Article

Identifying Effect of Car Fire Blankets on Chosen Fire Parameter Using Large-Scale Fire Tests of Internal Combustion Engine Vehicle and High-Voltage Traction Battery—Comparative Slovak Case Study

Department of Fire Engineering, Faculty of Security Engineering, University of Žilina, Univerzitná 8215/1, 010 26 Žilina, Slovakia
*
Author to whom correspondence should be addressed.
Appl. Sci. 2024, 14(11), 4902; https://doi.org/10.3390/app14114902
Submission received: 20 April 2024 / Revised: 4 June 2024 / Accepted: 4 June 2024 / Published: 5 June 2024
(This article belongs to the Section Applied Thermal Engineering)

Abstract

:
Firefighting units in the Slovak Republic are well prepared for extinguishing fires of vehicles with internal combustion engines. However, the expansion of electromobility is also coming to Slovakia. It is essential to pay attention to this topic from the point of view of repression. This article deals with car fire blankets. The main objective is to verify and compare the effectiveness of extinguishing internal combustion engine vehicle (ICEV) fires and high-voltage traction battery (HTB) fires using car fire blankets. The effectiveness of a car fire blanket was determined based on the analysis of temperature drops during large-scale fire tests of ICEVs and HTBs. The temperature was recorded by four thermocouples. Two thermocouples were placed at 0.7 m from the ICEV and HTB; one thermocouple was placed in the interior of the ICEV and inside the HTB; one thermocouple was placed on the roof of the ICEV and the surface of the HTB. Subsequently, the results were compared based on temperature–time curves obtained from experimental measurements. Applying the car fire blanket to the ICEV fire caused a drop in temperature on all thermocouples. The most significant temperature drop was recorded in the interior of the vehicle. Specifically, the temperature dropped from 724 °C to 140 °C. However, the application of the car fire blanket had a different effect on the HTB fire. There was a minimal temperature change in the thermocouple on the right side at a 0.7 distance. The other thermocouples identified a slight increase in temperature.

1. Introduction

More than 96% of all registered passenger vehicles in the Slovak Republic are internal combustion engine vehicles. These percentage shares represent the number of registered passenger vehicles as of the end of 2023. By the end of 2023, there were 80,592 registered hybrid passenger vehicles, 8299 electric passenger vehicles, and as many as 2,554,863 passenger vehicles with other propulsion systems. Over the last 8 years, we identified an increase in registered electric passenger vehicles by 8016 and hybrid passenger vehicles by as much as 79,831. The increase in the number of vehicles is shown in Figure 1. The data were obtained from the Presidium of the Police Force of the Slovak Republic [1,2]. These facts indicate the ongoing development of electromobility in the Slovak Republic. However, as stated, statistical surveys show that internal combustion engine vehicles still represent most passenger vehicles in Slovakia.
According to the statistics from the Presidium of Fire and Rescue Corps of the Slovak Republic [3], the group with the most fire incidents of vehicles in road transport represents passenger vehicles and vans. We found that over the last 8 years, there have been 6174 fires in road traffic, of which 81% represent fires of passenger vehicles and vans. Specifically, fires of passenger vehicles and vans account for approximately 80% of the total fires in road traffic each year. The comparison of fires is shown in Figure 2, where we can also see a decreasing trend in the fire rate of vehicles in road transport.
From the perspective of extinguishing internal combustion engine vehicle (ICEV) fires, the fire units in Slovakia are adequately equipped. However, the introduction of electric propulsion brings new challenges in terms of extinguishing their fires. Currently, the focus is shifting towards car fire blankets as a solution for extinguishing vehicles with various propulsion systems. Several researchers have dedicated their attention to this issue [4,5,6,7] with various conclusions. Based on the results, it can be deduced that the use of these tools has the potential to be effective in fires involving both electric and conventional propulsion vehicles.
The research concept presented in this article was based on testing the effect of the separate application of a car fire blanket to an ICEV fire and high-voltage traction battery (HTB) fire. Although the ICEV was within this study, we aimed to establish the research on comprehensive application. For this reason, a car fire blanket test focused on extinguishing HTB fires was conducted. This type of energy storage system is widely used in electric vehicles [8]. According to several researchers [9,10,11,12,13,14], energy storage systems in electric vehicles pose safety challenges, especially in terms of the complex fire suppression of HTB fires. We hypothesized that if the fire blanket application proves effective individually on ICEV and HTB fires, it has the potential to be effective on battery electric vehicle (BEV) and PHEV (plug-in hybrid electric vehicle) fires as well. Simultaneously, the effectiveness of these tools in suppressing HTB fires in storage facilities was also identified.
After conducting the survey of the addressed issue, we found that fires involving PHEVs, BEVs, and ICEVs share certain similarities. Researchers [15,16] found that the general behavior of BEVs and ICEVs subjected to the same external thermal stress was similar. However, compared to ICEV fires, BEV fires are characterized by rapid changes in energy release and overall higher heat release rates (HRRs) due to the presence of an HTB. Researchers in publications [14,16] did not identify significant differences in HRR and total heat release (THR) peaks between BEV and ICEV fires. According to [17], PHEV fires are similar to ICEV fires. Exceptions include several potential hazards in PHEV fires, such as combustible gas explosions, fires of molten materials beneath the vehicle, and aggressive flame behavior in the form of whirls or jets. Although most direct comparisons of ICEV, PHEV, and BEV fires focus on measuring the HRR and THR, a survey of other professional publications revealed that the maximum temperatures during fires are similar for all types of vehicle propulsion systems mentioned. Specifically, according to [18,19,20], the maximum temperatures in ICEV fires reach approximately 800–1000 °C. The maximum temperatures in BEV fires reach around 900–1100 °C according to [21,22], and for PHEV fires, they are approximately 850–1000 °C [22,23]. It is important to consider that the experiments did not have identical conditions. Nevertheless, it can be stated that maximum temperatures generally range from 800 to 1100 °C for vehicles. Naturally, the results may vary depending on the conditions of the specific fire and experiment. These findings justify the potential contribution of this publication to the broad spectrum of vehicle fires with various propulsions.
The aim of this article is to test the effectiveness of the car fire blanket separately on an ICEV fire and HTB fire. Subsequently, the results obtained will be compared and the impact of the car fire blanket on fire identified. The effectiveness will be evaluated based on the temperature drop measured by four thermocouples during a 10 min interval of car fire blanket application.

2. Materials and Methods

2.1. Description of Samples—Car Fire Blanket

The main object of this study was the car fire blanket. Specifically, the impact of applying this car fire blanket to the ICEV fire and HTB fire was investigated. The purpose was to identify possible differences in fire development in terms of temperature changes. The parameters of the car fire blanket are listed in Table 1.
The application of the fire blankets was carried out by members of the Fire and Rescue Corps (referred to as operators). Operators were equipped with all PPE (personal protective equipment) that is used during this specific type of emergency event. The actual PPE used is shown in Figure 3.
Meteorological conditions were recorded during both experiments. Throughout the execution of both experiments, the meteorological conditions were favorable. Overall, the conditions of both experiments were similar. Specifically, the conditions are detailed in Table 2 which provides a summary of the experiment.
The vehicle used in the large-scale ICEV fire test was the Volkswagen Polo IV Hatchback. The vehicle had an empty fuel tank, full interior equipment, all windows, and a complete engine. The actual vehicle used in the experiments is shown in Figure 4a,b. The basic dimensions of the vehicle are provided in Figure 4c,d.
Figure 4. Testing vehicle—Volkswagen Polo IV Hatchback. (a) Side view of real vehicle; (b) side view of model vehicle with dimensions; (c) rear view of real vehicle; (d) rear view of model vehicle with dimensions.
Applsci 14 04902 g004
In the second large-scale test, a fire was simulated in the electrical energy storage system. The electrical energy storage system used was a high-voltage traction battery. It is an NMC type of high-voltage traction battery. The specification of the HTB is provided in Table 3.
During the experiment, the high-voltage traction battery was left on a transport pallet for the purpose of positioning and subsequently moving it to quarantine. Furthermore, the structure was left to prevent the car fire blanket from being applied directly to the HTB. The structure had the following approximate dimensions: length 223.5 cm, width 160 cm, and height 42 cm. The HTB is shown in Figure 5.
Figure 5. High-voltage traction battery used in large-scale fire test.
Applsci 14 04902 g005

2.2. The Preparation of the Experiment

For measurement purposes, the Almemo 2690-8 datalogger (Ahlborn, Holzkirchen, Germany) was used, as shown in Figure 6a. It is a universal combined handheld measuring instrument with five universal inputs and two outputs. The device has internal memory, which allows for the direct recording of measured values in the instrument. Furthermore, the device features a large graphical display and waterproof connectors meeting the IP54 protection rating. The device is resistant to splashing water and dust. The temperatures were measured by 4 NiCr-Ni thermocouples with a temperature range of 100 °C to 1000 °C. The thermocouples were connected to the Almemo 2690-8. The meteorological conditions were measured by an external weather station shown in Figure 6b,c. To record the course of the experiments, 2 video cameras and 2 thermal imaging cameras with 4 tripods were used.
The experiments were recorded with a thermal camera FLIR E96 14° (FLIR, Portland, OR, USA) shown in Figure 6d. The thermal camera FLIR E96 14° features a resolution of 640 × 480 pixels (VGA) and is capable of generating video recordings. The device can be set to three modes based on temperature range, specifically −20 to +120 °C, 0 to +650 °C, and +300 to +1500 °C, all with a tolerance deviation of ±2%. The thermal imaging camera was configured with an ambient temperature of 26 °C and relative humidity of 30%. The camera recording was set to measure the hot spot (temperature measurement at the hottest point) and simultaneously the average temperature within the set area, in the temperature range mode of 0–650 °C and 300–1500 °C. To ensure stability, the thermal imaging camera was mounted on a tripod.
Figure 6. (a) Datalogger Almemo 2690-8; (b) weather station; (c) display for weather station; (d) Thermal imaging camera FLIR E96 14°.
Applsci 14 04902 g006
The placement of thermocouples was designed based on previous experiences with large-scale vehicle fire tests and the size of parking spaces according to the technical regulation STN 73 6058 [24]. This technical standard determines the width of parking spaces in the Slovak Republic. It was also necessary to consider the increase in vehicle dimensions, as noted by the authors in their publication [25]. The placement of thermocouples during the large-scale ICEV test is shown in Figure 7:
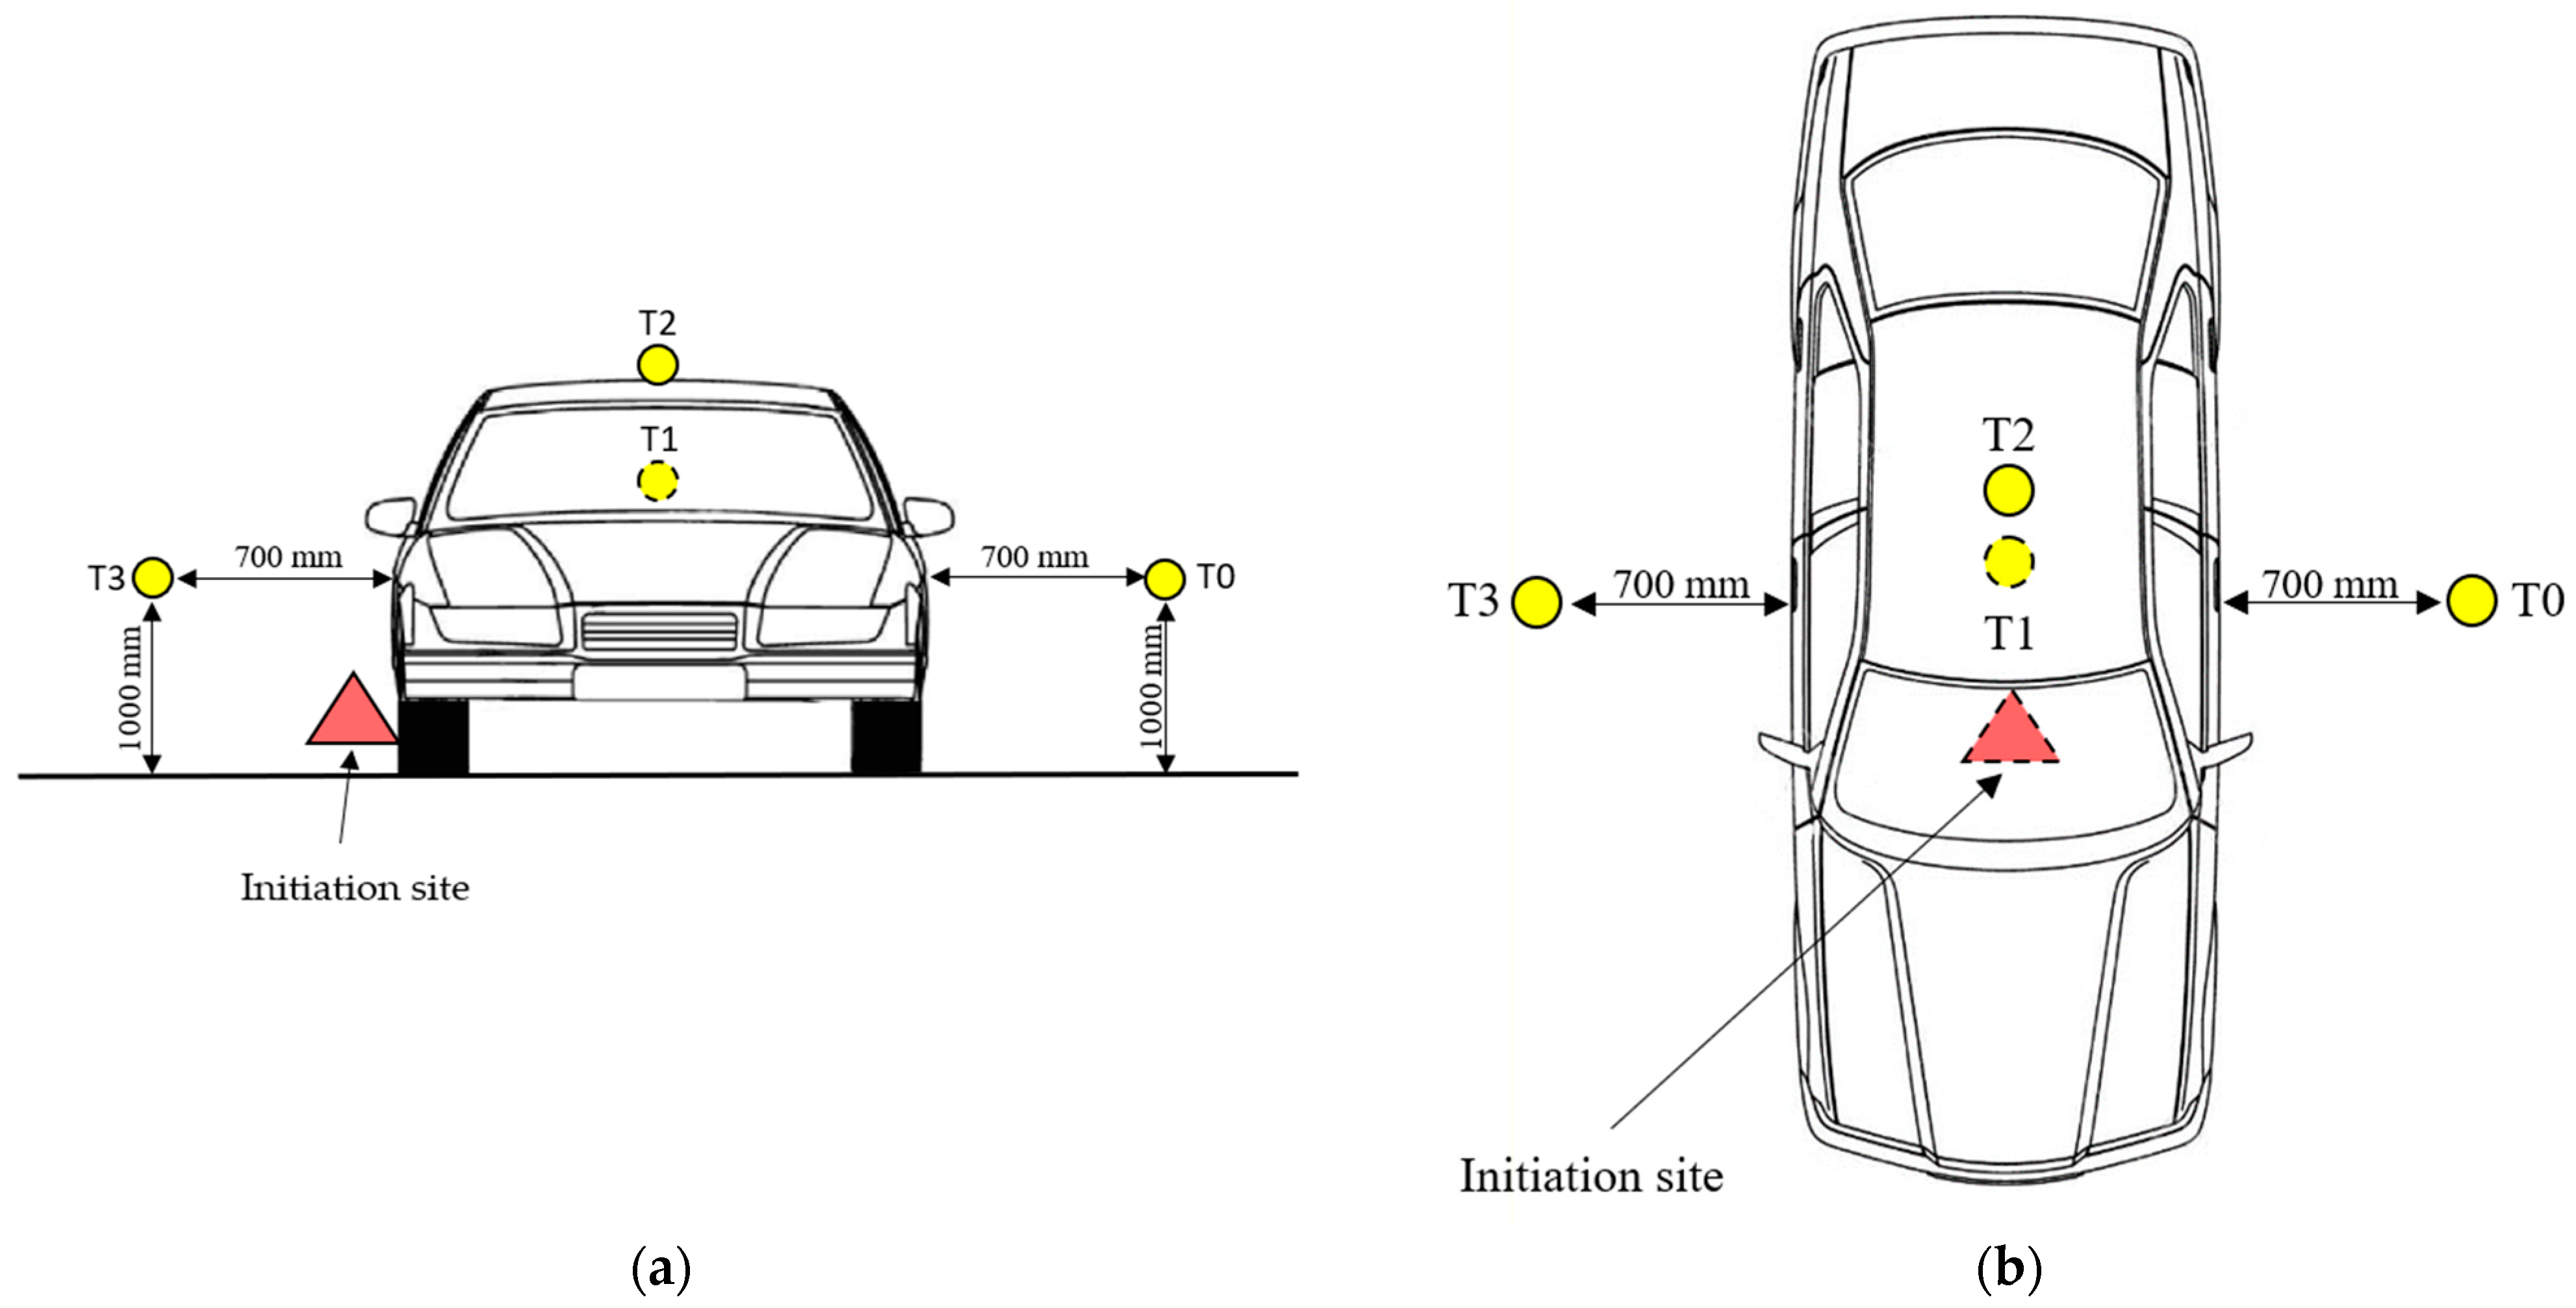
  • T0 on the driver’s side at a distance of 0.7 m and a height of 1 m;
  • T1 inside the vehicle approximately in the middle at headrest height;
  • T2 on the roof of the vehicle approximately in the middle (contact point of the car fire blanket and vehicle);
  • T3 on the passenger side at a distance of 0.7 m and a height of 1 m.
A similar placement was considered for the HTB fire test. Thermocouple T1 was placed at the point of connection of the HTB to the vehicle. The thermocouple inside was placed on the opposite side of the initiation to monitor the transfer of fire between the cells. The placement of thermocouples is shown in Figure 8:
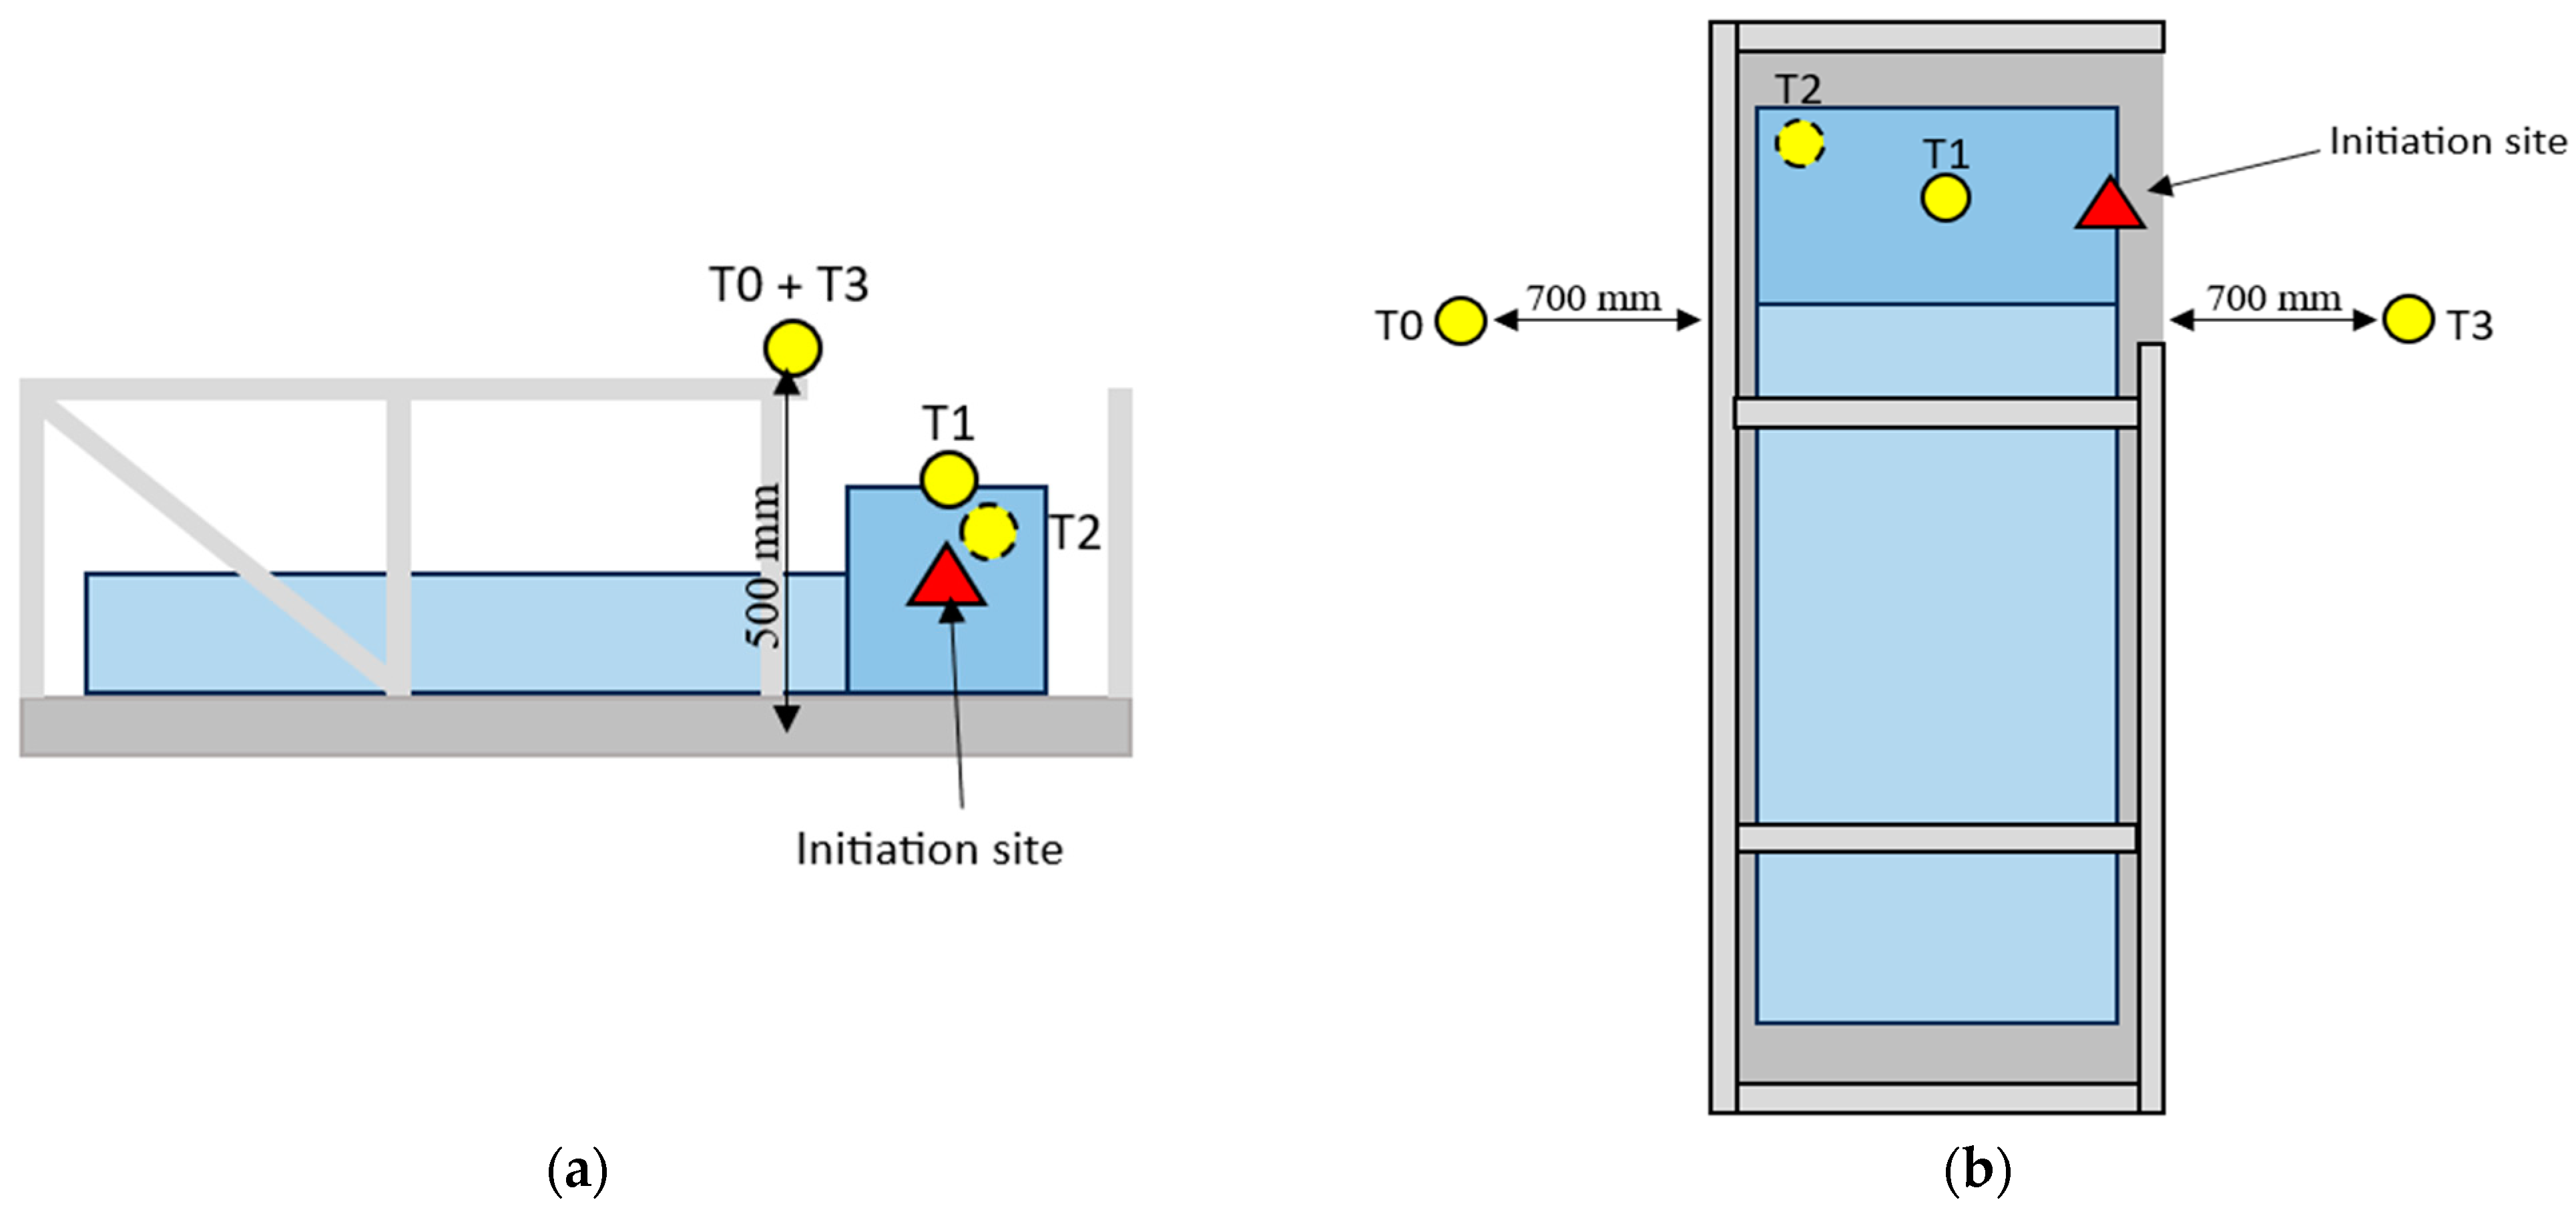
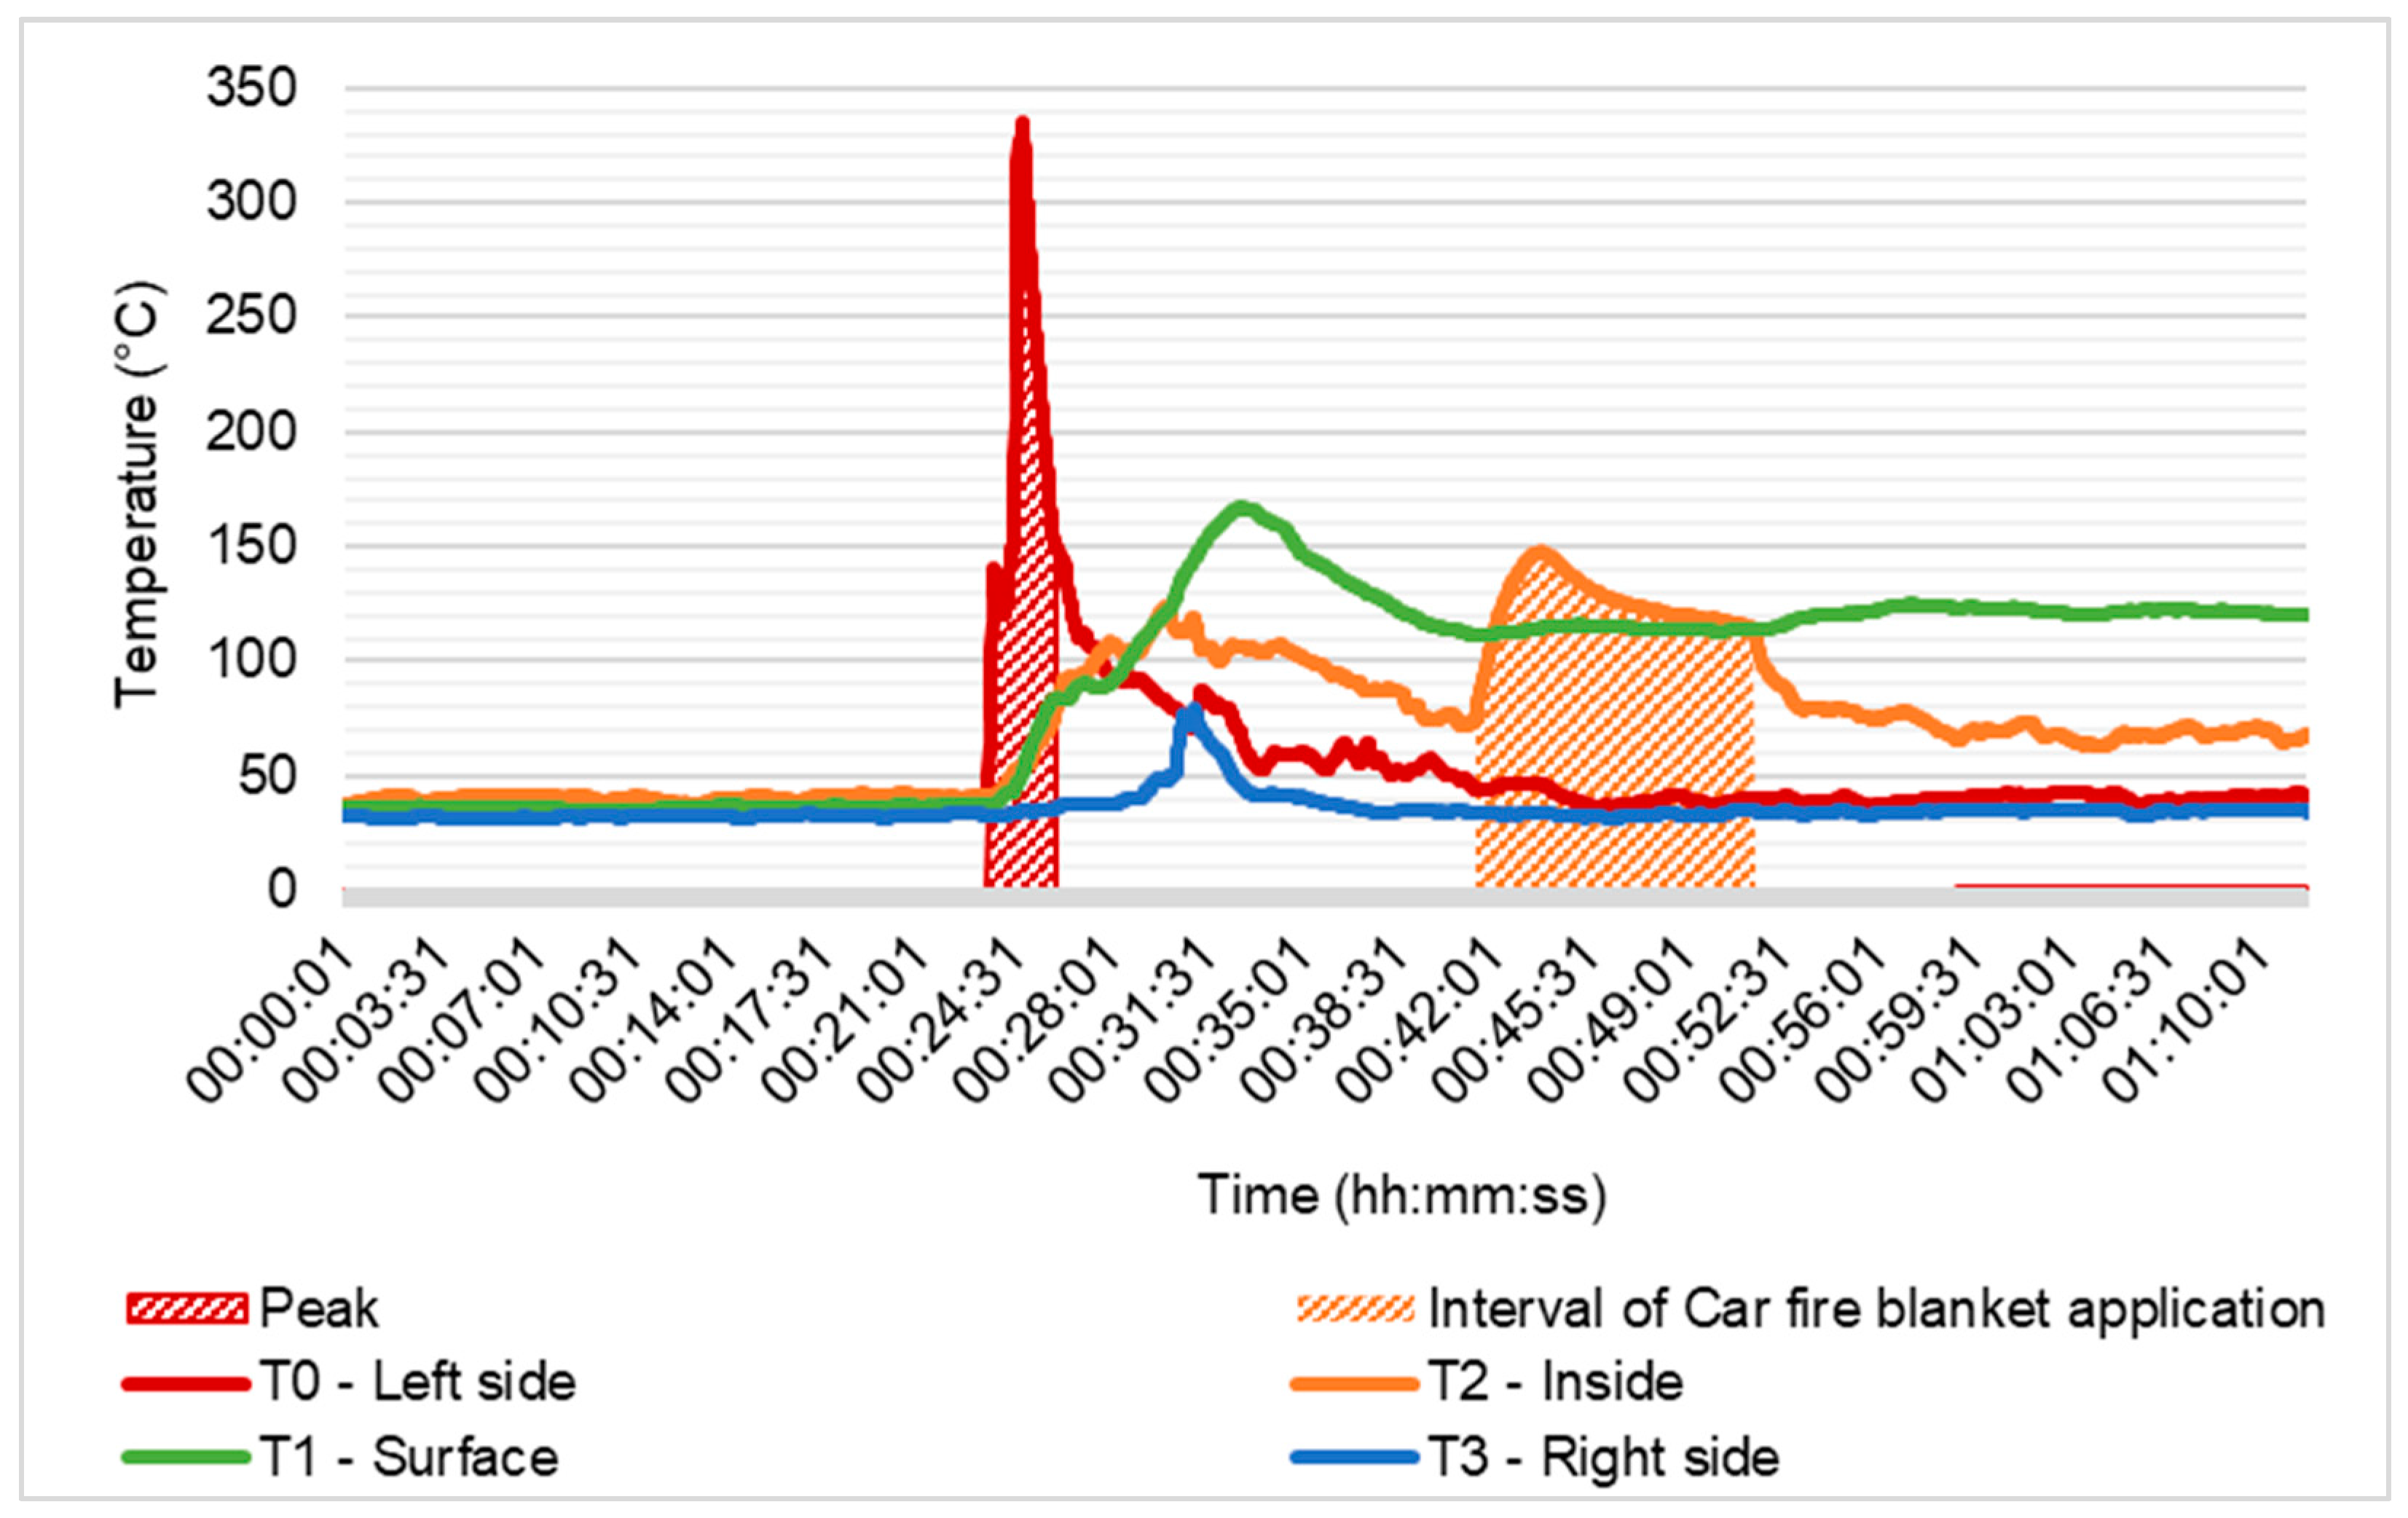
  • T0 on the left side at a distance of 0.7 m and a height of 0.5 m;
  • T1 at the point of connection of the battery to the vehicle (top side);
  • T2 inside on the opposite side of initiation;
  • T3 on the right side (initiation side) at a distance of 0.7 m and a height of 0.5 m.
To initiate the HTB, the transport structure was modified on one side. The HTB fire was initiated by mechanically compromising the integrity of the battery packing. For breaking through, a method of puncturing with a wedge was used. Flame combustion appeared only after the second drive in of the wedge by a hammer.

2.3. The Course of the Experiment

The experiments were carried out on a pre-prepared methodology for conducting experiments. The model for conducting large-scale tests is based on 5 main points:
  • The placement of the ICEV/HTB on a concrete base.
  • The installation of thermocouples according to Figure 7 and Figure 8.
  • The preparation of the accelerator and subsequent initiation of the fire.
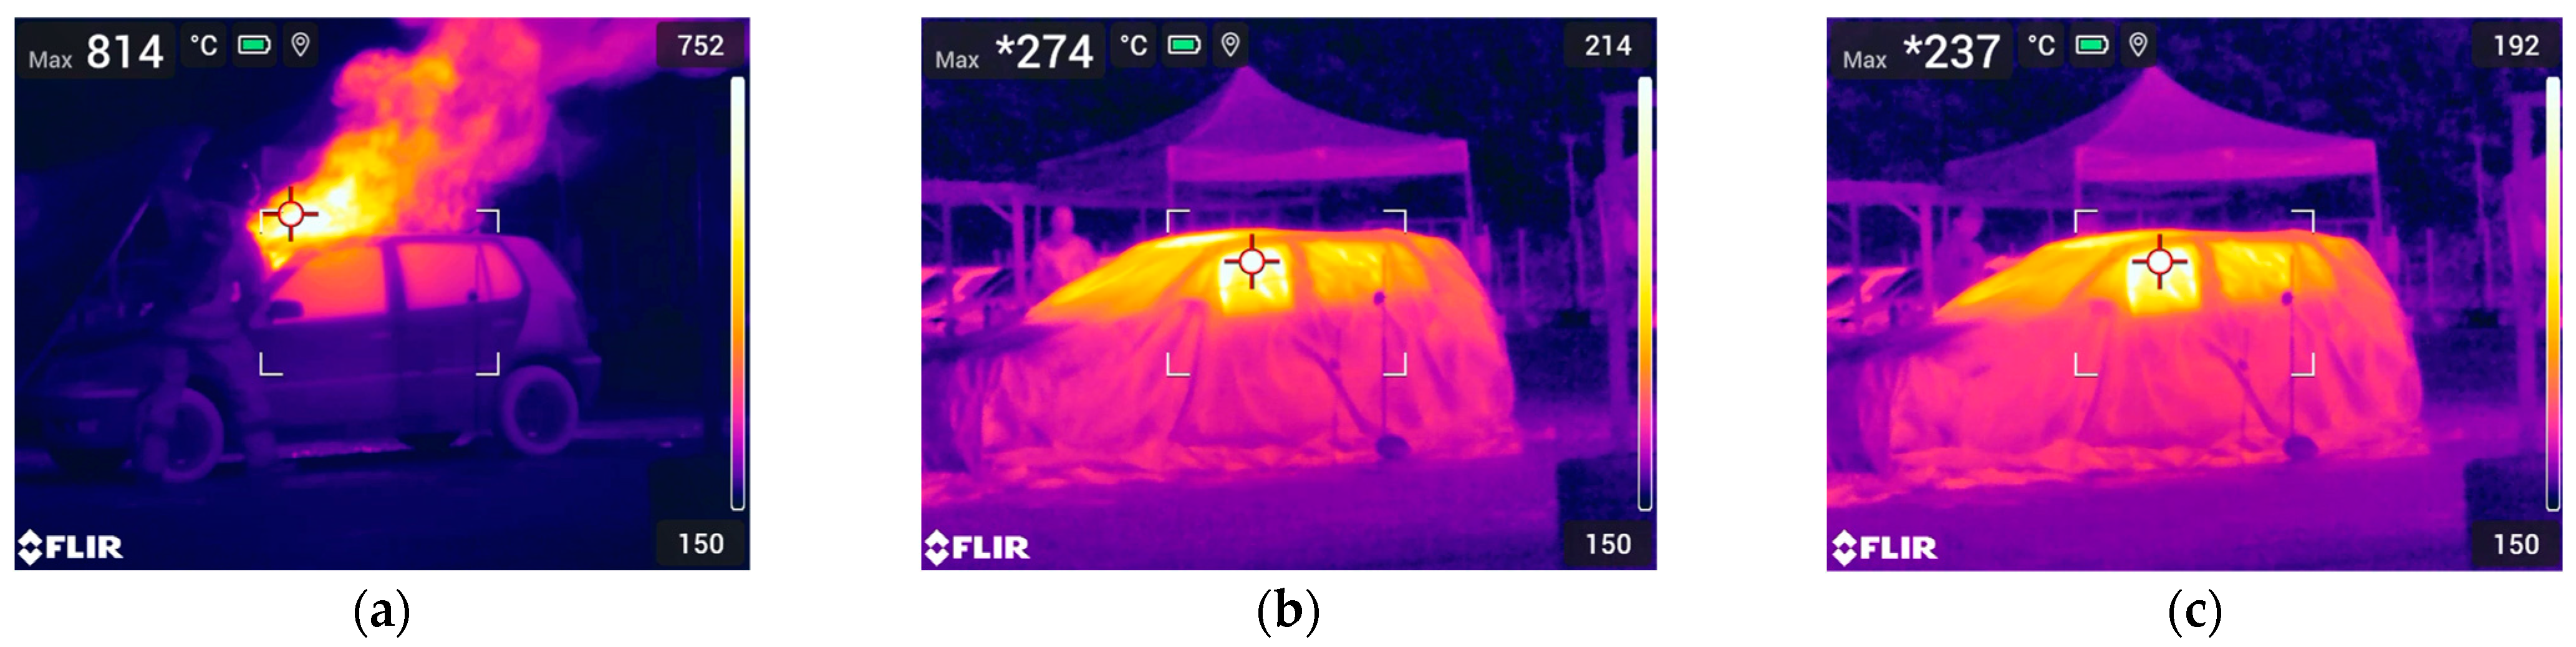
  • For a large-scale ICEV fire test, apply the car fire blanket at an interval of 10 min when the temperature reaches 700 °C in the interior of the ICEV (T1).
    For a large-scale HTB fire test—apply the car fire blanket at an interval of 10 min when the temperature reaches 700 °C inside the HTB (T2). In case of any changes, apply a car fire blanket at different temperatures.
  • Remove the fire blanket from the vehicle, and, if necessary, extinguish the fire.
The interval of the application of the car fire blanket was determined for 10 min. The interval was chosen based on the results and findings of the authors in their publication [7]. In addition, a test was conducted to determine the necessary time to move adjacent vehicles to a safe distance in case of fire. The actual time taken for evacuation was approximately 3 min, using special trolleys placed at the wheels. The time was extended to 10 min due to several factors that could occur during a real intervention. These factors include the following:
  • Reduced visibility, especially in enclosed spaces (garages, parking buildings).
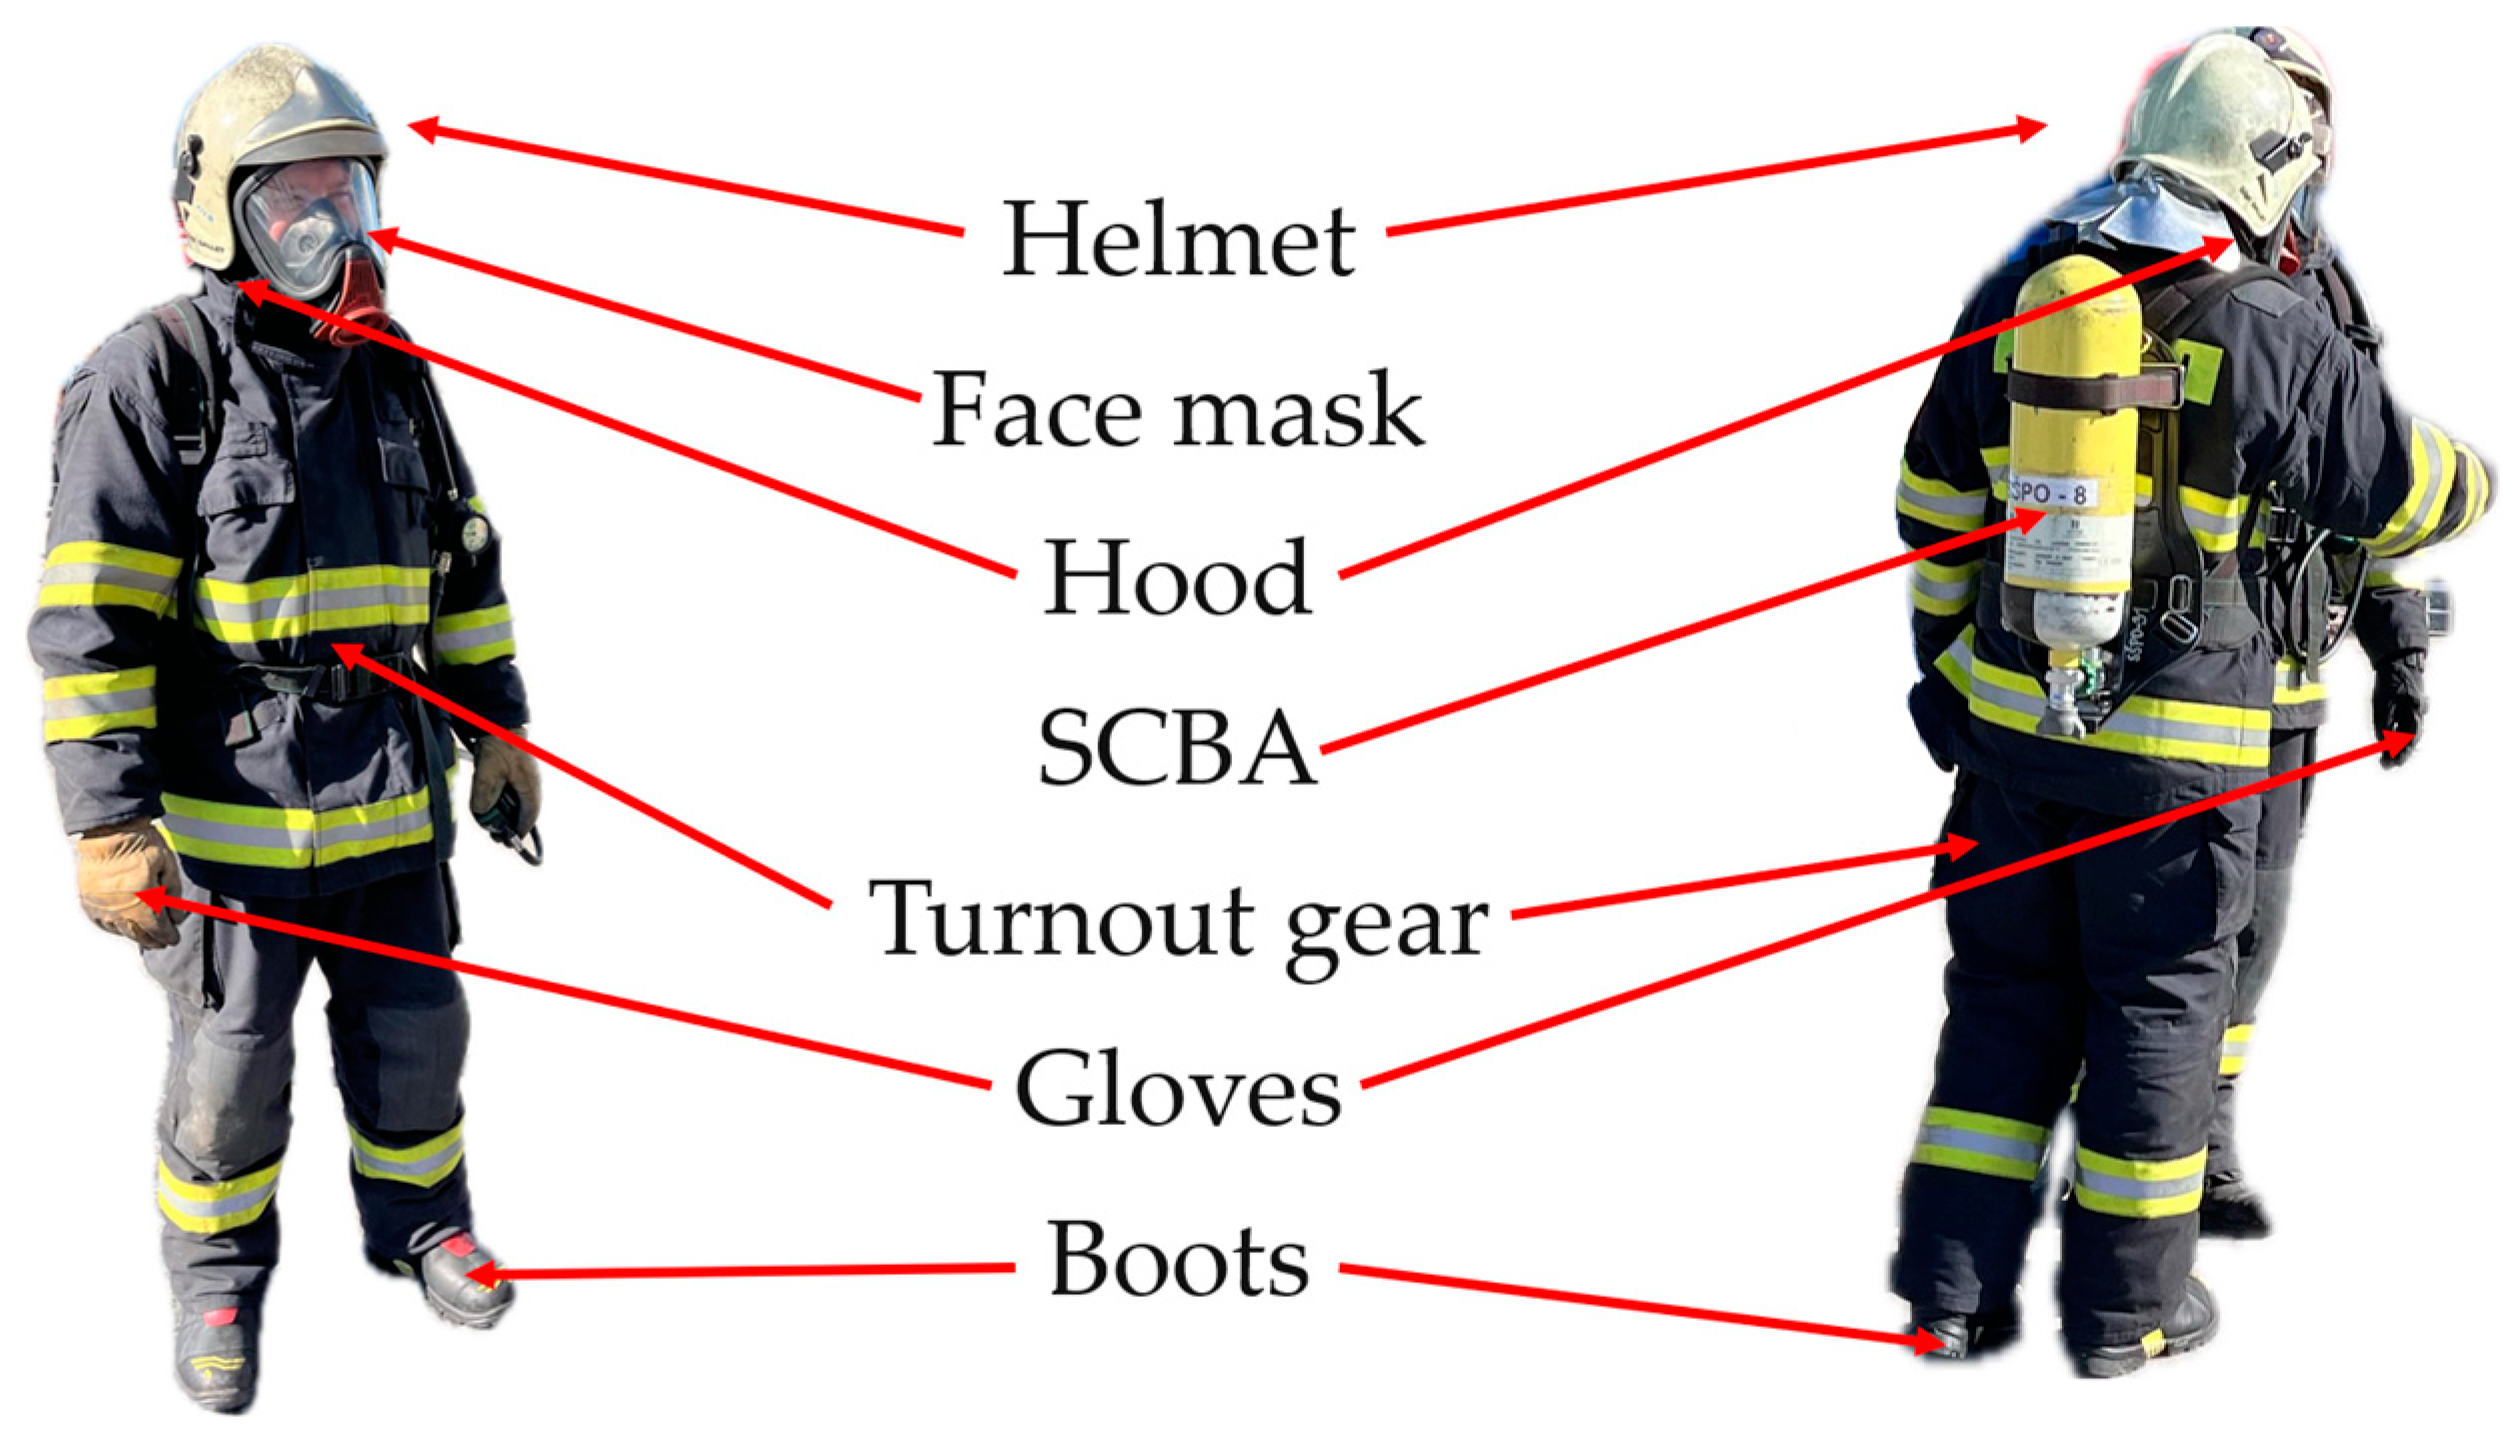
  • The necessity of using personal protective equipment (limitation and slowing down of movement).
  • Narrow space for maneuvering the vehicle.
  • The potential slope of the surface where the vehicles are positioned.
Lastly, the interval was set at only 10 min to test the thermal stability of the car fire blanket and its extinguishing effect within a shorter interval, as recommended by the manufacturer. Several manufacturers declare the need to leave the fire blanket on the vehicle for approximately 20–30 min to achieve the desired extinguishing effect.

3. Results

A significant difference occurred in the overall duration of the experiment. The timeline of the experiment is provided in Table 4. The table presents a simplified overview of the experiments based on time. The high-voltage traction battery was not extinguished conventionally but was instead quarantined and monitored for the following 48 h.

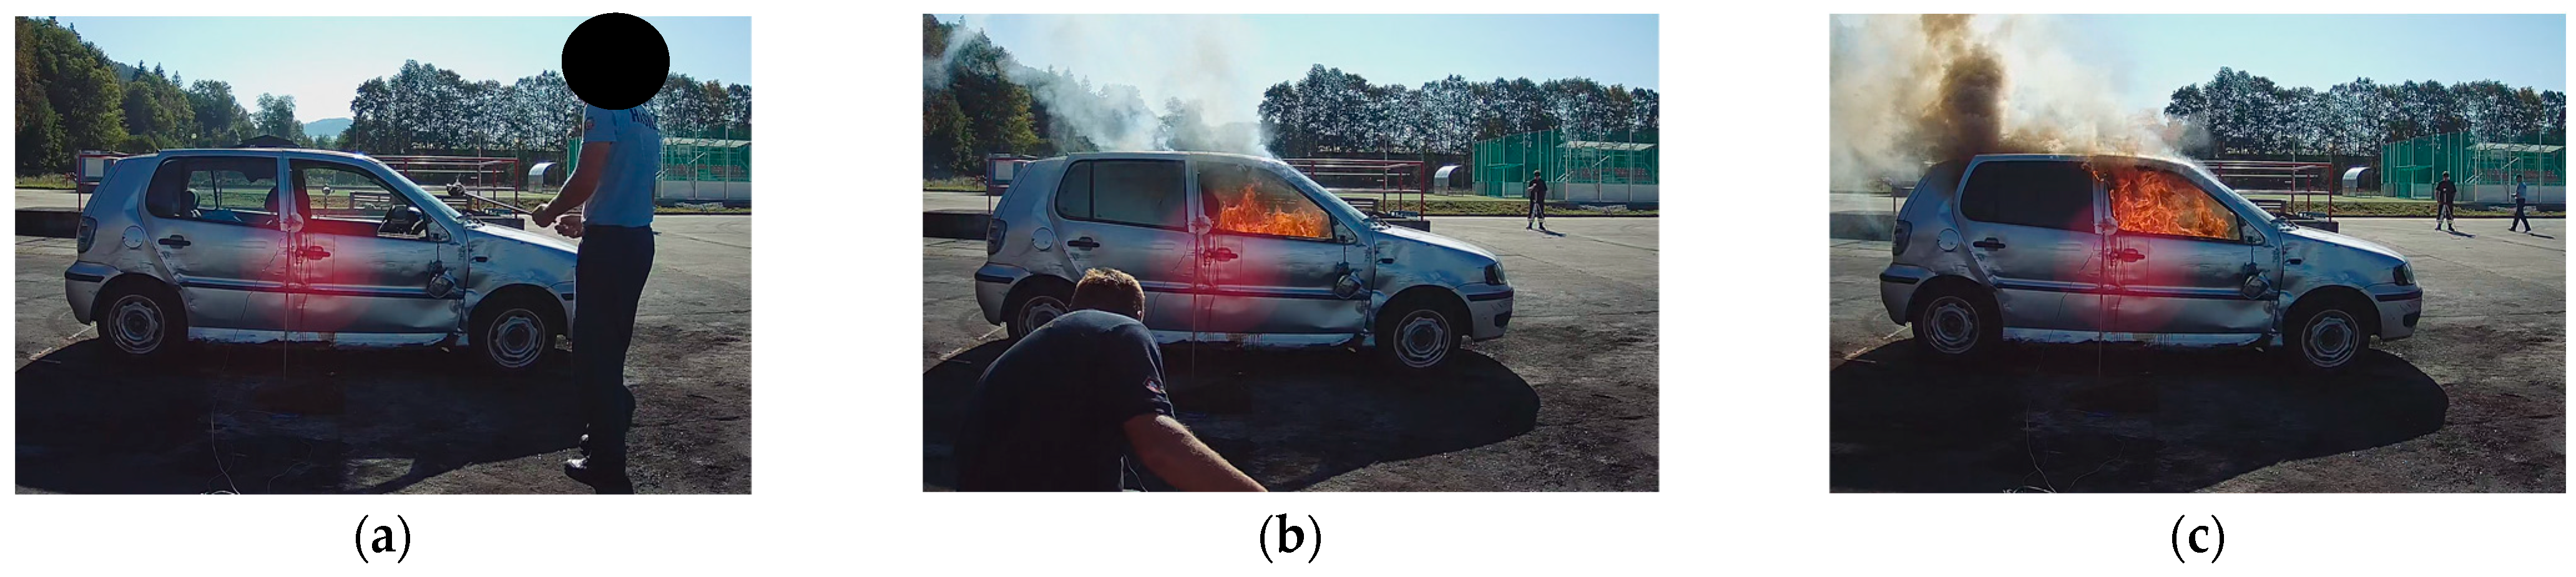
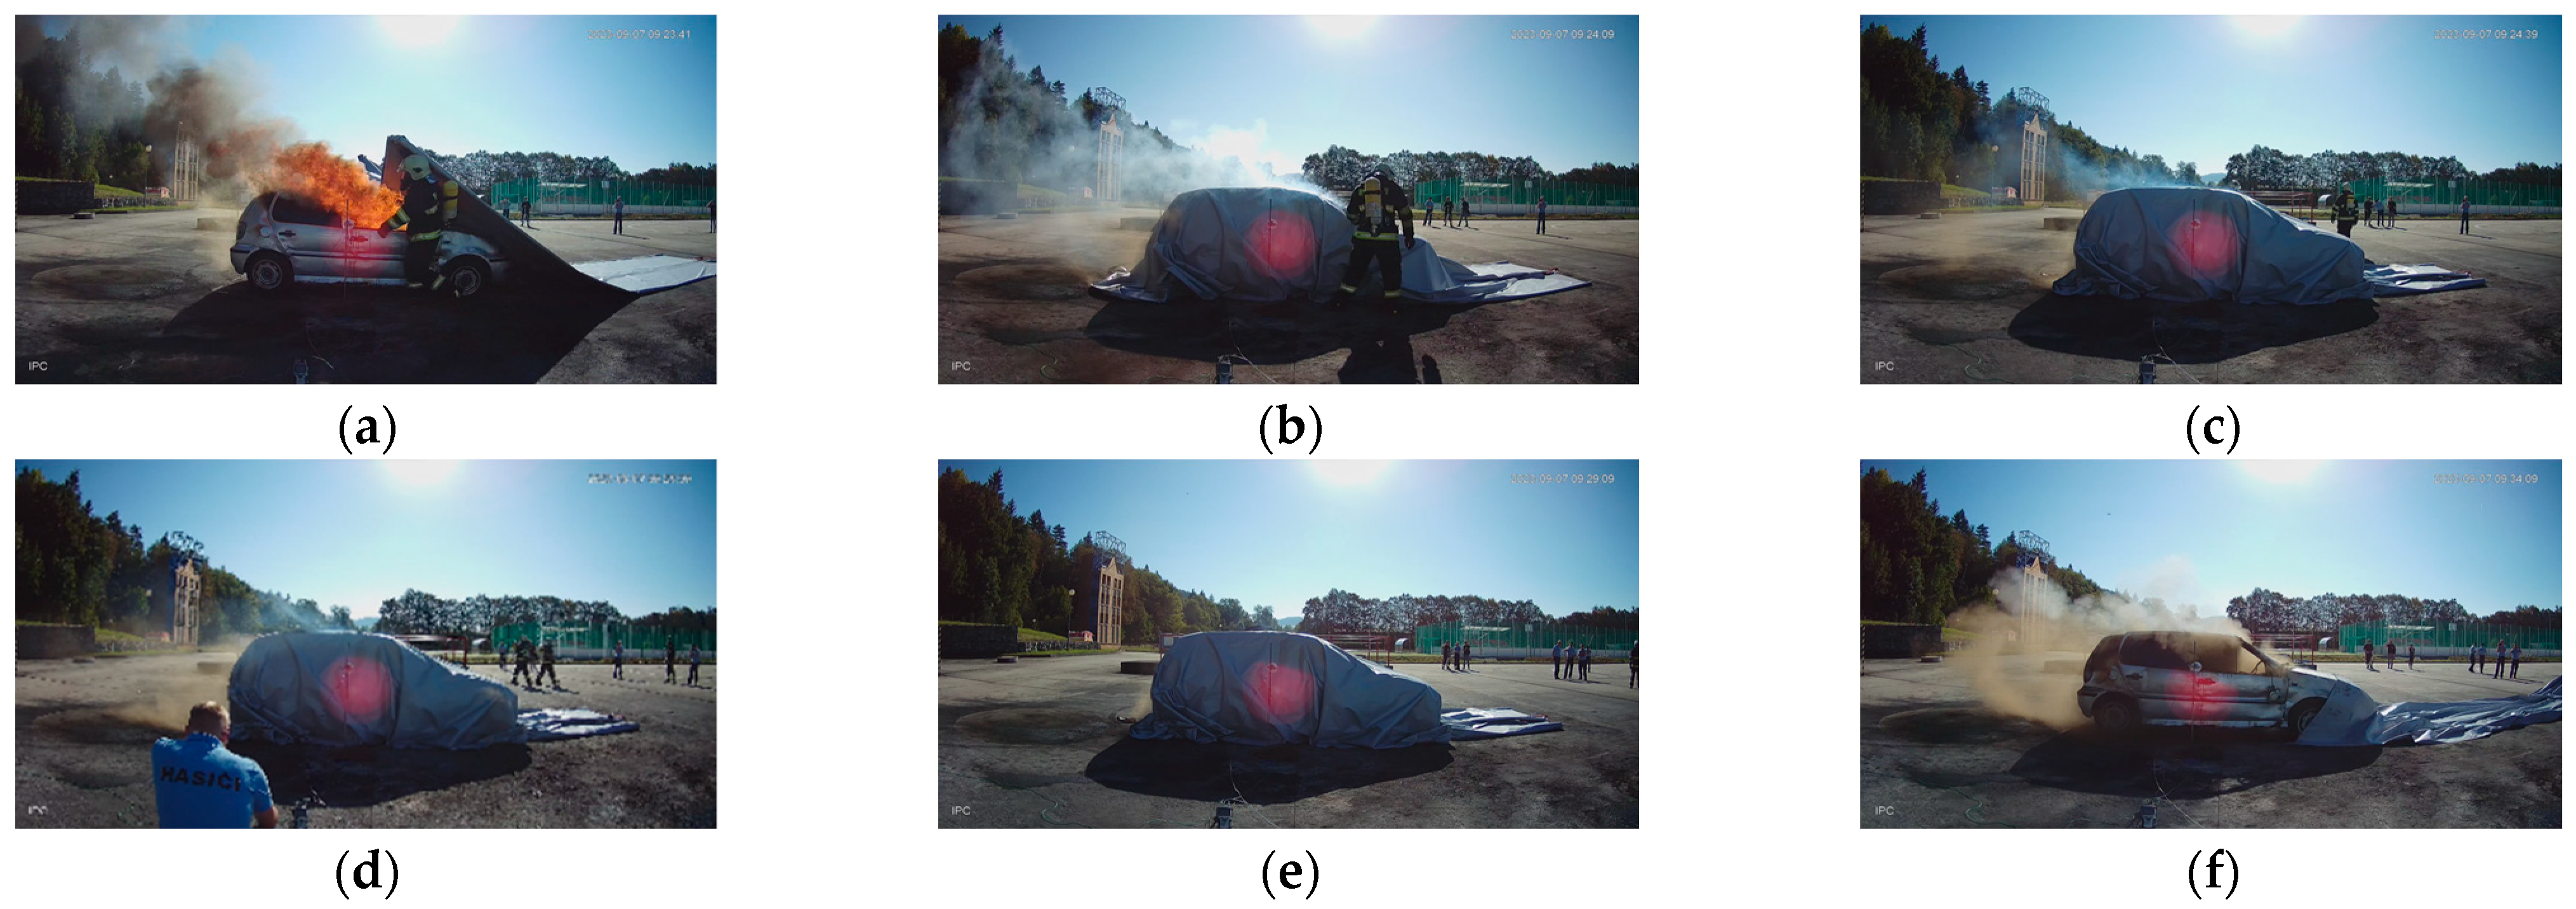
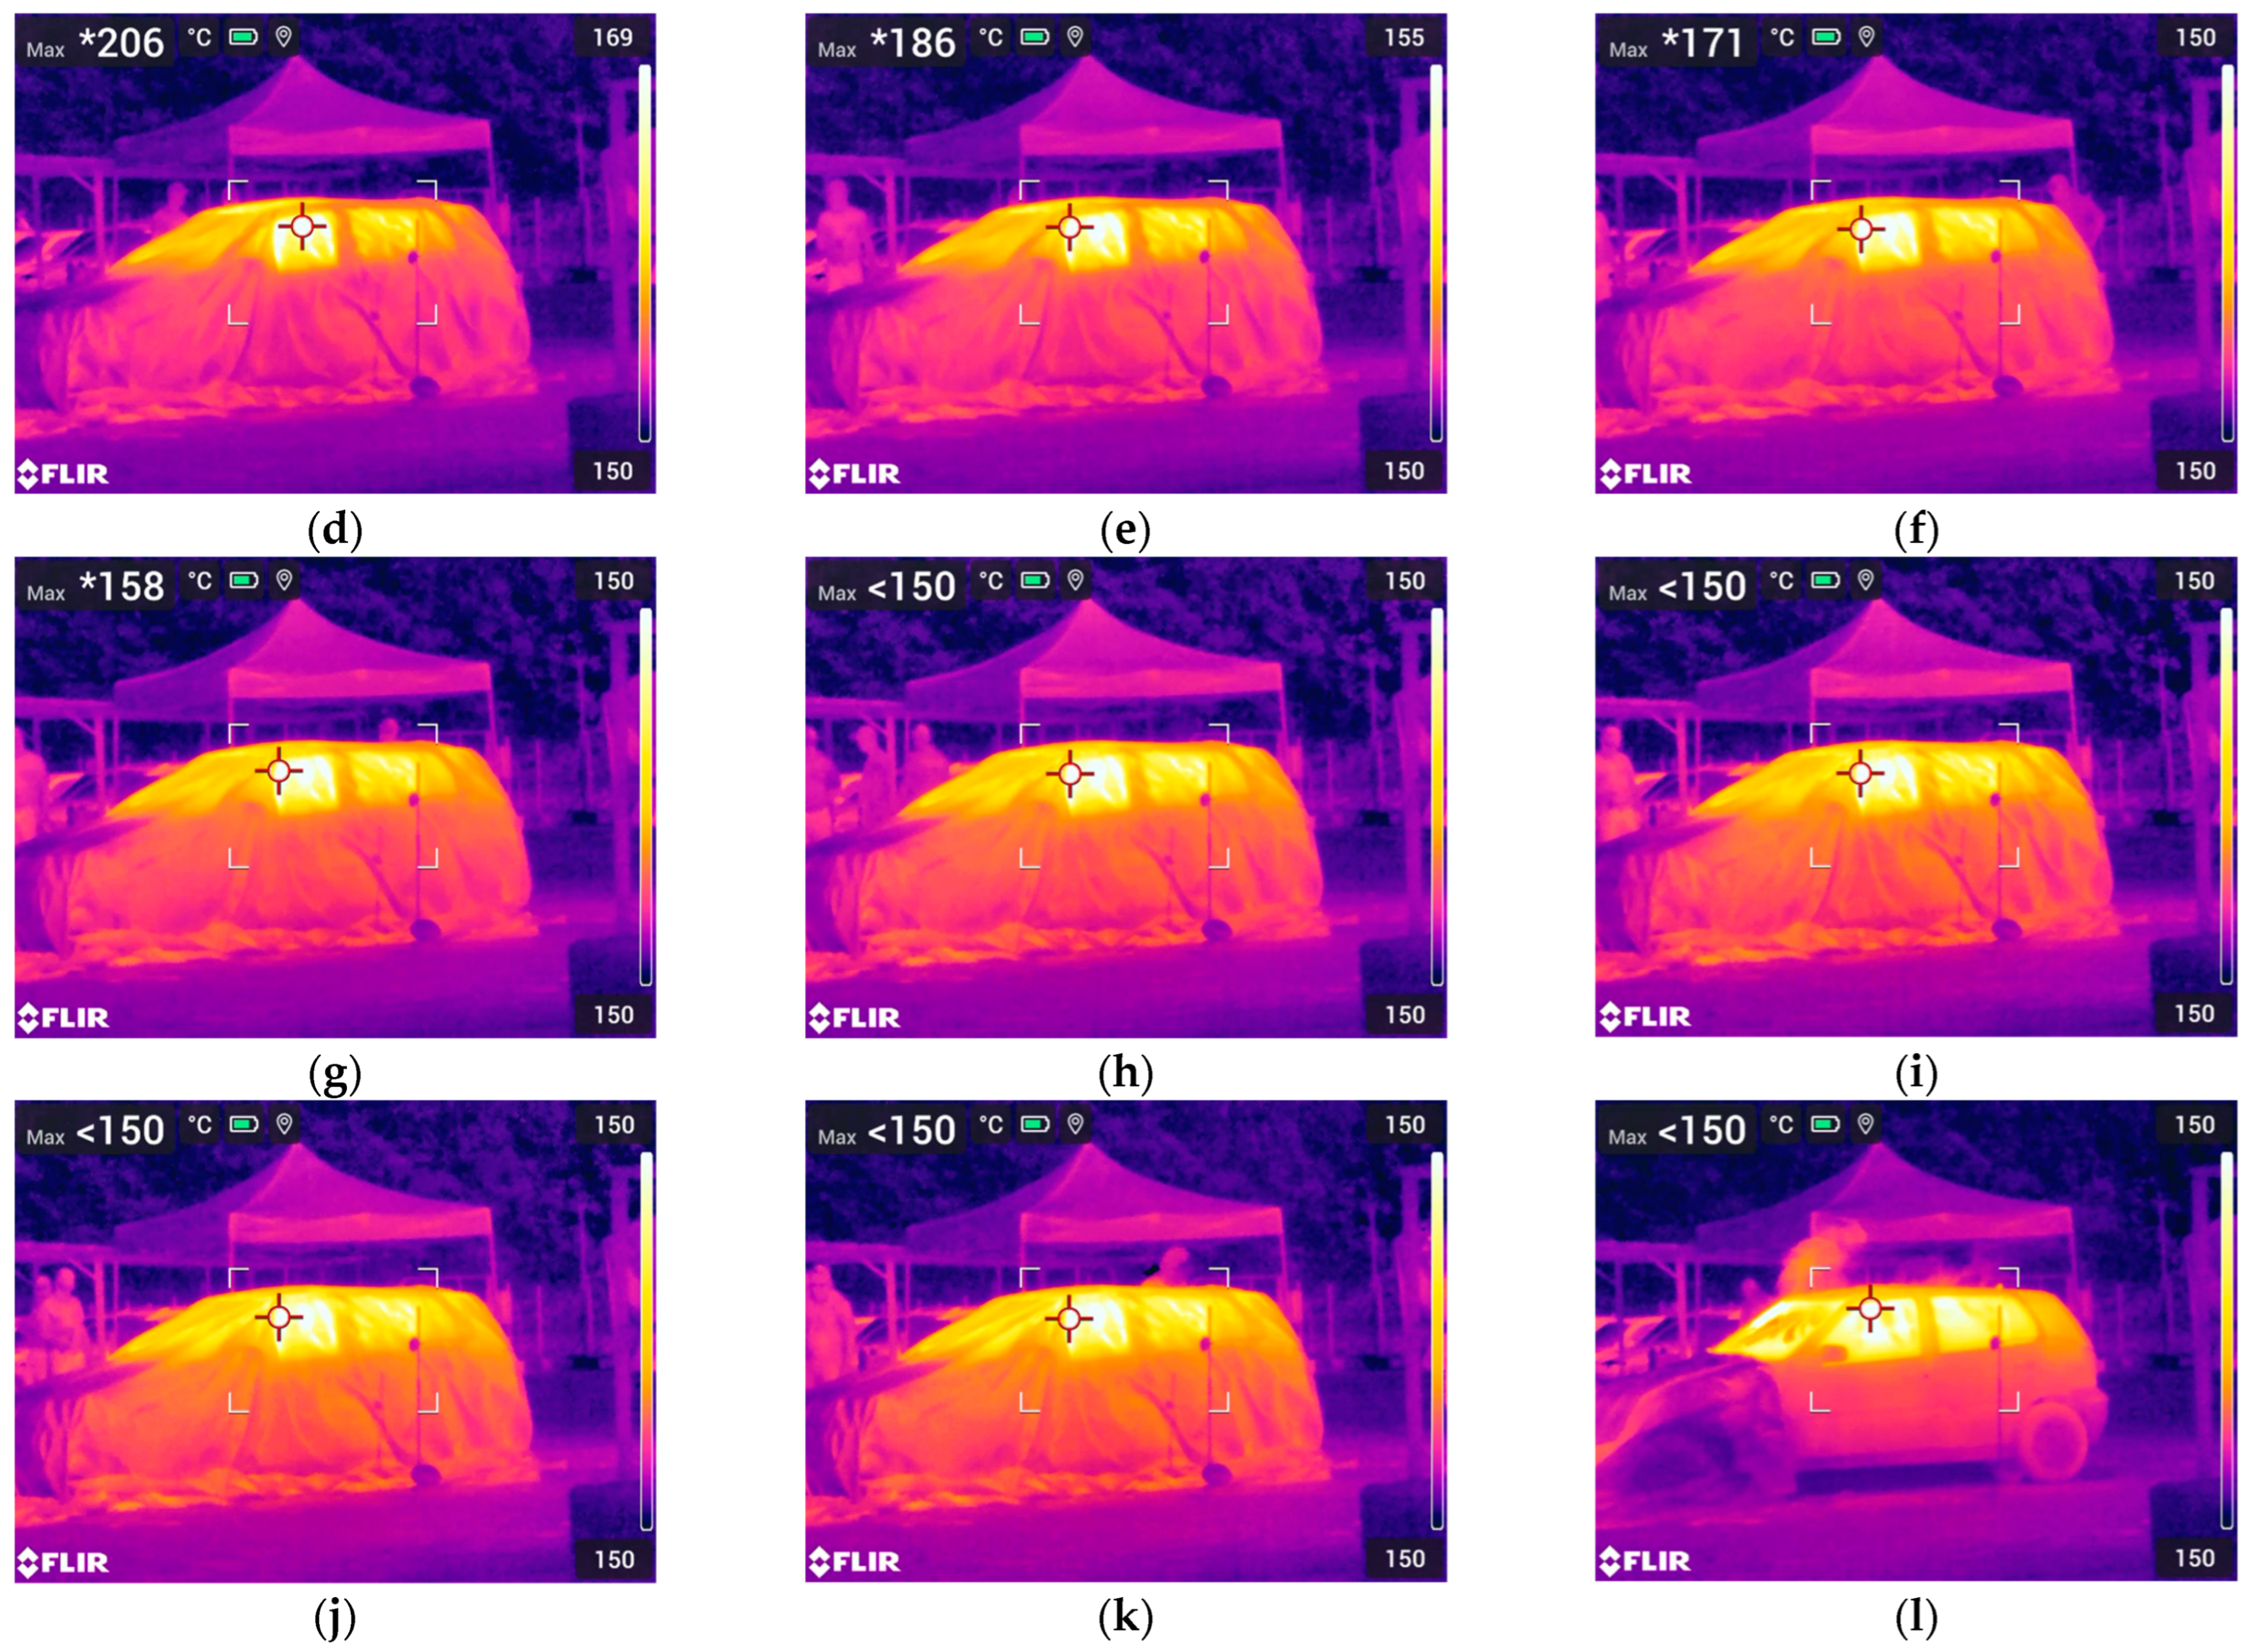
3.1. Results of Large-Scale ICEV Fire Test

The ICEV experiment begins with the deliberate ignition of the vehicle in the interior, on the front seats of the driver and the passenger shown in Figure 9. There is rapid fire development during the initiation phase.
Within 2 min, the vehicle fire becomes fully developed. In Figure 10a, the state of the fire just before the application of the car fire blanket is depicted. Figure 10b shows the state of the vehicle fire immediately after applying the car fire blanket. Figure 10c illustrates the state of the vehicle fire 30 s after the application of the car fire blanket, Figure 10d after 60 s, and Figure 10e after 300 s. Figure 10f shows the state of the vehicle fire just after the removal of the car fire blanket.
The results of the entire large-scale ICEV fire test are depicted in Figure 11. The graph shows the temperature–time curve. The temperatures were measured with thermocouples T0, T1, T2, and T3 at 1 s intervals. For a clearer display of results, the time on the X-axis is shown at 60 s intervals. The interval of the application of the car fire blanket is marked with an orange-colored area. Approximately 1 min after the fire blanket, an additional extinguishing of the fire was performed. The maximum temperature reached in this experiment was 723 °C, at which the car fire blanket was applied.
The temperature changes on thermocouples T0 and T3 were minimal. Approximately one minute after ignition, an increase in temperature was recorded in thermocouple T2. The temperature continued to rise until the application of the fire blanket. The highest temperature increase was observed in the vehicle interior by thermocouple T1. The temperature increased from the initiation of the fire to a maximum temperature of 723 °C in just under 2 min. Subsequently, after applying the car fire blanket, a decrease in temperature occurred.
For a clearer description of the temperature development over time, a graph was created in Figure 12. The graph shows the temperature–time curve during the 10 min interval when the car fire blanket was placed on the ICEV. The graph displays the temperature results measured by thermocouples T0, T1, T2, and T3 at 1 s intervals. To enhance the readability of the graph, 30 s intervals were chosen for the time display on the X-axis.
It was found that the temperature changes recorded by thermocouples T0 and T3 during the car fire blanket application were minimal. A temperature decrease from 83 °C to 23 °C was observed in thermocouple T3 and from 26 °C to 20 °C in thermocouple T0. The temperatures of the fire itself measured at the lateral distances were not high before the car fire blanket was placed over the vehicle. On the contrary, the most significant temperature decrease was recorded by thermocouple T1, where the temperature dropped from 724 °C to 140 °C, resulting in a total decrease of 584 °C. Thermocouple T2 recorded a temperature change from 217 °C to 120 °C, achieving an overall temperature decrease of 97 °C.
Furthermore, a FLIR E96 14° thermal imaging camera was utilized to capture surface temperatures. During the large-scale ICEV fire test, a similar temperature and changes were identified compared to those of the thermocouples. According to the footage from the FLIR thermal imaging camera, the average temperature of the ICEV fire just before the application of the car fire blanket was 752 °C, while the hot spot showed a temperature of 814 °C. This temperature was slightly higher compared to the temperature of 724 °C measured inside the vehicle by thermocouple T1. After removing the car fire blanket, the temperature was lower than 150 °C, similar to the temperature recorded by thermocouple T1, which measured 140 °C. The main time points of the FLIR E96 14° thermal imaging camera FLIR E96 14° footage are shown in Figure 13.

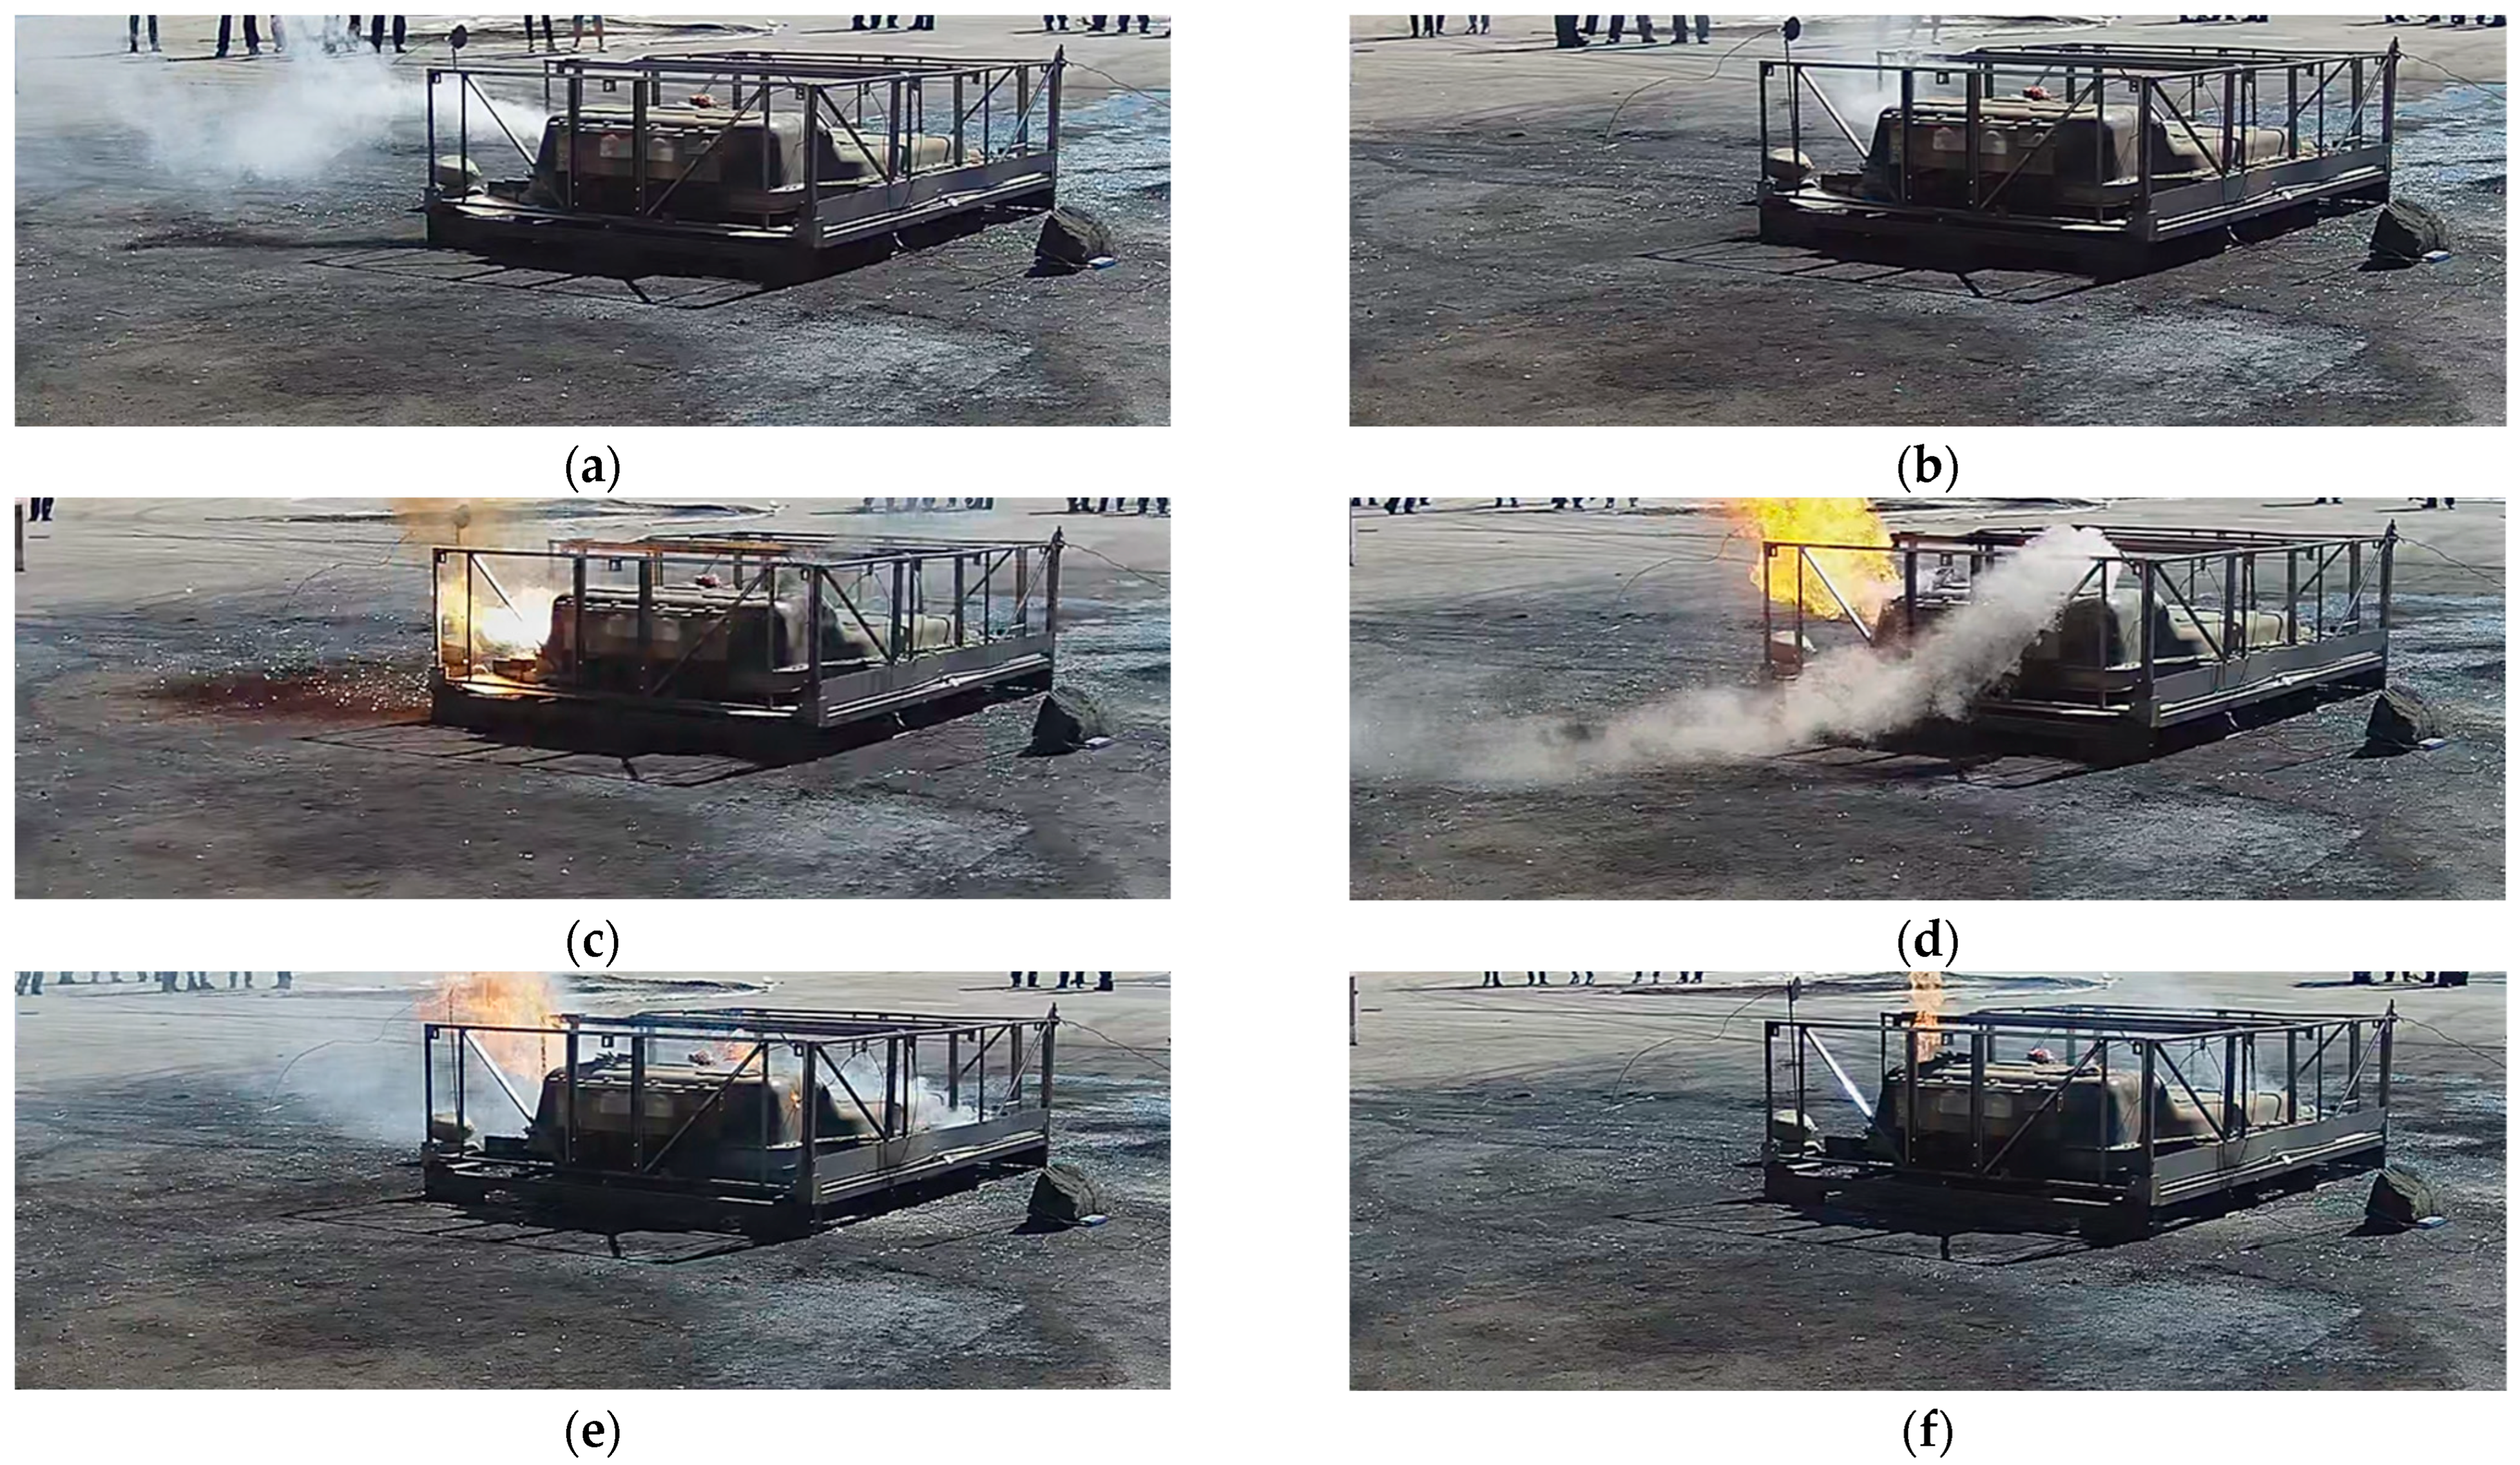
3.2. Results of Large-Scale HTV Fire Test

The large-scale HTB fire test started similarly with intentional initiation. To initiate the HTB fire, a mechanical breach of the battery packing integrity was conducted by a wedge and hammer. After the initial penetration, the slow development of the fire occurred. Initially, only smoke, which gradually weakened, could be observed, as shown in Figure 14a,b. Finally, a decision was made to drive the wedge deeper. Undoubtedly, the deeper drive in of the wedge led to the initiation of the fire, as shown in Figure 14c,d. The initiation was successful after more than 23 min. Subsequently, the fire began to develop. For a period of 18 min, we waited to see if the fire would intensify. Based on the fire conditions shown in Figure 14d,e, we deduced that only other HTB materials, such as plastics, were burning, not lithium. As the fire began to lose intensity, as shown in Figure 14f, the decision was made to apply the car fire blanket.
In Figure 15a, the fire is depicted just before the car fire blanket application on the HTB fire. Figure 15b shows the condition of the HTB fire right after the application of the fire blanket. Figure 15c displays the state of the HTB fire after 30 s, Figure 15d after 60 s, and Figure 15e after 300 s of the car fire blanket application. Figure 15f illustrates the condition of the HTB fire right after the removal of the car fire blanket.
The results of the entire large-scale HTB fire test are displayed in Figure 16. The graph shows the temperature–time curve. The temperatures were measured with thermocouples T0, T1, T2, and T3 in 1 s intervals. Due to the better readability of the graph, a 210 s interval was chosen for the time showcase on the X-axis. The interval of the car fire blanket application is highlighted with an orange-colored area, the same as in the graph for the large-scale ICEV fire test. The graph also highlights the “peak” interval, indicating the onset of flame ignition after the second wedge drive in. Right away after the termination of the experiment, the HTB was placed in quarantine in a container designated for extinguishing electric vehicles. The maximum temperature measured by the thermocouples in this experiment was only 335 °C on thermocouple T0.
The first hammering of the wedge to the HTB was at 00:02:50. There was no temperature increase recorded on any of the thermocouples. Visually, smoke was observed, as shown in Figure 14a,b. It is likely that only the casing and parts of the cell in the HTB module were damaged.
The ignition of the fire occurred approximately at 00:23:32. The ignition was achieved by further driving the wedge into the HTB packing. Upon the secondary wedge drive in, multiple cells of the battery module were punctured, triggering a chemical reaction of the substances inside the HTB, as shown in Figure 14c. It is presumed that there was no prolonged burning of lithium. Based on fire intensity and character, it is possible to conclude that mostly plastic and other combustible components of the HTB were burning.
After ignition, thermocouple T0 recorded a sudden temperature increase to 335 °C within one minute. This was followed by a rapid temperature drop until approximately 00:31:11. At this point, there was a slight increase again. Subsequently, the temperature decreased. From 00:40:36 onwards, the temperature remained stable in the range of 30 °C to 50 °C.
Thermocouples T1 and T2 recorded a less pronounced temperature increase. The temperature on thermocouple T1 increased over approximately 7 min to 121 °C. This was followed by a decline with slight fluctuations. Another temperature increase occurred upon the application of the car fire blanket. From around 00:43:30, the temperature decreased until the termination of the experiment. Thermocouple T2 recorded a temperature increase for approximately 10 min from the initiation of the fire to a temperature of 167 °C. From this point until the application of the car fire blanket, the temperature decreased. From 00:41:20, the temperature remained stable in the range of 110 °C to 130 °C.
Thermocouple T3 on the opposite side of the mechanical integrity of battery packing damage did not measure significant temperature changes as the fire did not spread through the whole HTB. There was a slow increase in temperature after the fire initiation, similar to the other thermocouples. At approximately 00:31:11, thermocouple T3 recorded a maximum temperature of 80 °C. From around 00:35:50, the temperature stayed between 30 °C and 45 °C.
The analysis of temperature changes over time within the interval of the car fire blanket application is shown in Figure 17. The graph shows the temperature–time curve during the 10 min interval of the car fire blanket application. The graph displays the temperature results measured by thermocouples T0, T1, T2, and T3 in 1 s intervals. However, the graph shows time on the X-axis at 30 s intervals for clarity. The initial and final temperatures on each thermocouple are marked with different colors and shown in the graph. The overall temperature change was analyzed for each thermocouple. After removing the fire blanket, the HTB was monitored for 20 min. The reason is the problem of the HTB fire’s re-ignition, which occurred in several cases of EV fires for this reason; the graph includes temperature–time curves after the removal of the car fire blanket.
During the 10 min interval of the car fire blanket application, thermocouple T0 on the left side recorded only minor temperature changes. The temperature decreased from 44 °C to 40 °C. After the removal of the car fire blanket, the temperature stabilized with minimal fluctuations. The temperature at the end of the experiment was 42 °C. Similarly, thermocouple T3 on the right side of the HTB recorded small temperature fluctuations. The temperature was 33 °C at the beginning of the application interval and 35 °C upon the removal of the car fire blanket. The temperature remained at 35 °C until the termination of the experiment. Thermocouple T1 on the surface recorded slightly higher temperature fluctuations, with temperatures rising. At the beginning of the application interval, the temperature was 111 °C. After removal, the temperature rose to 114 °C and reached 120 °C at the termination of the experiment. The largest temperature fluctuations were observed in thermocouple T2 inside the HTB. At the start of the application interval, the temperature was 75 °C, rising to 148 °C within 150 s. Upon the removal of the car fire blanket, the temperature was 116 °C and afterward decreased to 68 °C at the termination of the experiment.
The temperatures recorded by the FLIR E96 14° thermal imaging camera were more significant since the camera recorded the experiment from the side of initiation. During the large-scale HTB fire test, similar temperatures and their changes were identified compared to the thermocouples. The FLIR thermal imaging camera recorded a hot spot temperature of 498 °C and an average temperature of only 290 °C just before the application of the car fire blanket. Thermocouple T0 recorded a temperature of 335 °C. Higher temperatures were recorded at the 1st and 2nd minute after the application of the car fire blanket. The hot spot temperature 1 min after application was 420 °C, with an average temperature of 300 °C. The hot spot temperature 2 min after application was 346 °C, with an average temperature of 248 °C. Compared to the temperatures measured by the thermocouples, these were much higher temperatures. The highest temperature during the 10 min interval of the car fire blanket application was 148 °C at 02:29 on thermocouple T2 inside the HTB. In the last 6 min of the experiment, the temperature recorded by the FLIR thermal imaging camera was lower than 100 °C. However, after the removal of the car fire blanket, the hot spot temperature rose to 227 °C and the average temperature to 132 °C. The main time points from the thermal imaging camera FLIR E96 14° footage are shown in Figure 18.

4. Discussion

In this subsection, we focus on comparing the results of temperature change during the car fire blanket application to the ICEV fire and the HTB fire. We aim to provide a detailed comparison of the effectiveness of the fire blanket concerning both types of propulsion. The colors of the graphs were chosen according to the colors of the thermocouples in the Results. The temperatures are compared as follows:
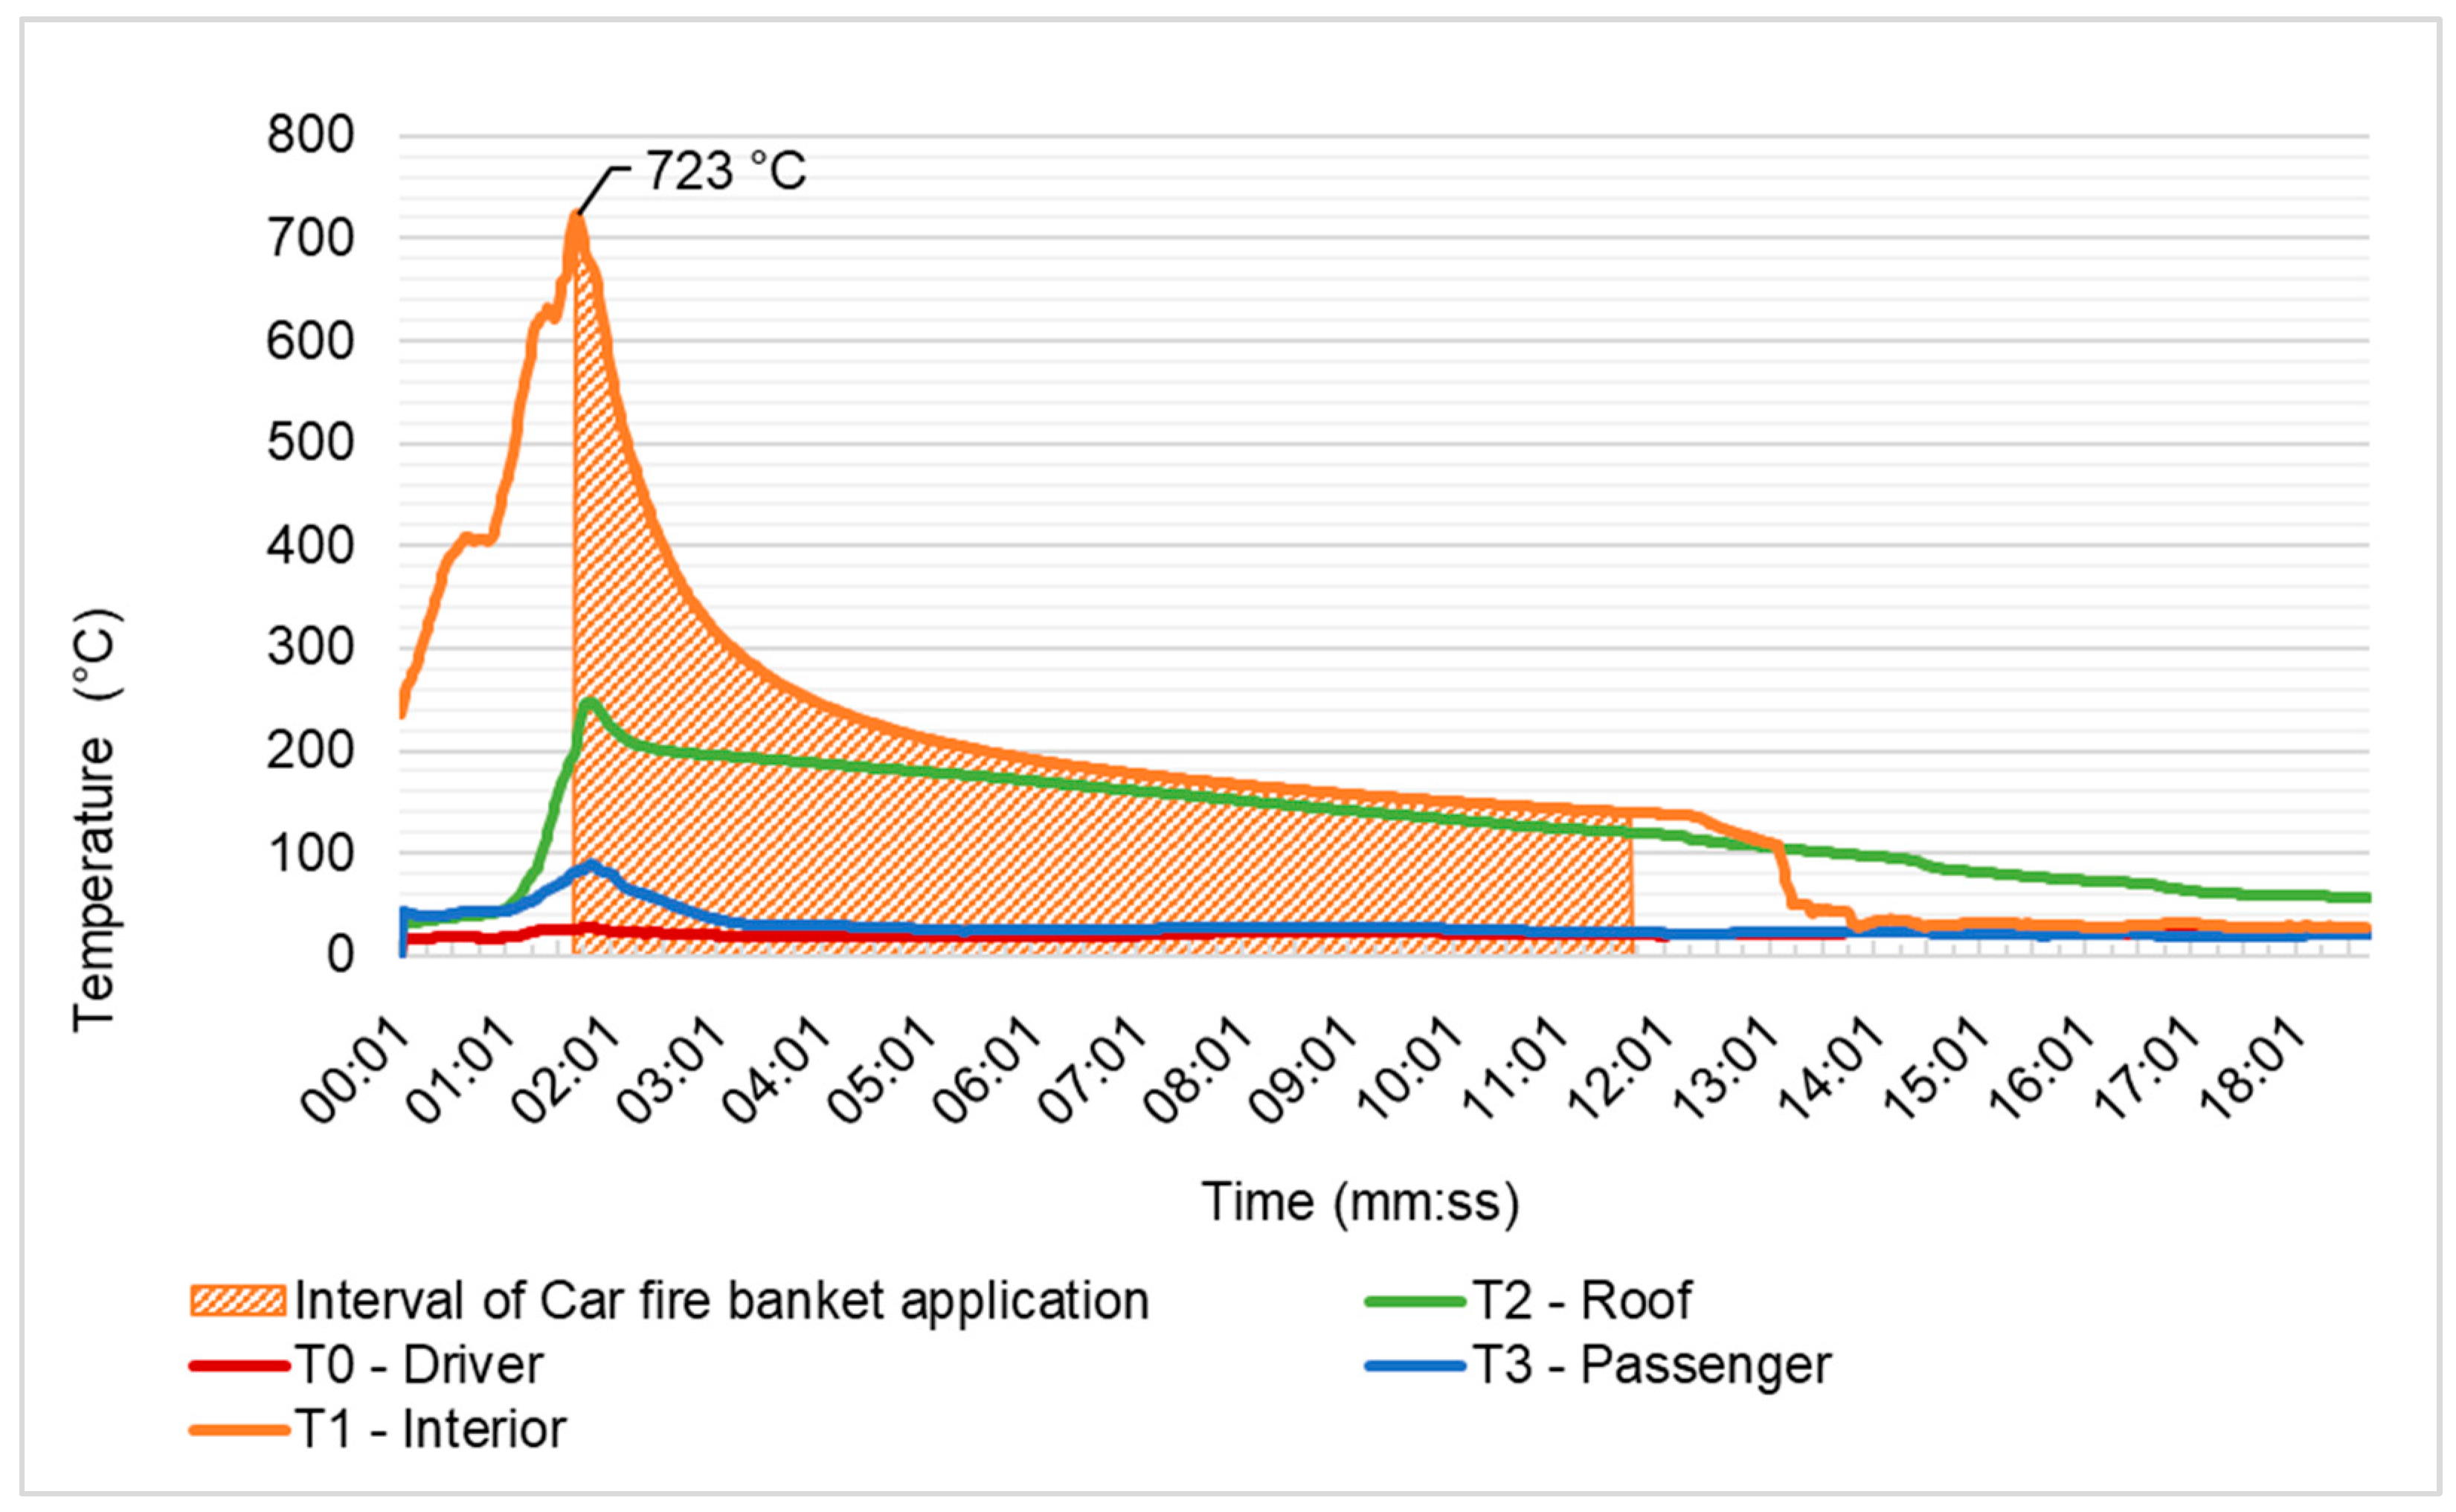
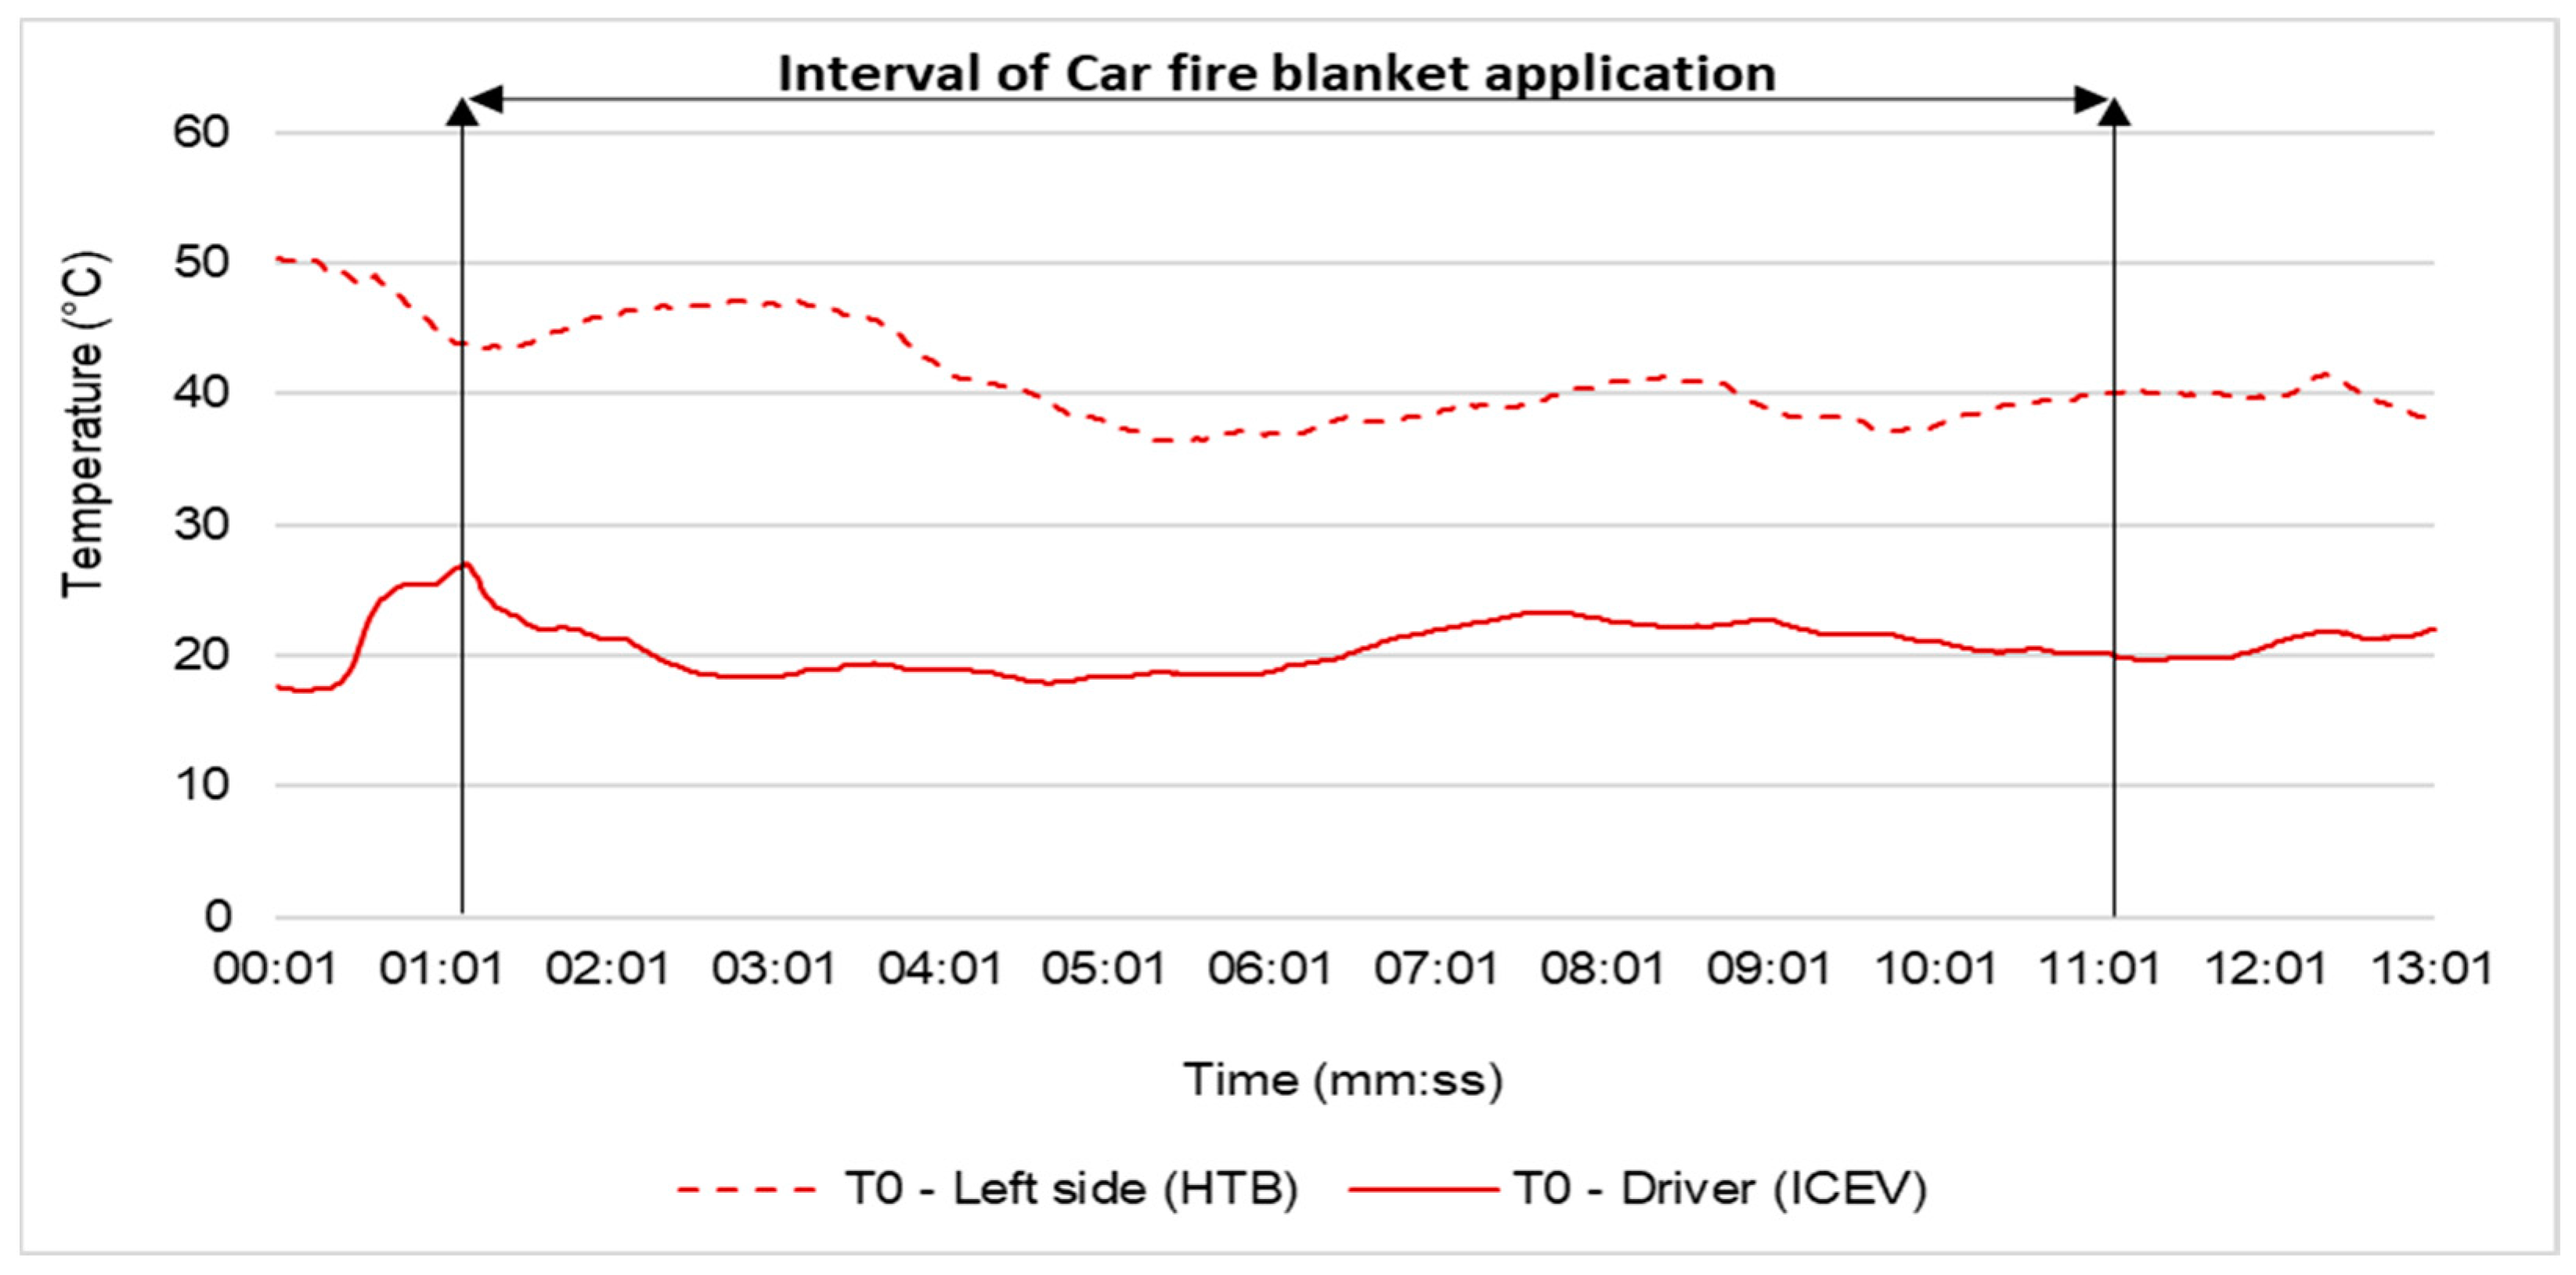
  • T0 Driver (ICEV) and T0 Left Side (HTB)—red color;
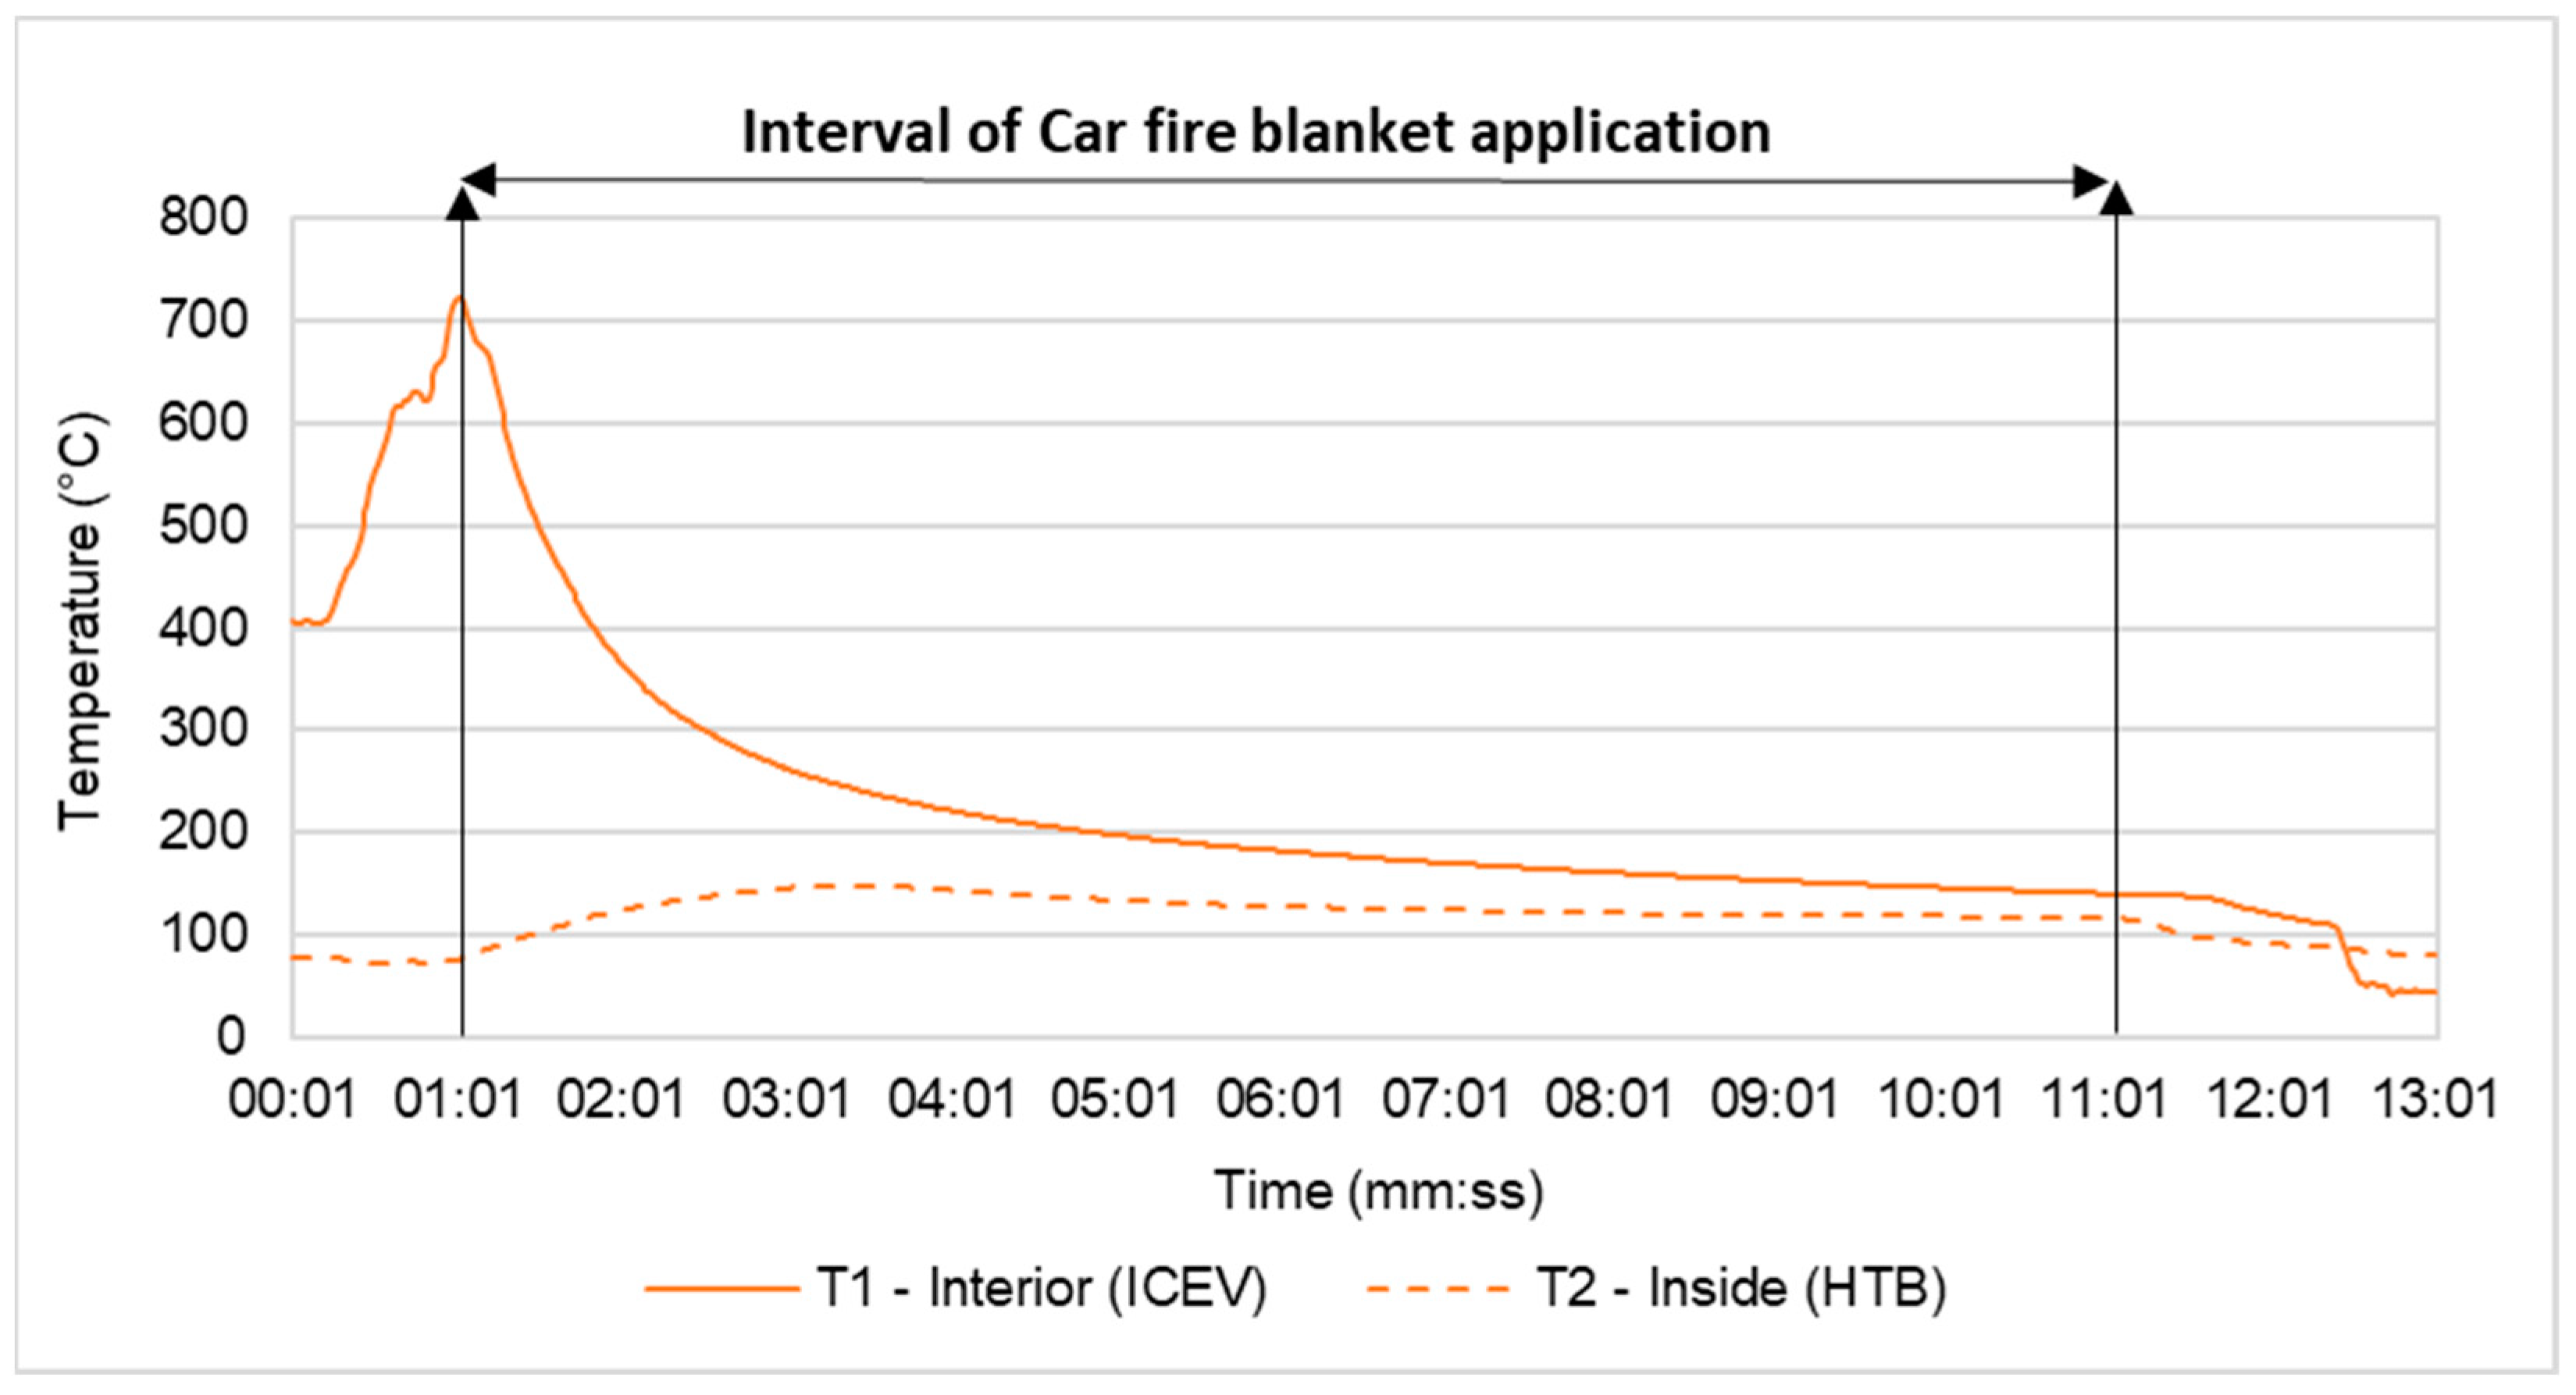
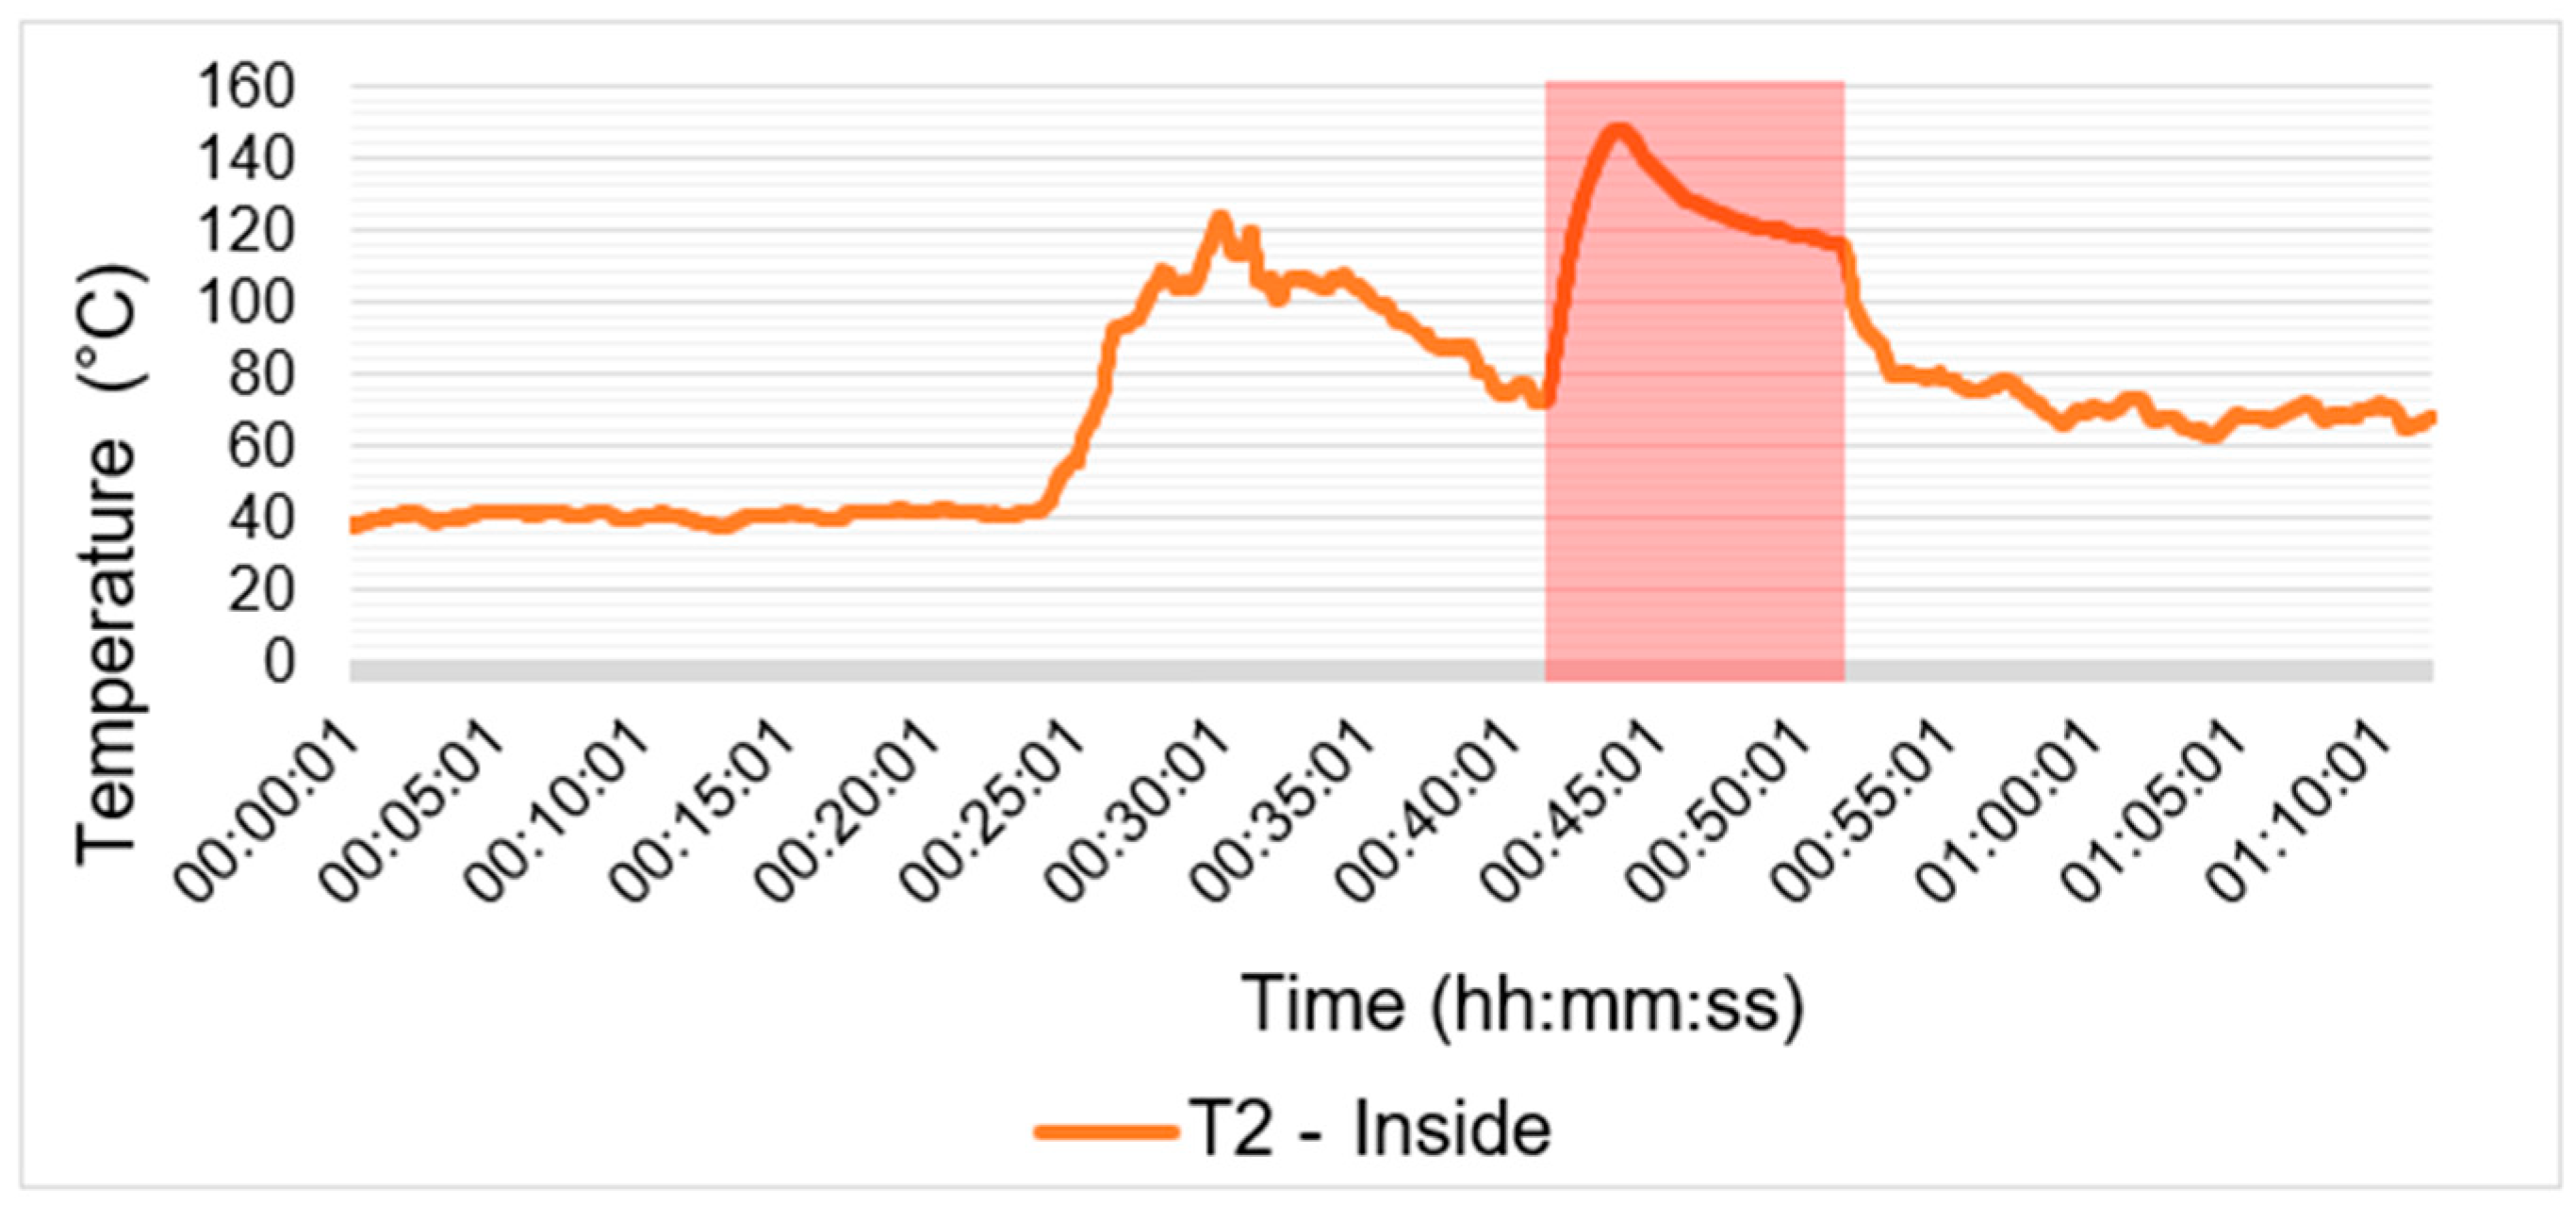
  • T1 Interior (ICEV) and T2 Interior (HTB)—orange color;
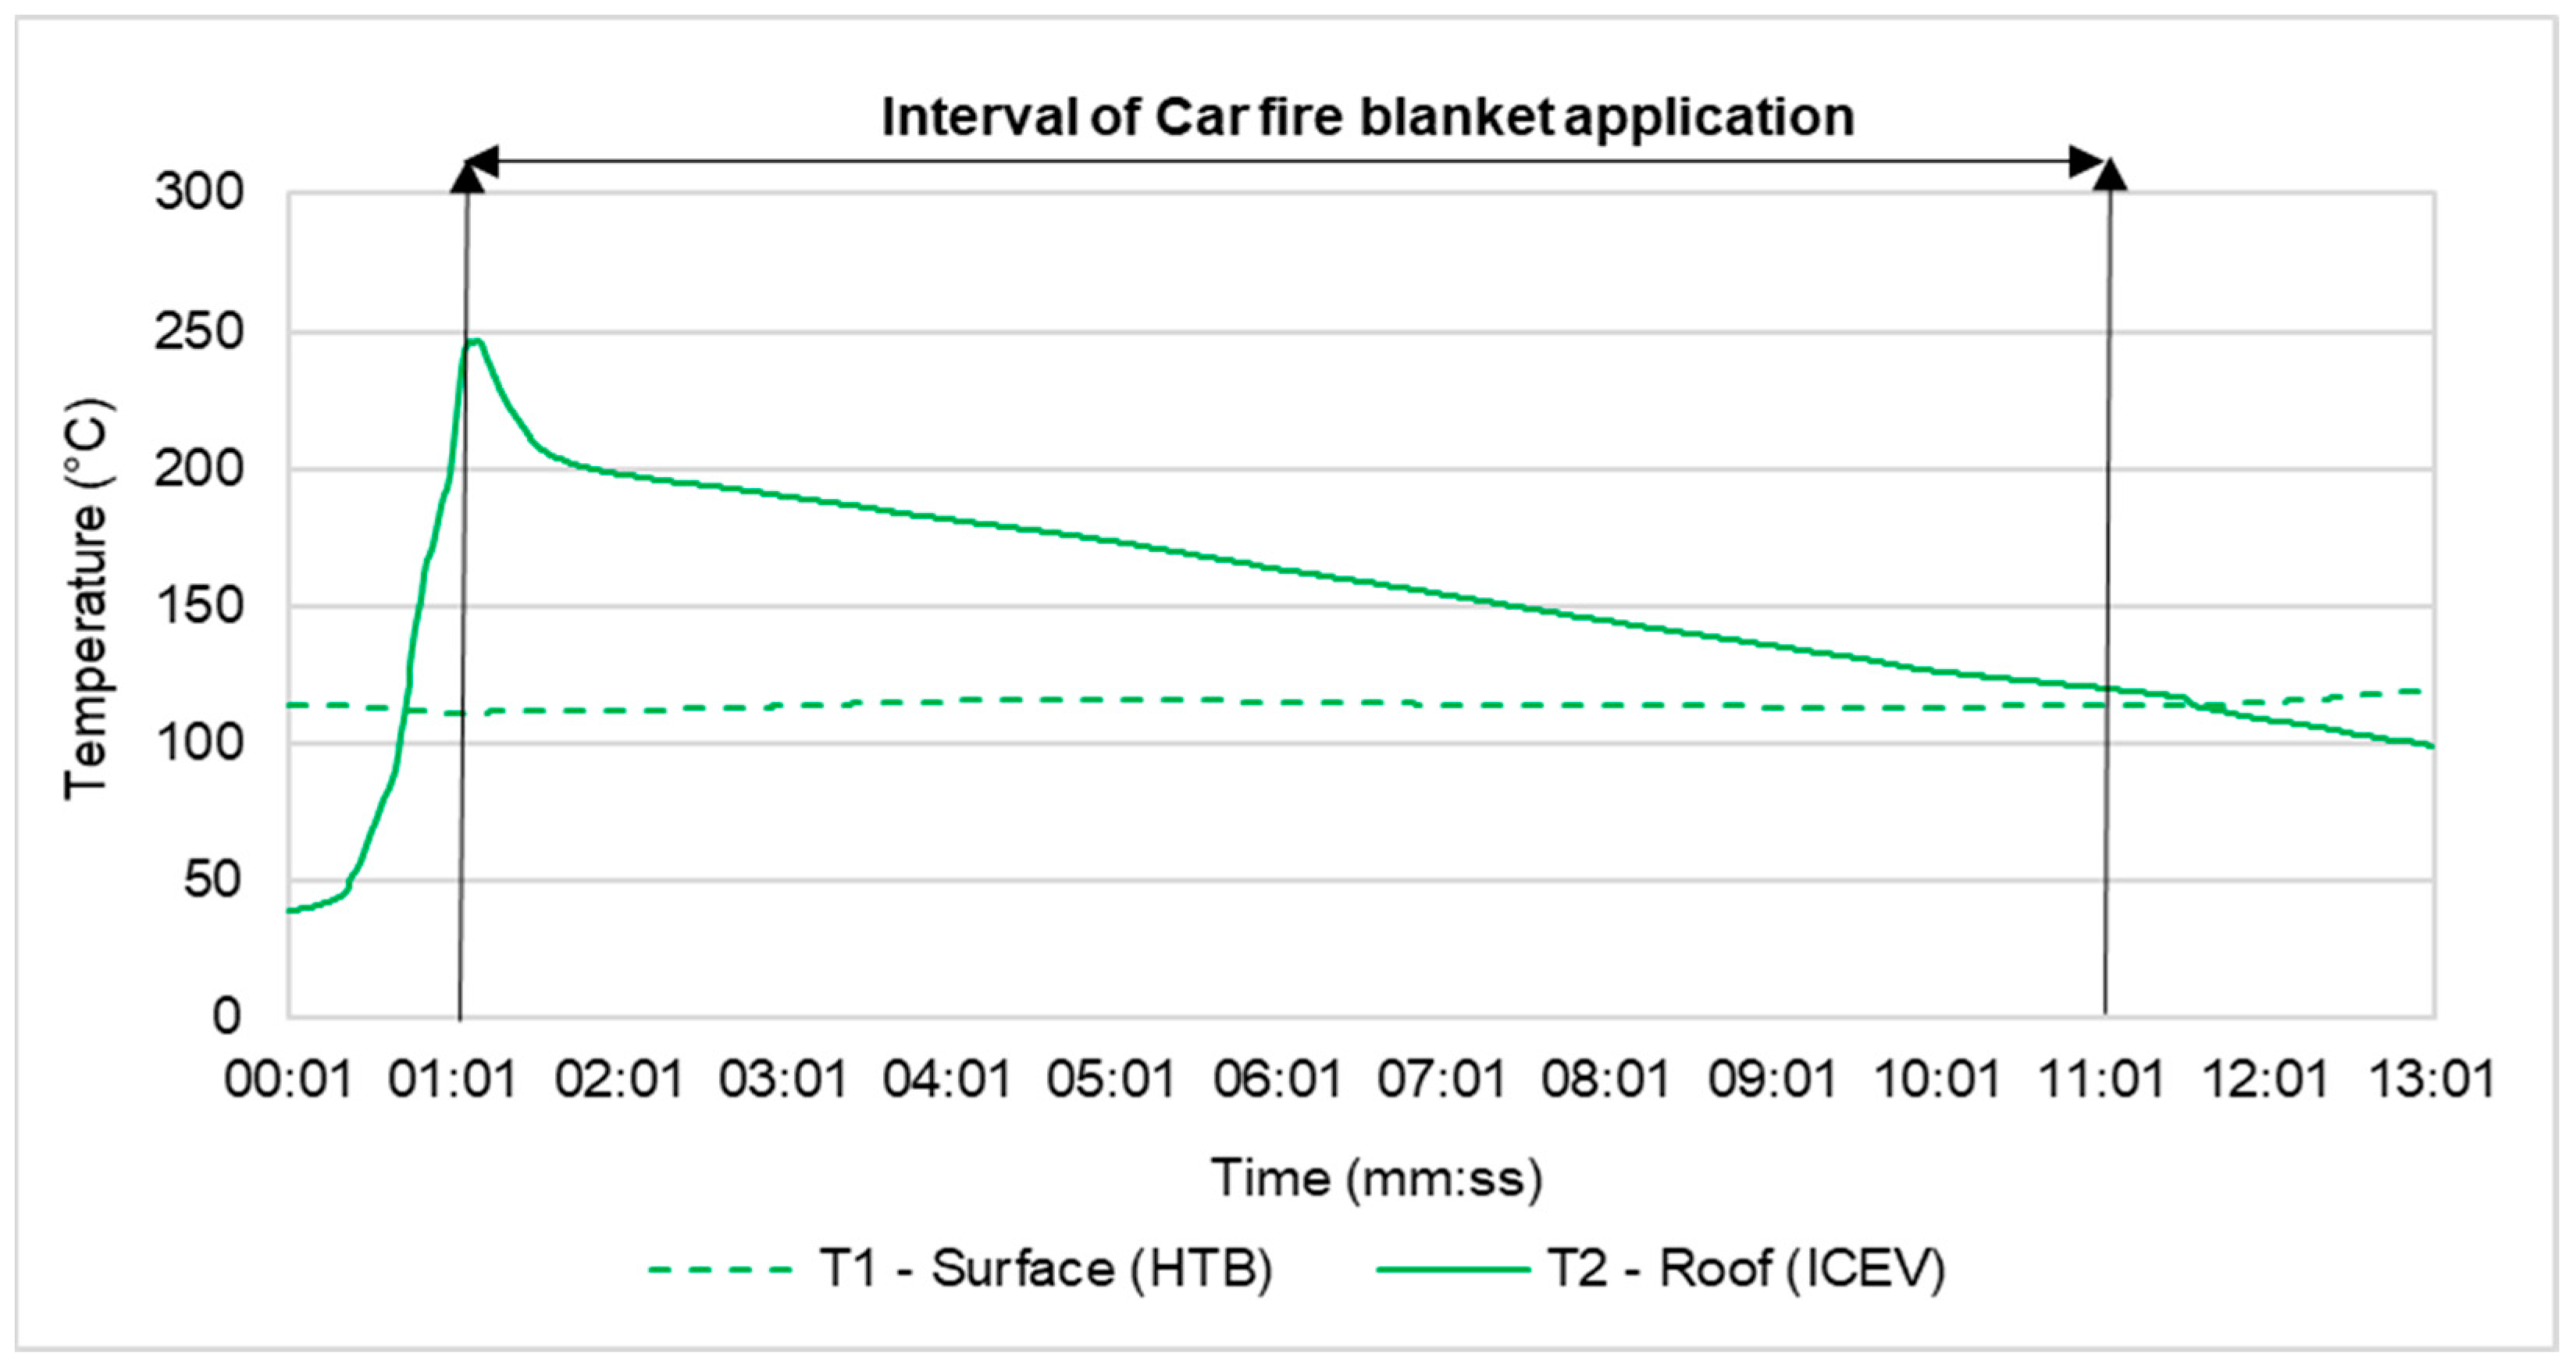
  • T2 Roof (ICEV) and T1 Surface (HTB)—green color;
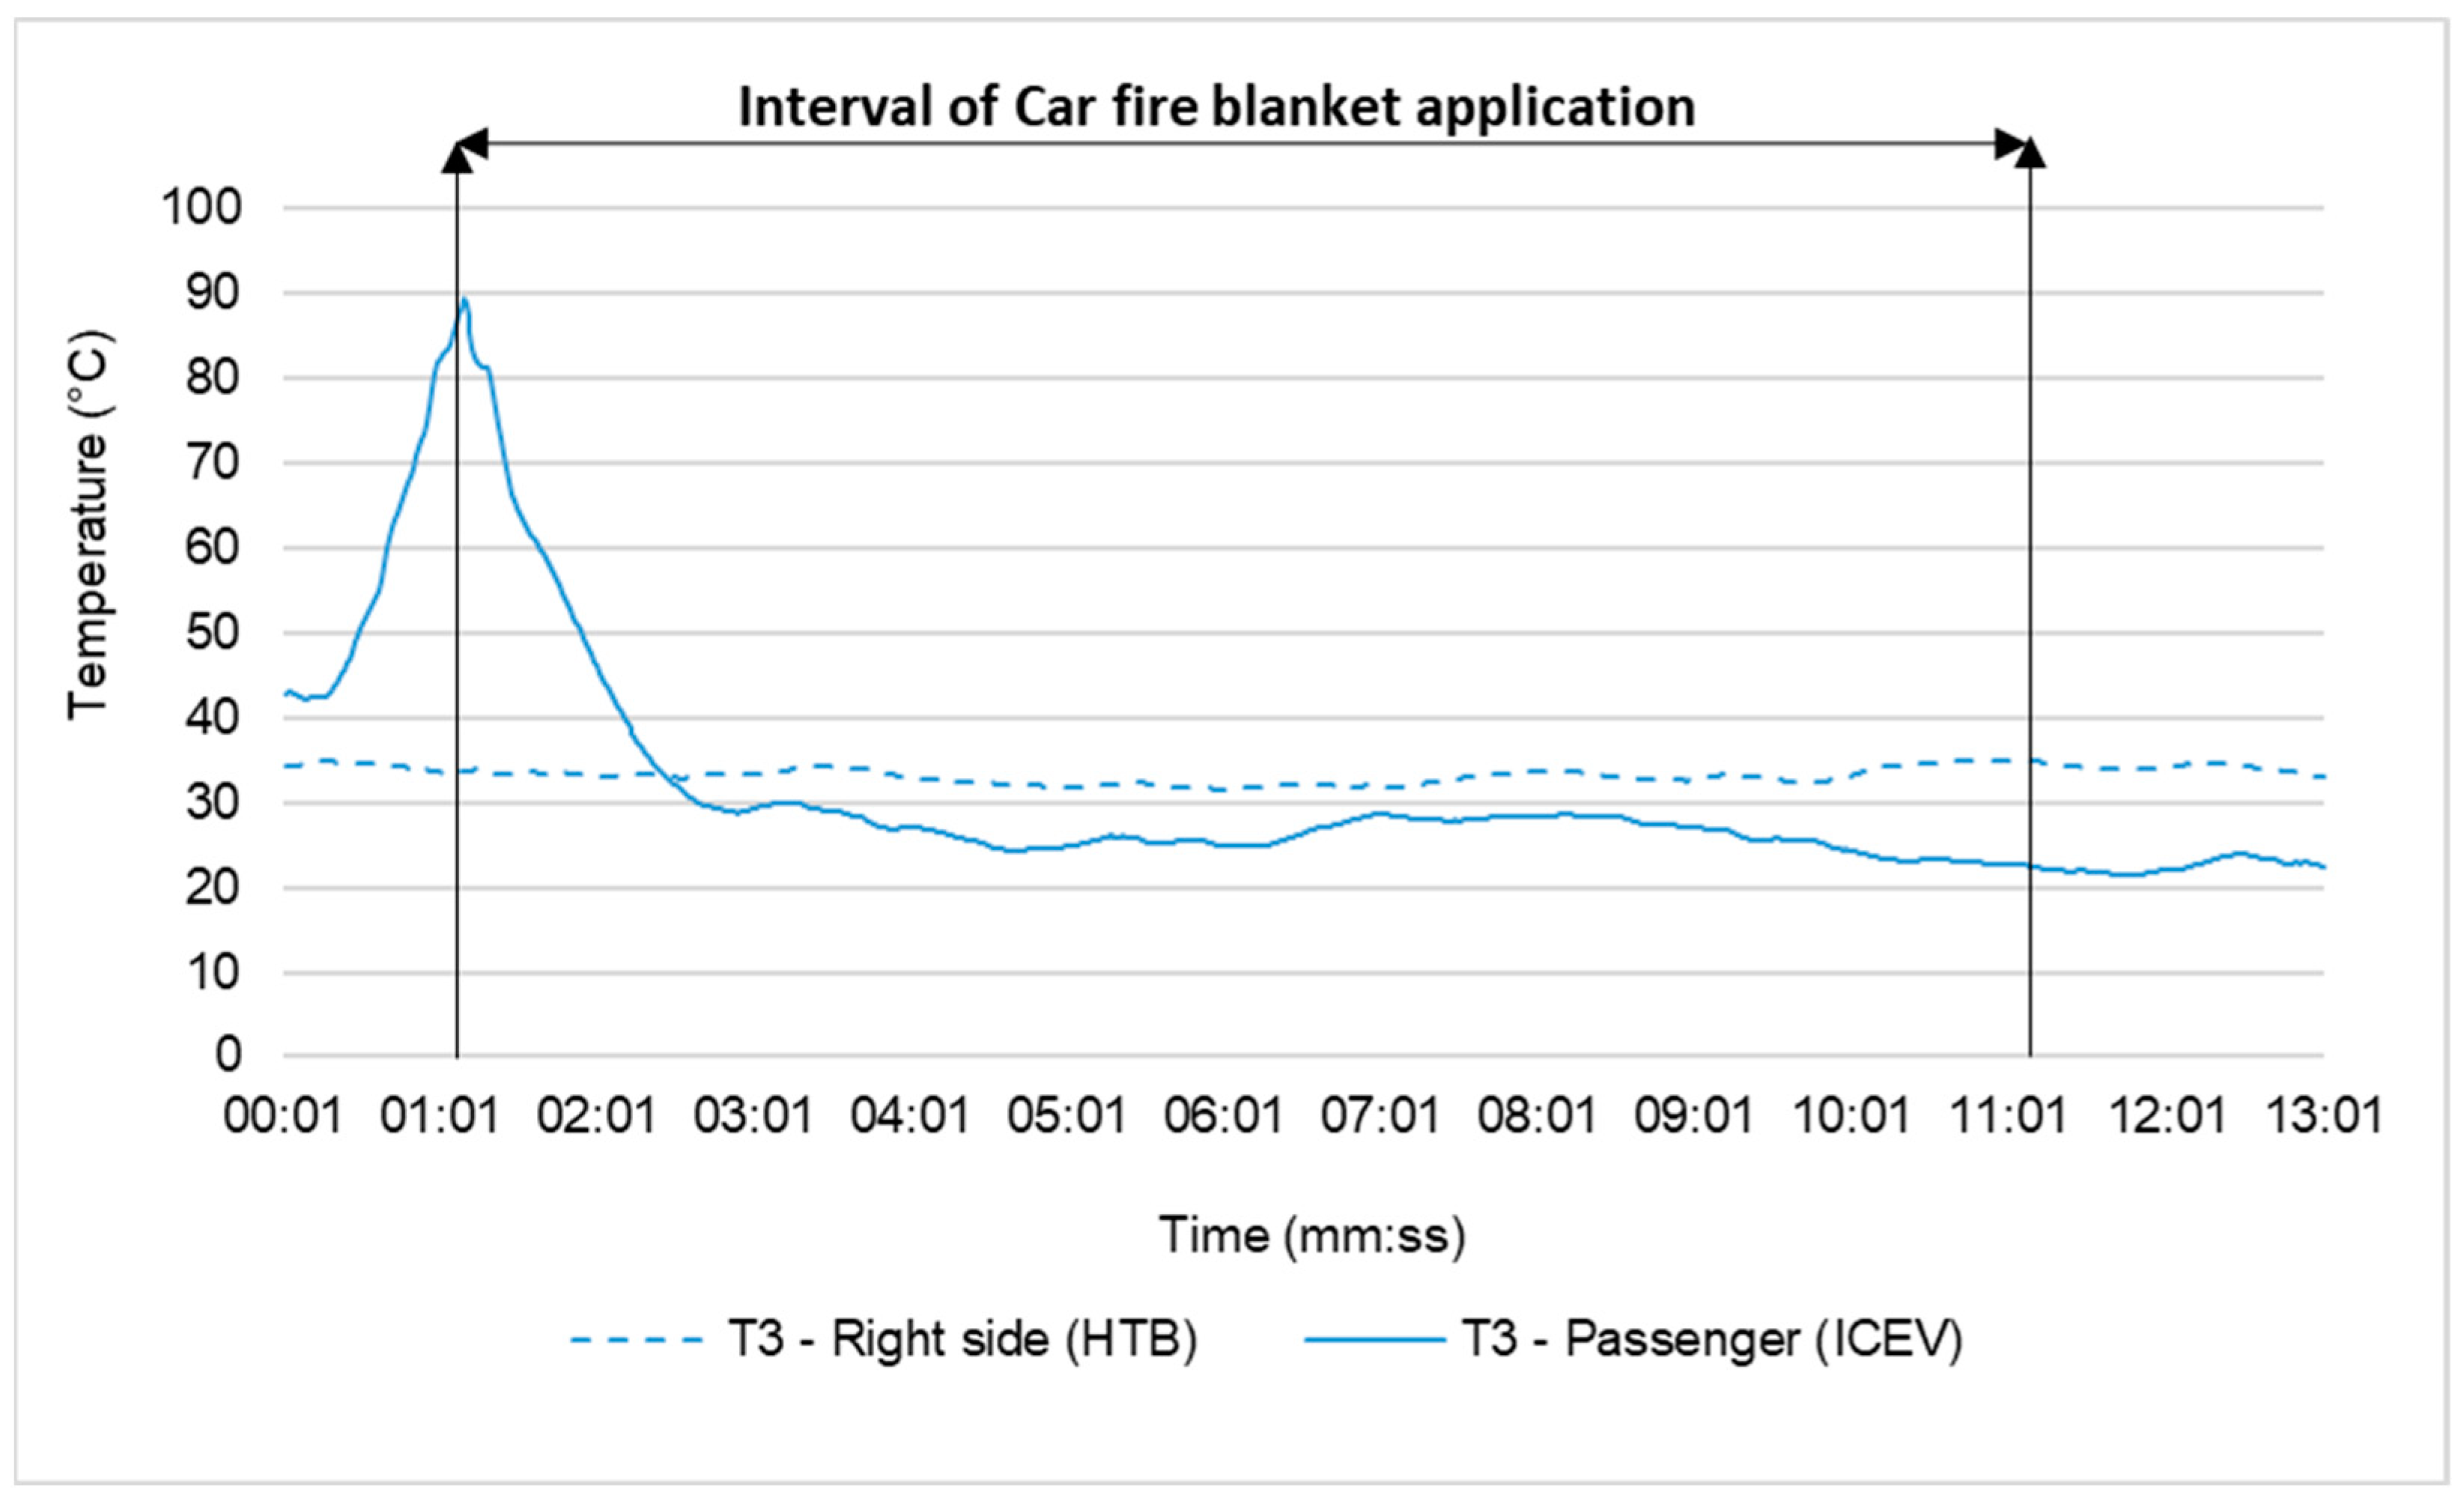
  • T3 Passenger (ICEV) and T0 Right Side (HTB)—blue color.
Firstly, we compared the data from thermocouple T0 Driver (ICEV) and T0 Left Side (HTB) shown in Figure 19. In the ICEV fire, the temperatures ranged from 18 °C to 28 °C, which represented ambient temperature. Before the application of the car fire blanket, the temperature rose, and it decreased after the application at 01:01. Later, at 06:01, the temperature rose again. It can be deduced that the measured temperatures had no significant impact on either the ICEV fire or the effectiveness of the car fire blanket. In the HTB fire, there were slightly higher temperatures from 36 °C to 50 °C. Before the application of the car fire blanket, the temperature decreased, and it slightly rose after the application.
Secondly, data from thermocouples T1 (ICEV) and T2 (HTB) are compared in Figure 20. In the ICEV fire test, much higher temperatures were recorded compared to the HTB fire. Before the application of the car fire blanket, the temperature in the ICEV fire test increased. After the application of the car fire blanket from 01:01 to 13:01, a decrease in the temperature was identified. In the HTB fire test, there were no significant temperature changes. The temperature remained stable before, during, and after the use of the car fire blanket. Overall, the highest temperature compared to each thermocouple was recorded inside the vehicle.
Thirdly, data from thermocouples T2 (ICEV) and T1 (HTB) are compared in Figure 21. Before the application of the car fire blanket, an increase in temperature can be observed in the ICEV fire test and a slight decrease in temperature in the HTB fire test. Subsequently, after the application of the car fire blanket at 01:01, there was a decrease in temperature in the ICEV fire test but an initial increase in the HTB fire test. The temperature continued to rise until approximately 03:10, followed by a decrease. Overall, the highest temperature was recorded on the surface of the HTB.
Lastly, data from thermocouples T3 (ICEV) and T3 (HTB) are compared in Figure 22. In the case of the HTB fire test, no temperature changes were identified before, during, or after the use of the fire blanket. The temperatures remained between 30 °C and 35 °C. Conversely, higher temperatures were recorded in the ICEV fire test. Before the application, the temperature increased. After the application of the car fire blanket from 01:01 to 13:01, the temperature decreased with minor fluctuations.
In terms of the temperature load on the car fire blanket, the average temperatures on individual thermocouples were identified at the time of the car fire blanket application to the ICEV fire test and the HTB fire test. The data are shown in Table 5.
During the application of the fire blanket in the ICEV and HTB fire tests, the average temperatures at the lateral gaps on thermocouples T0 and T3 were very similar. Thermocouple T0 recorded a temperature of 21 °C during the ICEV fire test and 41 °C during the HTB fire test. The higher temperature during the HTB fire test was due to initiation on the left side. On thermocouple T3, the average temperature in both tests was less than 35 °C, approximately the ambient temperature. The interior had the highest average temperature of 225 °C during the ICEV fire test. Inside the battery, the average temperature was 114 °C. On the roof of the ICEV, the average temperature was 164 °C, and on the surface of the HTB, it was 125 °C. Overall, the average temperature under the car fire blanket during the ICEV fire test was 195 °C, and during the HTB fire test, it was 120 °C. From the FLIR E96 14° thermal camera recordings, the average temperature during the ICEV fire test was 183 °C and for the HTB fire test, 154 °C. Significant temperature differences are mainly due to reaching higher temperatures in the ICEV fire. Probably, it was due to the presence of a larger amount of combustible materials. Additionally, there was no long-term lithium burning in the HTB fire test.
Researchers Wijesekere et al. [6] identified a temperature decrease inside the high-voltage traction battery when a car fire blanket was applied to an electric vehicle fire. The temperature at the beginning of the car fire blanket application interval was approximately 900 °C. For about 10 min, the temperature decreased. Subsequently, the temperature started to rise. However, the temperature did not drop below 500 °C overall.
Researchers further found that after the application of the car fire blanket, the ambient temperature stabilized below 100 °C. This indicates that the spread of the fire to surrounding vehicles is highly unlikely. According to the authors, the main reason to use car fire blankets is to keep smoke and flames under control and potentially extinguish the fire by limiting access to oxygen. Overall, the authors utilized seven thermocouples and one optical smoke detector.
In a large-scale HTB fire test, we measured significantly lower temperatures inside the battery. The maximum temperature recorded was just under 150 °C. However, there was an initial temperature increase after the car fire blanket application, followed by a subsequent decrease. The 10 min application interval is highlighted by a red rectangle in Figure 23.
Researchers Wijesekere et al. [6] in their publication likely measured higher temperatures due to the fire spreading into multiple modules of the HTB. In our conducted test, temperatures were much lower because the fire mainly involved plastics and other components of the HTB. The mechanical damage of the HTB was insufficient.
Based on the fire progression and analysis of the results, we deduce there was no long-term lithium burning in the HTB.
Researchers Kwon et al. [7] in their publication identified a temperature decrease of 719 °C (from 974 °C to 255 °C) inside the ICEV after the 10 min application interval of the car fire blanket. A comparison of the results of the large-scale ICEV fire test from this publication and the 10 min application interval from the publication by Kwon et al. [7] is shown in Figure 24. The graph compares the overall temperature decrease, temperatures before the application, and after the removal of the car fire blanket.
Kwon et al. [7] likely identified a greater temperature decrease due to a higher initial temperature. Despite the fact that the researchers identified a higher overall temperature decrease of 135 °C, we reached a lower temperature of 115 °C after removing the fire blanket from the ICEV.

5. Conclusions

The data presented in this contribution were obtained during the pilot testing of fire blankets on vehicles by the Fire and Rescue Corps within the Slovak Republic. Conducting large-scale tests is demanding. However, through experimental research, we obtained the following results:
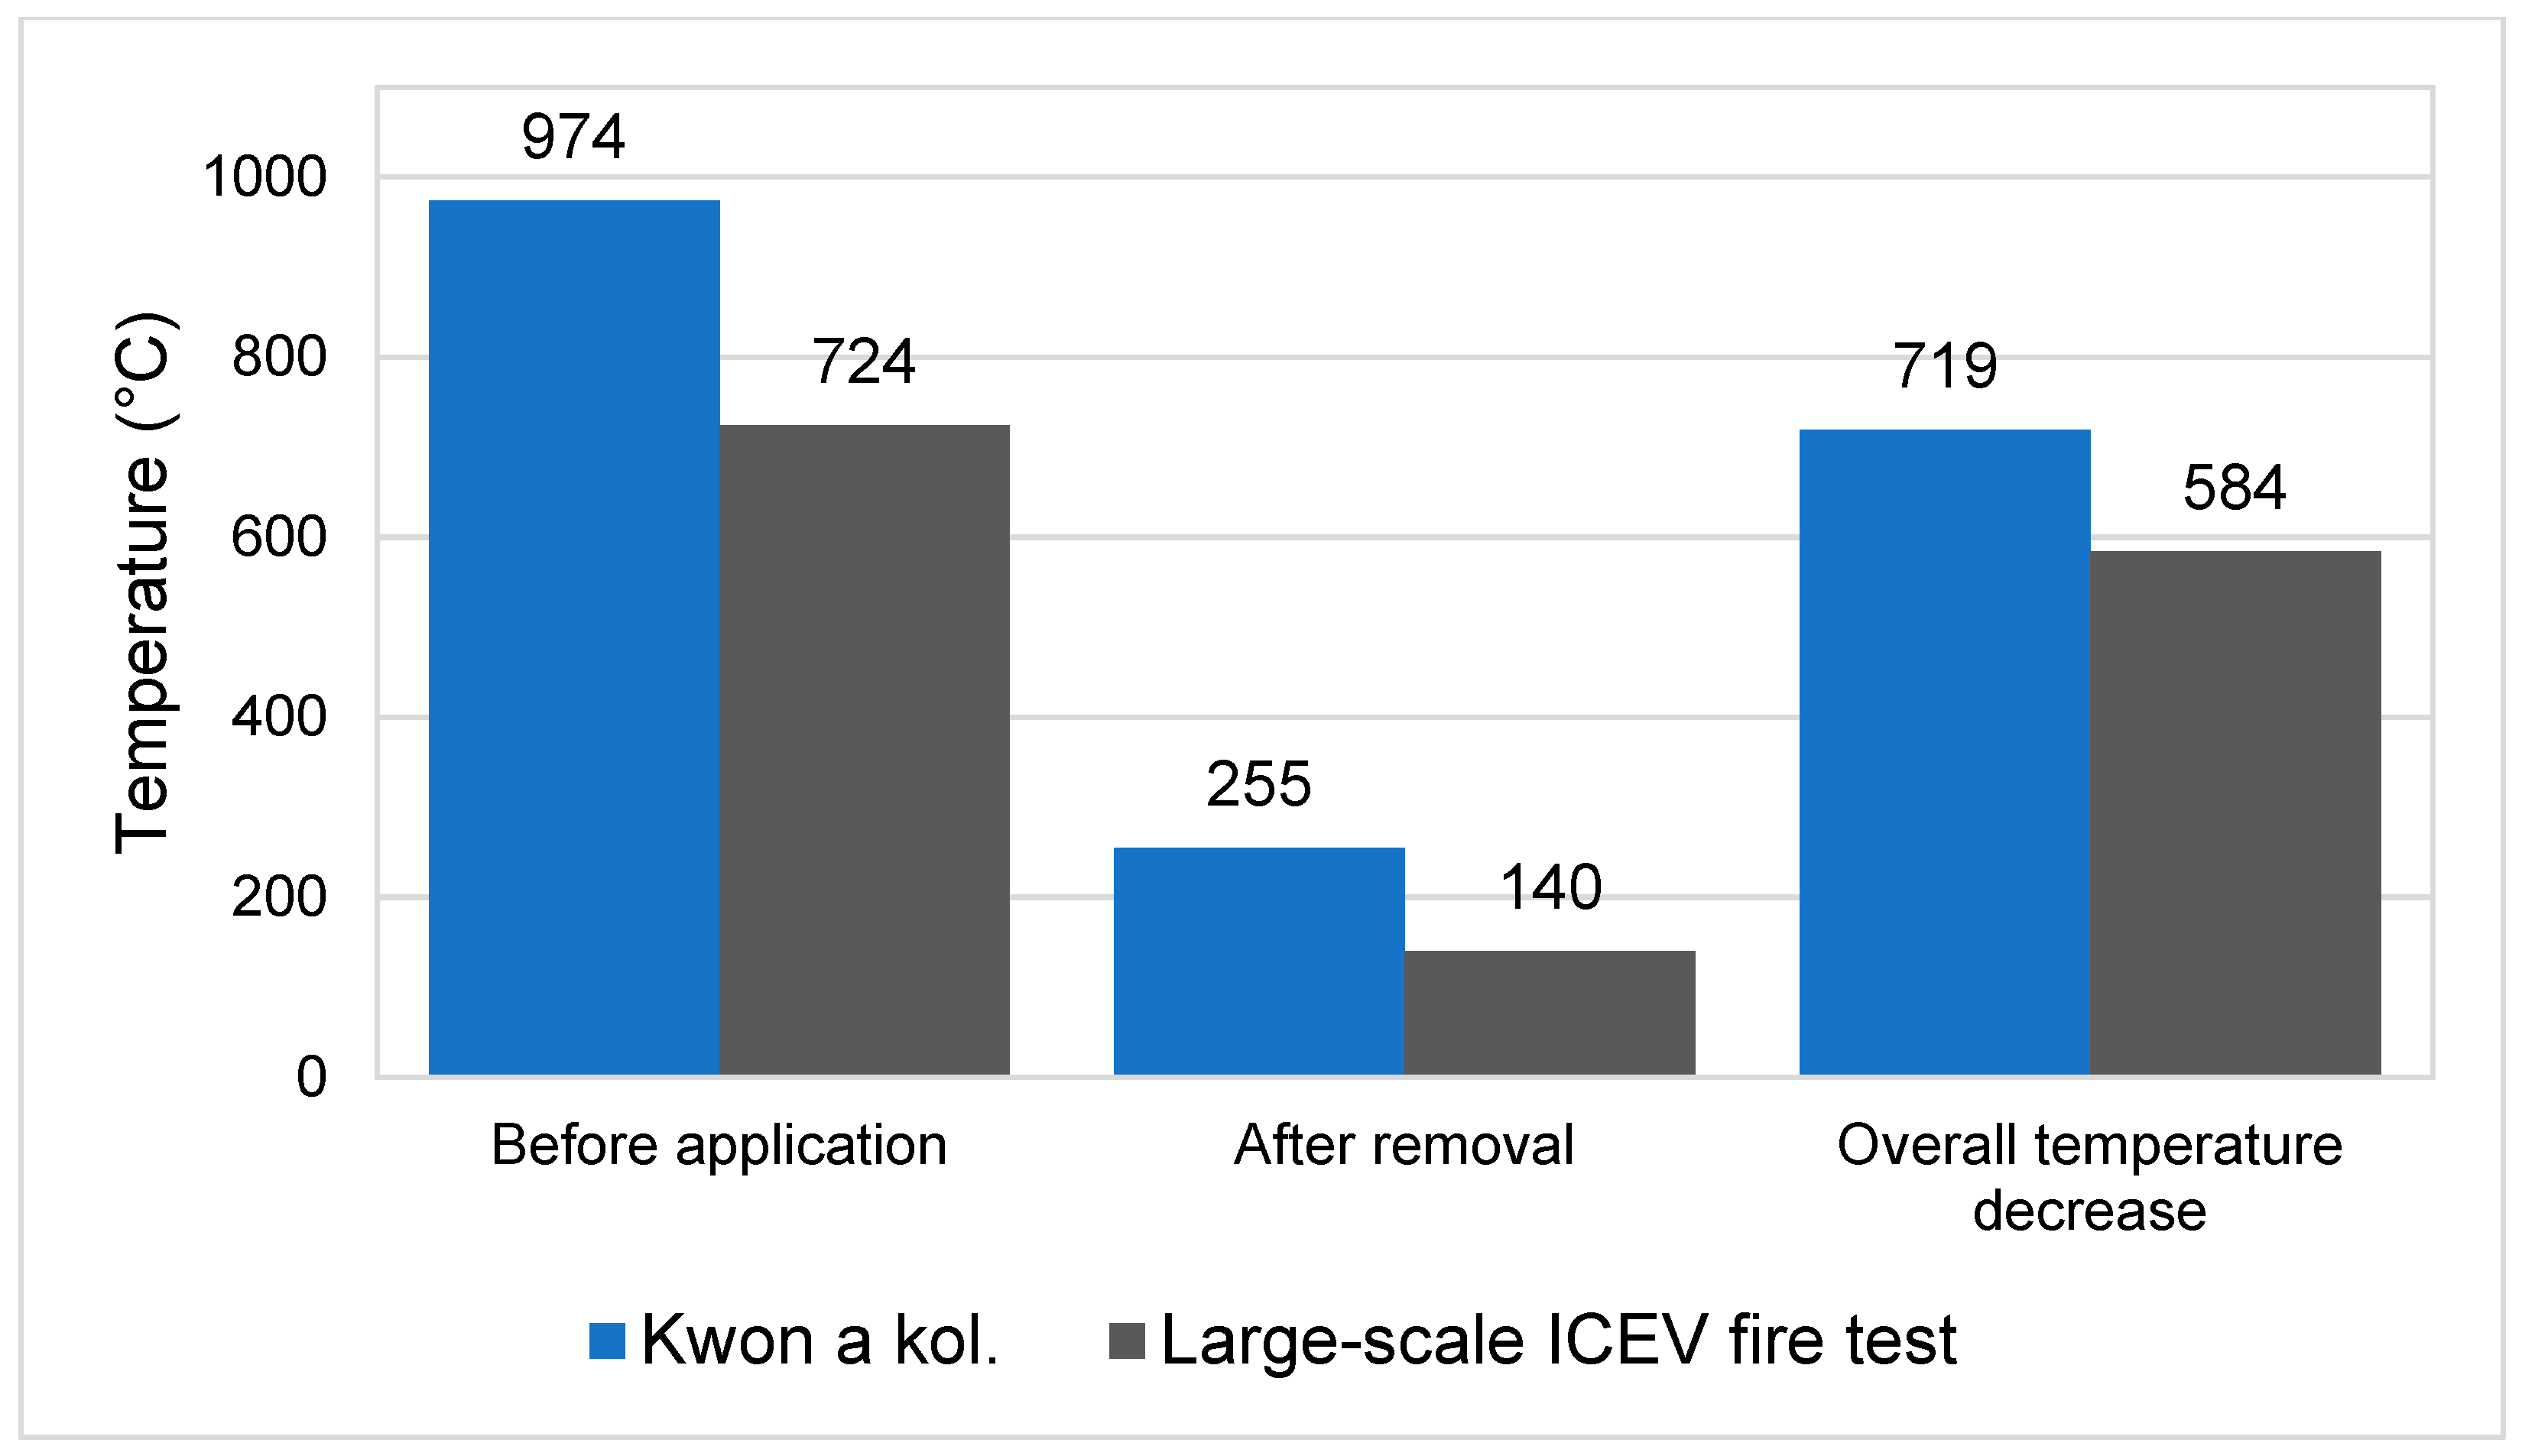
  • The application of the car fire blanket has a significant impact on the temperature decrease in the interior (temperature dropped by 584 °C) but also on the body (temperature dopped by 97 °C) of the ICEV. Thermocouples T0 and T3 at a lateral distance of 0.7 m did not measure significant temperatures during the whole experiment.
  • In the large-scale ICEV fire test, the maximum temperature reached was 724 °C in thermocouple T1 located in the interior.
  • There was no significant impact on temperature decrease after the car fire blanket application in the large-scale HTB fire test.
  • The large-scale HTB fire test results show that after car fire blanket application, the temperature inside the HTB increased (temperature rose by 39 °C).
  • Mechanical damage to the integrity of the HTB enclosure did not initiate a long-term lithium fire in the HTB fire test.
  • In the large-scale HTB fire test, the maximum temperature reached was 335 °C in thermocouple T0 located on the left side at a lateral distance of 0.7 m.
We consider the findings based on the results of this research to be of interest in not only the area of testing car fire blankets but also in ICEV and HTB fire testing. We also believe that the methodology of experiments applied in this research is repeatable and can bring more results in the area of car fire blanket testing. However, we acknowledge the limitations of the conducted experiments. Our prospective aim to enhance future experiments is to incorporate heat release rate (HRR) measurements. Since the car fire blanket was not applied during thermal runaway, we cannot assess its effect on this phenomenon in detail.

Author Contributions

Conceptualization, J.S. and M.K.; methodology, K.S. and J.S.; formal analysis, K.S. and J.S.; investigation, J.S., M.K., M.B. and K.S.; resources, M.B.; data curation, J.S. and K.S.; writing—original draft preparation, K.S.; writing—review and editing, K.S.; visualization, K.S.; project administration, K.S. All authors have read and agreed to the published version of the manuscript.

Funding

This article was supported by University of Žilina, Faculty of Security Engineering. Department of Fire Engineering.

Institutional Review Board Statement

Not applicable.

Informed Consent Statement

Not applicable.

Data Availability Statement

The data given in this study is available on the request of the corresponding author because of the anonymousness of the manufacturers who cooperated on the research.

Acknowledgments

This article was supported by the Fire and Rescue Corps of Slovak Republic with Research task PPZ-OAI1-2022/002671-037—Testing the effectiveness of extinguishing electric, hybrid vehicles and other dangerous substances in vehicle fires in road transport using different types of special fire blankets.

Conflicts of Interest

The authors declare no conflicts of interest.

References

  1. Ministry of Interior—Total Number of Registered Vehicles in Slovak Republic. Available online: https://www.minv.sk/?celkovy-pocet-evidovanych-vozidiel-v-sr (accessed on 2 March 2024). (In Slovak).
  2. Ministry of Interior—Number of Registered Electric and Hybrids Vehicles. Available online: https://www.minv.sk/?pocet-evidovanych-elektromobilov-a-hybridov (accessed on 2 March 2024). (In Slovak).
  3. Ministry of Interior—Fire Statistics in Slovakia. Available online: https://www.minv.sk/?statistika-poziarovosti-na-slovensku-2 (accessed on 5 March 2024). (In Slovak).
  4. Arvidson, M.; Gehandler, J.; Bleye, J. Fire suppression and manual firefighting of battery electric vehicle fires on ro-ro ships. In Proceedings of the Seventh International Conference on Fires in Vehicles, Stavanger, Norway, 24–25 April 2023. [Google Scholar]
  5. Sturm, P.; Fößleitner, P.; Fruhwirt, D.; Galler, R.; Wenighofer, R.; Heindl, S.F.; Krausbar, S.; Hegerf, O. Fire tests with lithium-ion battery electric vehicles in road tunnels. Fire Saf. J. 2022, 134, 103695. [Google Scholar] [CrossRef]
  6. Wijesekere, T.; Funk, E.; Wilkens, K.; Husted, B. Long-scale tests of firefighting technologies for electric vehicle fires on board ro-ro ferries. In Proceedings of the Seventh International Conference on Fires in Vehicles, Stavanger, Norway, 24–25 April 2023. [Google Scholar]
  7. Kwon, J.; Kim, H.; Lee, S.; Kim, S.; Park, T.; Kim, T.; Kim, S. Application of Car Fire Blankets to Car Fires. Fire Sci. Eng. 2021, 35, 143–149. [Google Scholar] [CrossRef]
  8. Chen, X.; Shen, W.; Vo, T.T.; Cao, Z.; Kapoor, A. An overview of lithium-ion batteries for electric vehicles. In Proceedings of the 10th International Power & Energy Conference, Ho Chi Minh, Vietnam, 12–14 December 2012. [Google Scholar]
  9. Zhao, C.; Wang, T.; Huang, Z.; Wu, J.; Zhou, H.; Ma, M.; Xu, J.; Wang, Z.; Li, H.; Sun, J.; et al. Experimental study on thermal runaway of fully charged and overcharged lithium-ion batteries under adiabatic and side-heating test. J. Energy Storage 2021, 38, 102519. [Google Scholar] [CrossRef]
  10. Mallick, S.; Gayen, D. Thermal behavior and thermal runaway propagation in lithium-ion battery systems—A critical review. J. Energy Storage 2023, 62, 106894. [Google Scholar] [CrossRef]
  11. Sun, P.; Willstrand, O.; Rosengren, M. A review of Battery Fires in Electric Vehicles. Fire Technol. 2020, 56, 1361–1410. [Google Scholar] [CrossRef]
  12. Bisschop, R.; Willstrand, O.; Rosengren, M. Handling Lithium-Ion Batteries in Electric Vehicles: Preventing and Recovering from Hazardous Events. Fire Technol. 2020, 56, 2671–2694. [Google Scholar] [CrossRef]
  13. Ghiji, M.; Novozhilov, V.; Moinuddin, K.; Joseph, P.; Burch, I.; Suendermann, B.; Gamble, G. A Review of Lithium-Ion Battery Fire Suppression. Energies 2020, 13, 5117. [Google Scholar] [CrossRef]
  14. Hynynem, J.; Quant, M.; Pramanik, R.; Olofsson, A.; Li, Y.Z.; Arvidson, M.; Andersson, P. Electric Vehicle Fite Safety in Enclosed Spaces; RISE Research Institutes of Sweden: Gothenburg, Sweden, 2023; pp. 8–28. [Google Scholar]
  15. Lecocq, A.; Bertana, M.; Truchot, B.; Marlair, G. Comparison of the fire consequences of an electric vehicle and an internal combustion engine vehicle. In Proceedings of the International Conference on Fires in Vehicles FIVE, Chicago, IL, USA, 27–28 September 2012. [Google Scholar]
  16. Lecocq, A.; Bertana, M.; Truchot, B.; Marlair, G. Comparison of fire behaviours of an electric-battery-powered behicle and gasoline-powered vehicle in a real-scale fire test. In Proceedings of the International Conference on Fires in Vehicles FIVE, Chicago, Il, USA, 27–28 September 2012. [Google Scholar]
  17. Willstrand, O.; Bisschop, R.; Blomqvist, P.; Temple, A.; Anderson, J. Toxic Gases from Fire in Electric Vehicles; RISE Research Institutes of Sweden: Gothenburg, Sweden, 2020; pp. 8–51. [Google Scholar]
  18. Li, D.; Zhu, G.; Zhu, H.; Yu, Z.; Gao, Y.; Jiang, X. Flame spread and smoke temperature of full-scale fire test of car fire. Case Stud. Therm. Eng. 2017, 10, 315–324. [Google Scholar] [CrossRef]
  19. Jiang, X.; Zhu, G.; Zhu, H.; Li, D. Full-scale Experimental Study of Fire Spread Behavior of Cars. Procedia Eng. 2018, 211, 297–305. [Google Scholar] [CrossRef]
  20. Okamoto, K.; Watanabe, N.; Hagimoto, Y.; Chigira, T.; Masano, R.; Miura, H.; Ochiai, S.; Satoh, H.; Tamura, Y.; Hayano, K.; et al. Burning behavior of sedan passenger cars. Fire Saf. J. 2009, 44, 301–310. [Google Scholar] [CrossRef]
  21. Kang, S.; Kwon, M.; Choi, J.Y.; Choi, S. Full-scale fire testing of battery electric vehicles. Appl. Energy 2023, 332, 120497. [Google Scholar] [CrossRef]
  22. Cui, Y.; Liu, J.; Cong, B.; Han, X.; Yin, S. Characterization and assessment of fire evolution process of electric vehicles placed in parallel. Process Saf. Environ. Prot. 2022, 166, 524–534. [Google Scholar] [CrossRef]
  23. Cui, Y.; Cong, B.; Liu, J.; Qiu, M.; Han, X. Characteristics and Hazards of Plug-In Hybrid Electric Vehicle Fires Caused by Lithium-Ion Battery Packs with Thermal Runaway. Front. Energy Res. 2022, 10, 878035. [Google Scholar] [CrossRef]
  24. STN 73 6058:1987; Multi-Story and Underground Garages. Basic Principles. Slovak Technical Standard: Bratislava, Slovakia, 1987.
  25. Niroomand, N.; Bach, C.; Elser, M. Vehicle Dimensions Based Passenger Car Classification using Fuzzy and Non-Fuzzy Clustering Methods. Transp. Res. Rec. 2021, 10, 184–194. [Google Scholar] [CrossRef]
Figure 1. Number of registered passenger battery electric and hybrid vehicles in Slovakia from 2016 to 2023 [2].
Applsci 14 04902 g001
Figure 2. Comparison of overall vehicle fires in road transport and fires of passenger vehicle and vans in Slovakia from 2016 to 2023 [3].
Applsci 14 04902 g002
Figure 3. PPE used by operators.
Applsci 14 04902 g003
Figure 7. Scheme of location of thermocouples in large-scale ICEV fire test. (a) Front view of thermocouple location for large-scale ICEV fire test; (b) top view of thermocouple location for large-scale ICEV fire test.
Applsci 14 04902 g007
Figure 8. Scheme of location of thermocouples in large-scale HTB fire test. (a) Side view of thermocouple location for large-scale HTB fire test; (b) top view of thermocouple location for large-scale HTB fire test.
Applsci 14 04902 g008
Figure 9. Initiation of ICEV fire. (a) The operator initiates a fire; (b) Development after 5 s from the initiation; (c) Development after 20 seconds from the initiation.
Applsci 14 04902 g009
Figure 10. Application of car fire blanket during large-scale ICEV fire test. (a) Beginning of 10 min interval of application at 01:41; (b) ICEV fully covered at 02:02; (c) 30 s after application to ICEV fire at 02:32; (d) 60 s after application to ICEV fire at 03:02; (e) 300 s after application to ICEV fire at 07:02; (f) car fire blanket removal at 12:14.
Applsci 14 04902 g010
Figure 11. The temperature–time curve of the entire large-scale ICEV fire test.
Applsci 14 04902 g011
Figure 12. The temperature–time curve of the 10 min interval of the car fire blanket application to the ICEV fire.
Applsci 14 04902 g012
Figure 13. FLIR E96 14° footage of large-scale ICEV fire test. (a) Time point right before car fire blanket application to ICEV fire; (b) time point 1 min after application; (c) time point 2 min after application; (d) time point 3 min after application; (e) time point 4 min after application; (f) time point 5 min after application; (g) time point 6 min after application; (h) time point 7 min after application; (i) time point 8 min after application; (j) time point 9 min after application; (k) time point 10 min after application; (l) time point right after removal of car fire blanket; * temperature is lower than the temperature range of the set mode (300 to +1500 °C).
Applsci 14 04902 g013aApplsci 14 04902 g013b
Figure 14. Initiation of HTB. (a) HTB after first wedge drive in at 00:02:50; (b) HTB after first wedge drive in at 00:10:58; (c) HTB after second wedge drive in at 00:23:32; (d) HTB after second wedge drive in at 00:24:58; (e) HTB after second wedge drive in at 00:28:10; (f) HTB after second wedge drive in at 00:35:00.
Applsci 14 04902 g014
Figure 15. Application of car fire blanket during large-scale HTB fire test. (a) Beginning of 10 min interval of application to HTB fire at 00:41:20; (b) HTB fully covered at 00:41:45; (c) 30 s after application to HTB fire at 00:42:15; (d) 60 s after application to HTB fire at 00:42:45; (e) 300 s application to HTB fire at 00:46:45; (f) car fire blanket removal at 00:51:59.
Applsci 14 04902 g015
Figure 16. The temperature–time curve of the entire large-scale HTB fire test.
Applsci 14 04902 g016
Figure 17. The temperature–time curve of the 10 min interval of the car fire blanket application to the HTB fire.
Applsci 14 04902 g017
Figure 18. FLIR E96 14° footage of large-scale HTB fire test. (a) Time point right before car fire blanket application to HTB fire; (b) time point 1 min after application; (c) time point 2 min after application; (d) time point 3 min after application; (e) time point 4 min after application; (f) time point 5 min after application; (g) time point 6 min after application; (h) time point 7 min after application; (i) time point 8 min after application; (j) time point 9 min after application; (k) time point 10 min after application; (l) time point right after removal of car fire blanket.
Applsci 14 04902 g018
Figure 19. Comparation of temperature–time curves of ICEV fire test (T0—Driver) and HTB fire test (T0—Left side).
Applsci 14 04902 g019
Figure 20. Comparation of temperature–time curves of ICEV fire test (T1—Interior) and HTB fire test (T2—Inside).
Applsci 14 04902 g020
Figure 21. Comparation of temperature–time curves of HTB fire test (T1—Surface) and ICEV fire test (T2—Roof).
Applsci 14 04902 g021
Figure 22. Comparation of temperature–time curves of ICEV fire test (T3—Passenger) and HTB fire test (T3—Right side).
Applsci 14 04902 g022
Figure 23. Temperature–time curve of thermocouple T2—Inside from large-scale HTB fire test with highlighted 10 min application interval of car fire blanket (red rectangle).
Applsci 14 04902 g023
Figure 24. Comparation of temperatures of [7] and large-scale ICEV fire test.
Applsci 14 04902 g024
Table 1. Car fire blanket parameters.
ToolDimension (m)Weight (kg)Long-Term TR 1 (°C)Short-Term TR 1 (°C)Repeated UsePrice (EUR)
Car Fire Blanket6 × 9271000130030 times1140
1 TR—temperature resistance.
Table 2. A summary of the experiments.
ExperimentLarge-Scale ICEV Fire TestLarge-Scale HTB Fire Test
ParameterInitiationApplication of FBRemoving of FBInitiationApplication of FBRemoving of FB
Air temperature (°C)28.73536.537.63838.4
Wind speed (m/s)1111.51.51.5
Wind directionNNENNENNENNENNENNE
Humidity (%)28221910107
Precipitation (mm)000000
Pressure (hPa)992992992991991991
Initiation of experimentsAccelerator—gasoline (2 dcL)
Initiator—flame (torch)
Mechanical integrity damage—iron spike and hammer
Samples of the experimentInternal combustion engine vehicle (ICEV)
(Figure 4)
High-voltage traction battery (HTB)
(Figure 5)
Car fire blanket
Monitored parameters Temperature (°C) throughout the course of the experiments
Temperature (°C) during the application of the car fire blanket to the ICEV and HTB fire
Time (hh:mm:ss)/(mm:ss)
Monitoring equipment and toolsThermocouples NiCr-Ni 4 pcs
Datalogger ALMEMO 2690-8 (Figure 6a)
Video camera 2 pcs
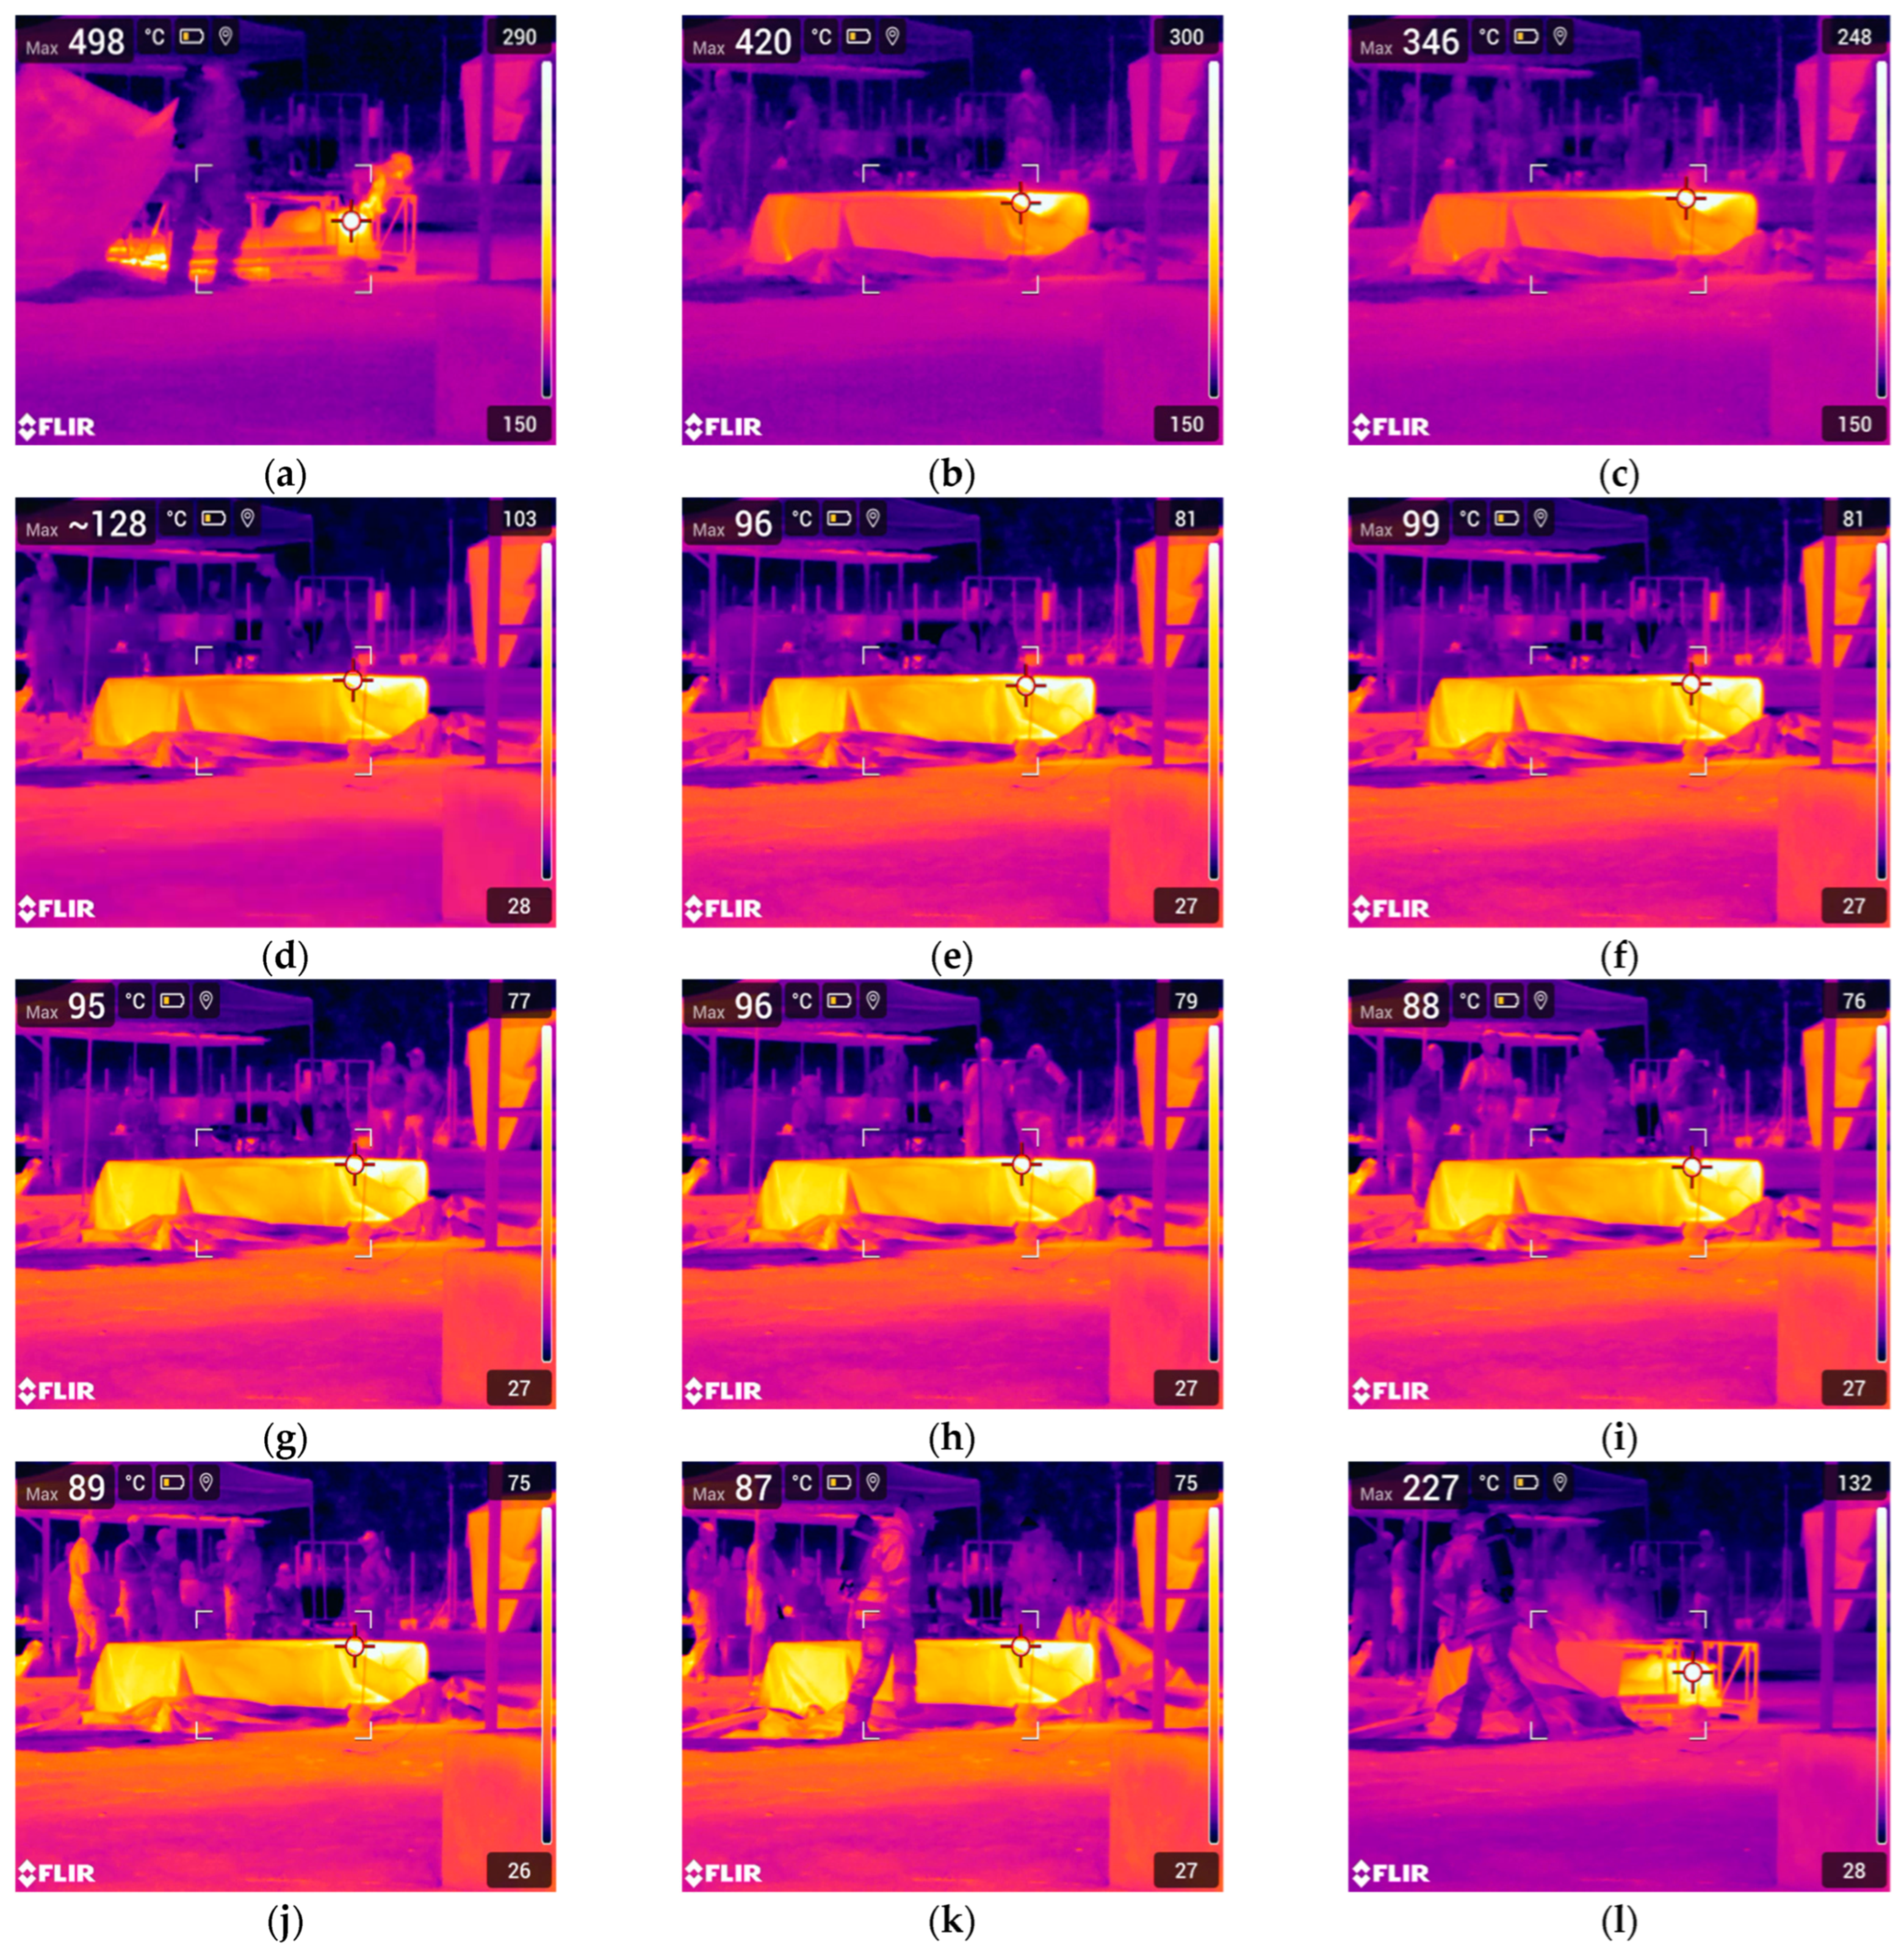
Thermal imaging camera of an unknown brand 1 pcs
Thermal imaging camera FLIR E96 14° 1 pcs
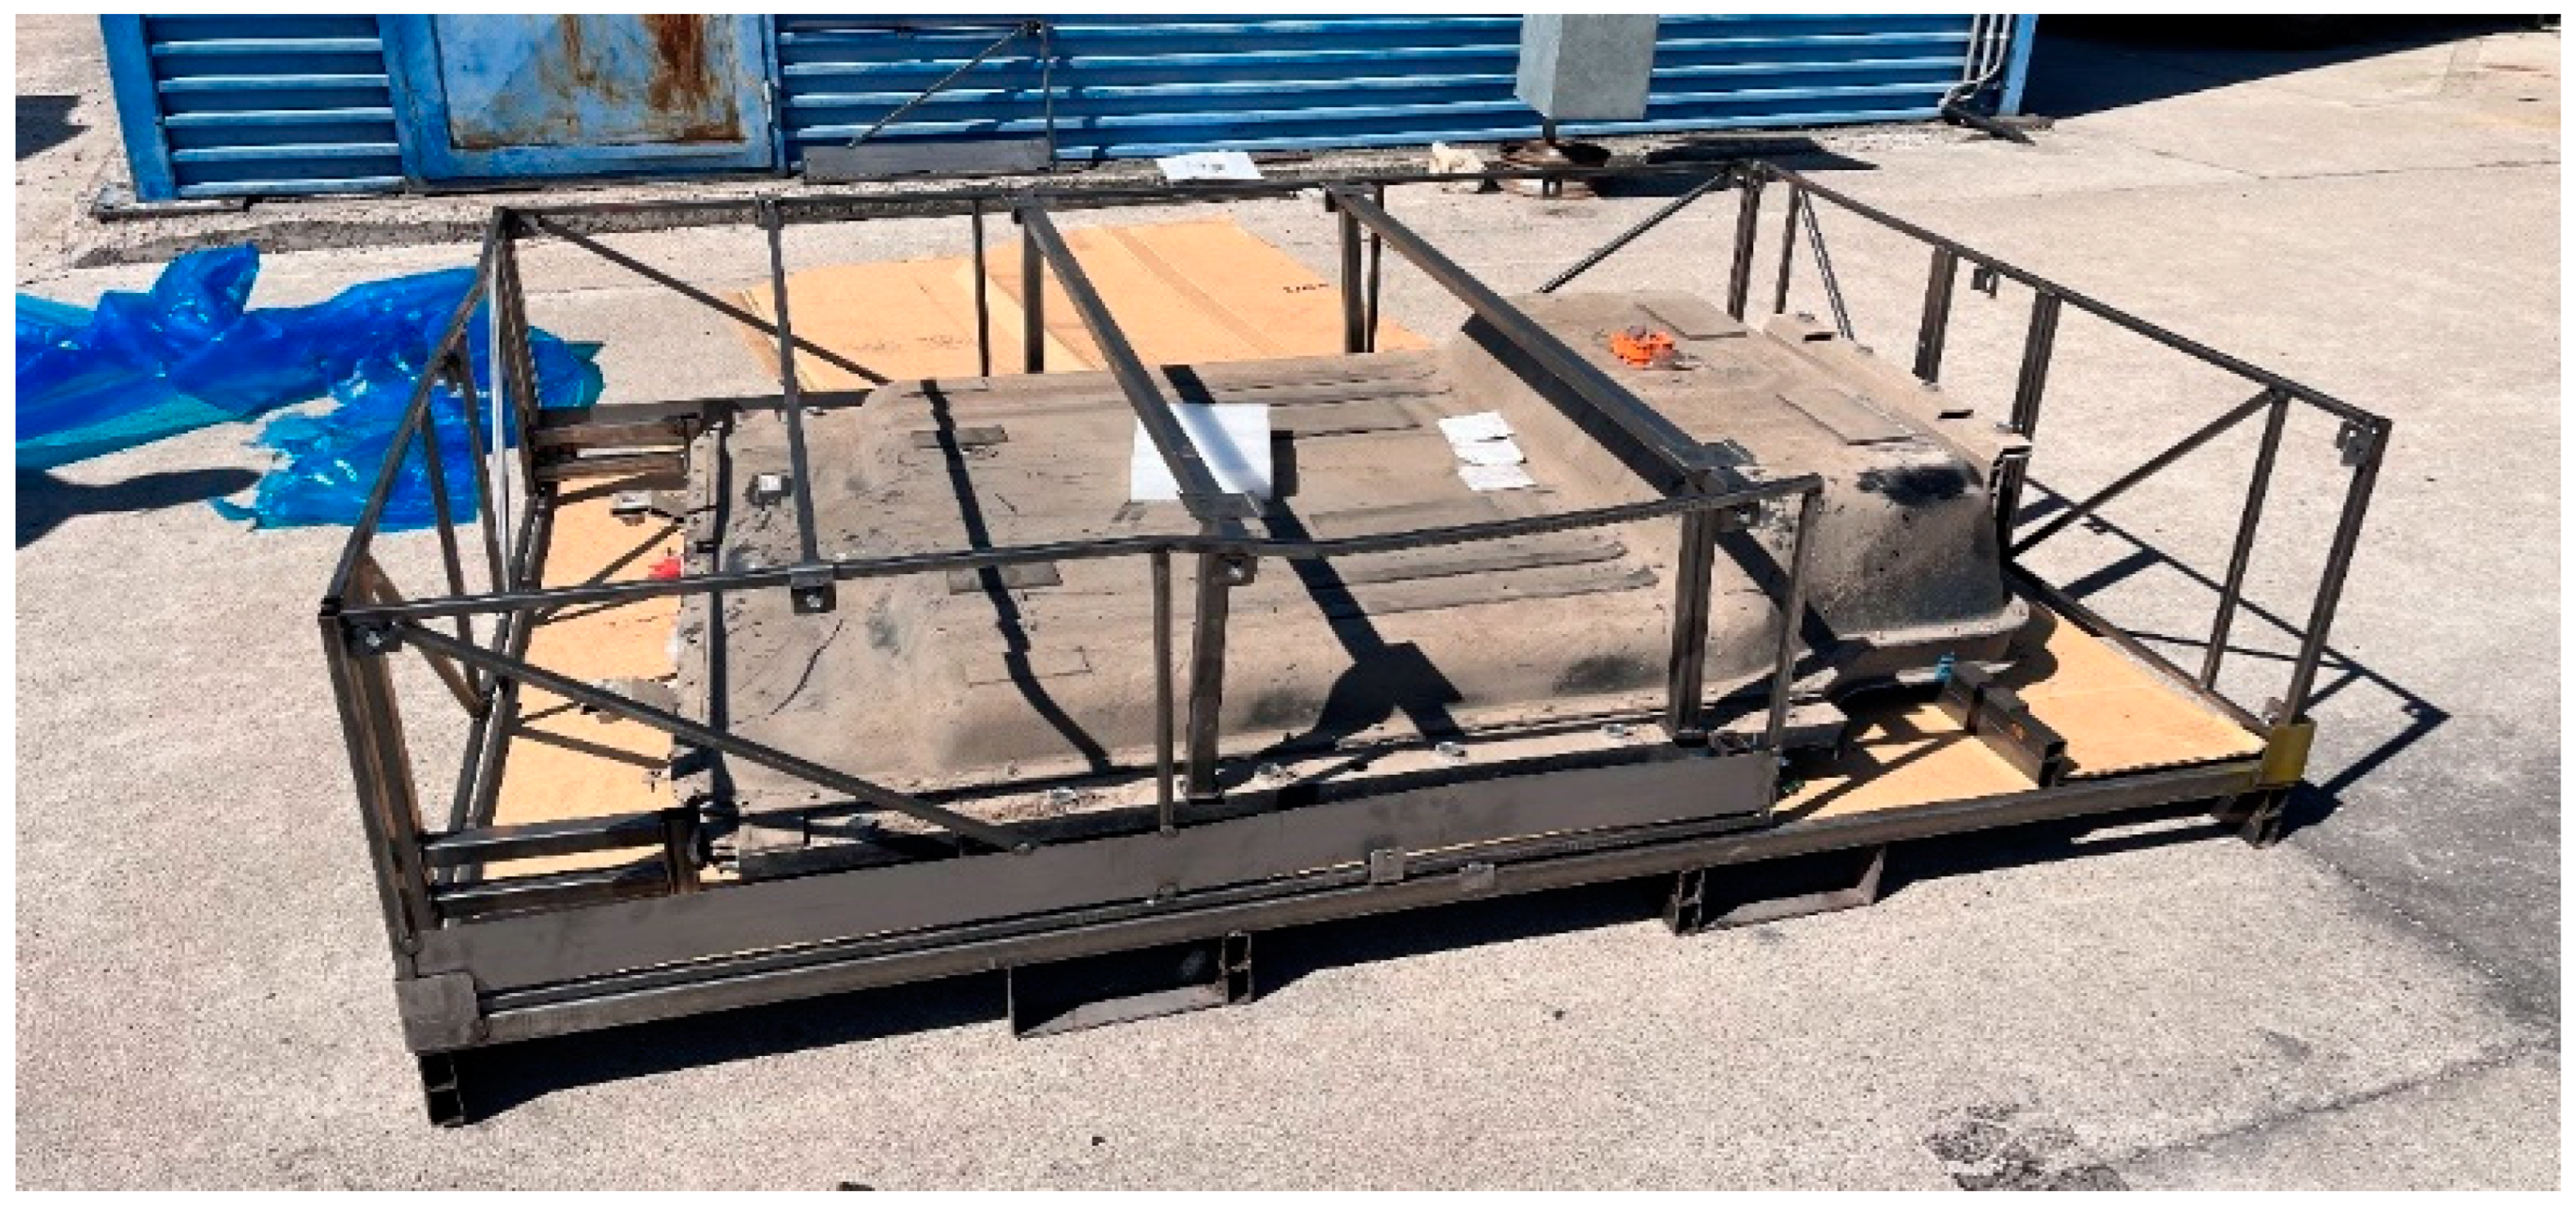
Table 3. Characteristics of HTB used in large-scale fire test.
ParameterBattery Pack
Number of modules in pack7
Cell typePouch cells 3.6 V; 63 Ah; weight 0.882 kg
Cells per Module42
Number of cells294
Configuration98s 3p
Anode materialCarbon Graphite
Cathode materialNMC 622
SeparatorCeramic coated
Electrolyte Organic carbonates
Usable energy64 kWh (Total = 67.5 kWh)
Nominal voltage356 V (3.6 V per cell)
Nominal Capacity189.6 Ah
SOCUsable 94.8%
Pack Mass425 kg
Cell Mass259 kg
Pack Cells 193 kg
Table 4. Th timeline of the experiments.
Experiment ProgressICEVHTB
Time (mm:ss)Time (hh:mm:ss)
Beginning00:0000:00
Initiation00:0100:23:32
FB Applied01:4100:41:20
FB Removed11:5400:51:31
Extinguishing13:03-
Termination18:4101:11:44
Table 5. Average temperature from results recorded by thermocouples and FLIR E96 14° at 10 min interval of car fire blanket application.
NameICEVHTB
T0—Driver (ICEV) T0—Left side (HTB)21 °C41 °C
T1—Interior (ICEV) T2—Inside (HTB)225 °C114 °C
T2—Roof (ICEV) T1—Surface (HTB)164 °C125 °C
T3—Passenger (ICEV) T3—Right side (HTB)31 °C33 °C
Average temperature under the car fire blanket (T1 and T2)195 °C120 °C
Average temperature from FLIR E96 14° (Hot spot)183 °C154 °C
Disclaimer/Publisher’s Note: The statements, opinions and data contained in all publications are solely those of the individual author(s) and contributor(s) and not of MDPI and/or the editor(s). MDPI and/or the editor(s) disclaim responsibility for any injury to people or property resulting from any ideas, methods, instructions or products referred to in the content.

