Abstract
Trees in proximity to power lines can cause significant damage to utility infrastructure during storms, leading to substantial economic and societal costs. This study investigated the effectiveness of non-parametric machine learning algorithms in modeling tree-related outage risks to distribution power lines at a finer spatial scale. We used a vegetation risk model (VRM) comprising 15 predictor variables derived from roadside tree data, landscape information, vegetation management records, and utility infrastructure data. We evaluated the VRM’s performance using decision tree (DT), random forest (RF), k-Nearest Neighbor (k-NN), extreme gradient boosting (XGBoost), and support vector machine (SVM) techniques. The RF algorithm demonstrated the highest performance with an accuracy of 0.753, an AUC-ROC of 0.746, precision of 0.671, and an F1-score of 0.693. The SVM achieved the highest recall value of 0.727. Based on the overall performance, the RF emerged as the best machine learning algorithm, whereas the DT was the least suitable. The DT reported the lowest run times for both hyperparameter optimization (3.93 s) and model evaluation (0.41 s). XGBoost and the SVM exhibited the highest run times for hyperparameter tuning (9438.54 s) and model evaluation (112 s), respectively. The findings of this study are valuable for enhancing the resilience and reliability of the electric grid.
1. Introduction
Severe weather, such as high winds, hurricanes, thunderstorms, and tornadoes, frequently induces tree failures in proximity to power lines, resulting in power outages and damage to utility infrastructure. These weather-related power outages cost the United States of America (USA) $25–75 billion annually [1]. This cost will continue to increase with the increasing frequency and intensity of storm activities due to climate change. During severe weather, tree failures are responsible for most power outages [2]. Tree failures not only cause catastrophic damage to power lines but also pose risks to public safety and infrastructure. The costs of restoring power lines and the anticipated increase in storm activity due to climate change have driven utilities to enhance grid resilience by identifying vegetation risks and reinforcing infrastructure.
Accurate modeling of tree-related power outage risks along distribution power lines is essential for effectively implementing grid resiliency programs ahead of storm events. Numerous scientific investigations have focused on predicting power outages due to vegetation and identifying the underlying factors contributing to these outages in power distribution systems. For instance, Guikema et al. [3] introduced a statistical framework to predict tree-related outages under normal operational conditions. Their investigation specifically focused on the impact of tree-trimming practices on the incidence of vegetation-related outages, utilizing a dataset comprising historical outages, geographical data, and tree-trimming records. In a separate study, Radmer et al. [4] proposed a methodology to predict the rate of tree-related outages due to annual vegetation growth, measured as the number of outages per mile-year. Key inputs to their models included historical outage data and climatic variables known to influence vegetation growth. Wanik et al. [5] conducted a study to assess the effects of various factors on predicting vegetation-related outages during hurricane events. By leveraging LiDAR tree height data alongside information on vegetation management practices and system infrastructure, they developed an ensemble machine learning algorithm to predict the likelihood of vegetation-related outages during hurricane events. Doostan et al. [6] proposed a data-driven methodology to predict the number of vegetation-related outages in power distribution systems using time series and nonlinear machine learning regression models.
Over the past two decades, much research has explored the applicability of various parametric and non-parametric models to power outage modeling problems. Initially, several parametric statistical models, such as the negative binomial regression model and Generalized Linear Models (GLMs), were used to predict the number of hurricane-related [4,7] and ice-storm-related outages [7]. Guikema et al. [8] compared multiple models (parametric, GLMs, and semi/non-parametric models, Generalized Additive Models (GAMs), Bayesian Additive Regression Trees (BART), and classification and regression trees (CART)) to predict post-hurricane damage to the electrical overhead distribution network (i.e., utility poles). They observed higher accuracy rates with semi- and non-parametric models than parametric ones. Nateghi et al. [9] modeled the outage duration using both parametric (regression methods) and non-parametric models (BART, multivariate adaptive regression splines (MARS), and CART) and demonstrated the applicability of the BART model with its predictive accuracy and lower prediction error compared to other methods.
Recently, many studies have adopted machine learning algorithms for power outage-related research and demonstrated the benefits of using machine learning (ML) models to predict power outages [5,10,11,12]. ML models have become more popular due to numerous advantages, including flexibility, adaptability, and the ability to analyze diverse data types [13]. Additionally, they are particularly effective in handling large volumes of data at high speeds, can continuously improve with more data, and can make predictions without explicit programming, making them highly efficient [14]. Furthermore, they can solve complex real-world problems and provide automatic problem-solving approaches. Non-parametric machine learning algorithms have lately attracted significant attention in utility infrastructure risk modeling. Konstantakopoulos et al. [15] used non-parametric methods such as bootstrapping, bagging, and gradient boosting to improve the prediction performance in utility learning frameworks. Imam et al. [16] reviewed the application of parametric and non-parametric machine learning techniques to power system reliability, highlighting the predictive capabilities of non-parametric algorithms in maintenance-related aspects. Ajayi et al. [17] further emphasized the importance of non-parametric methods in predicting health and safety hazards in power infrastructure operations, achieving near-perfect predictions.
When examining the literature, it becomes apparent that most studies on vegetation-related power outage modeling have been conducted at coarser resolutions, with limited research available that delves into the probability of tree-related outage risks on distribution power lines at a finer spatial granularity. Furthermore, the majority of these assessments have depended on the random forest (RF) algorithm [18,19]. To the best of our knowledge, no previous studies have been undertaken to predict tree-related outage risks at a finer spatial granularity using a wide range of non-parametric machine learning algorithms. Utilizing non-parametric machine learning modeling is crucial in this context, as it allows for the exploration of complex, nonlinear relationships within the data, which are often inherent in vegetation-related outage risk factors, thus enabling more accurate predictions at a finer spatial scale. Accurate identification and localization of vegetation-risk-prone areas are essential for improving grid reliability by aiding utility professionals in making informed decisions to implement appropriate tree-trimming and grid-hardening practices.
Therefore, the central objective of our study is to systematically evaluate the effectiveness of decision tree (DT), support vector machine (SVM), extreme gradient boosting (XGBoost), random forest (RF), and k-Nearest Neighbor (k-NN) algorithms in identifying the risk of tree-related power outages to distribution power lines at a finer spatial resolution. This work is an extension of our previous study [19], in which we developed a vegetation risk model to assess the impact of local environmental variables on the outage probability along distribution power lines using the RF algorithm.
2. Materials and Methods
2.1. Study Area
Our study area is Eversource Energy’s service territory in the state of Connecticut (CT). Eversource Energy (EE) maintains more than 28,000 km of overhead distribution lines across CT and contains nearly 49,000 device exposure zones (DEZs—the outage locations correspond to isolating devices, each of which protects a section of the power line called a device exposure zone). The average length of a DEZ is approximately 500 m. EE distributes electricity across 149 towns in CT, serving nearly 1.2 million customers. CT’s land cover varies from urban areas in central and southwestern CT to the forested areas of eastern and western CT and its southern coastal landscape (Figure 1).
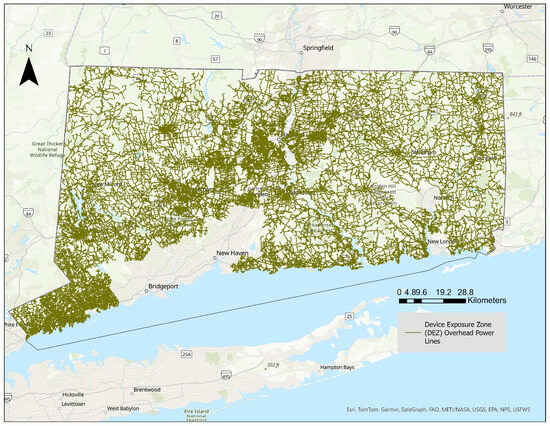
Figure 1.
Distribution grid of Eversource Energy in Connecticut.
2.2. Vegetation Risk Modeling Framework
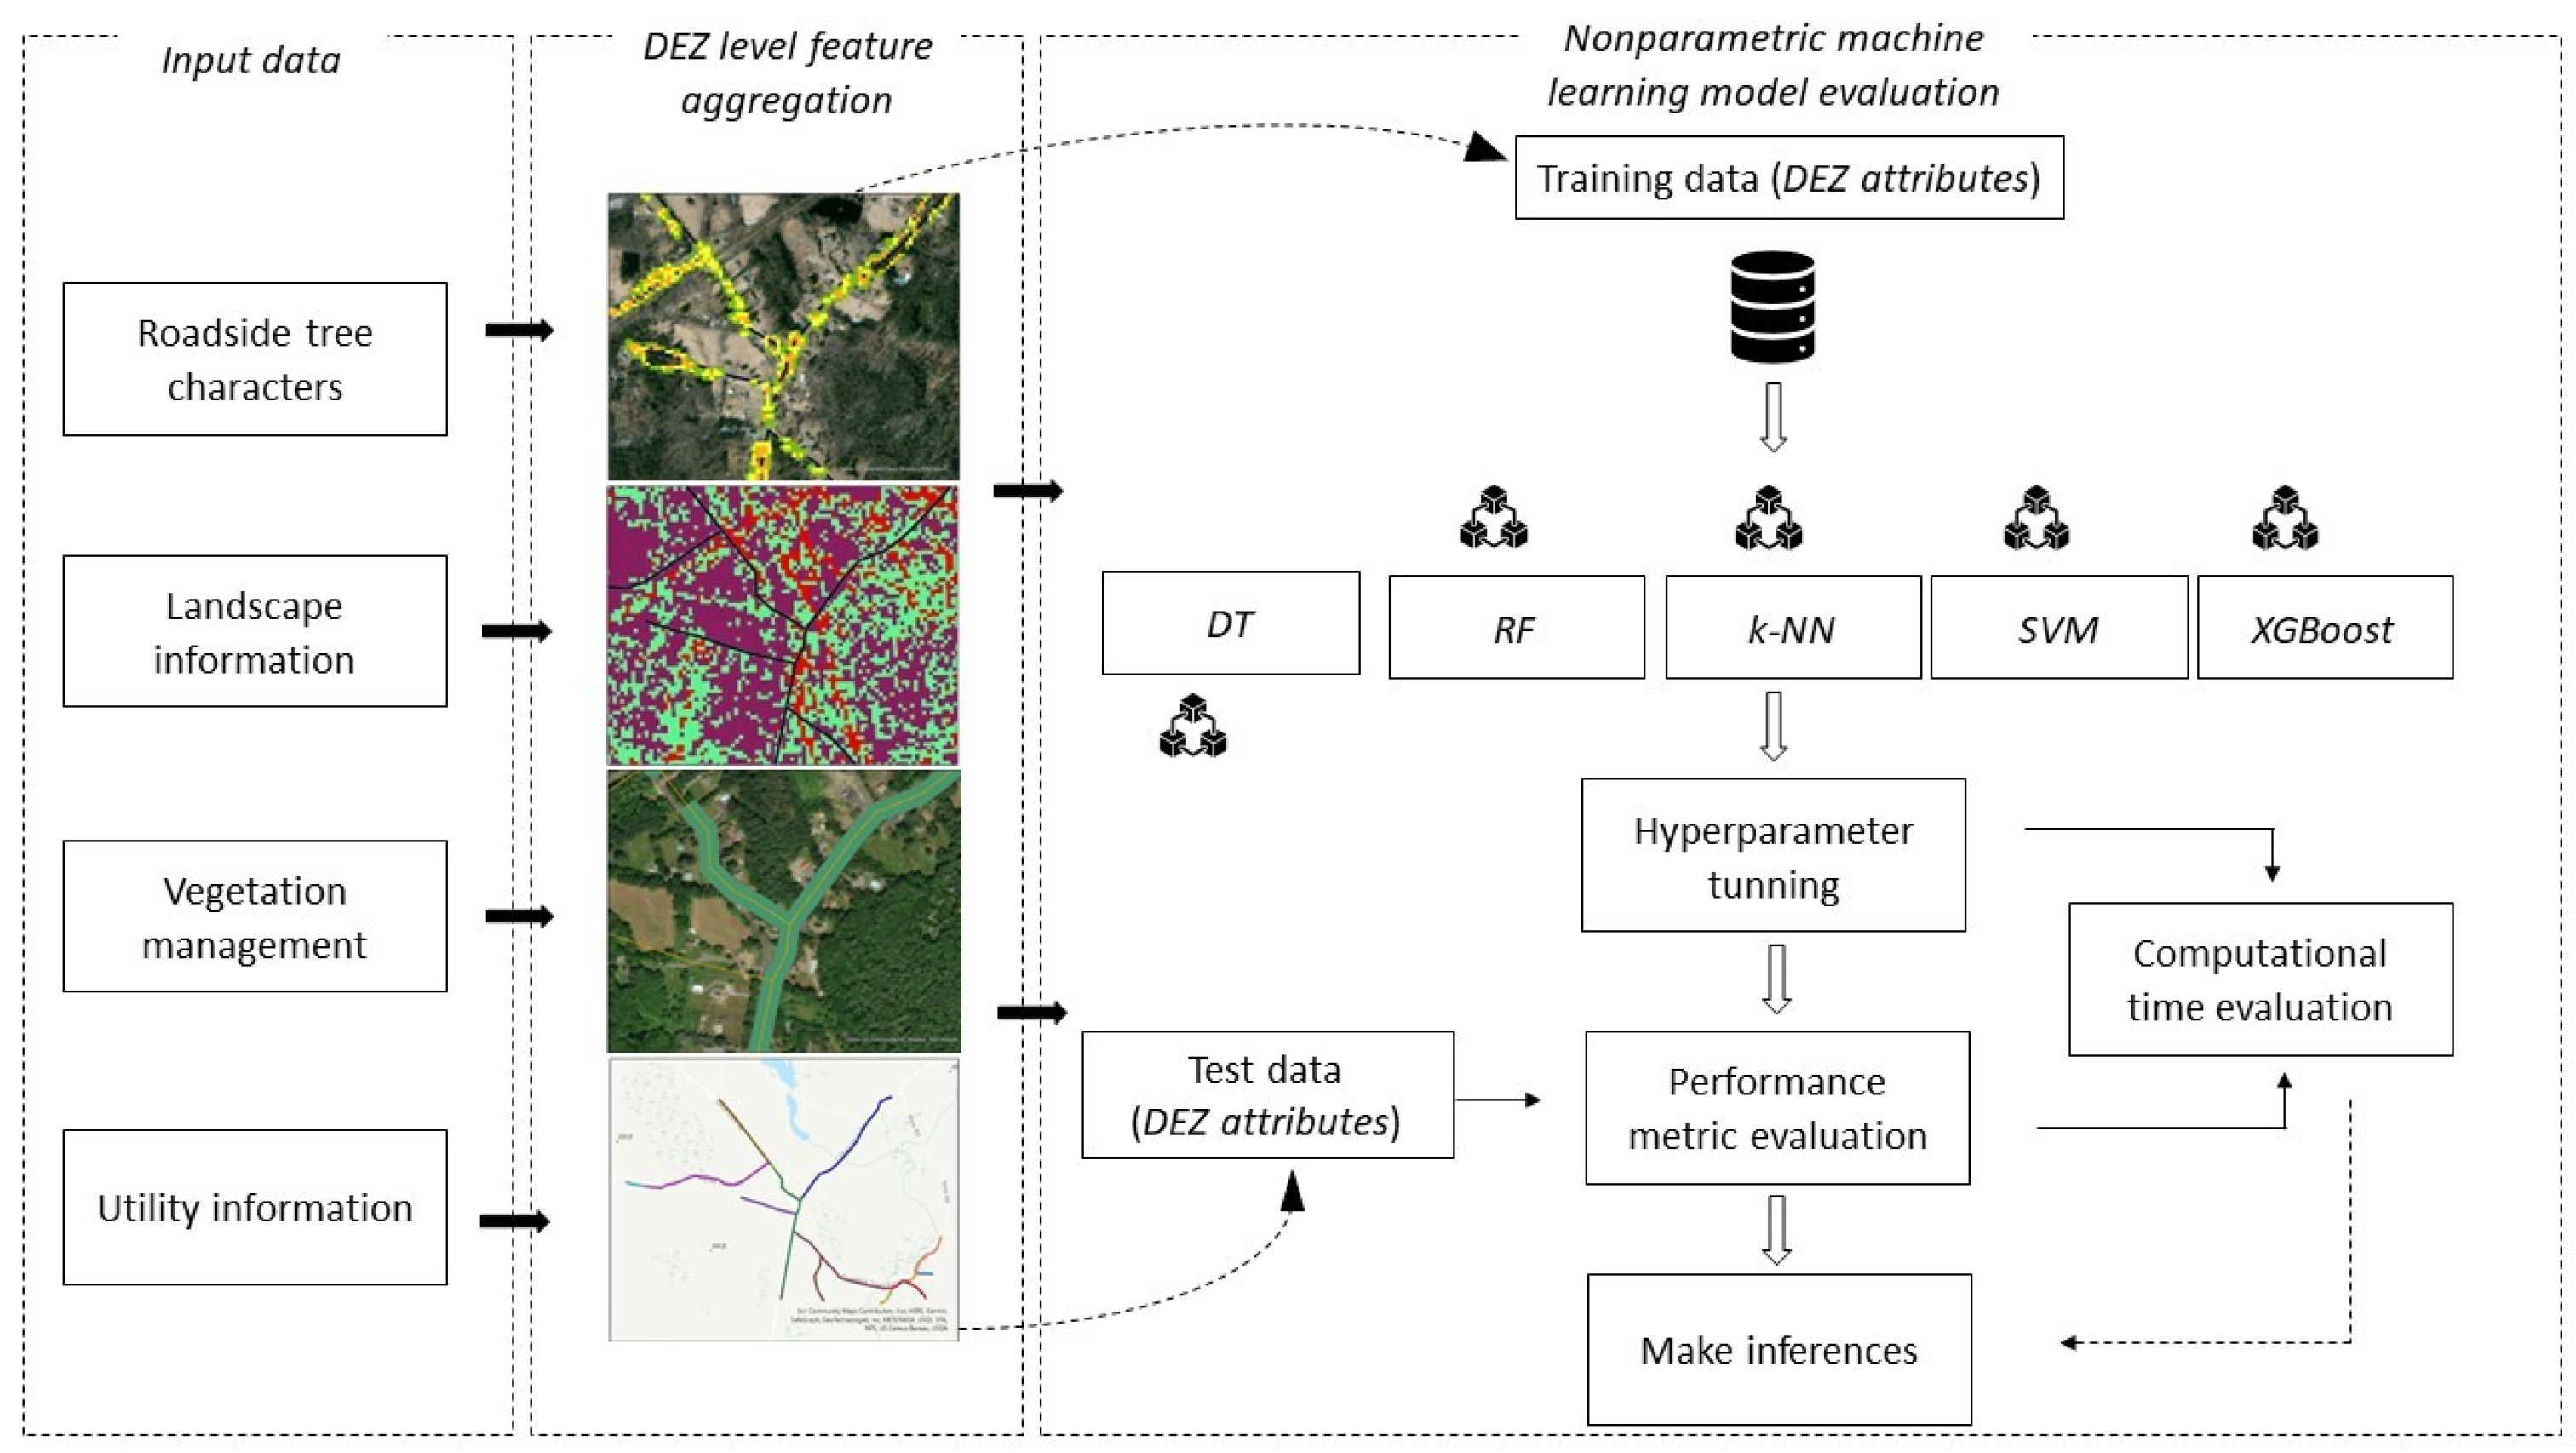
The proposed VRM [19] is a tree-related outage probability assessment tool that comprises roadside tree characteristics, vegetation management information, utility infrastructure, and power outage data across the EE service territory in CT (Table 1). The predictor variables for the VRM were selected by considering the existing literature on various machine learning distribution network outage prediction models [5,11,18,19]. All of the input variables were extracted, aggregated, and averaged at the DEZ level. The following subsections explain each component of the ML model comparison process (Figure 2).

Table 1.
List of predictor and response variables used for five machine learning models (CT DEEP: Connecticut Department of Energy and Environmental Protection, NLCD: National Land Cover Database, pPix: proximity pixels, TPI: Topographic Positioning Index, ETT: Enhanced Tree-Trimming, nn: Nearest Neighbors, DEZ: device exposure zone).
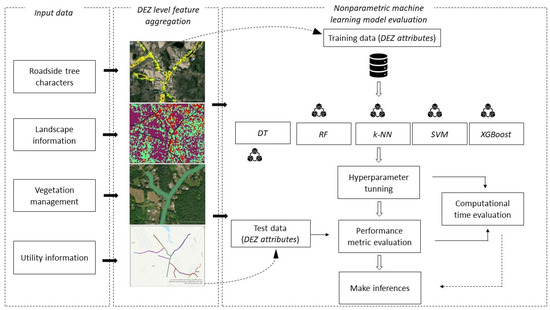
Figure 2.
Non-parametric machine learning model comparison workflow. (DEZ: device exposure zone, VRM: vegetation risk model, DT: decision tree, RF: random forest, k-NN: k-Nearest Neighbor, SVM: support vector machine, XGBoost: extreme gradient boosting).
2.3. Roadside Tree Properties
The tree heights along the overhead powerlines were obtained using state-wide publicly available LiDAR data, acquired in 2016 during leaf-off conditions. The LiDAR dataset has a point density of 2.2 pts/m2. We used the “proximity tree pixel” (pPix) approach introduced by [18] to derive the vegetation heights near the power lines. pPix are 1 m pixels in the canopy height model (CHM), which represent trees that can strike a power line in the event of a tree falling. Data from the National Land Cover Database (NLCD) 2016 were used to calculate the percent canopy cover within 30 m of the DEZs.
2.4. Utility Infrastructure and Vegetation Management Data
We utilized geospatial utility infrastructure data provided by Eversource Energy (Table 1). The DEZ power lines are represented as a polyline shapefile. This shapefile contains attributes such as the DEZ overhead length, underground power line length, and whether the overheads are covered with insulating materials or not. Also, we used Enhanced Tree-Trimming (ETT) vegetation management information. The tree-trimming specifications for ETT remove all trees and branches above and below that are 2.4 m to the side of the power lines (Eversource, 2019).
2.5. Landscape Information
A variety of landscape variables were derived using LiDAR and NLCD data, including the percentage of steep slopes (>50%), and average ground azimuth (Table 1). We employed USDA Natural Resources Conservation Service (NRCS) soil data to obtain soil information, such as the percentage of wetland and rocky and shallow soils.
2.6. Binary Response Variable: Outage Presence–Absence Data
Our modeling work is intended to predict the probability of any outage occurrence. Therefore, we used a binary response variable where a value of 1 represents a reported outage during the 2005 to 2017 period and a value of 0 indicates no reported outage. Eversource Energy’s outage management system (OMS), which was used to obtain the outage locations, includes both customer outages and system outages. In this case, we only used system outages or “trouble spots”, which are locations on the power grid where a restoration crew was needed to restore power. Hereafter, we will use the term outages to refer to these trouble spots. In this study, we only considered outages for primary overhead lines that were reported to be caused by tree or limb failures.
2.7. Machine Learning Models
Five non-parametric machine learning models were evaluated to determine which algorithm yields the best outage probability on the distribution power lines. The dataset used for all these machine learning models consisted of roadside tree characteristics, utility infrastructure, vegetation management data, and landscape information (Table 1).
2.7.1. Decision Tree (DT)
The decision tree algorithm offers several advantages in modeling. It is easily interpretable, making it a valuable tool for human experts [20]. The algorithm’s flexibility and understandability further enhance its appeal [21]. This algorithm consists of a series of logical “if-then” statements (decision nodes) that recursively split the training data into subsets of similar values in a top-down manner based on the discriminative power of each attribute, leading to the ultimate target values [22]. Recursive partitioning is either an automated process that uses a stopping criterion or an interactive process that requires an analyst to decide the splitting at nodes. Pruning is a procedure that removes extraneous trees and improves the robustness of a decision tree model [23].
2.7.2. k-Nearest Neighbors (k-NN)
The k-NN method is a simple non-parametric technique that offers several advantages in modeling. k-NN is effective for large training data and robust to noisy data [24]. The k-NN algorithm compares each test sample against the nearest k samples from the training data. Each test sample is classified into the most common class among the k-training samples closest to it in the feature space [25]. Higher k will produce results with greater generalization, while lower k will result in a very complex decision boundary [26].
2.7.3. Support Vector Machine (SVM)
The SVM algorithm is a non-parametric classifier. In dynamic modeling, an SVM offers a simple structure, fast convergence speed, and high generalization ability, making it a favorable choice over neural networks [27]. The SVM creates an optimal boundary to separate the classes in the feature space and maximize the separation between classes [28]. The surface of the boundary is called the hyperplane. All the data points nearest to the hyperplane are called support vectors. In the SVM algorithm, classes are separated using a geometric criterion to find the optimum separation [29]. SVMs were initially introduced to separate linear class boundaries. This limitation was overcome through the projection of the feature space to a higher dimension using the kernel trick [30].
2.7.4. Extreme Gradient Boosting (XGBoost)
XGBoost is an ensemble machine learning algorithm that improves the accuracy of classification by iteratively adding weak classifiers to the ensemble. The XGBoost algorithm offers several advantages in modeling. It has been extended to handle non-convex loss functions, making it suitable for a wider range of applications [31]. In the case of imbalanced data, a classification algorithm based on mixed sampling and ensemble learning has been proposed to optimize the regularization term of XGBoost, improving its classification effect [32]. XGBoost uses parallel computation to build trees using all the CPUs during model training. This algorithm does not use traditional stopping criteria; instead, it uses the “max-depth” parameter and prunes the trees starting from the end. These features offer greater improvements in performance and speed compared to other gradient-boosting methods. For more information about the XGBoost algorithm, see [33].
2.7.5. Random Forest (RF)
The random forest algorithm has been widely applied in power outage risk modeling due to its ability to handle nonstationarity, heteroscedasticity, trends, and multiple seasonal cycles [34]. A RF is an extension of the decision tree model, which is designed to produce more reliable predictions by utilizing the training data more comprehensively. This method, as described by [35], is known for its ability to produce more robust results. The RF utilizes a large number of DTs to overcome the limitations of the DT method [35]. The final class for each unknown is assigned by the majority “vote” of all the trees created.
2.8. Machine Learning Dataset
The aforementioned roadside tree characteristics, utility infrastructure, vegetation management, and landscape information (aggregated and averaged within each DEZ) were used to create the master dataset for machine learning. Each data point, or a single row of the dataset, represents one of the 49,482 DEZs from 2005 to 2017 and is linked to 15 explanatory variables and a response variable. The response variable was kept as a binary response variable for this study. The value of 1 represents that particular DEZ having reported an outage during the considered period, whereas 0 was assigned if the DEZ had no outages reported. Out of the 49,482 DEZs in the study area, 27,410 had no outages, 10,354 had 1 outage, 4816 had 2 outages, 2638 had 3 outages, and 4263 had more than 3 outages over 12 years. Most machine learning algorithms are unable to perform well with highly imbalanced data and require additional algorithms to solve these problems [36]. To address this issue while following the literature [37], in which similar circumstances are faced, we converted the target variable into a binary response variable (“0 = 27,411”, “1 = 22,071”) and predicted the probability that a given observation/outage occurrence belonged to one of the two classes, which are any outage presence or absence.
2.9. Experimental Setup
The dataset discussed previously (Table 1) was used to analyze and compare the performance using five non-parametric ML models. In the first step, we performed data engineering to ensure the quality and integrity of our dataset. Initially, we checked for outliers and missing values to identify and rectify any irregularities or gaps in the data. Furthermore, to facilitate the integration of categorical variables into our machine learning models, we used the one-hot encoding technique [38]. This method transforms categorical variables into binary vectors, with each category represented as a binary feature, thereby enabling numerical representation in our predictive models. In the subsequent phase, we randomly split the dataset into 80% training and 20% test data, following the widely used 80/20 rule. This rule is common practice in prediction modeling, as it provides an equidistributed split between the training and testing sets, ensuring robust model building regardless of the dataset’s domain, size, or class distribution [39].
In the next step, hyperparameter optimization is performed considering the hyperparameters for each ML algorithm described by [40]. In machine learning, hyperparameters are parameters that are set before the learning process begins and control the behavior of the training algorithm. These include settings such as the learning rate, the number of trees in a random forest, and the regularization parameter in support vector machines [41]. The search space refers to the range of possible values that these hyperparameters can take. During model training, various techniques such as grid search or random search are used to explore this search space to identify the optimal hyperparameter settings that result in the best model performance [42,43,44]. Table 2 lists the main hyperparameters and their respective search spaces for each of the five different machine learning algorithms used in our study. The random search (RS) hyperparameter optimization technique, which is “RandomizedSearch CV” in the SKlearn library, was deployed [45] to optimize the ML algorithms. This method employs k-fold cross-validation during the search process to evaluate different hyperparameter configurations. Therefore, we used 5-fold cross-validation while optimizing the parameters to ensure robustness and reliability in the hyperparameter tuning process. The trained ML algorithms were evaluated with test data to assess the performance of each ML algorithm. This step was repeated 30 times, and the mean values of performance metrics were reported.
Table 2.
Hyperparameters and their search spaces are used for five different machine learning algorithms.
2.10. Performance Metrics and Model Evaluation
Various performance metrics were used for model comparison, including the Area Under the Receiver Operating Characteristic Curve (AUC-ROC), model accuracy, precision, recall, and F1-score. The AUC-ROC is a metric that separates true positives from true negatives. An AUC-ROC of 1 indicates that a model can perfectly separate positive classes from negative classes, whereas 0 indicates the model will predict all positives as negatives and vice versa. This metric is constructed by plotting the true positive rate against the false positive rate at various thresholds. Accuracy (Equation (1)) is a metric that shows the proportion of observations that are identified correctly. An accuracy of 1 indicates perfect prediction, where all positive and negative classes are predicted 100% accurately. Precision (Equation (2)) refers to the proportion of positives which are predicted correctly, whereas recall (Equation (3)) estimates the portion of actual positives that were identified correctly. The F1-score (Equation (4)) is estimated by combining precision and recall in order to quantify the tradeoff between precision and recall. After obtaining the mean values of these performance metrics, a 95% confidence interval (CI) (Equation (5)) at α = 0.05 was calculated to provide a measure of the reliability and precision of the estimated parameters. Next, we ranked each model from 1 to 5, with 1 being the best-performing model and 5 being the least-performing model, based on the reported performance metric values and the calculated confidence intervals. Additionally, the time needed to finish the hyperparameter optimization (HO) and performance metrics evaluation (ME) was used as the model efficiency metric. All the HO and ME analyses were performed in the high-performance computing (HPC) environment at the University of Connecticut (AMD EPYC 7713, cores = 126, nodes = 1).
3. Results
3.1. Model Performance Evaluation
The types of hyperparameters and their parameter spaces identified during hyperparameter optimization are illustrated in Table 3. Table 4 provides insights into the VRM performance using the AUC-ROC, accuracy, precision, recall, and the F1-score. The performance of the five machine learning models was evaluated using the mean values of the performance metrics with their respective 95% confidence interval (CI) values. As shown in Table 4, the SVM and the RF reported the highest AUC-ROC scores of 0.745 and 0.746, with CIs of ±0.001 and ±0.002, respectively. Both k-NN and XGBoost demonstrated comparable AUC-ROC scores, with k-NN achieving 0.739 and XGBoost achieving 0.740, each with a confidence interval (CI) of ±0.002. In contrast, the decision tree (DT) model exhibited the lowest AUC-ROC value among the machine learning models, scoring 0.731 with a CI of ±0.002. The highest model accuracy of 0.753 was demonstrated by the RF, with a CI of ±0.002, followed by the SVM at 0.749, XGBoost at 0.746, and k-NN at 0.743. In contrast, the lowest accuracy of 0.736 was reported by the DT with a CI of 0.003. The precision metric revealed that the RF and XGBoost reported the highest precision scores of 0.671 and 0.661, respectively. k-NN and the SVM showed similar recall scores of 0.726 and 0.727. The RF exhibited the third highest recall value of 0.718, followed by XGBoost at 0.711 and the DT at 0.707. The highest F1-score was achieved by the RF, reaching 0.693 (SE). The lowest F1-scores were shown by k-NN at 0.668 and the DT at 0.664.
Table 3.
Identified hyperparameters and their search spaces used for five different machine learning algorithms.
Table 4.
Model performance metric evaluation (mean values of each metric with 95% confidence intervals for various machine learning algorithms).
The developed ranking scheme reported that the RF was the best model, followed by the SVM, XGBoost, and k-NN. The DT was reported as the least suited model (Table 5). The means of the performance metrics and the confidence interval (CI) values of each machine learning method were used to generate the ranking system. For the AUC-ROC, accuracy, precision, and the F1-score, the RF was found to be the best machine learning algorithm. However, the RF and the SVM ranked first according to the AUC-ROC, while the RF and XGBoost were found to be the top models for the precision metric. The models that performed the best for the recall values were the SVM and k-NN, with the RF coming in third and XGBoost and the DT coming in fourth. Overall, the random forest emerged as the best model.
Table 5.
Selecting the best-performing model using the ranking scheme based on different performance metrics.
3.2. Computational Runtime Evaluation for Hyperparameter Optimization and Model Performance Metrics
We estimated the computational runtime required for hyperparameter optimization and the mean computational runtime required for metric evaluation (Table 6). Based on the computational runtime estimated for hyperparameter optimization, XGBoost reported the highest computational runtime of 9438.54 s, followed by the RF (2825.82 s) and the SVM (224.91 s). The DT required a much lower runtime (3.93 s) compared to all the other methods for hyperparameter optimization. In contrast, the SVM showed the highest mean computational runtime of 112.26 s for metric evaluation. The RF reported mean computational runtimes of 66.79 s, and XGBoost reported 73.27 s. The DT required the least time for metric evaluation (0.41 s).
Table 6.
Computational runtime required for CT for hyperparameter optimization and model performance evaluation (MPE).
4. Discussion
In outage risk modeling, assessing the performance of different machine learning models is crucial to determining the model with the best predictive power. Many recent outage modeling studies have utilized various machine learning techniques to predict the number of outages or estimate the probability of outage risk. These methods include logistic regression, classification and regression trees, decision trees, multivariate adaptive regression splines, artificial neural networks, naïve Bayes regression, random forests, boosting, and an ensemble model of boosting and random forests [5,11,18,46]. Non-parametric machine learning algorithms have recently gained more attention than parametric models in outage modeling problems [8] due to their ability to capture complex data relationships and make fewer assumptions about the data distribution [47].
There is a lack of literature demonstrating how support vector machines, k-Nearest Neighbor (k-NN), and extreme gradient boosting (XGBoost) can provide inferences on estimating the probability of tree failure in addition to decision trees (DTs) and random forests (RFs). Despite differences in the machine learning algorithms used, we can compare our findings with previous studies on the applicability of different machine learning techniques for predicting the probability of tree-related outage risk during storms. The quality of the prediction is crucial, especially when dealing with issues related to electric power lines. Confidence intervals (CIs) have been utilized in many machine learning works to quantify the reliability or uncertainty of machine learning interpretations [48,49].
It is important to discuss how five different ML models performed since the performance of some of the ML models is quite similar for some performance metrics. Also, even a 0.1% improvement is considered significant given the scale of the study, encompassing approximately 49,000 device exposure zones (DEZs), and the substantial impact that certain DEZ locations have on the economic and power security aspects of the electric grid. Based on the model performance evaluation and ranking scheme, the random forest (RF) algorithm emerged as the best ML algorithm according to the metrics of the AUC-ROC, accuracy, precision, and the F1-score in assessing the tree-related outage probability on distribution power lines, implying superior performance compared to the other algorithms. The RF and the SVM showed similar results for the Area Under the Receiver Operating Characteristic Curve (AUC-ROC) metric. This implies that both models have similar potential to measure the percentage of correct predictions and the ability to separate true classes from negative classes. k-NN and the SVM outperformed the RF when assessing the recall (sensitivity). Recall and precision have important implications for the operational value of machine learning in risk assessment. A high recall score shows that the model can detect the majority of DEZs with outages while limiting the number of DEZs falsely predicted as having no outages (false negatives). Such false predictions may fail to identify some sensitive DEZs in the power grid and lead to serious consequences when trees fall onto power lines during severe weather events. In contrast, the RF and XGBoost models reported higher precision values compared to the other models, indicating that the SVM, k-NN, and the DT tend to falsely detect outages in DEZs (false positives) more frequently than the RF and XGBoost. This is important because utilities do not have to invest capital in DEZs that do not pose a risk to power lines. According to the ranking scheme based on the performance metrics and confidence interval values, the random forest (RF) was identified as the best machine learning model for assessing the probability of tree failure. Numerous previous studies have demonstrated the effectiveness of RFs in assessing the likelihood of tree failure [46] and predicting the number of power outages during storm events [50], highlighting their applicability in vegetation risk assessment. The DT was selected as the least performant model based on the AUC-ROC, accuracy values, and ranking scheme. DTs can perform poorly due to a variety of factors, such as the limitations of the pruning algorithms, and the algorithm can be seriously affected by the curse of dimensionality [51,52]. In tree-related outage risk assessment, it is crucial to have a model that can accurately identify risk areas because misclassifications can result in missed opportunities for intervention to improve resilience, which could lead to higher outage risks in future storm conditions.
Recording the computational runtimes of different machine learning (ML) models is important in data science. Computational runtime provides insights into algorithm optimization opportunities and resource planning. XGBoost and the RF consumed a comparatively higher runtime (in seconds) for hyperparameter optimization when compared to the other three models. The most probable reason is a large parameter space: XGBoost and RFs have a large parameter space for hyperparameter tuning. The computational runtime of hyperparameter optimization and model development may vary from several minutes to days depending on the scale of the data, the available computational resources, and the model complexity [53]. Moreover, the number of hyperparameters considered makes it time-consuming to search through all possible combinations of hyperparameters to find the optimal set. Since XGBoost and RFs are computationally intense algorithms, they can make hyperparameter optimization more time-consuming since the training process needs to be repeated multiple times to tune the hyperparameters. Additionally, certain types of hyperparameters and their values have a prompt effect on the execution time, such as the number of trees in RFs and XGBoost and the number of neighbors in k-NN [54]. The decision tree (DT) algorithm is comparatively simple, consisting of only one decision tree [22] and requiring fewer parameters. Therefore, it consumes less time compared to other complex algorithms.
This study offers significant insights into vegetation risk assessment across Connecticut, utilizing a different dataset and employing various non-parametric machine learning models. The findings are particularly relevant for utility companies and arborists in regions with similar environmental conditions and vegetation dynamics as those in the northeastern United States. While this study was initially designed for Connecticut, the methodologies and principles can be adapted and extended to other regions. But it is important to recognize potential limitations, such as differences in vegetation types in different regions, which might need to be adjusted for the best results.
5. Conclusions
This study sheds new light on the effectiveness of non-parametric machine learning algorithms in localizing storm-induced tree-related outage risk at the device exposure zone level, where faults are detected and handled by utilities. A total of 15 predictor variables were analyzed using five non-parametric machine learning algorithms and evaluated based on their model performance and confidence interval values. The RF emerged as the best model according to the performance metrics of accuracy, the AUC-ROC, precision, and the F1-score. Both the RF and the SVM showed superior performance according to the AUC-ROC metric when identifying DEZs with tree-related outage risk. The RF and XGBoost demonstrated higher precision values, highlighting weaknesses in other models’ ability to capture falsely identified outage presence areas (false positives) compared to the RF and XGBoost. Conversely, the SVM and k-NN reported higher recall values, indicating their ability to identify outage presence areas while minimizing falsely identified outage absence areas (false negatives). When a model captures a higher number of false positives, utilities have to spend extra capital and labor on resiliency programs. In contrast, utilities will be misguided when the risk model tends to detect more false negatives, causing risk to both humans and infrastructure. Accurate modeling of tree-related outage probability enables efficient resource allocation, prevents damage to the grid infrastructure, and lowers the cost of vegetation management.
While this study has discussed desirable outcomes, we believe it is important to acknowledge and address the limitations encountered. These limitations provide valuable insights for future research. Tree health is a critical determinant of tree failures during adverse weather events. Additionally, resistance to storm conditions largely varies across different species and the physical structure of the trees. Therefore, further development of vegetation risk models requires information on tree health and tree species. Also, further research is needed to address model uncertainty and to optimize the performance by employing different modeling techniques, including ensemble machine learning approaches.
Author Contributions
Conceptualization, H.W. and C.W.; methodology, H.W. and C.W.; software, H.W. and J.P.; validation, H.W.; formal analysis, H.W.; investigation, H.W.; resources, C.W.; data curation, H.W. and J.P.; writing—original draft preparation, H.W. and C.W.; writing—review and editing, R.F., D.C., J.P. and A.S.P.; supervision, C.W., R.F. and D.C.; project administration, C.W.; funding acquisition, C.W. All authors have read and agreed to the published version of the manuscript.
Funding
This research received no external funding.
Data Availability Statement
Data is contained within the article.
Acknowledgments
We gratefully acknowledge the support of the Eversource Energy Center at the University of Connecticut for providing the data necessary for this study. Additionally, we extend our appreciation to Elias Manos, a graduate student in the Department of Natural Resources and the Environment, for his valuable insights into improving this paper.
Conflicts of Interest
The authors declare no conflicts of interest. The funders had no role in the design of the study; in the collection, analyses, or interpretation of the data; in the writing of the manuscript; or in the decision to publish the results.
References
- Weather-Related Power Outages and Electric System Resiliency. Available online: https://sgp.fas.org/crs/misc/R42696.pdf (accessed on 18 January 2022).
- Guggenmoos, S. Effects of tree mortality on power line security. J. Arboric. 2003, 29, 181–196. [Google Scholar] [CrossRef]
- Guikema, S.D.; Davidson, R.A.; Liu, H. Statistical models of the effects of tree trimming on power system outages. IEEE Trans. Power Deliv. 2006, 21, 1549–1557. [Google Scholar] [CrossRef]
- Radmer, D.T.; Kuntz, P.A.; Christie, R.D.; Venkata, S.S.; Fletcher, R.H. Predicting vegetation-related failure rates for overhead distribution feeders. IEEE Trans. Power Deliv. 2002, 17, 1170–1175. [Google Scholar] [CrossRef]
- Wanik, D.W.; Anagnostou, E.N.; Hartman, B.M.; Frediani, M.; Astitha, M. Storm outage modeling for an electric distribution network in Northeastern USA. Nat. Hazards 2015, 79, 1359–1384. [Google Scholar] [CrossRef]
- Doostan, M.; Chowdhury, B.H. Power distribution system fault cause analysis by using association rule mining. Electr. Power Syst. Res. 2017, 152, 140–147. [Google Scholar] [CrossRef]
- Liu, H.; Davidson, R.A.; Apanasovich, T.V. Spatial generalized linear mixed models of electric power outages due to hurricanes and ice storms. Reliab. Eng. Syst. Saf. 2008, 93, 897–912. [Google Scholar] [CrossRef]
- Guikema, S.D.; Quiring, S.M.; Han, S. Prestorm estimation of hurricane damage to electric power distribution systems. Risk Anal. Int. J. 2010, 30, 1744–1752. [Google Scholar] [CrossRef]
- Nateghi, R.; Guikema, S.D.; Quiring, S.M. Comparison and validation of statistical methods for predicting power outage durations in the event of hurricanes. Risk Anal. Int. J. 2011, 31, 1897–1906. [Google Scholar] [CrossRef]
- Nateghi, R.; Guikema, S.D.; Quiring, S.M. Forecasting hurricane-induced power outage durations. Nat. Hazards 2014, 74, 1795–1811. [Google Scholar] [CrossRef]
- Cerrai, D.; Wanik, D.W.; Bhuiyan, M.A.E.; Zhang, X.; Yang, J.; Frediani, M.E.; Anagnostou, E.N. Predicting storm outages through new representations of weather and vegetation. IEEE Access 2019, 7, 29639–29654. [Google Scholar] [CrossRef]
- Melagoda, A.U.; Karunarathna, T.; Nisaharan, G.; Amarasinghe, P.; Abeygunawardane, S.K. Application of machine learning algorithms for predicting vegetation related outages in power distribution systems. In Proceedings of the 2021 3rd International Conference on Electrical Engineering (EECon), Colombo, Sri Lanka, 24 September 2021; pp. 25–30. [Google Scholar]
- Wang, Y.; Zhou, T.; Li, C.; Liu, Z.; Zheng, S.; Liu, Q. Systematic Analysis of Big Data Based Machine Learning Algorithms on Various Fields. In Proceedings of the 2022 IEEE Conference on Telecommunications, Optics and Computer Science (TOCS), Dalian, China, 11–12 December 2022; pp. 155–164. [Google Scholar]
- Rathor, A.; Gyanchandani, M. A review at Machine Learning algorithms targeting big data challenges. In Proceedings of the 2017 International Conference on Electrical, Electronics, Communication, Computer, and Optimization Techniques (ICEECCOT), Mysuru, India, 15–16 December 2017; pp. 1–7. [Google Scholar]
- Konstantakopoulos, I.C.; Ratliff, L.J.; Jin, M.; Sastry, S.S.; Spanos, C.J. A robust utility learning framework via inverse optimization. IEEE Trans. Control Syst. Technol. 2017, 26, 954–970. [Google Scholar] [CrossRef]
- Imam, F.; Musilek, P.; Reformat, M.Z. Parametric and Nonparametric Machine Learning Techniques for Increasing Power System Reliability: A Review. Information 2024, 15, 37. [Google Scholar] [CrossRef]
- Ajayi, A.; Oyedele, L.; Akinade, O.; Bilal, M.; Owolabi, H.; Akanbi, L.; Delgado, J.M.D. Optimised big data analytics for health and safety hazards prediction in power infrastructure operations. Saf. Sci. 2020, 125, 104656. [Google Scholar] [CrossRef]
- Wanik, D.W.; Parent, J.R.; Anagnostou, E.N.; Hartman, B.M. Using vegetation management and LiDAR-derived tree height data to improve outage predictions for electric utilities. Electr. Power Syst. Res. 2017, 146, 236–245. [Google Scholar] [CrossRef]
- Wedagedara, H.; Witharana, C.; Fahey, R.; Cerrai, D.; Joshi, D.; Parent, J. Modeling the impact of local environmental variables on tree-related power outages along distribution powerlines. Electr. Power Syst. Res. 2023, 221, 109486. [Google Scholar] [CrossRef]
- Almuallim, H.; Kaneda, S.; Akiba, Y. Development and applications of decision trees. In Expert Systems; Elsevier: Amsterdam, The Netherlands, 2002; pp. 53–77. [Google Scholar]
- Gorunescu, F.; Gorunescu, F. Classification and decision trees. In Data Mining: Concepts, Models and Techniques; Springer Science & Business Media: Berlin/Heidelberg, Germany, 2011; pp. 159–183. [Google Scholar]
- Larose, D.T. Data Mining and Predictive Analytics; John Wiley & Sons: Hoboken, NJ, USA, 2015. [Google Scholar]
- Wei, J.; Wang, S.; Yu, G.; Gu, L.; Wang, G.; Yuan, X. A novel method for pruning decision trees. In Proceedings of the 2009 International Conference on Machine Learning and Cybernetics, Baoding, China, 12–15 July 2009; pp. 339–343. [Google Scholar]
- Gao, W.; Yang, B.; Zhou, Z. On the robustness of nearest neighbor with noisy data. arXiv 2016, arXiv:1607.07526. [Google Scholar]
- Suguna, N.; Thanushkodi, K. An improved k-nearest neighbor classification using genetic algorithm. Int. J. Comput. Sci. Issues 2010, 7, 18–21. [Google Scholar]
- Rastin, N.; Jahromi, M.Z.; Taheri, M. A generalized weighted distance k-nearest neighbor for multi-label problems. Pattern Recognit. 2021, 114, 107526. [Google Scholar] [CrossRef]
- Wang, S.; Meng, B. Dynamic modeling method based on support vector machine. Procedia Environ. Sci. 2011, 11, 531–537. [Google Scholar] [CrossRef]
- Noble, W.S. What is a support vector machine? Nat. Biotechnol. 2006, 24, 1565–1567. [Google Scholar] [CrossRef]
- Fauvel, M.; Chanussot, J.; Benediktsson, J.A. Evaluation of kernels for multiclass classification of hyperspectral remote sensing data. In Proceedings of the 2006 IEEE International Conference on Acoustics Speech and Signal Processing Proceedings, Toulouse, France, 14–19 May 2006; p. II. [Google Scholar]
- Murty, M.N.; Raghava, R.; Murty, M.N.; Raghava, R. Kernel-based SVM. In Support Vector Machines and Perceptrons: Learning, Optimization, Classification, and Application to Social Networks; Springer: Berlin/Heidelberg, Germany, 2016; pp. 57–67. [Google Scholar]
- Guang, Y. Generalized xgboost method. arXiv 2021, arXiv:2109.07473. [Google Scholar]
- Zhang, P.; Jia, Y.; Shang, Y. Research and application of XGBoost in imbalanced data. Int. J. Distrib. Sens. Netw. 2022, 18, 15501329221106935. [Google Scholar] [CrossRef]
- Chen, T.; Guestrin, C. Xgboost: A scalable tree boosting system. In Proceedings of the 22nd ACM SIGKDD International Conference on Knowledge Discovery and Data Mining, San Francisco, CA, USA, 13–17 August 2016; pp. 785–794. [Google Scholar]
- Dudek, G. Short-term load forecasting using random forests. In Intelligent Systems’ 2014: Proceedings of the 7th IEEE International Conference Intelligent Systems IS’2014, Warsaw, Poland, 24–26 September 2014; Volume 2: Tools, Architectures, Systems, Applications; Springer: Berlin/Heidelberg, Germany, 2015; pp. 821–828. [Google Scholar]
- Breiman, L. Random forests. Mach. Learn. 2001, 45, 5–32. [Google Scholar] [CrossRef]
- He, H.; Garcia, E.A. Learning from imbalanced data. IEEE Trans. Knowled Data Eng. 2009, 21, 1263–1284. [Google Scholar]
- Taylor, W.O.; Nyame, S.; Hughes, W.; Koukoula, M.; Yang, F.; Cerrai, D.; Anagnostou, E.N. Machine learning evaluation of storm-related transmission outage factors and risk. Sustain. Energy Grids Netw. 2023, 34, 101016. [Google Scholar] [CrossRef]
- Seger, C. An Investigation of Categorical Variable Encoding Techniques in Machine Learning: Binary versus One-Hot and Feature Hashing. Bachelor’s Thesis, School of Electrical Engineering and Computer Science, Stockholm, Sweden, 2018. [Google Scholar]
- Sarkar, B.K. A case study on partitioning data for classification. Int. J. Inf. Decis. Sci. 2016, 8, 73–91. [Google Scholar] [CrossRef]
- Yang, L.; Shami, A. On hyperparameter optimization of machine learning algorithms: Theory and practice. Neurocomputing 2020, 415, 295–316. [Google Scholar] [CrossRef]
- Bengio, Y. Practical recommendations for gradient-based training of deep architectures. In Neural Networks: Tricks of the Trade, 2nd ed.; Springer: Berlin/Heidelberg, Germany, 2012; pp. 437–478. [Google Scholar]
- Hastie, T.; Tibshirani, R.; Friedman, J. The Elements of Statistical Learning; Springer Series in Statistics; Springer: Berlin/Heidelberg, Germany, 2001. [Google Scholar]
- Bergstra, J.; Bardenet, R.; Bengio, Y.; Kégl, B. Algorithms for hyper-parameter optimization. In Proceedings of the 24th International Conference on Neural Information Processing Systems, Granada, Spain, 12–15 December 2011; Volume 24. [Google Scholar]
- Bergstra, J.; Bengio, Y. Random search for hyper-parameter optimization. J. Mach. Learn. Res. 2012, 13, 281–305. [Google Scholar]
- Pedregosa, F.; Varoquaux, G.; Gramfort, A.; Michel, V.; Thirion, B.; Grisel, O.; Blondel, M.; Prettenhofer, P.; Weiss, R.; Dubourg, V.; et al. Scikit-learn: Machine Learning in Python. JMLR 2011, 12, 2825–2830. Available online: https://scikit-learn.org/0.15/about.html#citing-scikit-learn (accessed on 20 March 2023).
- Kabir, E.; Guikema, S.; Kane, B. Statistical modeling of tree failures during storms. Reliab. Eng. Syst. Saf. 2018, 177, 68–79. [Google Scholar] [CrossRef]
- Hastie, T.; Tibshirani, R.; Friedman, J.H.; Friedman, J.H. The Elements of Statistical Learning: Data Mining, Inference, and Prediction; Springer: Berlin/Heidelberg, Germany, 2009. [Google Scholar]
- Cortes, C.; Mohri, M. Confidence intervals for the area under the ROC curve. In Proceedings of the 17th International Conference on Neural Information Processing Systems, Vancouver, BC, Canada, 1 December 2004; Volume 17, pp. 305–312. [Google Scholar]
- Guignard, F.; Amato, F.; Kanevski, M. Uncertainty quantification in extreme learning machine: Analytical developments, variance estimates and confidence intervals. Neurocomputing 2021, 456, 436–449. [Google Scholar] [CrossRef]
- Nateghi, R.; Guikema, S.; Quiring, S.M. Power outage estimation for tropical cyclones: Improved accuracy with simpler models. Risk Anal. 2014, 34, 1069–1078. [Google Scholar] [CrossRef]
- Oates, T.; Jensen, D. Toward a theoretical understanding of why and when decision tree pruning algorithms fail. In Proceedings of the Sixteenth National Conference on Artificial Intelligence and the Eleventh Innovative Applications of Artificial Intelligence Conference Innovative Applications of Artificial Intelligence, Orlando, FL, USA, 18–22 July 1999; pp. 372–378. [Google Scholar]
- Bengio, Y.; Delalleau, O.; Simard, C. Decision trees do not generalize to new variations. Comput. Intell. 2010, 26, 449–467. [Google Scholar] [CrossRef]
- Claesen, M.; De Moor, B. Hyperparameter search in machine learning. arXiv 2015, arXiv:1502.02127. [Google Scholar]
- Bishop, C.M. Neural Networks for Pattern Recognition; Oxford University Press: Oxford, UK, 1995. [Google Scholar]

Disclaimer/Publisher’s Note: The statements, opinions and data contained in all publications are solely those of the individual author(s) and contributor(s) and not of MDPI and/or the editor(s). MDPI and/or the editor(s) disclaim responsibility for any injury to people or property resulting from any ideas, methods, instructions or products referred to in the content. |
© 2024 by the authors. Licensee MDPI, Basel, Switzerland. This article is an open access article distributed under the terms and conditions of the Creative Commons Attribution (CC BY) license (https://creativecommons.org/licenses/by/4.0/).