Article

Analysis of the Impact Resistance Characteristics of a Power Propulsion Shaft System Containing a High-Elasticity Coupling

1
School of Naval Architecture, Ocean and Energy Power Engineering, Wuhan University of Technology, Wuhan 430063, China
2
Shanghai Marine Diesel Engine Research Institute, Shanghai 201108, China
*
Author to whom correspondence should be addressed.
Appl. Sci. 2024, 14(12), 4995; https://doi.org/10.3390/app14124995
Submission received: 29 April 2024 / Revised: 30 May 2024 / Accepted: 5 June 2024 / Published: 7 June 2024

Abstract

:
In research concerning the impact resistance characteristics of ship power transmission shaft systems incorporating a high-elasticity coupling, a significant challenge lies in ascertaining the displacement compensation metrics for the high-elasticity coupling. This study constructs a finite element model of the ship power transmission shaft system with an entity equivalent model of the high-elasticity coupling. Utilizing the Dynamic Design Analysis Method (DDAM) and the time-history method, the dynamic responses of the high-elasticity coupling, the propulsion shaft system, and its critical cross-sections under explosive impact loads are analyzed. The findings indicate that the maximum impact displacement of the propulsion shafting system, as calculated by DDAM, is 22.47 mm in the vertical direction at the driven end of the high-elasticity coupling. In contrast, the maximum impact displacement determined by the time-history method is 15.23 mm in the same direction. The study corroborates the precision of the high-elasticity coupling equivalent model establishment methodology and confirms that the entity equivalent model of the power transmission shaft system with a high-elasticity coupling is capable of fulfilling the criteria for a swift evaluation of impact resistance characteristics. This provides theoretical backing for the forecasting of impact resistance performance in ship propulsion shaft systems.

1. Introduction

In maritime navigation, ships face a complex and variable physical environment, particularly the inevitable threat from various external impact loads such as waves, collisions, and explosions. With the continuous development of ship engineering technology and the diversification of ship missions, higher demands are placed on the ship’s impact resistance capabilities. The propulsion shaft system, as an essential component of the power system, plays a crucial role [1]. When a ship is subjected to impact loads, the normal operation of the propulsion shaft system and its related components is vital to the reliability of the ship’s power system. The displacement response under impact loads and the vibration stress generated at the bearing supports are directly related to the survivability of the ship’s power system. The high-elasticity coupling is the most important vibration isolation and torque transmission device in the propulsion shaft system, and its impact resistance performance has a significant impact on the overall impact resistance performance of the ship’s propulsion shaft system. Currently, the standards for impact resistance calculations primarily refer to the United States Navy’s specifications for the impact resistance of shipborne equipment [2] and the German Navy’s construction standards. Many research institutions and scholars are highly focused on the impact resistance research of propulsion equipment [3]. Conducting simulation research on the impact resistance performance of the propulsion shafting system and high-elasticity couplings is of significant importance for evaluating the strength performance of the propulsion shafting system and for the optimization and improvement of the ship’s power system.
In the area of impact response analysis for ship propulsion shafting systems, extensive research has been conducted by scholars both domestically and internationally, yielding several research outcomes. There are three main methods for impact resistance analysis, namely equivalent statics, frequency-domain analysis, and time-domain analysis [4,5,6].
The equivalent static method simplifies calculations by translating impact loads into equivalent static loads. This approach is often used to assess the response of structures under impact loads, especially when it is difficult to conduct actual dynamic load testing. However, this method only yields maximum stress and deformation results and is less commonly used in practical applications [7].
The frequency-domain analysis method transforms the impact load into a frequency-domain representation to calculate the spectral distribution of the impact load at different frequencies. Based on modal analysis, it solves the dynamic response characteristics of the system at various frequencies. He et al. [8] established a non-parametric dynamic model based on a test rig, and through experiments and numerical calculations, obtained the shaft system’s displacement response, thereby concluding that uncertainty has a significant impact on the dynamic characteristics of the shaft system. Liang et al. [9], based on the response spectrum analysis method, combined with the design impact spectrum used by the U.S. Navy’s DDAM method, calculated and analyzed the impact response spectrum for the research objective of the article. They used the finite element method for calculation and analysis and took the cantilever beam explosion impact as an example to verify the reliability of the numerical method. Camargo F. [10] systematically summarized various numerical simulation methods in the computational modeling of underwater explosions, focusing primarily on the characteristics of Eulerian and Lagrangian fluid descriptions, Johnson–Cook and Gurson constitutive materials for naval panels, and solving methods such as the Finite Element Method, Finite Volume Method, Boundary Element Method, and Smooth Particle Hydrodynamics. These methods were applied to assess different ship hull materials, with various mathematical approaches and experimental tests conducted for validation. Pang et al. [11] took a certain launching ship as an example and proposed a test method for evaluating the response of the launching platform, as well as tested the maximum structural impact response under the launcher, which gradually attenuated to the bow and stern of the ship. The test analysis showed that the vibration acceleration response was different in different directions, with the highest response in the vertical direction and the lowest in the longitudinal direction. The test results were then verified through finite element numerical analysis. Zhu et al. [12] established a coupled model of longitudinal vibration of the thrust shaft system, bearing lubrication, and shaft misalignment, and analyzed the dynamic characteristics of the stern bearing under explosive impact by solving the Reynolds equation and explosive impact equation. Liang et al. [13] studied the impact of waves impacts on the water-lubricated bearings in the propulsion shaft system. By establishing a water-lubricated bearing model that combines the wave impact function, Reynolds equation, and Euler equation, they analyzed the impact of wave impact magnitude, direction, and entry time on the starting performance of the bearing. Long et al. [14] employed the discrete element method to study the interaction between sea ice and offshore wind turbines, analyzing factors of brittle and ductile failure, and confirmed a strong correlation between self-excited vibration and the brittle–ductile failure of sea ice. Huang et al. [15] investigated the response characteristics of the outer hull of a ship’s double-layer panel after being penetrated by an energetic metal jet and subjected to a secondary near-field explosion, using the Coupled Eulerian–Lagrangian method for numerical calculations and validated the analysis through experimental verification. Ley et al. [16], based on strip theory, boundary element methods, and unsteady Reynolds-averaged Navier–Stokes equations, analyzed the wave load results obtained for different ship types under extreme wave motion using various computational methods. They systematically compared the results with experimental data, indicating that numerical methods based on potential theory are consistent with experimental results in small and moderate waves, but exhibit significant discrepancies with measurements in higher waves. Mannacio et al. [17] took a specific simplified basic structure of a ship as an example and conducted numerical simulation calculations using the dynamic implicit finite element analysis method. Then, based on the MIL-S-901D medium-weight impact standard, they conducted impact tests on three different models. The test data obtained from the medium-weight, high-impact impact machine were compared with the test results to verify the effectiveness of the calculation method. Liu et al. [18] used a nonlinear explicit dynamic analysis method, established a three-dimensional free-field impact wave numerical model, and studied the fatigue damage state of the plate-type explosion-proof door under the action of underwater explosion impact spectrum through finite element numerical simulation. Ni et al. [19] utilized a one-way coupled Computational Fluid Dynamics–Discrete Element Method approach to construct a finite element model of a polar vessel, observing the propagation of ice cracks and analyzing the comparison between simulation results and previous experimental data. This study validated that during the ice-breaking process, the ice load excitation is significantly greater than the hydrodynamic resistance excitation. Cao et al. [20] established an impact resistance numerical model of the hydraulic coupling, conducted impact response calculations on it using the DDAM method, analyzed the performance characteristics of the main components under different impact loads, and used orthogonal experiments to analyze the influencing factors. Paul et al. [21] designed the isolation system for the U.S. Navy’s auxiliary turbine generator sets on ships. They used different simplified and complete system finite element models, selected specific elastic isolation installation seats, adjusted them through impact resistance test tests, and met the design requirements of the isolation system under the action of impact loads. Hu et al. [22], based on typical multi/single-cargo hold asymmetric damage models, studied the water flooding characteristics of the compartment under dynamic explosion and conducted explosive impact calculations under time-domain conditions. Kwak et al. [23] proposed a method for analyzing the degree of structural fatigue damage under explosive impact, calculated the structural damage degree based on physical design parameters and accurate analysis results, and used it for the design structure configuration assessment of naval ships. The FLACS commercial program was used for verification. Xie et al. [24], based on the dynamic design analysis method, conducted impact response calculations for a gas turbine simplified to a system with two degrees of freedom and analyzed the impact displacement response and impact stress response of key components such as the flexible bracket. Rakotomalala et al. [25] established a semi-analytical model of the ship impact system and used the model to calculate the dynamic response of the submarine hull under the action of underwater explosion-induced pressure, derived simple mathematical expressions, and thus obtained the impact of non-contact explosions on the ship’s hull and equipment. Cui et al. [26] took the propulsion shaft system with an elastic coupling as an example, established its finite element model, and conducted impact calculations on the propulsion shaft system and high-elasticity coupling based on the DDAM method and time-history method, and analyzed its impact resistance performance.
The time-domain analysis method investigates the dynamic response of a system as it changes over time under the influence of impact loads. It is suitable for calculating the dynamic characteristics of complex structures, such as propulsion shafting systems, under transient load conditions. However, compared to the frequency-domain method, it consumes more computational resources and is more complex than both the frequency-domain method and the equivalent static method. Kim et al. [27], based on the German Navy standard, used numerical analysis methods to conduct time-domain transient response calculations on gas turbine units under non-contact underwater explosions and analyzed the impact load on key components for structural safety performance assessment. Yang et al. [28] established a finite element model of the propulsion shaft system with or without coupling in the longitudinal and torsional directions, applied a double triangular wave impact load in the longitudinal and torsional directions using the time-domain simulation method, and the coupled system of torsion and longitudinal displacement made the longitudinal displacement increase rapidly and then gradually decrease to 0 under the action of damping, and the torque vibration of the shaft section was consistent with the displacement form. Wang et al. [29], based on the transfer matrix-Newmark step-by-step integration method, used the transfer vector instead of the traditional vector, analyzed the time-domain dynamic response of the propulsion shaft system under impact loads, and studied the impact of initial stress on the response. Küçükarslan S. [30] used the mixed boundary element method, modeled the pile with finite elements, solved the control equation using the implicit integration method, and applied the displacement balance condition at each time analysis step to conduct time-domain transient analysis of the pile under impact loads. Liu et al. [31] employed a bidirectional coupling approach to discuss the impact of structural flexibility on the slamming phenomenon of wedge-shaped bodies and ship models. The effectiveness of the numerical method used was validated through the consistency between the simulation results and experimental data. Zhao et al. [32] proposed a time-domain decomposition method for multiple impact signals of the crankshaft impact as an example, adjusted the design parameters to make it adaptively adjustable, and accurately identified the impact number and impact effect of the vibration signal. Zhu et al. [33] have developed an analytical approach to forecast the elastic dynamic response of a rectangular plate subjected to the influence of moving pressure impact loads. The methodology incorporates a dynamic load coefficient to scrutinize the influence of moving velocity on dynamic loads. After the model-based analysis, the authors delineated the expression for the DMLC and advanced an empirical formula for the conversion of moving impact loads into an equivalent static load representation. Piscopo et al. [34] based on a nonlinear time-domain hydrodynamic model, compared the results obtained through the time-domain analysis method and the spectral analysis under the Welch and Thomson method. The results indicated that spectral analysis is conducive to enhancing the assessment of the fatigue life of mooring lines. Wang et al. [35] used the seakeeping method, computational fluid dynamics method, and the finite element method to simulate the slamming pressure and local structural response of a large container ship and analyzed the dynamic characteristics of the bow-shaped structure under slamming load. Zhang et al. [36] employed the time-domain method to study the interaction between sea ice and the cable tunnel structure of offshore substations, analyzing the failure patterns of sea ice and the variation rules of ice force amplitudes under ice loads. Zhao et al. [37] proposed a model for an icebreaker colliding with an ice ridge, determined the ice-induced forces on the hull based on numerical simulation, applied ice impact loads to the hull using a triangular pulse, and calculated the response characteristics of the structural model. Wang et al. [38] proposed a numerical simulation method for calculating the ice resistance of cylindrical structures based on the discrete element method. By comparing the structural resistance results of model simulation under experimental conditions with the results of model experiments, the effectiveness of the numerical method was validated. Chung et al. [39] took a high-speed catamaran as an example, conducted impact modeling of the catamaran ship type and fluid model based on the finite element method, proposed an impact resistance analysis method for high-speed catamaran ship types and discussed related influencing parameters, and finally compared the simulation results with empirical data for analysis. Sigrist et al. [40] proposed a universal method for analyzing the dynamic response of underwater impact loads on ship equipment without the need for ‘coupled calculations’. Based on the calculation of transfer functions of fluid, structure, and structure coupling, the impact resistance performance of the ship’s hull and equipment was analyzed. Iakovlev et al. [41,42] studied a system composed of a fluid-filled underwater cylindrical shell and a rigid cylinder, where the fluid dynamic field was affected by an external shock wave, analyzed various phenomena of shock wave propagation and reflection, and the impact of the mass size of the core on the interaction between fluid and structure.
From the current state of research, it is evident that the impact resistance calculations for marine propulsion shafting systems primarily focus on calculations from the propeller to the thrust bearing, with almost no attention given to impact calculations for shafting systems containing high-elasticity couplings. Additionally, current research on high-elasticity couplings mainly revolves around the simulation and experimental computation of the couplings’ performance parameters, including radial stiffness and torsional stiffness. There is a notable lack of research and calculations on the impact characteristics simulation models of high-elasticity couplings. This paper aims to address the existing issues in the impact calculation and analysis of propulsion shafting systems containing high-elasticity couplings, thereby further perfecting the modeling methods for impact calculations, analysis of influencing factors, and other related theoretical issues. The arrangement of the research content of this paper is as follows: Section 2 will conduct a model study on the electric propulsion shafting system and high-elasticity coupling, providing a detailed description of the mechanical properties of the rubber material of the high-elasticity coupling, and performing static and modal analysis based on the established model of the electric propulsion shafting system; Section 3 will calculate the design impact acceleration based on the Dynamic Design Analysis Method (DDAM), and then analyze the impact response of the shafting system shaft segments and critical cross-sections under the action of impact loads; Section 4 will use the time-history method to calculate the impact spectrum, focusing on the analysis of the impact displacement response at the cross-section; Finally, in Section 5, the conclusions will be drawn based on the aforementioned analyses.

2. Electric Propulsion Shaft System Model and Static Characteristic Analysis

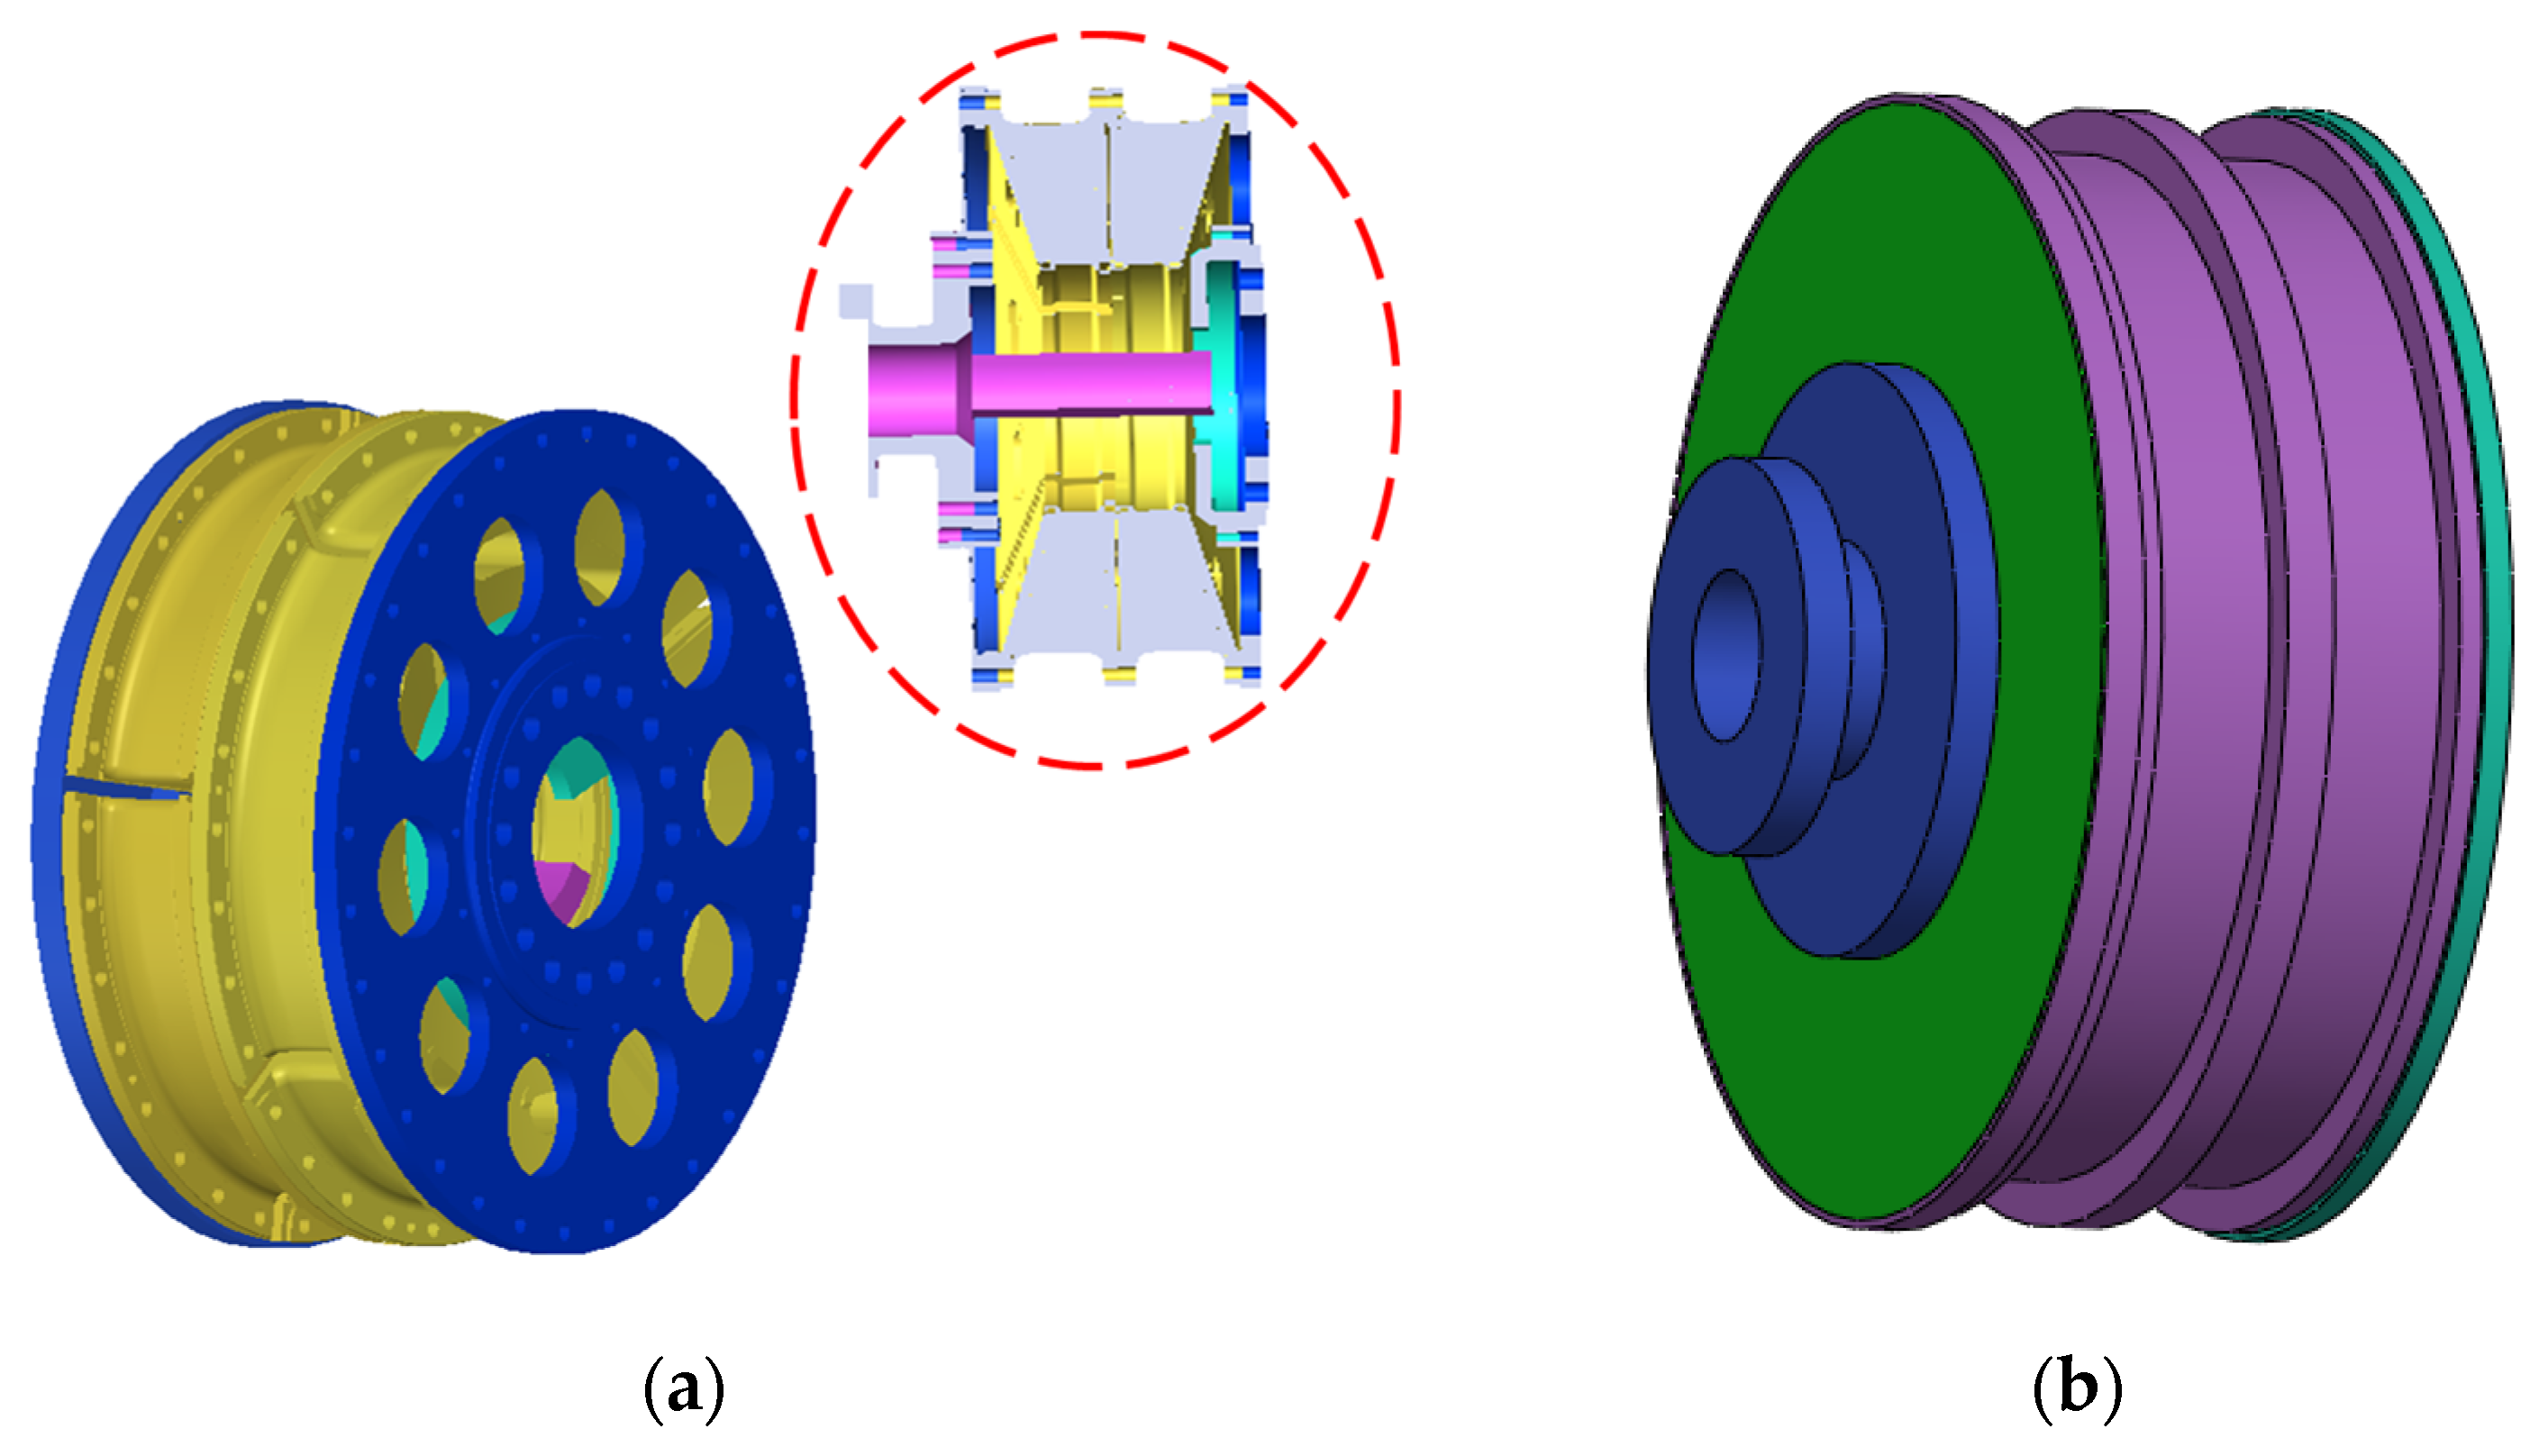
2.1. High Elasticity Coupling Model and Characteristic Analysis

High-elasticity couplings, serving as the components that connect the motor to the propulsion shaft system, are primarily utilized for the transmission of torque. From the perspective of the propulsion shaft system’s resistance to impact, another significant function of high-elasticity couplings is displacement compensation. That is to say, after the propulsion shaft system is subjected to impact loads, high-elasticity couplings rely on their displacement compensation capabilities to perform longitudinal and radial displacement compensation. Consequently, this can provide a protective effect for the equipment located upstream of the high-elasticity coupling.

2.1.1. Elastic Coupling Rubber Material Stress–Strain Relationship

The rubber material of high-elastic couplings possesses superior elastic and damping properties. The constitutive relationship of its composite material is nonlinear, typically addressed using strain energy density functions in large nonlinear commercial software such as ABAQUS and ANSYS. In finite element simulation analysis, commonly used strain energy density functions include the Mooney–Rivlin model, the Yeoh model, and the Neo–Hookean model, etc. [43,44,45,46]. From a mathematical perspective, this has driven the in-depth study of strain energy density functions. Based on the incompressibility and isotropy assumptions of rubber materials, the strain energy function W can be represented as a function composed of three stretch ratios, I 1 , I 2 , I 3 . The strain energy function W remains unchanged when two of these variables change their signs. That is, the Rivlin strain energy density function model as follows:
I 1 = λ 1 2 + λ 2 2 + λ 3 2
I 2 = λ 1 2 λ 2 2 + λ 2 2 λ 3 2 + λ 1 2 λ 3 2
I 3 = λ 1 2 λ 2 2 λ 3 2 = 1
In the aforementioned equations, I 1 , I 2 , I 3 represent the stretch ratios of the rubber material, respectively; λ 1 , λ 2 , λ 3 , correspond to the principal stretch ratios in the three coordinate directions. Thus, the strain energy density function W for incompressible isotropic materials is the sum of terms as follows:
W = i + j = 1 N C ij ( I 1 3 ) i ( I 2 3 ) j
Equation (4) is the Rivlin model in rubber theory analysis, where W represents the strain energy density function; and C i j are rubber material constants. Simplifying this model leads to the commonly used two-term Mooney–Rivlin model, with its strain energy density function W expressed as follows:
W = C 10 ( I 1 3 ) + C 01 ( I 2 3 )
where C 10 , C 01 are Mooney–Rivlin constants. Many researchers in related fields have made various modifications to the Mooney–Rivlin model, resulting in many higher-order forms of strain energy density functions. Due to the convenience of use and the fact that the constants of these models can be obtained through tensile and shear tests on standard specimens, the Mooney–Rivlin model and its derivatives are widely applied in finite element calculations for rubber material models.

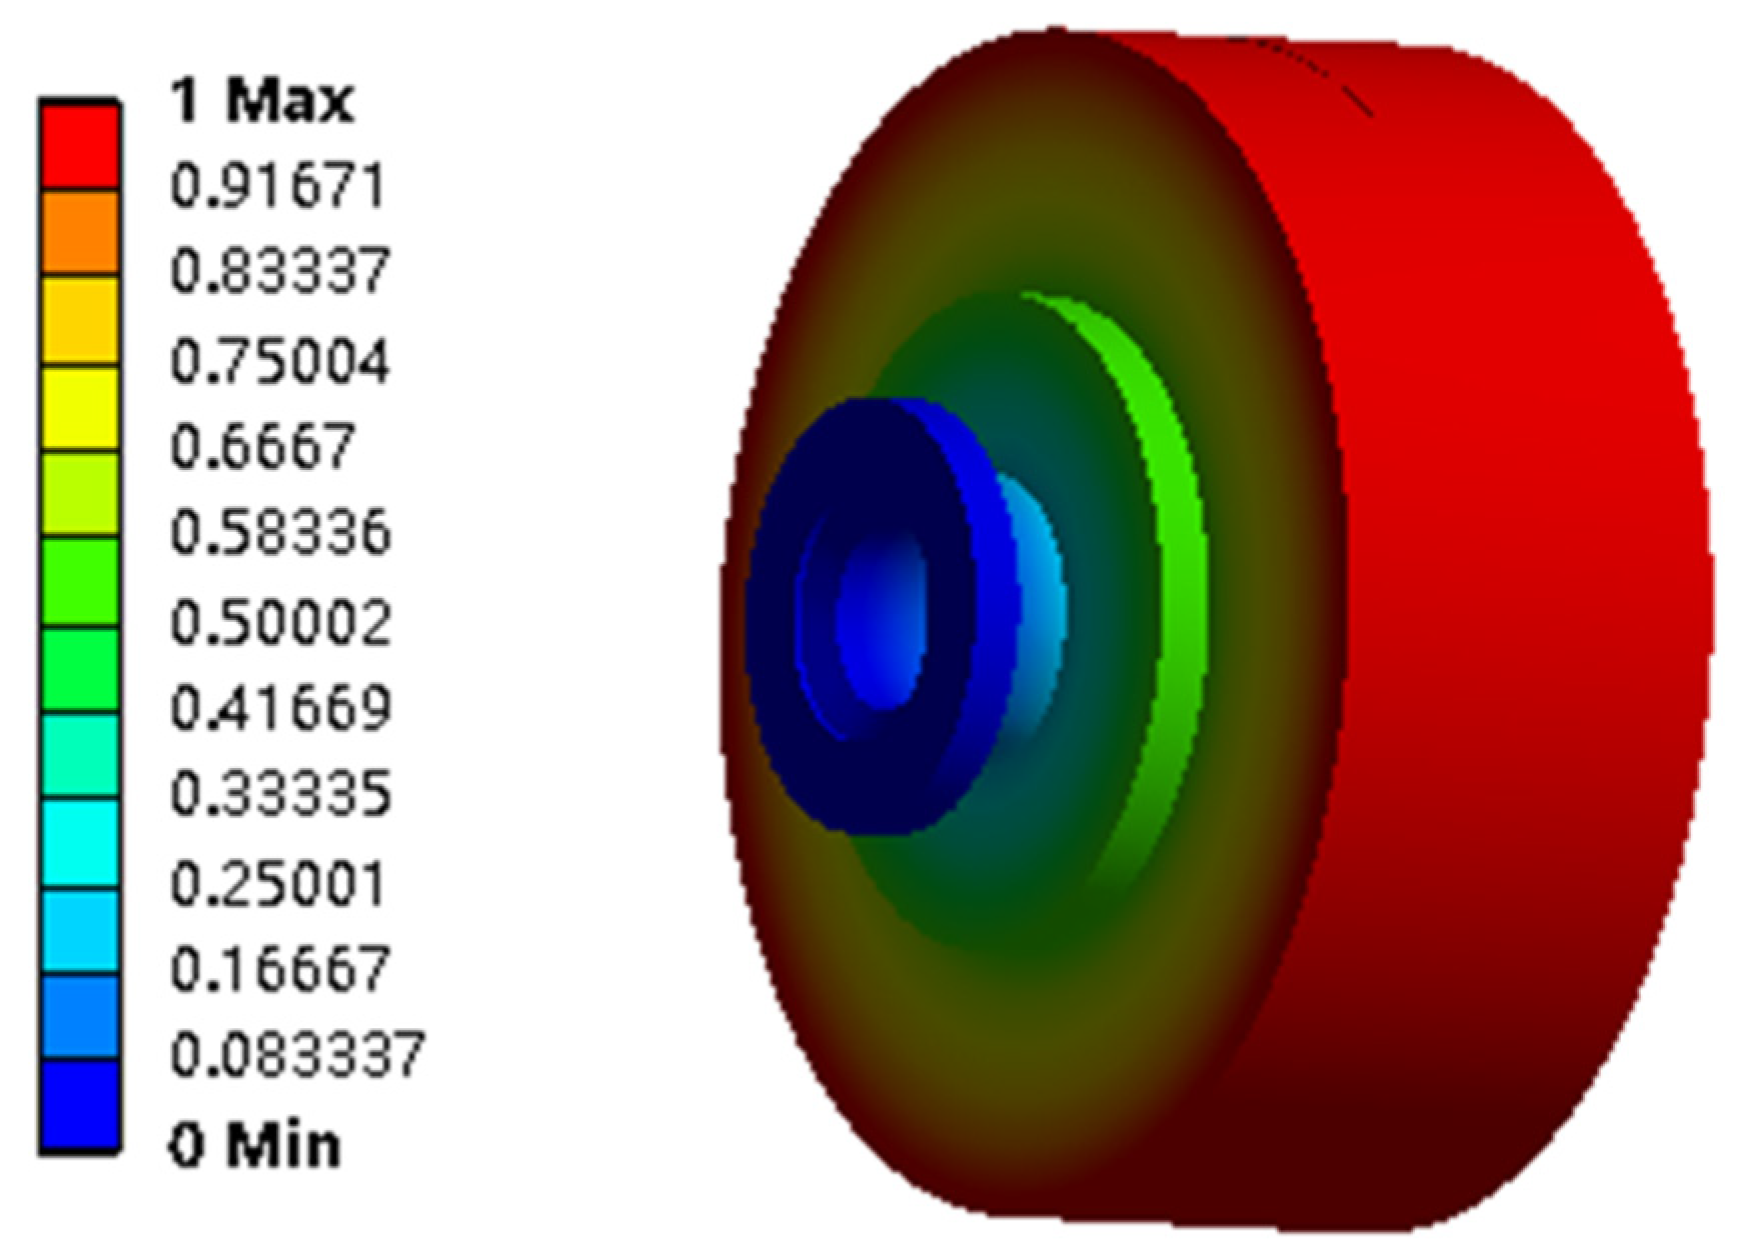
2.1.2. High-Elasticity Coupling Model

The current propulsion shaft system uses a double-row multi-disk rubber diaphragm coupling, which primarily transmits the power output from the motor to the rear transmission shaft system through elastic rubber blocks and metal diaphragms, thereby driving the rear shaft system and simultaneously transmits high torque and compensating for the axial misalignment between the motor and the rear shaft system. During the process where the propulsion shaft system is subjected to impact loads, the high-elasticity coupling compensates for the impact response displacement to reduce the harm caused by poor vibration of the propulsion shaft system. A three-dimensional model of the high-elasticity coupling entity is shown in Figure 1a, with its cross-sectional view depicted within the red circle, with a total mass of 3550 kg.
In the actual simulation calculation process, due to the complexity of its three-dimensional model and issues such as mesh division, computational resources, and local model analysis, it is necessary to simplify the physical model and use a three-dimensional equivalent model of the high-elasticity coupling for simulation analysis. The simplified model should maintain basic parameters such as mass, axial length, center of gravity, and inertia consistent with the original model to meet the requirements for impact resistance calculation of the propulsion shaft system after the ship is subjected to explosive impact. It should also be able to successfully calculate the displacement compensation capability of the high-elasticity coupling. Based on its main structural features, it is simplified into parts such as the driving and driven flanges, diaphragms, and rubber blocks that compensate for the impact response displacement. The structure size is similar to that of the physical model. The equivalent model is established using three-dimensional modeling software and assembled in the software, as shown in Figure 1b. The density of the active and passive flanged diaphragm components is adjusted to 7850 kg/m3, and the density of the rubber material component is adjusted to 1748.6 kg/m3. The total mass of the equivalent model is 3550 kg. When calculating the stress–strain relationship to determine Young’s modulus, the high-elasticity coupling is analogized to the deformation problem of a beam model under simple load action in material mechanics theory, as shown in Figure 2 for the simplified diagram of the high-elasticity coupling beam model, where each part of the coupling deforms under the action of external forces. During the deformation process, the work performed by the impact load is converted into energy, which is temporarily stored within the solid, that is, strain energy. As the external force gradually decreases, the deformation gradually recovers, and the coupling releases the stored energy to do work.
θ B = F l 2 2 E I
y B = F l 3 3 E I
where θ B and y B are the end section rotation angle and the maximum deflection, respectively; F denotes the applied external force; and E signifies the modulus of elasticity. In the calculation of its moment of inertia, the elastic coupling end face can be simplified into an annular section with an outer diameter of D and an inner diameter of d, and its moment of inertia is:
I z = I y = π 64 ( D 4 d 4 )
By combining Equations (6)–(8), and knowing that the rated torque of the high-elasticity coupling is 315 kN·m, the material properties of the equivalent model parts can be obtained. This material property is also applicable to the entire propulsion shaft system impact resistance simulation and calculation analysis. In addition, the established equivalent model of the high-elasticity coupling is directly imported into the static analysis module of the finite element analysis software. By applying torque or external force and adjusting the material properties, the coupling is made to deform accordingly to meet the required radial stiffness and torsional stiffness. Based on the theoretical stiffness parameters of the high-elasticity coupling, combined with simulation numerical analysis, in the stiffness simulation process of the high-elasticity coupling, both longitudinal stiffness and torsional stiffness are considered, but the coupling process between the two is not considered. In the calculation of torsional stiffness, one end of the high-elasticity coupling is fixed and the rated torque of the elastic coupling is applied to the other end. As shown in Figure 3, the simulation calculation obtained the simulation cloud map of radial stiffness and torsional stiffness, with the radial displacement being about 1 mm. Given that the material properties corresponding to torsional stiffness and radial stiffness are different, a material with a smaller Young’s modulus is chosen for impact calculation to consider safety performance. Since the evaluation standard of the high-elasticity coupling mainly focuses on whether the impact displacement can meet its compensation displacement requirements, a softer material is used to determine the material properties of each part of the equivalent model of the high-elasticity coupling, as shown in Table 1. In the entire calculation process of the propulsion shaft system, according to the parts represented by the position of the equivalent model shaft section of the high-elasticity coupling and the parameters in the material property table, the material properties of the equivalent model of the high-elasticity coupling are set.

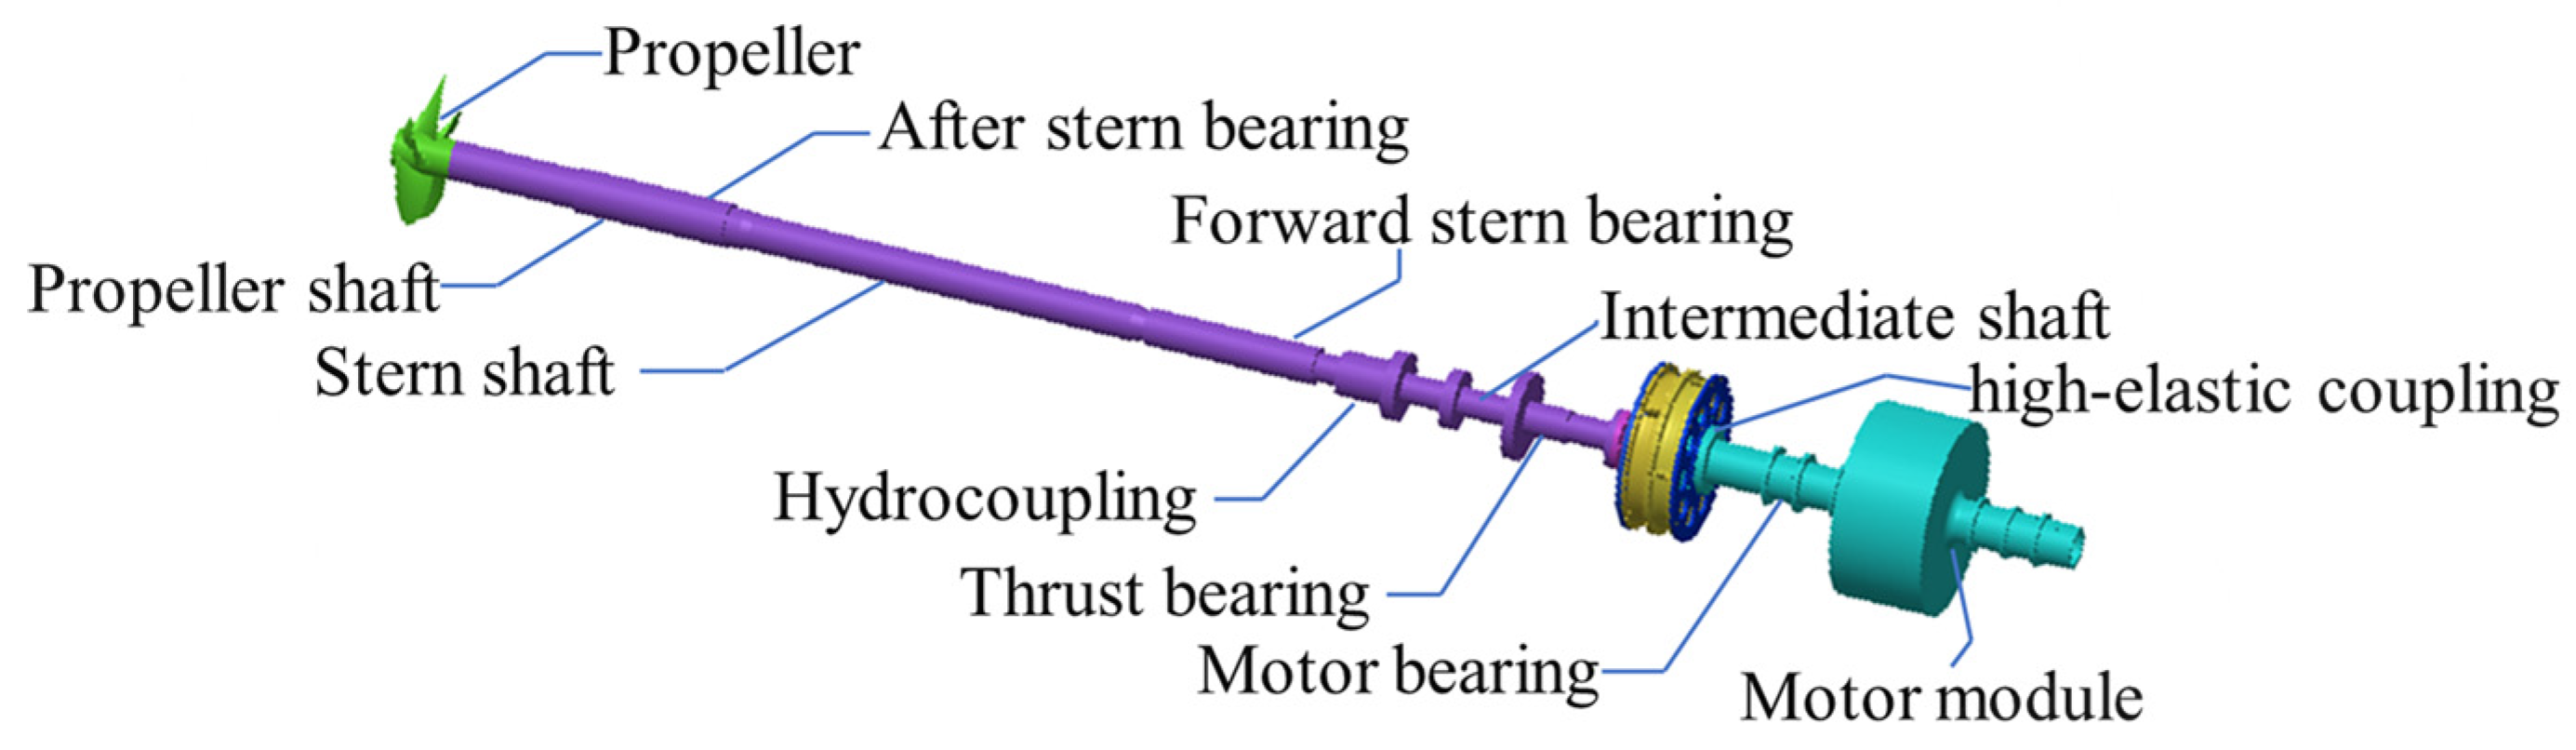
2.2. Propulsion Shafting System Model

In the current research on the finite element model of the ship’s propulsion shaft system for impact resistance calculation, to accurately describe the dynamic characteristics of the propulsion shaft system and to facilitate the simulation calculation and three-dimensional modeling, this analysis mainly models the parts that have a significant impact on the impact resistance calculation results of the propulsion shaft system. Some complex and less important structures are simplified to better conform to actual engineering. By fully considering and comparing the characteristics of the physical model, beam model, and equivalent model, the equivalent model of the high-elasticity coupling combined with the physical model of the propulsion shaft system is finally chosen as the finite element model for impact calculation. This model simplifies the propeller, tail shaft, thrust intermediate shaft, equivalent high-elasticity coupling model, and propulsion motor module into shaft segments and assembles them into a geometric model. It can arbitrarily extract the required section displacement response and stress response. Figure 4 shows the physical model diagram of the propulsion shaft system.

2.3. Static Analysis of Propulsion Shafting System

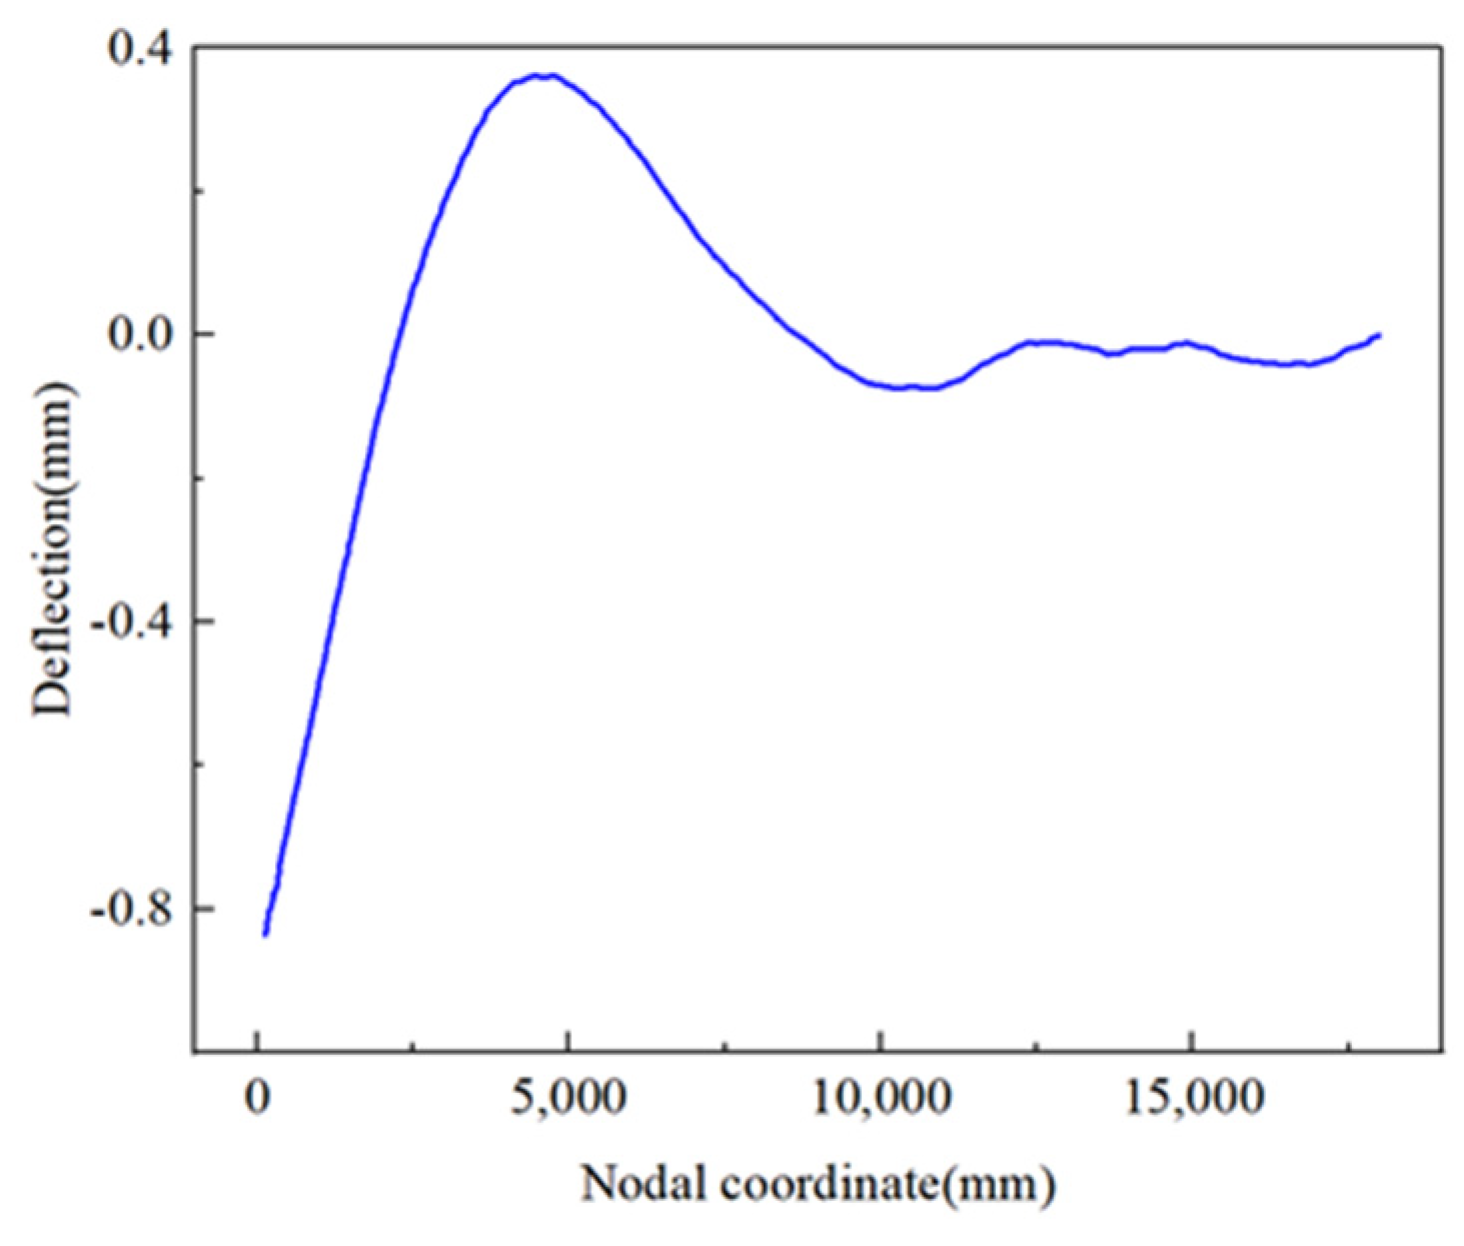
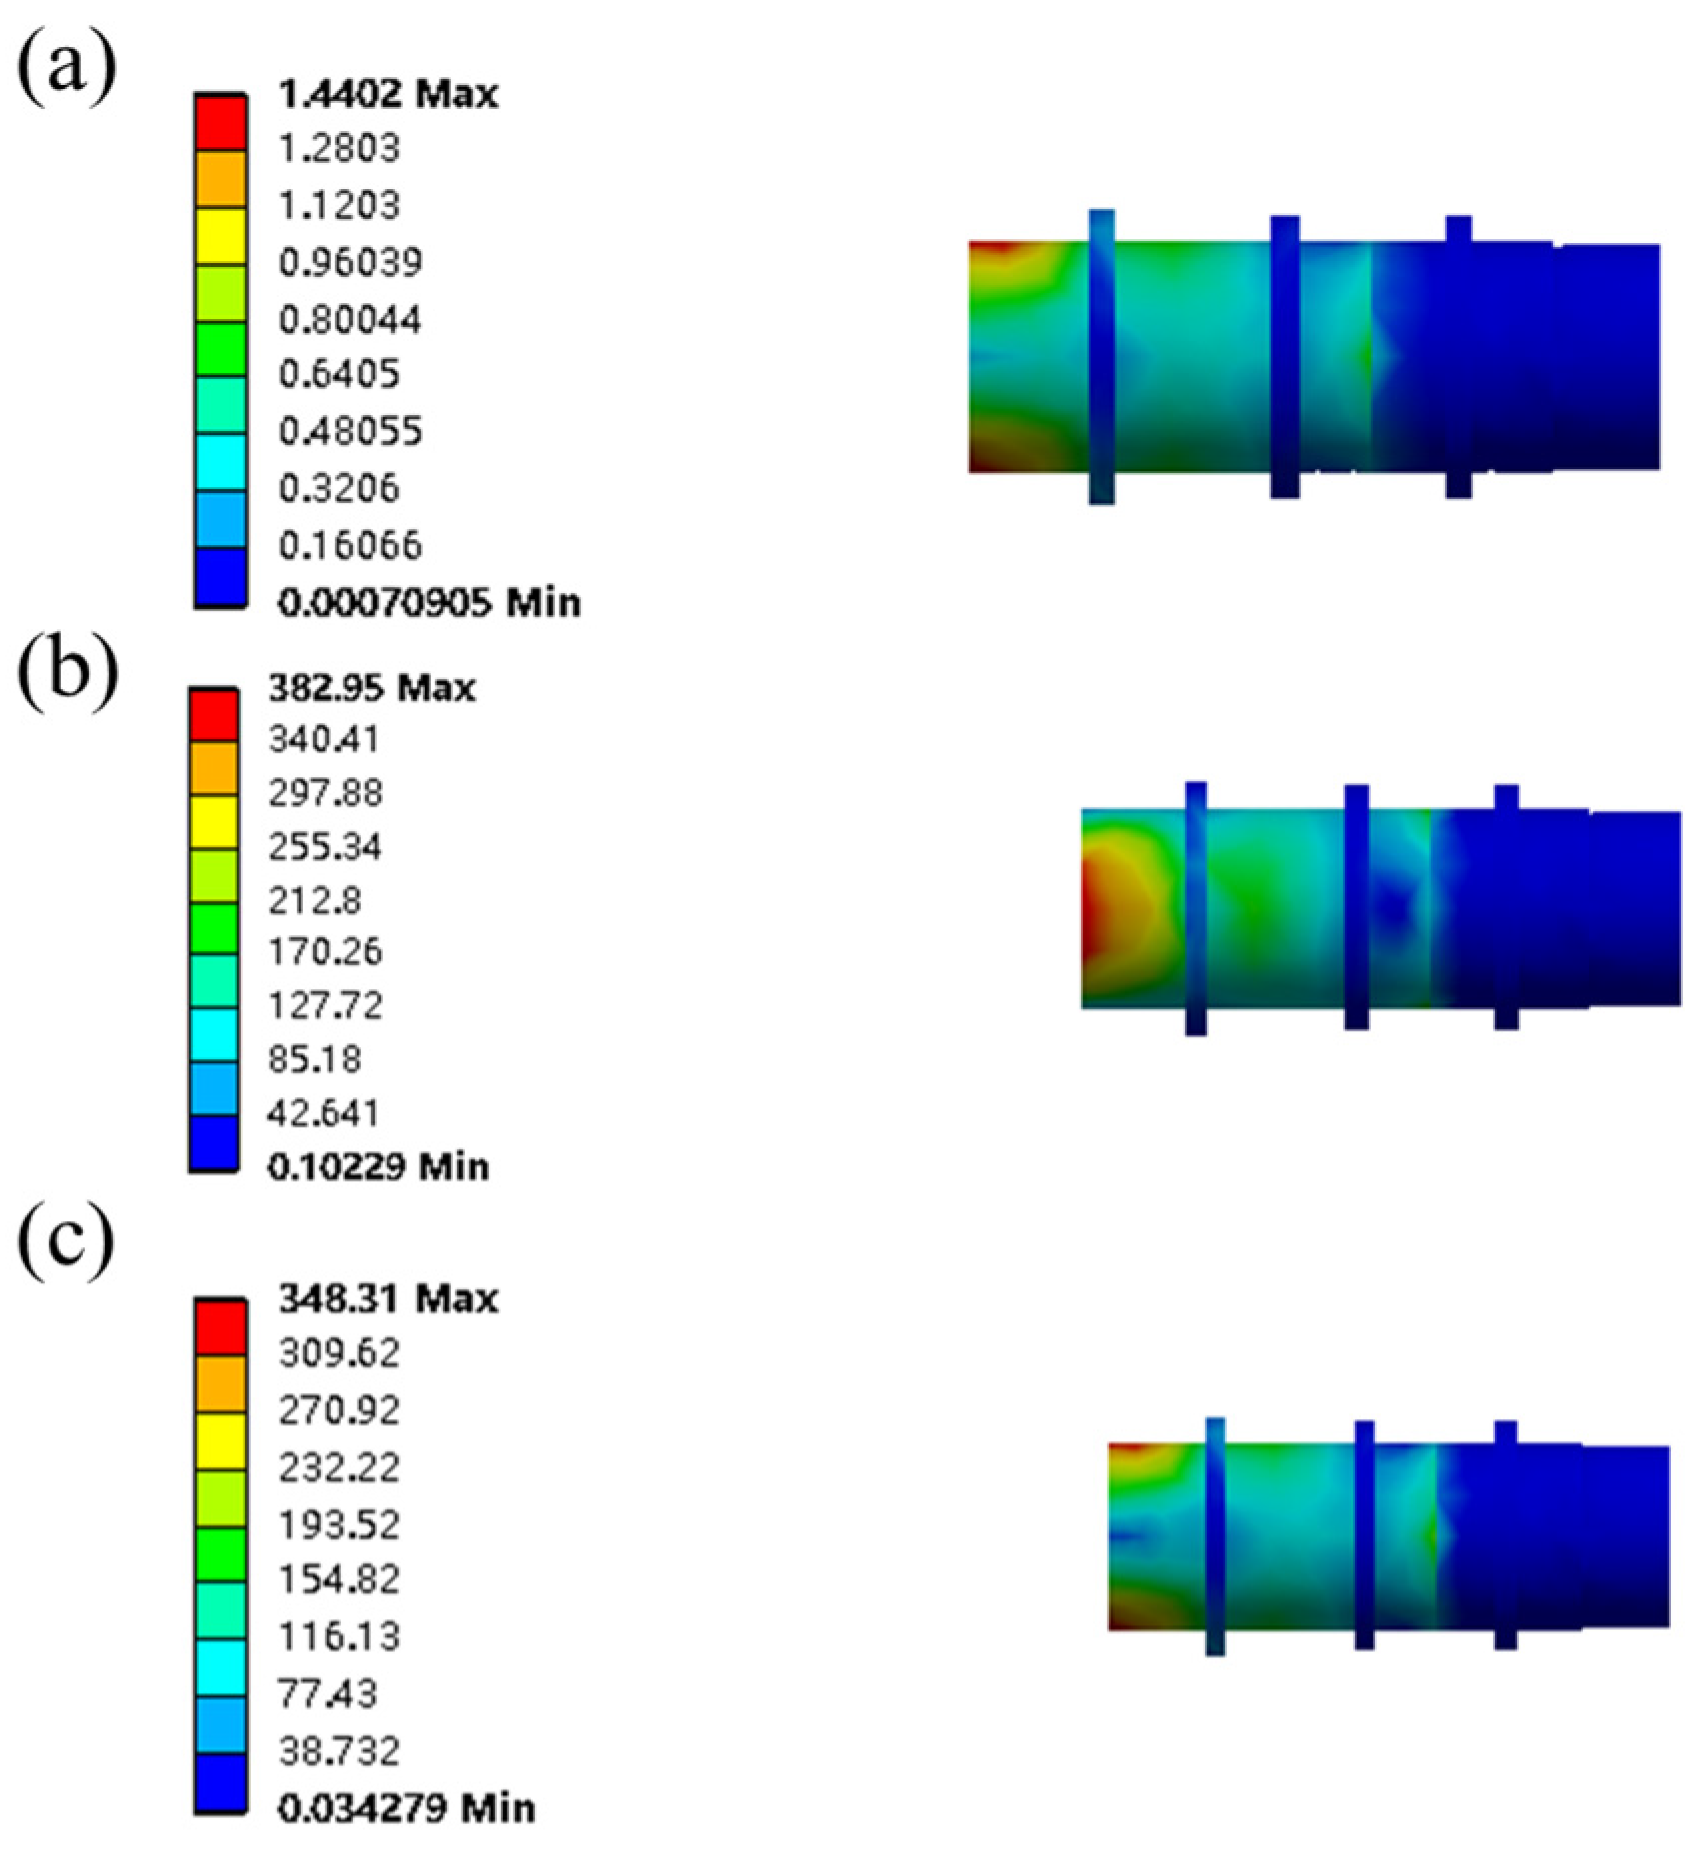
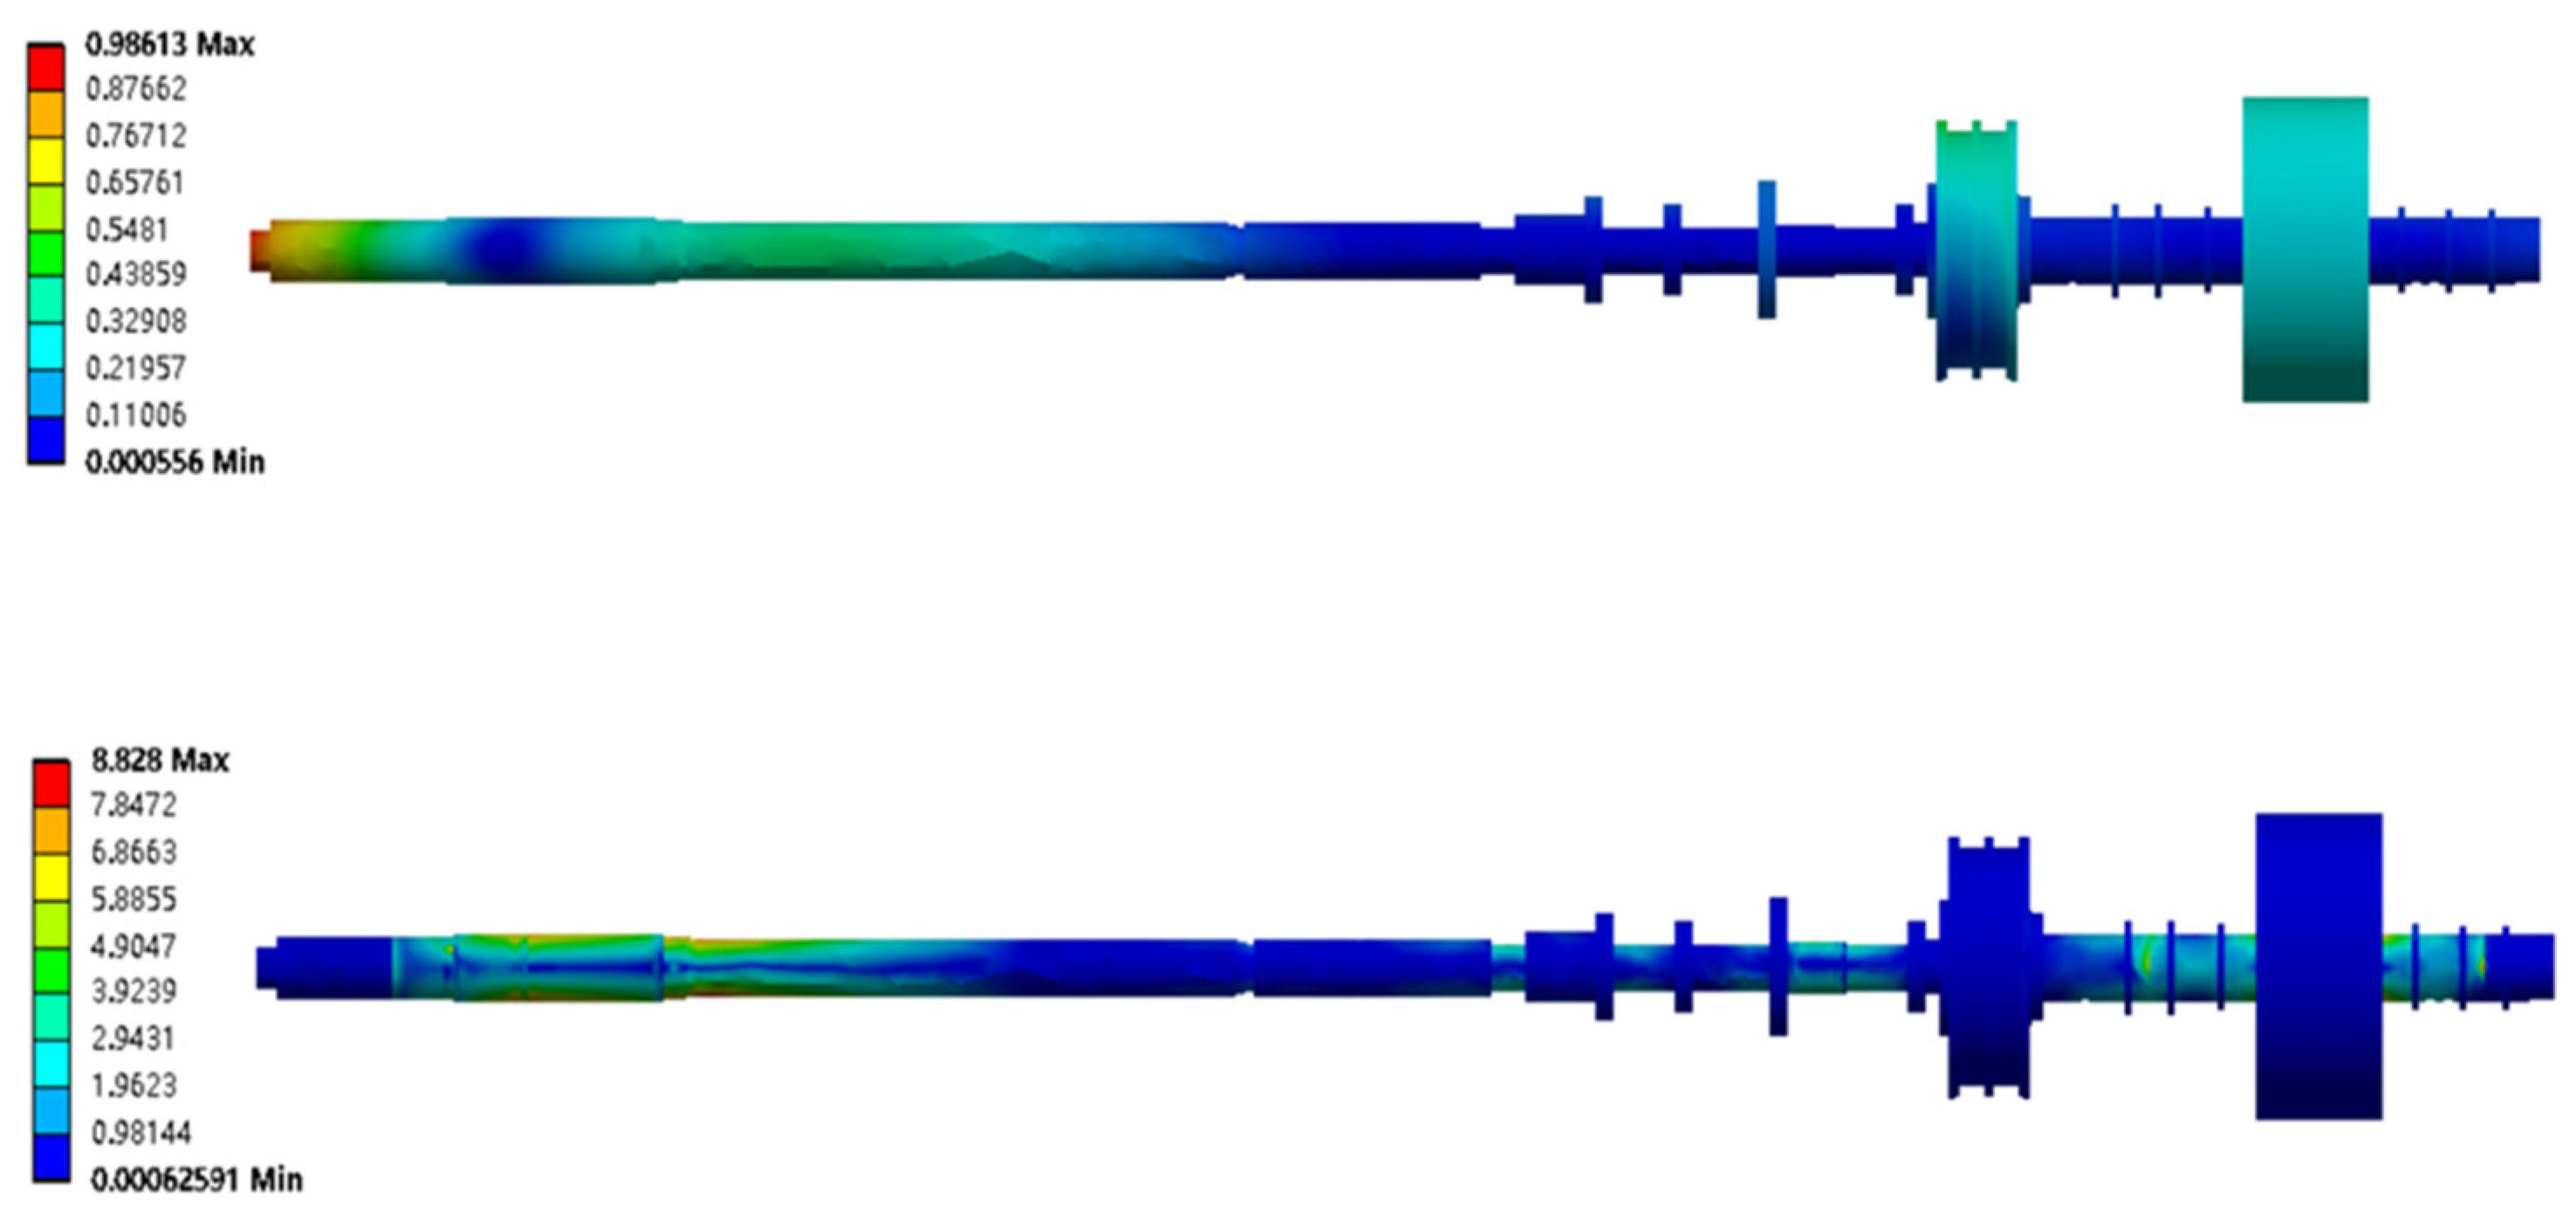
2.3.1. Static Mechanical Analysis

The established three-dimensional model of the propulsion shaft system is imported into the finite element analysis software, combined with the theory of the ship’s propulsion shaft system. The shaft segment from the propeller to the tail shaft tube seal, which is simplified, is treated with water coverage, and the buoyancy coefficient is taken as 1025 kg/m3. According to the known model mass, the material properties corresponding to the corresponding shaft segment model are set. The density of unknown metal structures is processed at 7850 kg/m3, the elastic modulus is 2.0 × 10¹¹ Pa, and Poisson’s ratio is 0.3, resulting in a system mass of 33 tons for the propulsion shaft system. In terms of boundary condition definition, considering the rubber joint surface of the high-elasticity coupling with the flange disc and the flange surface with the external shaft segment, a binding connection is used and there is no relative displacement between the parts.
In static calculation, it is necessary to impose corresponding constraints on the shaft system to meet the actual state of the shaft system. The spring element is used to simulate the bearing of the propulsion shaft system, assuming that the bearing has isotropic stiffness in the radial direction. To more accurately simulate the actual situation, in the cross-section of the bearing support point, vertical and horizontal spring elements are used, and corresponding stiffness is assigned for simulation calculation. In the post-processing stage, the deformation of the propulsion shaft system is visualized by adding displacement transformation, and the state parameters of the key cross-section or the entire system are extracted. To obtain the load conditions of each bearing, a spring probe is introduced to measure the load at the bearing support point position and the deflection of the spring. The final load of each bearing model is obtained as shown in Table 2, and the deflection curve of the propulsion shaft system is shown in Figure 5.
From Figure 5, it can be observed that the bending deflection at various positions of the propulsion shaft system, as calculated through static mechanics, is delineated. The X-axis corresponds to the locations of cross-sections along the shaft from the propeller to the motor, while the Y-axis denotes the deflection values at each of these cross-sections. The deflection curve represents the deformation profile of the propulsion shaft system across different regions. At the vicinity of the X-axis at 0 mm, the deflection is recorded as 0.83 mm, predominantly due to the substantial mass of the propeller which results in a downward deflection. Within the shaft segment spanning from 2000 mm to 8500 mm, the section is supported by the stern bearing at the rear and the forward stern bearing. This segment, under the influence of the propeller’s gravitational force, exhibits an upward deflection with a maximum deformation reaching 0.37 mm.

2.3.2. Modal Analysis

To comprehensively analyze the vibration characteristics of the propulsion shafting system, a modal analysis was conducted. Considering the significant impact of bearing stiffness on the natural frequencies of the shafting system, the role of bearing stiffness was meticulously taken into account during the modal analysis. The finite element model used for static analysis was adopted and further defined with boundary conditions. Within the modal analysis module of the finite element software, the propulsion shafting system’s modal analysis can be simulated similarly to statics using two perpendicularly constrained spring elements to represent the action of the bearings. The vertical and lateral stiffness of the spring elements are set according to the type of bearing and the given conditions. The thrust stiffness of the thrust bearing is set as axial stiffness, without considering the coupling effect of bearing stiffness. Corresponding constraints and boundary conditions are also applied to the propulsion shafting system; alternatively, the bearing elements in the module can be used to achieve the effect of the bearings, which are relatively simpler to set up than spring elements. A single-bearing element can simultaneously impart both lateral and vertical stiffness, replicating the function of two perpendicular spring elements. The propeller’s mass is treated as a concentrated mass point, and for static treatment, the propeller’s rotational inertia is not set. Depending on the actual analysis requirements, a reasonable number of modal analysis orders are set, and the minimum and maximum analysis frequencies can also be set based on the analysis frequency. In the actual calculations of this paper, 150 modal frequencies and modes were set. By selecting the overall deformation in the post-processing module, the modal deformation shapes for each order can be obtained, as shown in Figure 6, Figure 7, Figure 8, Figure 9 and Figure 10, which are the main modal shapes of the propulsion shafting system.

3. DDAM for Impact Resistance Calculation

In conventional impact resistance theoretical calculations, the Equivalent Static Force (ESF) method is often used to determine the stress and displacement deformation of partial structures under impact loads. However, this method primarily considers the strength of base supports and connecting elements and can also analyze the installation state of rigid equipment, but it is not capable of calculating the impact spectrum input for elastic equipment installation conditions. The DDAM not only takes into account the impact of equipment installation stiffness on the impact spectrum input but also considers the effect of its mass on the base impact. It can specifically calculate and analyze the maximum relative displacement and maximum impact dynamics parameters that each component of the propulsion shaft system can withstand. This method is based on modal analysis theory, simplifying the propulsion shaft system into multiple single-degree-of-freedom systems, extracting modal frequencies and modal effective mass. It selects modes with a large modal mass ratio relative to the total system mass and by requirements. By calculating the design impact load spectrum data, it conducts impact resistance calculations in the vertical, transverse, and longitudinal directions of the propulsion shaft system, obtaining the impact response displacement and impact response stress in the three directions. It extracts the response values of key sections and compares them with the specified allowable values to assess the impact resistance performance of the shaft system.

3.1. Impact Acceleration Calculation

The design impact spectrum curve is based on the national military standard (GJB1060.1-91) [47], selecting modes with effective total mass greater than 80% of the system mass, mainly considering lower frequency modes. The propulsion shaft system’s different directional modes are processed separately. The impact spectrum values vary depending on the type of ship and the equipment installation location. Based on the design impact acceleration value A a and the impact velocity value V a , the smaller value between V a · ω a and A a is taken as the design impact acceleration for the dynamic analysis system in the given impact direction. The values for the design impact acceleration A a and impact velocity V a are shown in Table 3. Since the propulsion shaft system is connected to the hull and has similar dynamic changes, the calculation is based on the benchmark acceleration and velocity of the hull components. By calculating, the impact acceleration spectrum in the three directions is obtained, as shown in Table 4, which presents some of the natural frequencies and design acceleration values.
The calculation formulas for A 0 and V 0 in the table are as follows:
A 0 = 102.02 217.73 + m a 9.07 + m a
V 0 = 0.51 217.73 + m a 45.36 + m a
where A 0 —Base acceleration, m/s2; V 0 —Base velocity, m/s; A a —Design acceleration, m/s2; V a —Design velocity, m/s; m a —Modal mass, t.
Since the propulsion shaft system includes a high-elasticity coupling, and the rubber components are nonlinear materials, to ensure calculation accuracy, the total modal mass selected in the longitudinal, vertical, and transverse directions of the propulsion shaft system is much greater than the total mass of 80% stipulated in the regulations. Low-frequency modes with a larger proportion are chosen. Thus, in the post-processing of the finite element modal analysis module, information such as modal order, modal frequency, participation factor, modal mass, and the ratio of modal mass to the total system mass is extracted. Consequently, the design impact acceleration spectrum for the longitudinal, vertical, and transverse directions of the ship’s propulsion shaft system is calculated.

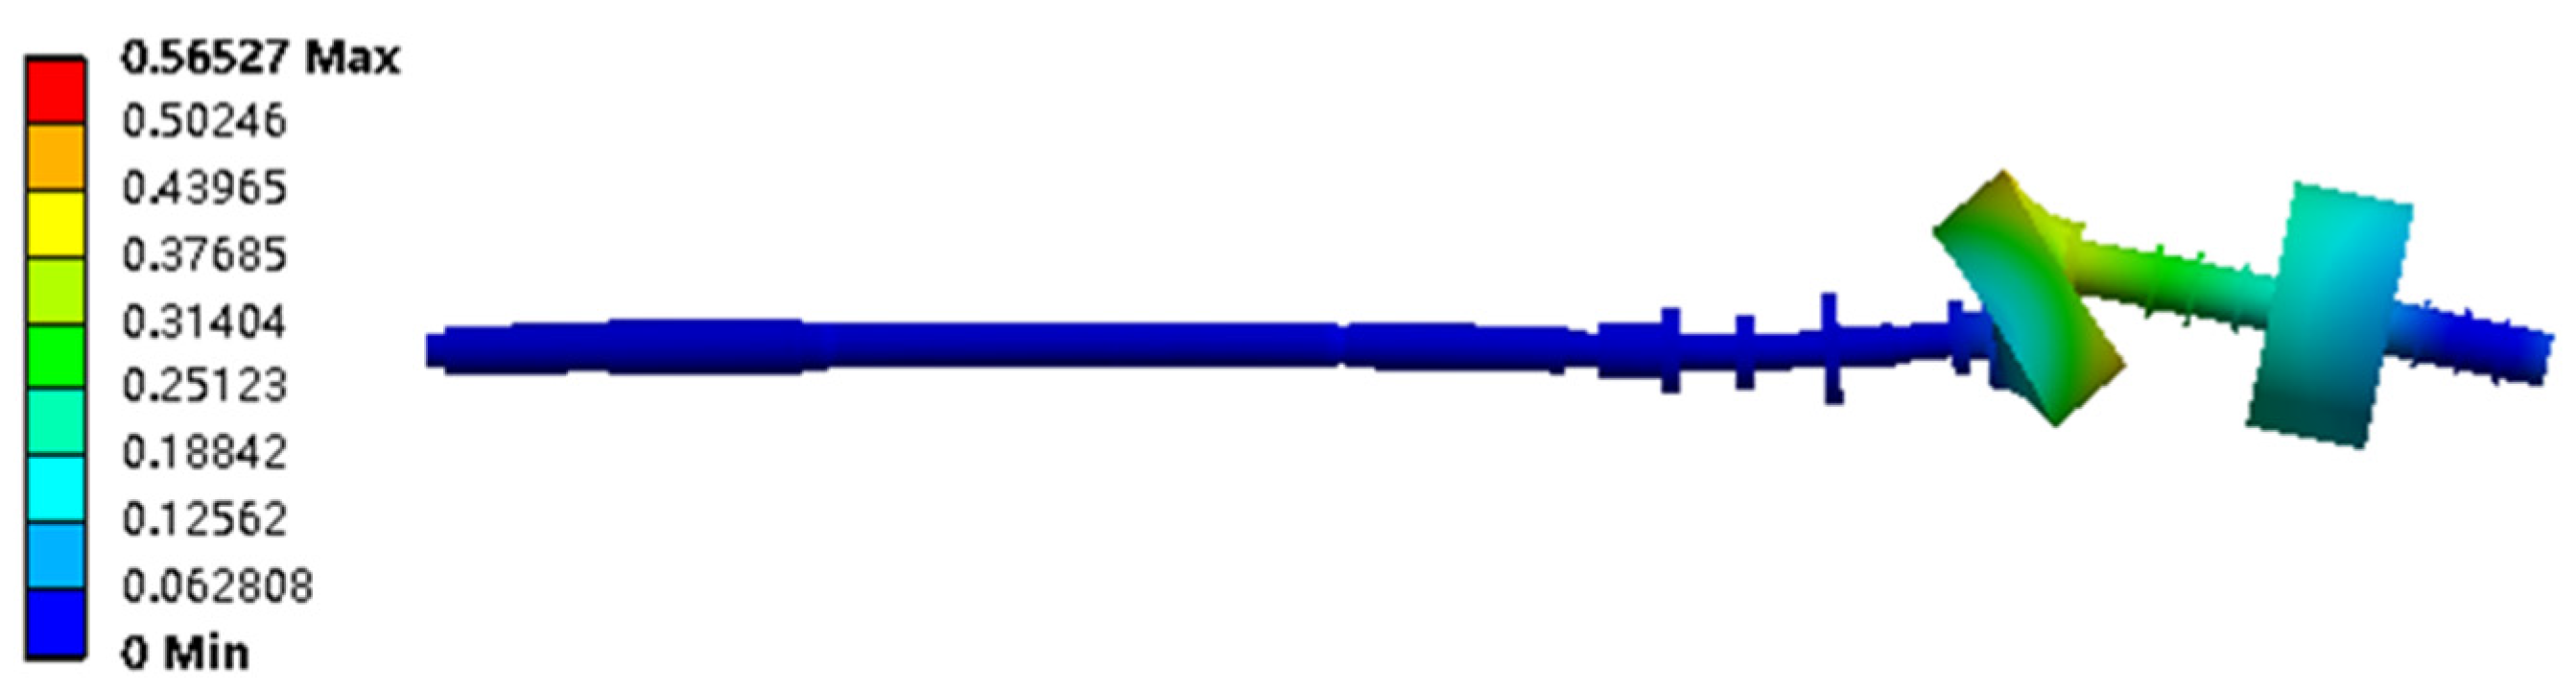
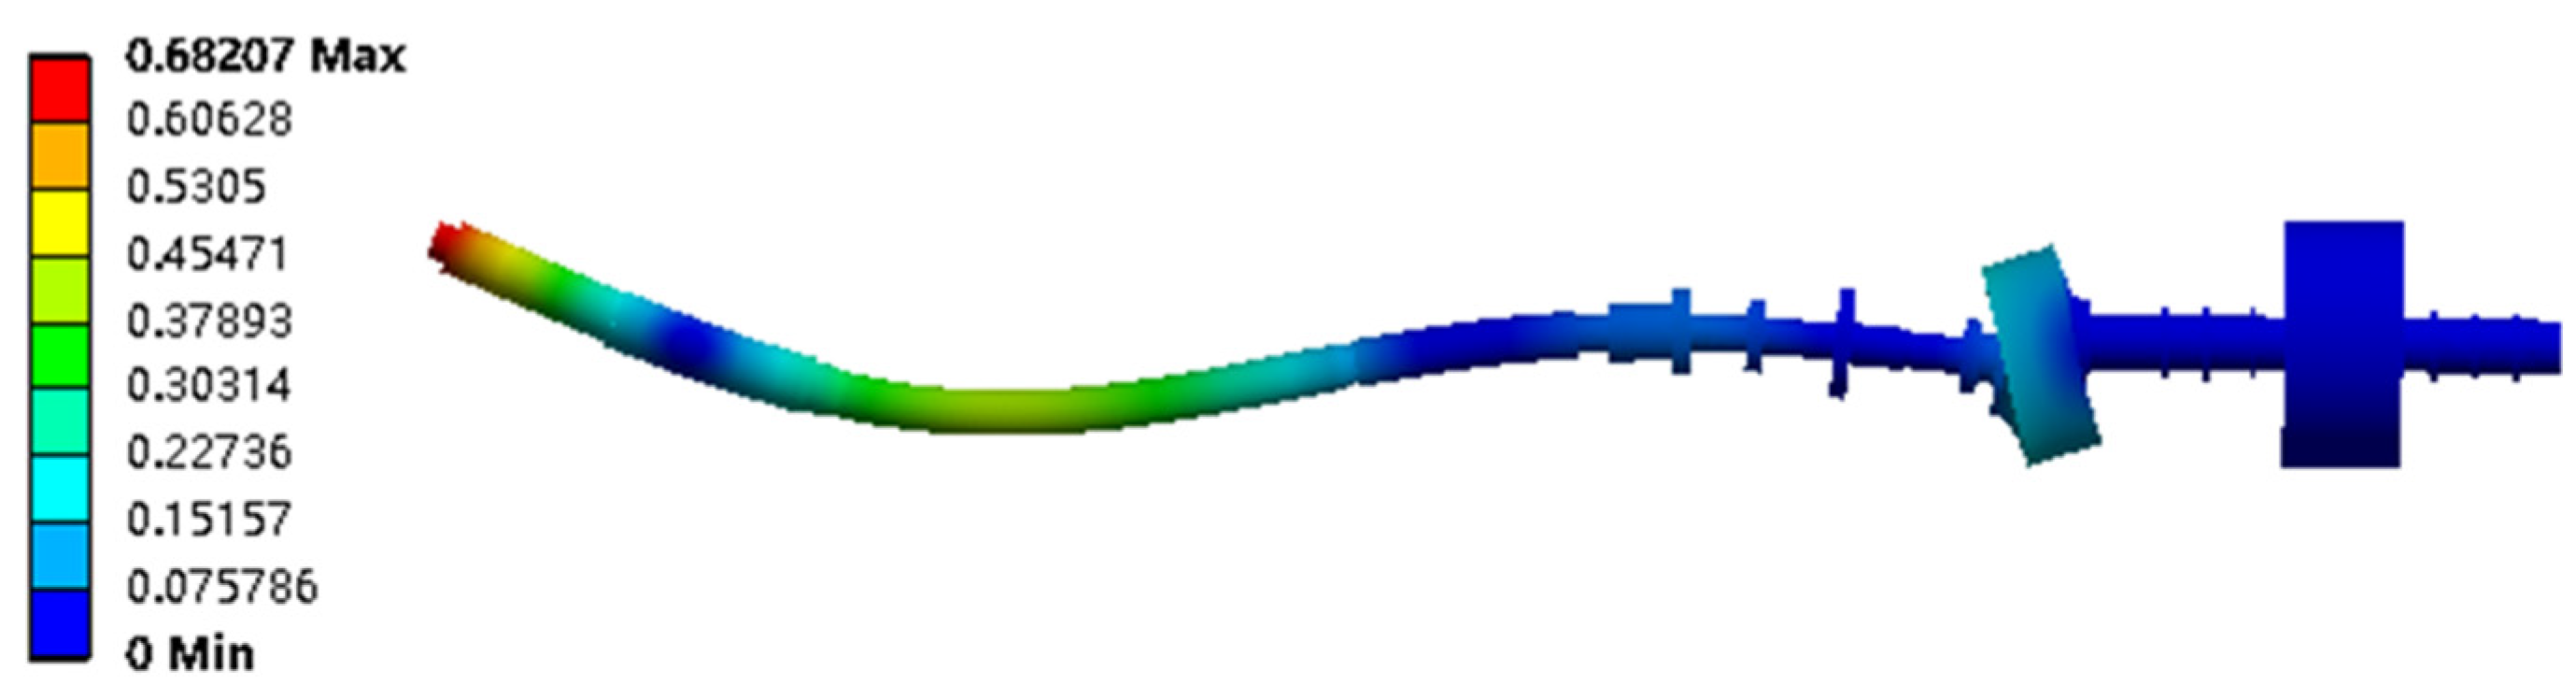
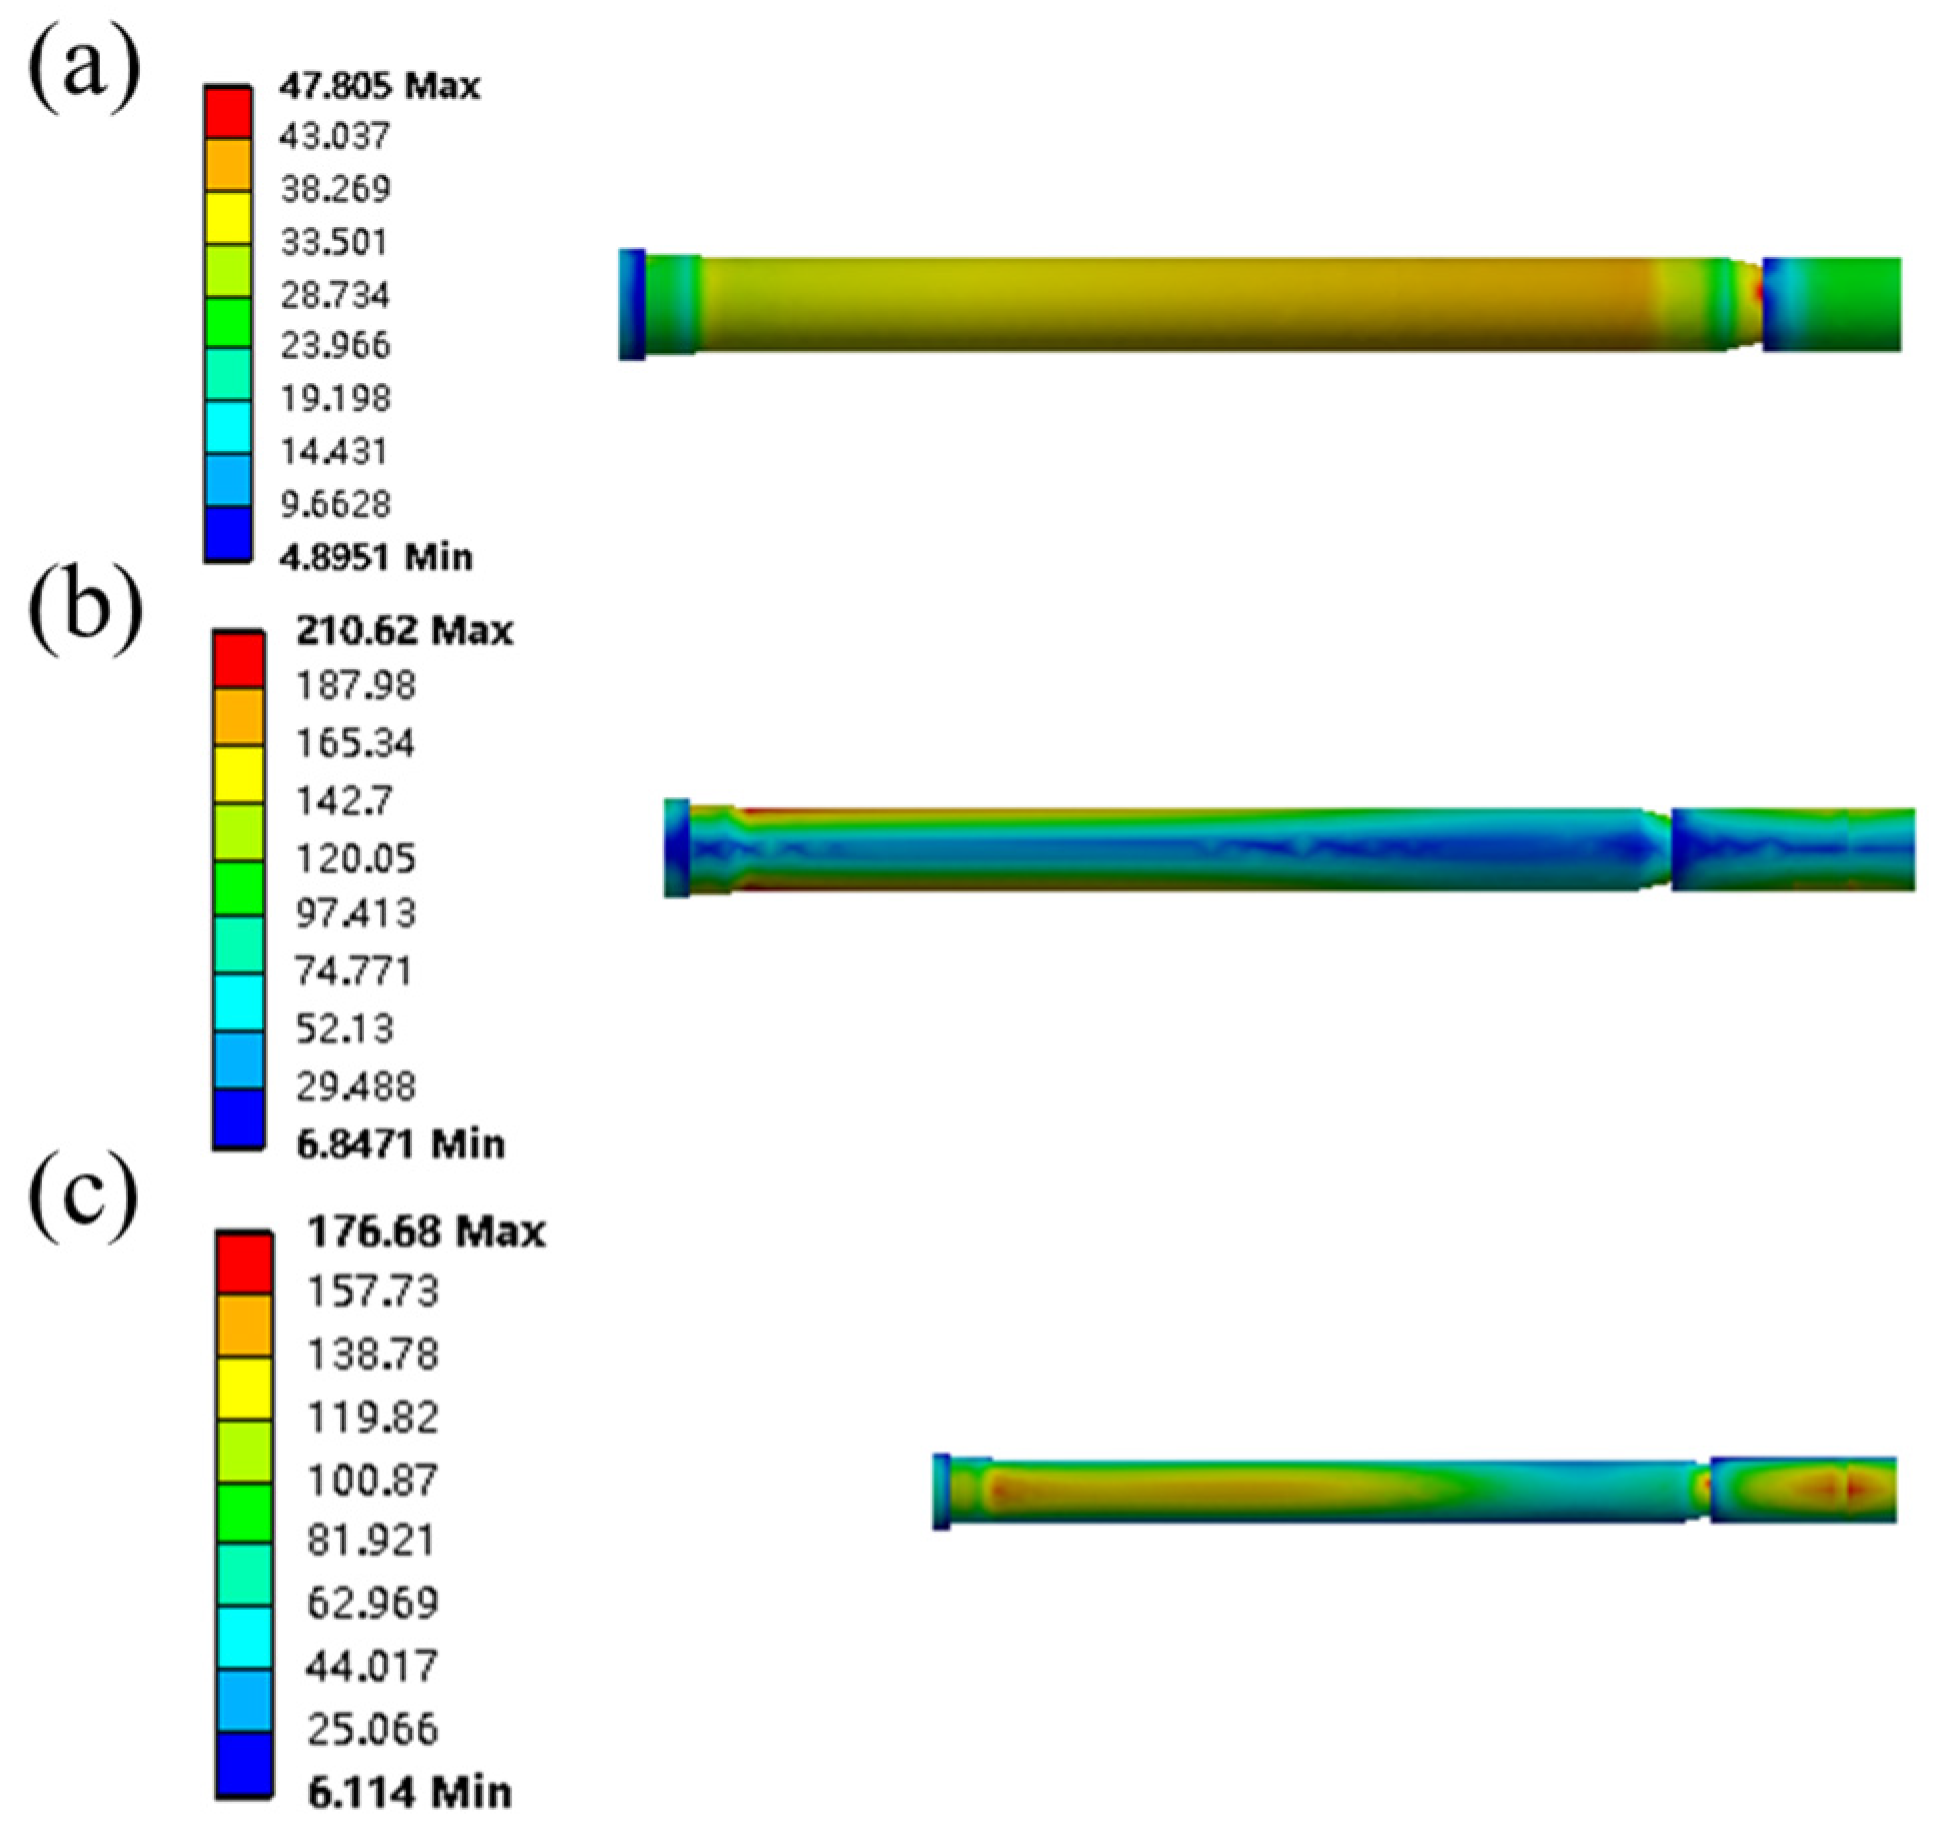
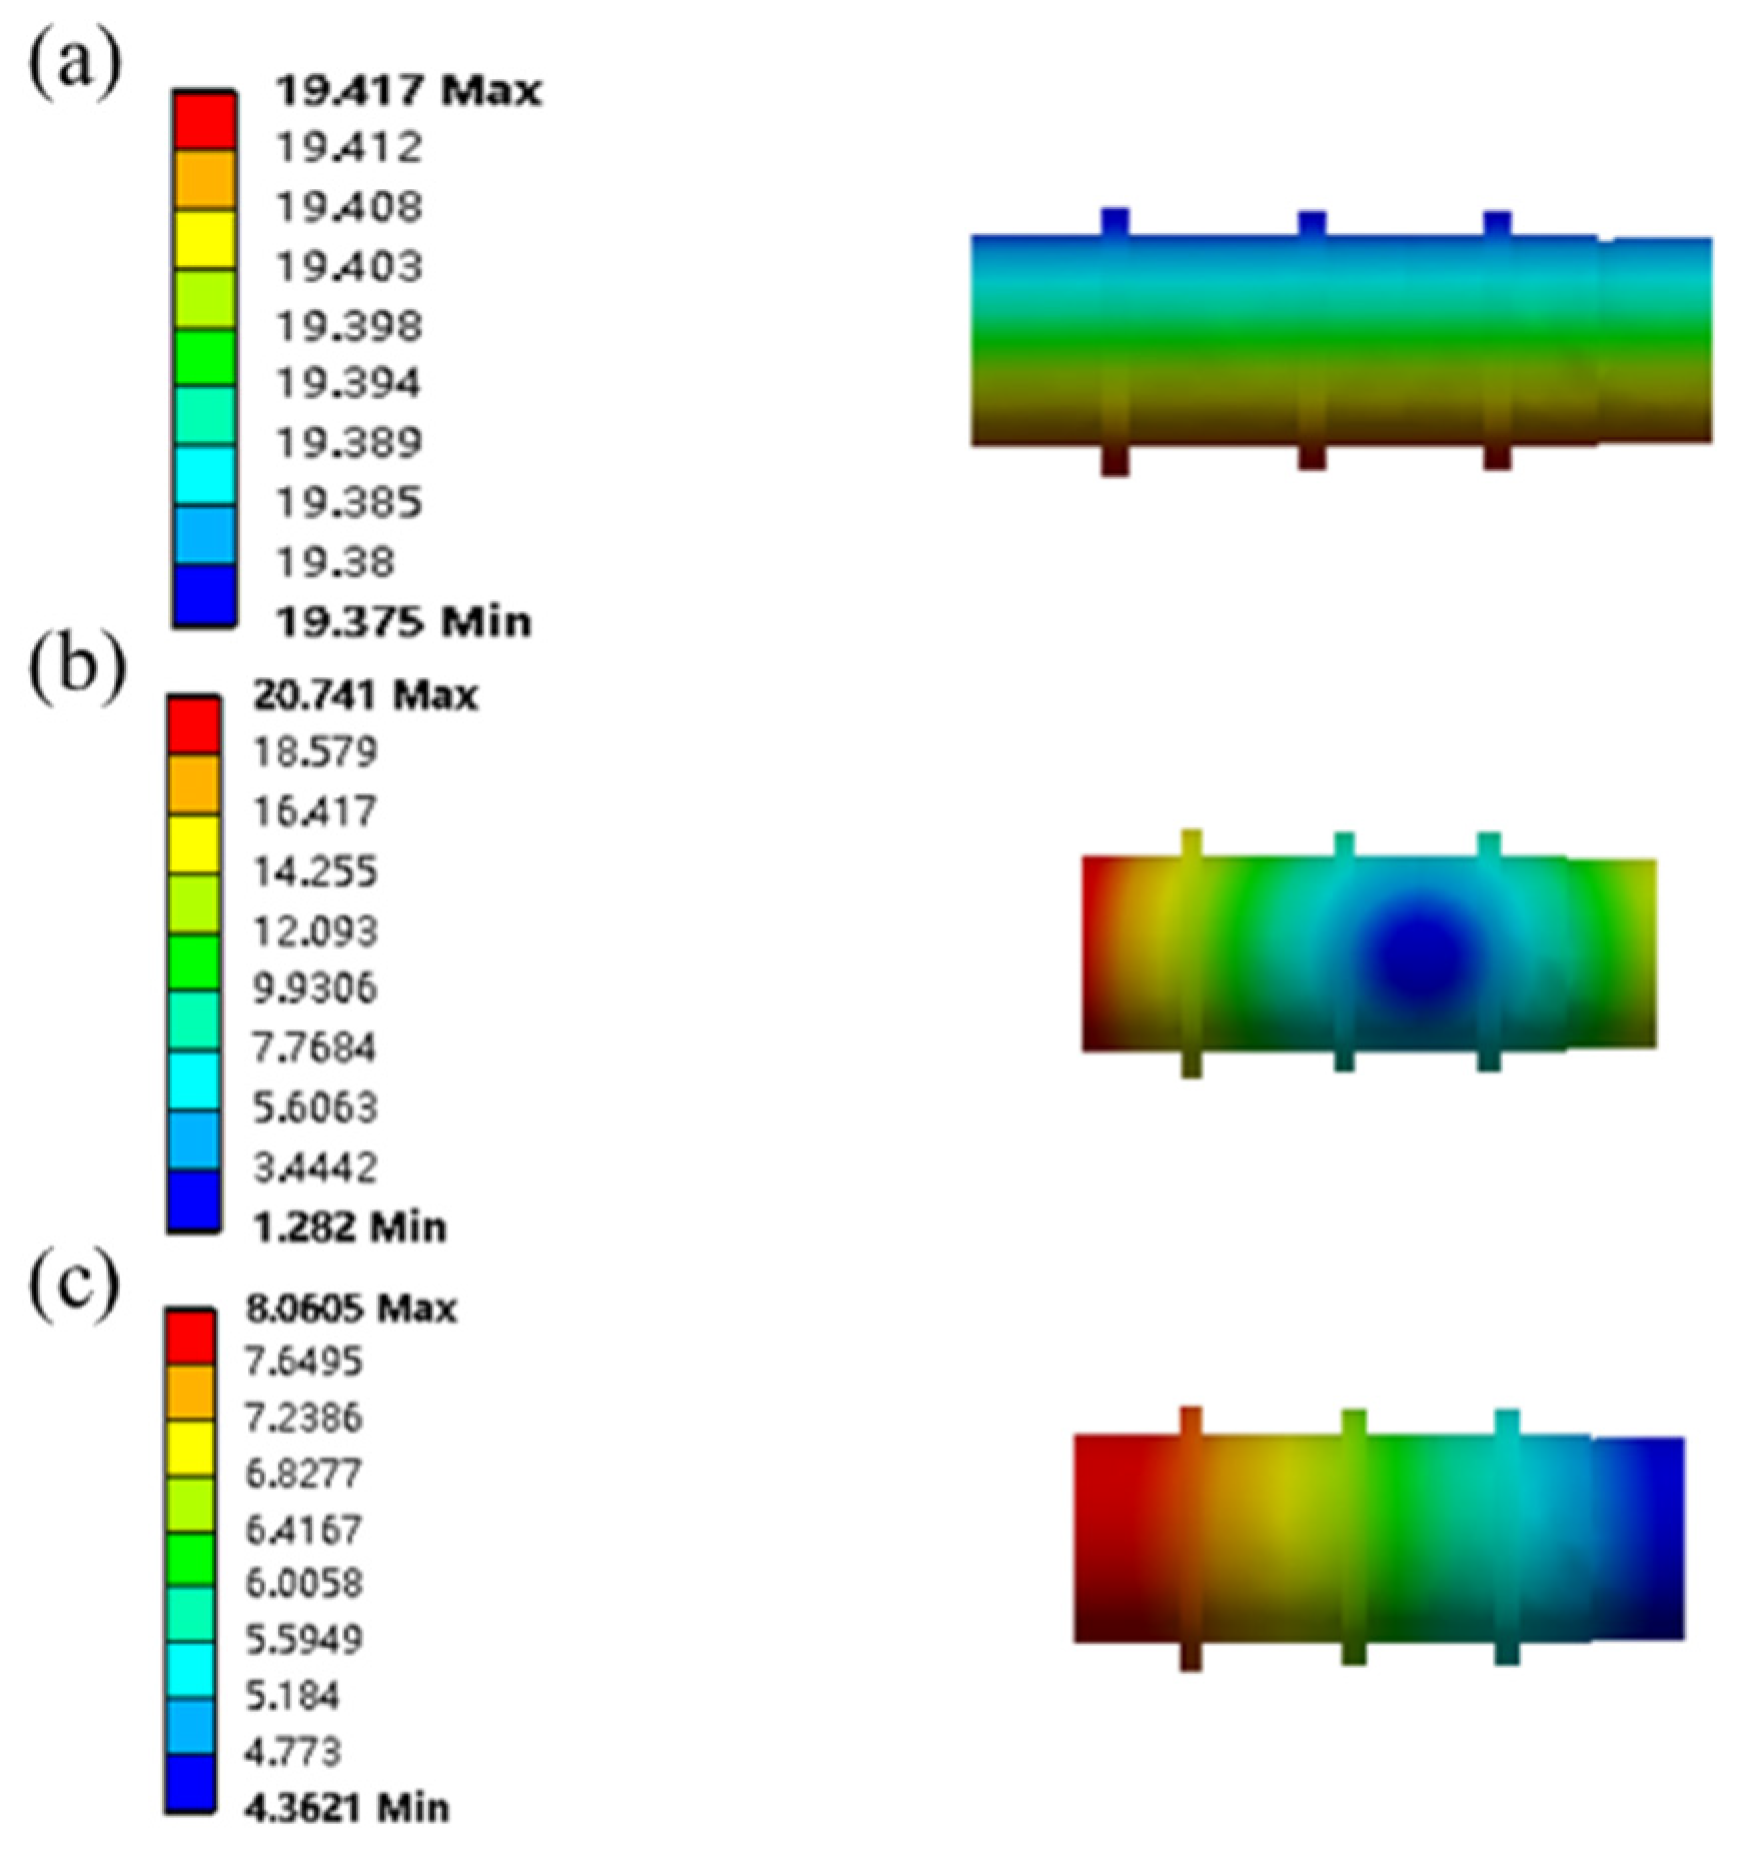
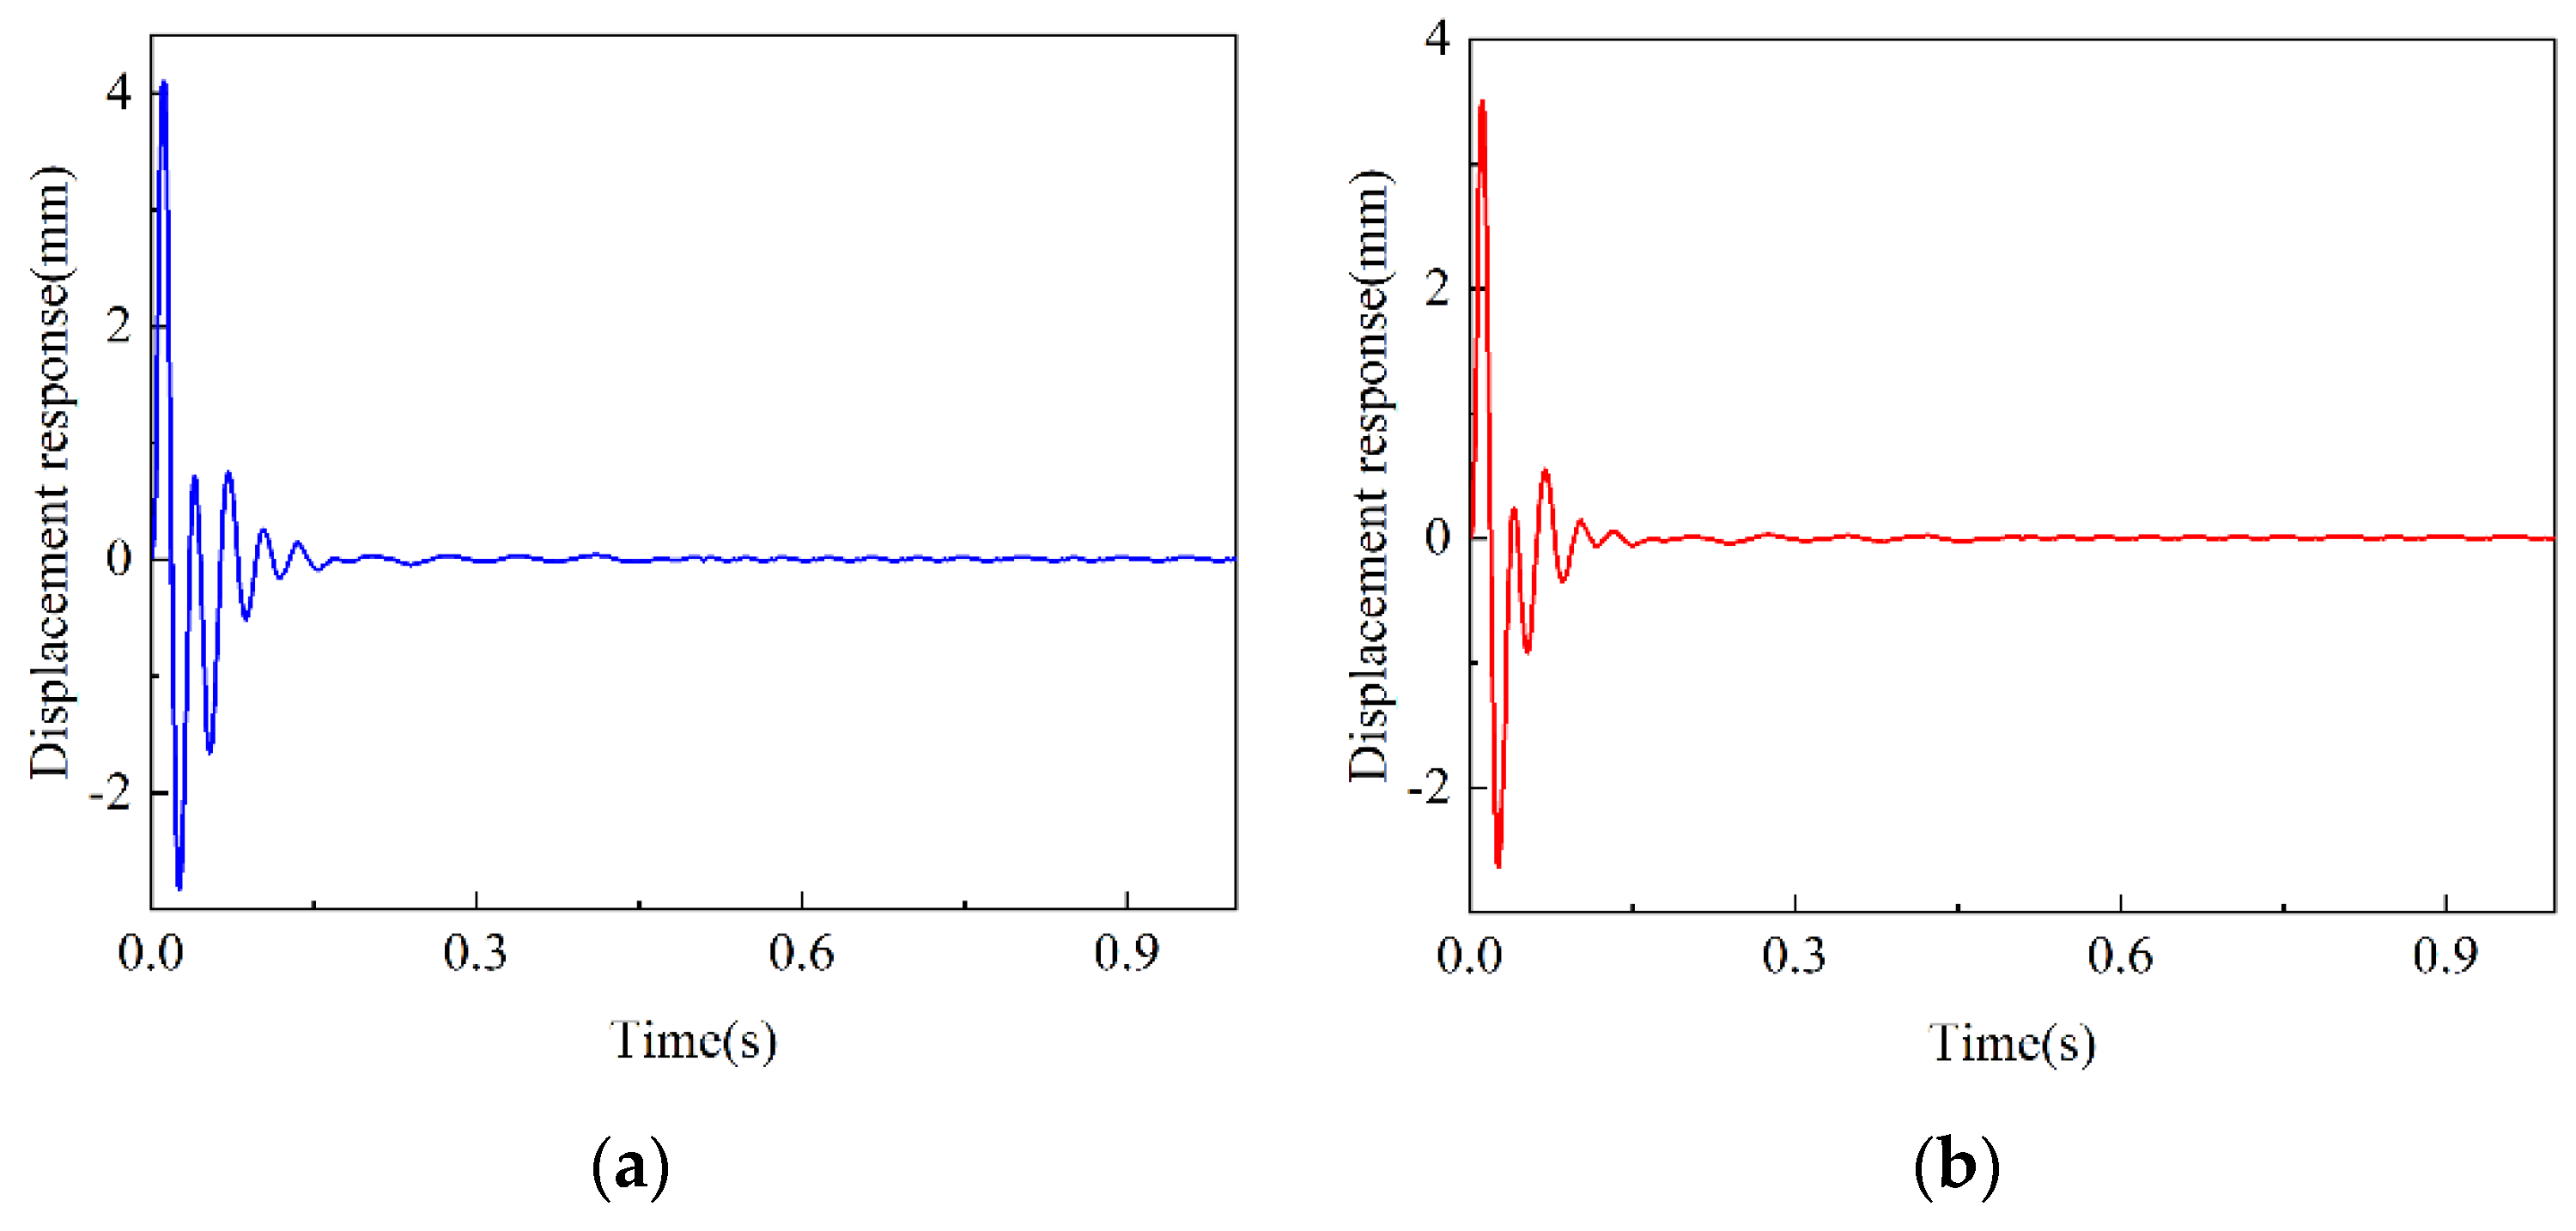
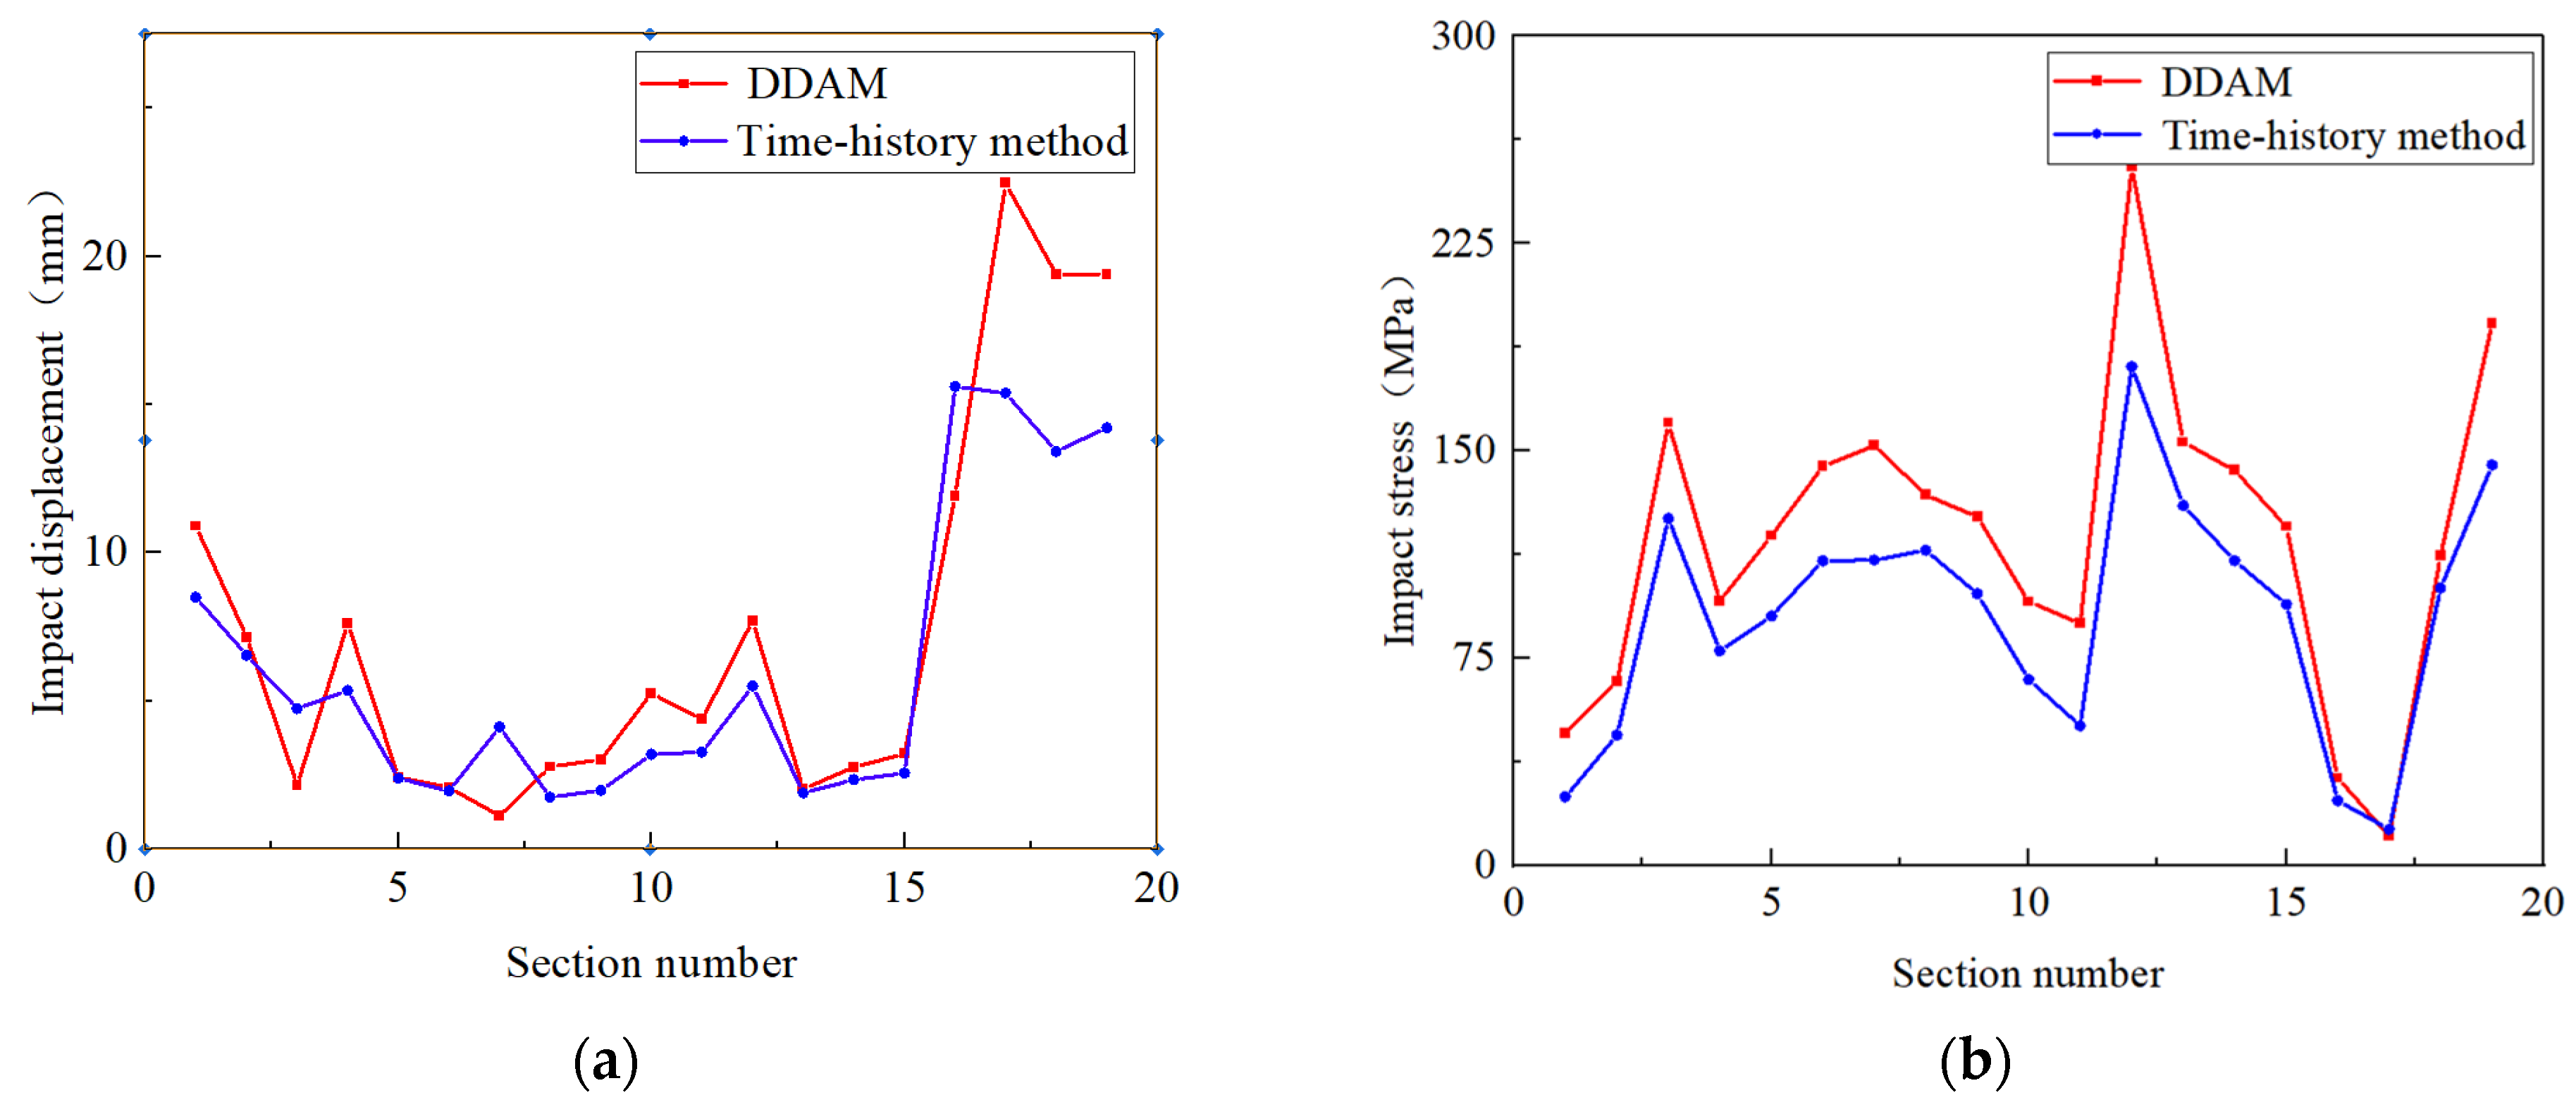
3.2. Analysis of Impact Response Results

The DDAM calculation yields the maximum impact response values of the propulsion shaft system after being subjected to an impact. In the finite element post-processing module, the impact displacement response and impact stress response results for each direction and each shaft segment can be extracted, as shown in Figure 11, Figure 12, Figure 13 and Figure 14, which depict the impact displacement response and stress response cloud diagrams for typical shaft segments in each direction of the propulsion shaft system. Additionally, the impact displacement or impact stress response at key sections defined during the modeling process can be extracted for verification against impact calculation results based on different equipment and different locations, as shown in Table 5 for the impact displacement response and impact stress response at key sections.
As can be seen from Figure 11 and Figure 12, it can be observed that the maximum impact displacement and maximum impact stress experienced by the tail shaft occur when subjected to vertical loading. The maximum impact displacement is 15.1 mm, and the maximum impact stress is 210.6 MPa. There are likely two contributing factors to the larger impact response between the tail shaft segments. Firstly, the tail shaft is directly connected to the propeller shaft, which, due to its short length and connection to the propeller, has a larger mass. This increases the force experienced by the latter half of the tail shaft. This can be directly observed from the propulsion shaft system’s straight-line state bearing load table in Section 2.3, which shows a relatively high load on the after-tail bearing. Secondly, the span between the after-tail bearing and the forward-tail bearing is relatively large, and the distance is further, which may result in a larger impact displacement response in the mid-to-rear end.
As can be seen from Figure 13 and Figure 14, when the motor shaft is subjected to a vertical impact, the impact displacement and impact stress represented on the impact response cloud diagram are relatively large. At this time, the maximum impact displacement is 20.7 mm, and the maximum impact stress is 382.9 MPa, mainly manifested in the connection displacement with the motor stator module. This is primarily due to the large mass of the motor stator itself, which results in more pronounced vertical displacement and stress responses upon impact.
From Table 5, which shows the impact response of key sections of the propulsion shaft system in different directions and components, it can be seen that the boundary conditions set for lateral impact displacement response are similar to those for vertical impact displacement response. Both rely on constraints set by springs with radial and lateral stiffness. Additionally, the role of bearings is consistent in both the vertical and lateral directions. Therefore, the magnitude of the displacement response to impact and the impact stress response at different locations under vertical and lateral impact loads corresponds to the relative magnitudes of the impact load spectra in the two directions. Since the overall vertical acceleration spectrum is greater than the lateral acceleration spectrum, the impact displacement response and impact stress response are greater in the vertical direction than in the lateral direction. From the impact displacement and impact stress responses of the key sections of the propulsion shaft system, it is observed that the vertical impact displacement and stress responses are larger, followed by the lateral responses, with the longitudinal responses being relatively smaller. The impact stress response levels at the bearing support points are also relatively higher than at other sections. When the propulsion shaft system is subjected to vertical and lateral impacts, the high-elasticity coupling bears the largest impact displacement, with a maximum vertical displacement of 22.47 mm. This is mainly due to the lower elastic modulus of the rubber components, which can serve to dampen and protect other equipment.

4. Time-History Method for Impact Resistance Calculation

The time-history impact calculation is primarily based on the German military standard BV043/85 [48], which conducts impact resistance calculations for equipment over a certain period. The impact response results can also be extracted based on the time history. In the calculation process, the load is applied through multiple load steps of time-history acceleration impact excitation. By defining the peak load, time step, and time function, the impact load is controlled and applied to the shafting system in the form of an acceleration field.

4.1. Shock Spectrum Calculation

In the time-domain impact of the propulsion shafting system, the shock input spectrum is typically represented by a trilinear shock spectrum for velocity, acceleration, and displacement. In the transformation between the frequency-domain and the time-domain, that is, the input of the impact load can be represented by the peak value, action time, and time-domain waveform. According to the Federal German Defense Navy BV043/85 ship specification, the trilinear shock input spectrum can be transformed into a combined triangular wave of impact acceleration time-domain variation curve, as shown in Figure 15.
The combined triangular wave has the following formulaic relationship:
a 2 = 0.6 × a 0
V 2 = 3 4 × V 0
t 3 = 2 × V 2 / a 2
( t 5 t 3 ) = 6 × 1.05 × d 0 1.6 × a 2 t 3 2 1.6 × a 2 t 3
a 4 = a 2 t 3 / ( t 5 t 3 )
t 4 = t 3 + 0.6 ( t 5 t 3 )
In the aforementioned equations, t 2 , t 3 , t 4 , t 5 , represent various time points, s; a 2 denotes the peak value of the positive pulse acceleration, mm/s2. a 4 signifies the peak value of the negative acceleration pulse, mm/s2. According to the specification requirements, when the mass of the equipment to be calculated exceeds 5 tons, it is necessary to consider the spectrum drop effect in the design spectrum. At this time, the impact load reduction coefficient ( A a 0 , A v 0 ) is considered, and the impact response value is affected by the reduction coefficient to become A a 0 , A v 0 :
Acceleration A a 0 :
A a 0 = ( M i M 0 ) 0.537
Velocity A v 0 :
A v 0 = ( M i M 0 ) 0.4
where M 0 is the equipment mass, 5 t; M i is the mass of the equipment subjected to impact, t.
It is known from establishing the three-dimensional model of the propulsion shafting system that the total mass of the propulsion shafting system is approximately 31.946 tons. According to the impact environment specified in the specification and combined with the spectrum drop effect, the combined triangular wave time-history curve of the propulsion shafting system is calculated. This method is only for the vertical and lateral directions. The calculated acceleration time-history curve parameters are shown in Table 6.
According to the acceleration time-history curve parameters in Table 6, five time steps are set for the simulation calculation. To see the triangular spectrum, the fifth step time is set to 0.1 s, and the impact of the acceleration time-history curves in the three directions are obtained. In the calculation, to analyze the state of the propulsion shafting system after being subjected to the impact load, the analysis time is selected to be 0.1 s. Due to the action of the system damping, the decay curve of the entire propulsion shafting system within 0.1 s after being subjected to the impact load can be obtained, which allows for a more intuitive analysis of the impact displacement response and stress response of the propulsion shafting system.

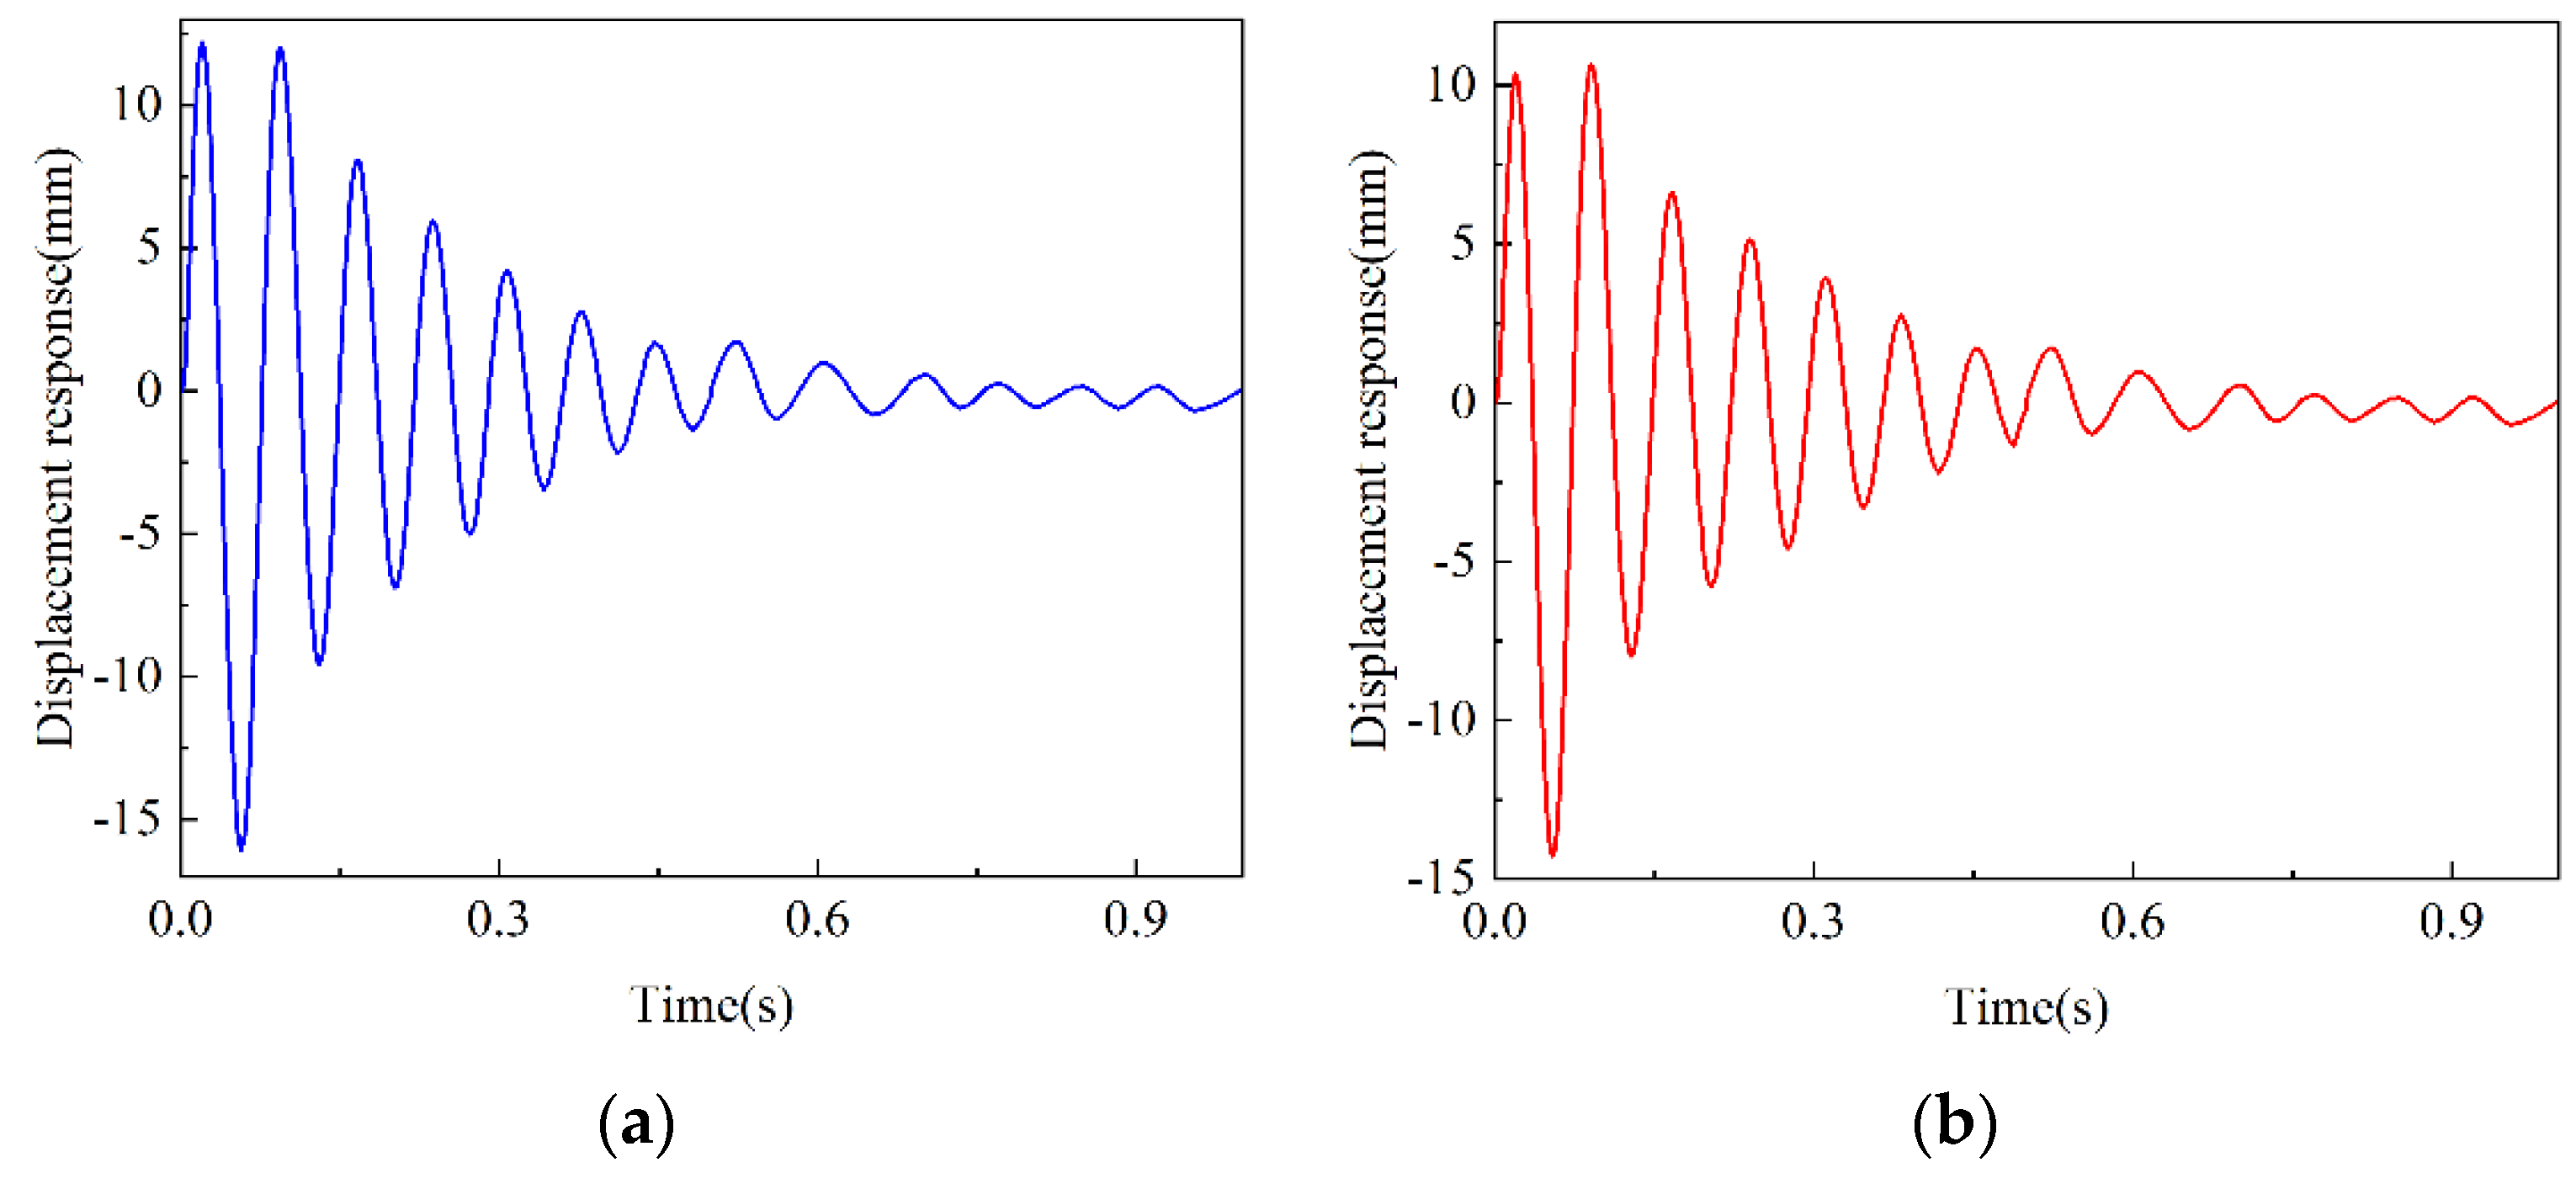
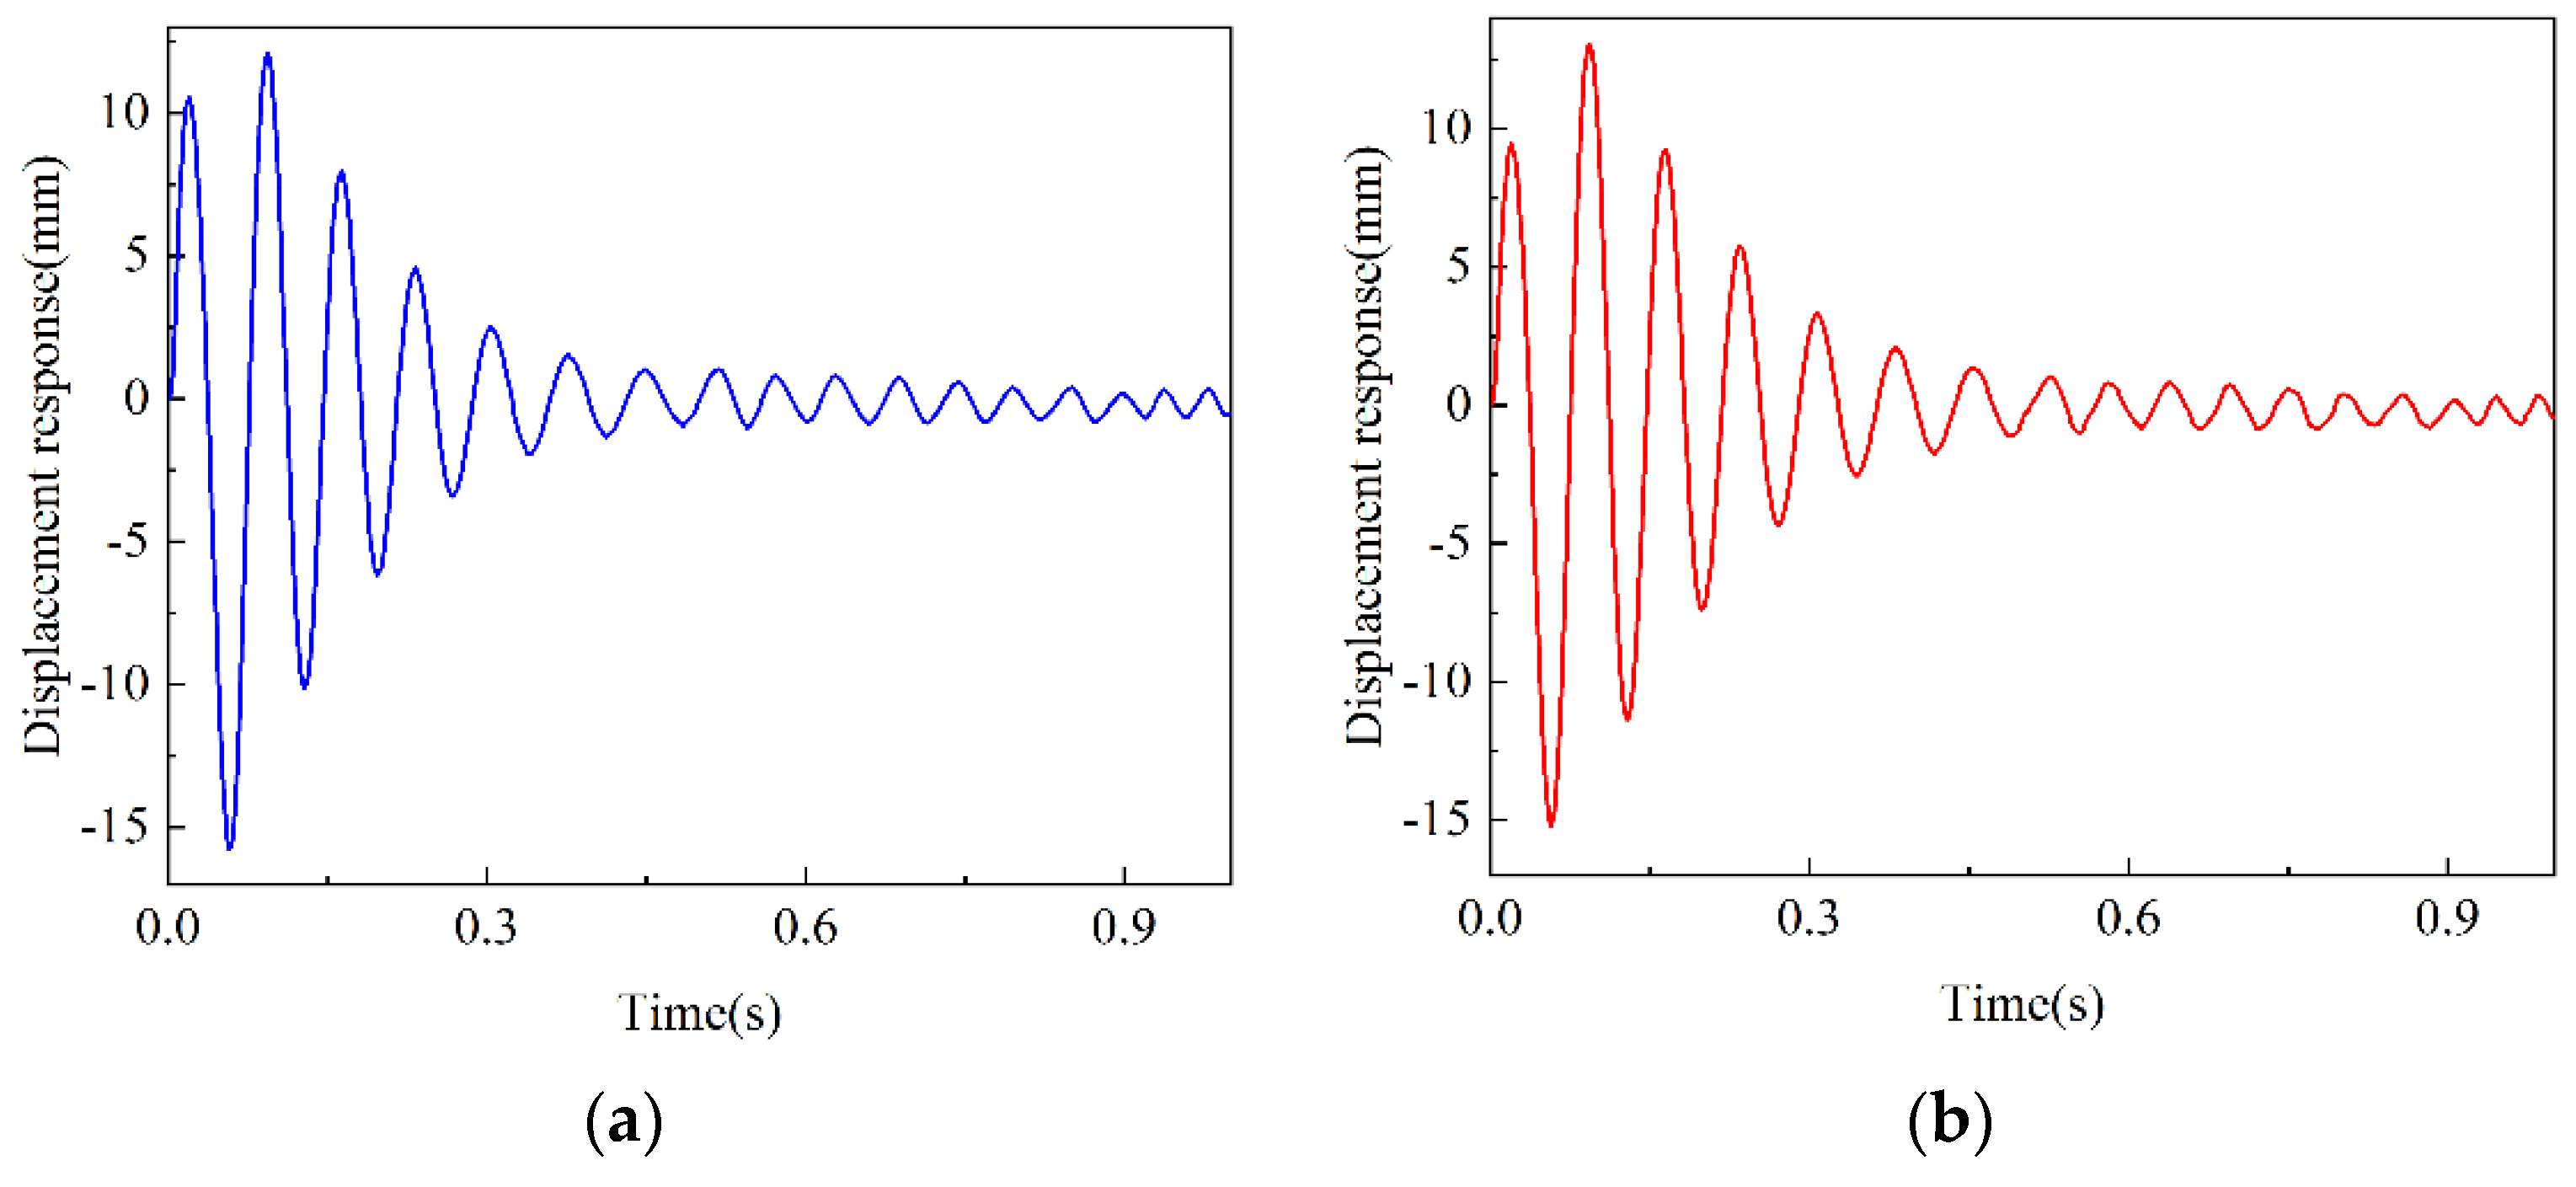
4.2. Impact Response Result Analysis

This section is based on the time-history method to calculate the maximum impact response value of the propulsion shafting system after being subjected to impact, as shown in Figure 16 and Figure 17, which are the cloud diagrams of displacement response and stress response of the propulsion shafting system in the vertical and lateral directions when subjected to impact. When performing impact calculations using the time-history method, the time set includes two parts as follows: the impact load duration and the response decay time. The impact load duration refers to the combined triangular wave excitation time, while the decay time is selected based on the convergence situation. A total time-history of 1 s is selected in this paper. Due to the large impact of the propeller mass on the after-stern bearing and the forward-stern bearing, and the high-elasticity coupling has a strong displacement compensation under the action of impact load, the time-domain method mainly focuses on the impact displacement response of the after-stern bearing, the forward-stern bearing, and the master and slave ends of the high-elasticity coupling under this working condition, as shown in Figure 18, Figure 19, Figure 20 and Figure 21.
From Figure 16 and Figure 17, it can be seen that the vertical impact displacement response of the propulsion shafting system is greater than the lateral impact displacement response; the vertical impact stress response is greater than the lateral impact stress response. Similar to the dynamic design analysis method, the impact stress of the shaft segments is all manifested at the tail shaft, which may be mainly affected by the larger mass of the propeller, increasing the force situation of the latter half of the tail shaft. It may also be that the span between the after-stern bearing and the forward-stern bearing is larger and the distance is further, resulting in larger impact displacement and stress response of the tail shaft.
From Figure 18, Figure 19, Figure 20 and Figure 21, it can be seen that based on the time-domain method for impact resistance calculation of the propulsion shafting system, the impact displacement of the master and slave ends of the high-elasticity coupling is large, and the displacement amplitude results are equal. This is mainly due to the smaller density of the rubber components of the high-elasticity coupling and the larger Poisson’s ratio, which can compensate for the displacement. The vertical impact response and the lateral impact response of different components have the same amplitude and trend, and under the action of the impact load, the displacement response curve fluctuates back and forth between positive and negative. This is mainly because when the system is subjected to impact, it will produce an inertial force opposite to it, making the displacement amplitude and the torque of the impact force in the previous instantaneous state opposite, and finally, the displacement amplitude curve gradually converges and decreases to zero under the action of the system damping.

5. Discussion

In the finite element model simulation calculations of the propulsion shafting system containing an equivalent model of a high-elasticity coupling, the dynamic design analysis method and the time-history method for impact input loads are based on GJB1060.1-91 and BV043/85, respectively. The impact load value of the dynamic design analysis method is related to the modal mass of the propulsion shafting system; the time-history method, on the other hand, is a time-history curve derived from the equipment’s mass combined with the standard impact spectrum. A comparative analysis of the results from the impact resistance calculations of the propulsion shafting system using both the dynamic design analysis method and the time-history method indicates that the trends and patterns of the impact responses are essentially the same, although the degrees of response vary. Moreover, the vertical vibration amplitudes of the impact displacement and impact stress are generally larger than those in the axial and transverse directions. To compare the results of the two calculation methods, the impact stress response and displacement response of different vertical shaft sections of the propulsion shafting system are compared, as shown in Figure 22, which compares the maximum displacement and maximum equivalent stress results at different sections in the vertical direction of the propulsion shafting system.
Figure 22 indicates that the trends of the computational results from both the dynamic design analysis method and the time-history method are generally similar, although they differ in amplitude of vibration. However, there are noticeable differences in the stern and bow bearing support cross-sections. From the displacement response comparison chart, Section 1, which is the propeller position, exhibits a larger displacement response. The dynamic design analysis method calculates a displacement of 10.9 mm, while the time-history method also yields a significant displacement of 8.5 mm. The trend of displacement response then decreases, primarily due to the proximity to the stern bearing. Additionally, Section 17, which is the driven end of the high-elasticity coupling, shows the maximum impact displacement calculated by the dynamic design analysis method, reaching up to 22.47 mm. This is mainly attributed to the lower radial stiffness of the thrust bearing, resulting in a larger vertical impact displacement response. Sections 18 and 19 correspond to the simplified motor bearing support points, where the vertical displacement response is also larger due to the larger mass of the motor rotor and the lower radial stiffness of the motor bearing. From the stress response comparison chart, it is observed that the stress levels at each bearing support point are relatively high, especially at the thrust bearing support point where the impact stress is notably higher, while the impact stress levels of the motor bearing, stern bearing, and bow bearing are slightly lower. Through a comparative analysis of the results from the two methods, it is evident that in the impact resistance calculations for the propulsion shafting system, the results from the dynamic design method are slightly greater than those from the time-history method, with the former’s results being more conservative.

6. Conclusions

This paper presents a case study of an electric propulsion shaft system, establishing a finite element model that includes an equivalent model of a high-elasticity coupling for the propulsion shaft system. The impact resistance performance is simulated using both the DDAM method and the time-history method. Through the analysis of the computational results, the following conclusions are drawn:
(a) Simulation calculations of the impact resistance for a finite element model of a propulsion shafting system containing an equivalent model of a high-elasticity coupling using different computational methods indicate that the equivalent model is convenient for modeling and has a higher computational speed, which allows for rapid forecasting of the impact resistance characteristics of a propulsion shafting system containing a high-elasticity coupling.
(b) Comparative analysis of the impact resistance simulation results for a ship’s electric propulsion shafting system containing a high-elasticity coupling using the Dynamic Design Analysis Method (DDAM) and the time-history method demonstrates the accuracy of the established equivalent model of the high-elasticity coupling.
(c) Comparison of the impact resistance calculation results between DDAM and the time-history method reveals that the maximum impact displacement calculated by DDAM is 22.47 mm, occurring at the driven end of the high-elasticity coupling, and the maximum impact stress is 252.67 MPa, occurring at the thrust bearing support point. The time-history method calculates a maximum impact displacement of 15.61 mm, also at the driven end of the high-elasticity coupling, while the maximum impact stress is 180.45 MPa, occurring at the thrust bearing support point. The impact response results from the DDAM method are relatively larger, and the calculations tend to be conservative.
(d) Based on the impact resistance calculations for the propulsion shafting system using DDAM and the time-history method, the impact displacement of the high-elasticity coupling is less than its radial displacement compensation range (±24 mm); the impact stress of each shaft section is much lower than the allowable stress of the shaft section, which is 530 MPa. This indicates that the electric propulsion shafting system containing the high-elasticity coupling can safely operate under this impact load.
(e) Through the application of diverse methodologies in the investigation of the impact resistance performance of electric propulsion shaft systems incorporating high-elastic couplings, this research has furnished both the empirical data and theoretical underpinnings for the future design selection and predictive modeling of impact resistance for a variety of shaft systems and high-elastic couplings with distinct structural configurations.

Author Contributions

Conceptualization, Methodology, Investigation, Writing—Original Draft, Writing—Review and Editing, Y.G.; Conceptualization, Methodology, Formal Analysis, Investigation, Writing—Original Draft, Z.M.; Resources, Supervision, Funding Acquisition, Validation, R.Z.; Conceptualization, Methodology, Formal Analysis, J.W.; Formal Analysis, Validation, Z.Y. All authors have read and agreed to the published version of the manuscript.

Funding

This research was funded by the National Natural Science Foundation of China’s Major Program (Project No.: 51839005): For the theory and technology for the control-oriented intelligent installation of large marine propulsion shafting, the funder is Zhou Ruiping.

Institutional Review Board Statement

Not applicable.

Informed Consent Statement

Not applicable.

Data Availability Statement

The data that support the findings of this study are available from the corresponding author upon reasonable request.

Conflicts of Interest

The authors declare no conflicts of interest.

References

  1. Cheng, S.; Wang, S.; Chen, G. Evaluation Study on Shock Damage of Ship Subjected to Blasting Warhead Far-Field Underwater Explosion. Chin. J. Ship Res. 2014, 9, 19–25. [Google Scholar] [CrossRef]
  2. Liu, W.; Lin, T.; He, Z. Analysis of Shock Resistance on GWC6066 Marine Gearbox. Appl. Mech. Mater. 2014, 602, 135–138. [Google Scholar] [CrossRef]
  3. Hao, E.; Liu, Y.Z.; Liu, C.G. Numerical simulation of monopile foundation of an offshore wind turbine subjected to ship impact. J. Vib. Shock 2015, 34, 7–13. [Google Scholar] [CrossRef]
  4. Zhang, W.; Yao, X.; Wang, Z.; Wang, Y. Research on shock resistance of shipborne equipment based on multibody system discrete-time transfer matrix method. Ships Offshore Struct. 2022, 17, 1522–1531. [Google Scholar] [CrossRef]
  5. Wang, X.; Li, X.; Ma, X.; Du, G. Numerical analysis on spectrum dip characteristics of shock response spectrum of submarine equipment. Chin. J. Ship Res. 2019, 14, 31–37. [Google Scholar] [CrossRef]
  6. Hu, H.; Zhou, R.; Zhou, Z.; Liu, Y. Analysis and optimization of resistance characteristics of submarine snorkel air-intake valve. Chin. J. Ship. Res. 2019, 14, 85–89. [Google Scholar] [CrossRef]
  7. Hong, S.; Wang, W. Research on impact resistance of ship launching device. Ship. Elect. Eng. 2010, 30, 169–171. [Google Scholar] [CrossRef]
  8. He, X.; Li, G.; Xing, P.; Lu, L.; Gao, H.; Zhang, H.; Wang, G. Experimental and numerical investigation on dynamic characteristics of ship propulsion shafting under uncertainty based on displacement response. Ocean Eng. 2021, 237, 109637. [Google Scholar] [CrossRef]
  9. Liang, C.; Yang, M.; Tai, Y. Prediction of shock response for a quadrupod-mast using response spectrum analysis method. Ocean Eng. 2002, 29, 887–914. [Google Scholar] [CrossRef]
  10. Camargo, F. Survey on Experimental and Numerical Approaches to Model Underwater Explosions. J. Mar. Sci. Eng. 2019, 7, 15. [Google Scholar] [CrossRef]
  11. Pang, F.; Qin, Y.; Tang, Y.; Gao, C.; Li, H. Experimental study on impact response of seaborne rocket launch platform. Ocean Eng. 2023, 280, 114623. [Google Scholar] [CrossRef]
  12. Zhu, J.; Wei, G.; Peng, Z.; Xia, Z.; Zheng, L.; Zhu, H. Analysis of underwater explosion shock on ship shaft stern bearing lubrication characteristics under different bearing working conditions. Int. J. Nav. Archit. Ocean Eng. 2022, 14, 100444. [Google Scholar] [CrossRef]
  13. Liang, P.; Li, X.; Guo, F.; Cao, Y.; Zhang, X.; Jiang, F. Influence of sea wave shock on transient start-up performance of water-lubricated bearing. Tribol. Int. 2022, 167, 107332. [Google Scholar] [CrossRef]
  14. Long, X.; Liu, L.; Ji, S. Discrete Element Analysis of Ice-Induced Vibrations of Offshore Wind Turbines in Level Ice. J. Mar. Sci. Eng. 2023, 11, 2153. [Google Scholar] [CrossRef]
  15. Huang, X.; Mao, J.; Luo, X.; Du, P.; Ouahsine, A. Dynamic Response of a Warship’s Metal-Jet-Damaged Double-Layer Plates Subjected to the Subsequent Underwater Explosion. J. Mar. Sci. Eng. 2024, 12, 854. [Google Scholar] [CrossRef]
  16. Ley, J.; Moctar, O. A Comparative Study of Computational Methods for Wave-Induced Motions and Loads. J. Mar. Sci. Eng. 2021, 9, 83. [Google Scholar] [CrossRef]
  17. Mannacio, F.; Barbato, A.; Marzo, F.; Gaiotti, M.; Rizzo, C.; Venturini, M. Shock effects of underwater explosion on naval ship foundations: Validation of numerical models by dedicated tests. Ocean Eng. 2022, 253, 111290. [Google Scholar] [CrossRef]
  18. Liu, Z.; Zhou, X.; Xiao, L.; Li, X.; Lin, F. Dynamic response and damage characteristics of special blast-resistant door structure subjected to underwater explosion. Struct 2023, 57, 105262. [Google Scholar] [CrossRef]
  19. Ni, B.; Chen, Z.; Zhong, K.; Li, X.; Xue, Y.Z. Numerical Simulation of a Polar Ship Moving in Level Ice Based on a One-Way Coupling Method. J. Mar. Sci. Eng. 2020, 8, 692. [Google Scholar] [CrossRef]
  20. Cao, J.; Sun, F.; Shen, S.; Sun, W.; Ye, X. Analysis of impact resistance and influencing factors of sleeve-type hydraulic coupling based on DDAM. Ship Sci. Technol. 2023, 45, 51–57. [Google Scholar] [CrossRef]
  21. Paul, G.; Steven, L. Auxiliary turbine generator set isolation system design for us naval vessel. In Turbo Expo: Power for Land, Sea, and Air; American Society of Mechanical Engineers: New York, NY, USA, 2012. [Google Scholar] [CrossRef]
  22. Hu, H.; Li, X.; Wang, C.; Rheem, C.; Chen, W. Study on the flooding characteristics of damaged barges with dynamic explosive deformation. Int. J. Nav. Archit. Ocean Eng. 2024, 16, 100589. [Google Scholar] [CrossRef]
  23. Kwak, M.; Yoon, J.; Park, S.; Kwon, S.; Shin, Y.; Noh, Y. Extent of damage analysis of naval ships subject to internal explosions. Int. J. Nav. Archit. Ocean Eng. 2023, 15, 100514. [Google Scholar] [CrossRef]
  24. Xie, Z.; He, S.; Wu, X. Anti-shock optimization of a certain gas turbine foundation by DDAM. Adv. Mat. Res. 2010, 129, 376–380. [Google Scholar] [CrossRef]
  25. Rakotomalala, Q.; Khoun, L.; Leblond, C.; Sigrist, J. An advanced semi-analytical model for the study of naval shock problems. J. Sound Vibr. 2021, 511, 116317. [Google Scholar] [CrossRef]
  26. Cui, L.; Zhou, R.; Wang, S.; Chen, Y. Research on Shock Resistance of Ship Propulsion Shafting with Flexible Coupling. Ship Build. China 2023, 64, 61–72. [Google Scholar] [CrossRef]
  27. Kim, J.; Park, Y.; Park, M.; Lee, J.; An, S. Evaluation of the Shock Resistance of a Gas Turbine Package. Trans. Korean Soc. Mech. Eng. A 2017, 41, 1005–1009. [Google Scholar] [CrossRef]
  28. Yang, Y.; Wang, X.; Wang, M.; Wu, Y.; Dai, Y. Torsional-longitudinal impact response of ship propulsion shafting system. J. Vib. Shock 2017, 36, 96–102. [Google Scholar] [CrossRef]
  29. Wang, Y.; Yu, R.; Chen, R. Shock Response Analysis for a Propulsion Shaft System in Time Domain. Appl. Mech. Mater. 2011, 58, 2534–2539. [Google Scholar] [CrossRef]
  30. Küçükarslan, S. Time domain dynamic analysis of piles under impact loading. Soil Dyn. Earthq. Eng. 2002, 22, 97–104. [Google Scholar] [CrossRef]
  31. Liu, T.; Wang, J.; Liu, K.; Zhao, X. Experimental and Numerical Prediction of Slamming Impact Loads Considering Fluid–Structure Interactions. J. Mar. Sci. Eng. 2024, 12, 733. [Google Scholar] [CrossRef]
  32. Zhao, N.; Zhang, J.; Ma, W.; Jiang, Z.; Mao, Z. Variational time-domain decomposition of reciprocating machine multi-impact vibration signals. Mech. Syst. Signal Proc. 2022, 172, 108977. [Google Scholar] [CrossRef]
  33. Zhu, L.; Duan, L.; Chen, M.; Yu, T.; Pedersen, P. Equivalent design pressure for ship plates subjected to moving slamming impact loads. Mar. Struct. 2020, 71, 102741. [Google Scholar] [CrossRef]
  34. Piscopo, V.; Scamardella, A.; Rossi, G.; Crenna, F.; Berardengo, M. Fatigue Assessment of Moorings for Floating Offshore Wind Turbines by Advanced Spectral Analysis Methods. J. Mar. Sci. Eng. 2022, 10, 37. [Google Scholar] [CrossRef]
  35. Wang, Q.; Yu, P.; Chang, X.; Fan, G.; He, G. Research on the bow-flared slamming load identification method of a large container ship. Ocean Eng. 2022, 266, 113142. [Google Scholar] [CrossRef]
  36. Zhang, B.; Dong, R.; Li, W.; Zhao, Y.; Wang, G.; Zhang, D. Numerical Simulation of Extreme Ice Loads on Complex Pile Legs of Offshore Substation Structures. J. Mar. Sci. Eng. 2024, 12, 838. [Google Scholar] [CrossRef]
  37. Zhao, W.; Leira, B.; Høyland, K.; Kim, E.; Feng, G.; Ren, H. A Framework for Structural Analysis of Icebreakers during Ramming of First-Year Ice Ridges. J. Mar. Sci. Eng. 2024, 12, 611. [Google Scholar] [CrossRef]
  38. Wang, C.; Gong, J.; Zhang, Y.; Liu, L.; Lou, M. Investigating Load Calculation for Broken Ice and Cylindrical Structures Using the Discrete Element Method. J. Mar. Sci. Eng. 2024, 12, 395. [Google Scholar] [CrossRef]
  39. Chung, J.; Shin, Y. Simulation of dynamic behaviour of high-speed catamaran craft subjected to underwater explosion. Ships Offshore Struct. 2014, 9, 387–403. [Google Scholar] [CrossRef]
  40. Sigrist, J.; Broc, D. A versatile method to calculate the response of equipment mounted on ship hulls subjected to underwater shock waves. Finite Elem. Anal. Des. 2023, 218, 103917. [Google Scholar] [CrossRef]
  41. Iakovlev, S.; Gaudet, J.; Dooley, G.; MacDonald, B. Hydrodynamic fields induced by the shock response of a fluid-filled submerged cylindrical shell containing a rigid co-axial core. J. Sound Vibr. 2010, 329, 3359–3381. [Google Scholar] [CrossRef]
  42. Iakovlev, S. Submerged fluid-filled cylindrical shell subjected to a shock wave: Fluid–structure interaction effects. J. Fluids Struct. 2001, 23, 117–142. [Google Scholar] [CrossRef]
  43. Tonder, J.; Venter, M.; Venter, G. A novel method for resolving non-unique solutions observed in fitting parameters to the Mooney Rivlin material model. Finite Elem. Anal. Des. 2023, 225, 104006. [Google Scholar] [CrossRef]
  44. Yao, Q.; Dong, P.; Zhao, Z.; Li, Z.; Wei, T.; Wu, J.; Li, W. Temperature dependent tensile fracture strength model of rubber materials based on Mooney-Rivlin model. Eng. Fract. Mech. 2023, 292, 109646. [Google Scholar] [CrossRef]
  45. Gao, X.; Wang, Y. A new method for selecting and evaluating the hyperelastic model of tread rubber material under rolling contact condition. Int. J. Polym. Anal. Charact. 2024, 29, 15–41. [Google Scholar] [CrossRef]
  46. Gajewski, M.; Szczerba, R.; Jemioło, S. Modelling of elastomeric bearings with application of Yeoh hyperelastic material model. Procedia Eng. 2015, 111, 220–227. [Google Scholar] [CrossRef]
  47. GJB1060.1-91; General Requirement for Environmental Conditions of Naval Ships Mechanical Environments. National Defense Science and Technology Commission: Beijing, China, 1991.
  48. BV043-85; Naval Vessel Construction Specifications. Federal German Armed Forces: Berlin, Germany, 1985.
Figure 1. High-elasticity coupling model: (a) three-dimensional solid model diagram; (b) Equivalent model diagram.
Applsci 14 04995 g001
Figure 2. Simplified diagram of the high-elasticity coupling beam model.
Applsci 14 04995 g002
Figure 3. High-elasticity coupling equivalent model simulation cloud diagram.
Applsci 14 04995 g003
Figure 4. Physical model diagram of the propulsion shaft system.
Applsci 14 04995 g004
Figure 5. Deflection curve of the propulsion shaft system.
Applsci 14 04995 g005
Figure 6. Modal shape and natural frequency (6.327 Hz).
Applsci 14 04995 g006
Figure 7. Modal shape and natural frequency (17.389 Hz).
Applsci 14 04995 g007
Figure 8. Modal shape and natural frequency (46.731 Hz).
Applsci 14 04995 g008
Figure 9. Modal shape and natural frequency (55.612 Hz).
Applsci 14 04995 g009
Figure 10. Modal shape and natural frequency (60.521 Hz).
Applsci 14 04995 g010
Figure 11. Stern shaft impact displacement cloud diagram: (a) longitudinal impact displacement; (b) vertical impact displacement; (c) transverse impact displacement.
Applsci 14 04995 g011
Figure 12. Stern shaft impact stress cloud diagram: (a) longitudinal impact stress; (b) vertical impact stress; (c) transverse impact stress.
Applsci 14 04995 g012
Figure 13. Motor shaft impact displacement cloud diagram: (a) longitudinal impact displacement; (b) vertical impact displacement; (c) transverse impact displacement.
Applsci 14 04995 g013
Figure 14. Motor shaft impact stress cloud diagram: (a) longitudinal impact stress; (b) vertical impact stress; (c) transverse impact stress.
Applsci 14 04995 g014
Figure 15. Combined triangular wave impact load time-history curve.
Applsci 14 04995 g015
Figure 16. Vertical impact response contour map of the propulsion shafting system.
Applsci 14 04995 g016
Figure 17. Transverse impact response contour map of the propulsion shafting system.
Applsci 14 04995 g017
Figure 18. Impact displacement response curve of the after-stern bearing: (a) vertical impact displacement curve; (b) transverse impact displacement curve.
Applsci 14 04995 g018
Figure 19. Impact displacement response curve of forward-stern bearing: (a) vertical impact displacement curve; (b) transverse impact displacement curve.
Applsci 14 04995 g019
Figure 20. Impact displacement response curve of slave end of elastic coupling: (a) vertical impact displacement curve; (b) transverse impact displacement curve.
Applsci 14 04995 g020
Figure 21. Impact displacement response curve of the active end of the elastic coupling: (a) vertical impact displacement curve; (b) transverse impact displacement curve.
Applsci 14 04995 g021
Figure 22. Comparison chart of impact response at key cross-sections of the propulsion shafting system: (a) impact displacement curve; (b) impact stress curve.
Applsci 14 04995 g022
Table 1. Material properties of the equivalent model of the high-elasticity coupling.
PartDensity/kg·m−3Young’s Modulus/PaPoisson’s Ratio
active and passive flanges78502.0 × 10110.3
diaphragm assembly78502.0 × 10110.3
rubber material components17492.4 × 1070.45
Table 2. Straight state bearing load table of the propulsion shaft system.
No.NamePosition (mm)Load (kN)
1after stern bearing204886.02
2before stern bearing829913.95
3thrust bearing11,72743.72
4the rear end of the motor bearing14,242111.62
5the front end of the motor bearing16,75863.91
Table 3. Design impact acceleration and impact velocity values for various installation areas.
No.Impact DirectionElastic DesignElasto-Plastic Design
A a V a A a V a
hull areavertical 1.0 A 0 1.0 V 0 1.0 A 0 0.5 V 0
transverse 1.0 A 0 1.0 V 0 1.0 A 0 0.5 V 0
longitudinal 0.4 A 0 0.4 V 0 0.4 A 0 0.2 V 0
deck areavertical 0.5 A 0 0.5 V 0 0.5 A 0 0.25 V 0
transverse 1.0 A 0 1.0 V 0 1.0 A 0 0.5 V 0
longitudinal 0.4 A 0 0.4 V 0 0.4 A 0 0.2 V 0
external platevertical 5.0 A 0 5.0 V 0 not allowed
transverse 1.0 A 0 1.0 V 0
longitudinal 0.4 A 0 0.4 V 0
Table 4. Propulsion shaft system longitudinal, vertical, and transverse impact acceleration values.
No.LongitudinalVerticalTransverse
Frequency (Hz)Design Acceleration (m/s2)Frequency (Hz)Design Acceleration (m/s2)Frequency (Hz)Design Acceleration (m/s2)
16.32738.9266.564100.95717.319261.886
221.349131.35017.387257.98122.759350.058
325.146154.70521.349322.57738.871593.228
448.199296.54639.121601.43646.731718.776
551.030309.16051.709791.07860.354927.460
655.612295.62460.520930.13874.2211141.618
760.029369.33378.3741205.45881.1331247.905
881.133499.17287.5091346.00088.0041353.592
990.950559.57194.7721457.70191.0351400.228
1097.222598.105107.6161655.231101.6431562.395
Table 5. The propulsion shaft system key section impact response.
LocationMaximum Transient Displacement (mm)Maximum Instantaneous Stress (MPa)
LongitudinalVerticalTransverseLongitudinalVerticalTransverse
center of gravity of the propeller2.3810.907.9944.7147.8243.07
after stern bearing support point2.892.161.5714.55160.21123.08
before the stern bearing support point1.341.120.7923.38151.95137.52
thrust bearing support point1.107.705.777.92252.67174.22
high-elasticity coupling rear end0.9711.917.707.5531.719.14
high-elasticity coupling front end4.2322.4711.725.8610.89.19
motor 1# bearing support point4.0419.396.414.29111.9878.22
motor 2# bearing support point5.9519.416.160.77196.28205.64
Motor 1#: the motor located at the front; Motor 2#: the motor situated at the rear.
Table 6. The propulsion shafting system impacts acceleration time-history curve parameters.
Time-History Curve ParameterVerticalTransverse
a2 (mm/s2)695,028.4608,149.9
t2 (s)0.00290.0028
t3 (s)0.00720.0070
a4 (mm/s2)−187,531.4−208,955.3
t4 (s)0.02320.0194
t5 (s)0.03390.0276
Disclaimer/Publisher’s Note: The statements, opinions and data contained in all publications are solely those of the individual author(s) and contributor(s) and not of MDPI and/or the editor(s). MDPI and/or the editor(s) disclaim responsibility for any injury to people or property resulting from any ideas, methods, instructions or products referred to in the content.

