Abstract
This study of the strength and deformation of coal samples was triggered by the need to define the stress–strain characteristics of pillars during room and pillar mining in the shaft protective pillar at the ČSM Mine. It was probably the world’s deepest deployment of this mining method in a coal mine. In order to solve the bearing capacity of pillars, the dependence of coal strength on the slenderness ratio is used. For this reason, coal samples with different slenderness ratios were investigated. After considering the purpose of this research, slenderness ratios (width/height) of 1 to 7.7 were chosen. At the same time, the modulus of deformation as a function of the slenderness ratio was determined, and the vertical deformation of the pillars and the safety factor were calculated. Attention is also paid to the influence of sampling on the results of measured coal strengths.
1. Introduction
When dealing with the strength characteristics of coal samples, it is necessary to examine whether the strength of the coal at the point of removal from the seam has already been exceeded. This is often the case in deep mine sampling and is also true in our case.
The purpose of measuring the strength of coal samples as a function of the slenderness ratio was to investigate the bearing capacity of coal seam pillars during room and pillar mining. However, there was one major complication: this was a bottom pillar mining operation with a requirement for minimum subsidence of the overburden. It was necessary to prevent disturbing the mineshaft and many structures near the mineshaft on the surface. Therefore, a pillar width of 25 m was chosen, with a chamber width of 6 m and a mining thickness of 3 m. The pillars, therefore, had a slenderness ratio (width w/height h) of 8.3. For this reason, we measured uniaxial compressive strength at slenderness ratios w/h of 1 and higher. The uniaxial compressive strength increases with an increasing slenderness ratio. From the measured values, regression equations are established to calculate the uniaxial compressive strength (UCS) as a function of the slenderness ratio. In the laboratory determination of UCS, the slenderness ratio is the most significant influencing parameter. However, there are other influencing factors. If we want to infer the strength of pillars in a mountain massif from laboratory tests, we must consider the influence of volume [1]. As there are more discontinuity surfaces in a larger volume of the seam, a larger volume of the seam has a lower strength. Large volume in situ compression tests are recommended to address this issue. This effect on coal was investigated by Bieniawski [1]. According to the research, when the width of the test specimen was changed from 19 mm to 1524 mm, the uniaxial compressive strength changed from 33.7 MPa to 4.4 MPa. In all cases, the test specimens were cubic in shape. Given the greater incidence of discontinuities in the coal seams, this trend is understandable for cubic test specimens. UCS is also affected by loading rate. In our research, we followed the recommendations of ISRM [2], while the loading speed was chosen in the interval of 0.5–1 MPa.s−1.
Another influencing factor on which the laboratory-determined UCS depends is the amount of friction on the loading surfaces of the test specimen. Higher friction results in a higher UCS value [3,4]. Some authors [3] have even developed formulas for the strength of coal pillars taking into account the effect of interface friction and slenderness ratio. Other studies [4,5] point to the fact that the interface friction and slenderness ratio of pillars may be related to coal mine bumps.
2. Materials and Methods
2.1. Sampling
In order to determine the strength of coal, it is best to take samples from drill cores in areas not affected by mining activities. However, from a practical point of view, in the vast majority of cases, it is an unrealistic requirement. In most cases, we have to be content with sampling from mine workings. In this case, however, we have to investigate what stress-transformation process the sample has already undergone as a result of the formation of the mine workings at a given depth below the surface. If the sample has already been subjected to stresses in excess of its strength, there is a weakening effect on the sample depending on the difference between the strength of the deposit and the stress acting on it. However, this is not the only difference. The creation of the mine workings will result in a release of pressure in its surroundings. This has the effect of lifting the bedrock in the strain-free area. In a fragile coal seam, this further erodes its structure.
For our research, coal samples were taken from coal seam No. 30, which is located in the bottom pillar of the ČSM Mine at a depth of approximately 800 m. The samples taken were in the form of whole pieces of coal (minimum size of 0.3 × 0.3 × 0.2 m). A total of 11 such coal blocks were taken.
The geostatic stress at the sampling site is about 20 MPa, but due to the fact that several tens of seams have been mined around the bottom pillar in the past, the bottom pillar is even more stressed. The excavation of the mine workings causes a further substantial increase in the stresses in the vicinity of the seam. Measurements of the uniaxial compressive strength of the seam samples show that the strength at a ratio of w/h = 1 is about 10 MPa. This analysis shows that it is impossible to take coal samples from mine workings under conditions where the compressive strength has not yet been overcome. Coal samples disturbed by their multiple uniaxial compressive strength are always taken, which is reflected in the disturbance of the integrity of the seam in the vicinity of the mine workings. The previous disturbance of the samples taken causes the measured strength characteristics to be lower than those of undisturbed parts of the seam further away from the mine workings. The extent of this disturbance has not yet been determined. To determine it, we would need to have two types of samples in terms of the method of sampling. One set of samples would have to be taken from drill cores in areas not affected by mining activity and the other from the mine workings.
2.2. Existing Methods of Solving the Strength versus Slenderness Ratio
The problem of the effect of the slenderness ratio on the bearing capacity of pillars has been the subject of many papers. All the works express the mathematical dependence of strength on the slenderness ratio. These dependencies are divided into two groups:
- Linear, e.g., [6,7,8,9], also in [3], this type of dependence is preferred;
- Exponential, e.g., [10,11,12,13,14,15,16,17,18,19].
It can be seen from the above references that the exponential expression of this dependence prevails.
Although a large number of researchers have dealt with the issue of the influence of the slenderness ratio on the bearing capacity of coal pillars, most of the available information is associated with mining in South Africa [10,12,14,15,17], Australia [10], America [11,16,19], or India [13], where mining with the room and pillar method is common. In Europe, the longwall mining method has historically been the most common for coal, and, therefore, not much research has been carried out for European conditions.
When calculating the slenderness ratio, it is important to take into account the shape of the pillars, when we can distinguish square, rectangular, and diamond shapes of pillars in coal mining. For this reason, some authors [10] introduce the concept of effective pillar width into the calculation of the slenderness ratio.
Many papers deal with mathematical modelling of the effect of the slenderness ratio on compressive strength [20,21,22]. The publication [20] is based on the tensile failure of the peripheral parts of the pillars and the shear failure of the inner parts. When examining crystalline rock in the w/h ratio range of 0.5–3.5, the mathematical modelling suggests that the increase in bearing capacity with increasing w/h is roughly linear.
Other methods of evaluating the effect of the slenderness ratio on the load capacity of pillars are based on statistical methods. A significant contribution to the solution of the bearing capacity of pillars is the monitoring of the parameters of pillars that have experienced a stability failure compared to pillars that have resisted the load acting on them [23,24].
2.3. Objectives of the Contribution
The pillars evaluated in room and pillar mining at the ČSM Mine have a specific characteristic, unlike other applications of this mining method, in that very strict requirements for limited deformation conditions must be met to avoid disturbing the stability of the mineshaft and surface structures near the mineshaft. Therefore, one of the objectives of this work is to assess the safety factor of the concerned pillars. Another objective is to prepare the basis for the evaluation of the deformation of the pillars, on which the shape of the subsidence basin of the surface mainly depends.
2.4. Measurement Methodology
From the collected samples, cuboid test specimens with a square pressure surface of 70 × 70 mm were made by cutting.
Due to the principle of this research, the ISRM [2] recommendation for uniaxial compressive strength measurements regarding the slenderness ratio could not be followed. The test specimens had different slenderness ratios t (width w to height h).
This slenderness ratio ranged from 1 to 7.7. A smaller slenderness ratio (>7.7) was not implemented due to the disintegration of coal thin slices (<9 mm) during sample preparation (cutting).
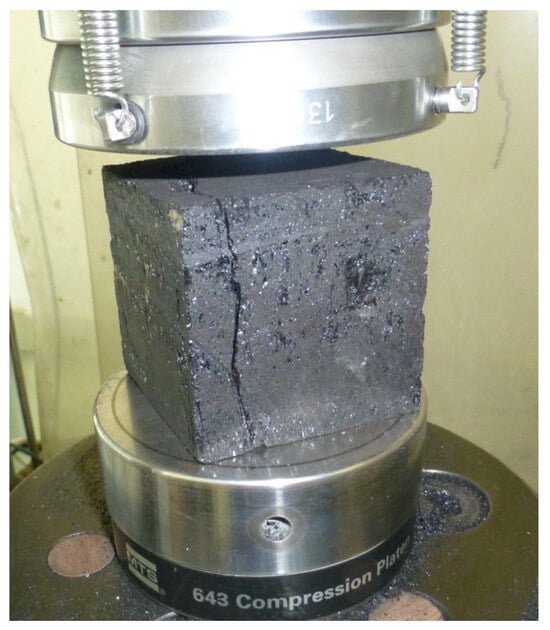
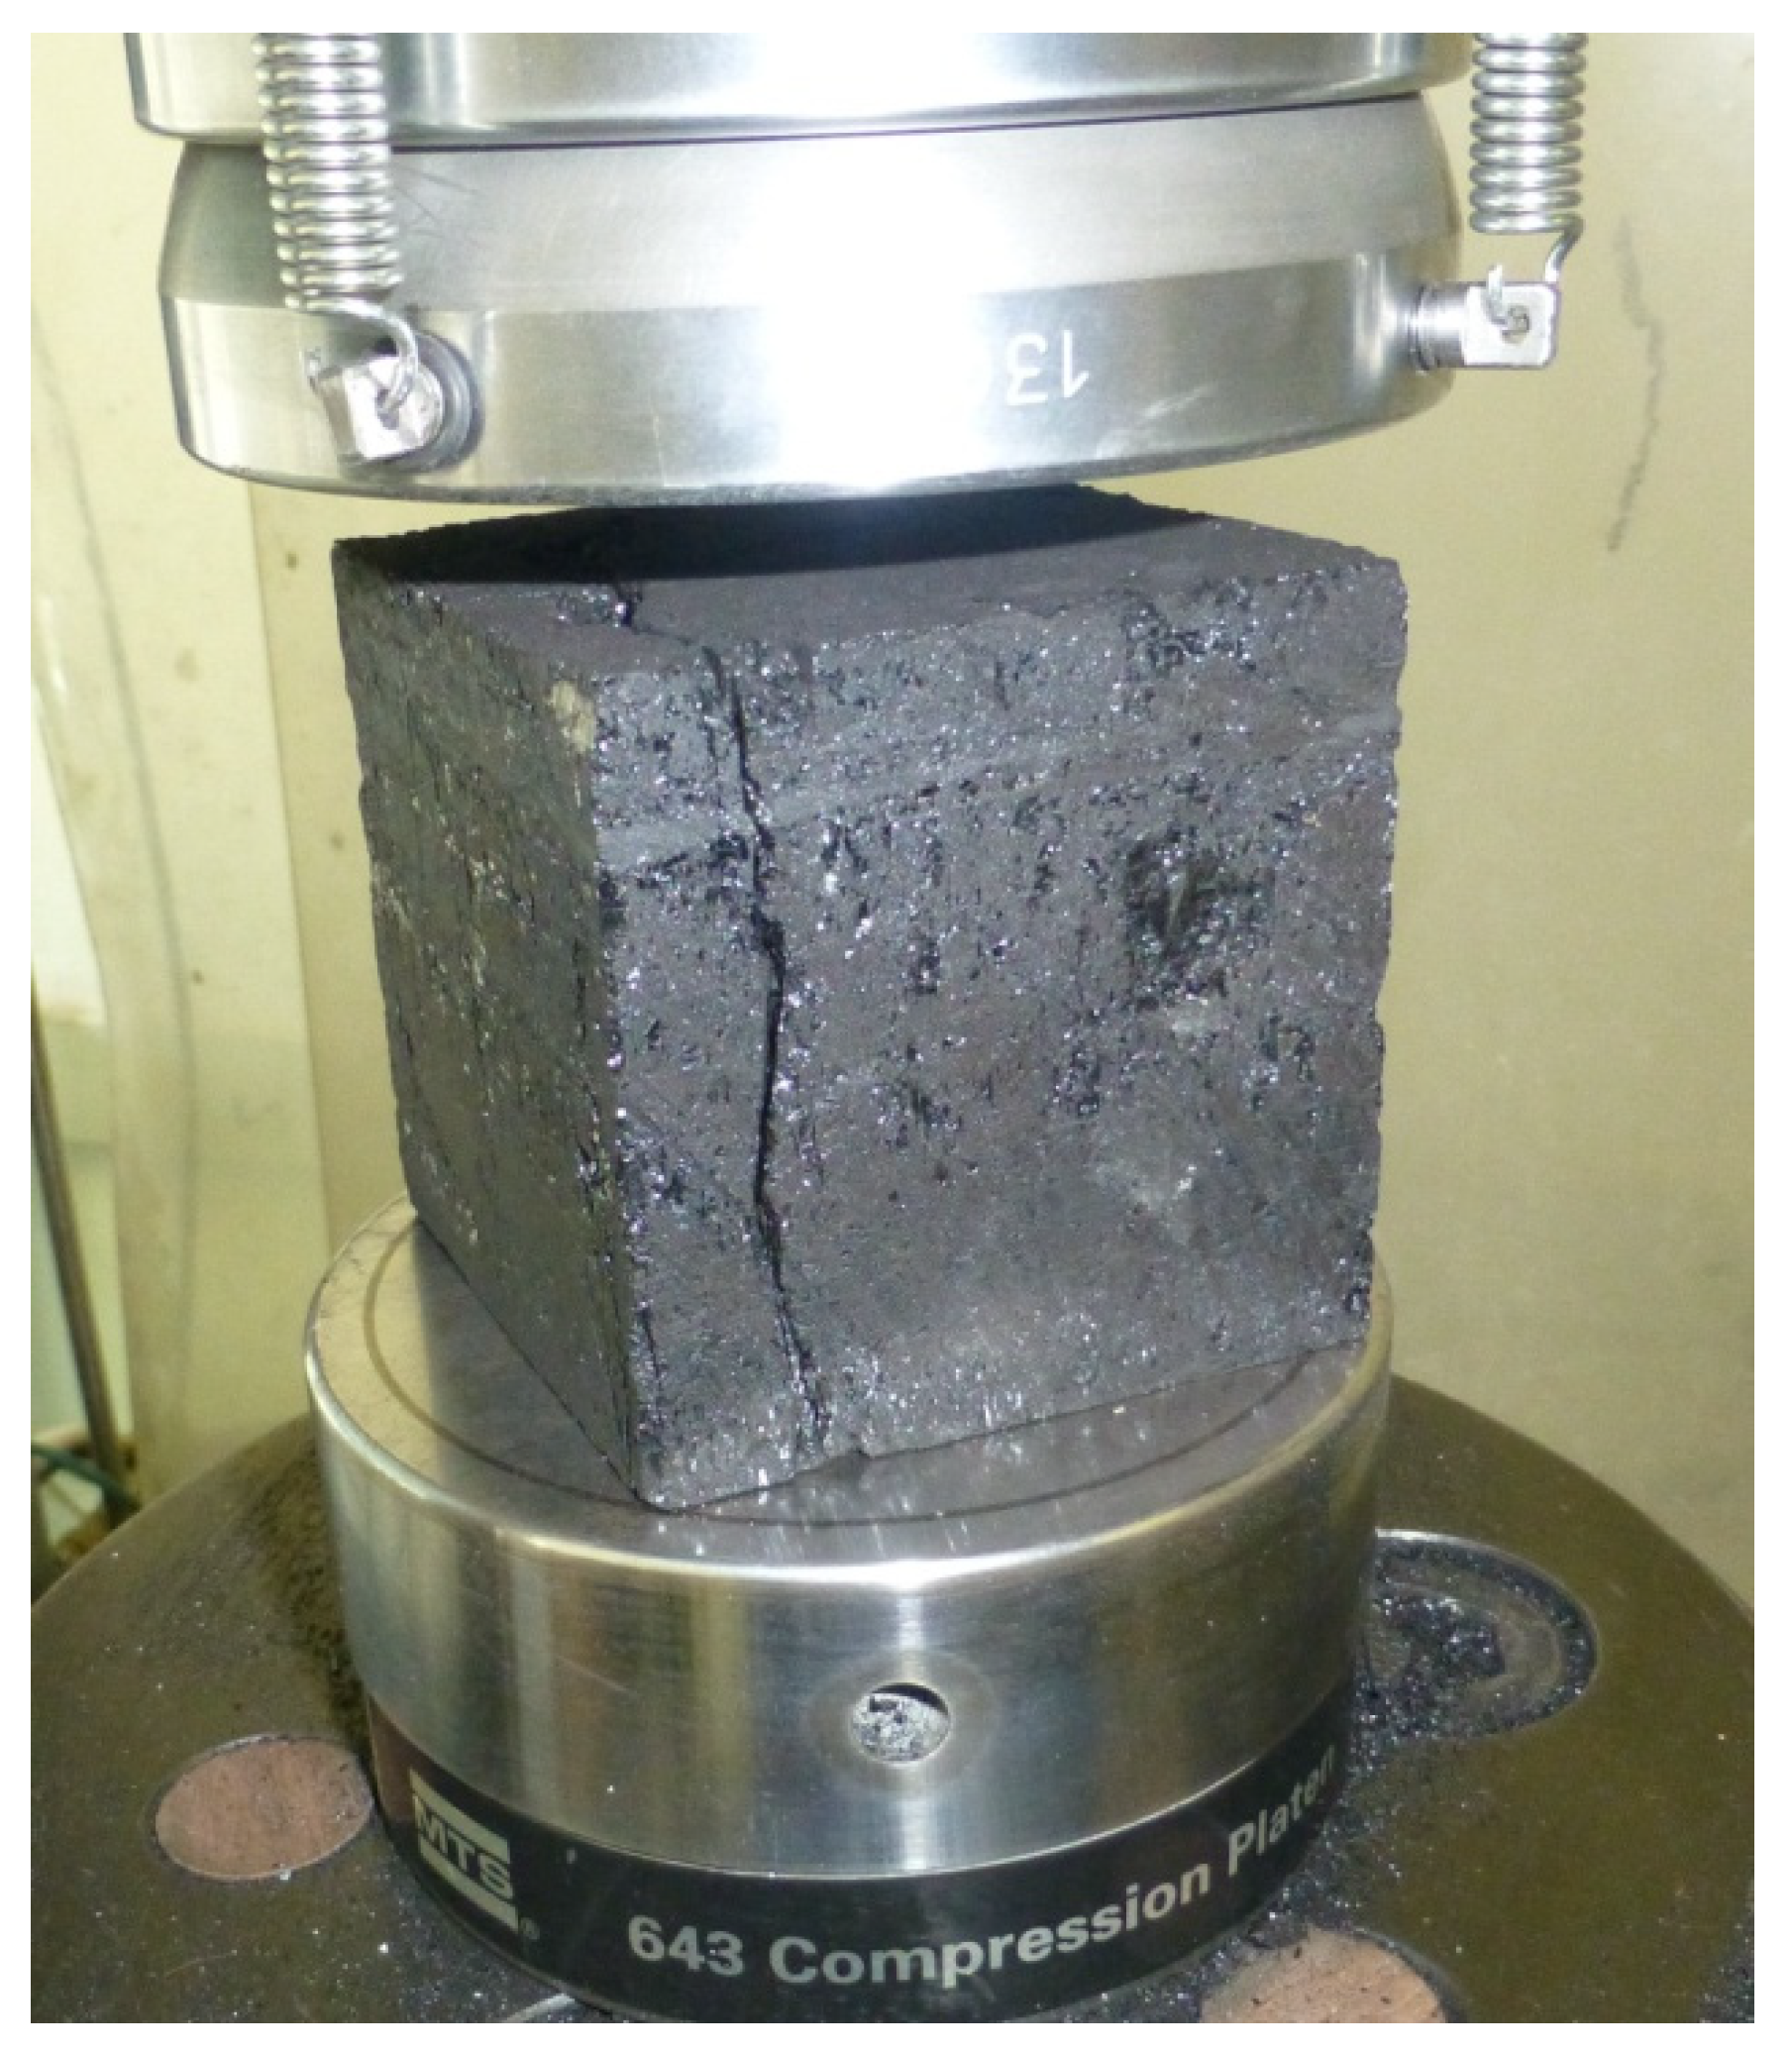
Figure 1.
Test specimen with slenderness ratio 1.

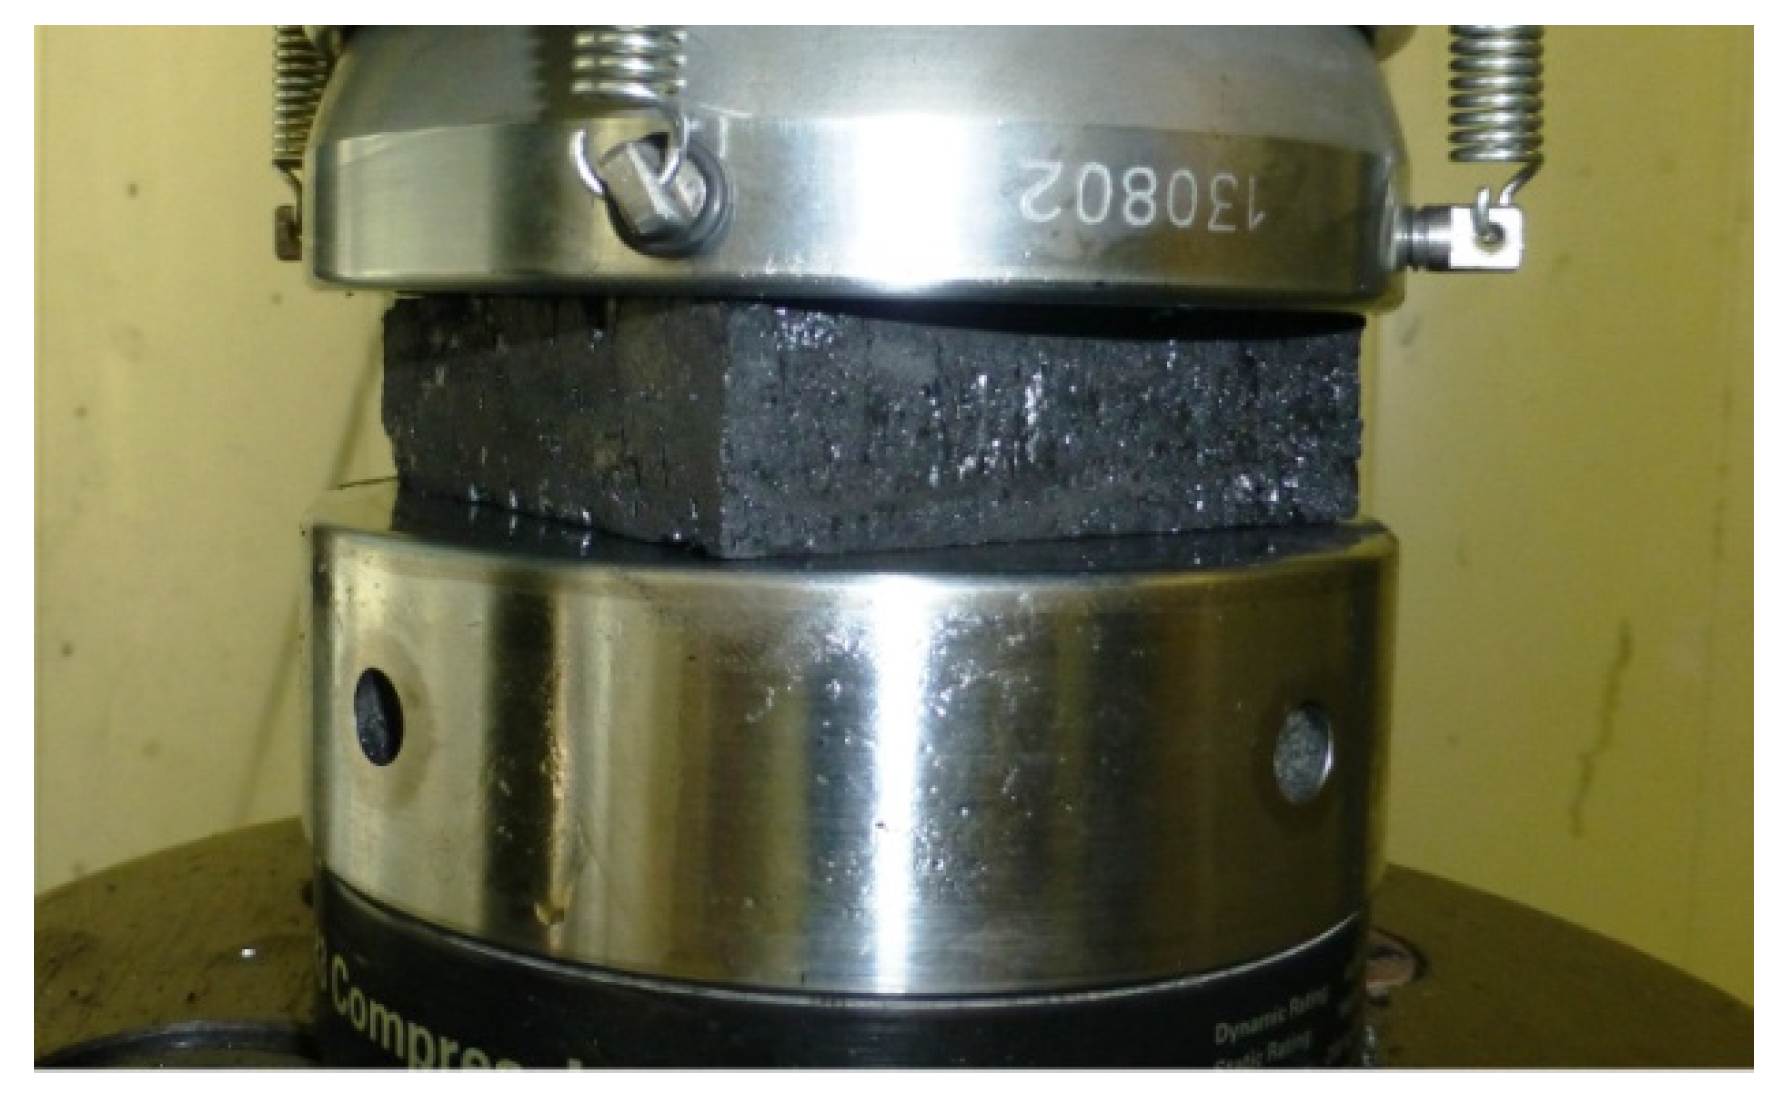
Figure 2.
Test specimen with slenderness ratio w/h 3.57.
The uniaxial compressive strength of the test specimens was measured on the MTS 816 Rock Test System. Loading was carried out at a constant strain rate so that the rate of loading to ultimate strength was in the range of 0.5–1 MPa.s−1. This setup of the test equipment allows the recording of the deformation diagram even beyond the ultimate strength.
The dimensions and weight of each test specimen were recorded prior to the pressure test. For some of the test specimens, the weight of the whole test specimen residue was determined after the pressure test.
The applied force and longitudinal deformation were recorded in the time axis during the compression test using a computer connected to the test equipment.
The compression test was carried out at lower slenderness ratios until the applied force beyond the strength limit did not change much. At the higher slenderness ratios, when the applied force beyond the ultimate strength started to increase again, we allowed the applied force to increase up to the maximum force capacity of the test equipment.
The transformation modulus Ep was determined from its linear part based on the plotted deformation diagram.
3. Results
Compression tests were carried out on 46 test specimens with different slenderness ratios. From these measurements, both compressive strengths and deformation moduli were evaluated.
3.1. Compressive Strength
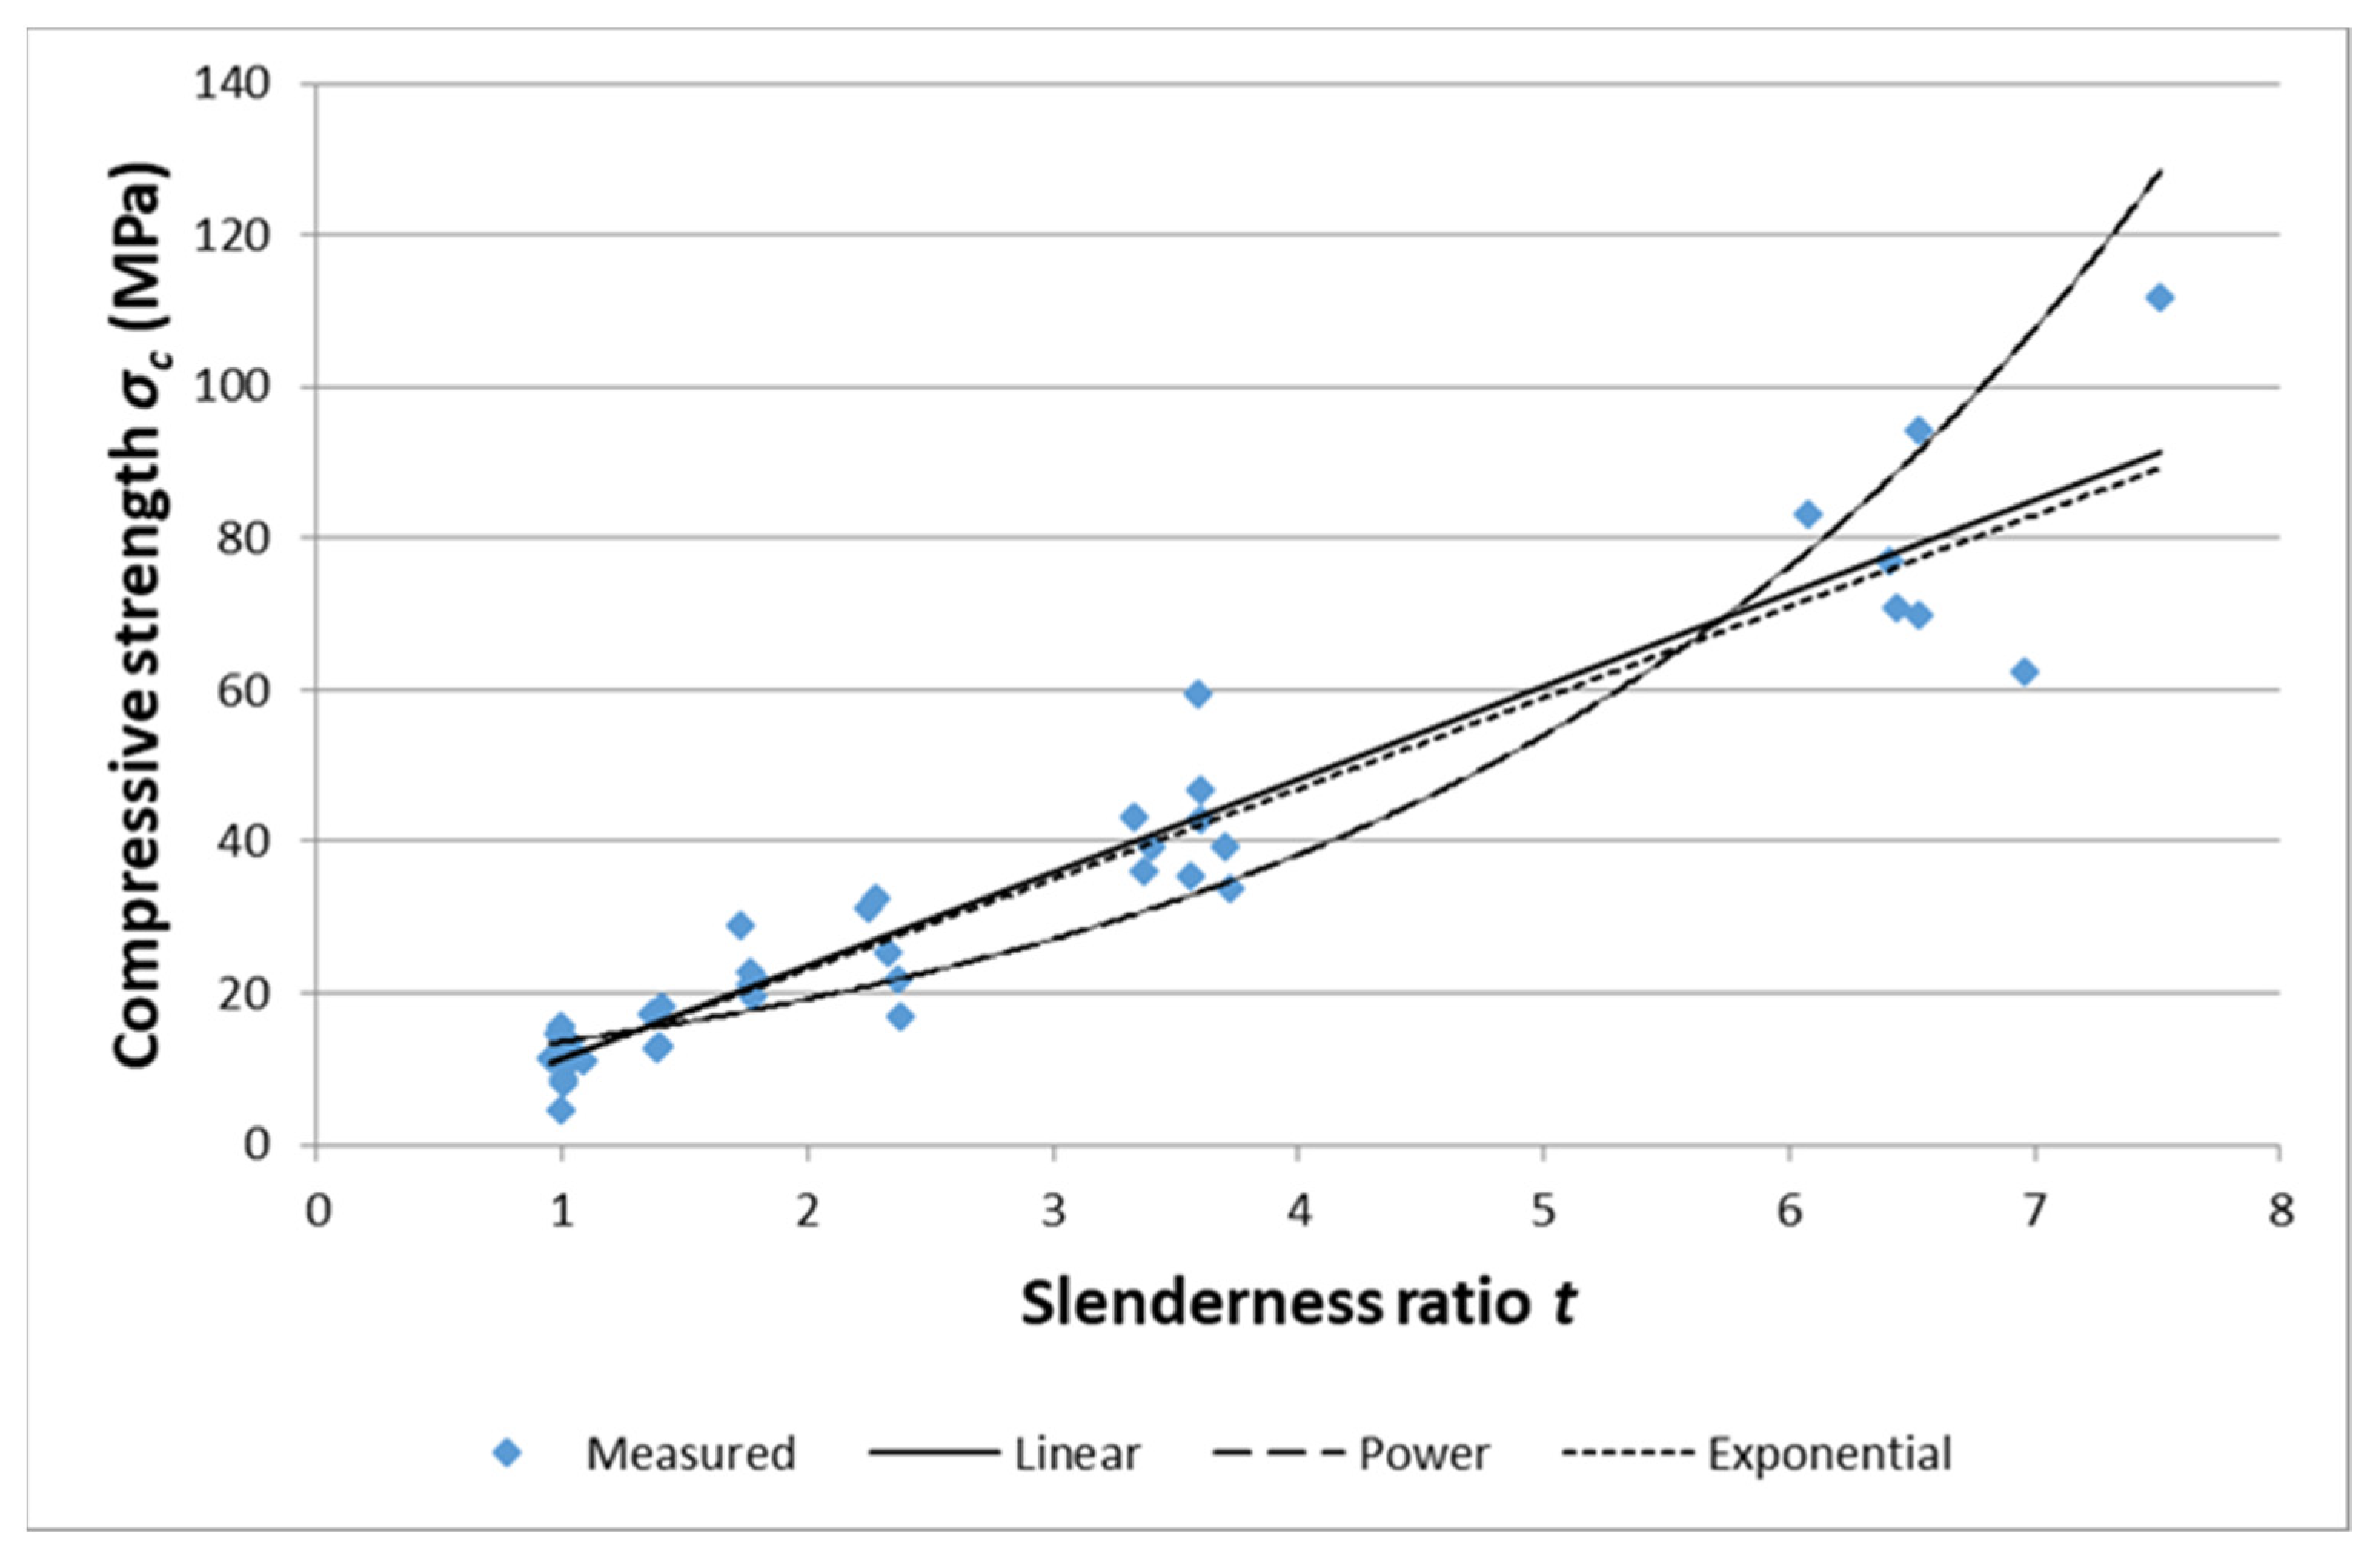
The results of compressive strength measurements σc versus slenderness ratio t are shown graphically in Figure 3.
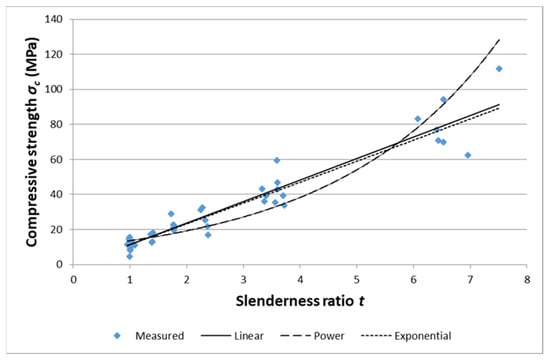
Figure 3.
Graph of measured compressive strength values.
The measured values were interspersed with regression relationships. The best fitting regression dependence is linear—it shows the highest value of the index of determination R2 = 0.92. This dependence of the compressive strength σc on the slenderness ratio t has the following form:
σc = 12.293t − 0.8585
The power dependence is almost the same, with a slightly lower index R2 = 0.90
σc = 11.446t1.019
The least satisfactory is the exponential dependence with the lowest index R2 = 0.84
σc = 9.6521e0.3445t
3.2. Deformation Modulus
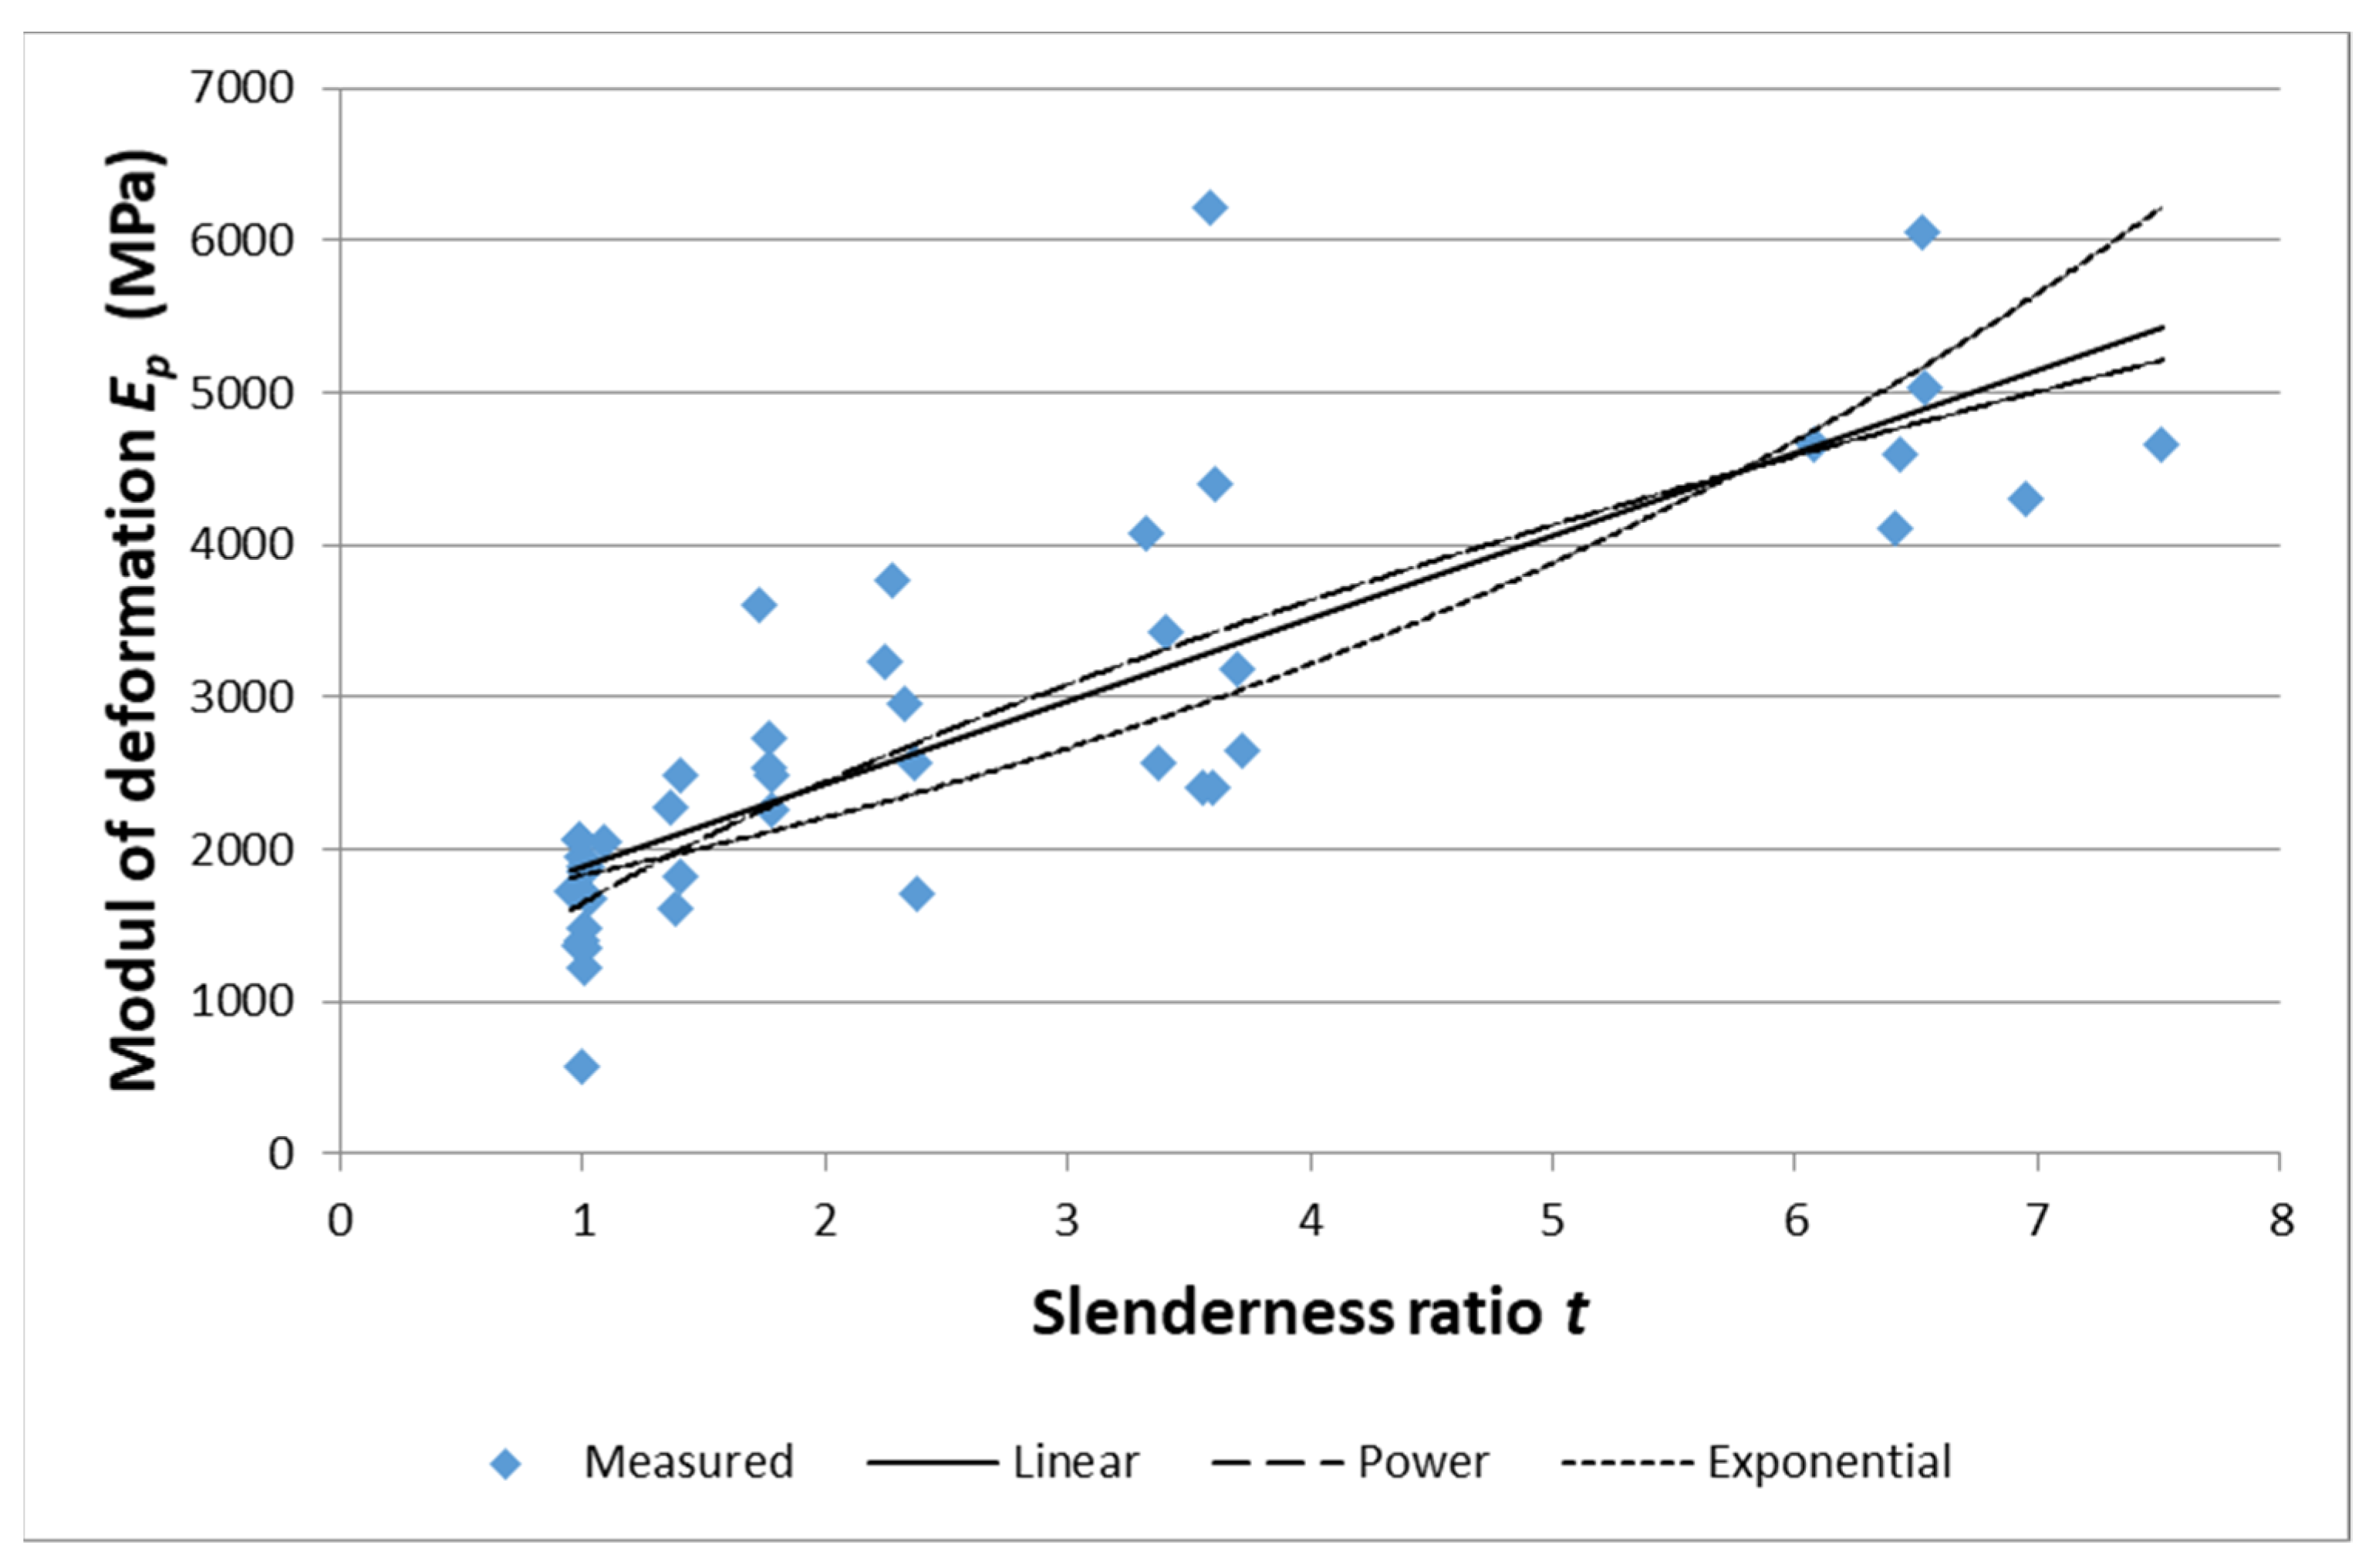
The deformation modulus was also determined for all the test specimens on which the compressive strength was determined. The results of the determined refractive moduli Ep as a function of the slenderness ratio t are shown graphically in Figure 4. From Figure 4 it is clear that with decreasing slenderness ratio the value of the modulus Ep decreases. However, a relatively large dispersion of the measured values is evident. This is probably related to the nature of the coal samples, which are naturally permeated by an inhomogeneous system of small cracks and fissures (see Figure 1), which influence the measured values. Since these are destructive tests, a different coal sample is used for each measurement, which has a different degree of natural breakdown and thus can show different values (large dispersion of measured values).
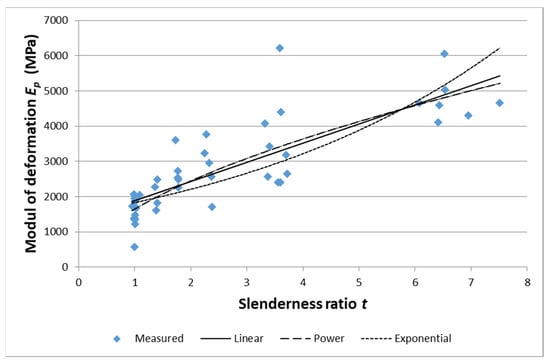
Figure 4.
Graph of calculated values of the deformation modulus.
The determined values of the deformation modulus were interspersed in the graph with three types of regression dependencies. The linear regression dependence with the index of determination R2 = 0.673 has the form
Ep = 544t + 1337
The power regression relationship shows a very similar determination index to the linear regression, namely R2 = 0.678. Its equation has the form
Ep = 1644t0.57
The exponential dependence expresses the least appropriate waveform because its index of determination is the lowest, R2 = 0.597. The equation for an exponential regression curve is
Ep = 1516e0.188t
The determination index of the mentioned regressions is relatively low; however, it is influenced by the high dispersion of the measured values of the module Ep, especially for low values of the slenderness ratio.
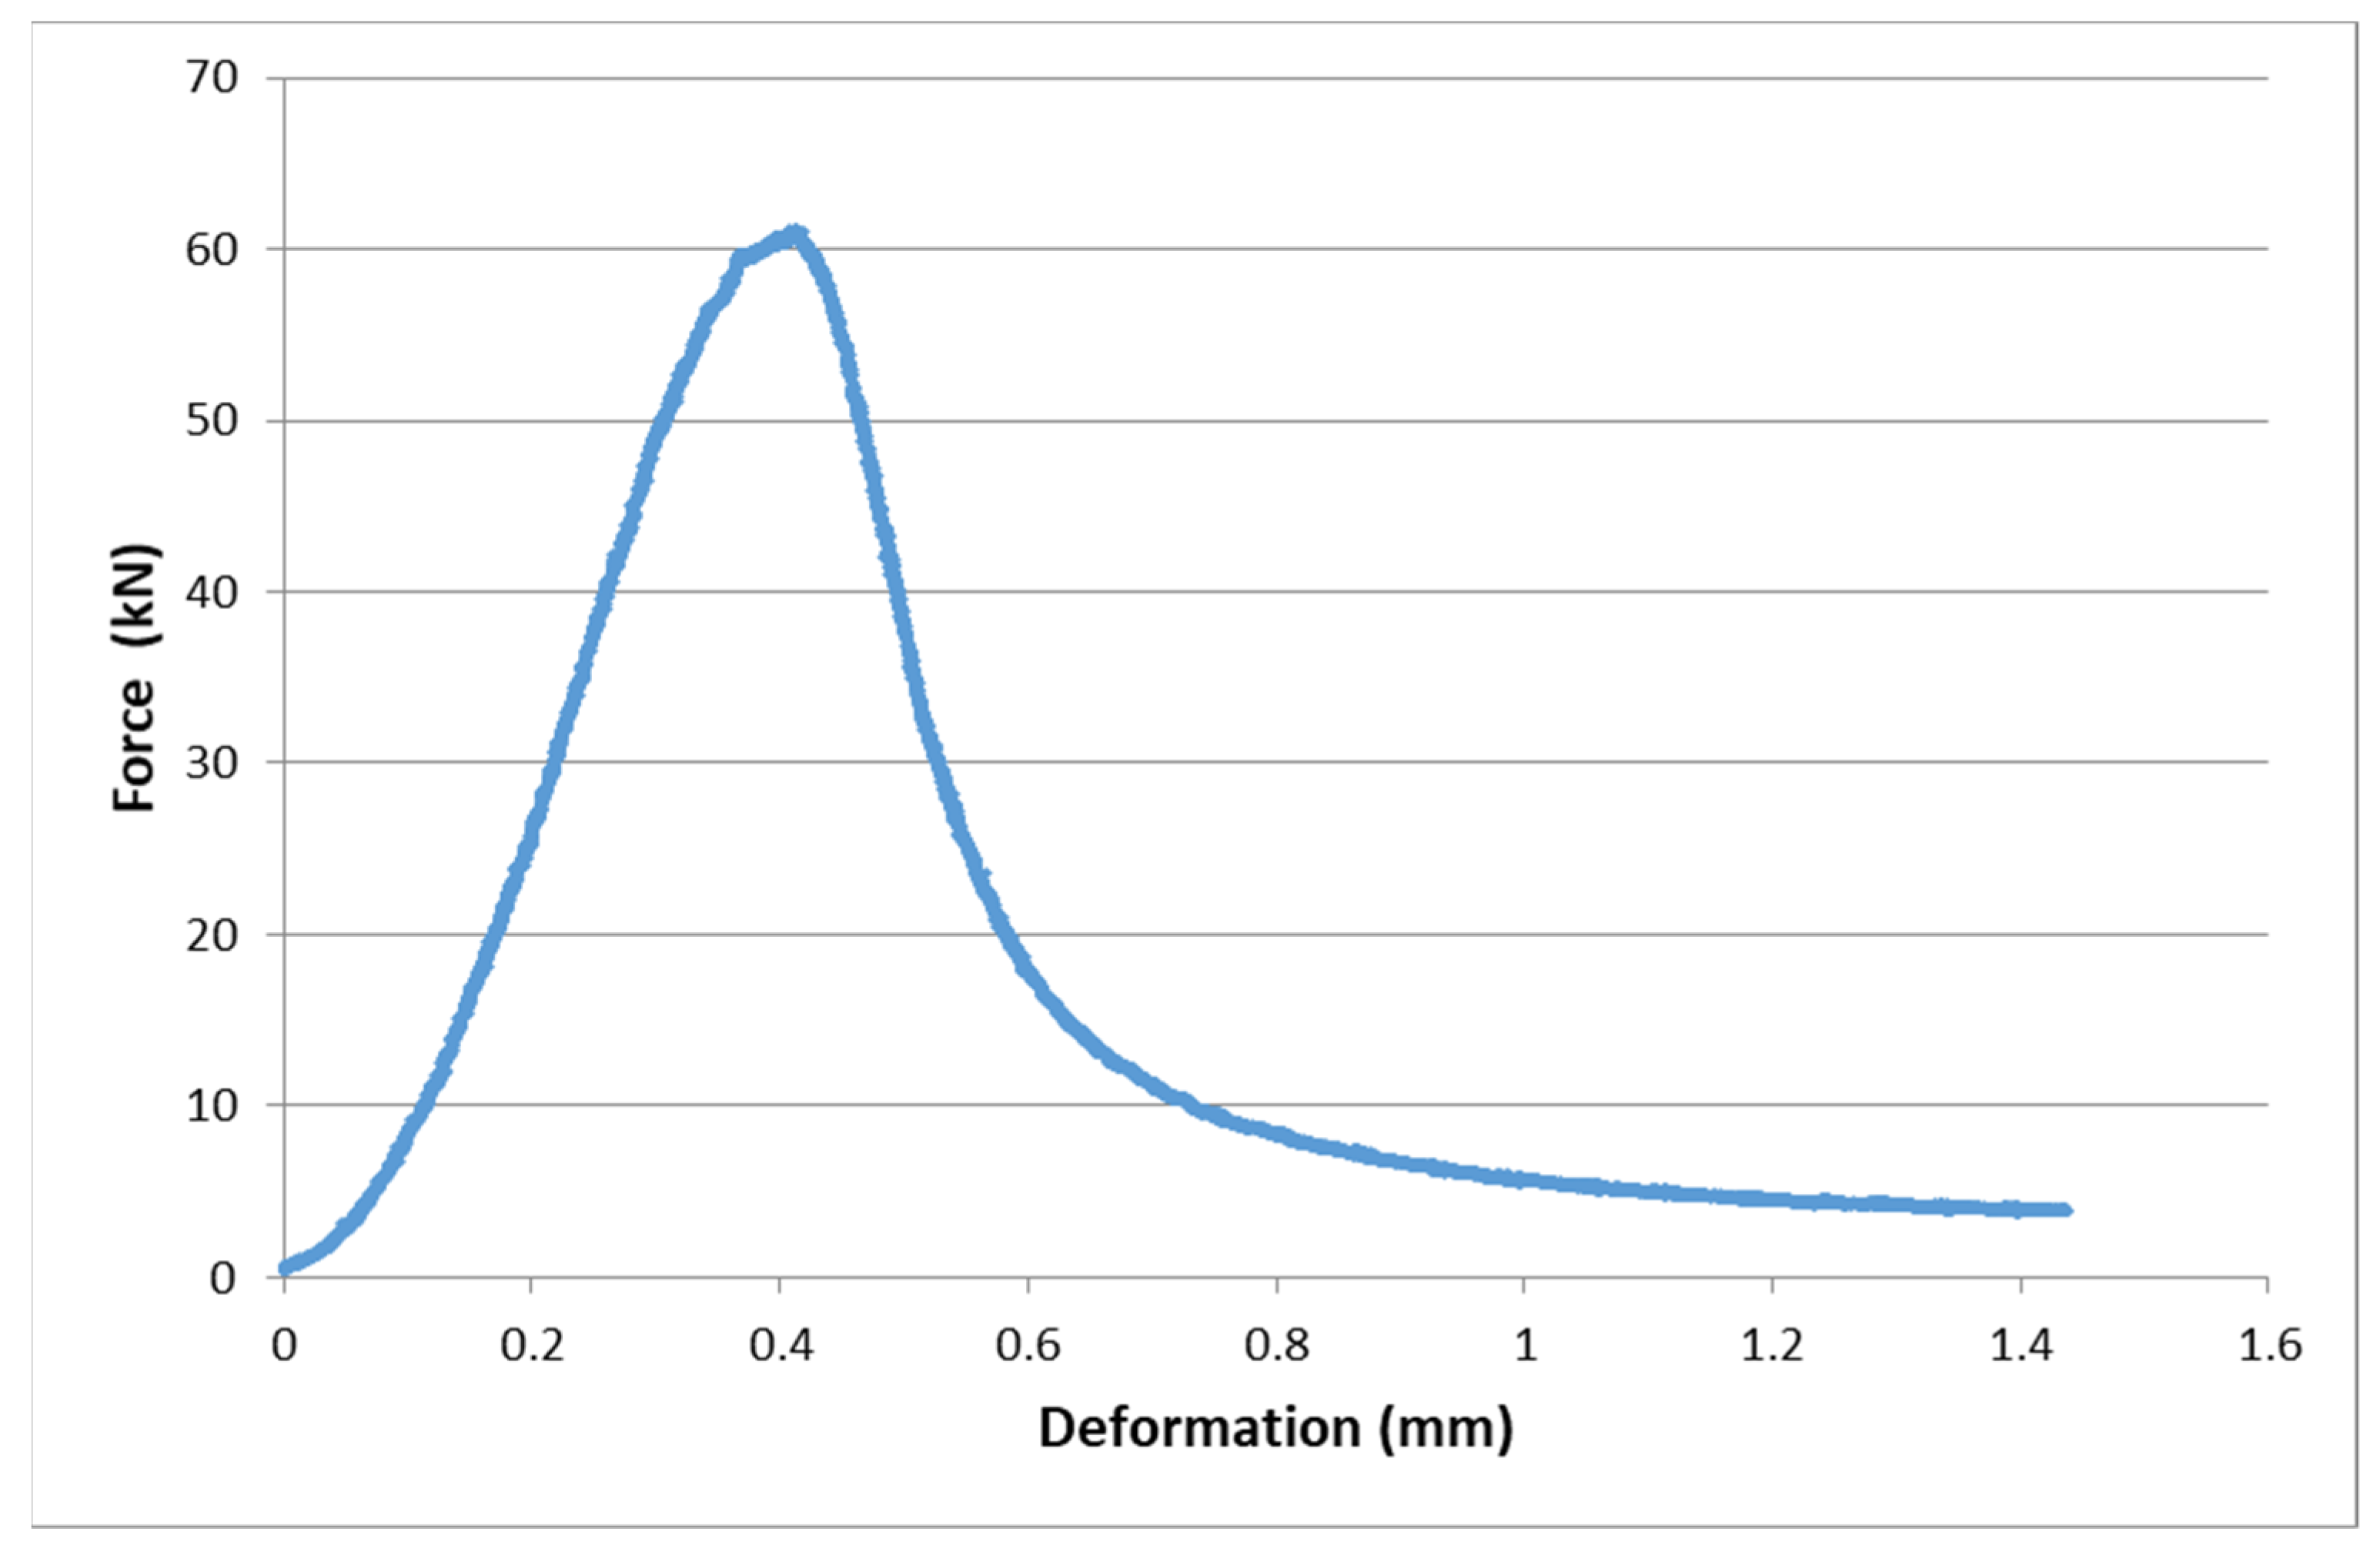
3.3. Flow of Deformation Diagrams
The entire test specimen was gradually disturbed for test specimens with a slenderness ratio of approximately two or less, especially after reaching the ultimate strength. Due to the control of the compression test with a constant deformation rate, there was no sudden disturbance of the test specimen. However, a complete deformation diagram was obtained even beyond the strength limit. A typical example of such a deformation diagram is shown in Figure 5.
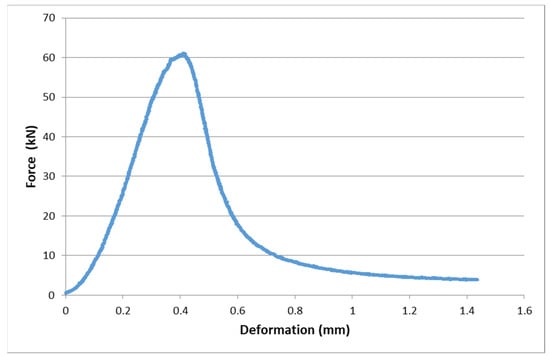
Figure 5.
Typical example of a deformation diagram at a lower slenderness ratio (t = 1).
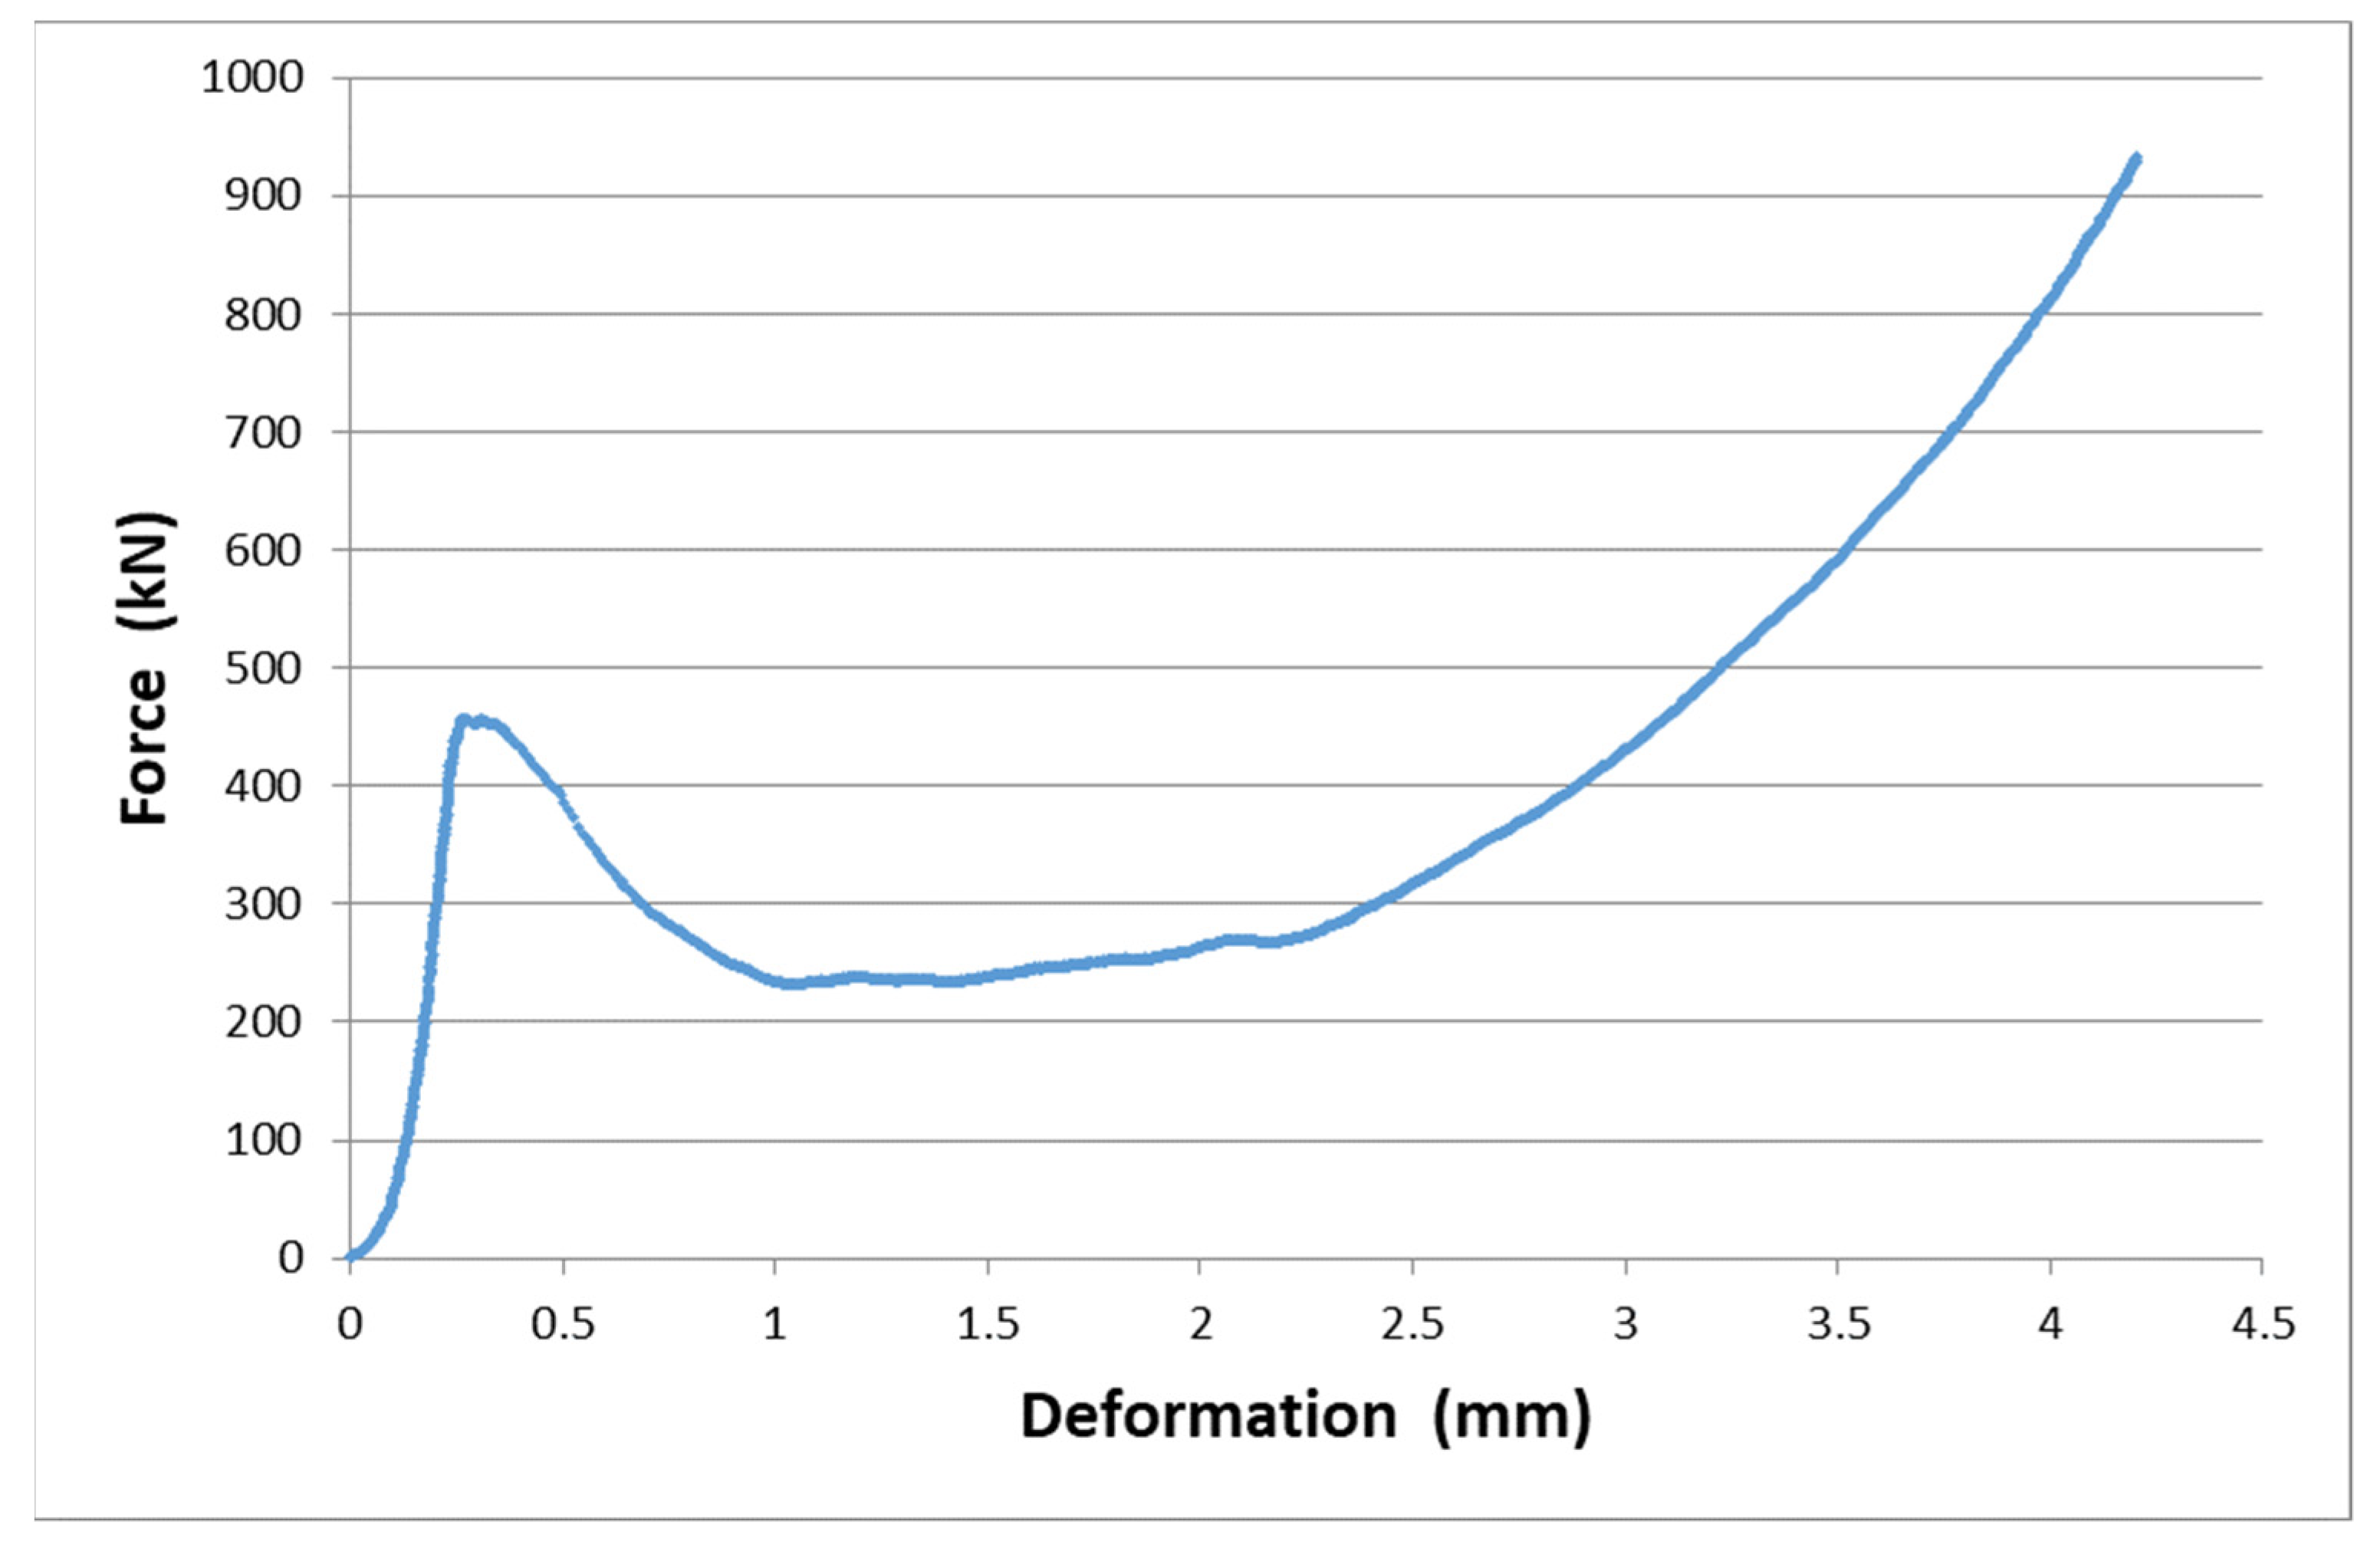
In compressive strength tests with a higher slenderness ratio, the resistance of the test specimen partially decreased after reaching the ultimate strength but then increased again. The test specimens were loaded in this way up to the maximum range of the test equipment. A typical example of such a deformation diagram is shown in Figure 6.
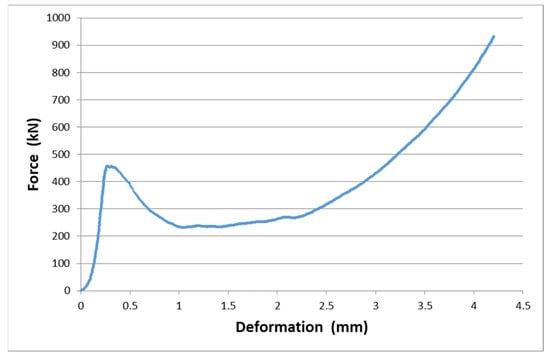
Figure 6.
Typical example of a deformation diagram at a low slenderness ratio (t = 6.6).
4. Discussion
The effect of the slenderness ratio on the bearing capacity of pillars has been studied by many researchers. Some have reached conclusions analogous to those drawn from our measurements. For example, in [25], it is stated that at a w/h ratio >5, the friction between the pillar and the surrounding rocks causes the pillars to become unbreakable. The dependence of the bearing capacity of the pillar on the slenderness ratio is discussed in [17,26]. In order to determine the bearing capacity of pillars, the works mentioned above establish the following relationship:
where k is the strength determined in situ on a cubic block with 1 m edges, h is the pillar height, w is the pillar width, and a and b are experimental constants.
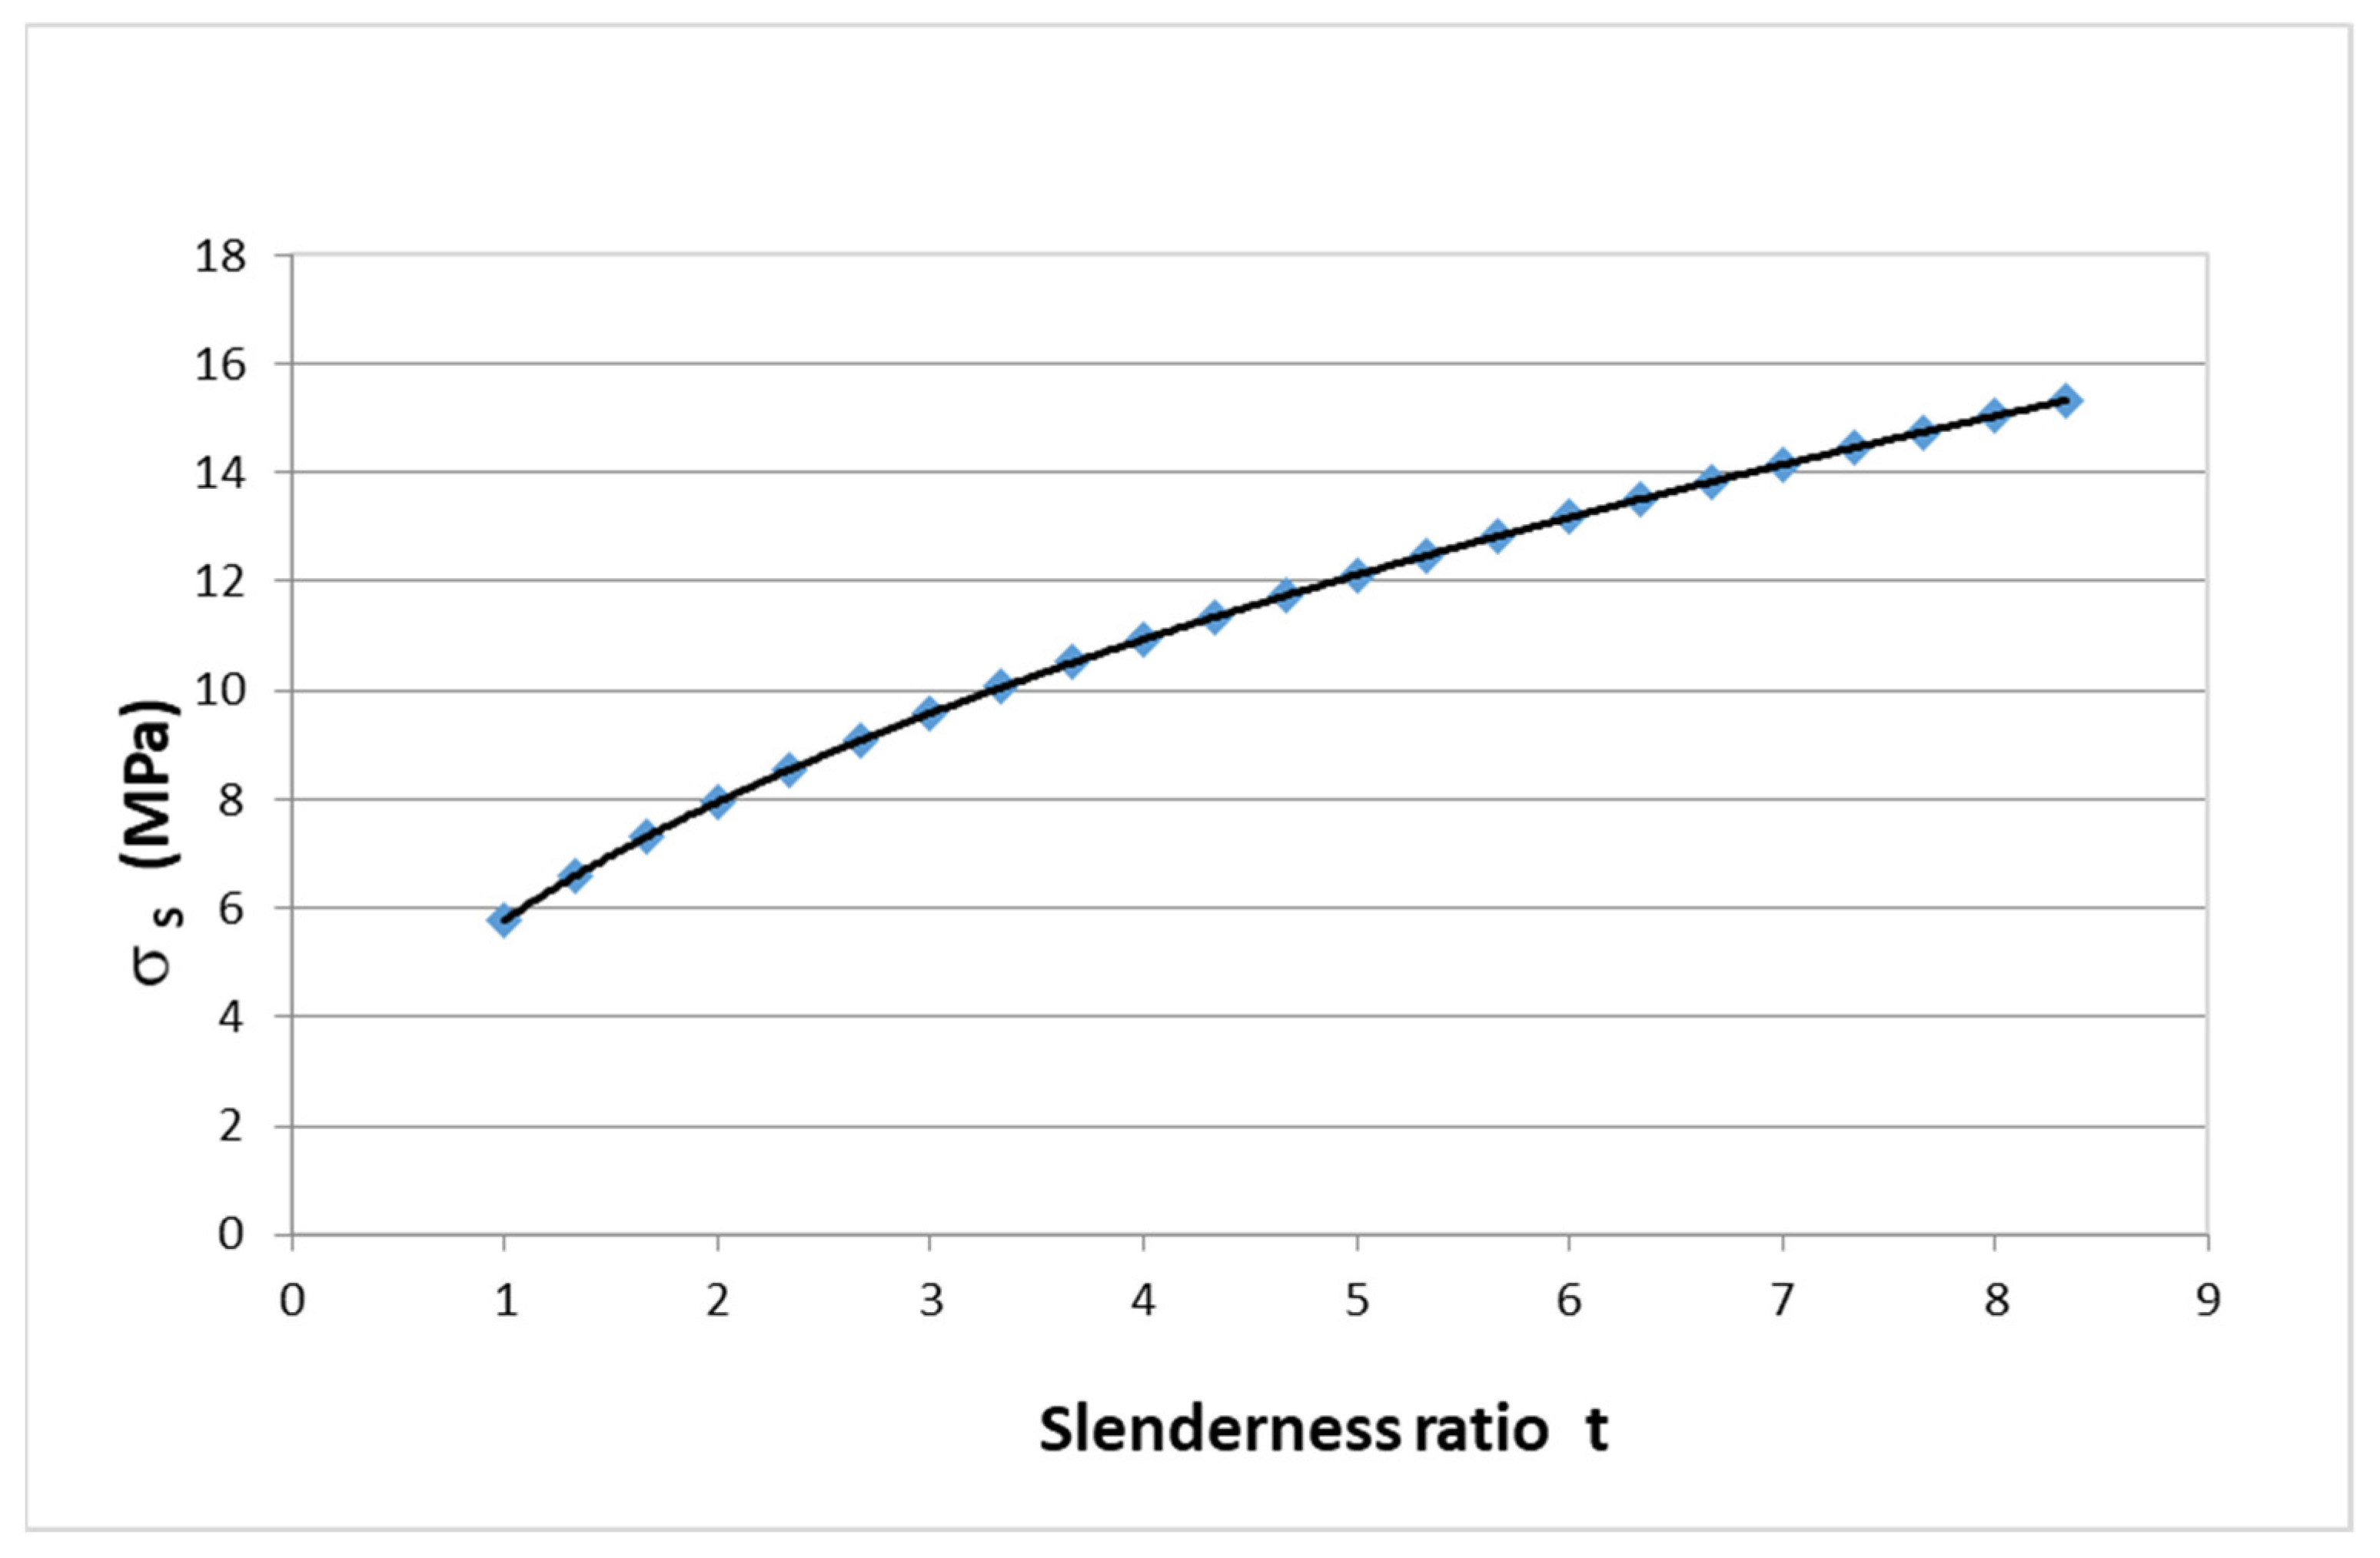
The following parameters were determined for the South African coal: = 7.2 MPa, a = −0.66, and b = 0.46. For the pillars at the ČSM Mine with h = 3 m and w = 25 m, the Equation (8) = 15.3 MPa applies. Since at that mine the geostatic stress is about 20 MPa and the pillars showed no instability, this seam must be much stronger than the South African coal.
Based on Equation (8), we have calculated that the load capacities of the pillars for our observed range of slenderness ratio t are 1 to 8.33. The results are shown in the graph in Figure 7.
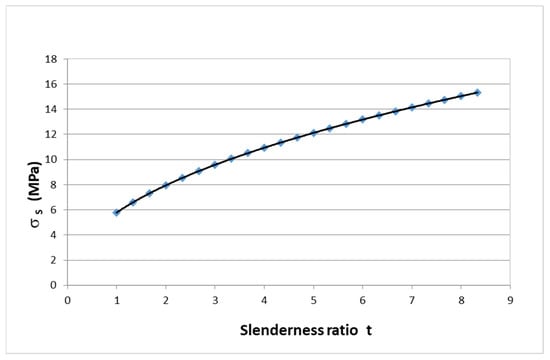
Figure 7.
Dependence of pillar bearing capacity on slenderness ratio for South African coal according to the Relationship (8).
Relationship (8) is a power function; therefore, the power regression fully fits the calculated values. The bearing capacity of the pillars as a function of the slenderness ratio according to this calculation has the following form:
According to this calculation, the bearing capacity of the pillars at a slenderness ratio of 8.33 is 2.65-times higher than at a slenderness ratio of 1. Our measurements have shown that the ratio of the strength of coal samples at a slenderness ratio of 8.33 and a slenderness ratio of 1 is 8.7 and 8.0, according to the relationship (2) and (3), respectively. This implies that it is appropriate to use relationship (8) or (9) for slenderness ratios closer to 1. Pillars with very high slenderness ratios are rare. For Indian coal conditions, the bearing capacity of pillars has been determined from extensive measurements [27] using the relationship
where is the uniaxial compressive strength determined on a 25 mm edge cubic specimen.
If our measurements on 70 mm edge cubic specimens yielded a compressive strength of 11.4 MPa, and we would assume that we would measure a strength of 20 MPa on 25 mm edge specimens, then for the dimensions of the pillars at the ČSM Mine = 10.5 MPa, it is an even smaller increase than seen in the previous South African coal pillars for evaluation (9).
From relationship (10), the load capacity ratio of the pillars at a slenderness ratio of 8.33 and a slenderness ratio of 1 is 1.94. This is an even smaller increase than that seen in the previous evaluation of South African coal pillars.
Another study on the effect of the Indian coal slenderness ratio on the resulting bearing capacity [28] found that the ratio of bearing capacity of pillars at the slenderness ratio of 9.1 and the slenderness ratio of 1 is 3.55.
There are many relationships that can be used for calculating the load capacity of pillars depending on their slenderness. The publication [29] evaluates 12 formulas for this calculation. Only three formulas, according to [19,30,31], show a steeper increase in bearing capacity with an increasing w/h ratio.
The larger scatter of measured values at the same slenderness ratio in the results in Figure 3 is due to the presence of more or fewer discontinuities, which were often macroscopically noticeable on the test specimens. These discontinuities may be original, created by geological processes during the formation of the seam. However, they may also be due to the overpressure mentioned above in the sides of the mine from which the samples were taken.
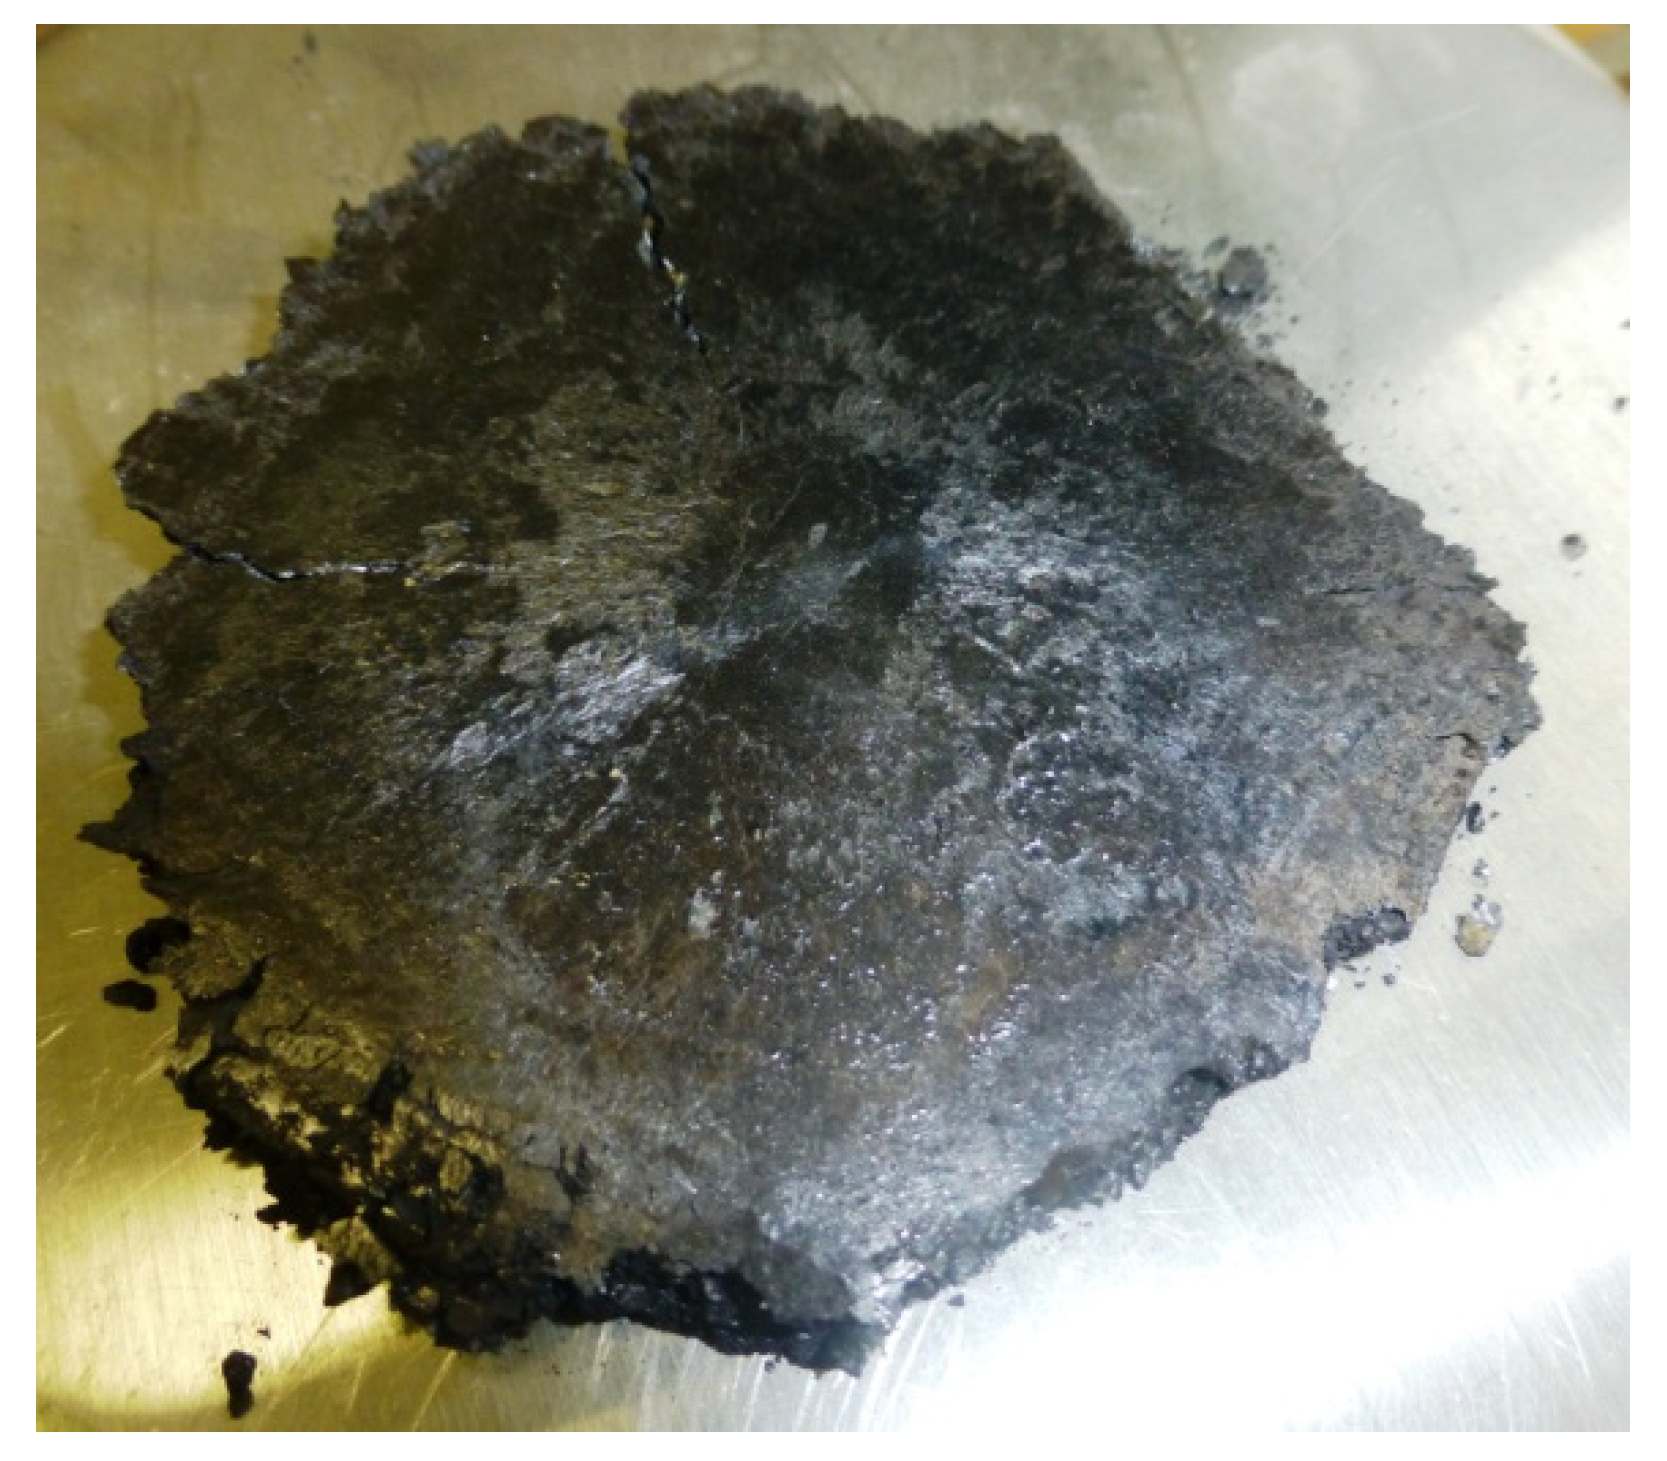
The increase in compressive strength at the lower slenderness ratio is caused by the fact that the inside of the test specimen cannot be transversely reshaped due to friction at the contact surfaces. Moreover, a volumetric state of tension inside the test specimen increases the resulting compressive strength. The extent of the test specimen in the volumetric state of tension at higher slenderness ratios is determined in various ways. For example, [3] determines this range by the appearance of the compressive surface of the test specimen after the compression test. We loaded the test specimens with a slenderness ratio of 6–8 after the ultimate strength was reached so that the final force was about 2–3-times higher than the force when the ultimate strength was reached. The part of the test specimen that was in the bulk state of tension was further compacted by the high loading, and the original height of the test specimen was reduced by up to 38% at the maximum applied force of almost 1000 kN. After the test, the compacted residue of the test specimen remained intact and could be handled manually. This strengthened portion of the specimen represents approximately the region where the volumetric stresses occur. An example of this strengthened residue is shown in Figure 8.
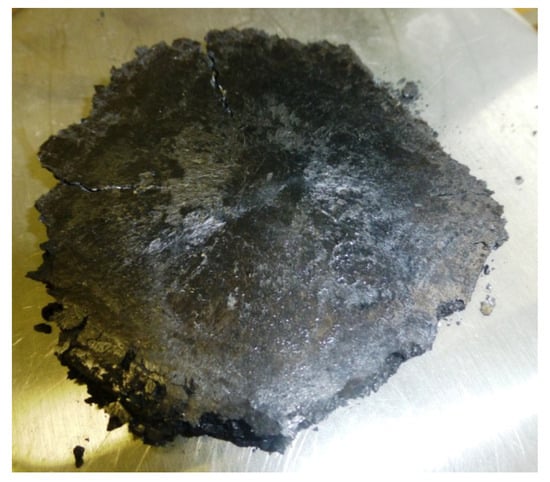
Figure 8.
Example of strengthened core of test specimen residue with slenderness ratio 6.25.
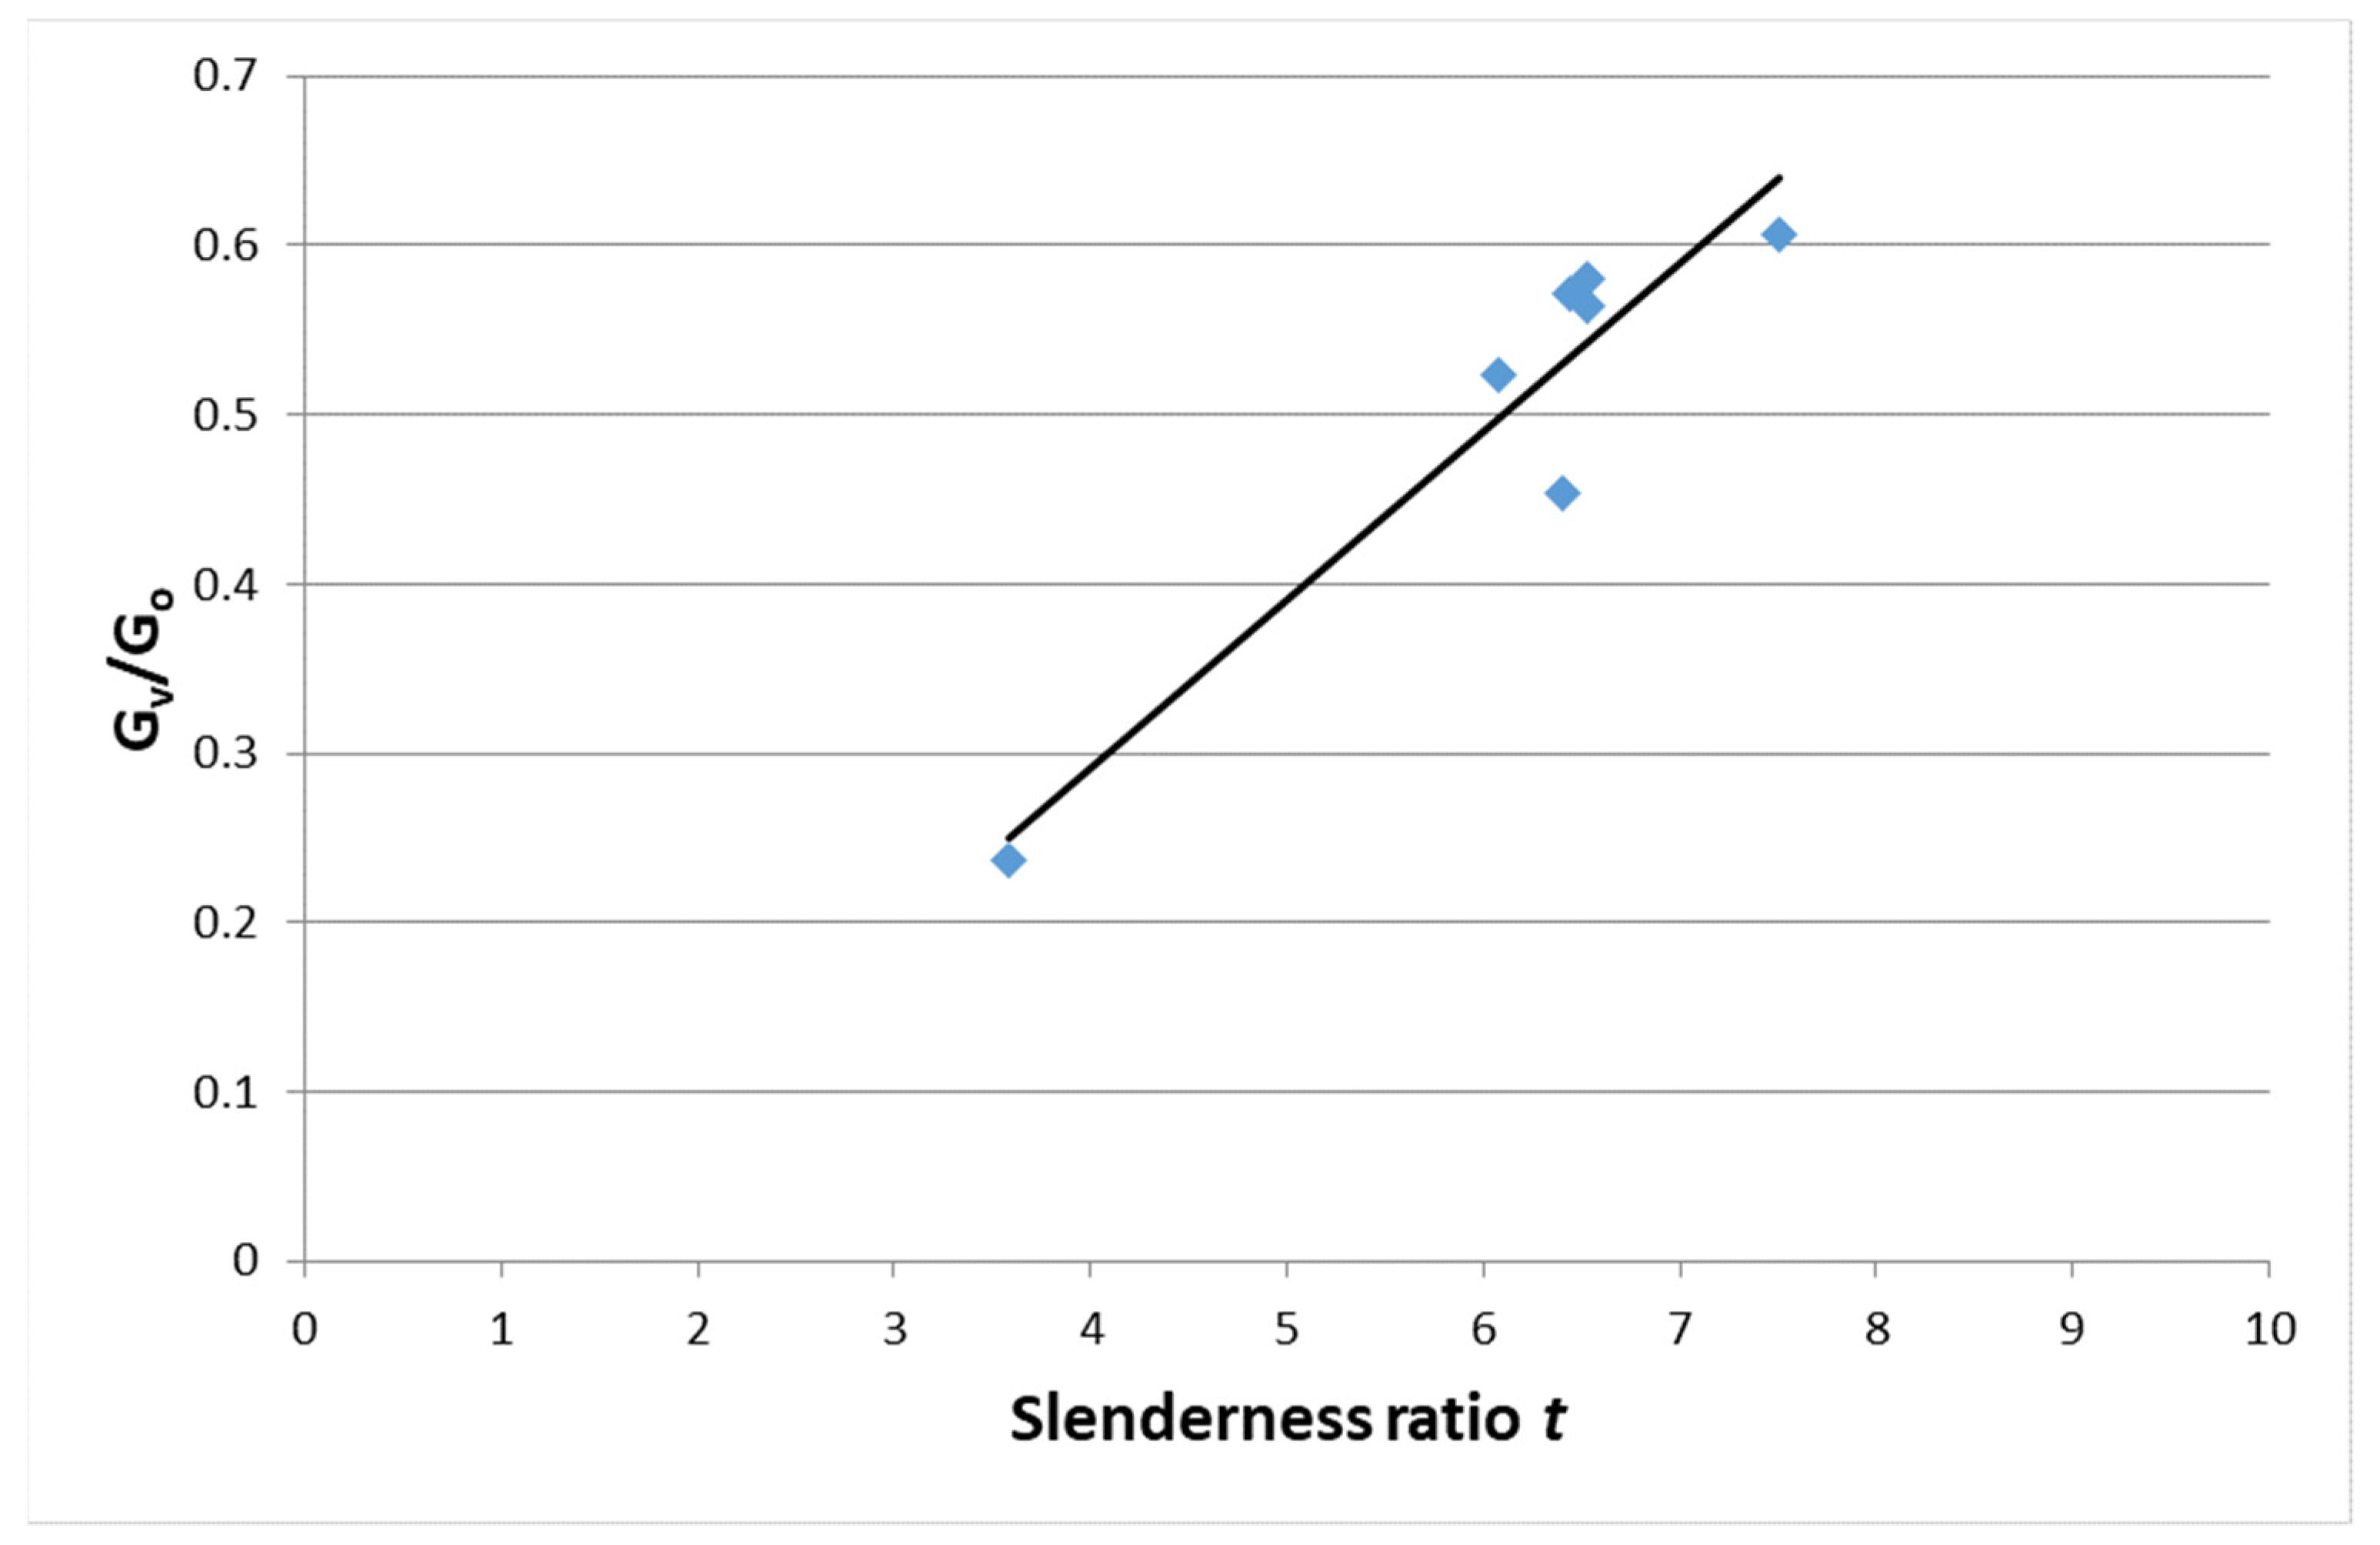
These compact low slenderness ratio remnants of the test specimen were weighed after the test. Their Gv weight to Go pre-test weight ratio ranged from 0.45 to 0.61, with an average of 0.55. These values were found for a w/h ratio ranging from 6.25 to 7.69. The graphical dependence of the Gv/Go ratio on the slenderness ratio is shown in Figure 9.
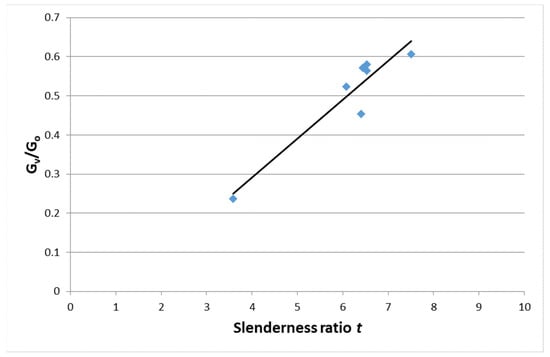
Figure 9.
Ratio of the hardened part of the sample to the original sample as a function of t.
The linear regression relationship with the index of determination R2 = 0.89 has the form
Gv/Go = 0.0994t − 0.106
For the pillars used with a w/h ratio of 8.33, this equation yields Gv/Go = 0.72.
For this representation of the volumetric state of stress in a 25 m wide and 3 m high pillar, the loosening of the pillars would occur to a depth of 1.9 m. In the case under consideration, this value for the loosening of the pillars could not be verified because, for safety reasons, the sides of the chambers were reinforced with roof bolts.
As the slenderness ratio of the pillars decreases, the impact of more discontinuities in a larger volume on the resulting bearing capacity of the pillars changes. Even though the entire column is interspersed with a large number of discontinuities, the majority of the column volume is in a bulk state of tension, and the discontinuities contained within it do not contribute as much to the reduction in the column capacity. It can be seen clearly in the strengthened low-slenderness-ratio residue of the test specimen after compression testing. The original discontinuities in this part of the test specimen have been compressed via the volumetric compression, giving the test specimen a higher strength.
The laboratory-determined compressive strength is influenced by the amount of friction on the compression surfaces. Many papers [3,4,5,32,33,34,35,36,37] have addressed this issue. These works clearly show that lower friction between the test specimen and the loading mechanism also lowers compressive strength. In the laboratory tests, we used very smooth steel jaws, which showed a coefficient of friction of 0.45 with the coal samples. The pillars in mining conditions have sandstone in the overburden and siltstone in the bedrock. Thus, the coefficient of friction between the pillar and the surrounding rocks will definitely be higher than in the laboratory tests. For this reason, the laboratory compressive strength results could not be influenced upwards.
The published results of the effect of friction on the pushing surfaces of the test specimens only considered the same friction on both pushing surfaces. In reality, these frictions between the pillar and the overburden/bedrock are often different. It would be interesting to see how the different friction on the compression surfaces of the test specimen affects the measured compressive strength.
Another influencing factor for laboratory-determined compressive strength is the laboratory conditions. The jaws of the loading mechanism have significantly different elastic properties than the rock under investigation [38,39]. The degree of this influence will depend on the situation in the part of the mountain massif under consideration. If we assess the bearing capacity of a pillar that has rocks with the same mechanical properties as the pillar above and below it, then this influence may be more pronounced. In the case we are considering, rocks with a significantly higher deformation modulus and lower Poisson’s number are above and below the coal pillar. For this reason, this influencing factor will not be as important, as the loading of the coal sample in the laboratory is partly similar to the loading of the coal pillar under mine conditions in this respect.
When assessing the bearing capacity of rock pillars, the frequency of discontinuity surfaces is an important influencing factor [40]. This phenomenon is more evident in slender pillars, which are more severely affected by the presence of discontinuities than wider pillars. This study has also shown that as the slender ratio decreases below 0.8, the confining stresses within a pillar approach zero and brittle fracturing can occur throughout the unconfined pillar core. The fracturing and spalling failure mechanism is poorly understood, and it seems prudent to avoid designing pillars with slenderness ratio <0.8 that might fail in this manner. The parameter evaluating the frequency of discontinuity areas is directly included in the calculation of the bearing capacity of rock pillars. However, in the evaluation of coal pillars, the number of discontinuity surfaces is difficult to determine, and the slender ratio is commonly >0.8; therefore, it is usually not taken into account. In some cases, however, the effect of the size of the test specimens is considered, which indirectly takes into account the number of discontinuity surfaces.
For the determination of the deformation of the pillars, we use the modulus of transformation—Equation (6). For the slenderness ratio t = 8.33, Ep = 5500 MPa. With a chamber width of 6 m and a pillar width of 25 m, the area of excavated space per chamber is 336 m2. This excavated space constitutes 53.8% of the pillar area. The load on the pillar is increased by this percentage relative to the originally applied stress. The distance of room and pillar mining is mostly more than 100 m from longwall faces. Therefore, the additional load from the longwall faces is negligible. We can, therefore, assume an initial stress corresponding to a depth of 800 m, which is 20 MPa. After the chambers have been cut, the stress increases to σp = 30.75 MPa. The stress will, therefore, increase to = 10.75 MPa. The total vertical deformation of the pillar ∆h is given by the equation
The entire 3 m pillar is lowered by 6 mm by excavating the surrounding chambers.
The safety factor SF depends on the stress acting on the pillar.
The load capacity of the pillar according to Equation (2), which expresses the linear dependence of the strength of the specimen on the slenderness ratio w/h = 8.33, is 101.5 MPa, and according to Equation (3) for the power curve, it is 99.3 MPa. From these values, SF = 3.2. In reality, this value will be lower because we did not have the opportunity to investigate the effect of the increase in the volume of the test specimens on the resulting bearing capacity of the pillars. The high value of the calculated safety factor ensures that the actual pillars will be very stable.
5. Conclusions
Our measurements and observations of the in situ behaviour of the pillars have shown that the relationships derived for mining conditions at shallower depths and other locations cannot be applied to determine the dependence of coal strength on the slenderness ratio.
The strength versus slenderness ratio w/h can be expressed as a linear function or power function. There is a negligible difference between them.
Our laboratory measurements were burdened by two conflicting issues that we could not quantify. On the one hand, it is the effect of the volume of the test specimens, with larger test specimens showing lower strength. On the other hand, it is a fact that the samples were taken from locations where they were already subjected to stresses higher than their strength. This effect may, in turn, reduce the measured strength values.
The total calculated vertical deformation of the pillars in the bottom pillar is very low and cannot endanger the stability of the mineshaft and surface structures.
The calculated safety factor shows that the chosen dimensions of the pillars should guarantee the long-term stability of the pillars.
Based on experimental operation of room and pillar mining method in conditions of the ČSM mine and the geotechnical monitoring carried out so far [41], it is possible to state that the laboratory measured data and theoretical assumptions were correct and correspond to the data measured in the framework of in situ geotechnical monitoring.
Author Contributions
Conceptualization, J.Š., V.P. and V.H.; methodology, J.Š. and V.P.; software, P.Z.; validation, J.Š., V.P. and P.Z.; formal analysis, J.Š. and V.H.; investigation, J.Š. and V.P.; resources, V.H. and P.Z.; data curation, J.Š. and V.P.; writing—original draft preparation, J.Š.; writing—review and editing, P.Z.; visualization, P.Z.; supervision, V.P and V.H. All authors have read and agreed to the published version of the manuscript.
Funding
This research received no external funding.
Institutional Review Board Statement
Not applicable.
Informed Consent Statement
Not applicable.
Data Availability Statement
The raw data supporting the conclusions of this article will be made available by the authors on request.
Conflicts of Interest
The authors declare that they have no known competing financial interests or personal relationships that could have appeared to influence the work reported in this paper.
References
- Bieniawski, Z.T. The effect of specimen size on the compressive strength of coal. Int. J. Rock Mech. Min. Sci. 1967, 5, 325–335. [Google Scholar] [CrossRef]
- The Complete IRSM Suggested Methods for Rock Characterisation, Testing and Monitoring; IRSM Turkish National Group Ankara: Ankara, Turkey, 2007; ISBN 978-975-93475-4-1.
- Prassetyo, S.H.; Irnawan, M.A.; Simangunsong, G.M.; Wattimena, R.K.; Arif, I.; Rai, M.A. New coal pillar strength formulae considering the effect of interface friction. Int. J. Rock Mech. Min. Sci. 2019, 123, 104102. [Google Scholar] [CrossRef]
- Prassetyo, S.H. The Influence of Interface Friction and W/H Ratio in the Violence of Coal Specimen Failure. Master’s Thesis, West Virginia University, Morgantown, WV, USA, 2011. [Google Scholar]
- Prassetyo, S.H.; Rashed, G.; Li, Y.; Luo, Y.; Peng, S. The influence of interface friction and W/H ratio on the violence of coal specimen failure-A comparison between a bump and non-bump prone mines. In Proceedings of the 30th International Conference on Ground Control in Mining, Morgantown, WV, USA, 26–28 July 2011; West Virginia University: Morgantown, WV, USA, 2011; pp. 1–13. [Google Scholar]
- van der Merwe, J.N. New pillar strength formula for South African coal. J. S. Afr. Inst. Min. Metall. 2003, 103, 281–292. [Google Scholar]
- Bieniawski, Z.T. In situ strength and deformation characteristics of coal. Eng. Geol. 1968, 2, 325–340. [Google Scholar] [CrossRef]
- Bunting, D. Chamber pillars in deep anthracite mines. Trans. AIME 1911, 42, 236–245. [Google Scholar]
- Bauschinger, J. Mitteilungen aus dem Mechanisch Technishen Laboratorium; Hochschule München: Munich, Germany, 1876. [Google Scholar]
- Galvin, J.M.; Hebblewhite, B.K.; Salamon, M.D.G. UNSW pillar strength determinations for Australian and South African conditions. In Rock Mechanics for Industry: Proceedings of the 37th U.S. Symposium; A.A. Balkema: Rotterdam, The Netherlands, 1999; pp. 63–71. [Google Scholar]
- Mark, C.; Chase, F. Analysis of Retreat Mining Pillar Stability. In Proceedings: New Technology for Ground Control in Retreat Mining-NIOSH IC 9446; National Institute of Occupational Safety and Health: Pittsburgh, PA, USA, 1997; pp. 17–34. [Google Scholar]
- Madden, B.J. A re-assessment of coal-pillar design. J. S. Afr. Inst. Min. Metall. 1991, 91, 27–37. [Google Scholar]
- Sheorey, P.R. Design of coal pillar arrays, chain pillars. In Comprehensive Rock Engineering; Pergamon: Oxford, UK, 1992; Volume 2, pp. 631–670. [Google Scholar]
- Salamon, M.D.G.; Wagner, H. Practical Experiences in the Design of Coal Pillars. In Proceedings of the 21st International Conference of Safety in Mines Research, Sydney, Australia, 21–25 October 1985; A.A. Balkema: Rotterdam, The Netherlands, 1985. [Google Scholar]
- Wagner, H.; Madden, B.J. 47 Fifteen years’ experience with the design of coal pillars in shallow South African collieries: An evaluation of the performance of the design procedures and recent improvements. In Design and Performance of Underground Excavations: ISRM Symposium; British Geotechnical Society: Cambridge, UK, 1984; pp. 391–399. [Google Scholar]
- Holland, C.T. Pillar design for support of the over burden in coal mines. In Proceedings of the 9th Canada Symposium on Rock Mechanics, Montreal, ON, Canada, 13–15 December 1973; Department of Energy, Mines and Resources, Mines Branch: Ottawa, ON, Canada, 1973; pp. 114–139. [Google Scholar]
- Salamon, M.D.G.; Munro, A.H. A study of the strength of coal pillars. J. S. Afr. Inst. Min. Metall. 1967, 68, 55–67. [Google Scholar]
- Holland, C.T.; Gaddy, F.L. Some aspects of permanent support of overburden on coal beds. In Proceedings of the West Virginia Coal Mining Institute; Pennsylvania State University: University Park, PA, USA, 1957; pp. 43–66. [Google Scholar]
- Greenwald, H.P.; Howarth, H.C.; Hartmann, I. Experiments on Strength of Small Pillars of Coal in the Pittsburgh Bed; U.S. Department of the Interior, Bureau of Mines: Washington, DC, USA, 1939. [Google Scholar]
- Sinha, S.; Walton, G. A progressive S-shaped yield criterion and its application to rock pillar behavior. Int. J. Rock Mech. Min. Sci. 2018, 105, 98–109. [Google Scholar] [CrossRef]
- Peng, J.; Ngai, L.; Wong, Y.; Teh, C.I. A re-examination of slenderness ratio effect on rock strength: Insights from DEM grain-based modelling. Eng. Geol. 2018, 246, 245–254. [Google Scholar] [CrossRef]
- Wattimena, R.K.; Kramadibrata, S.; Sidi, I.D.; Azizi, M.A. Developing coal pillar stability chart using logistic regression. Int. J. Rock Mech. Min. Sci. 2013, 58, 55–60. [Google Scholar] [CrossRef]
- Mark, C.; Agioutantis, Z. Analysis of coal pillar stability (ACPS): A new generation of pillar design software. Int. J. Min. Sci. Technol. 2019, 29, 87–91. [Google Scholar] [CrossRef]
- Zhou, Z.; Zang, H.; Cao, W.; Du, X.; Chen, L.; Ke, C. Risk assessment for the cascading failure of underground pillar sections considering interaction between pillars. Int. J. Rock Mech. Min. Sci. 2019, 124, 104142. [Google Scholar] [CrossRef]
- St George, J.D. Structural effects on the strength of New Zealand coal. Int. J. Rock Mech. Min. Sci. 1997, 34, 299.e1–299.e11. [Google Scholar] [CrossRef]
- Bieniawski, Z.T. Discussion of pillar strength formulas. Rock Mech. 1977, 10, 107–110. [Google Scholar] [CrossRef]
- Sheorey, P.R.; Das, M.N.; Barat, D.; Prasad, R.K.; Singh, B. Coal pillar strength estimation from failed and stable eases. Int. J. Rock Mech. Min. Sci. 1987, 24, 347–355. [Google Scholar] [CrossRef]
- Das, M.N. Influence of width/height ratio on post-failure behaviour of coal. Int. J. Min. Geol. Eng. 1986, 4, 79–87. [Google Scholar] [CrossRef]
- Jawed, M.; Sinha, R.K.; Sengupta, S. Chronological evolution in coal pillar design for bord and pillar workings: A critical appraisal. J. Geol. Min. Res. 2013, 5, 1–11. [Google Scholar] [CrossRef]
- Gaddy, F.L. A Study of the Ultimate Strength of Coal as Related to the Absolute Size of Cubical Specimens Tested; Virginia Polytechnic Institute: Blacksburg, VA, USA, 1956; pp. 1–27. [Google Scholar]
- Wilson, A.H. The stability of underground workings in the soft rocks of the Coal Measures. Int. J. Min. Eng. Geotech. Geol. Eng. 1983, 1, 91–187. [Google Scholar] [CrossRef]
- Lawall, C.E.; Holland, C.T. Some Physical Characteristics of West Virginia Coals; West Virginia University Bulletin, Series 37, No. 8. IV; West Virginia University: Morgantown, WV, USA, 1937. [Google Scholar]
- Daniels, J.; Moore, L.D. The crushing strength of coal. Eng. Min. J. 1907, 84, 263–268. [Google Scholar]
- Meikle, P.G.; Holland, C.T. The Effect of Friction on the Strength of Model Coal Pillars; SME-AIME Preprint No. 65FM80; The American Institute of Mining, Metallurgical, and Petroleum Engineers: Chicago, IL, USA, 1965; pp. 322–326. [Google Scholar]
- Khair, A.W. Effect of Coefficient of Friction on the Compressive Strength of Model Coal Pillars. Master’s Thesis, West Virginia University, Morgantown, WV, USA, 1968. [Google Scholar]
- Pariseau, W.G.; Hustrulid, W.A.; Swanson, S.R.; Van Sambeek, L. Coal Pillar Strength Study (The Design of Production Pillars in Coal Mines); U.S. Department of the Interior, Bureau of Mines: Bruceton, PA, USA, 1977. [Google Scholar]
- Babcock, C.O. Constraint is the prime variable in pillar strength. In Proceedings of the 4th Conference on Ground Control in Mining, Morgantown, WV, USA, 22–24 July 1985; West Virginia University: Morgantown, WV, USA, 1985; pp. 105–116. [Google Scholar]
- Brady, B.T. The effect of confining pressure on the elastic stress distribution in a radially end-constrained circular cylinder. Int. J. Rock Mech. Min. Sci. 1971, 8, 153–164. [Google Scholar] [CrossRef]
- Brady, B.T. An exact solution to the radially end-constrained circular cylinder under triaxial loading. Int. J. Rock Mech. Min. Sci. Geomech. Abstr. 1971, 8, 165–178. [Google Scholar] [CrossRef]
- Esterhuizen, G.S.; Dolinar, D.R.; Ellenberger, J.L. Pillar strength in underground stone mines in the United States. Int. J. Rock Mech. Min. Sci. 2011, 48, 42–50. [Google Scholar] [CrossRef]
- Waclawik, P.; Ptacek, J.; Konicek, P.; Kukutsch, R.; Nemcik, J. Stress-state monitoring of coal pillars during room and pillar extraction. J. Sustain. Min. 2016, 15, 49–56. [Google Scholar] [CrossRef]
Disclaimer/Publisher’s Note: The statements, opinions and data contained in all publications are solely those of the individual author(s) and contributor(s) and not of MDPI and/or the editor(s). MDPI and/or the editor(s) disclaim responsibility for any injury to people or property resulting from any ideas, methods, instructions or products referred to in the content. |
© 2024 by the authors. Licensee MDPI, Basel, Switzerland. This article is an open access article distributed under the terms and conditions of the Creative Commons Attribution (CC BY) license (https://creativecommons.org/licenses/by/4.0/).