Article

Research on Hybrid Vibration Sensor for Measuring Downhole Drilling Tool Vibrational Frequencies

1
Shaanxi Shaanxi Coal Caojiatan Mining Co., Ltd., Yulin 719100, China
2
China Coal Technology & Engineering Group Coal Mining Research Institute, Beijing 100013, China
3
Mining Research Institute of China Coal Science Research Institute, Beijing 100013, China
4
Faculty of Mechanical and Electronic Information, China University of Geosciences (Wuhan), Wuhan 430074, China
5
Tiandi Science & Technology Co., Ltd., Beijing 100013, China
*
Author to whom correspondence should be addressed.
Appl. Sci. 2024, 14(12), 5014; https://doi.org/10.3390/app14125014
Submission received: 3 May 2024 / Revised: 3 June 2024 / Accepted: 6 June 2024 / Published: 8 June 2024
(This article belongs to the Section Electrical, Electronics and Communications Engineering)

Abstract

:
The vibration parameters during drilling play a critical role in enhancing drilling speed and ensuring safety. However, traditional downhole vibration sensors face limitations in their power supply methods, hindering widespread adoption. To address this challenge, our research introduces a novel solution: a hybrid downhole vibration sensor (HDV-TENG) utilizing triboelectric nanogenerators. This sensor not only enables the measurement of low- to medium–high-frequency vibrations using self-power but also serves to energize other downhole devices. We utilized a self-constructed vibration simulator to replicate downhole drilling tool vibrations and conducted a comprehensive series of sensor tests. The test results indicate that the frequency measurement bandwidth of the HDV-TENG spans from 0 to 200 kHz. Especially, the measurement errors for vibrations within the low-frequency range of 0 to 10 Hz and the high-frequency range of 10 to 200 k Hz are less than 5% and 8%, respectively. Additionally, the experimental findings regarding load matching demonstrate that the HDV-TENG achieves an output power level in the milliwatt range, representing a significant improvement over the output power of traditional triboelectric nanogenerators. Unlike traditional downhole vibration measurement sensors, HDV-TENG operates without requiring any external power supply, thereby conserving downhole space and significantly enhancing drilling efficiency. Furthermore, HDV-TENG not only offers a broad measurement range but also amplifies output power through the synergy of a triboelectric nanogenerator (TENG), piezoelectric nanogenerator (PENG), and electromagnetic power generator (EMG). This capability enables its utilization as an emergency power source for other micropower equipment downhole. The introduction of HDV-TENG also holds considerable implications for the development of self-powered underground sensors with high-frequency measurement capabilities.

1. Introduction

The drilling process is one of the key methods used to bore holes from the surface to extract various underground resources [1,2]. Throughout the drilling operation, the drill string tends to undergo nonlinear vibrations [3]. These vibrational patterns encapsulate significant drilling condition data, pivotal for mitigating drilling incidents, fine-tuning drilling parameters, and enhancing drilling velocity [4,5]. At present, there are mature measurement-while-drilling systems (MWD, LWD) used in drilling operations to measure the vibration of drill strings [6,7], as well as strain gauges [8], high-speed cameras [9], surface measurement and deep learning [10,11], dynamic model optimization [12,13], and other methods that have achieved good results in measuring vibration in the simulated downhole environment. Some scholars choose to install the measuring device on the surface to measure the vibration information of drilling tools [14]. Although numerous methods exist for measuring downhole vibrations, significant challenges persist under actual operational conditions. Traditional vibration measuring systems rely on cable or battery power sources, which can impede construction efficiency and increase costs related to tool processing, installation, and frequent drilling. Meanwhile, due to limitations in installation methods and size requirements, measurement approaches applicable in simulated environments often fall short of meeting downhole operational demands. Furthermore, indirect surface measurement methods are prone to cumulative errors due to the influence of the formation medium. Hence, there is an urgent need to develop a vibration sensor tailored for downhole conditions that also optimizes power supply methods.
The emergence of triboelectric nanogenerators (TENGs) in 2012 opened avenues for self-powered sensing and the harvesting and recycling micro-nanoenergy, offering a new dimension to the measurement and utilization of drilling tool vibrations [15]. Through extensive scholarly research, the principles of triboelectric nanoenergy generation have significantly evolved, particularly in the realms of energy harvesting and sensing [16,17]. In the field of energy collection, the principle of triboelectric nanoenergy generation has realized the collection of blue energy [18,19,20], mechanical energy [21,22,23], human motion energy [24,25,26], etc. In the field of sensing, research achievements such as speed sensing [27,28], pressure sensing [29,30], motion detection [31,32], and wearable devices [33,34,35] have been achieved; the power supply mode realizes self-sensing and self-power supply. Meanwhile, certain scholars have undertaken initial explorations into applying triboelectric nanoenergy generation in downhole drilling [36,37,38]. However, several challenges persist, notably the limited bandwidth of vibration measurement confined to low frequencies and inadequate power supply. The utilization of piezoelectric nanogenerators (PENGs) in the field of high-frequency vibration monitoring, as well as electromagnetic power generation (EMG) in the field of energy harvesting, provides references for addressing the aforementioned issues [39,40]. Based on this, this research proposes a hybrid downhole vibration sensor (HDV-TENG) based on triboelectric nanogenerators, which can realize the vibration frequency measurement from the low-frequency to high-frequency band in a self-powered manner. The sensor addresses the narrow frequency measurement range issue of conventional TENG-based vibration sensors. It not only achieves automatic force vibration sensing but also collects downhole vibration energy, providing power for other micropower devices. It offers a new solution to the power supply problem of downhole equipment and is undoubtedly more suitable for use in drilling conditions.

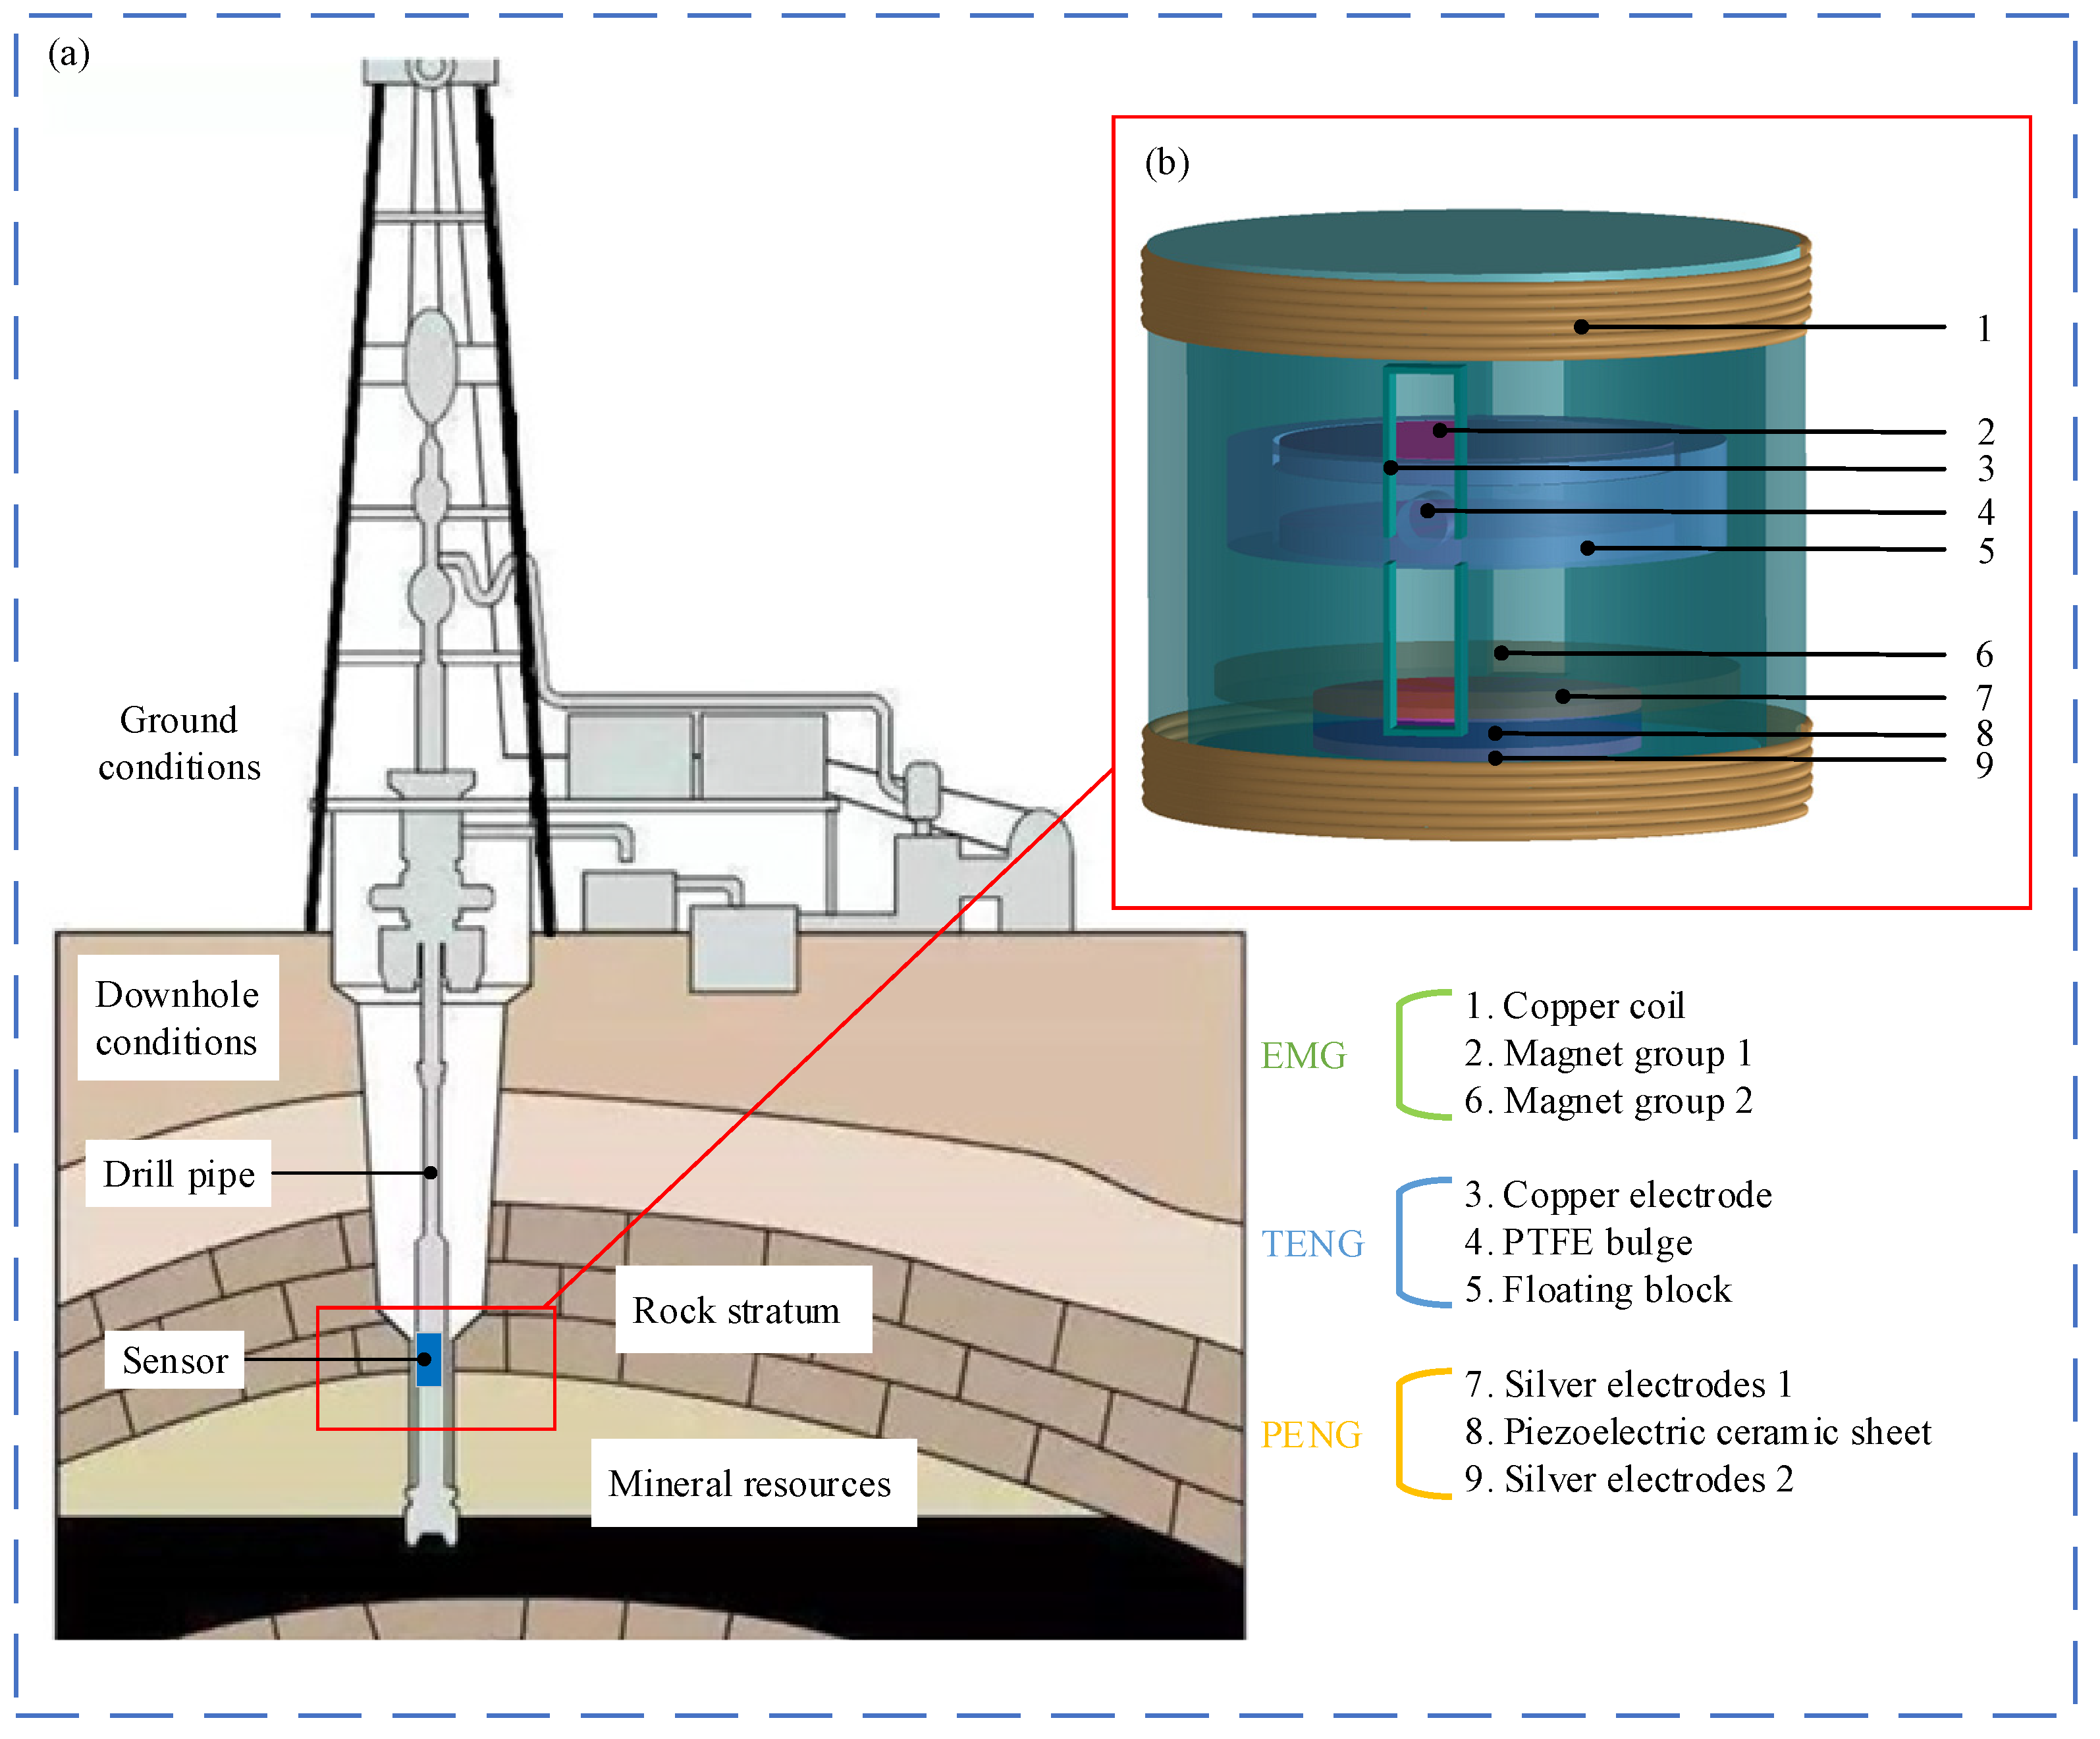
2. Structure and Principle

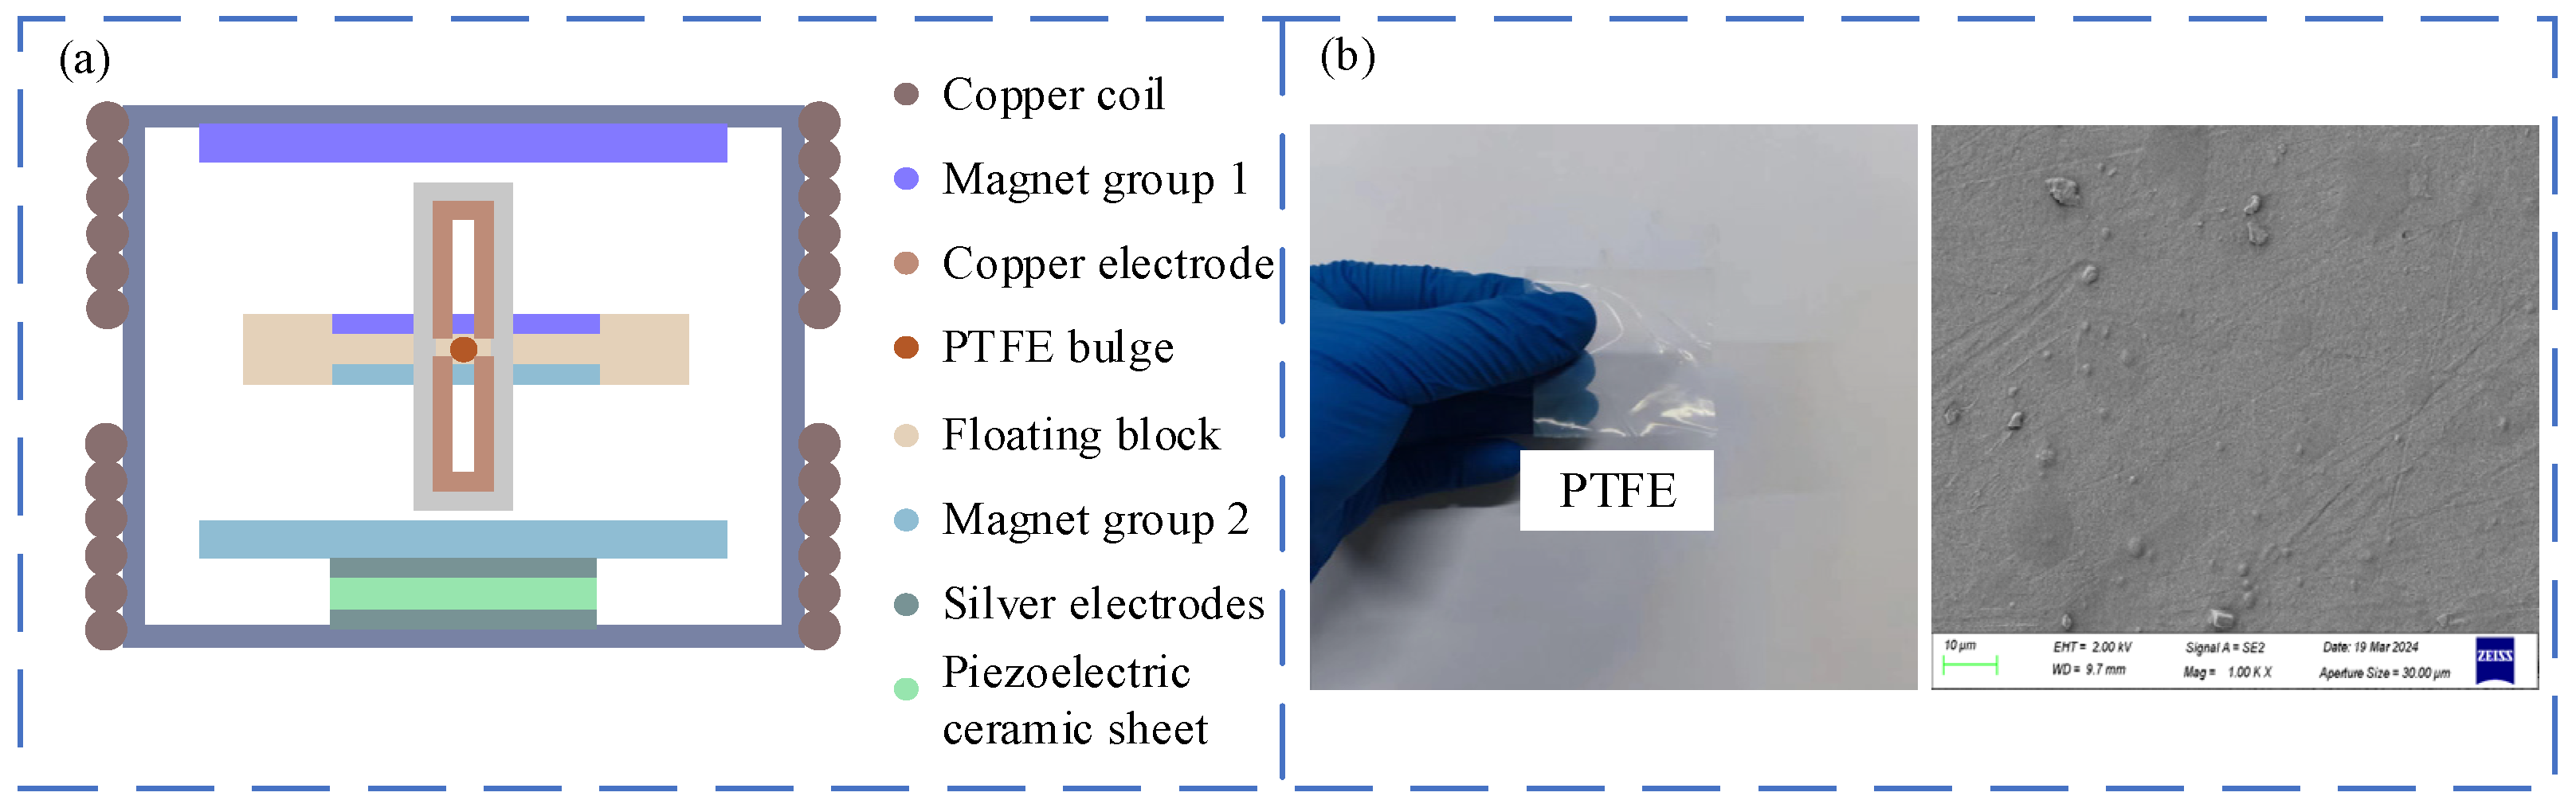
2.1. Structure Composition of HDV-TENG

Figure 1a illustrates the schematic diagram of the drilling working conditions, with the sensor installed within the measurement short section near the drill bit on the drill string. During the drilling process, the HDV-TENG can realize the collection of the vibration parameters of the drill pipe and the collection of vibration energy. Figure 1b shows a schematic diagram of the structure of the HDV-TENG. As shown in the figure, the sensor is cylindrical in shape overall, with a housing made of polyetheretherketone (PEEK) material in the form of a tube, with an outer diameter of 80 mm and a height of 120 mm. The HDV-TENG consists of three parts: TENG, PENG, and EMG. The TENG part consists of a set of copper electrodes (with a thickness of 0.05 mm) and a floating block. The floating block has a cylindrical protrusion in the middle, with its surface covered with polytetrafluoroethylene (PTFE) material (with a thickness of 0.05 mm). Additionally, each of the magnet assemblies 1 and 2 has a magnet (EH brand neodymium magnet) mounted on the surface of the floating block. The PENG part includes a piezoelectric ceramic sheet and a group of silver electrodes. The EMG part includes copper coils, and magnet groups 1 and 2. During the manufacturing process, the piezoelectric ceramic piece is first placed at the bottom of the PEEK tube. Once the TENG part of the sensor is installed, it is placed on top of the piezoelectric ceramic piece. Next, magnets 1 and 2 are installed based on the principle of like poles repelling each other so that the floating block is suspended inside the sensor. Finally, coils are wound around the outer shell of the sensor, completing the assembly of the sensor.

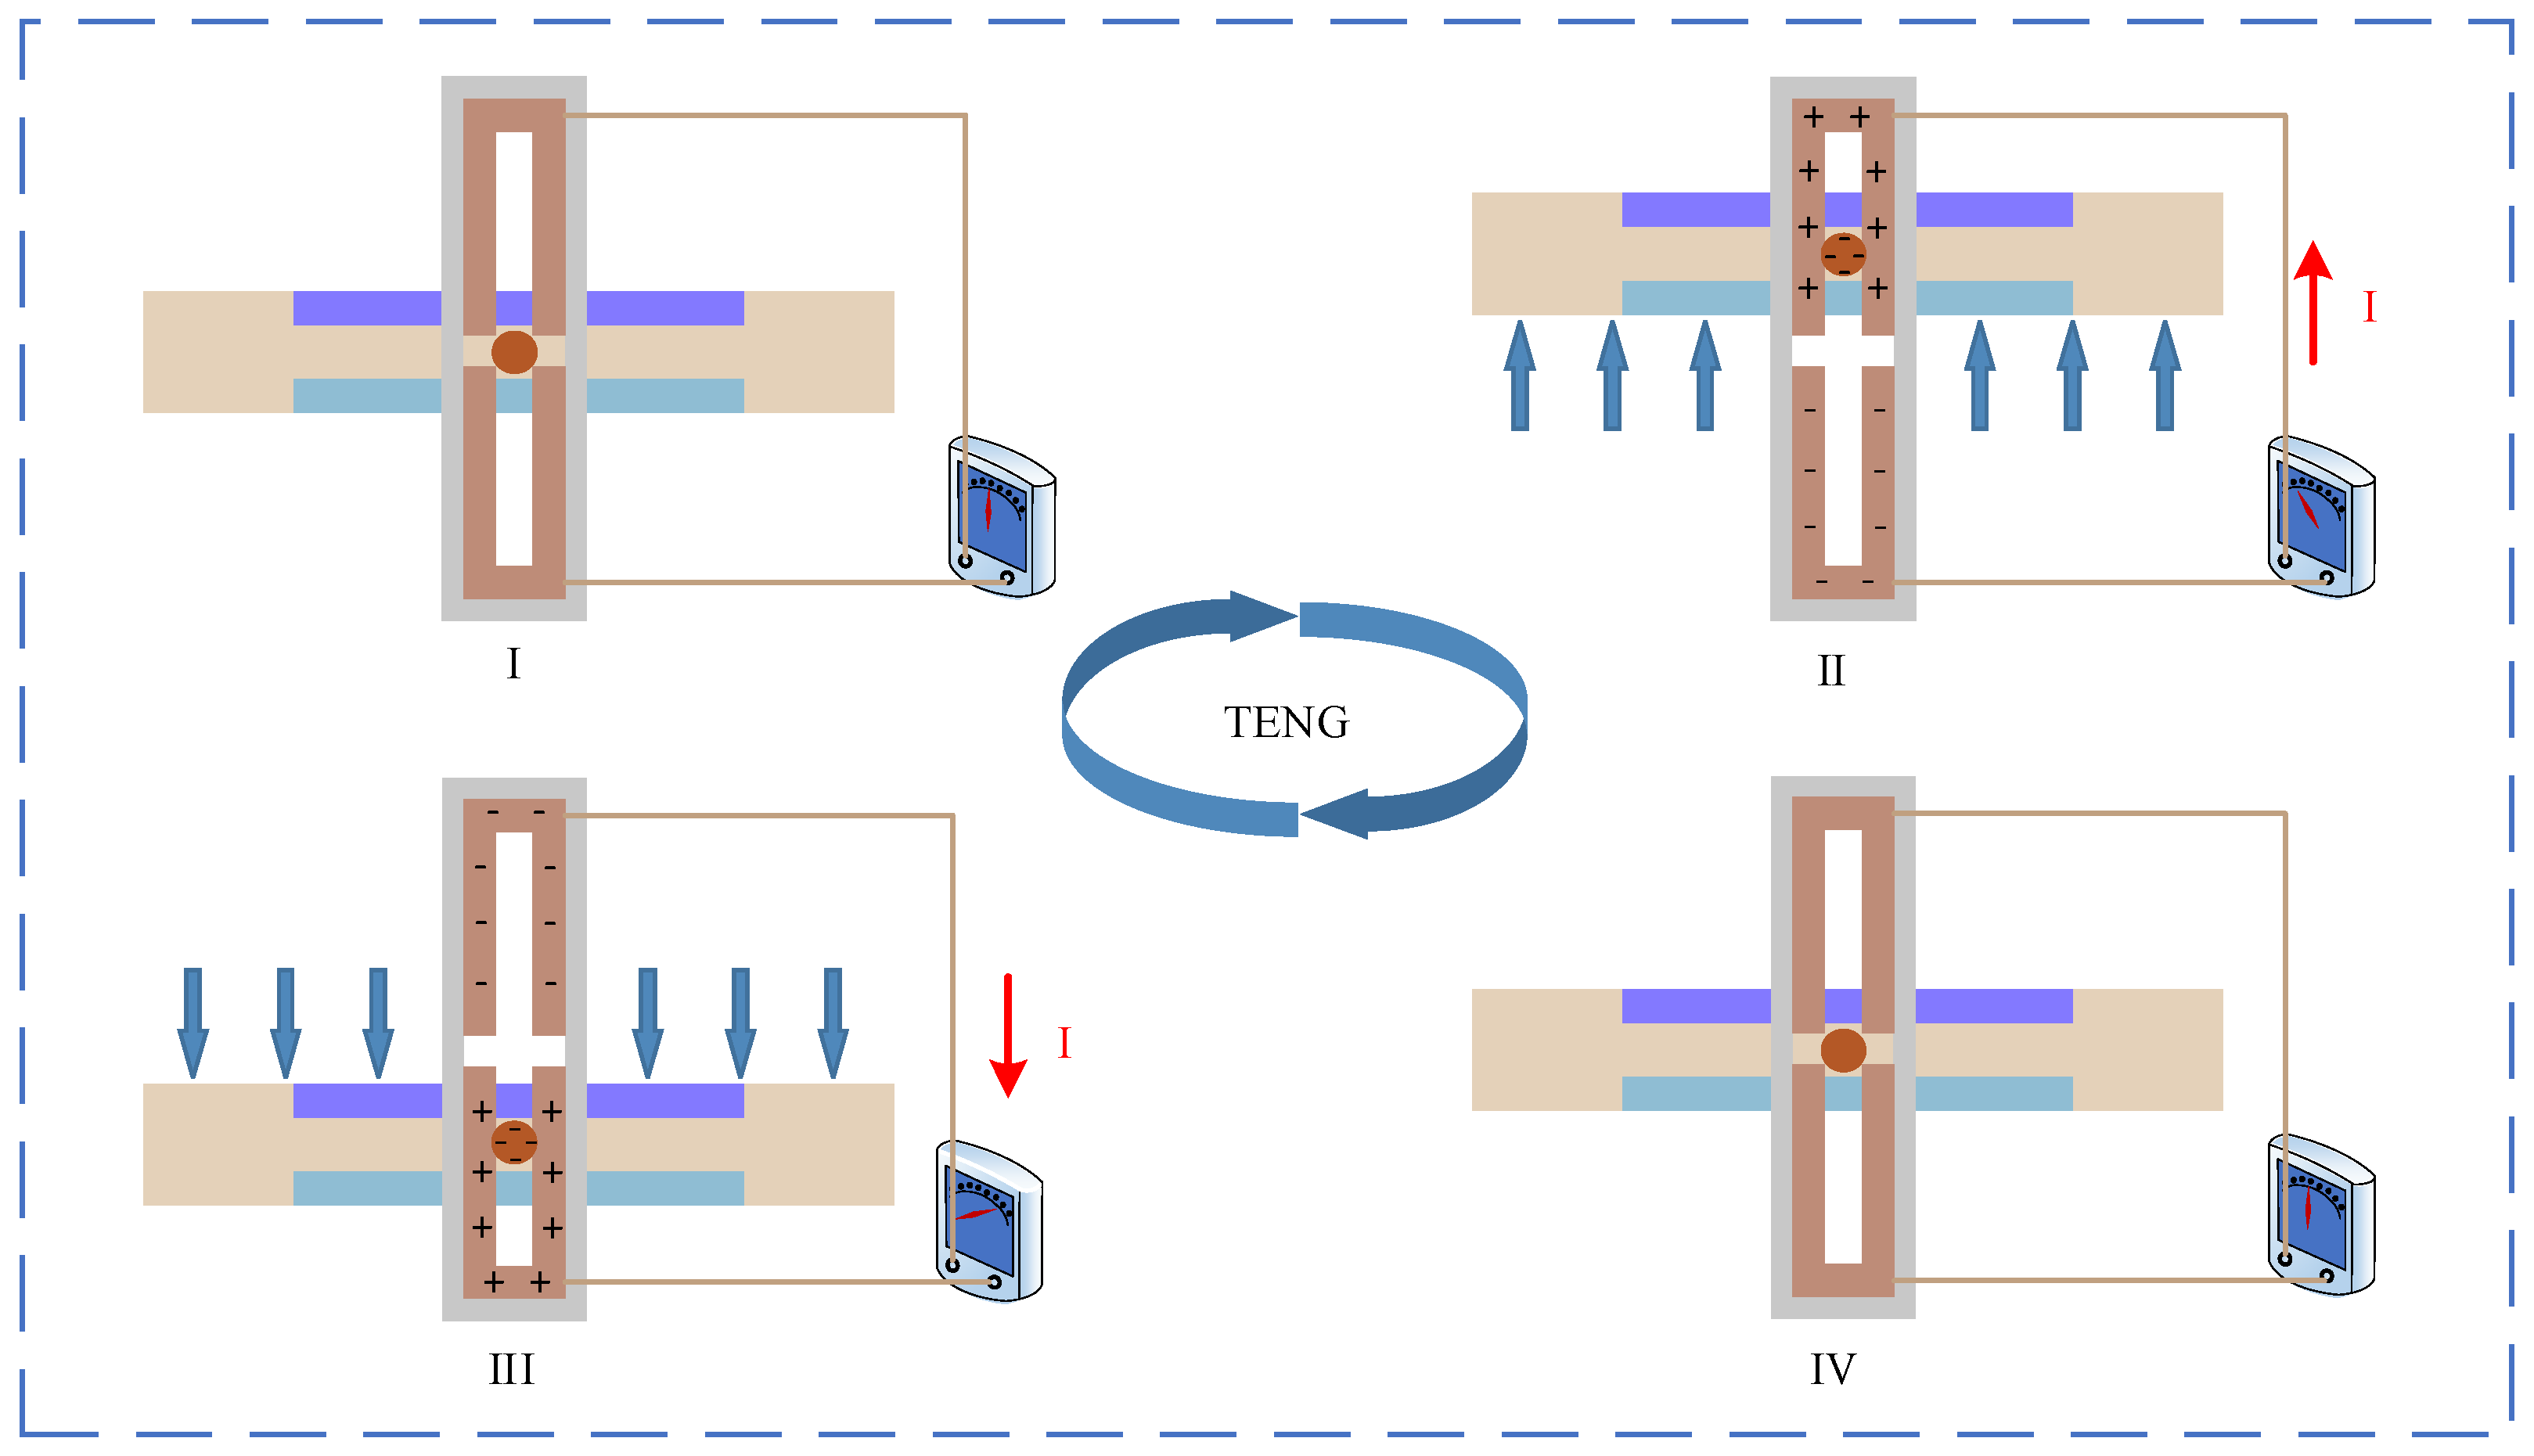
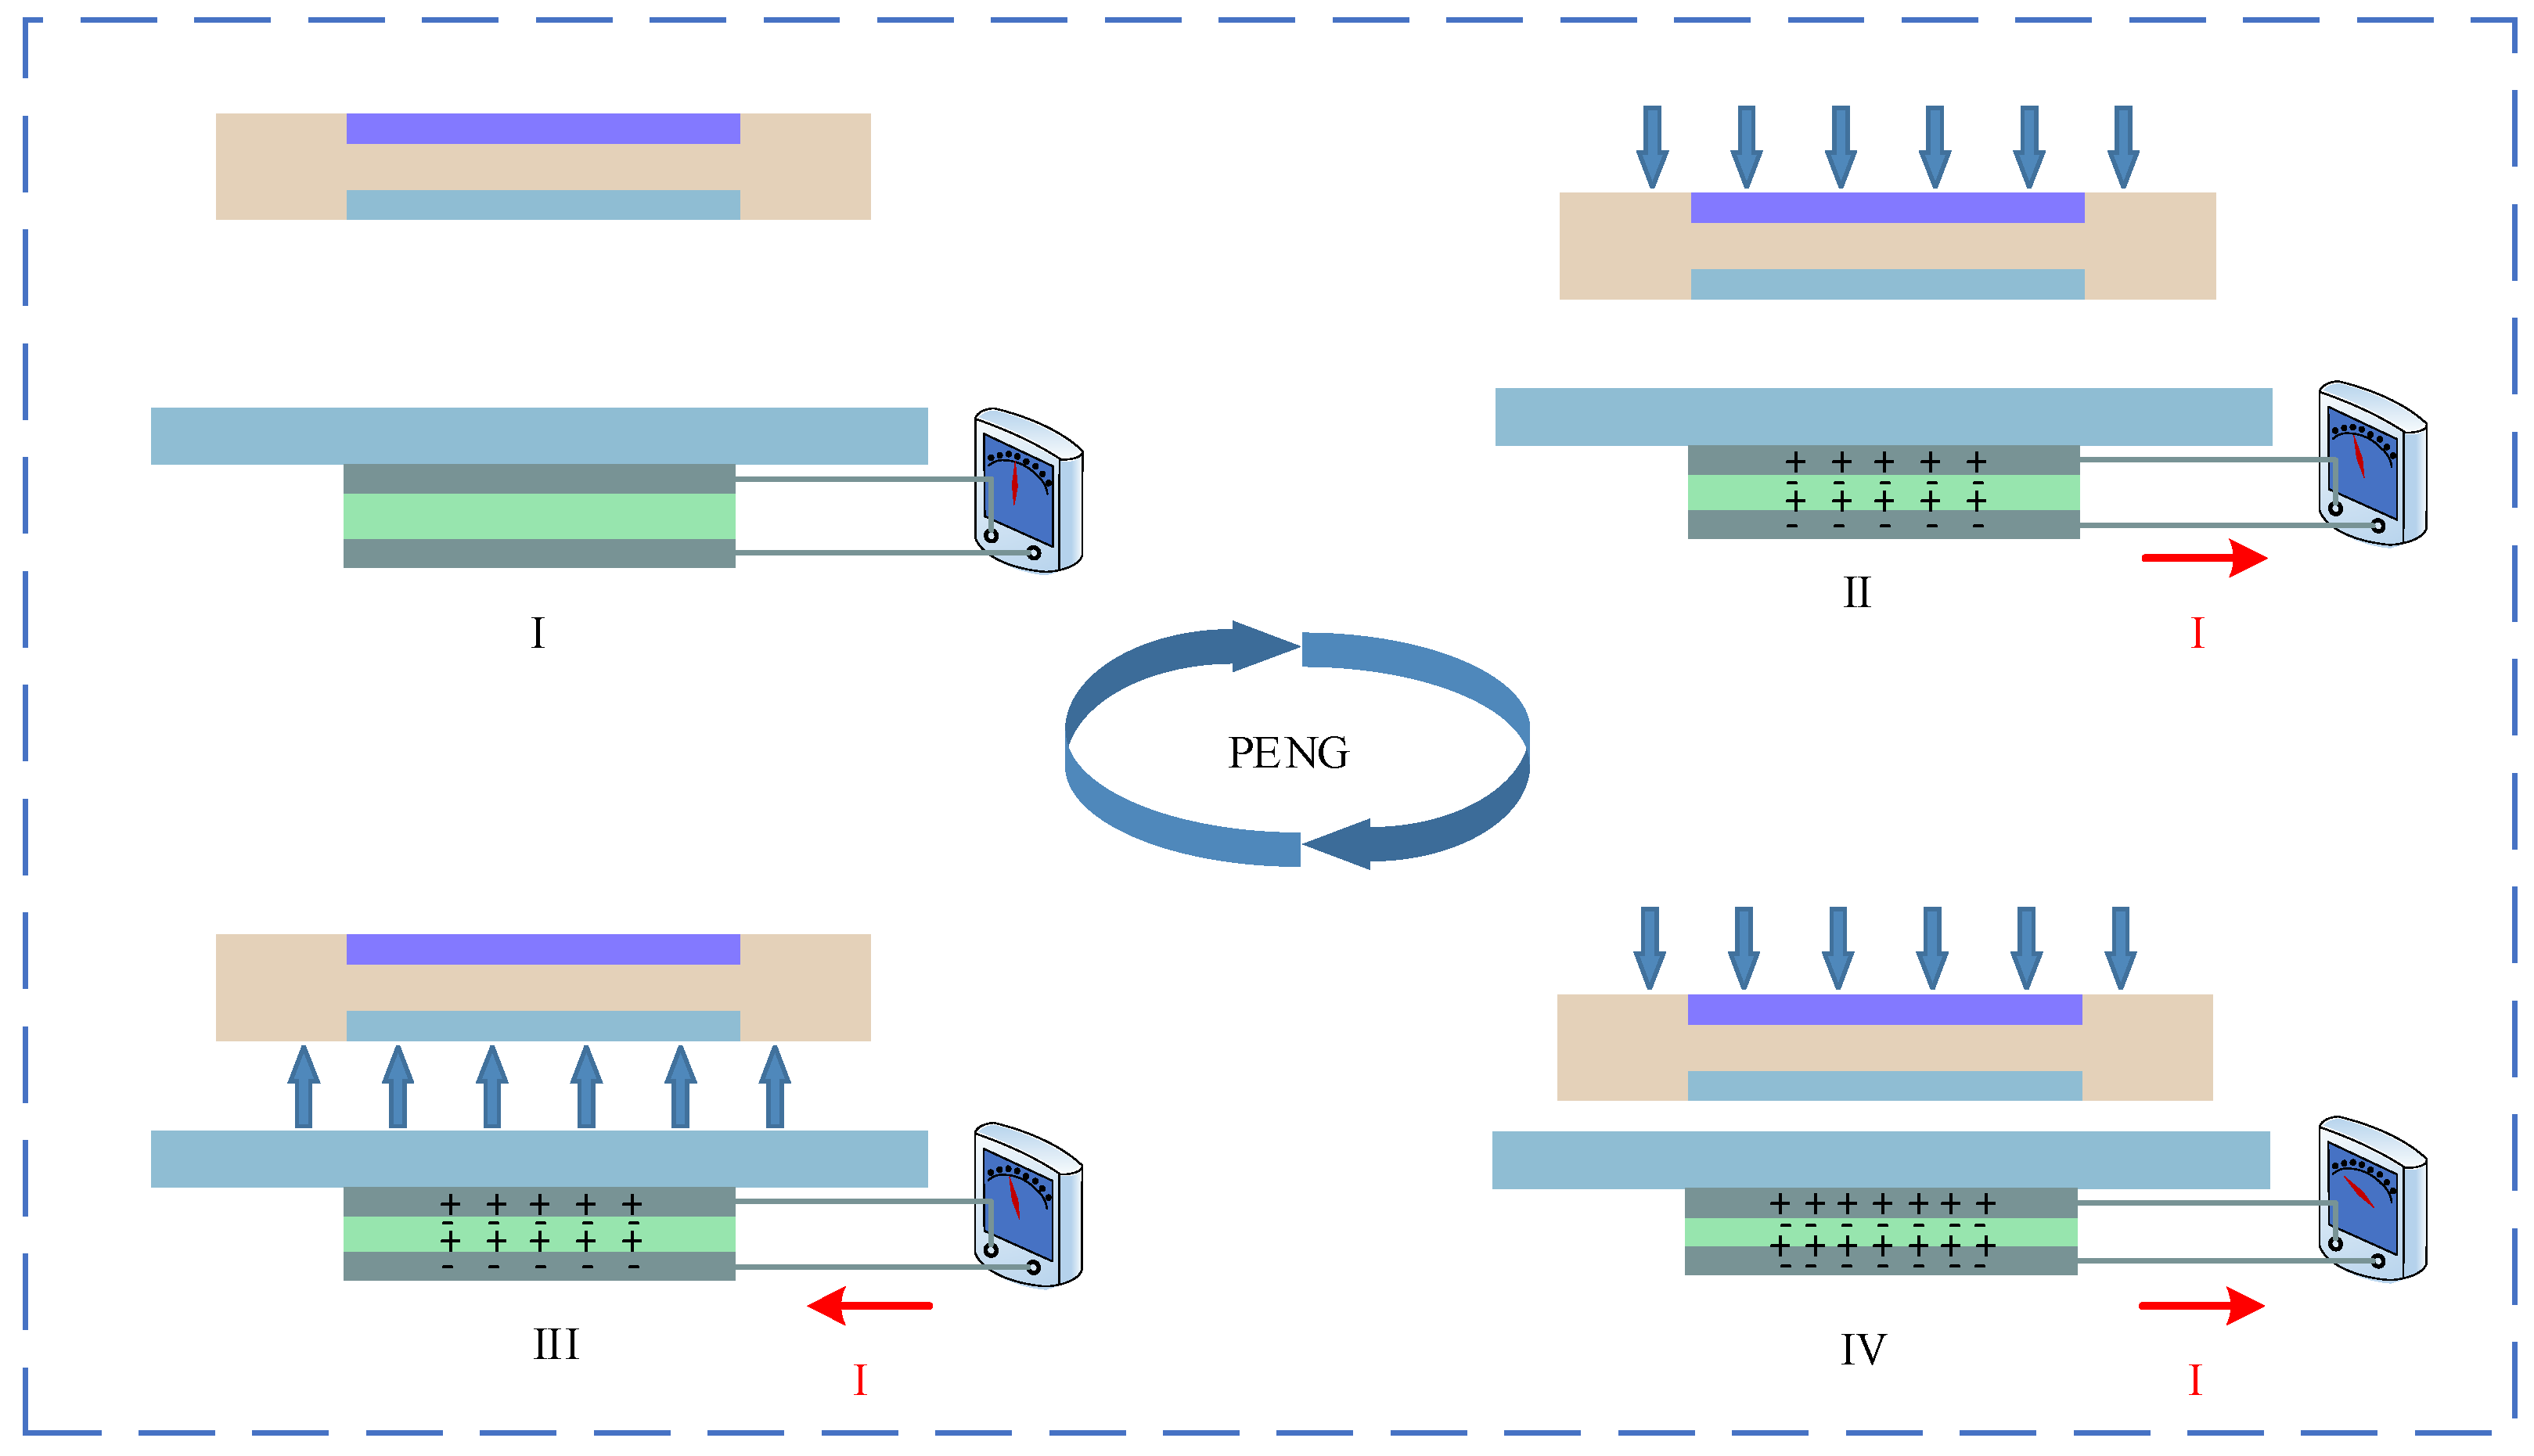
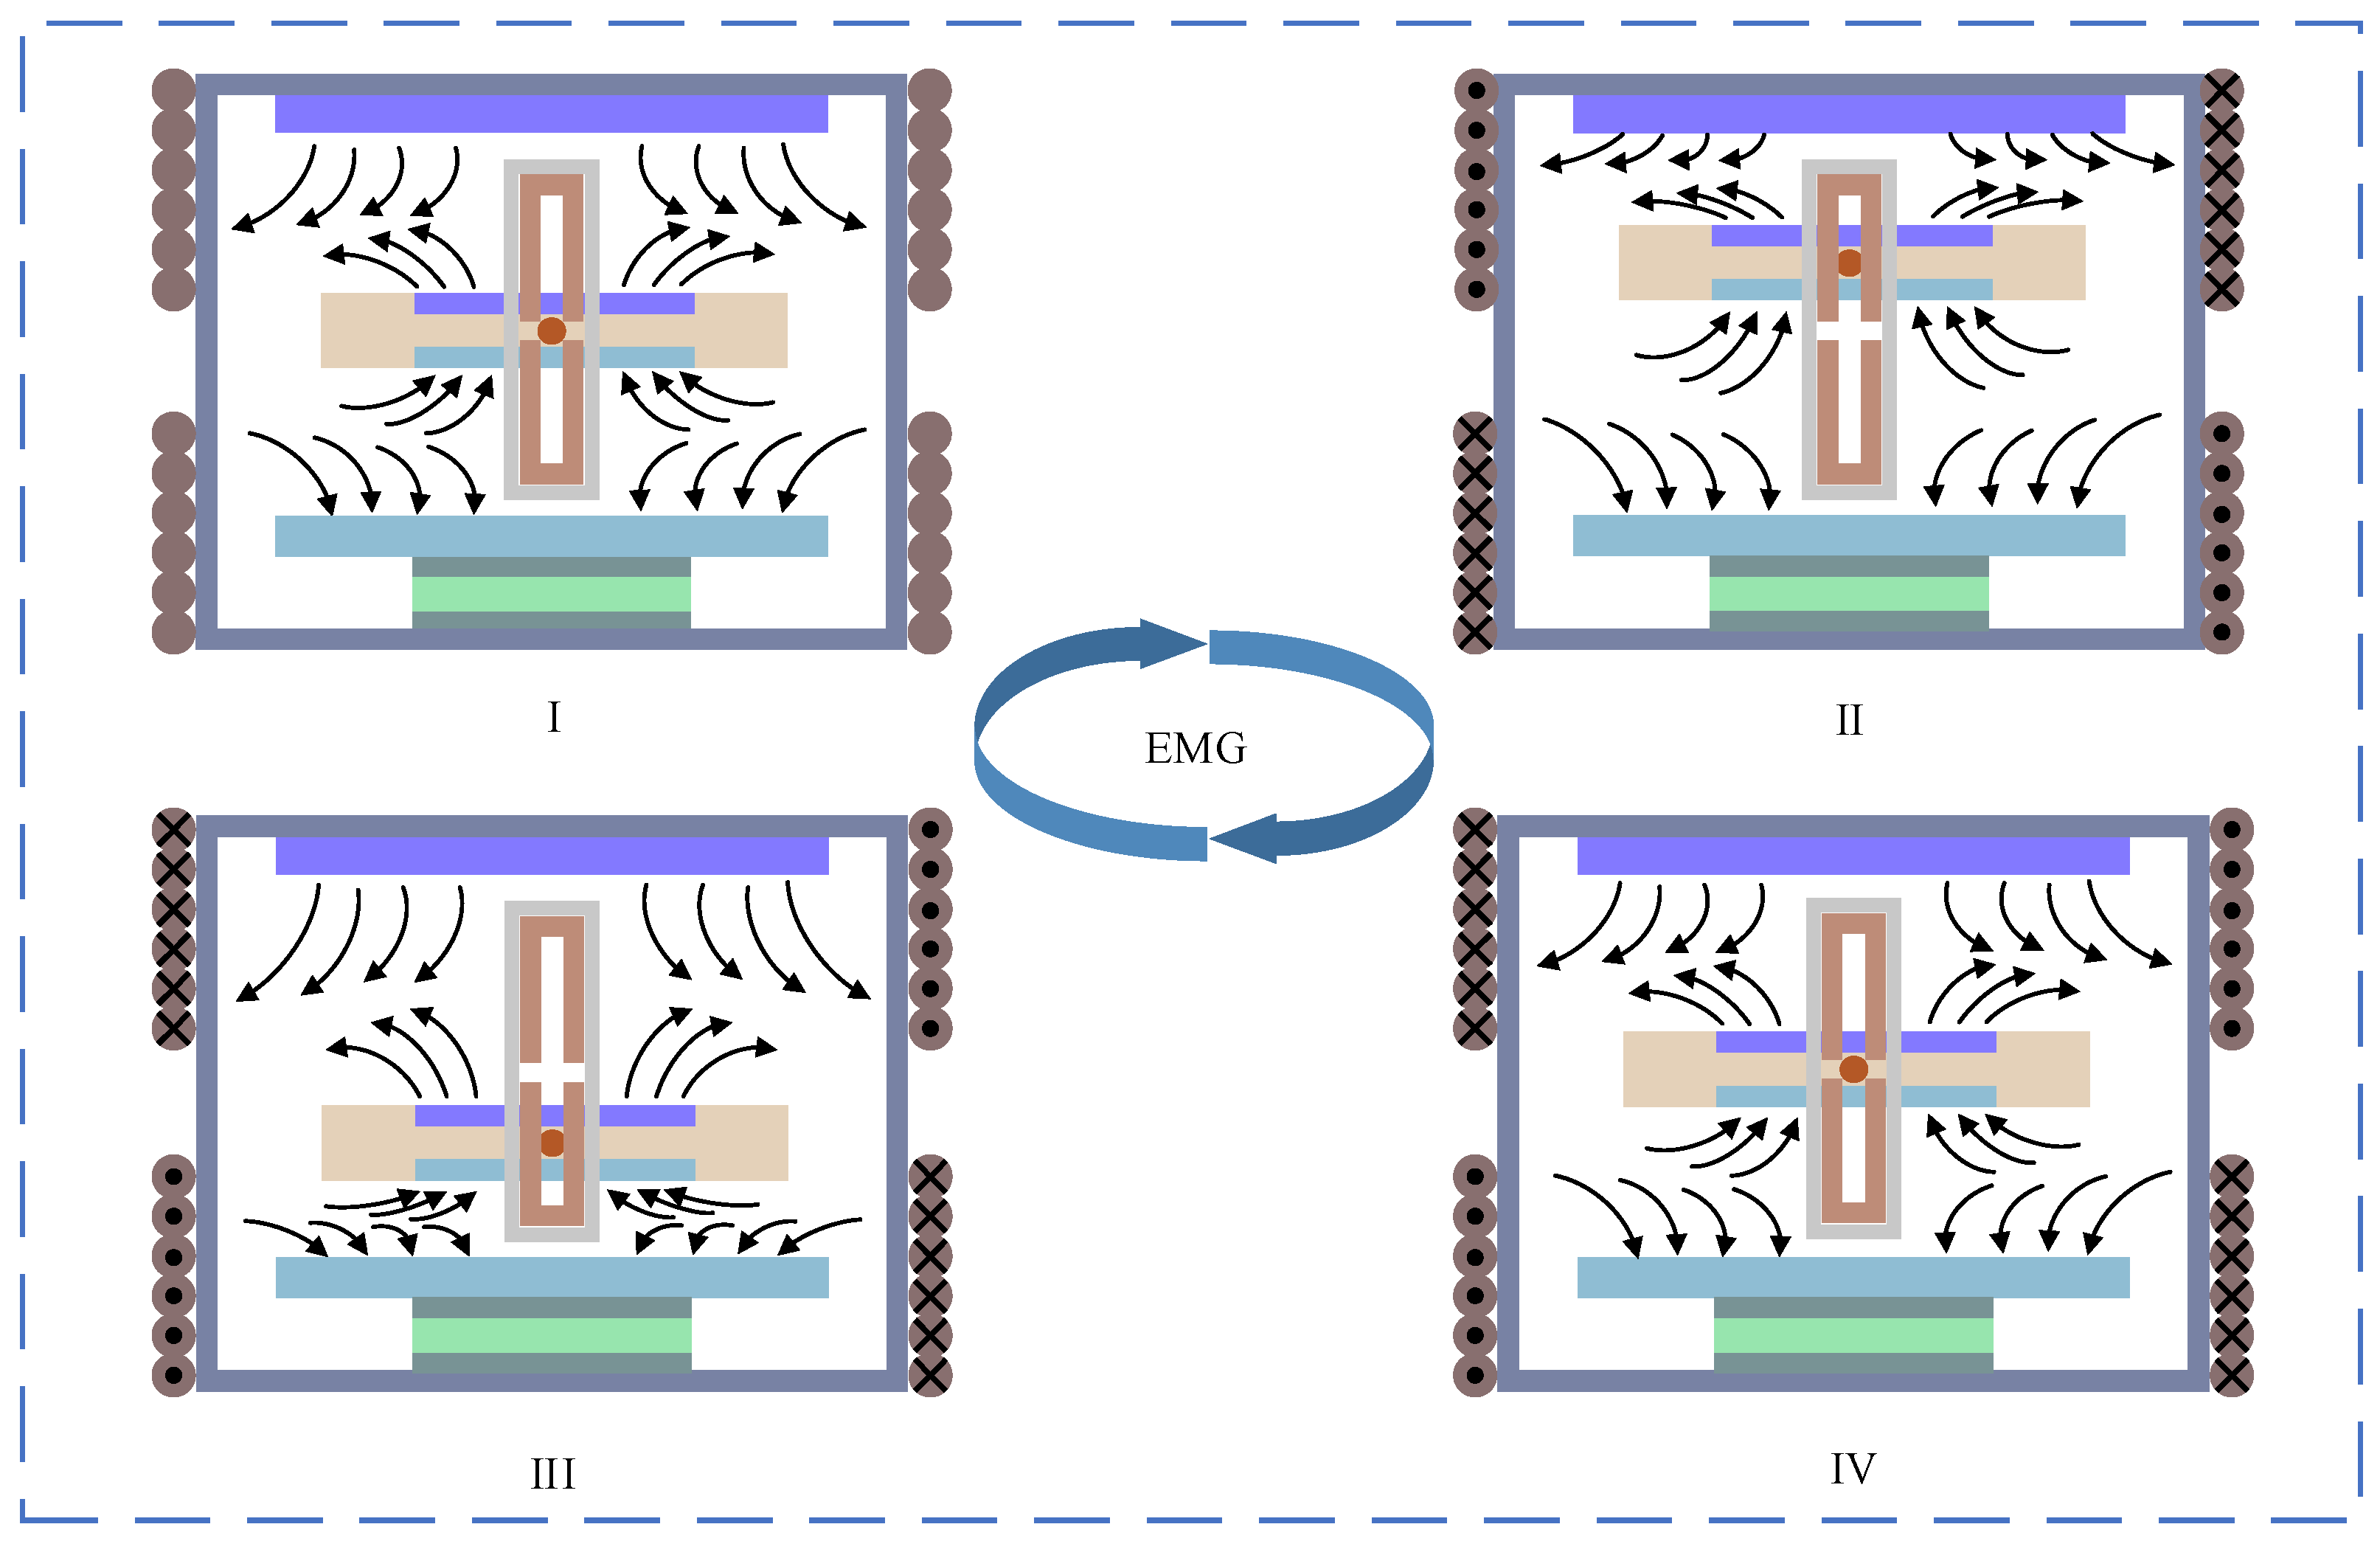
2.2. Working Principle of HDV-TENG

Figure 2a shows a cross-sectional view of the HDV-TENG, which supplements the structure of the HDV-TENG. During the working process of the drill pipe, the TENG, PENG, and EMG work together. The working principle is shown in Figure 3, Figure 4 and Figure 5; the floating block vibrates with the vibration of the drill pipe under the action of magnetic force, and the cylindrical protrusions on the suspension block contact and rub the copper electrodes to form an independent layer working mode. The physical photo and SEM image of the PTFE material in the TENG component are shown in Figure 2b.
During the rising process, the surface of the upper copper electrode generates positive induced charges, and the lower copper electrode generates negative induced charges due to the passage. The current direction at this time is calibrated to be positive, and the output is positive. For the pulse wave, when the floating block descends, oppositely induced charges are generated on the surfaces of the two copper electrodes. The current direction is calibrated to be negative at this time, and a negative pulse wave is output; the charge transfer is shown in Figure 3 I–IV. The current output equation for the TENG part is [41]
R A d σ I ( z , t ) d t = z σ c / ε 0 σ I ( z , t ) [ d 1 / ε 1 + d 2 / ε 2 + z / ε 0 ]
Among them, σI is the variation of free electrons in the electrode over time, and σc represents the surface charge density of the friction material.
The vertical vibration of the floating block acts on the bottom magnet in magnet group 2 through the magnetic force, so that the piezoelectric ceramic sheet is deformed by force, and opposite charges are induced on the surface of the piezoelectric ceramic sheet, resulting in a potential difference, and the calibration output current is positive. After the upward vibration magnetic force is weakened, the deformation of the piezoelectric ceramic sheet recovers, the potential difference decays to 0, the current also becomes 0, and a positive pulse wave is output, the charge transfer is shown in Figure 4 I–IV. The current output equation for the PENG part is [42]
R A d σ d t = z [ σ p ( z ) σ ( t ) ] / ε
Among them, A is the electrode area, and z is a function of time t.
During the vibrating process of the floating block, the copper coil cuts the magnetic field lines between the magnet groups 1 and 2 to induce electromotive force, leading to generating voltage and current, and the current changes are shown in Figure 5 I–IV.
The acquisition of vibration frequency is realized by two parts, including TENG and PENG, corresponding to the vibration measurement of low frequency and medium–high frequency, respectively. The measurement method obtains the real-time vibration frequency by calculating the number of pulse waves per unit time. In comparison to TENG and PENG, the output power of the EMG part is higher; thus, the collection of vibration energy is mainly achieved by the EMG part. The functions of each part of the sensor, as shown in Figure 6, indicate that the TENG part is responsible for measuring low-frequency vibrations, the PENG part is responsible for measuring high-frequency vibrations, and the EMG part implements the power generation function of the sensor.

3. Experiments

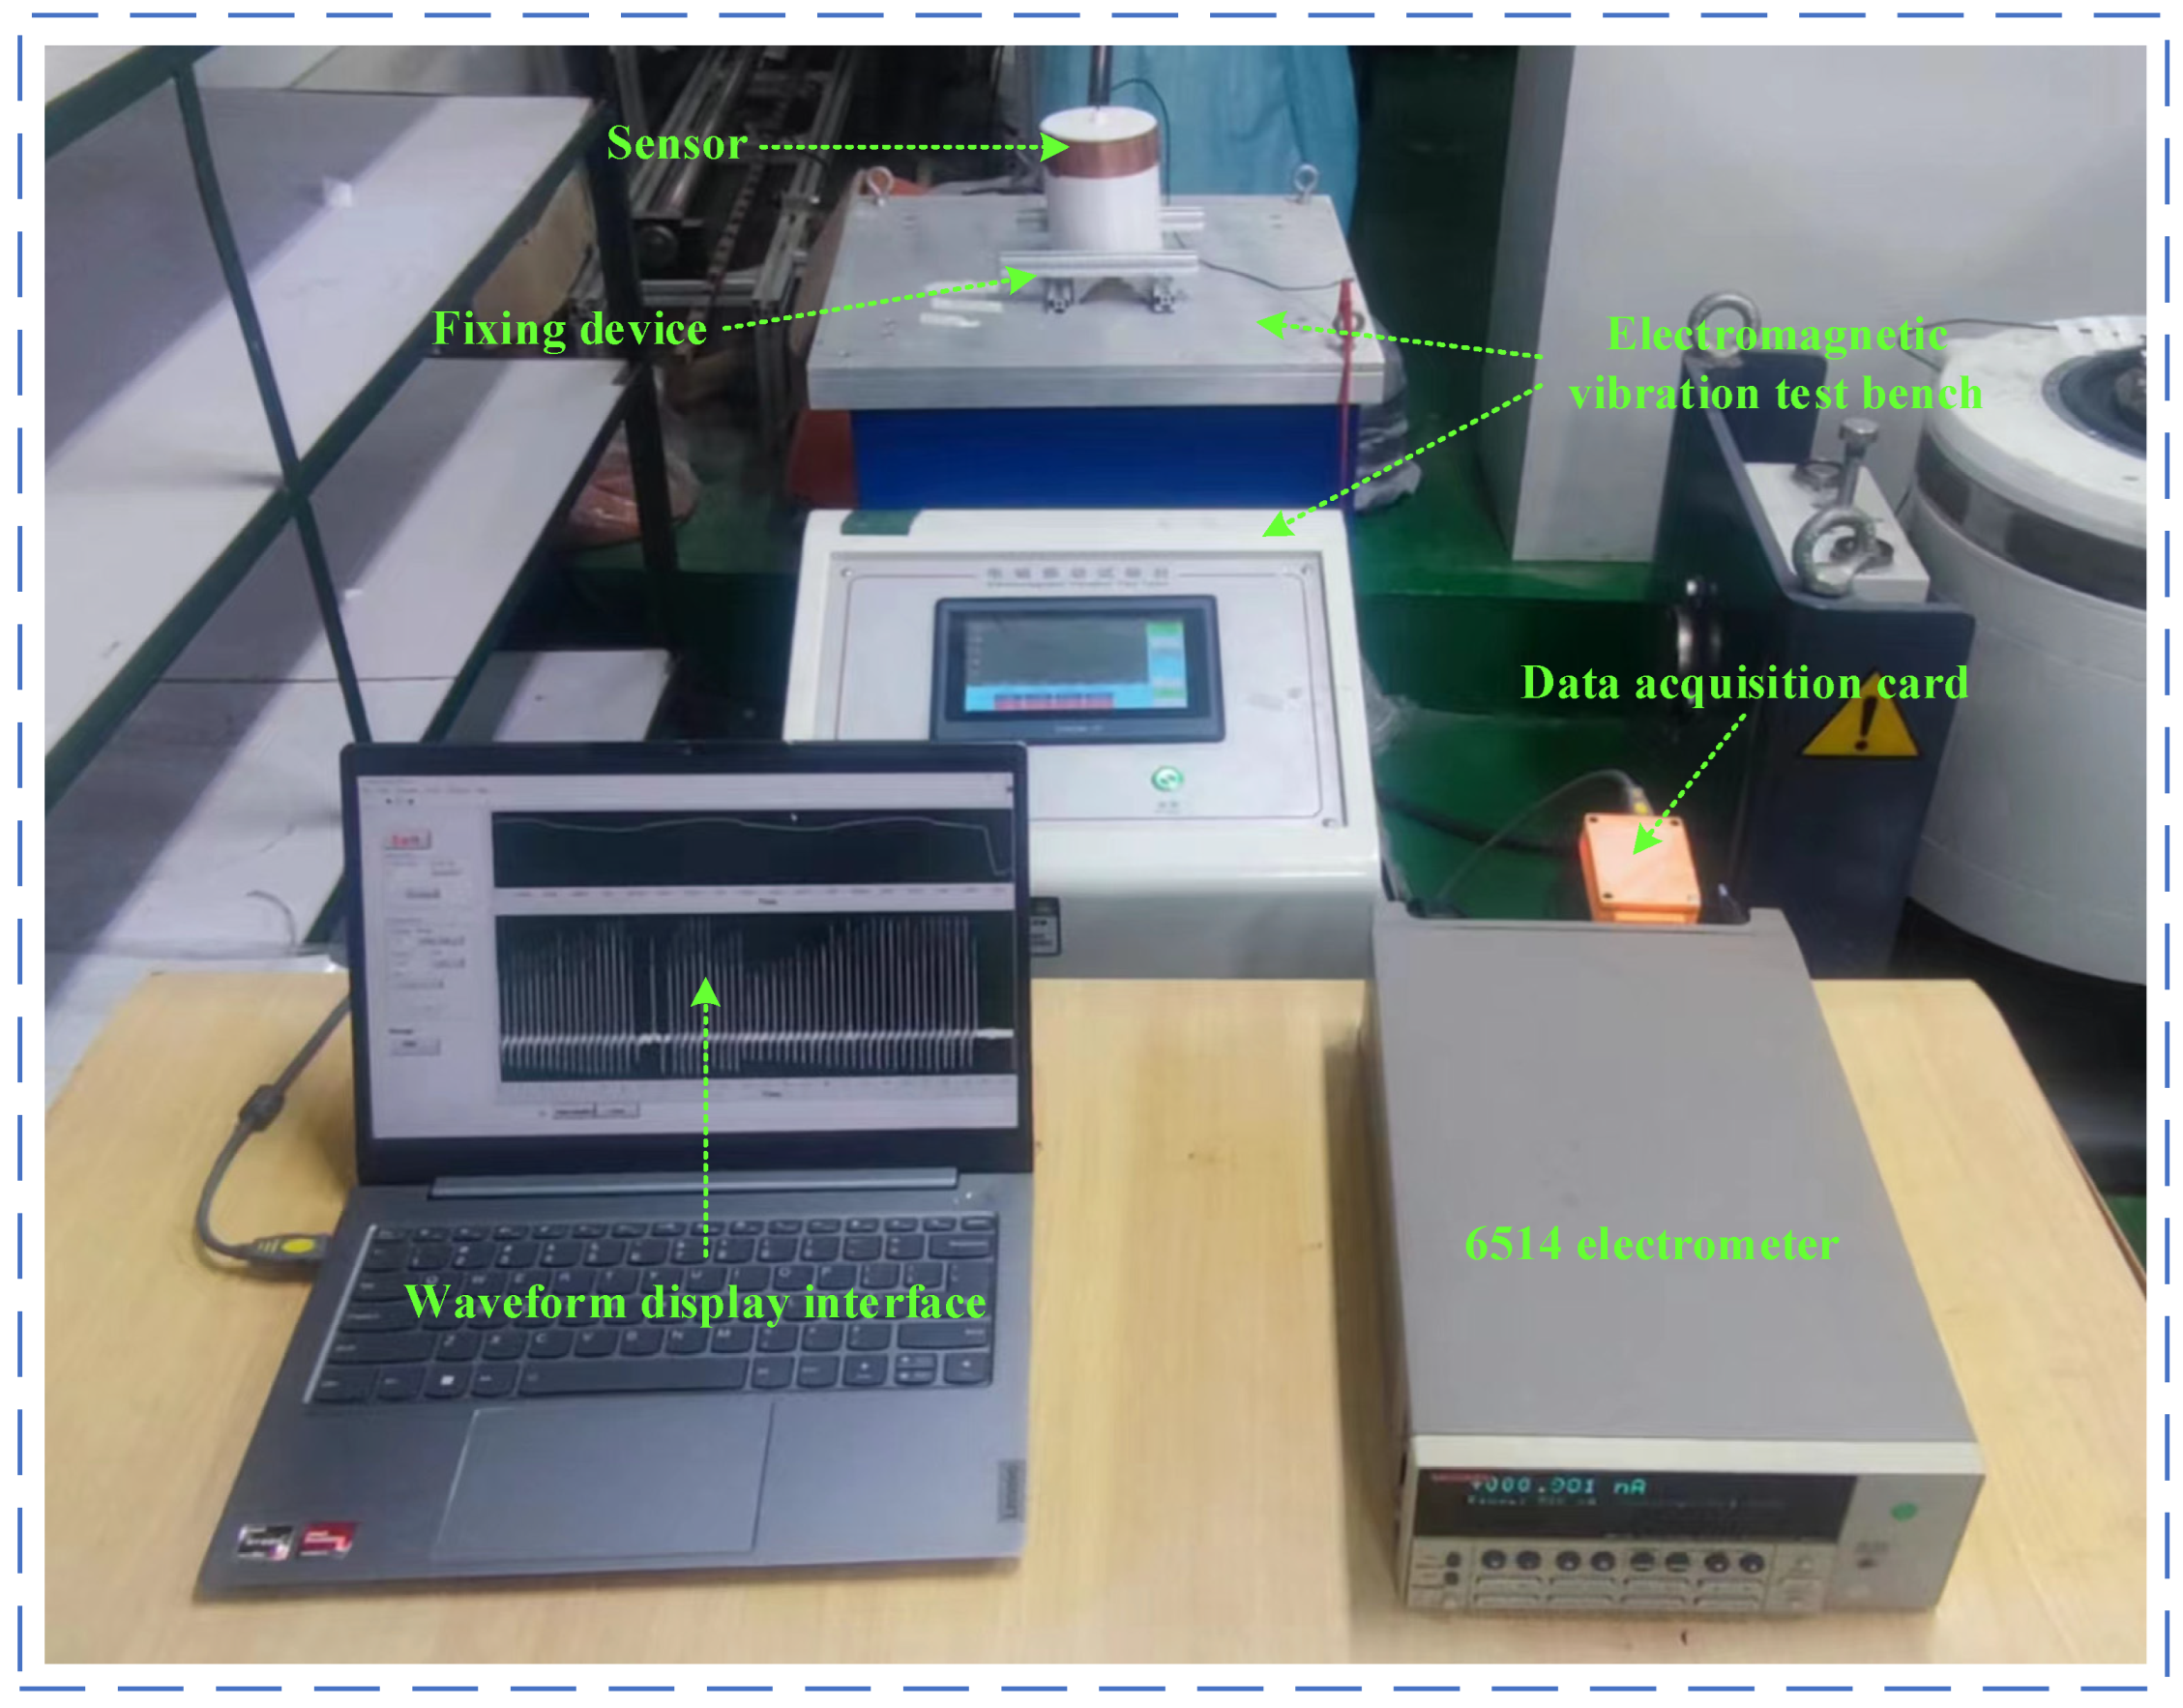
3.1. Experiment Platform

A self-built vibration simulation device is used to simulate the vibration of the downhole drilling tool, as shown in Figure 7. The sensor is installed on the top of the vibrator, and the controller is adjusted to make the vibrator vibrate at different frequencies. The vibration table has dimensions of 700 mm in both length and width, and it can simulate vibrations of up to 200k Hz. The HDV-TENG detects and produces a voltage signal, which is passed through the data acquisition card (USB5632, ART Technology Co., Ltd, Beijing, China), and a 6514 electrometer (Keithley Inc., Cleveland, OH, USA, 6514) was collected and sent to the PC software to display the signal waveform. In addition, the simulated environment is regulated by means of an incubator and a humidification device. Experiments include sensing performance experiments, power generation performance experiments, and stability experiments.

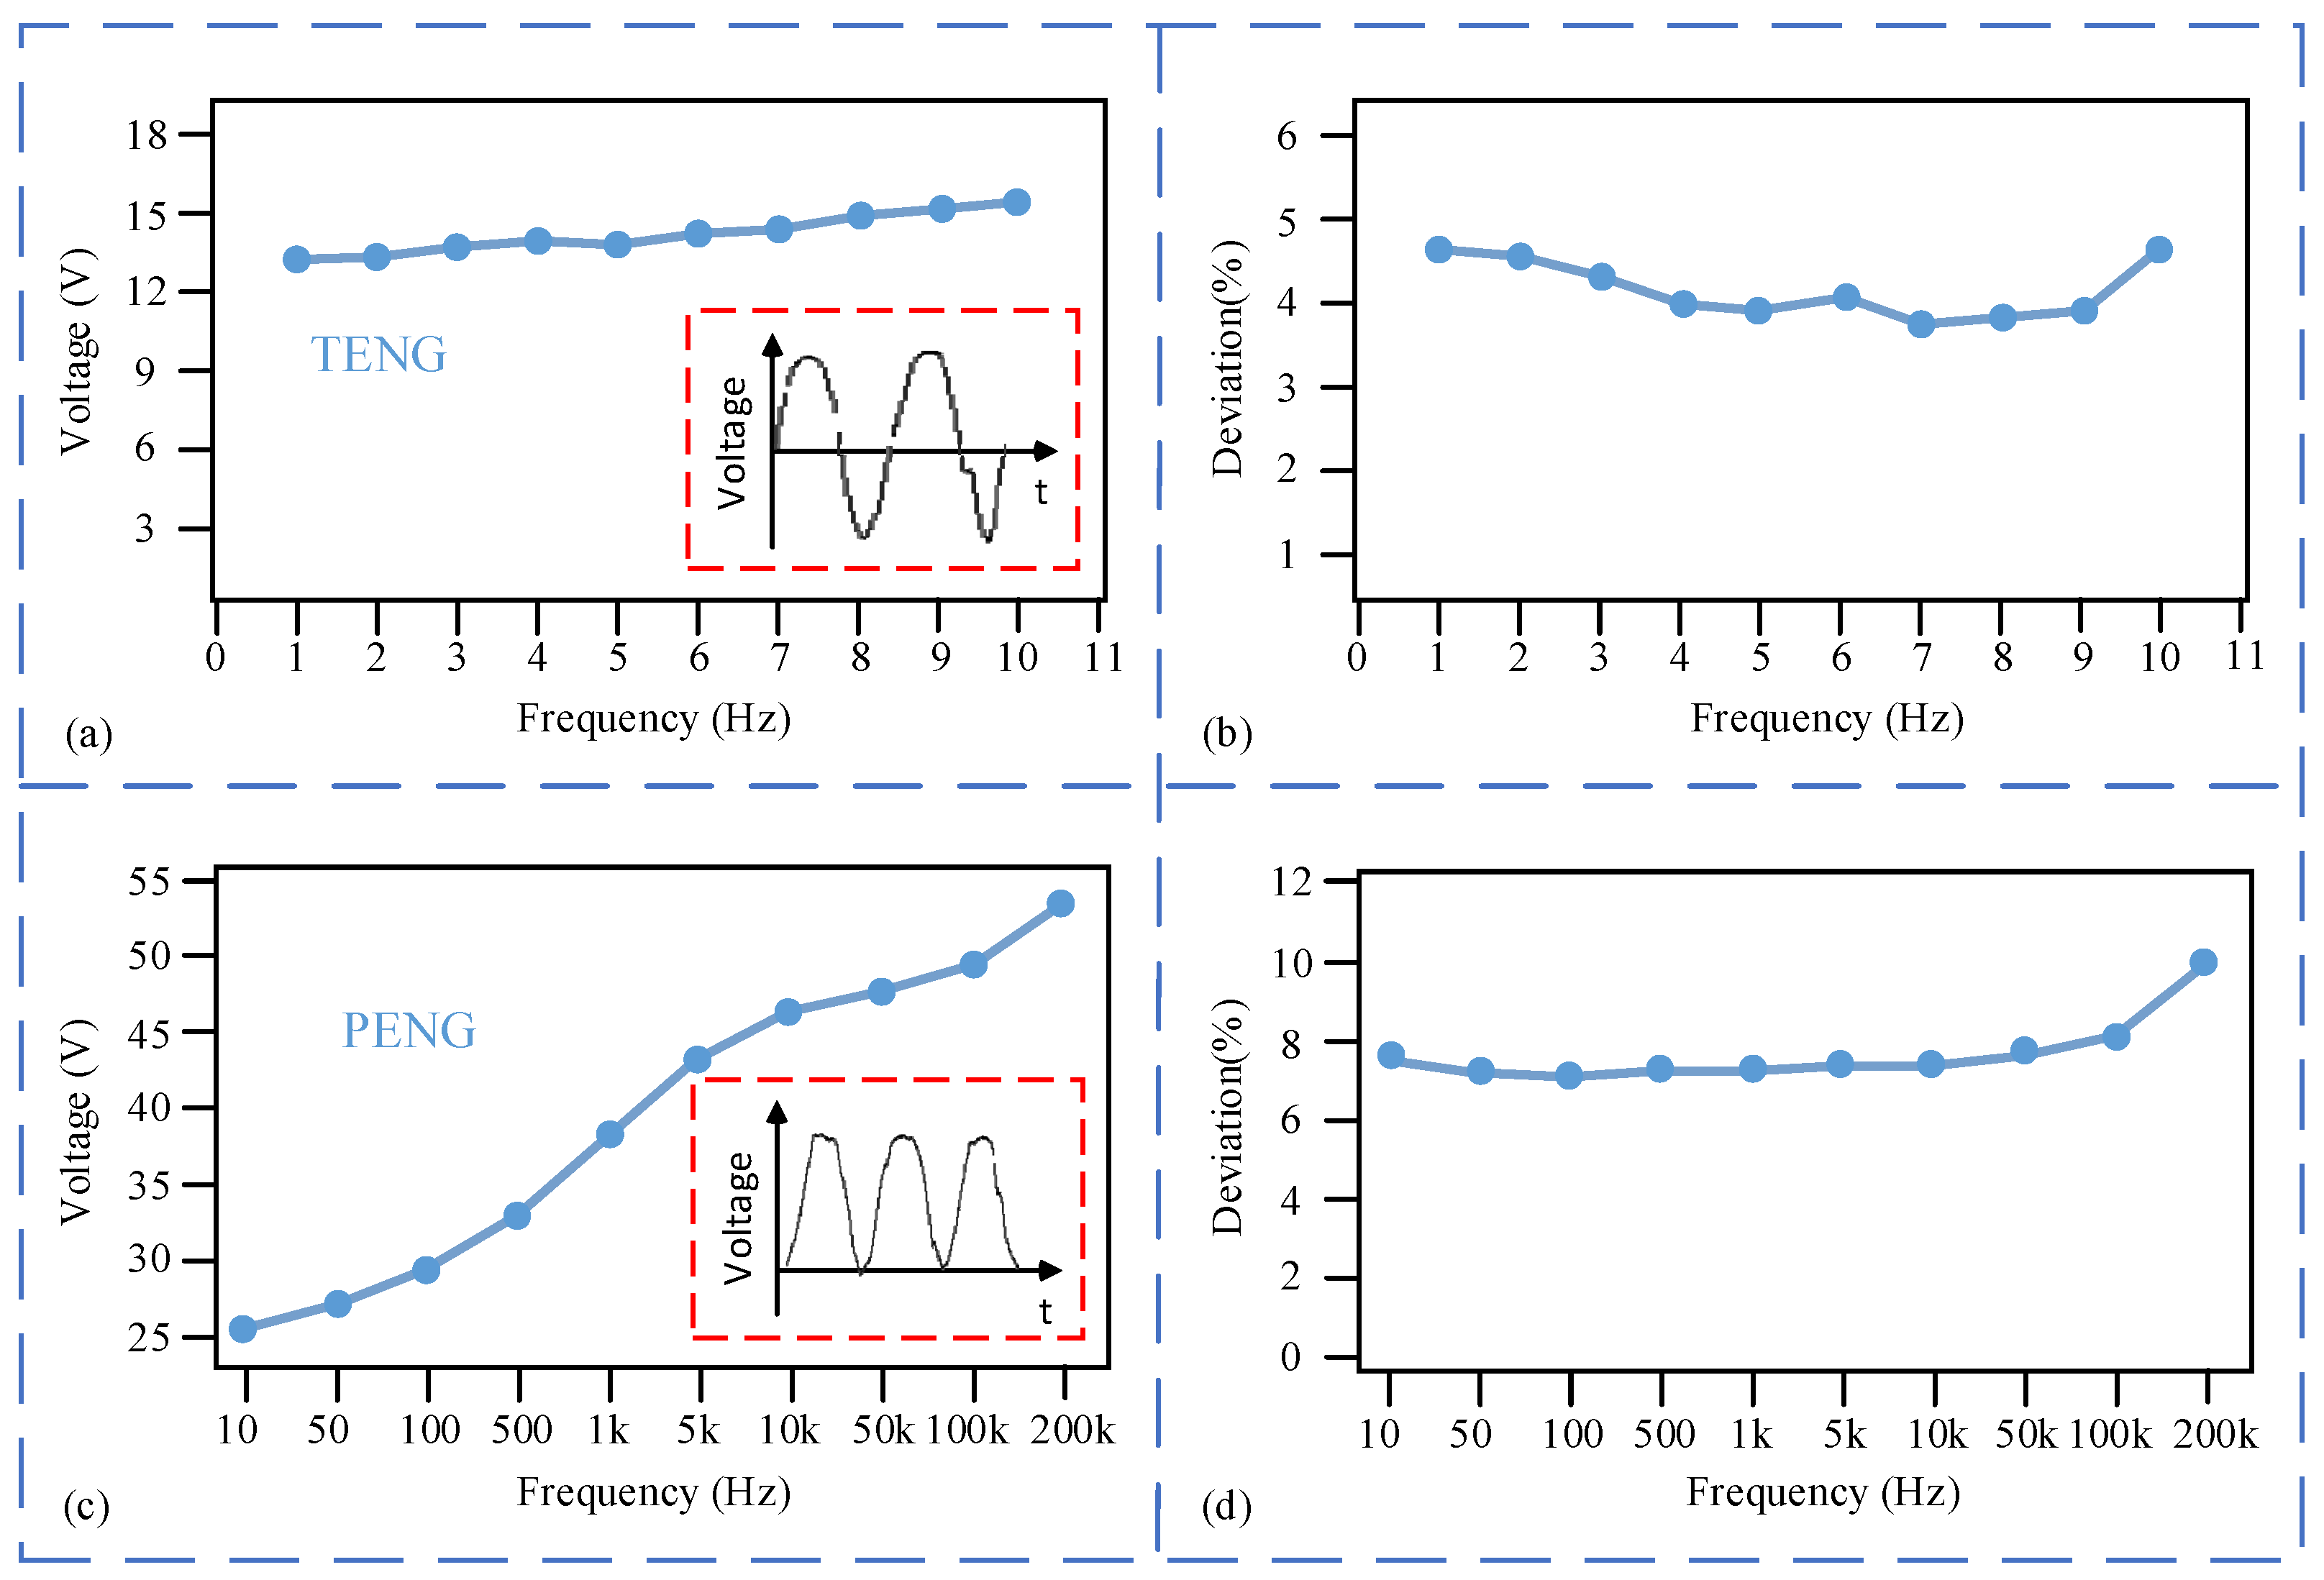
3.2. Sensing Performance Experiments

The sensor measures the vibration frequency through the TENG unit and the PENG unit. We tested the output signals of the sensor at different vibration frequencies, and then captured portions of the signal waveform, as shown in Figure 8. From the perspective of waveform frequency, for both the TENG unit and the PENG unit, the frequencies of their output voltage and current signals increase with the increase in vibration frequency. This is consistent with the working principle we analyzed, confirming that the sensor can measure vibration frequency. From the perspective of waveform peak values, as the input vibration frequency increases, the voltage of the TENG unit remains essentially unchanged, while the current shows an increasing trend. Conversely, both the voltage and current of the PENG unit show an increasing trend.
During drilling operations, the vibration frequency of downhole drilling tools is typically related to the rotation speed of the drill bit and usually remains within 10 Hz. However, in cases of uneven formation distribution, high-frequency vibration signals may also occur. Figure 9 shows the experimental results of the HDV-TENG sensing performance experiments. HDV-TENG can measure vibration within the vibration frequency of 1–200k Hz and output stable waveform. Therefore, the frequency measurement range of the sensor can meet the requirements of actual working conditions. For the TENG unit, as the vibration frequency increases, the peak output voltage remains generally stable, with only a very slight increasing trend. When the vibration frequency is 10 Hz, the output voltage reaches approximately 15.6 V. For the PENG unit, the peak output voltage also increases with the increase in frequency, and when the frequency is 200k Hz, the output voltage reaches about 54 V. During the experimental process, we also observed deviations in the measurement results due to factors such as the structural design of the sensor and uneven vibrations. Therefore, we evaluated the measurement accuracy of the sensor. The accuracy of vibration frequency measurement is expressed by deviation:
D e v i a t i o n = f 1 f 2 f 2 × 100 %
Among them, f1: measured frequency; f2: actual vibration frequency.
The frequency is measured by TENG at the low frequency of 1 to 10 Hz, and its output voltage keeps steady with the increase in frequency, as shown in Figure 9a. Statistical calculation of the deviation of vibration frequency measurement at different frequencies shows that the deviation of HDV-TENG measurement at the frequency of 1 to 10 Hz is less than 5%, which meets the requirements of downhole working conditions, as shown in Figure 9b. The frequency measurement is carried out by PENG at medium and high frequencies of 10 to 200k Hz; the output voltage increases with the increase in frequency, and the change relationship is shown in Figure 9c. The measurement of PENG also adopts the deviation index. Through statistical calculation, it can be seen that the deviation of the measurement frequency of 10 to 200k Hz is less than 10%, while the vibration frequency does not exceed 10k Hz in the downhole condition, and the corresponding deviation is less than 9%, which meets the downhole measurement accuracy requirements. as shown in Figure 9d. In conclusion, within the frequency range of 1 to 10 Hz, due to the smaller measurement deviation of TENG compared to PENG, we utilized the signal from the TENG component as the sensing signal. However, after the vibration frequency exceeded 10 Hz, the measurement deviation of the TENG component gradually increased, surpassing that of PENG, and its output voltage was also smaller than that of PENG. Therefore, we used the signal from the PENG component as the sensing signal within this frequency range.
In addition, to investigate whether the magnet in the EMG part would affect the sensing performance of the sensor, we conducted experiments after removing the magnet. The results were similar to those in Figure 9, demonstrating that the presence of the magnet does not affect the operating performance of the TENG and PENG sections.

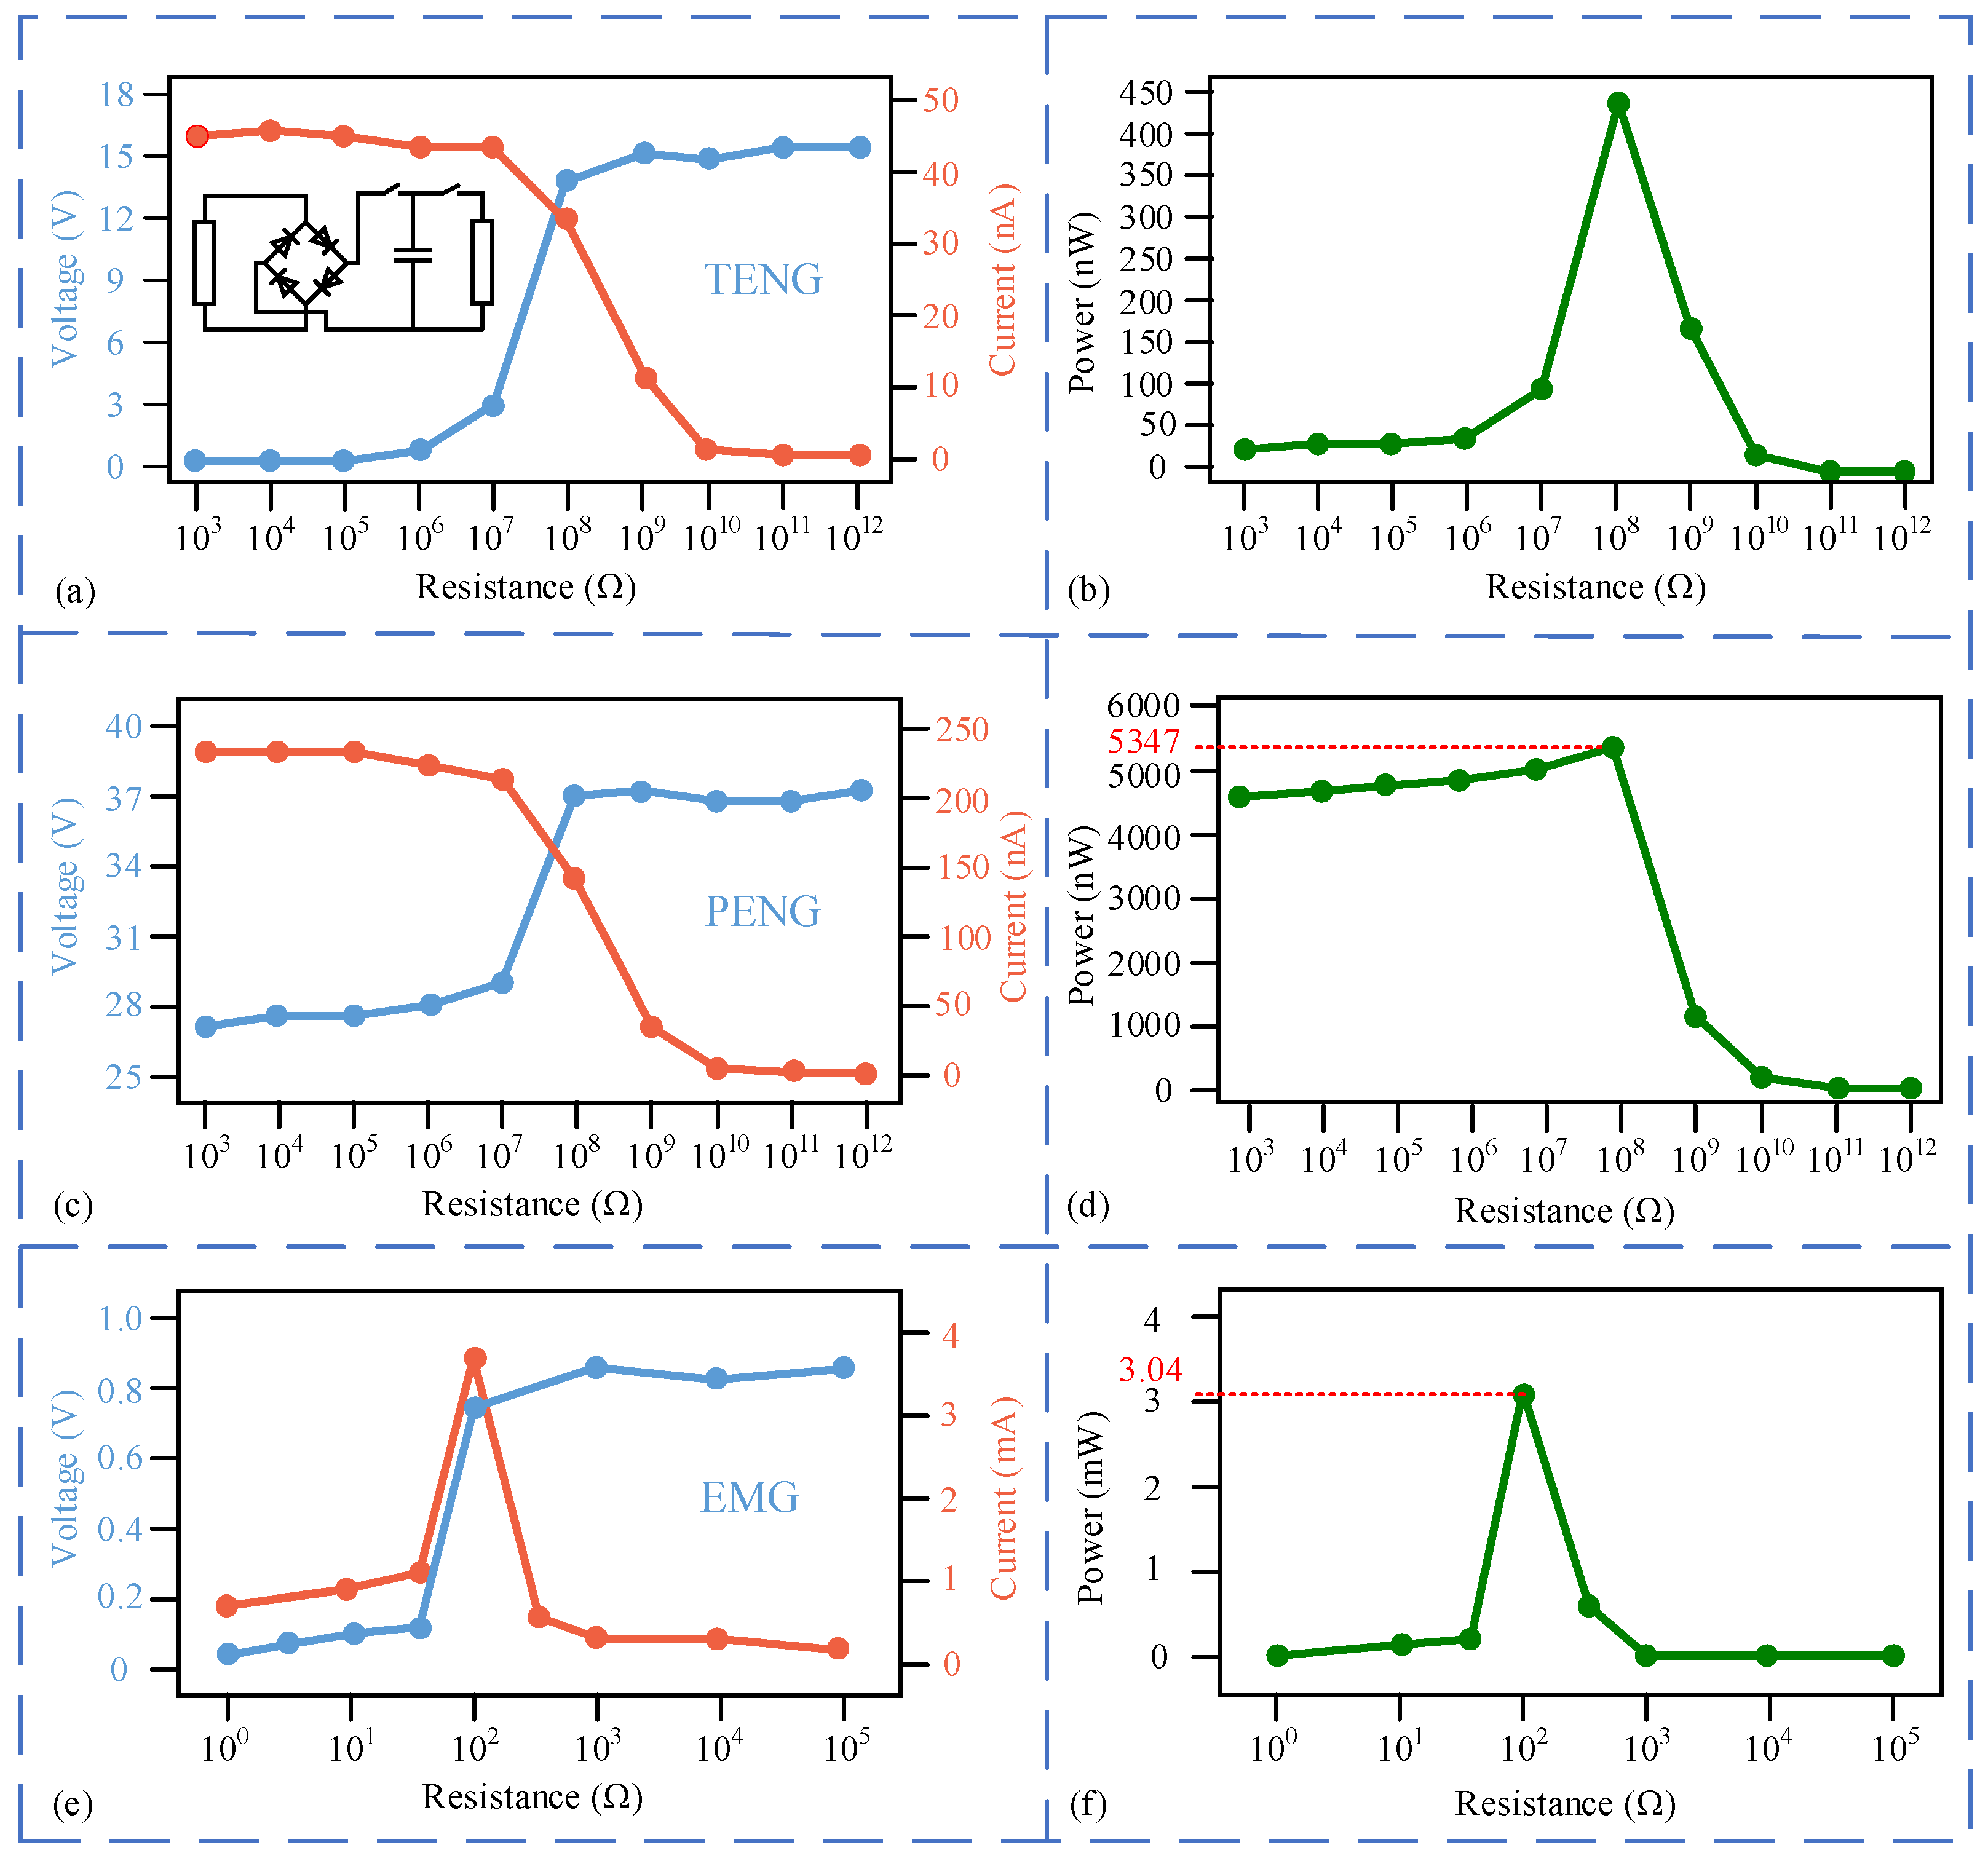
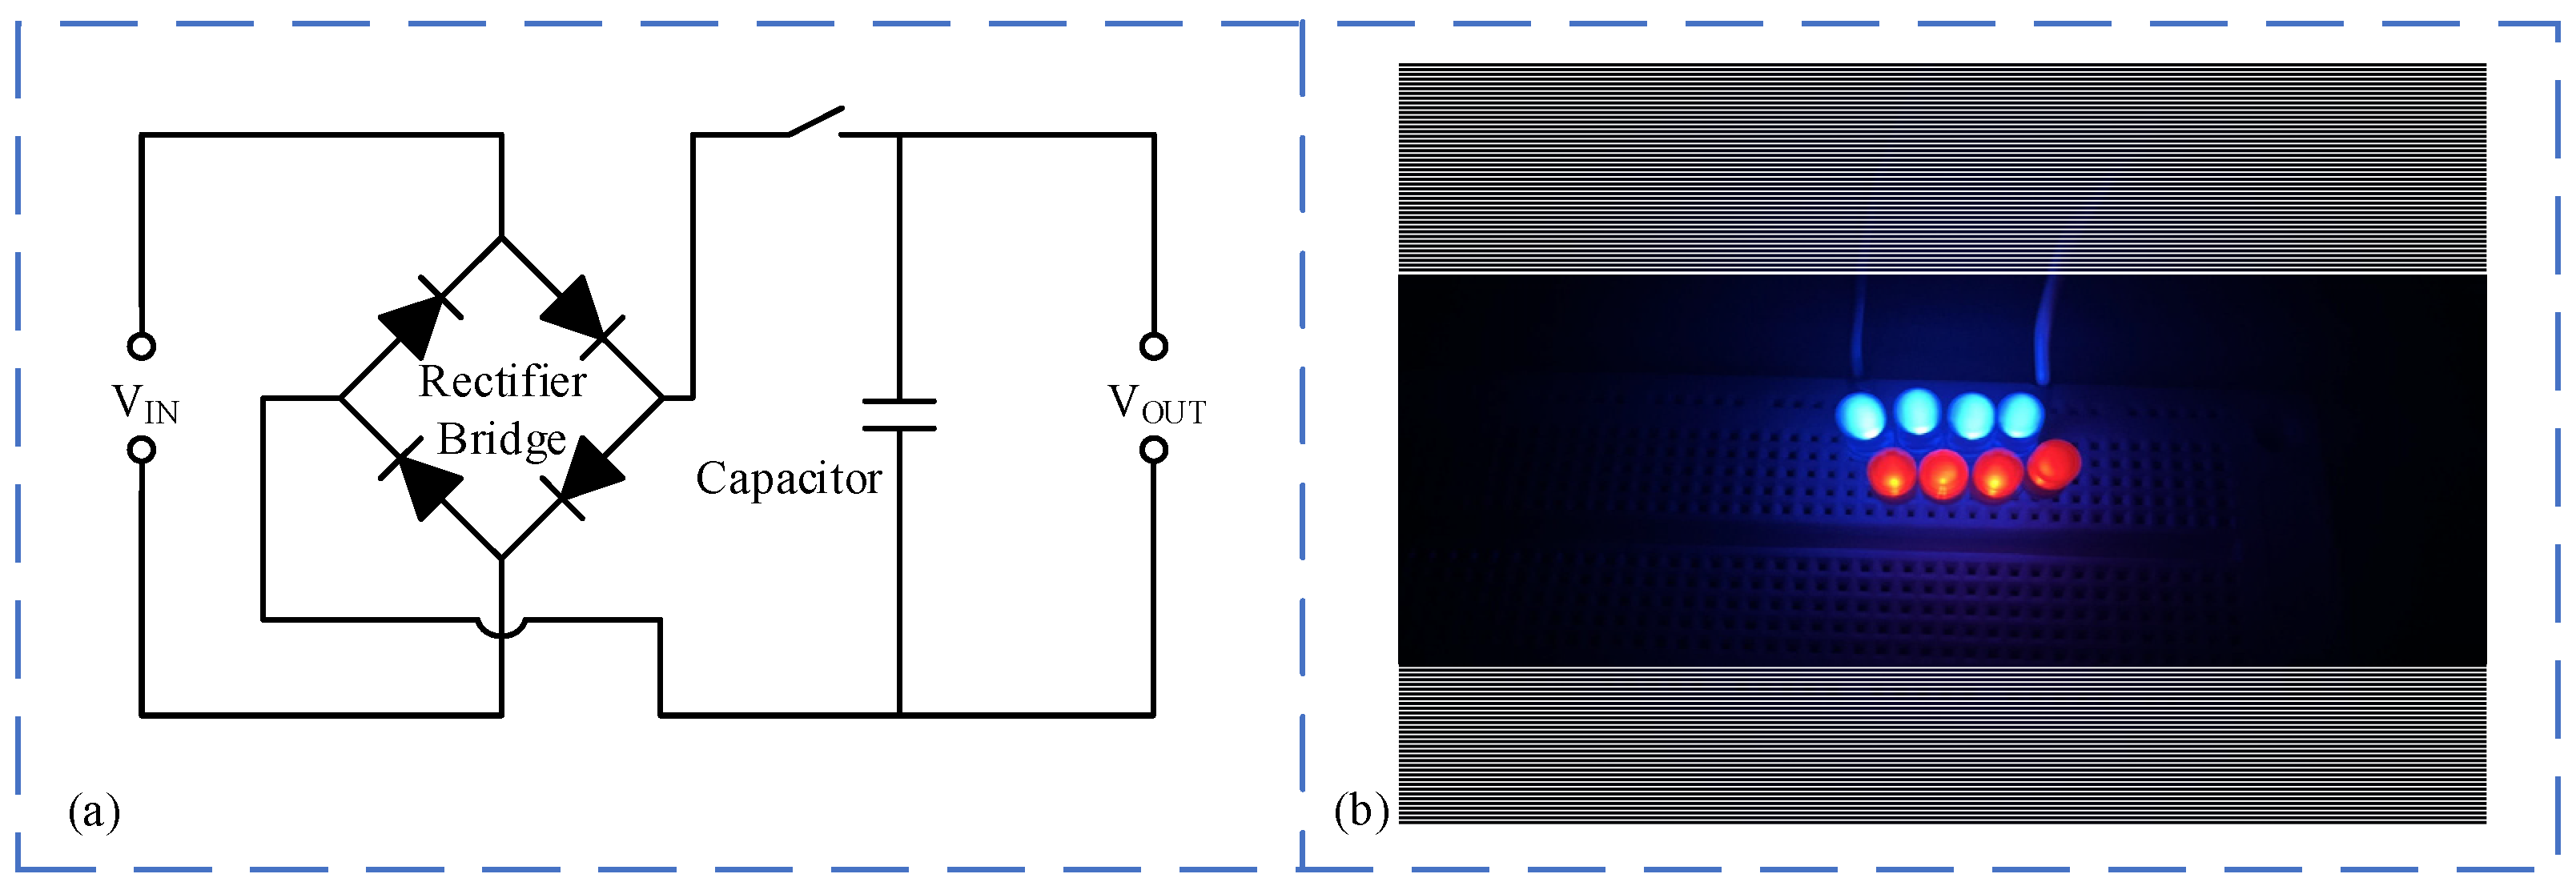
3.3. Power Generation Performance Experiments

As shown in Figure 10, the relationship between the output voltage, output current, and load of TENG, PENG, and EMG is explored. The formula for calculating the output power of each part of the sensor is as follows:
P = U I
In the equation, U represents the output voltage after rectification, and I represents the output current after rectification.
The voltage of the TENG unit and PENG unit Increases with the increase in load, and the current decreases with the increase in load. The TENG works at the frequency of 10 Hz, and the peak power reaches the maximum when the load is 108 Ω, which is 447.8 nW. At this point, the voltage is 14.4 V and the current is 31.1 nA. The output of TENG is alternating current, which is rectified by a three-phase rectification current, as shown in the figure, and the alternating current is converted into direct current output. When PENG works at a frequency of 1k Hz, the load is 108 Ω, and the peak power reaches the maximum, which is 5347 nW. At this time, the voltage is 37 V and the current is 144.5 nA. When EMG works at a frequency of 1k Hz and the load is 100 Ω, the peak power is the largest, which is 3.04 mW, the voltage is 0.78 V, and the current is 3.9 mA. It can be observed that among the three working parts of the sensor, the output power of the EMG is much higher than that of the TENG and PENG. This also indicates that the EMG can significantly increase the output power of the sensor, making it possible for the sensor to provide power to other low-power devices underground in emergency situations.
Furthermore, since the sensor’s output is alternating current, it needs to be rectified in order to power other devices, as shown in Figure 11a. To validate the possibility of the sensor powering other low-power devices underground, we rectified the EMG section of the sensor to power an array of LED lights. The results indicate that the output power of the sensor can illuminate multiple LED lights.

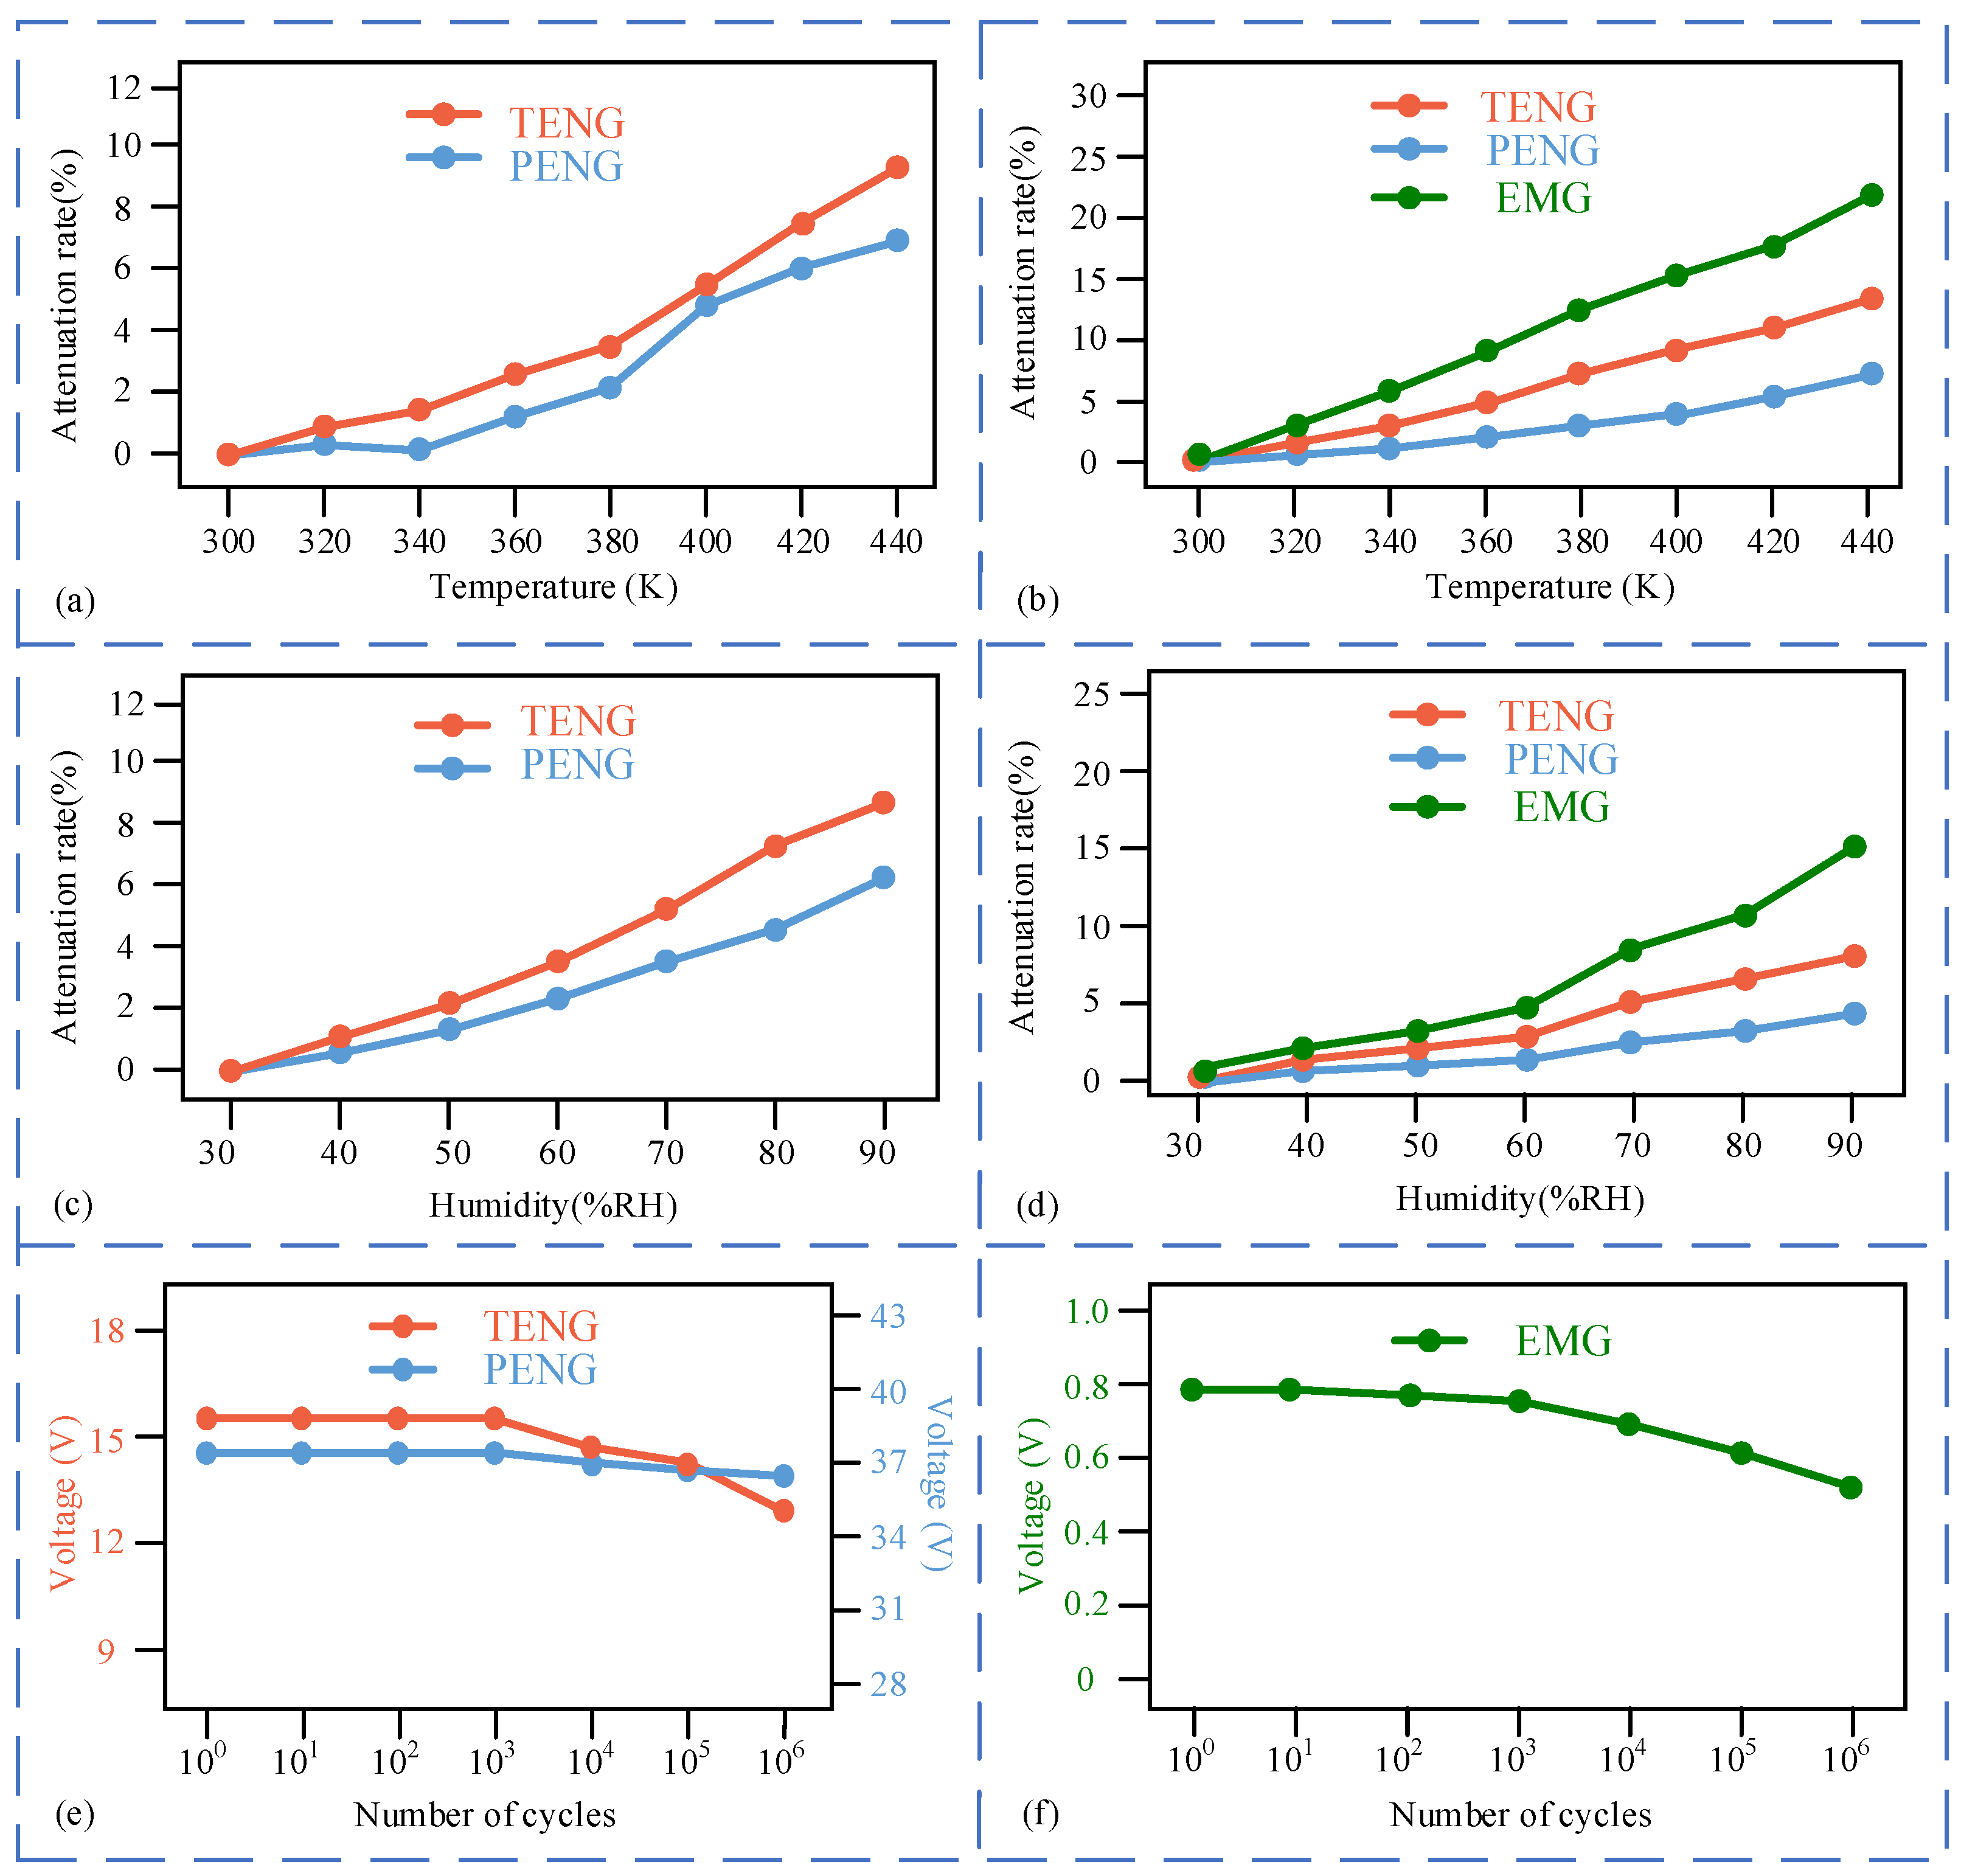
3.4. Stability Experiments

As shown in Figure 12, the effects of downhole high temperature, high humidity, and vibration period on HDV-TENG were explored. In the experiment of temperature and humidity changes, the output voltage and peak power of TENG (f = 10 Hz), PENG (f = 1k Hz), and EMG (f = 1k Hz) at 300 K and 30% relative humidity (RH) were used as reference values. Calibration was carried out by using the attenuation rate:
A t t e n u a t i o n   r a t e = p 2 p 1 p 1 × 100 %
Among them, p2: corresponding output voltage and peak power under different temperatures and humidity, p1: corresponding output voltage and peak power under 300 K, 30% RH; the measurement point is selected from the maximum rate of change measured for output voltage and peak power at different temperatures and humidity.
Due to the high-temperature and humidity conditions encountered by the sensor in downhole environments, we conducted tests on the output voltage of the sensor within the temperature range of 300 K to 440 K and the humidity range of 30% RH to 90% RH. From Figure 12a,c, it can be observed that with increasing temperature and relative humidity, the output voltage of the sensor decreases. However, when the temperature is below 440 K or the relative humidity is below 90%, the attenuation rate of the output voltage is less than 10%. Frequency measurement is calculated based on the number of pulse waves per unit time. As long as there is an output voltage, it can be detected through HDV-TENG and output pulse waves. The change rate of the output voltage is less than 10%, indicating that the measurement performance of HDV-TENG is very little affected by temperature and humidity variations. At the same time, the influence of temperature and humidity changes on power generation performance was explored. From Figure 12b,d, it can be seen that EMG is most affected by temperature and humidity, followed by PENG, and TENG has the least influence, but the peak power change rates of the three are at different temperatures. All are less than 25% and are less than 20% under different humidity, which can realize the power supply for the sensor itself. In addition, the effect of the vibration cycle on the output voltage of HDV-TENG was explored. As shown in Figure 12e,f, the output voltage of the PENG unit remained stable under 106 vibration cycles, while the output voltages of the TENG unit and EMG unit have decreased to some extent; the reduced values are still obvious, proving that HDV-TENG has a long working life. In conclusion, HDV-TENG has a high tolerance and good stability and can be applied to complex underground environments.

4. Conclusions

In this research, a hybrid downhole vibration sensor (HDV-TENG) based on electromagnetic–piezoelectric–triboelectric nanogenerators is developed, which can realize the measurement of vibration frequency and the collection of vibration energy. The frequency measurement bandwidth is 0 to 200k Hz, using the principles of triboelectric nanogenerators and piezoelectric nanogenerators to measure low frequency of 0 to 10 Hz and medium–high frequency of 10 to 200k Hz vibrations, respectively; the corresponding measurement errors are less than 5% and 8%, which meet the downhole accuracy requirements and solve the limitation of small measurement frequency bandwidth of friction nanogenerators in downhole vibration measurement. At the same time, the power generation performance of the sensor is explored. The maximum load power of TENG is 447.8 nW when the frequency is f = 10 Hz and the load is 108 Ω; the maximum load power of PENG is 5347 nW when the frequency is 1k Hz and the load is 108 Ω; the peak load power of EMG is 3.04 mW when the frequency is 1k Hz and the load is 100 Ω. The sensor’s output signal, after rectification, can simultaneously illuminate eight LED lights. In addition, the influence of downhole temperature and humidity changes on the performance of the sensor was explored. The experiments show that the HDV-TENG can still work normally at 440 K (high temperature) and 90% RH humidity, which has good anti-interference and reliability.
The innovation of HDV-TENG is that it overcomes the limitation that the triboelectric nanogenerator itself can only measure low frequencies. Combined with the characteristics of piezoelectric ceramics suitable for high-frequency vibration measurement, the use of magnetic levitation technology to achieve nonfaulty measurement of low-frequency to medium–high-frequency vibration has high measurement reliability and accuracy. At the same time, HDV-TENG can withstand high temperatures and high humidity and is suitable for complex downhole working conditions. In addition, HDV-TENG combines triboelectric power generation, piezoelectric effect, and electromagnetic power generation, and introduces a self-powered mode, which improves energy utilization efficiency and drilling efficiency. However, at present, the HDV-TENG still has some limitations. At present, the output power of the self-powered sensor is still limited and unstable, so it is difficult to directly supply power to other components. Therefore, it is necessary to further study the output power of the sensor and deal with the alternating current (AC) output.

Author Contributions

Validation, J.L. and Y.F.; writing—original draft, G.P.; methodology, C.W.; writing—review and editing, J.L., Y.F. and C.W.; project administration, C.W. All authors have read and agreed to the published version of the manuscript.

Funding

This work was supported by CNPC Innovation Found (2022DQ02-0309); Scientific research project of Shaanxi Coal Industry and Chemical Industry Group Co., Ltd. (KCYJY-2023-ZD-02 and 2023-TD-ZD003-003); National Key R&D Program of China (2023YFC2907502).

Institutional Review Board Statement

Not applicable.

Informed Consent Statement

Not applicable.

Data Availability Statement

The data presented in this study are available on request from the corresponding author. The data are not publicly available due to privacy.

Conflicts of Interest

Author Jiangbin Liu was employed by the company Shaanxi Shaanxi Coal Caojiatan Mining Co., Ltd. Author Yanjun Feng was employed by the company Tiandi Science & Technology Co., Ltd. The remaining authors declare that the research was conducted in the absence of any commercial or financial relationships that could be construed as a potential conflict of interest. The authors declare that this study received funding from Shaanxi Coal Industry and Chemical Industry Group Co., Ltd. The funder was not involved in the study design, collection, analysis, interpretation of data, the writing of this article or the decision to submit it for publication.

References

  1. Oseh, J.O.; Mohd, N.M.N.A.; Gbadamosi, A.O.; Agi, A.; Blkoor, S.O.; Ismail, I.; Igwilo, K.C.; Igbafe, A.I. Polymer nanocomposites application in drilling fluids: A review. Geoenergy Sci. Eng. 2023, 222, 211416. [Google Scholar] [CrossRef]
  2. Guo, J.; Wan, J.L.; Yang, Y.; Dai, L.; Tang, A.; Huang, B.; Zhang, F.; Li, H. A deep feature learning method for remaining useful life prediction of drilling pumps. Energy 2023, 282, 128442. [Google Scholar] [CrossRef]
  3. Li, Y.; Wang, J.; Shan, Y.; Wang, C.; Hu, Y. Measurement and analysis of downhole drill string vibration signal. Appl. Sci. 2021, 11, 11484. [Google Scholar] [CrossRef]
  4. Hohl, A.; Herbig, C.; Arevalo, P.; Reckmann, H.; Macpherson, J. Measurement of dynamics phenomena in downhole tools-requirements, theory and interpretation. In Proceedings of the IADC/SPE Drilling Conference and Exhibition, Fort Worth, TX, USA, 6–8 March 2018; OnePetro: Richardson, TX, USA, 2018. [Google Scholar]
  5. Mahjoub, M.; Nguyen, K.L.; Menand, S.; Tran, Q.T.; Andrianoely, M.A.; Manin, L.; Dufour, R.; Isbell, M. Dynamics Vibration Prediction and Comparison with Downhole Data Measurements in Unconventional Wells. In Proceedings of the IADC/SPE International Drilling Conference and Exhibition, Galveston, TX, USA, 3–5 March 2020; OnePetro: Richardson, TX, USA, 2020. [Google Scholar]
  6. Gou, Y.; Fu, X. Vibration and horizontal directivity analysis of transmitting transducer for acoustic logging while drilling. J. Geophys. Eng. 2021, 18, 379–391. [Google Scholar] [CrossRef]
  7. Klaic, M.; Murat, Z.; Staroveski, T.; Brezak, D. Tool wear monitoring in rock drilling applications using vibration signals. Wear 2018, 408, 222–227. [Google Scholar] [CrossRef]
  8. Baumgartner, T.; Ashok, P.; van Oort, E. Automated preprocessing techniques for high frequency downhole sensor data. In Proceedings of the SPE/IADC International Drilling Conference and Exhibition, The Hague, The Netherlands, 5–7 March 2019; OnePetro: Richardson, TX, USA, 2019. [Google Scholar]
  9. Wiktorski, E.; Geekiyanage, S.; Løken, E.; Sui, D. Comparative Study of Surface and Downhole Drillstring Vibrations Measurements on a Laboratory-Scale Drilling Rig. In Proceedings of the SPE Norway One Day Seminar, Bergen, Norway, 14 May 2019; OnePetro: Richardson, TX, USA, 2019. [Google Scholar]
  10. Millan, E.; Ringer, M.; Boualleg, R.; Li, D. Real-Time drillstring vibration characterization using machine learning. In Proceedings of the SPE/IADC International Drilling Conference and Exhibition, The Hague, The Netherlands, 5–7 March 2019; OnePetro: Richardson, TX, USA, 2019. [Google Scholar]
  11. Zha, Y.; Pham, S. Monitoring downhole drilling vibrations using surface data through deep learning. In SEG Technical Program Expanded Abstracts 2018; Society of Exploration Geophysicists: Houston, TX, USA, 2018; pp. 2101–2105. [Google Scholar]
  12. Wang, C.; Liu, G.; Yang, Z.; Li, J.; Zhang, T.; Jiang, H.; Cao, C. Downhole working conditions analysis and drilling complications detection method based on deep learning. J. Nat. Gas Sci. Eng. 2020, 81, 103485. [Google Scholar] [CrossRef]
  13. Zhang, H.; Di, Q.; Li, N.; Wang, W.; Chen, F. Measurement and simulation of nonlinear drillstring stick–slip and whirling vibrations. Int. J. Non-Linear Mech. 2020, 125, 103528. [Google Scholar] [CrossRef]
  14. Ren, F.; Fang, T.; Cheng, X. Theoretical modeling and experimental study of rock-breaking depth in particle jet impact drilling process. J. Pet. Sci. Eng. 2019, 183, 106419. [Google Scholar] [CrossRef]
  15. Fan, F.R.; Tian, Z.Q.; Wang, Z.L. Flexible triboelectric generator. Nano Energy 2012, 1, 328–334. [Google Scholar] [CrossRef]
  16. Wu, C.; Wang, A.C.; Ding, W.; Guo, H.; Wang, Z.L. Triboelectric nanogenerator: A foundation of the energy for the new era. Adv. Energy Mater. 2019, 9, 1802906. [Google Scholar] [CrossRef]
  17. Rana, S.M.S.; Salauddin, M.; Sharifuzzaman, M.; Lee, S.H.; Shin, Y.D.; Song, H.; Jeong, S.H.; Bhatta, T.; Shrestha, K.; Park, J.Y. Ultrahigh-output triboelectric and electromagnetic hybrid generator for self-powered smart electronics and biomedical applications. Adv. Energy Mater. 2022, 12, 2202238. [Google Scholar] [CrossRef]
  18. Chen, H.; Xing, C.; Li, Y.; Wang, J.; Xu, Y. Triboelectric nanogenerators for a macro-scale blue energy harvesting and self-powered marine environmental monitoring system. Sustain. Energy Fuels 2020, 4, 1063–1077. [Google Scholar] [CrossRef]
  19. Jiang, T.; Pang, H.; An, J.; Lu, P.; Feng, Y.; Liang, X.; Zhong, W.; Wang, Z.L. Robust swing-structured triboelectric nanogenerator for efficient blue energy harvesting. Adv. Energy Mater. 2020, 10, 2000064. [Google Scholar] [CrossRef]
  20. Liu, G.; Guo, H.; Xu, S.; Hu, C.; Wang, Z.L. Oblate spheroidal triboelectric nanogenerator for all-weather blue energy harvesting. Adv. Energy Mater. 2019, 9, 1900801. [Google Scholar] [CrossRef]
  21. Jie, Y.; Jia, X.; Zou, J.; Chen, Y.; Wang, N.; Wang, Z.L.; Cao, X. Natural leaf made triboelectric nanogenerator for harvesting environmental mechanical energy. Adv. Energy Mater. 2018, 8, 1703133. [Google Scholar] [CrossRef]
  22. Wu, Y.; Qu, J.; Chu, P.K.; Shin, D.M.; Luo, Y.; Feng, S.P. Hybrid photovoltaic-triboelectric nanogenerators for simultaneously harvesting solar and mechanical energies. Nano Energy 2021, 89, 106376. [Google Scholar] [CrossRef]
  23. Song, Y.; Wang, N.; Hu, C.; Wang, Z.L.; Yang, Y. Soft triboelectric nanogenerators for mechanical energy scavenging and self-powered sensors. Nano Energy 2021, 84, 105919. [Google Scholar] [CrossRef]
  24. Bai, Z.; Xu, Y.; Li, J.; Zhu, J.; Gao, C.; Zhang, Y.; Wang, J.; Guo, J. An eco-friendly porous nanocomposite fabric-based triboelectric nanogenerator for efficient energy harvesting and motion sensing. ACS Appl. Mater. Interfaces 2020, 12, 42880–42890. [Google Scholar] [CrossRef] [PubMed]
  25. Wu, Z.; Ding, W.; Dai, Y.; Dong, K.; Wu, C.; Zhang, L.; Lin, Z.; Cheng, J.; Wang, Z.L. Self-powered multifunctional motion sensor enabled by magnetic-regulated triboelectric nanogenerator. ACS Nano 2018, 12, 5726–5733. [Google Scholar] [CrossRef]
  26. Rana, S.M.S.; Rahman, M.T.; Salauddin, M.; Maharjan, P.; Bhatta, T.; Cho, H.; Park, J.Y. A human-machine interactive hybridized biomechanical nanogenerator as a self-sustainable power source for multifunctional smart electronics applications. Nano Energy 2020, 76, 105025. [Google Scholar] [CrossRef]
  27. Zou, H.X.; Zhao, L.C.; Wang, Q.; Gao, Q.H.; Yan, G.; Wei, K.X.; Zhang, W.M. A self-regulation strategy for triboelectric nanogenerator and self-powered wind-speed sensor. Nano Energy 2022, 95, 106990. [Google Scholar] [CrossRef]
  28. Wang, Y.; Yang, E.; Chen, T.; Wang, J.; Hu, Z.; Mi, J.; Pan, X.; Xu, M. A novel humidity resisting and wind direction adapting flag-type triboelectric nanogenerator for wind energy harvesting and speed sensing. Nano Energy 2020, 78, 105279. [Google Scholar] [CrossRef]
  29. He, F.; You, X.; Gong, H.; Yang, Y.; Bai, T.; Wang, W.; Guo, W.; Liu, X.; Ye, M. Stretchable, biocompatible, and multifunctional silk fibroin-based hydrogels toward wearable strain/pressure sensors and triboelectric nanogenerators. ACS Appl. Mater. Interfaces 2020, 12, 6442–6450. [Google Scholar] [CrossRef] [PubMed]
  30. Long, S.; Feng, Y.; He, F.; Zhao, J.; Bai, T.; Lin, H.; Cai, W.; Mao, C.; Chen, Y.; Gan, L.; et al. Biomass-derived, multifunctional and wave-layered carbon aerogels toward wearable pressure sensors, supercapacitors and triboelectric nanogenerators. Nano Energy 2021, 85, 105973. [Google Scholar] [CrossRef]
  31. He, W.; Sohn, M.; Ma, R.; Kang, D.J. Flexible single-electrode triboelectric nanogenerators with MXene/PDMS composite film for biomechanical motion sensors. Nano Energy 2020, 78, 105383. [Google Scholar] [CrossRef]
  32. Zhang, H.; Zhang, P.; Zhang, W. A high-output performance mortise and tenon structure triboelectric nanogenerator for human motion sensing. Nano Energy 2021, 84, 105933. [Google Scholar] [CrossRef]
  33. Chen, G.; Au, C.; Chen, J. Textile triboelectric nanogenerators for wearable pulse wave monitoring. Trends Biotechnol. 2021, 39, 1078–1092. [Google Scholar] [CrossRef] [PubMed]
  34. Xiao, X.; Chen, G.; Libanori, A.; Chen, J. Wearable triboelectric nanogenerators for therapeutics. Trends Chem. 2021, 3, 279–290. [Google Scholar] [CrossRef]
  35. Dong, K.; Peng, X.; Wang, Z.L. Fiber/fabric-based piezoelectric and triboelectric nanogenerators for flexible/stretchable and wearable electronics and artificial intelligence. Adv. Mater. 2020, 32, 1902549. [Google Scholar] [CrossRef]
  36. Chuan, W.; He, H.; Shuo, Y.; Chenxing, F. Research on the self-powered downhole vibration sensor based on triboelectric nanogenerator. Proc. Inst. Mech. Eng. Part C J. Mech. Eng. Sci. 2021, 235, 6427–6434. [Google Scholar] [CrossRef]
  37. Bai, Y.; Xu, L.; Lin, S.; Luo, J.; Qin, H.; Han, K.; Wang, Z.L. Charge pumping strategy for rotation and sliding type triboelectric nanogenerators. Adv. Energy Mater. 2020, 10, 2000605. [Google Scholar] [CrossRef]
  38. Lee, J.W.; Jeong, J.; Yoo, D.; Lee, K.; Lee, S.; Kim, D.S.; Sim, J.Y.; Hwang, W. Pump drill-integrated triboelectric nanogenerator as a practical substitute for batteries of intermittently used devices. Nano Energy 2019, 56, 612–618. [Google Scholar] [CrossRef]
  39. Mehamud, I.; Marklund, P.; Björling, M.; Shi, Y. Machine condition monitoring enabled by broad range vibration frequency detecting triboelectric nano-generator (TENG)-based vibration sensors. Nano Energy 2022, 98, 107292. [Google Scholar] [CrossRef]
  40. Shi, G.; Zeng, W.; Xia, Y.; Xu, J.; Jia, S.; Li, Q.; Wang, X.; Xia, H.; Ye, Y. A floating piezoelectric electromagnetic hybrid wave vibration energy harvester actuated by a rotating wobble ball. Energy 2023, 270, 126808. [Google Scholar] [CrossRef]
  41. Niu, S.; Wang, Z.L. Theoretical systems of triboelectric nanogenerators. Nano Energy 2015, 14, 161–192. [Google Scholar] [CrossRef]
  42. Hu, D.; Yao, M.; Fan, Y.; Ma, C.; Fan, M.; Liu, M. Strategies to achieve high performance piezoelectric nanogenerators. Nano Energy 2019, 55, 288–304. [Google Scholar] [CrossRef]
Figure 1. Schematic diagram of HDV-TENG structure. (a) Schematic diagram of drilling and installation of HDV-TENG; (b) schematic diagram of HDV-TENG structure.
Applsci 14 05014 g001
Figure 2. HDV-TENG working principle. (a) HDV-TENG cross-section; (b) physical photos and SEM pictures of PTFE.
Applsci 14 05014 g002
Figure 3. TENG working principle.
Applsci 14 05014 g003
Figure 4. PENG working principle.
Applsci 14 05014 g004
Figure 5. EMG working principle.
Applsci 14 05014 g005
Figure 6. The functions of each part of the sensor.
Applsci 14 05014 g006
Figure 7. Schematic diagram of experimental platform.
Applsci 14 05014 g007
Figure 8. Output signal test of sensor. (a) Output voltage signal of TENG at different vibration frequencies; (b) output current signal of TENG at different vibration frequencies; (c) output voltage signal of PENG at different vibration frequencies; (d) output current signal of PENG at different vibration frequencies.
Applsci 14 05014 g008
Figure 9. Experimental results of sensing performance experiments: (a) voltage output of TENG at different vibration frequencies; (b) deviation of TENG measurement frequency at different vibration frequencies; (c) voltage output of PENG at different vibration frequencies; (d) PENG at different vibration frequencies and deviation of measurement frequency.
Applsci 14 05014 g009
Figure 10. Experimental results of power generation performance. (a) The voltage and current output of TENG under different loads (vibration frequency is 10 Hz); (b) the peak power of TENG under different loads; (c) the voltage and current output of PENG under different loads (vibration frequency 1k Hz); (d) peak power of PENG under different loads; (e) voltage and current output of EMG under different loads (vibration frequency is 1k Hz); (f) peak power of EMG under different loads.
Applsci 14 05014 g010
Figure 11. Schematic diagram of sensor lighting LED lamp. (a) Schematic diagram of the rectifier circuit; (b) the HDV-TENG lights up 8 LED bulbs.
Applsci 14 05014 g011
Figure 12. Stability test results: (a) voltage decay ratios of TENG (f = 10 Hz) and PENG (f = 1k Hz) at different temperatures; (b) TENG (f = 10 Hz) and PENG (f = 1k Hz) at different temperatures Peak power attenuation ratio; (c) voltage attenuation ratio of TENG (f = 10 Hz) and PENG (f = 1k Hz) under different humidity; (d) peak power attenuation of TENG (f = 10 Hz) and PENG (f = 1k Hz) under different humidity ratio; (e) voltage decay curves of TENG (f = 10 Hz) and PENG (f = 1k Hz) under different vibration cycles; (f) voltage decay curves of EMG (f = 1k Hz) under different vibration cycles.
Applsci 14 05014 g012
Disclaimer/Publisher’s Note: The statements, opinions and data contained in all publications are solely those of the individual author(s) and contributor(s) and not of MDPI and/or the editor(s). MDPI and/or the editor(s) disclaim responsibility for any injury to people or property resulting from any ideas, methods, instructions or products referred to in the content.

