Article

A Vehicle Velocity Prediction Method with Kinematic Segment Recognition

1
School of Mechanical Engineering, Beijing Institute of Technology, Beijing 100081, China
2
National Key Laboratory of Special Vehicle Design and Manufacturing Integration Technology, Beijing 100081, China
*
Author to whom correspondence should be addressed.
Appl. Sci. 2024, 14(12), 5030; https://doi.org/10.3390/app14125030
Submission received: 29 April 2024 / Revised: 6 June 2024 / Accepted: 7 June 2024 / Published: 9 June 2024
(This article belongs to the Topic Artificial Intelligence Models, Tools and Applications)

Abstract

:
Accurate vehicle velocity prediction is of great significance in vehicle energy distribution and road traffic management. In light of the high time variability of vehicle velocity itself and the limitation of single model prediction, a velocity prediction method based on K-means-QPSO-LSTM with kinematic segment recognition is proposed in this paper. Firstly, the K-means algorithm was used to cluster samples with similar characteristics together, extract kinematic fragment samples in typical driving conditions, calculate their feature parameters, and carry out principal component analysis on the feature parameters to achieve dimensionality reduction transformation of information. Then, the vehicle velocity prediction sub-neural network models based on long short-term memory (LSTM) with the QPSO algorithm optimized were trained under different driving condition datasets. Furthermore, the kinematic segment recognition and traditional vehicle velocity prediction were integrated to form an adaptive vehicle velocity prediction method based on driving condition identification. Finally, the current driving condition type was identified and updated in real-time during vehicle velocity prediction, and then the corresponding sub-LSTM model was used for vehicle velocity prediction. The simulation experiment demonstrated a significant enhancement in both the velocity and accuracy of prediction through the proposed method. The proposed hybrid method has the potential to improve the accuracy and reliability of vehicle velocity prediction, making it applicable in various fields such as autonomous driving, traffic management, and energy management strategies for hybrid electric vehicles.

1. Introduction

With the continuous development of intelligent transportation travel demand, the real-time prediction of road information has become increasingly important. Neural networks (NNs) provide a new solution for vehicle velocity prediction, which is realized by autonomous learning. The combination of NN and machine learning (ML) in the energy management strategy of the vehicle can predict the road condition information in real-time, which can significantly improve the efficiency of the energy management strategy, improve the engine operating interval, and optimize the energy distribution of the vehicle to reduce the incidence of failure. If the driving state of the vehicle (such as speed and demand torque, etc.) can be predicted in advance, the global optimization algorithm can be used to control the vehicle performance to reach the optimal state within a certain time range [1].
At present, the prediction methods of future vehicle velocity mainly include the prediction method based on exponential function and the prediction method based on driving data [2,3]. The different methods of vehicle velocity prediction are shown in Figure 1.
The prediction method based on exponential function represents the future prediction information in the finite time domain in the form of exponential change. When a constant exponential coefficient is adopted, the prediction accuracy of vehicle velocity is low. If the prediction accuracy is improved, the exponential coefficient needs to change according to the different working conditions [4]. Sun et al. [5] studied the prediction accuracy and hybrid electric vehicle (HEV) fuel consumption of the exponential function prediction model. However, this prediction method relies on the assumption of exponential changes in future driving information, and if this assumption is violated, its wide application will be hindered.
Prediction methods based on driving data mainly include the Markov chain (MC) model [6,7,8] and NN model [9,10,11]. The principle is to collect a large number of historical working condition data, establish the corresponding prediction model, and combine the current and historical driving condition information to predict the vehicle velocity. In terms of the MC prediction model, the future vehicle velocity is predicted by the vehicle velocity at the previous moment, which is suitable for the velocity prediction of a fixed driving route. Therefore, this velocity prediction model is more suitable for urban bus driving scenarios due to their repetitive routes [12,13]. Xie et al. [14] proposed a vehicle velocity prediction method based on the backpropagation neural network (BP-NN); both the acceleration sequence and the velocity sequence as the two inputs to the BP-NN were shown to be effective, while the accuracy of the MC predictor as the benchmark was also low. Lin et al. [15] combined BP-NN and radial basis function neural network (RBF-NN) to predict the vehicle velocity and the future vehicle velocity error at the same time, improving the accuracy of vehicle velocity prediction, and applied it to fuel cell vehicle energy management strategy, reducing the hydrogen consumption by 17.07%. Zhou et al. [16], by studying the multivariate correlation between the preview velocity sequence, acceleration sequence, and short-term future velocity sequence and training NN model, found that it could be applied to future velocity prediction in different prediction time horizons. Aiming at the problem of the large cumulative error of the deep neural network (DNN) model, the tolerance sequence correction method was used to transform the setting mechanism, which significantly reduced the impact of prediction error on the system. Liu et al. [17] established a short-term prediction model of driving state by combining stochastic prediction and machine learning. Wang et al. [18] used the global positioning system to obtain the drivers’ historical driving data, predict and identify driving routes, and use dynamic programming (DP) algorithms to achieve the optimal battery state adjustment of vehicle charging consumption. Wu et al. [19] combined traffic signals and passenger numbers with energy management strategies based on deep reinforcement learning and used a large number of driving cycles generated by training traffic simulations for training. A NN-based travel model was proposed to help manage the energy distribution of PHEVs, where the simulation results verified that this model could improve the prediction accuracy and contribute to improving fuel economy [20]. Nevertheless, the predictive performance of the NN model is easily affected by its fixed network structure, learning rate, and input. In addition, the evaluation metrics and the amount of training data collected also affect the accuracy of the model.
Ma et al. [21] applied the long short-term memory network (LSTM) to the traffic field for the first time and verified the advantages of LSTM in prediction accuracy by comparing it with many traditional prediction methods. In addition, convolutional neural networks (CNNs) have been used in the prediction research of road network traffic flow and combined with deep neural networks (DNNs) to capture the temporal and spatial characteristics of traffic flow [22,23,24].
In the above vehicle velocity prediction methods, most researchers have built a unique vehicle velocity prediction model to predict the future velocity sequence. However, the number of neurons, the learning rate, batch size, diffusion factor, hidden layer number, epochs, and other parameters in the vehicle velocity prediction model have a wide range of values, and the same parameter will show a different prediction accuracy in different cycle conditions. Therefore, a single predictive model is not sufficient to describe all driving processes. In order to build a more accurate model, we need to decompose the prediction model into multiple sub-prediction models corresponding to different parameter intervals. Moreover, the type of driving condition of a vehicle is a complex variable that is determined by many factors, which will have a significant impact on vehicle performance. Correctly distinguishing the driving condition types will help to decompose the unified model into a series of sub-neural network models corresponding to different driving condition types to improve the accuracy of the prediction model.
Based on the above analysis, the same driving conditions often have similar velocity fluctuation trends. In order to further improve the prediction accuracy of vehicle velocity, a hybrid model of clustering data with LSTM-NN was proposed. Firstly, kinematic fragment samples in typical working conditions were extracted and feature parameters were calculated. Principal component analysis was used to reduce the dimensionality of feature parameters with multiple dimensions, and samples with similar characteristics were clustered by the K-means algorithm. The clustering results could effectively express the historical correlation and trend correlation of vehicle velocity in various working conditions. Then, the LSTM model was trained by using the training data obtained by clustering, the number of neurons, training times, and learning rate of LSTM-NN were optimized by quantum particle swarm optimization algorithm (QPSO), and the K-means-QPSO-LSTM prediction model was constructed for prediction. Finally, a China Heavy-duty commercial vehicle Test Cycle-Tractor Trailer (CHTC-TT) was used as the test cycle. The hybrid prediction model based on K-means-QPSO-LSTM was compared with radial basis function (RBF)-NN and CNN-LSTM, which are commonly used in vehicle velocity prediction.

2. Data Preprocessing

In this section, kinematic fragment samples in typical driving conditions were extracted and characteristic parameters were calculated. In order to reduce the amount of calculation and avoid information overlap of multi-dimensional characteristic parameters, principal component analysis was used to reduce the dimension of characteristic parameters with multi-dimensionality.

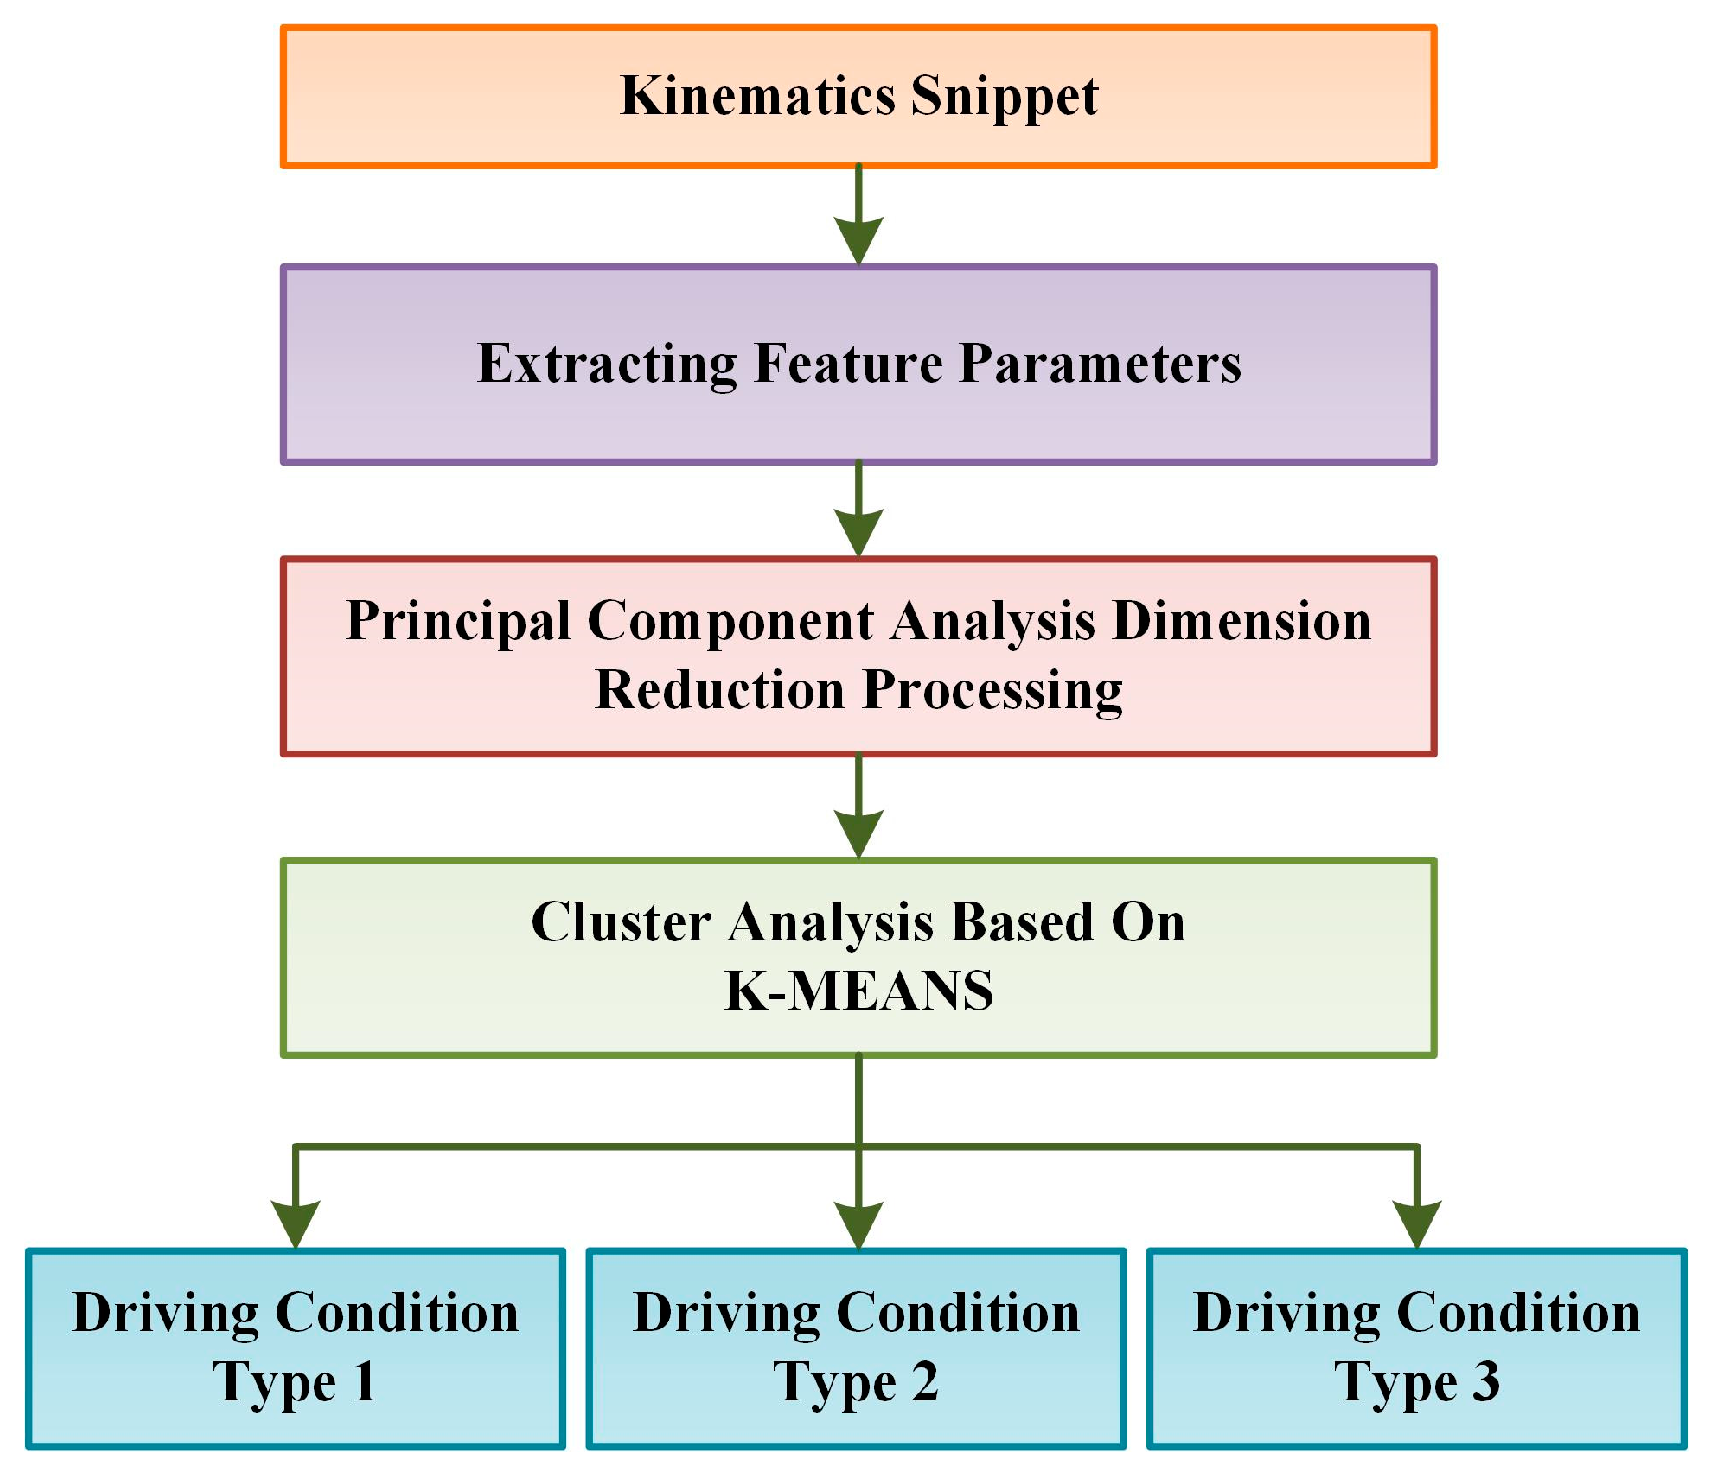
2.1. Kinematic Fragment Feature Parameter Extraction

The kinematic segment refers to the driving velocity information between two adjacent stopping points [25]. There are many different kinematic segments in the same driving condition, and there are many similar kinematic segments in different driving conditions. In the short time domain, the kinematic segment can better reflect the driving characteristics of the vehicle, so the kinematic segment is considered as a reference for velocity prediction. The extracted kinematic segments are clustered together according to the driving characteristic parameters, and used as samples to train the neural network velocity prediction sub-model, because a certain cluster composed of kinematic segments with similar characteristics can master and express the characteristics and rules of a certain class of working conditions more accurately. The current driving condition is identified according to the past driving information, and the corresponding sub-neural network is used to predict the vehicle velocity.
The sample acquisition process is shown in Figure 2. The kinematic segments of typical driving conditions are extracted, and a multi-feature kinematic segment clustering method based on principal component analysis is proposed. The multi-feature parameters of the kinematic segments were reduced dimensionality according to the principal component analysis method, and the kinematic segments with similar feature parameters were clustered together by the K-means algorithm to obtain the training samples of the sub-models of velocity prediction under three working conditions to prepare for the subsequent velocity prediction.
In the relevant literature, the number of characteristic parameters of the vehicle driving conditions is generally set as 10–18 [26]. Considering the calculation amount and accuracy comprehensively, the number of characteristic parameters of the kinematic segment is 10. The expression of 10 characteristic parameters is expressed as follows:
v a v e = ( v d t ) / t
v max = max { v 1 , v 2 , v 3 v n }
σ = [ 1 n 1 i = 1 n ( v i v a v e ) 2 ] 1 2
η a = t a T
η d = t d T
a max = max { a 1 , a 2 , a 3 a n }
a min = min { a 1 , a 2 , a 3 a n }
a a _ a v e = ( d v d t a d t ) / ( t a d t )
a d _ d v e = ( d v d t d d t ) / ( t d d t )
S = v car d t
where vave is the average of velocity value, vmax is the maximum velocity value, σ is the standard deviation of velocity, ta is the acceleration time of each motion segment, T is the segment time, td is the deceleration time of each motion segment, ηa is the ratio of the acceleration time to the length of the segment time, ηd is the ratio of the deceleration time to the length of the segment time, amax is the maximum acceleration, amin is the minimum acceleration, aa_ave is the value of average acceleration, ad_ave is the value of average deceleration, and S is the mileage of the kinematic segment.
A program was written in MATLAB 2018a to extract the characteristic parameters of 317 kinematic segments under 15 typical driving conditions, and some of the results are shown in Table 1.

2.2. Principal Component Analysis

If 10 feature parameters are directly used for clustering, the dimensionality disaster will increase the calculation amount. In addition, the large number of features and the linear correlation and information overlap among parameters will affect the clustering results [27]. Therefore, principal component analysis is adopted to reduce the dimensionality of multi-feature parameters to improve the velocity and accuracy of clustering samples with multi-feature.
Principal component analysis converts the related initial variables into unrelated synthetic variables through orthogonal transformation and ensures that the synthetic variables can retain as much information as possible about the initial variables [28]. The key to the transformation and solution of the variable matrix is to obtain a low-dimensional scalar value that can describe the original information through a certain transformation of the original multi-dimensional characteristic parameters through the feature vector. The specific implementation steps are as follows:
1.
The initial variable matrix X is constructed by using the characteristic parameter information of the kinematic fragment above, where l is the number of characteristic parameters 10, and n is the number of samples 317.
X = [ x 11 x 12 x 1 l x 21 x 22 x 2 l x n 1 x n 2 x n l ]
The normalized matrix Z is obtained by using the normalized transformation formula shown in the above publicized formula.
z i j = x i j x ¯ j s j , x j = i = 1 n x i j n , s 2 j = i = 1 n ( x i j x ¯ j ) 2 n 1
where xij is the parameter value of row i and column j in the initial variable matrix (i = 1, 2, …, n; j = 1, 2, …, l), and x ¯ j and s j 2 are the mean and variance of column j, respectively.
Z = [ z 11 z 12 z 1 l z 21 z 22 z 2 l z n 1 z n 2 z n l ]
2.
The correlation coefficient matrix R is calculated based on the correlation of the elements in the matrix.
R = [ r 11 r 12 r 1 l r 21 r 22 r 2 l r n 1 r n 2 r n l ]
The element rij calculation process is expressed as:
r i j = k = 1 n ( z k i z i ¯ ) ( z k j z j ¯ ) k = 1 n ( z k i z i ¯ ) k = 1 n ( z k j z j ¯ )
3.
The eigenvalues and eigenvectors of the correlation coefficient matrix can be obtained by solving the eigenequation of the correlation matrix R.
| λ E R | = 0
4.
The principal component contribution rate is calculated from the eigenvalue, which belongs to a part of all data features contained in the sample and is related to the sample features. The larger the eigenvalue, the more features are covered when the eigenvalue is used to describe the original information. Principal components can be selected according to the size of the eigenvalue, and the contribution rate represents the retention degree of each principal component to the initial information. The cumulative contribution rate can determine the number of principal components used to express the features of the original data. The calculation formula of the principal component contribution rate is described below.
W j = λ j j = 1 l λ j
The formula for calculating the cumulative contribution rate of each principal component is as follows:
T k j = V k j λ k
where Tkj and Vkj are the coefficients of the kth eigenvector, λk is the eigenvalue (k = 1, 2, …, g) of the kth principal component, and g is the number of principal components. The formula for calculating the score of the sample in the ith sample under the first principal component is expressed as:
f i k = T k j · z i j ( i = 1 , 2 , , n ; j = 1 , 2 , , l )
The principal component score matrix for all samples is obtained as described below:
F = [ f 11 f 12 f 1 g f 21 f 22 f 2 g f n 1 f n 2 f n g ]
According to the above steps of the principal component analysis, the main data information were obtained as follows. After obtaining the correlation coefficient matrix of the standardized sample, the eigenvalues and their contribution rates can be calculated, which are arranged in descending order according to the size of the eigenvalues, and the cumulative contribution rates are summed line by line starting from the largest eigenvalue. The results are shown in Table 2.
The eigenvalue is an evaluation index of the information inclusion ability of the principal component. The larger the eigenvalue, the more information the principal component covers and the stronger the evaluation ability of the problem. The eigenvalues of the first three rows in the table were extracted, and the cumulative contribution rate of the three principal components reached 78.3817%, that is, the information of the initial variables could be better described according to these three principal components.
Table 3 shows the eigenvector corresponding to the three selected eigenvalues, namely the principal component load. The principal component load matrix reflects the correlation coefficients between the three principal components f1, f2, f3, and 10 feature parameters. The original feature parameters can be transformed according to the feature vector to obtain the scalar value of the sample information described by the principal component. It can be seen from the table that the first principal component mainly reflects the information of five characteristic parameters: average velocity value, maximum velocity value, standard deviation of velocity, maximum acceleration, and average acceleration. The second principal component mainly reflects the information of the acceleration time ratio, one characteristic parameter, while the third principal component mainly reflects the information of deceleration time ratio, maximum deceleration velocity, average deceleration velocity, and total mileage, four characteristic parameters. The three principal components basically cover the information described by the 10 feature parameters, so the three principal components can be used to replace the 10 feature parameters to describe the information of the kinematic segments, and the dimensionality reduction of the feature parameters is completed. Table 4 shows the principal component scores of some of the samples.

2.3. Kinematic Fragment Clustering

The establishment of the neural network vehicle velocity prediction sub model needs to obtain samples for different driving conditions. Therefore, the collected kinematic fragments need to be classified after the characteristic parameters of 317 kinematic fragments are reduced from ten dimensions to three dimensions. Unlike general classification, kinematic segments have multi-dimensional characteristics, and the classification criteria cannot be determined in advance. Therefore, the clustering method is applicable here. The clustering algorithm will automatically classify the categories based on the features of the input samples and cluster the kinematic fragments with similar features together. Commonly used clustering methods include the partitioning method, hierarchical method, density-based method, grid-based method, and model-based method. In this paper, the K-means algorithm was used to cluster the kinematic fragment samples. The process of the K-means algorithm is as follows [29]:
Input: number of k clusters; D: dataset containing k objects.
Output: set and class number of k clusters.
  • According to the randomness principle, the algorithm selects k objects from the dataset as the center of k clusters, which is called the initial cluster center.
  • Calculate the distance of all other objects to the initial cluster center, classify all objects into this k cluster with the shortest principle of European distance, and obtain the k initial clustering. Distance is used to characterize the similarity between objects, describing the real distance of two objects in space, and the calculation formula is:
d ( X i , X j ) = k = 1 n ( X i k , X j k ) 2
3.
Mobile clustering center, where the average value of the data objects in each initial cluster is calculated, and the centroid of each cluster is obtained as the new cluster center.
4.
The distance of all data objects to the new cluster center is calculated, and the data objects are reclassified according to the principle of minimum distance. Repeat the above steps; the algorithm ends when the optimal E value of the objective function is minimum and no longer changes.
The calculation formula of the cluster center is as follows:
ξ k = 1 n k x i ξ k x i
The optimal E value of the objective function is calculated as follows:
E = i = 1 k j = 1 n j d ( X i , X j )
where, ξk is the cluster center (k = 1, 2, 3).
Table 5 shows the cluster center after classification. By classifying the three-dimensional principal component information of the samples, the amount of pre-classification of the K-means algorithm was determined to be three categories.
The cluster corresponding to the first cluster center ξ1 represents driving condition type 3 with a long driving distance, high average velocity, and maximum velocity. The cluster corresponding to the second cluster center ξ2 represents working condition type 1 with a short driving distance, low average velocity, and maximum velocity, while the cluster corresponding to the third cluster center ξ3 represents working condition type 2 with a medium driving distance, average velocity, and maximum velocity. According to the K-means clustering analysis, three types of training samples can be seen in Figure 3.

3. Methodology

3.1. QPSO Model

The quantum particle swarm optimization (QPSO) algorithm is a particle swarm optimization (PSO) algorithm with quantum behavior improved on the basis of PSO. It uses the wave function to solve the position and velocity of particles in quantum space and obtains the probability density function of a certain position of particles in space by solving the Schrodinger equation. The Monte Carlo stochastic simulation method is used to obtain the particle position equation. In quantum space, the properties of particles satisfying the aggregate state are completely different, and it can be searched in the whole feasible solution space. Therefore, the global search performance of the QPSO algorithm is far better than that of the standard PSO algorithm [30,31,32]. The motion state equation of QPSO can be expressed by the following formula [33].
P i j ( t ) = φ P i j ( t ) + ( 1 φ ) G i j ( t )
where φ∈(0,1] is a random number, P i j (t) is the individual best position of particle i at time t, G i j (t) is the global best position of the population at time t, and j represents the dimension. In the QPSO algorithm, the Monte Carlo strategy is used to randomly generate new points. The particle update formula for particle i in the round t + 1 iteration can be expressed as follows:
Y i j ( t + 1 ) = { P i j ( t ) + 1 2 L i j ( t ) ln ( 1 u ) , u > 0.5 P i j ( t ) 1 2 L i j ( t ) ln ( 1 u ) , u 0.5
where u∈(0, 1] is produced by a uniform distribution, Y i j (t + 1) represents the current position of the particle, and L i j (t) represents the distance between the current position of the particle and the best average best position of the individual, which can be expressed as follows:
L i j ( t ) = 2 β | m best Y i j ( t ) |
β = m ( m n ) T ite T ite , max
E best = 1 N i = 1 N P i j ( t )
where Y i j (t) represents the position of the last iteration of the particle, β is the expansion coefficient, Ebest represents the average optimal position of the particles, N represents the total number of particles, m and n are the expansion coefficient parameters, and Tite,max and Tite represent the maximum and current iterations of the algorithm, respectively.

3.2. LSTM Model

Neural networks have made breakthroughs in the fields of image and natural language processing, among which recurrent neural networks (RNNs) are widely used in the processing and prediction of time series because they can learn the correlation information of the time before and after data. As an important variant of RNNs, LSTM uses three “gates” in structural design to control the hidden layer state, which can retain useful information at every moment. In many tasks, LSTM performs better than classical RNNs [33,34,35,36].
The LSTM cell diagram is shown in Figure 4. In the LSTM cell diagram, x = [x1, x2, x3, ..., xt+1], t is the time step, xt is the input at time t, h = [h1, h2, h3, ..., ht+1], ht is the corresponding output at time t, c = [c1, c2, c3, ..., ct+1], and ct is the corresponding state of time t memory cells. Cell state is the memory unit of LSTM, carrying all previous state information [34]. Compared with the RNN unit structure module, the LSTM unit structure module is more complex and has more parameters.
The forget gate determines what information to forget from the cell state, reads ht−1 and xt, and uses the sigmoid function for processing to determine the proportion of information forgotten at a moment in time on the cell state. The calculation formula is as follows:
l t = sigmoid ( M f · [ h t 1 , x t ] + b f )
In the formula, Mf and bf are the weight matrix and bias vector of this stage, respectively.
As for the input gate and select memory stages, selecting the memory stage involves selectively memorizing the input and screening out the important information input to the current state. In this stage, ht−1 and xt are read, and the proportion of new memory c ˜ t written into memory cell state ct is determined by the sigmoid function. The relevant calculation formula is as follows:
i t = sigmoid ( M i · [ h t 1 , x t ] + b i )
c ˜ t = tan h ( M c · [ h t 1 , x t ] + b c )
c t = l t c t 1 + i t c ˜ t
where Mi and bi are the weight matrix and bias vector of the sigmoid layer, respectively; Mc and bc are the weight matrix and bias vector of the tanh layer, respectively, and tanh is a hyperbolic tangent function.
The output gate calculates the proportion of the cell state ct output information through the sigmoid function, and then multiplies the activated cell state to obtain the final output result.
o t = sigmoid ( M O · [ h t 1 , x t ] + b O )
h t = o t tanh ( c t )
where MO and bO are the weight matrix and bias vector of the output gate, respectively.

3.3. Prediction Model Based on K-Means-QPSO-LSTM

In recent years, a LSTM neural network prediction model based on QPSO has been widely used in various disciplines. In terms of the PM2.5 concentration prediction, the prediction model of QPSO combined with LSTM can accurately predict the PM2.5 concentration after training [37]. In terms of the usage prediction of shared bicycles, the prediction model of QPSO combined with LSTM could predict the number of bicycles needed per hour in the future day [38]. The forecast model of QPSO combined with LSTM could predict the freight volume in the future time (hour, day, or month), [39] and each of the above models showed good predictive power when verified.
Therefore, the prediction accuracy can be significantly improved after the optimization of LSTM hyperparameters. When a LSTM neural network is used for model training, the number of hyperparameter hidden layer neurons La and Lb, iterations K, and learning rate Ir need to be evaluated. The selection of hyperparameter values has a great impact on the performance and training effect of the LSTM neural network, and the appropriate selection can improve the accuracy of the results. In order to avoid determining appropriate hyperparameters through a large number of experiments, this paper used the QPSO algorithm to optimize the L, K, and Ir of the LSTM neural network and constructed a QPSO-LSTM prediction model.
The process is shown in Figure 5, where La1, Lb1 represent the number of hyperparameter hidden layer neurons of the first sub-LSTM model, K1 represents the number of iterations of the first sub-LSTM model, and Ir1 represents the number of iterations of the first sub-LSTM model; La2, Lb2 represent the number of hyperparameter hidden layer neurons of the second sub-LSTM model, K2 represents the number of iterations of the second sub-LSTM model, and Ir2 represents the number of iterations of the second sub-LSTM model; La3, Lb3 represent the number of hyperparameter hidden layer neurons of the third sub-LSTM model, K3 represents the number of iterations of the third sub-LSTM model, and Ir3 represents the number of iterations of the third sub-LSTM model.
The overall procedure for the algorithm design and optimization is as follows:
  • Data processing. The data processing steps have been detailed in Section 2 and will not be elaborated in this section. Three types of driving condition datasets were obtained through data processing. For the first type of dataset, because there was a lot of data, the first 90% of the dataset was used as the training set, and the last 10% was used as the test set. For the second and third types of datasets, the first 70% of the driving condition data was used as the training set, and the last 30% was used as the test set. The training set was used to train the sub-LSTM model and optimize its parameters, while the test set was used to evaluate the model’s performance.
  • Initialize the particle swarm parameters including the particle swarm size, particle dimension, number of iterations, particle position (hidden layer neuron number (Lai, Lbi), training number (Ki), and learning rate (Iri) (i = 1, 2, 3).
  • The velocity and position of each particle are updated, and the fitness value of each particle is calculated. The fitness value of each particle is a function of the mean square error (MSE) of the training set.
  • Update the individual and population history optimal fitness value and location of each particle as well as the other parameters.
  • The end condition is satisfied by calculating the maximum number of iterations or the minimum difference value of the fitness value between two iterations. If not, step 2 is performed to continue the iteration.
  • If the conditions are met, the global optimal value is output to the sub-LSTM network to achieve the purpose of optimizing the hyperparameters.

4. Prediction and Analysis

4.1. Training Setting

The three types of kinematic fragment samples in Figure 3 were used to train the sub-neural network. In order to accurately evaluate the prediction effect of different methods quantitatively, the root mean square error (RMSE), mean absolute error (MAE), and coefficient of determination (R2) were adopted as evaluation indices in this paper, which are commonly expressed as follows:
R M S E = 1 Q ε = 1 Q ( v true ( ε ) v pre ( ε ) ) 2
M A E = 1 Q m = 1 Q | v true ( ε ) v pre ( ε ) |
R 2 = 1 ε = 1 Q ( v true ( ε ) v pre ( ε ) ) 2 ε = 1 Q ( v true ( ε ) v ¯ true ( ε ) ) 2
where Q is the number of test samples; vtrue and vpre are the truth velocity and predicted velocity at time ε, respectively. v ¯ true is the average of the true vehicle velocity in the test set. The smaller the values of RMSE and MAE, the lower the prediction error, indicating a higher performance of the vehicle velocity prediction model. R2 serves as an indicator to assess the level of model fitting, with a value closer to 1 implying a better fitting effect on the data and increased prediction accuracy.

4.2. Parameter Setting and Training

In order to obtain an accurate neural network vehicle velocity prediction model, the sub-LSTM neural network established should be able to accurately approximate the training samples. Therefore, in this section, the hyperparameters of the LSTM neural network were optimized by the QPSO algorithm to establish different sub-LSTM network models. Test samples were selected to verify the approximation degree of the LSTM prediction results, and the sub-LSTM neural network with the highest approximation degree was determined as the final vehicle velocity prediction model.
When the training dataset was the first type of driving condition, the parameters of the QPSO algorithm were set as follows: the number of particles was 10, the number of populations was 100, the number of hidden layer neurons was [1, 200], the number of LSTM iterations was [1, 100], and the learning rate was [0.0001, 0.01].
The changes in particle fitness with the increase in iterations of the QPSO-LSTM 1 model are shown in Figure 6. The particle fitness finally stabilized at 0.006814. After QPSO optimization of the LSTM model hyperparameters, the final results are as shown in Figure 7 and Table 6, where the number of hidden layer neurons was La1 = 75, Lb1 = 116, the optimal iteration times of LSTM 1 was 90, and the optimal learning rate of LSTM 1 was 0.0094.
The changes in particle fitness with the increase in iterations of the QPSO-LSTM 2 model are shown in Figure 8. The particle fitness finally stabilized at 0.002972. After QPSO optimization of the LSTM 2 model hyperparameters, the final results are as shown in Figure 9 and Table 6, where the number of hidden layer neurons was La1 = 61, Lb1 = 80, the optimal iteration times of LSTM 1 was 99, and the optimal learning rate of LSTM 1 was 0.00977.
The changes in particle fitness with the increase in iterations of the QPSO-LSTM 3 model are shown in Figure 10. The particle fitness finally stabilized at 0.00321. After QPSO optimization of the LSTM 3 model hyperparameters, the final results are as shown in Figure 11 and Table 6, where the number of hidden layer neurons was La1 = 85, Lb1 = 95, the optimal iteration times of LSTM 3 was 92, and the optimal learning rate of LSTM 3 was 0.0093.
In general, the LSTM super parameters are mostly based on experience to set up its hyperparameters, which are predicted by a single LSTM model and optimized LSTM model. One of the single LSTM models is to use each historical speed data as input, and then use the LSTM model to predict. This means that the hyperparameters in the LSTM prediction model are not necessarily optimal. Based on the optimized LSTM model, the LSTM, and the QPSO-LSTM, the optimized post-optimized hyperparameters were updated to the LSTM model. This means that the accuracy of the LSTM model was improved, and finally, the vehicle velocity prediction results of a single model and optimized model were compared.
From Figure 12, Figure 13 and Figure 14, it can be seen that when the vehicle velocity was steady (i.e., there is no sudden increase or decrease in acceleration), the prediction accuracy of the vehicle velocity was more accurate, as was the prediction accuracy of the QPSO-LSTM method. In summary, the QPSO-LSTM algorithm’s vehicle velocity prediction performance was better than that of the single LSTM algorithm and the PSO-LSTM algorithm’s vehicle velocity prediction effect. When the prediction horizon was 2 s, the trend and numerical size of the predicted vehicle velocity were almost consistent with the actual vehicle velocity, and the predicted vehicle velocity was more consistent with the actual vehicle velocity curve. Only at the turning points of the vehicle velocity did the prediction error increase.
As shown in Table 7, for different prediction horizon lengths, the three prediction algorithms performed consistently, and the prediction accuracy indicators were better for shorter prediction horizons. For example, with a single LSTM prediction algorithm, as the prediction time horizon increases, the RMSE becomes larger, ranging from 1.9662 km/h (type 1, 2 s), 1.8531 km/h (type 2, 2 s), and 2.8681 km/h (type 3, 2 s) to 9.6329 km/h (type 1, 10 s), 8.1622 km/h (type 2, 10 s), and 8.9326 km/h (type 3, 10 s). The MAE also becomes larger, ranging from 1.5097 km/h (type 1, 2 s), 1.288 km/h (type 2, 2 s), and 2.0725 km/h (type 3, 2 s) to 7.0982 km/h (type 1, 10 s), 5.7281 km/h (type 2, 10 s), and 5.7073 km/h (type 3, 10 s). The R2 becomes smaller, and the fit of the prediction model becomes worse, ranging from 0.9723 (type 1, 2 s), 0.98785 (type 2, 2 s), and 0.99134 (type 3, 2 s) to 0.32817 (type 1, 10 s), 0.78341 (type 2, 10 s), and 0.87092 (type 3, 10 s). The emergence of the same pattern was observed in both the PSO-LSTM and QPSO-LSTM prediction algorithms. In summary, from the prediction accuracy indicators RMSE, MAE, and R2, a time horizon setting of 5 s for prediction was considered to be more appropriate, and the vehicle velocity prediction model based on QPSO-LSTM was superior to the LSTM and PSO-LSTM prediction algorithms.

4.3. Simulation Results Based on K-Means-QPSO-LSTM

To verify the effectiveness of the K-means-QPSO-LSTM vehicle velocity prediction model proposed in this paper, a cyclic test scenario, the China Heavy-duty commercial vehicle Test Cycle-Tractor Trailer (CHTC-TT), which consists of three types of driving conditions, was used as the test scenario for verifying the prediction effect. The test cycle set is shown in Figure 15.
As shown in Figure 16, the results of classifying the current driving condition type based on the past 10s of vehicle velocity are shown. The blue line represents the vehicle velocity, and the red line represents the type of driving condition. The sample used for clustering was the kinematic segment between two idle points, which is usually of a longer duration. The time horizon for collecting velocity information was 10 s, so the same kinematic segment will be divided into different types, especially in the time horizon near sudden acceleration or deceleration, where the fluctuation of the driving condition type is obvious.
A simulation-based validation of the vehicle velocity prediction method based on kinematic segment identification in the typical cycle condition CHTC-TT is shown in Figure 17, where different vehicle velocity prediction methods are compared, and the prediction results are shown in Figure 17.
As shown in Figure 17, compared with the vehicle velocity prediction method based on kinematic segment recognition, the prediction accuracy of the vehicle velocity methods with LSTM, RBF-LSTM, and CNN-LSTM was not ideal under various driving conditions such as idling, emergency acceleration, and emergency deceleration. Unlike the vehicle velocity prediction without kinematic segment recognition, the vehicle velocity prediction model based on K-means-QPSO-LSTM with driving condition type recognition, although unable to predict the sudden uncertainty of future driving information, could accurately identify the current driving condition based on the past driving feature parameters and update the driving condition type in real-time. This effectively solves the problem of fluctuating driving conditions. For the vehicle velocity prediction model with driving condition type recognition, the training samples of the sub-QPSO-LSTM were obtained by classifying the feature parameters, which are more representative, so the prediction accuracy was better even during the stable driving period. In summary, the vehicle velocity prediction method based on K-means-QPSO-LSTM with kinematic segment recognition improved the prediction accuracy in both changing and stable driving conditions.
Table 8 shows different prediction results of four vehicle velocity prediction models under the input of the CHTC-TT test cycle. It can be seen that the vehicle velocity prediction method based on kinematic segment recognition with K-means-QPSO-LSTM had the best prediction performance.

5. Conclusions

In this paper, the kinematic segments of typical driving conditions were taken as samples, a clustering method of multi-dimensional parameter samples based on principal component analysis was proposed, and QPSO-LSTM vehicle velocity prediction sub models were established for three types of samples, respectively. In the process of velocity prediction, the category of current driving conditions is determined by extracting the driving information in the past period of time based on k-means, and the sub model of QPSO-LSTM velocity prediction under this category was used to predict the velocity, and an adaptive velocity prediction method based on kinematic segment recognition was realized.
  • Kinematic segments of typical driving cycles were extracted, and ten characteristic parameters including the average velocity, mean square error of velocity, and maximum velocity were calculated. In order to reduce the computation and avoid the overlap of information, the principal component analysis method was used to reduce the dimension of the eigenvector composed of the eigen parameters. Each principal component is a parameter related to ten features. The three principal components are used to describe the ten feature parameters of each kinematic segment, and the transformation of the feature vector from ten dimensions to three dimensions is realized.
  • According to the three principal component information of each kinematic segment sample, the K-means algorithm was used to cluster the samples, and sample sets under three typical working conditions were obtained. These respectively represent the high velocity, long driving mileage type 3, low velocity, long idling time, short driving mileage type 1, and the characteristics between the two driving conditions type 2.
  • The vehicle velocity prediction sub-model based on LSTM was trained with three kinds of kinematic fragment samples, respectively, and the optimal LSTM hyperparameters were found by iterative correction with the QPSO algorithm. Combining kinematic segment recognition and a vehicle velocity prediction model, a vehicle velocity prediction method based on K-means-QPSO-LSTM was obtained. This method has an adaptive neural network that can change the vehicle velocity prediction models in real-time according to the actual driving information. Compared with the traditional neural network-based vehicle velocity prediction method, the prediction accuracy was improved.
The model proposed in this paper provides a theoretical basis for the energy management strategy of hybrid electric vehicles based on vehicle velocity prediction. However, there are still some limitations. How to strike a balance between the prediction accuracy and model complexity is always a difficult problem. The proposed vehicle velocity prediction model has clear advantages in terms of prediction accuracy, however, the time taken to train the deep model is also of concern. In the future, we consider placing the model in a parallel framework such as Apache Spark to improve the efficiency of the model. In addition, the weather factor was not considered in this paper. In future work, we will add more influencing factors and use a space-time deep learning neural network model to improve the prediction accuracy of the vehicle velocity prediction model.

Author Contributions

B.L., Data curation, formal analysis, writing original draft, methodology; C.W., Project administration, resources, supervision, writing editing; F.F., Conceptualization, investigation, writing review. All authors have read and agreed to the published version of the manuscript.

Funding

This research was supported by the Natural Science Foundation of Beijing province (Grant No. 4242047).

Institutional Review Board Statement

Not applicable.

Informed Consent Statement

Not applicable.

Data Availability Statement

The data that support the findings of this study are available from the corresponding author upon reasonable request.

Conflicts of Interest

The authors declare no conflict of interest.

References

  1. Zou, Y.; Liu, T.; Liu, D.; Sun, F. Reinforcement learning-based real-time energy management for a hybrid tracked vehicle. Appl. Energy 2016, 171, 372–382. [Google Scholar] [CrossRef]
  2. Zhang, F.; Hu, X.; Xu, K.; Tang, X.; Cui, Y. Current Status and Prospects for Model Predictive Energy Management in Hybrid Electric Vehicles. J. Mech. Eng. 2019, 55, 86–108. [Google Scholar] [CrossRef]
  3. Huang, Y.; Wang, H.; Khajepour, A.; He, H.; Ji, J. Model predictive control power management strategies for HEVs: A review. J. Power Sources 2017, 341, 91–106. [Google Scholar] [CrossRef]
  4. Zeng, X.; Huang, K.; Meng, F. Model predictive control for parallel hybrid electric vehicles with potential real-time capability. J. Automot. Saf. Energy 2012, 3, 165–172. [Google Scholar]
  5. Sun, C.; Hu, X.; Moura, S.J.; Sun, F. Velocity Predictors for Predictive Energy Management in Hybrid Electric Vehicles. IEEE Trans. Control Syst. Technol. 2015, 23, 1197–1204. [Google Scholar]
  6. Häggström, O. Finite Markov Chains and Algorithmic Applications; Cambridge University Press: Cambridge, UK, 2002. [Google Scholar]
  7. Hu, Q.; Yue, W. Markov Decision Processes with Their Applications; Springer: Berlin/Heidelberg, Germany, 2008. [Google Scholar]
  8. Shen, P.; Zhao, Z.; Zhan, X.; Li, J.; Guo, Q. Optimal energy management strategy for a plug-in hybrid electric commercial vehicle based on velocity prediction. Energy 2018, 155, 838–852. [Google Scholar] [CrossRef]
  9. Murphey, Y.L.; Park, J.; Chen, Z.; Kuang, M.L.; Masrur, M.A.; Phillips, A.M. Intelligent Hybrid Vehicle Power Control—Part I: Machine Learning of Optimal Vehicle Power. IEEE Trans. Veh. Technol. 2012, 61, 3519–3530. [Google Scholar] [CrossRef]
  10. Sun, C.; Sun, F.; He, H. Investigating adaptive-ECMS with velocity forecast ability for hybrid electric vehicles. Appl. Energy 2017, 185, 1644–1653. [Google Scholar] [CrossRef]
  11. Zhang, P.; Lu, W.; Du, C.; Hu, J.; Yan, F. A Comparative Study of Vehicle Velocity Prediction for Hybrid Electric Vehicles Based on a Neural Network. Mathematics 2024, 12, 575. [Google Scholar] [CrossRef]
  12. Pu, Z.; Jiao, X.; Yang, C.; Fang, S. An Adaptive Stochastic Model Predictive Control Strategy for Plug-in Hybrid Electric Bus During Vehicle-Following Scenario. IEEE Access 2020, 8, 13887–13897. [Google Scholar] [CrossRef]
  13. Li, L.; You, S.; Yang, C. Multi-Objective Stochastic MPC-Based System Control Architecture for Plug-In Hybrid Electric Buses. IEEE Trans. Ind. Electron. 2016, 63, 4752–4763. [Google Scholar] [CrossRef]
  14. Xie, S.; Hu, X.; Qi, S.; Tang, X.; Lang, K.; Xin, Z.; Brighton, J. Model Predictive Energy Management for Plug-In Hybrid Electric Vehicles Considering Optimal Battery Depth of Discharge. Energy 2019, 173, 667–678. [Google Scholar] [CrossRef]
  15. Lin, X.; Wang, Z.; Wu, J. Energy management strategy based on velocity prediction using back propagation neural network for a plug-in fuel cell electric vehicle. Int. J. Energy Res. 2021, 45, 2629–2643. [Google Scholar] [CrossRef]
  16. Zhou, Q.; Du, C.; Wu, D.; Huang, C.; Yan, F. A tolerant sequential correction predictive energy management strategy of hybrid electric vehicles with adaptive mesh discretization. Energy 2023, 274, 127314. [Google Scholar] [CrossRef]
  17. Liu, Y.; Li, J.; Gao, J.; Lei, Z.; Zhang, Y.; Chen, Z. Prediction of vehicle driving conditions with incorporation of stochastic forecasting and machine learning and a case study in energy management of plug-in hybrid electric vehicles. Mech. Syst. Signal Process. 2021, 158, 107765. [Google Scholar] [CrossRef]
  18. Wang, P.; Li, J.; Yu, Y.; Xiong, X.; Zhao, S.; Shen, W. Energy management of plug-in hybrid electric vehicle based on trip characteristic prediction. Proc. Inst. Mech. Eng. Part D J. Automob. Eng. 2020, 234, 2239–2259. [Google Scholar] [CrossRef]
  19. Wu, Y.; Tan, H.; Peng, J.; Zhang, H.; He, H. Deep reinforcement learning of energy management with continuous control strategy and traffic information for a series-parallel plug-in hybrid electric bus. Appl. Energy 2019, 247, 454–466. [Google Scholar] [CrossRef]
  20. Gu, W.; Zhao, D.; Mason, B. A Review of Intelligent Road Preview Methods for Energy Management of Hybrid Vehicles. IFAC-PapersOnLine 2019, 52, 654–660. [Google Scholar] [CrossRef]
  21. Ma, X.; Tao, Z.; Wang, Y.; Yu, H.; Wang, Y. Long short-term memory neural network for traffic speed prediction using remote microwave sensor data. Transp. Res. Part C Emerg. Technol. 2015, 54, 187–197. [Google Scholar] [CrossRef]
  22. Liu, Y.; Zheng, H.; Feng, X.; Chen, Z. Short-term traffic flow prediction with Conv-LSTM. In Proceedings of the 2017 9th International Conference on Wireless Communications and Signal Processing (WCSP), Nanjing, China, 11–13 October 2017; pp. 1–6. [Google Scholar]
  23. Wu, Y.; Tan, H. Short-term traffic flow forecasting with spatial-temporal correlation in a hybrid deep learning framework. arXiv 2016, arXiv:1612.01022. [Google Scholar]
  24. Fu, R.; Zhang, Z.; Li, L. Using LSTM and GRU neural network methods for traffic flow prediction. In Proceedings of the 2016 31st Youth Academic Annual Conference of Chinese Association of Automation (YAC), Wuhan, China, 11–13 November 2016; pp. 324–328. [Google Scholar]
  25. Zhang, J.W.; Li, M.L.; Ai, G.H.; Zhang, F.X.; Zhu, X.C. A Study on the Features of Existing Typical Vehicle Driving Cycles. Automot. Eng. 2005, 27, 220–224. [Google Scholar]
  26. Montazeri-Gh, M.; Fotouhi, A. Traffic condition recognition using the -means clustering method. Sci. Iran. 2011, 18, 930–937. [Google Scholar] [CrossRef]
  27. Miao, Q.; Sun, Q.; Bai, S.; Yan, W.; Li, G. Construction of Typical Driving Cycle of Bus Based on Clustering and Markov Chain. China J. Highw. Transp. 2016, 29, 161–169. [Google Scholar]
  28. Billard, L.; Le-Rademacher, J. Principal component analysis for interval data. Wiley Interdiscip. Rev. Comput. Stat. 2012, 4, 535–540. [Google Scholar] [CrossRef]
  29. Qiao, D. Research and Application Based On K-means Algorithm and Hierarchical Clustering Algorithm. Master’s Thesis, Jilin University, Changchun, China, 2016. [Google Scholar]
  30. Clerc, M.; Kennedy, J. The particle swarm—Explosion, stability, and convergence in a multidimensional complex space. IEEE Trans. Evol. Comput. 2002, 6, 58–73. [Google Scholar] [CrossRef]
  31. Sun, J. Particle Swarm Optimization with Particles Having Quantum Behavior. Master’s Thesis, Jiangnan University, Wuxi, China, 2009. [Google Scholar]
  32. Mikki, S.M.; Kishk, A.A. Quantum particle swarm optimization for electromagnetics. IEEE Trans. Antennas Propag. 2006, 54, 2764–2775. [Google Scholar] [CrossRef]
  33. Yu, Y.; Si, X.; Hu, C.; Zhang, J. A Review of Recurrent Neural Networks: LSTM Cells and Network Architectures. Neural Comput. 2019, 31, 1235–1270. [Google Scholar] [CrossRef]
  34. Fu, X.; Wei, Y.; Su, Y.; Hu, H. Shear Wave Velocity Prediction Based on the Long Short-Term Memory Network with Attention Mechanism. Appl. Sci. 2024, 14, 2489. [Google Scholar] [CrossRef]
  35. Guo, J.; Liu, D.; Lin, S.; Lin, J.; Zhen, W. Temperature Prediction of a Temperature-Controlled Container with Cold Energy Storage System Based on Long Short-Term Memory Neural Network. Appl. Sci. 2024, 14, 854. [Google Scholar] [CrossRef]
  36. Yan, S.; Zhang, J.; Parvej, M.M.; Zhang, T. Sea Drift Trajectory Prediction Based on Quantum Convolutional Long Short-Term Memory Model. Appl. Sci. 2023, 13, 9969. [Google Scholar] [CrossRef]
  37. Du, M.; Chen, Y.; Liu, Y.; Yin, H. A Novel Hybrid Method to Predict PM2.5 Concentration Based on the SWT-QPSO-LSTM Hybrid Model. Comput. Intell. Neurosci. 2022, 2022, 7207477. [Google Scholar] [CrossRef] [PubMed]
  38. Cao, M.; Liang, Y.; Zhu, Y.; Lü, G.; Ma, Z. Prediction for Origin-Destination Distribution of Dockless Shared Bicycles: A Case Study in Nanjing City. Front. Public Health 2022, 10, 849766. [Google Scholar] [CrossRef] [PubMed]
  39. Zhao, L.; Cao, N.; Yang, H. Forecasting regional short-term freight volume using QPSO-LSTM algorithm from the perspective of the importance of spatial information. Math. Biosci. Eng. 2023, 20, 2609–2627. [Google Scholar] [CrossRef] [PubMed]
Figure 1. Different vehicle velocity prediction methods.
Applsci 14 05030 g001
Figure 2. Sample acquisition flowchart.
Applsci 14 05030 g002
Figure 3. The training sample. (a) The first type of driving condition sample; (b) the second type of driving condition sample; (c) the third type of driving condition sample.
Applsci 14 05030 g003
Figure 4. LSTM cell diagram.
Applsci 14 05030 g004
Figure 5. Structure of the vehicle velocity prediction model.
Applsci 14 05030 g005
Figure 6. The fitness curve of QPSO with iteration times for LSTM 1.
Applsci 14 05030 g006
Figure 7. The change in the QPSO hyperparameters with iteration times for LSTM 1. (a) La1 changes with the number of iterations, (b) Lb1 changes with the number of iterations, (c) K1 changes with the number of iterations, (d) Ir1 changes with the number of iterations.
Applsci 14 05030 g007
Figure 8. The fitness curve of QPSO with iteration times for LSTM 2.
Applsci 14 05030 g008
Figure 9. The change in the QPSO hyperparameters with iteration times for LSTM 2. (a) La2 changes with the number of iterations, (b) Lb2 changes with the number of iterations, (c) K2 changes with the number of iterations, (d) Ir2 changes with the number of iterations.
Applsci 14 05030 g009
Figure 10. The fitness curve of QPSO with iteration times for LSTM 3.
Applsci 14 05030 g010
Figure 11. The change in the QPSO hyperparameters with iteration times for LSTM 3. (a) La3 changes with the number of iterations, (b) Lb3 changes with the number of iterations, (c) K3 changes with the number of iterations, (d) Ir3 changes with the number of iterations.
Applsci 14 05030 g011
Figure 12. Prediction results of driving condition type 1 by different methods with 2 s time horizon.
Applsci 14 05030 g012
Figure 13. Prediction results of driving condition type 2 by different methods with 2 s time horizon.
Applsci 14 05030 g013
Figure 14. Prediction results of driving condition type 3 by different methods with 2 s time horizon.
Applsci 14 05030 g014
Figure 15. CHTC-TT-based test cycle set.
Applsci 14 05030 g015
Figure 16. Online driving condition type identification.
Applsci 14 05030 g016
Figure 17. Comparison of the prediction results of different methods.
Applsci 14 05030 g017aApplsci 14 05030 g017b
Table 1. Characteristic parameters of the kinematic segments.
Fragmentvave
(km/h)
vmax
(km/h)
σηaηdamax
(m/s2)
amin
(m/s2)
aa_ave
(m/s2)
ad_ave
(m/s2)
S
(m)
131.4451.819.370.380.567.2−52.94−1.991603.6
218.0530.311.080.620.384.2−5.82.33−3.79397.2
……
31710.4718.46.560.530.323.17−4.441.84−3.07209.45
Table 2. Characteristics and contribution rates of the principal components.
Principal
Component
EigenvalueContribution
Rate (%)
Cumulative
Contribution Rate (%)
14.507345.037245.0732
21.805218.052063.1251
31.525715.256678.3817
40.69086.908385.2901
50.55455.544690.8346
60.46954.694995.5295
70.26022.601898.1312
80.11901.190199.3213
90.05860.585999.9072
100.00930.0928100
Table 3. Principal component load matrix.
Normalized
Variable
Eigenvector
Type 1
Eigenvector
Type 2
Eigenvector
Type 3
vave0.4367−0.00490.2382
vmax0.44290.02620.2279
σ0.44230.04230.0872
ηa−0.09090.56030.1888
ηd−0.1656−0.36730.4079
amax0.2461−0.4672−0.1525
amin−0.3896−0.21300.1238
aa_ave0.1629−0.4478−0.3609
ad_ave−0.2842−0.28460.4992
S0.2488−0.05630.5132
Table 4. Score data for the three principal components.
Samplef1f2f3
1−3.1689−1.21930.8208
2−3.164−1.21960.8176
3−3.1628−1.21970.8161
4−3.1605−1.21980.8144
5−3.159−1.21950.8138
Table 5. The cluster center.
Cluster CenterFirst Principal ComponentSecond Principal ComponentThird Principal
Component
ξ1−1.030.090.13
ξ22.34−0.98−1.17
ξ35.50−0.573.71
Table 6. LSTM hyperparameters obtained by different optimization methods with a 2 s time horizon.
Driving Condition
Type
Prediction MethodLaiLbiKiIri
Type 1LSTM120801000.0035
PSO-LSTM7780710.0079
QPSO-LSTM75116900.0094
Type 2LSTM100801000.005
PSO-LSTM7553960.0096
QPSO-LSTM6180990.00977
Type 3LSTM90601000.0055
PSO-LSTM100134940.0094
QPSO-LSTM8595920.0093
Note: i = 1, 2, 3.
Table 7. The evaluation indices of the results obtained by the different methods with different time horizons.
Driving Condition
Type
Prediction
Methods
R2RMSE
(km/h)
MAE
(km/h)
Time
Horizon (s)
Type 1LSTM0.97231.96621.50972
PSO-LSTM0.974561.88451.4042
QPSO-LSTM0.975831.83671.35222
Type 2LSTM0.987851.85311.2882
PSO-LSTM0.991611.60761.08572
QPSO-LSTM0.991881.51531.0022
Type 3LSTM0.991342.86812.07252
PSO-LSTM0.991992.75872.02032
QPSO-LSTM0.994812.22081.81712
Type 1LSTM0.795386.37593.47625
PSO-LSTM0.876414.14512.96735
QPSO-LSTM0.900364.02262.12335
Type 2LSTM0.940994.25592.91065
PSO-LSTM0.947364.0222.83445
QPSO-LSTM0.950433.90412.675
Type 3LSTM0.97225.7383.94315
PSO-LSTM0.963854.74843.29975
QPSO-LSTM0.964734.69133.29725
Type 1LSTM0.328179.63297.098210
PSO-LSTM−0.03585711.96138.311310
QPSO-LSTM0.2274910.32956.941110
Type 2LSTM0.783418.16225.728110
PSO-LSTM0.743348.88535.735910
QPSO-LSTM0.805657.73185.280810
Type 3LSTM0.870928.93265.707310
PSO-LSTM0.87888.65665.661610
QPSO-LSTM0.86559.11825.585510
Table 8. The evaluation indicators of the predicted results.
Prediction MethodR2RMSE
(km/h)
MAE
(km/h)
Time
Horizon (s)
RBF0.989962.97542.38515 s
LSTM0.989472.98362.42265 s
CNN-LSTM0.991342.82052.21615 s
K-means-QPSO-LSTM0.993972.25781.69765 s
Disclaimer/Publisher’s Note: The statements, opinions and data contained in all publications are solely those of the individual author(s) and contributor(s) and not of MDPI and/or the editor(s). MDPI and/or the editor(s) disclaim responsibility for any injury to people or property resulting from any ideas, methods, instructions or products referred to in the content.

