Article

Durability Assessment of Eco-Friendly Bricks Containing Lime Kiln Dust and Tire Rubber Waste Using Mercury Intrusion Porosimetry

Civil Engineering Discipline, Department of Engineering, La Trobe University, Bundoora, VIC 3086, Australia
*
Author to whom correspondence should be addressed.
Appl. Sci. 2024, 14(12), 5131; https://doi.org/10.3390/app14125131
Submission received: 26 April 2024 / Revised: 3 June 2024 / Accepted: 7 June 2024 / Published: 12 June 2024
(This article belongs to the Section Civil Engineering)

Abstract

:
The global challenge faced due to the impact of the construction industry on climate change, along with the issues surrounding sustainable waste disposal, has necessitated various research on using waste products as eco-friendly alternatives in construction. In this study, the avoidance of waste disposal through landfills in Australia was encouraged by incorporating lime kiln dust (LKD) and tire rubber waste (TRW) into masonry mixes to manufacture green bricks. Furthermore, the investigations in this article highlight the use of mercury intrusion porosimetry (MIP) to determine the durability of the LKD-TRW bricks when exposed to freeze–thaw (F-T) cycles by examining the pore size distribution within the bricks. The LKD waste was blended with ground granulated blast furnace slag (GGBFS) at a 70:30 blending ratio and combined with the TRW in stepped increments of 5% from 0 to 20% to produce these eco-friendly bricks. The compressive strength (CS), flexural strength (FS), frost resistance (FR), pore size distribution according to mercury intrusion porosimetry (MIP), and the water absorption (WA) properties of the bricks were assessed. The CS and FS values at 28 days of curing were recorded as 6.17, 5.25, and 3.09 MPa and 2.52, 2, and 1.55 MPa for 0, 5, and 10% TRW contents, respectively. Durability assessments using the F-T test showed that the bricks produced with 0% TRW passed as frost-resistant bricks. Furthermore, the results from the MIP test showed a total pore volume of 0.033 mL/g at 3 µm pore size for the 0% TRW content, further confirming its durability. Hence, the 0% LKD-TRW bricks can be utilized in cold regions where temperatures can be as low as −43 °C without deteriorating. Lastly, WA values of 7.25, 11.76, and 14.96% were recorded for the bricks with 0, 5, and 10% TRW, respectively, after the 28-day curing period. From all of the results obtained from the laboratory investigations, the LKD-TRW bricks produced with up to 10% TRW were within the satisfactory engineering requirements for masonry units.

1. Introduction

Significant research has been carried out on waste for producing sustainable materials used in construction [1,2,3]. This is because prevalent observations reported by research show that they all center on addressing two principal challenges [2,4,5,6]: The first challenge relates to reducing the consequences associated with climate change by promoting the utilization of alternative binder materials (ABMs) in place of ordinary Portland cement (OPC) in the construction industry [2,4,7,8]. Additionally, due to the rapid population growth, development of industries, extension of urbanization, and consumerism, significant increases in the production of municipal, industrial, and agricultural waste have been recorded [9,10]. Hence, the second major challenge pertains to finding a solution for how these wastes can be disposed of sustainably, where the emphasis is placed on avoiding disposing of them through landfills, thereby averting adverse environmental and health impacts [10,11,12,13,14]. Furthermore, Agyeman et al. [15] have shown serious concerns about the rate at which waste is generated globally. They reported that about 1.3 billion tons of waste was generated in 2015. It was projected that this will increase to about 2.2 billion tons/year by 2025, with the 15-year projected per capita waste generation rate rising from about 1.2 to about 1.42 kg/person/day. They further reported that specialists have alerted governments and individuals that waste generation associated with population growth will continue to rise unless individuals and organizations revise how natural resources and waste are used and reused. Furthermore, other problems—such as the high carbon dioxide (CO2) emissions associated with the firing of clay bricks [3,16,17], and the rate of population growth, which has necessitated the construction of more civil engineering infrastructure, thereby leading to a gradual depletion of aggregates used as construction materials—have also been identified [1,14,18,19,20,21,22]. Due to these alarming reports, governments at various levels, alongside organizations and institutions, have adopted the reduce, reuse, and recycle method of waste disposal. This will aid in significantly reducing the quantity of waste that would eventually be dumped on available land. Similarly, increased awareness and research into using these wastes as additives in construction have become imperative. Hence, constant research on their application and utilization in producing green engineering structures, as additives or replacements to conventional construction materials, is increasing [7,8,14,23,24,25,26].
To address the challenges associated with the production and use of OPC in construction, different researchers have proposed various ABMs in their respective studies. Chin et al. [22] investigated the use of agro-industrial wastes (quarry dust, shells from oil palm fruit, ash from palm oil fuel, and limestone) for producing sustainable bricks. For the brick production, the coarse aggregates were fully replaced with the shells from the oil palm fruit. OPC was partially replaced with 20% ash obtained from the palm oil fuel, and another 20% by weight of the cement was replaced with limestone, which acted as an admixture. Lastly, fine aggregates were replaced with 50% quarry dust. The results showed that the bricks produced in this study had a lower strength-to-weight ratio of about 0.18. However, when compared to conventional bricks produced with OPC, the sustainable bricks had better late strength development characteristics due to the pozzolanic properties of the ash obtained from the palm oil fuel.
In another study performed by Putra et al. [8], bottom ash from non-woody biomass was investigated as a suitable alternative to OPC. In their study, the ashing of different residues from agricultural products was carried out to obtain biomass ash with a high silica content and pozzolanic properties. The results showed that the spelt husk ash and foliage emerged as the biomasses with the most promising properties when compared to OPC. Furthermore, Miah et al. [27] investigated the durability and long-term performance of concrete produced with alternative cementitious materials (ACMs) for up to 900 days. In their study, slag and fly ash were used as alternatives to OPC in producing concrete. The OPC was replaced by weight in stepped increments of 10% from 0 to 30%, and then 45% and 60% replacements were also considered. Short-term assessments at 14, 28, 60, and 90 days and long-term assessments at 120, 365, 730, and 900 days were carried out, and the samples were cured with water. The results showed that the concrete produced with 30% fly ash and 30% slag replacements, had a continuous increase in strength with age up to 900 days when compared to concrete that was produced with OPC, which did not show a significant increase in strength for the long-term assessment. Additionally, scanning electron microscopy (SEM) performed on the samples showed that the concrete with 30% fly ash and 30% slag had dense interfacial transition zones, whereas the OPC concrete had thick and large cracks and interfacial transition zones. Hence, they concluded that the concrete samples prepared with 30% fly ash and 30% slag had properties that outweighed the OPC samples.
The natural aggregates (coarse and fine) used to produce concrete are under pressure due to the increased demand for housing, thereby resulting in a gradual depletion of these non-renewable natural resources [7,8,14,23,24,25,26]. Hence, replacing these natural aggregates has become essential. Different industrial waste products, including bottom ash, copper slag, crushed glass aggregate, crushed hardened concrete waste, crushed spent fired clay bricks, waste tire-crumb rubber, and waste foundry sand, have been studied as potential replacements for fine aggregates in concrete [14,20,28,29,30]. Research on the use of waste from foundry sand (WFS) as a fine aggregate that was used to replace natural sand for concrete production was carried out by Bilal et al. [20]. Their research aimed to enhance the preservation of the Earth’s natural resources (sand) while providing the best use of the WFS as an industrial waste product. Slump and strength tests (splitting tensile strength, flexural strength, compressive strength) at 7, 28, 56, and 91 days of curing were carried out on both the control and modified samples, for which OPC was used as the cementing agent. WFS was added to five different mixes (M1–M5) ranging from 0 to 40% in stepped increments of 10%. Compressive strength tests were performed when the samples attained ages of 7, 28, 56, and 91 days. It was observed from the results that the concrete mix comprising 30% replacement of WFS (M4) resulted in the samples having peak compressive strengths when compared to other mixes, including the control sample (M1). It was also noted that the strength increase trend of all of the samples containing WFS (M2–M5) was similar to that of the control concrete (M1). The similarity in the trends observed could have been because of the existence of the fine particles in the WFS, which acted as an excellent packing material and eventually resulted in the production of a denser concrete mix [20]. Similar improvements were observed in the flexural strength and splitting tensile test results. It was thus concluded from their research that WFS is a suitable candidate for the partial replacement of natural sand in making concrete, at an optimal substitution of 30%.
In another study by Ahmed et al. [30], the effects of coated and uncoated rubber on the flexural behavior of reinforced concrete (RC) beams were investigated. This research was carried out to conserve the naturally occurring fine sand and divert the waste rubber from ending up in landfills. In their study, crumb rubber replaced natural fine sand in varying proportions of 5, 10, and 20% by volume. The bond between the crumb rubber particles and the concrete mix needed to be improved; to achieve this, slurries from fly ash and OPC were used as coatings for the crumb rubber particles. The results showed that the samples’ compressive strengths improved by an average of 8.5% and 17.5% for the mixes produced from crumb rubber particles coated with OPC and fly ash slurries, respectively. Furthermore, the beams produced with fly-ash-coated crumb rubber exhibited the highest flexural capacities among all of the steel RC beams.
MIP, which is used to analyze pore size distribution in samples, has been widely used and recommended as an effective method of examining pore sizes within the structure of concrete and mortar materials [31], as well as for understanding the engineering properties of soils [32]. Lapierre et al. [33] measured the permeability and mercury intrusion of clay soils found in Louisville and concluded that the permeability of the soil could not be predicted exclusively by using data from pore size distribution alone, because other factors contributed to the controlled flow through a porous medium. Delage and Lefebvre [34] used a combination of MIP and SEM test results to discuss the microstructure of remolded and undisturbed delicate Champlain clay from St. Marcel. It was suggested in the study that inter-aggregate and intra-aggregate porosity regimes existed in the remolded specimens when compared to the undisturbed samples. The authors further reported that a collapse of the soil’s inter-aggregate pores was observed due to the consolidation of the clay soil, while the intra-aggregate pores remained almost intact. Ma [31] presented tips on the pore size measurement of cement concrete and mortars using MIP. The research reported factors and controls that should be in place for successful acquisition of MIP data. Furthermore, it was reported that MIP is a valuable test when performing comparative assessments of the pore refinements that occur within a given system or sample, as well as when working out horizontal comparisons of various systems [35]. Additionally, parameters determined from MIP tests are useful for the establishment of property–microstructure relations which can be both statistically and physically meaningful [36,37].
In summary, this study utilized industrial waste (LKD and GGBFS) in combination with TRW for brick production to address the prevalent challenges identified by the studies highlighted above. The production of these novel bricks will achieve three aims: Firstly, this study will address the concerns surrounding the increasing amount of CO2 associated with the production and use of OPC, by fully replacing OPC with LKD and GGBFS wastes. Secondly, the increase in construction and the depletion of natural sand underscore the need to investigate TRW as a sustainable alternative to sand, thereby decreasing its exploitation. Thirdly, MIP has been promoted as a quantitative method of understanding the pore size distribution in clay soils, cement concrete, and cement mortar samples. However, limited recent research has been conducted on its use to evaluate the pore size distribution within brick samples. This study was conceived to bridge this knowledge gap, using MIP to assess the effect of freeze–thaw (F-T) cycles on the pore size distribution within the LKD-TRW bricks.

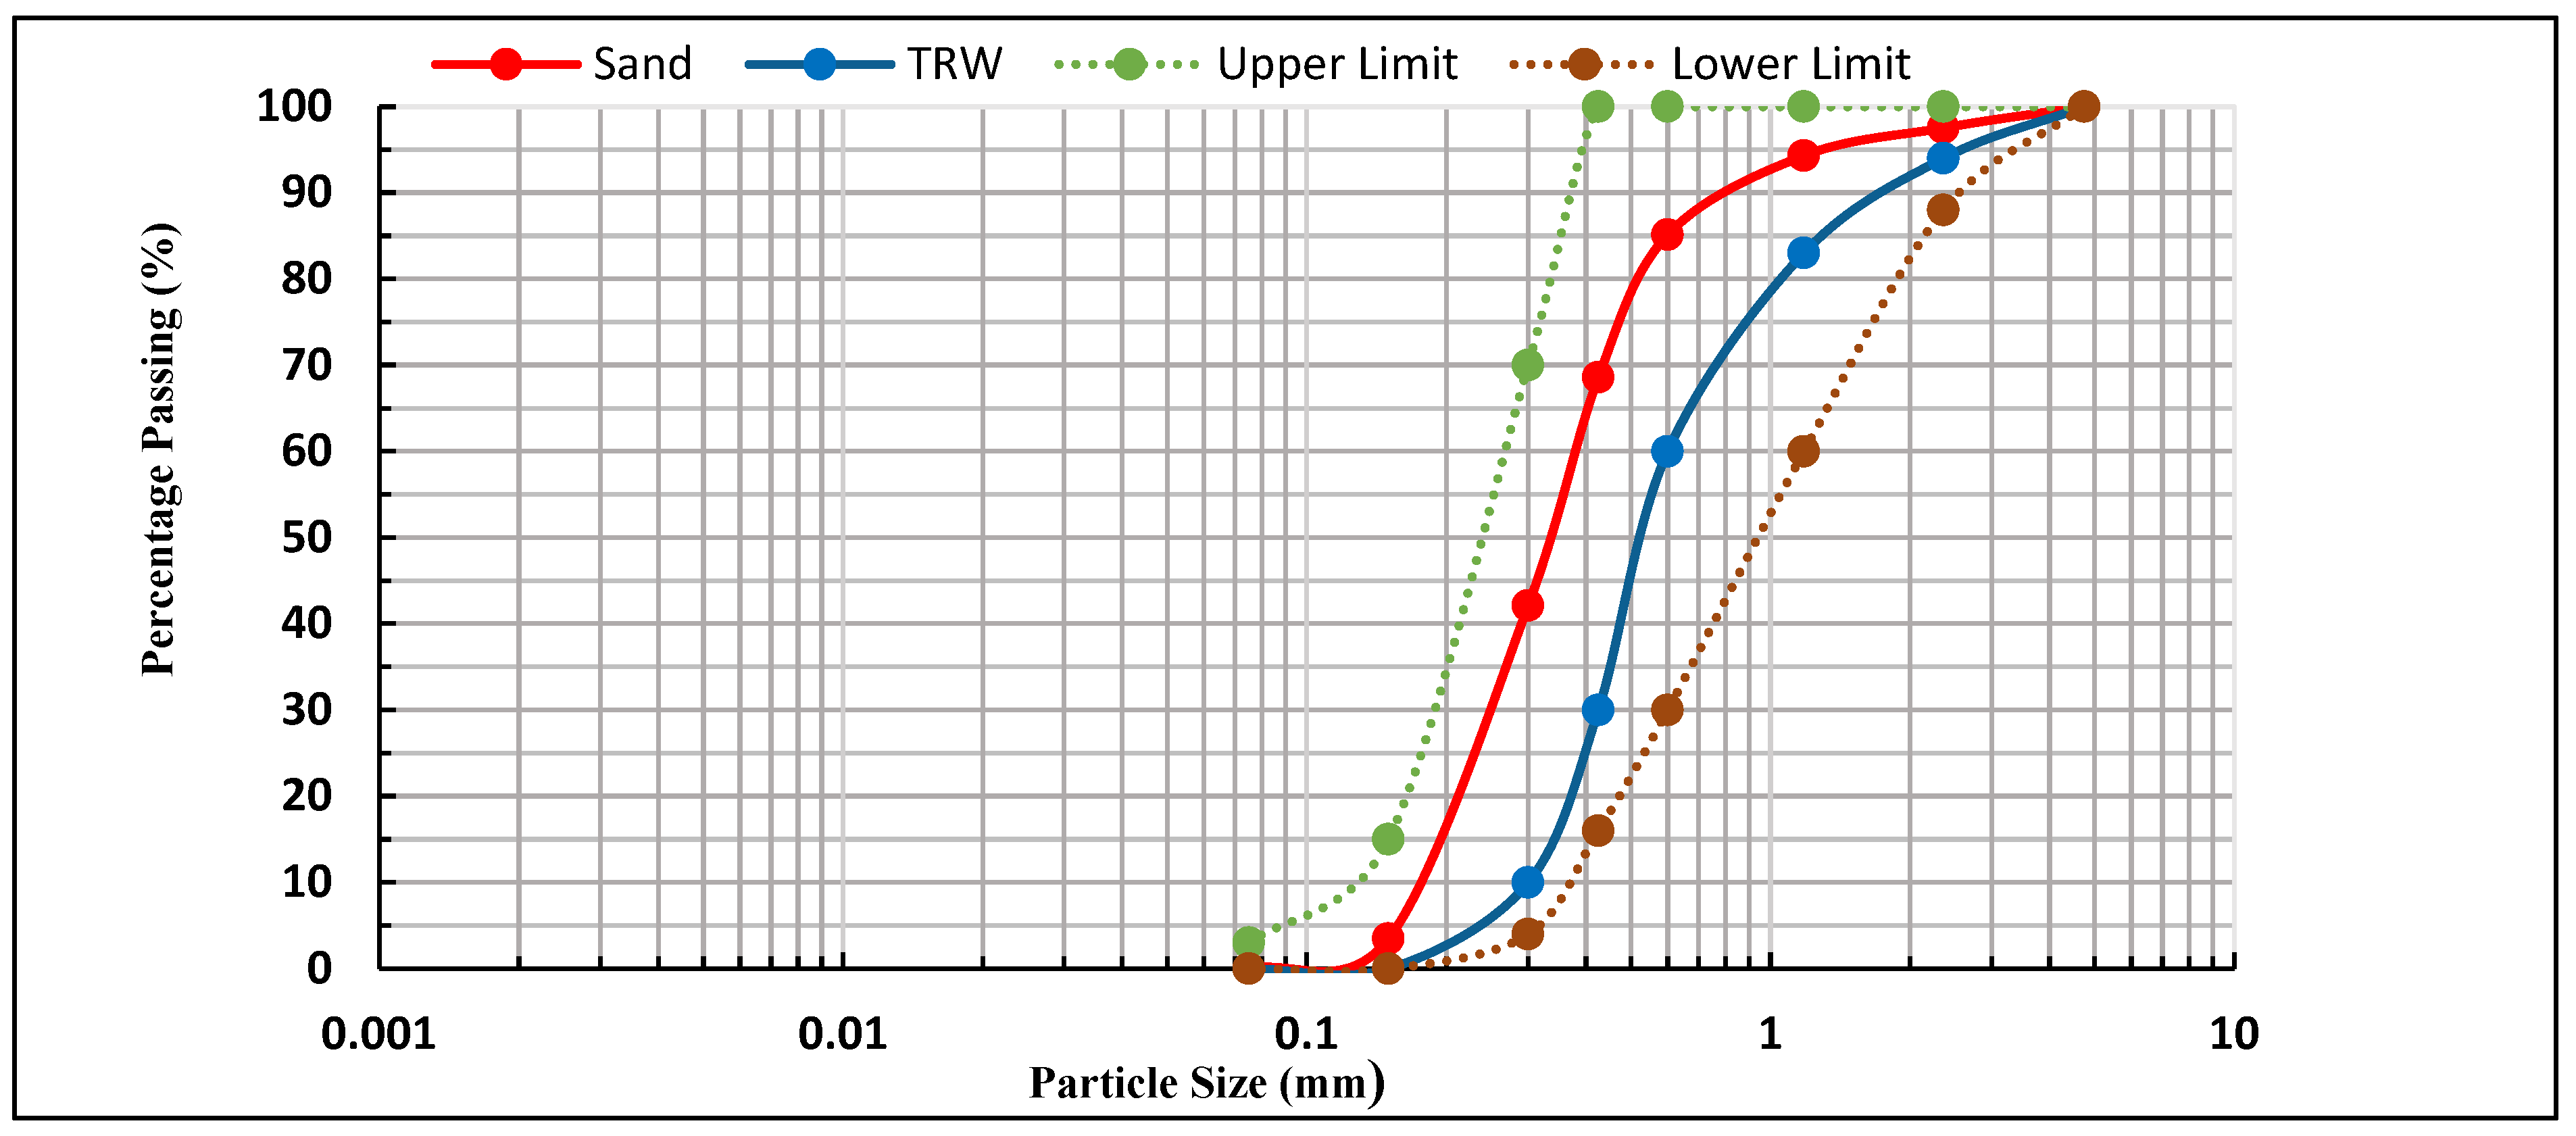
2. Materials Used in the Study

LKD and GGBFS: LKD and GGBFS were combined in a 70:30 blend ratio for brick production.
LKD has been identified as a possible replacement for OPC due to its high calcium content, alongside other compounds that highlight it as a favorable alternative binder material (ABM) [5,14,38]. Other compounds in LKD include SiO2, Al2O3, Fe2O3, and MgO, which are also in OPC in similar proportions [14].
Ground granulated blast furnace slag (GGBFS) is a supplementary cementitious material (SCM) composed of CaO and SiO2 in good proportions. This composition, in combination with the CaO, SiO2, Al2O3, Fe2O3, and MgO from the LKD, was responsible for the strength obtained in the bricks produced [14]. Table 1 shows the chemical compositions of the LKD and GGBFS used in this study. Specific gravity (Gs) values of 2.75 and 2.65 were obtained for the LKD and GGBFS, respectively.
Tire rubber waste (TRW): The properties and engineering applications of TRW have been previously reported in publications concerning its environmental, economic, and technical benefits [10,13]. However, a prevalent challenge of strength reduction persists in concretes produced with TRW. This is due to the hydrophobic nature of the rubber material and the difference in stiffness between the cement paste and the rubber particles [39,40]. This results in incomplete bonding between the cement paste and the rubber aggregates; hence, cracks easily occur when the samples are loaded externally. To address this shortcoming and enhance the mechanical properties of the rubberized samples, surface treatment of TRW with 10% (w/v) sodium hydroxide (NaOH) solution was carried out as recommended by previous research [14,41,42]. Furthermore, sieve analysis and Gs tests were carried out on the TRW crumbs, and values of 2.96 and 0.77 were obtained for the fineness modulus (FM) and Gs, respectively. The FM value obtained for the TRW was within the recommended limits from prior research [43,44], and as specified by codes [45,46] for fine aggregates. Hence, the fine TRW used in this study could partially replace fine natural aggregates (sand), since it possessed similar grading properties to the sand aggregates, as shown in Figure 1.
Sand: A gradation test was carried out to determine the particle size of the sand, and an FM of 2.47 was obtained. A Gs of 2.61 was also obtained for the sand sample. It is recommended that an FM within the range of 2.3–3 [45,46] or 2.2–2.8 [47] is suitable for brick production.
Water-reducing agent (WRA): In this study, Sika Plastiment®-45 WRA was incorporated to improve the workability of the mix.

3. Experimental Program for Rubberized Brick Production

In this research, the laboratory mix design of the rubberized brick was carried out to achieve 3 MPa as a minimum compressive strength, which is the recommended strength for masonry units under the non-load-bearing category [48,49]. We used 1.0 part by weight of the lime kiln dust-ground granulated blast furnace slag (LKD-GGBFS) blend to 3.0 parts by weight of natural sand as the fine aggregate, and a water–binder ratio of 0.45 was considered for the mix.
A trial mix design was performed to determine the final mix that would be used for the brick production (Table 2). A total of 63 bricks were cast for the trial mix, using a constant water–binder (w/b) ratio of 0.45. The mix design that had compressive strength (CS) greater than 5 MPa [49] and contained a higher amount of LKD was considered for producing the final bricks. Hence, the 70:30 (LKD-GGBFS) blend ratio was picked to be the final blending ratio that was used in the brick production.
To improve the workability of the mix, an average of 1.5% of water-reducing agent, based on the LKD-GGBFS weight, was added to the mix. The natural fine sand was partially replaced by the tire rubber waste (TRW) at 5%, 10%, 15%, and 20% increments by the volume of the sand.

Production and Curing Procedure

  • The mixing procedure for producing the bricks was carried out following the Australian standards [48,49]; thereafter, the mix was placed in formworks that had been greased for easy de-molding.
  • Vibration of the mix in three layers was carried out on a vibrating table. The first and second layers were vibrated for about 40 s each, and the final layer was vibrated for about 120 s. After the vibration was completed, the mix in the formwork was leveled to achieve a smooth and, leveled surface.
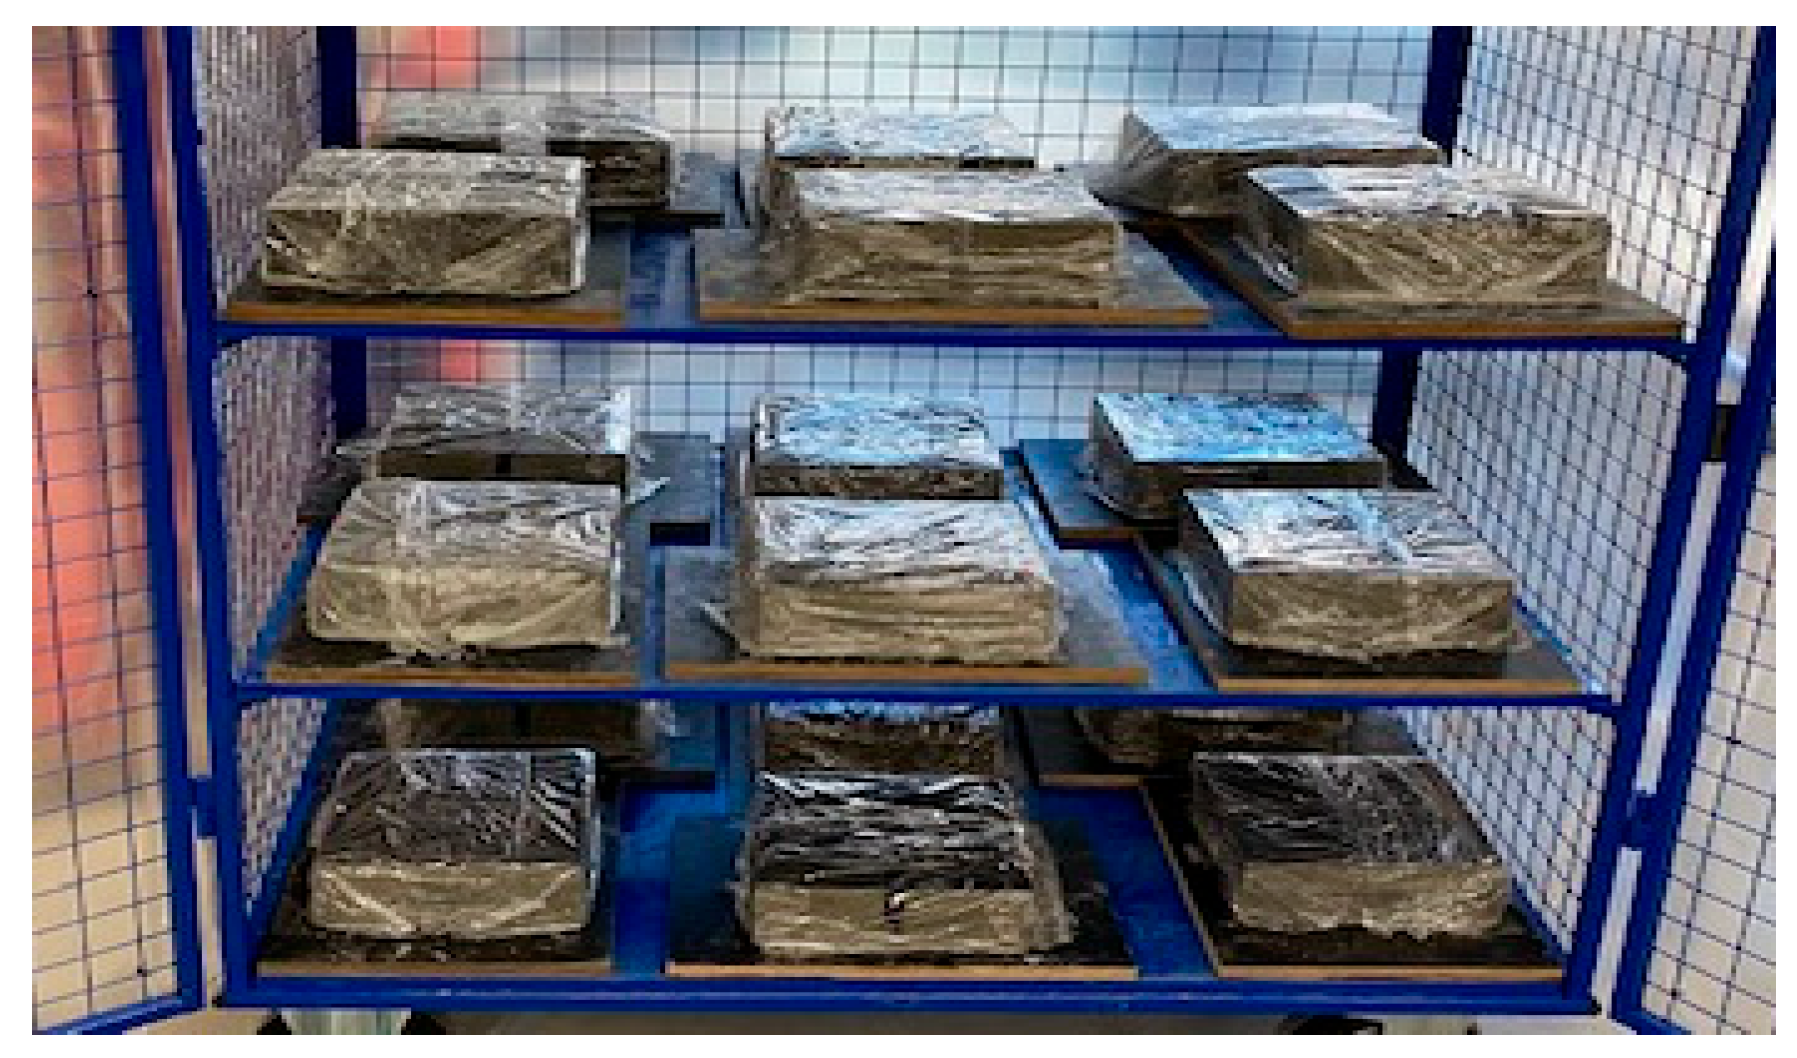
  • After 48 h, the bricks were de-molded, sprayed with water, and wrapped with nylon film to enhance moist curing in an environment with an average humidity of 79% (±5%) and an average temperature of 19 °C (±5 °C), as shown in Figure 2.
  • Hydration of the samples by spraying was carried out on alternate days until the curing ages of 7, 14, and 28 days. After each curing period, the brick samples were unwrapped as needed and tested.

4. Tests Carried Out on the Bricks

Tests carried out on the bricks included the following:
  • Compressive strength (CS) test
A compression test is usually carried out to ascertain the peak stress that any sample can withstand. The compression test was carried out using the MTS compressive strength testing machine. The testing machine comprises two flat steel plates: one in a firm position, upon which the masonry unit was placed, while the other is a movable plate, which was responsible for transmitting the load to the sample when the load was applied. The plates were arranged in such a way that the centroid of the masonry unit coincided with the center of the plate thrust. The load was applied at a uniform rate of 4 mm/min, and the load that caused the failure in the masonry unit was noted. For each TRW content considered, three samples were tested, and their average compressive strength was computed. The testing procedure was carried out in line with codes [48,49,50], and the CS was computed using Equation (1) below, as required by AZ/NZ-4456.4- [50]:
CS = K a   ( 1000 P ) A
where
  • Ka = Aspect ratio factor determined by the height-to-thickness of the brick;
  • P = Load that caused failure of the brick (kN);
  • A = Area of the brick (mm2);
  • CS = Computed compressive strength (MPa).
  • Flexural strength (FS) test
An FS test is usually carried out on bricks to assess their ability to withstand bending or flexural stress. It is carried out to investigate the structural integrity and breaking resistance when a load is applied to a brick. The information from an FS test is crucial for engineering and construction applications, ensuring that the bricks tested meet the required strength for construction purposes.
The samples that were cured for 7, 14, and 28 days were set up as shown in Figure 3 a,b and tested according to codes [51]. The loading rollers were brought into contact with the top of the brick sample, and then a seating load that did not exceed 100 N was applied to the brick sample. The uniformity of the bearing of the rollers was checked, and their positions were marked on the sides of the bricks, as shown in Figure 3, before proceeding with the loading.
The samples were loaded at a constant rate of 0.3 mm/min until they fractured (failure occurred), and the modulus of rupture was calculated using Equation (2) below, as required by codes [51]:
f c f = P L ( 1000 ) B D 2
where
  • fcf = Flexural strength (MPa);
  • P = Maximum applied force indicated by the testing machine (kN);
  • L = Span length (mm);
  • B = Average width of the specimen at the section of failure (mm);
  • D = Average depth of specimen at the section of failure (mm).
It was important to note that the fractures did not occur outside the middle third of the span length (indicated with blue lines, as required by code AS 1012.11) [51]. Figure 3 shows the brick samples before and after testing using the MTS testing machine, showing that the fracture occurred within the middle third of the span.
  • Freeze–thaw (F-T) test
F-T tests are usually performed to estimate the resistance and durability of a concrete sample to resist deterioration when exposed to repeated freeze–thaw cycles [48]. This is because F-T is considered to be one of the durability properties of bricks and has been identified as one of the major factors in brick degradation [52,53,54]. It has also been established as a qualitative and direct method used to assess the durability of bricks [52,53,54]. Furthermore, it has been reported that bricks are porous building materials that usually contain some amount of moisture within their structure. This moisture has a direct influence on the bricks’ properties such as shrink and expansion, strength, resistance to external conditions, and vapor permeability [55]. The durability of the bricks was tested by assessing their resistance to F-T, as described in code EN 772-22 [56].
The resistance to F-T was assessed by exposing the bricks to 10 F-T cycles. The F-T tests were carried out on the rubberized bricks that contained 0, 5, and 10% TRW. Samples prepared with 15 and 20% TRW were not considered, due to their low strength. After the bricks had been cured by hydration for the specified durations, three bricks for each TRW content considered were selected randomly and placed in a chamber, where the internal temperature was lowered from 22 °C to −43 °C (71.6 °F to −45.4 °F) and then increased back to 11–17 °C (51.8–62.6 °F) within 12 hours (hrs). Each cycle comprised 9 hhrs of freezing and 3 hrs of thawing in water. The freezing was limited to 9 hrs because the temperature in the chamber was as low as −43 °C. The bricks were weighed and recorded at the successful completion of each cycle. This was used to calculate the change in the mass of the brick, and the average values of the three bricks in each case were used for computations. Additionally, the appearance of surface changes after the F-T cycles of the bricks was also assessed.
  • Mercury intrusion porosimetry (MIP) test
The distribution of the pore sizes in the bricks was characterized using MIP as a common method recommended by researchers [57,58,59,60]. The samples used for the MIP test were crushed samples obtained from the bricks that were exposed to the F-T test and air-dried for 60 days, and from the samples that were not exposed to F-T cycles but were left in the open outside for a period of no less than 60 days. This was done to compare the effects of the F-T test on the pore sizes of the bricks. The retrieved samples were dried in an oven at a temperature of 105–110 °C for 24 h to ensure that all of the pores were free from any form of retained or trapped water [60,61]. The MIP test was performed on an AutoPore IV 9500 Version 2.03.00 with a maximum pressure of about 207 MPa and a contact angle value of 130°. The tests were conducted at low and high pressure levels, which permitted the evaluation of the pore size distribution in the range from about 350 μm (µm) to 6 nanometers (nm).
The use of the Maage factor, as proposed by Maage [62], has been identified and acknowledged as an indirect method used to grade the resistance of bricks that have been subjected to F-T cycles [63,64]. The Maage factor, which is based on experimental data, presents a statistical model with two main variables: the total volume of pores (PV), and the proportion of pores with a specific diameter larger than 3 µm (P3), which are partially saturated due to the meniscus effects, as shown in Equation (3) below:
F c = 3.2 P V + 2.4   ( P 3 )
where
  • Fc = Calculated frost resistance number/frost durability index;
  • PV = Intruded pore volume (cm3/g or mL/g);
  • P3 = Percentage of the pores with diameters greater than 3 µm.
Equation (3) was used to compute and determine the extent of the produced bricks’ durability, where values of Fc > 70 represent durable bricks, and Fc < 55 represents non-durable bricks. Fc values between 55 and 70 represent bricks with uncertain frost durability properties [62].
Research by Koroth, [52], Mensinga, [53], Elert et al. [65], and Stryszewska and Kanka [66] has shown precisely that the large pores within the samples are responsible for the good resistance of clay bricks to F-T cycles. Furthermore, pores larger than 3 µm in diameter have a beneficial effect on the frost resistance of bricks [55,62]. This section examines the influence of raw materials’ (LKD-GGBFS blend and TRW) characteristics on the porosity, pore volume, and pore size distribution, which were used to assess the LKD-TRW bricks.
  • Water absorption test
After 28 days of curing had elapsed, the samples were subjected to cold water absorption (WA) tests. The WA tests were conducted on the bricks to investigate their durability properties, which include their quality, their behavior in weathering, and their degree of burning. A water absorption value not exceeding 20% provides better resistance to damage by freezing [48,50,67,68]. Furthermore, WA tests can be used to determine the degree of compactness in bricks, because water is absorbed by pores in bricks and, thus, with an increase in pores, the water absorbed by the bricks increases. Hence, bricks with WA of less than 3% can be referred to as vitrified. The WA tests were carried out per codes AS 3700 [48], AS-NZ-4456.14 [50], IS:1077-2:1992- [67], and IS 3495-2 [68]; after the tests, water absorption was computed using Equation (4) below:
W = ( M 2 M 1 ) M 1 × 100 %
where
  • W = Water absorption (%);
  • M1 = Weight of brick after oven-drying for 24 h (g);
  • M2 = Weight of brick after soaking in water for 24 h (g).

5. Discussion of Results from the Tests

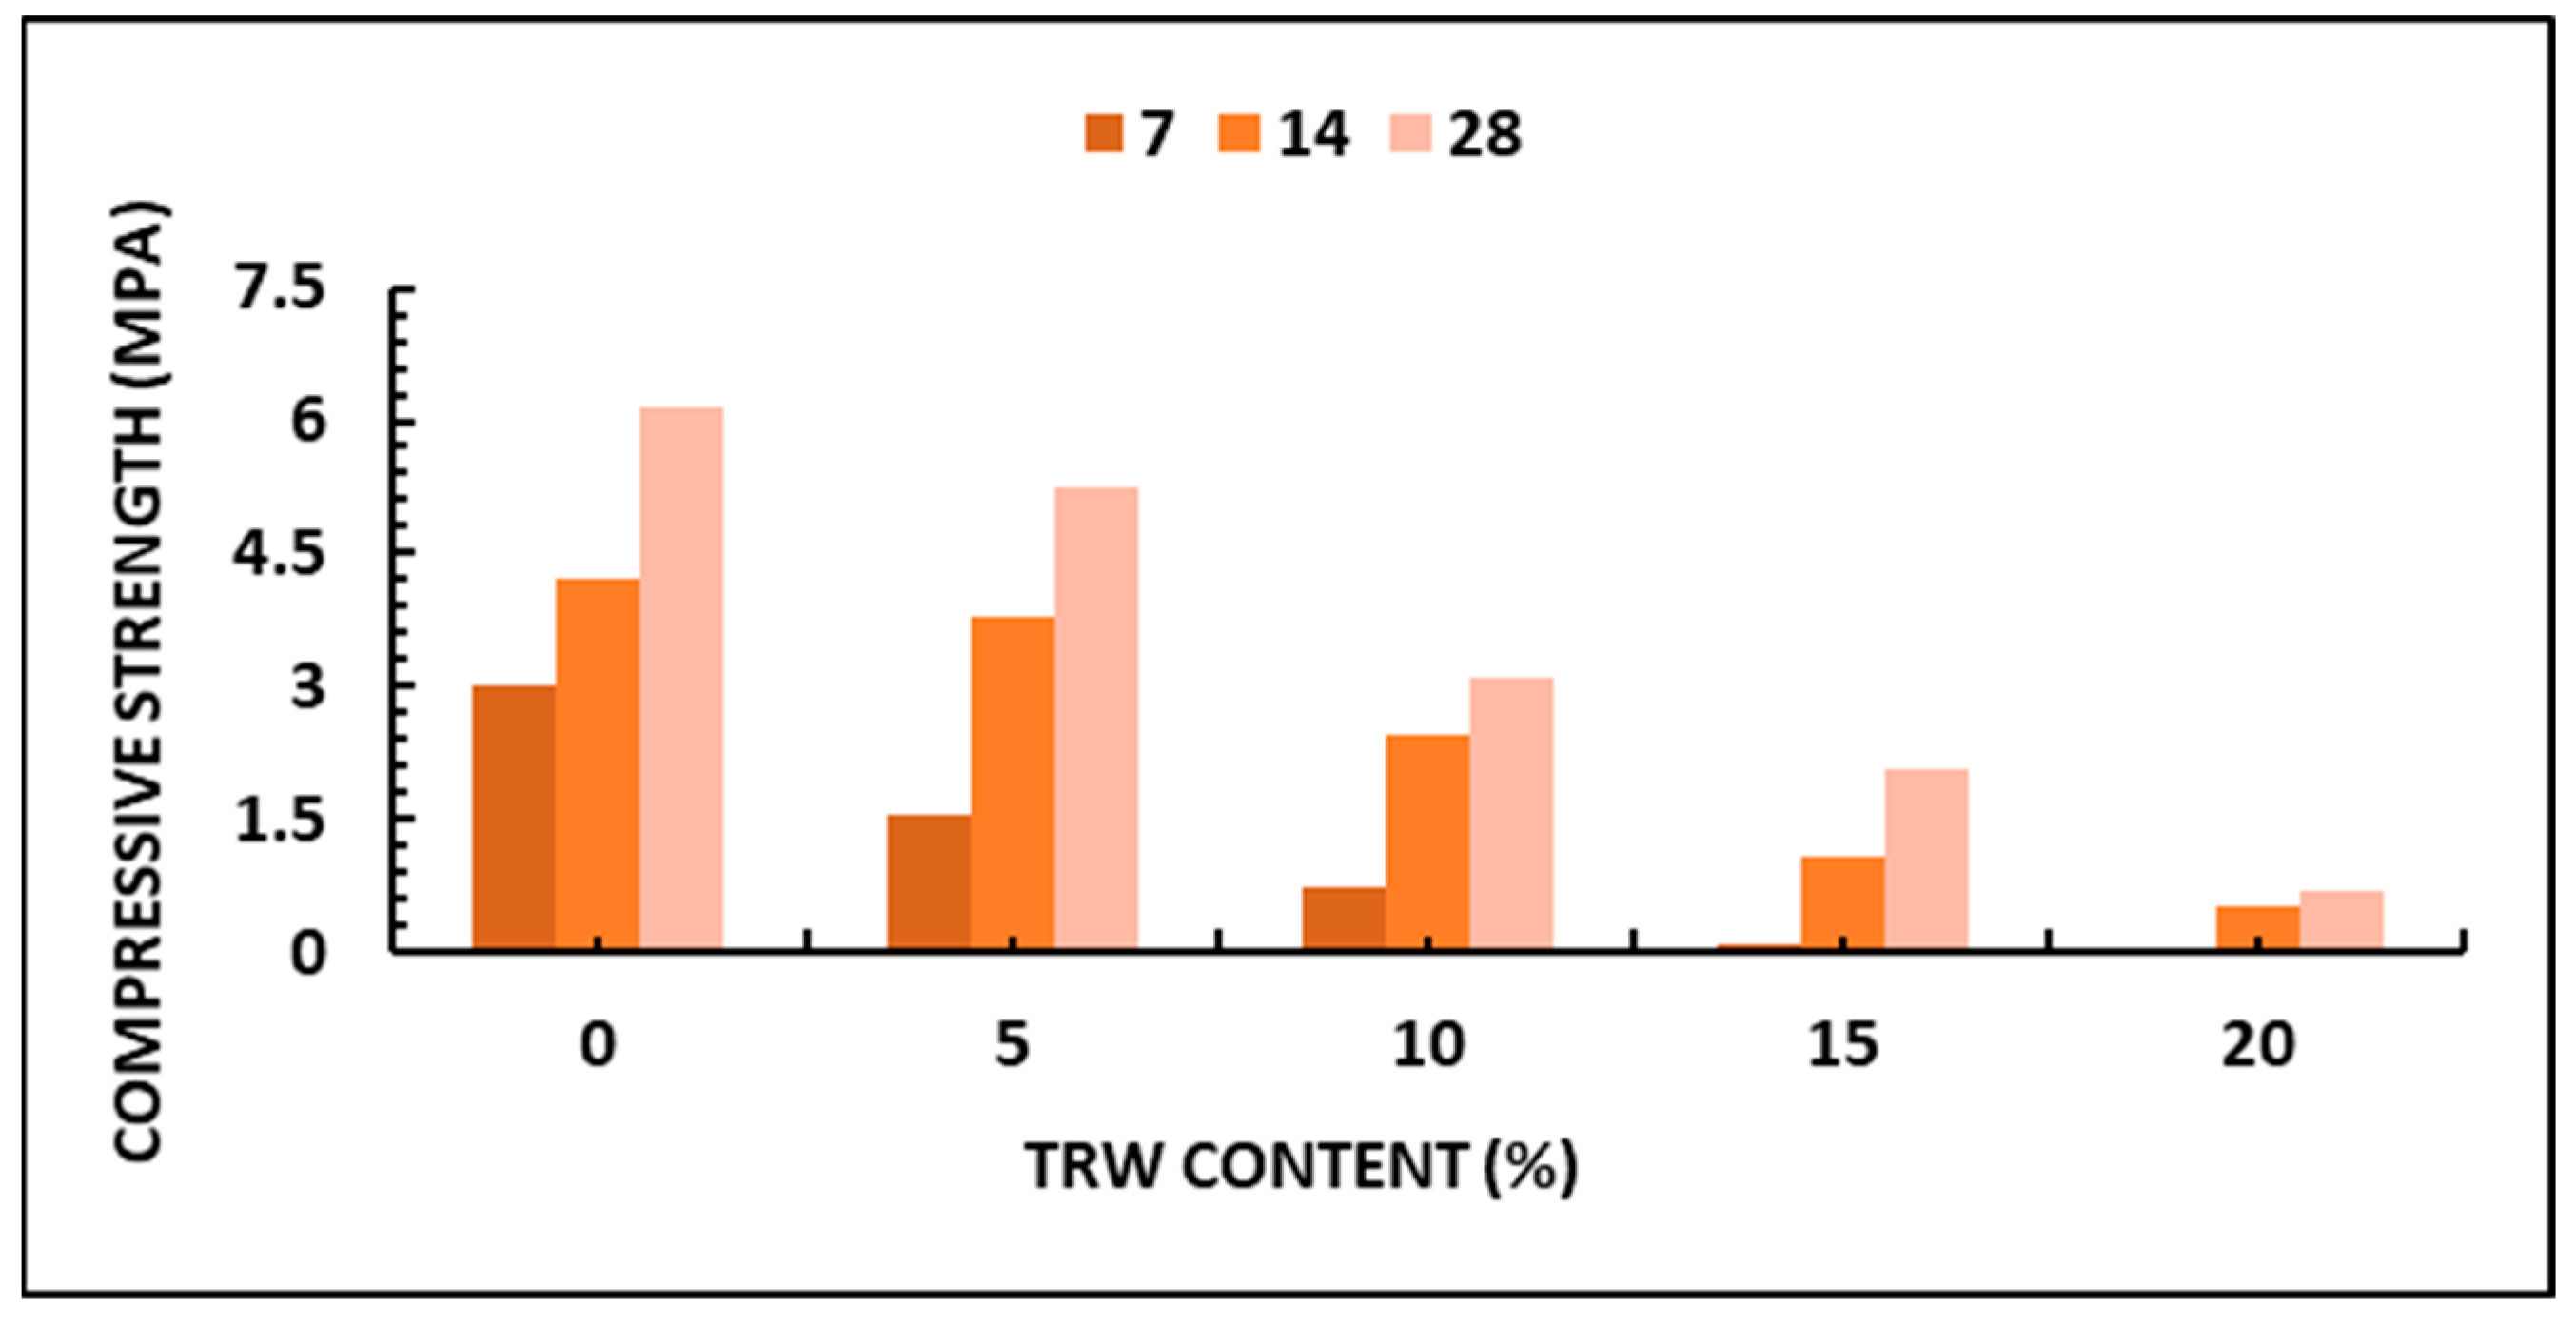
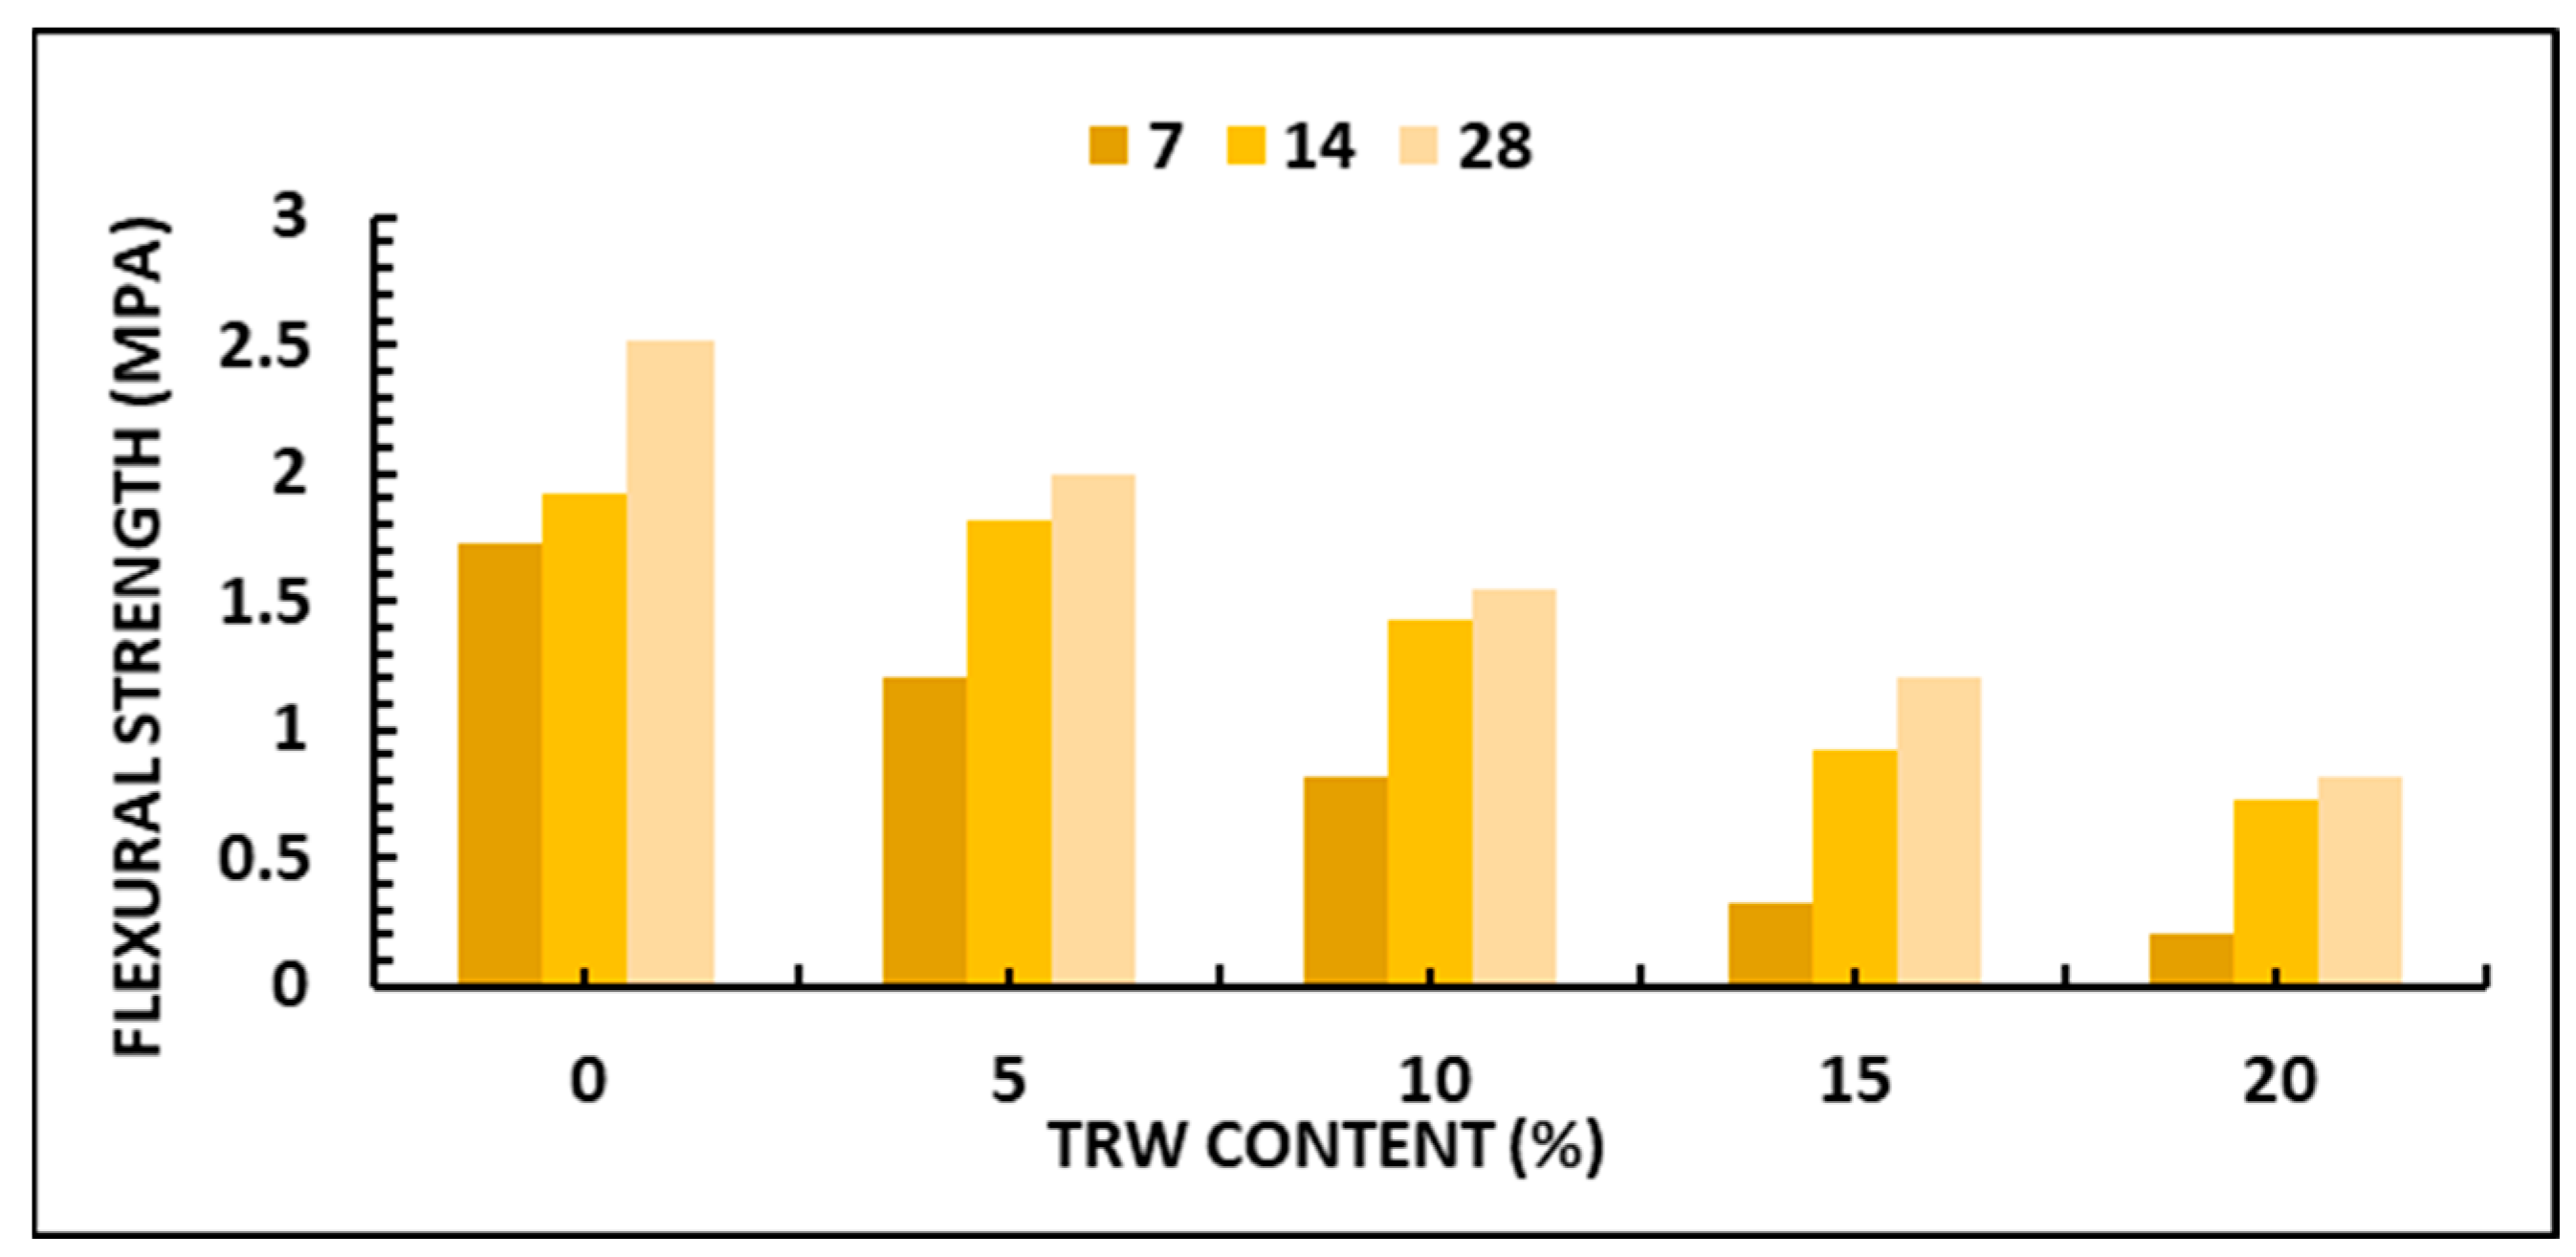
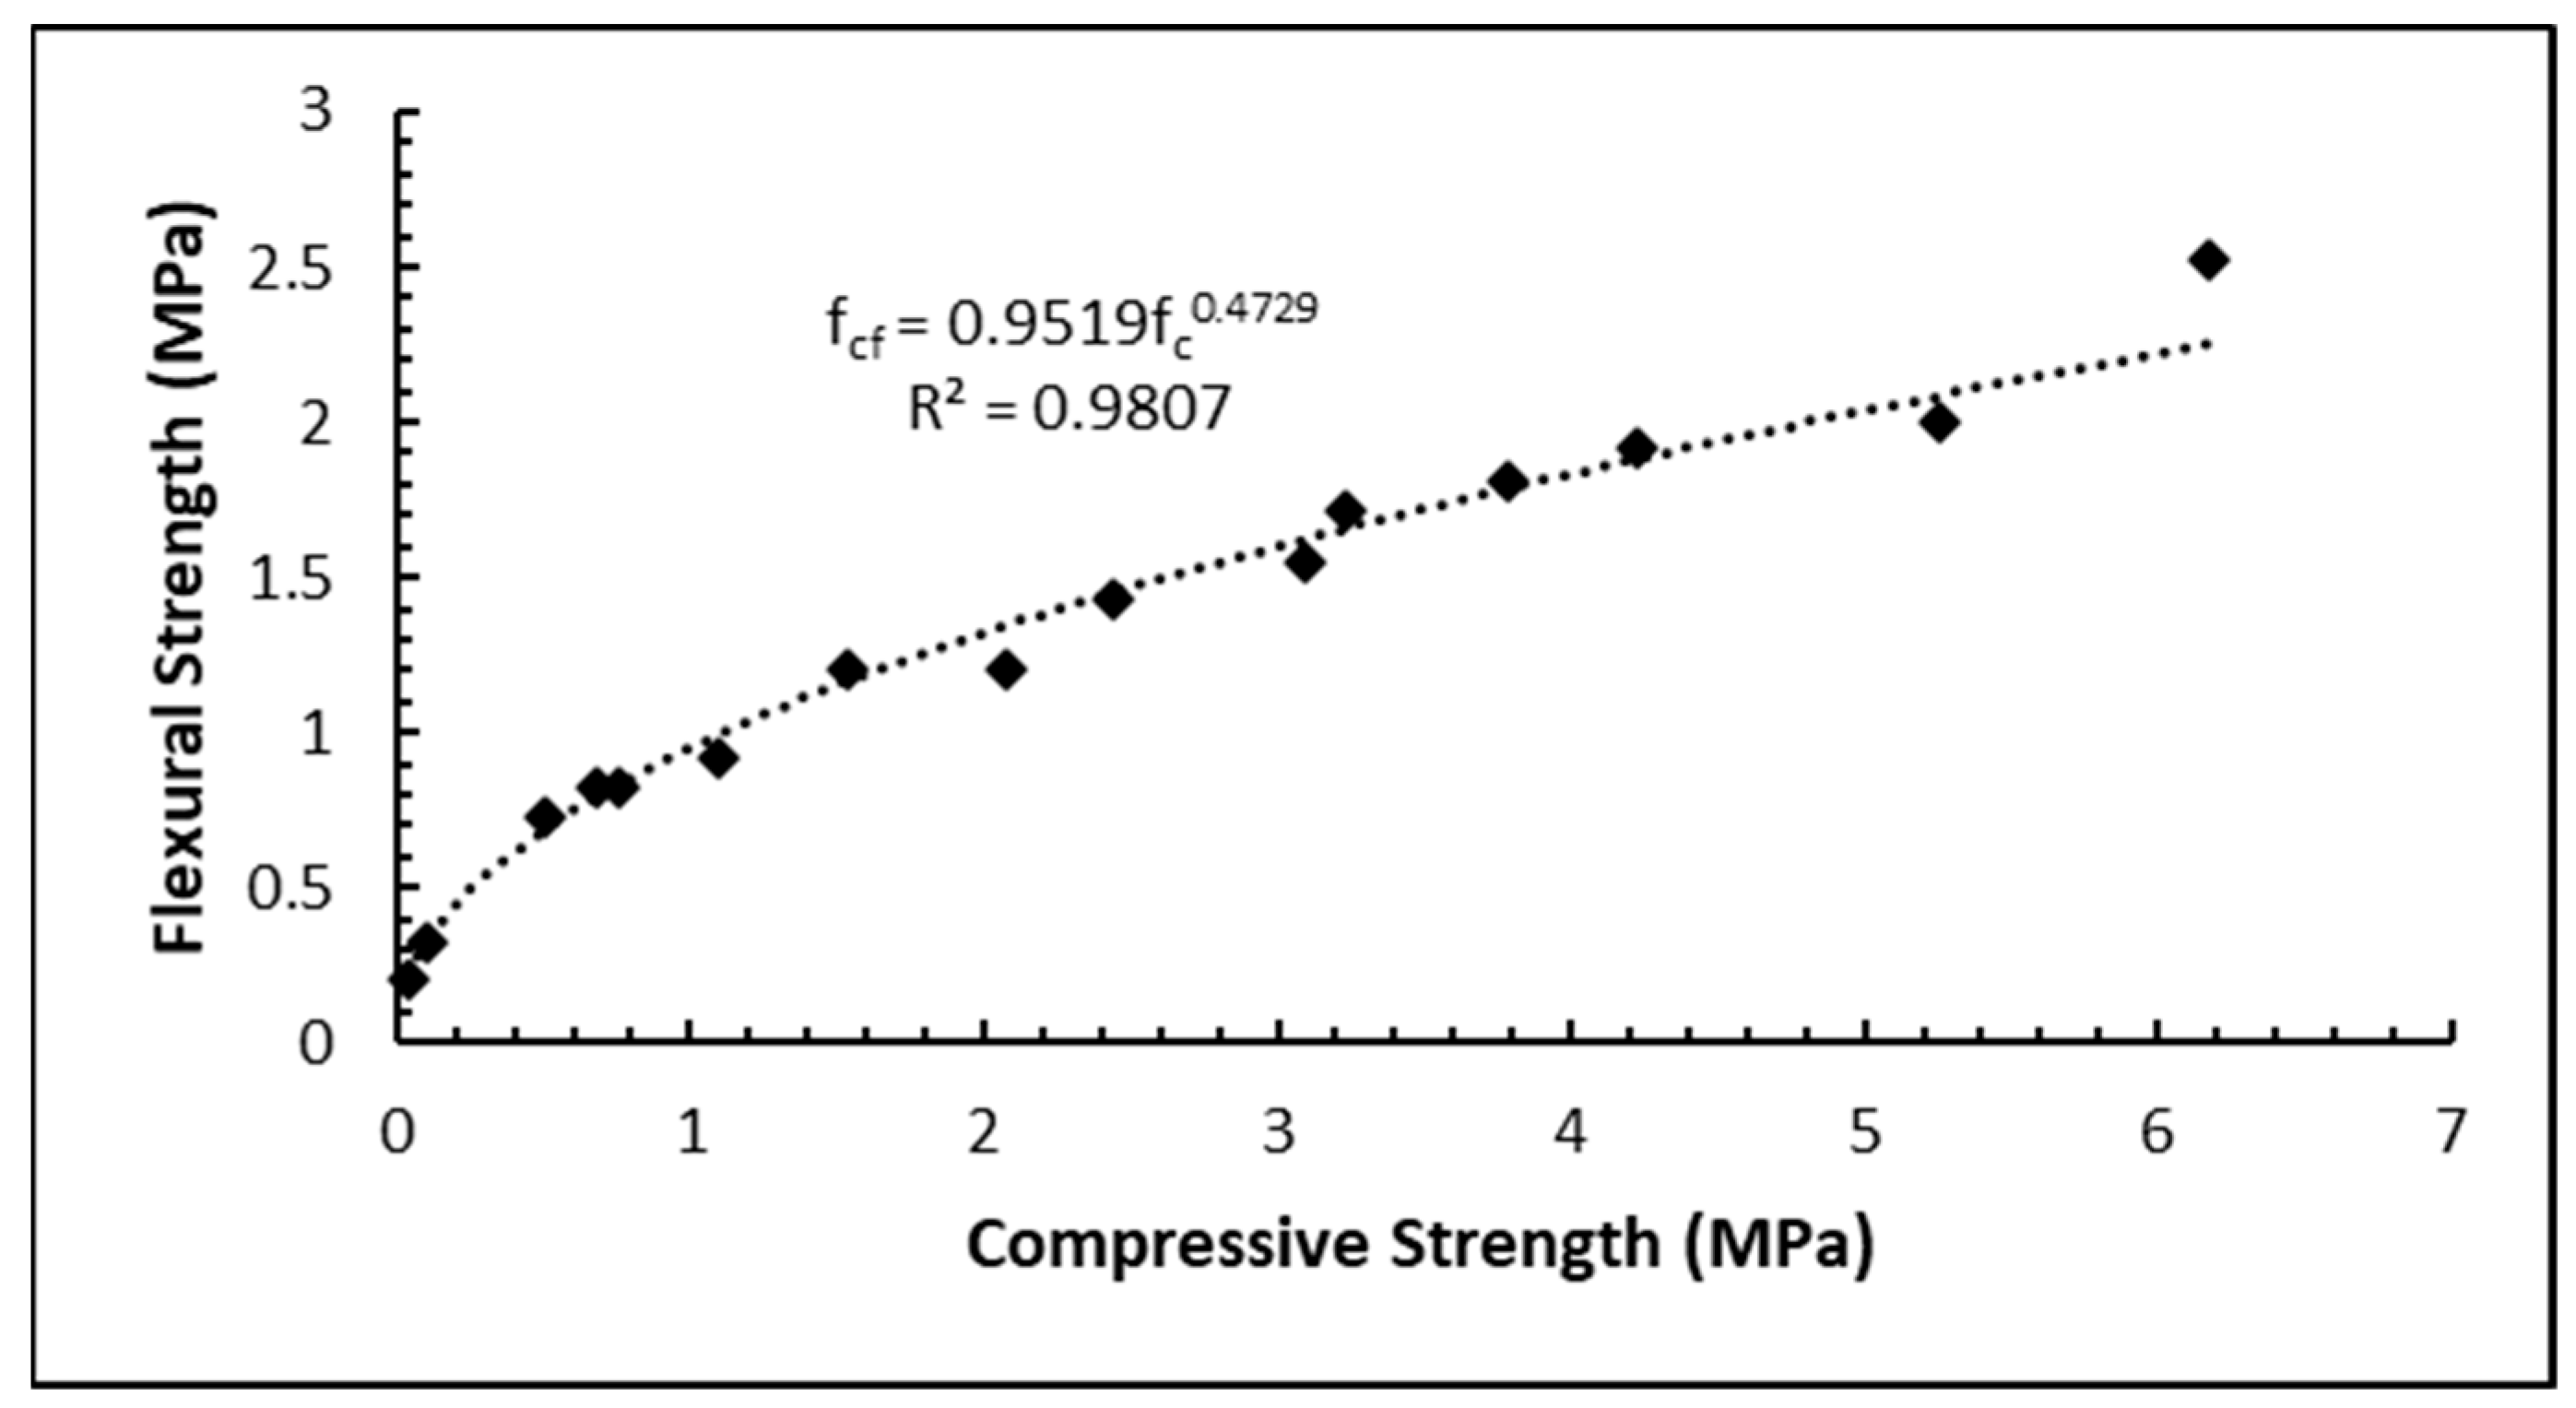
5.1. Compressive Strength (CS) and Flexural Strength (FS)

Table 3 shows the CS and FS results obtained for the samples that contained varying contents of TRW, while Figure 4 and Figure 5 show the plots for the CS and FS obtained, respectively.
It can be observed from Figure 4 and Figure 5 that, with an increase in TRW content, there was a reduction in both CS and FS. Furthermore, it can be observed that with increasing hydration duration from 7 to 28 days, there was an increase in both CS and FS. Additionally, the bricks produced with up to 10% TRW replacement passed the FS requirements for concrete bricks, which range between 1.4 and 3.4 MPa [69]. As required by standards, the bricks that contained 10 and 5% TRW met the non-load- and load-bearing requirements for masonry units, respectively, [49]. It can be concluded that the bricks produced with up to 10% TRW passed the CS and FS requirements for units that can be used in small buildings.
A theoretical model that can be used to correlate the CS and FS of the green bricks was developed. The exponential, linear, power, and logarithmic models were produced, and the model that gave correlation coefficients (R) of almost 1 was selected as the most acceptable relationship. Hence, the power model was selected as the most acceptable relationship, which is consistent with the work carried out by Oke and Abuel-Naga [14], as shown in Table 4. Figure 6 shows the relationship between the CS and the FS of the bricks.
From the above models, the model that can be used to predict the FS of the TRW bricks in the absence of a test is the power model, which is expressed in Equation (4) below:
fcf = 0.9519fc0.4729
where
  • fcf = Flexural strength;
  • fc = Compressive strength.

5.2. Freeze–Thaw

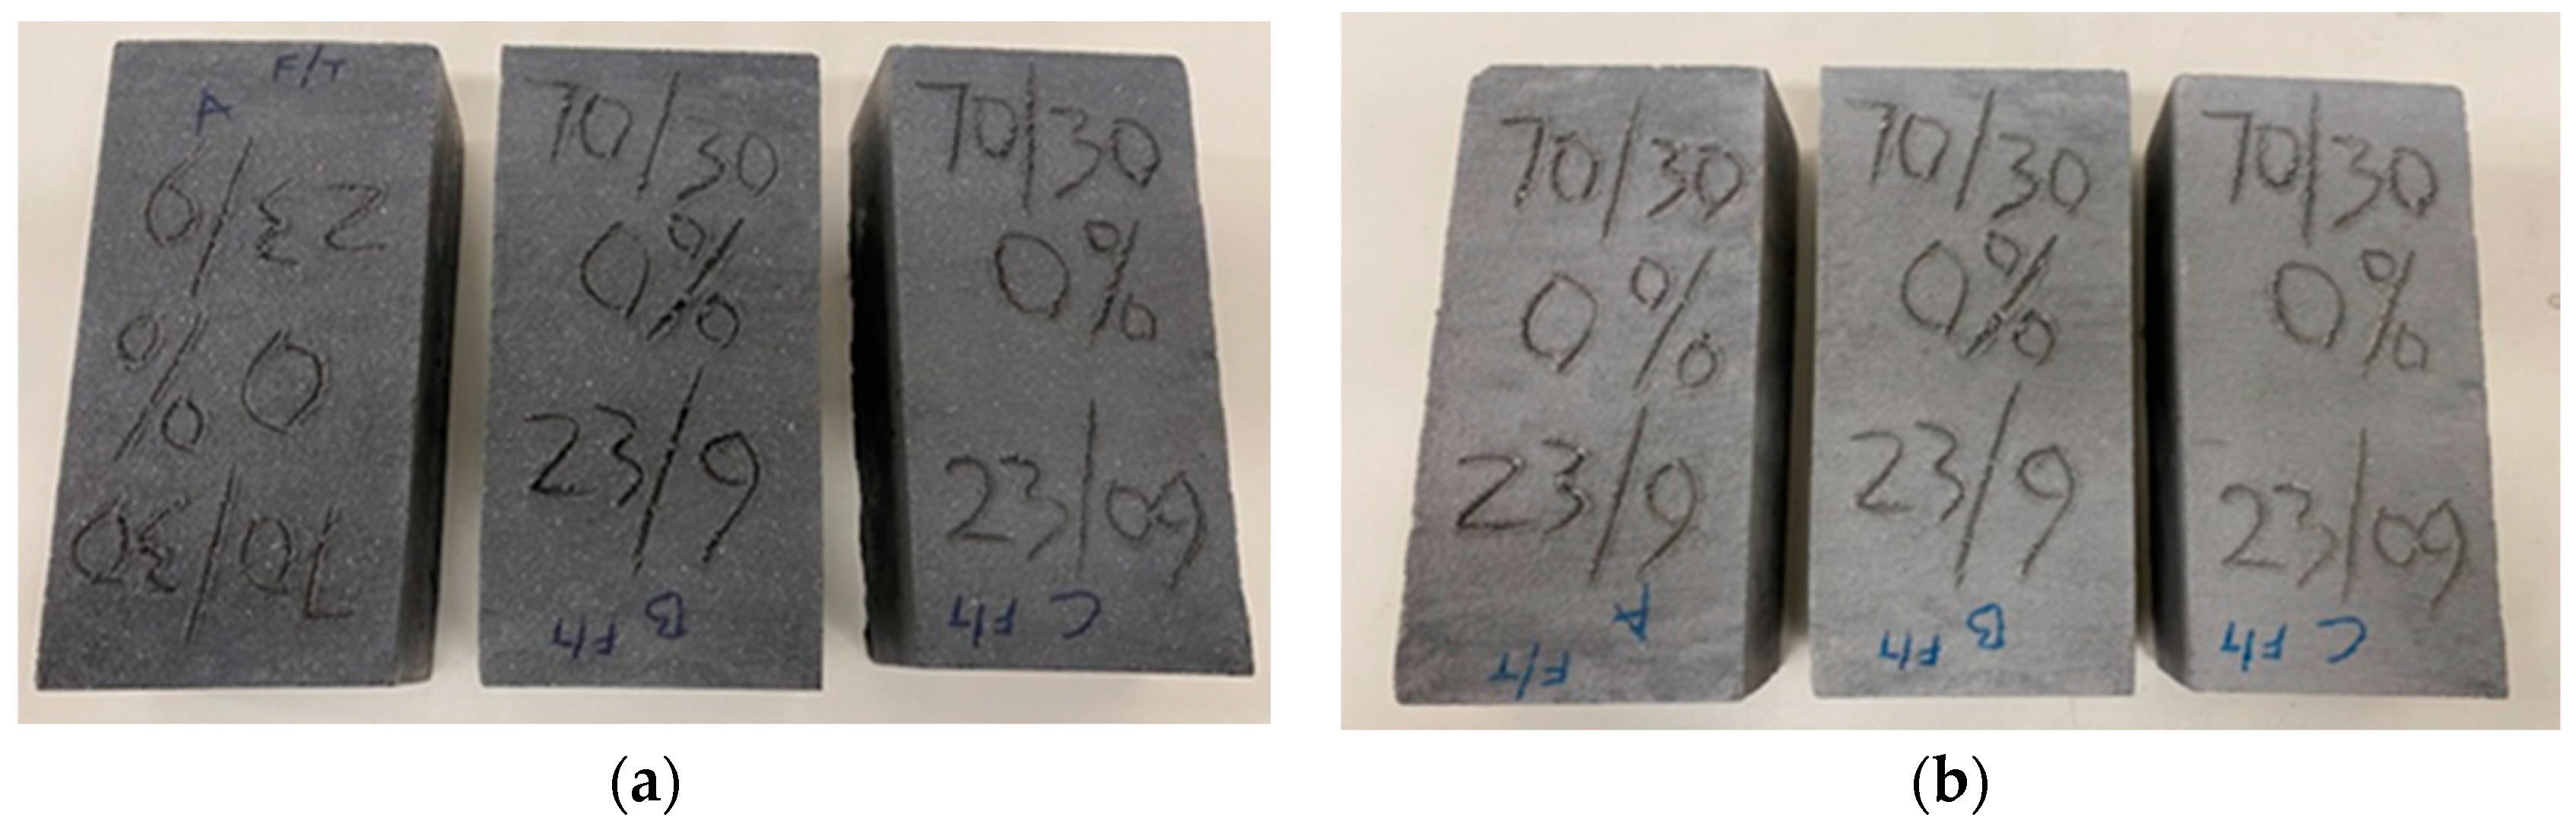
  • Physical appearance of the bricks before and after F-T
After the cycles, the samples were visually inspected for changes on the surface, as shown in Figure 7a,b and Figure 8a,b. If there were no signs of change in the specimens, this implies that the samples were qualitatively assessed as resistant [55].
It can be observed that the samples that were prepared without TRW (Figure 7a,b) had no physical changes before and after the 10 cycles, but the samples that had 5 and 10% TRW had some abraded spots on the surface of the bricks, as shown in Figure 8a,b. This shows that the samples that had no TRW content exhibited better F-T durability and were classed as frost-resistant bricks. The samples that contained 5 and 10% TRW were classified as non-frost-resistant bricks. In practical applications, frost-resistant bricks are termed frost-durable bricks [62,63].
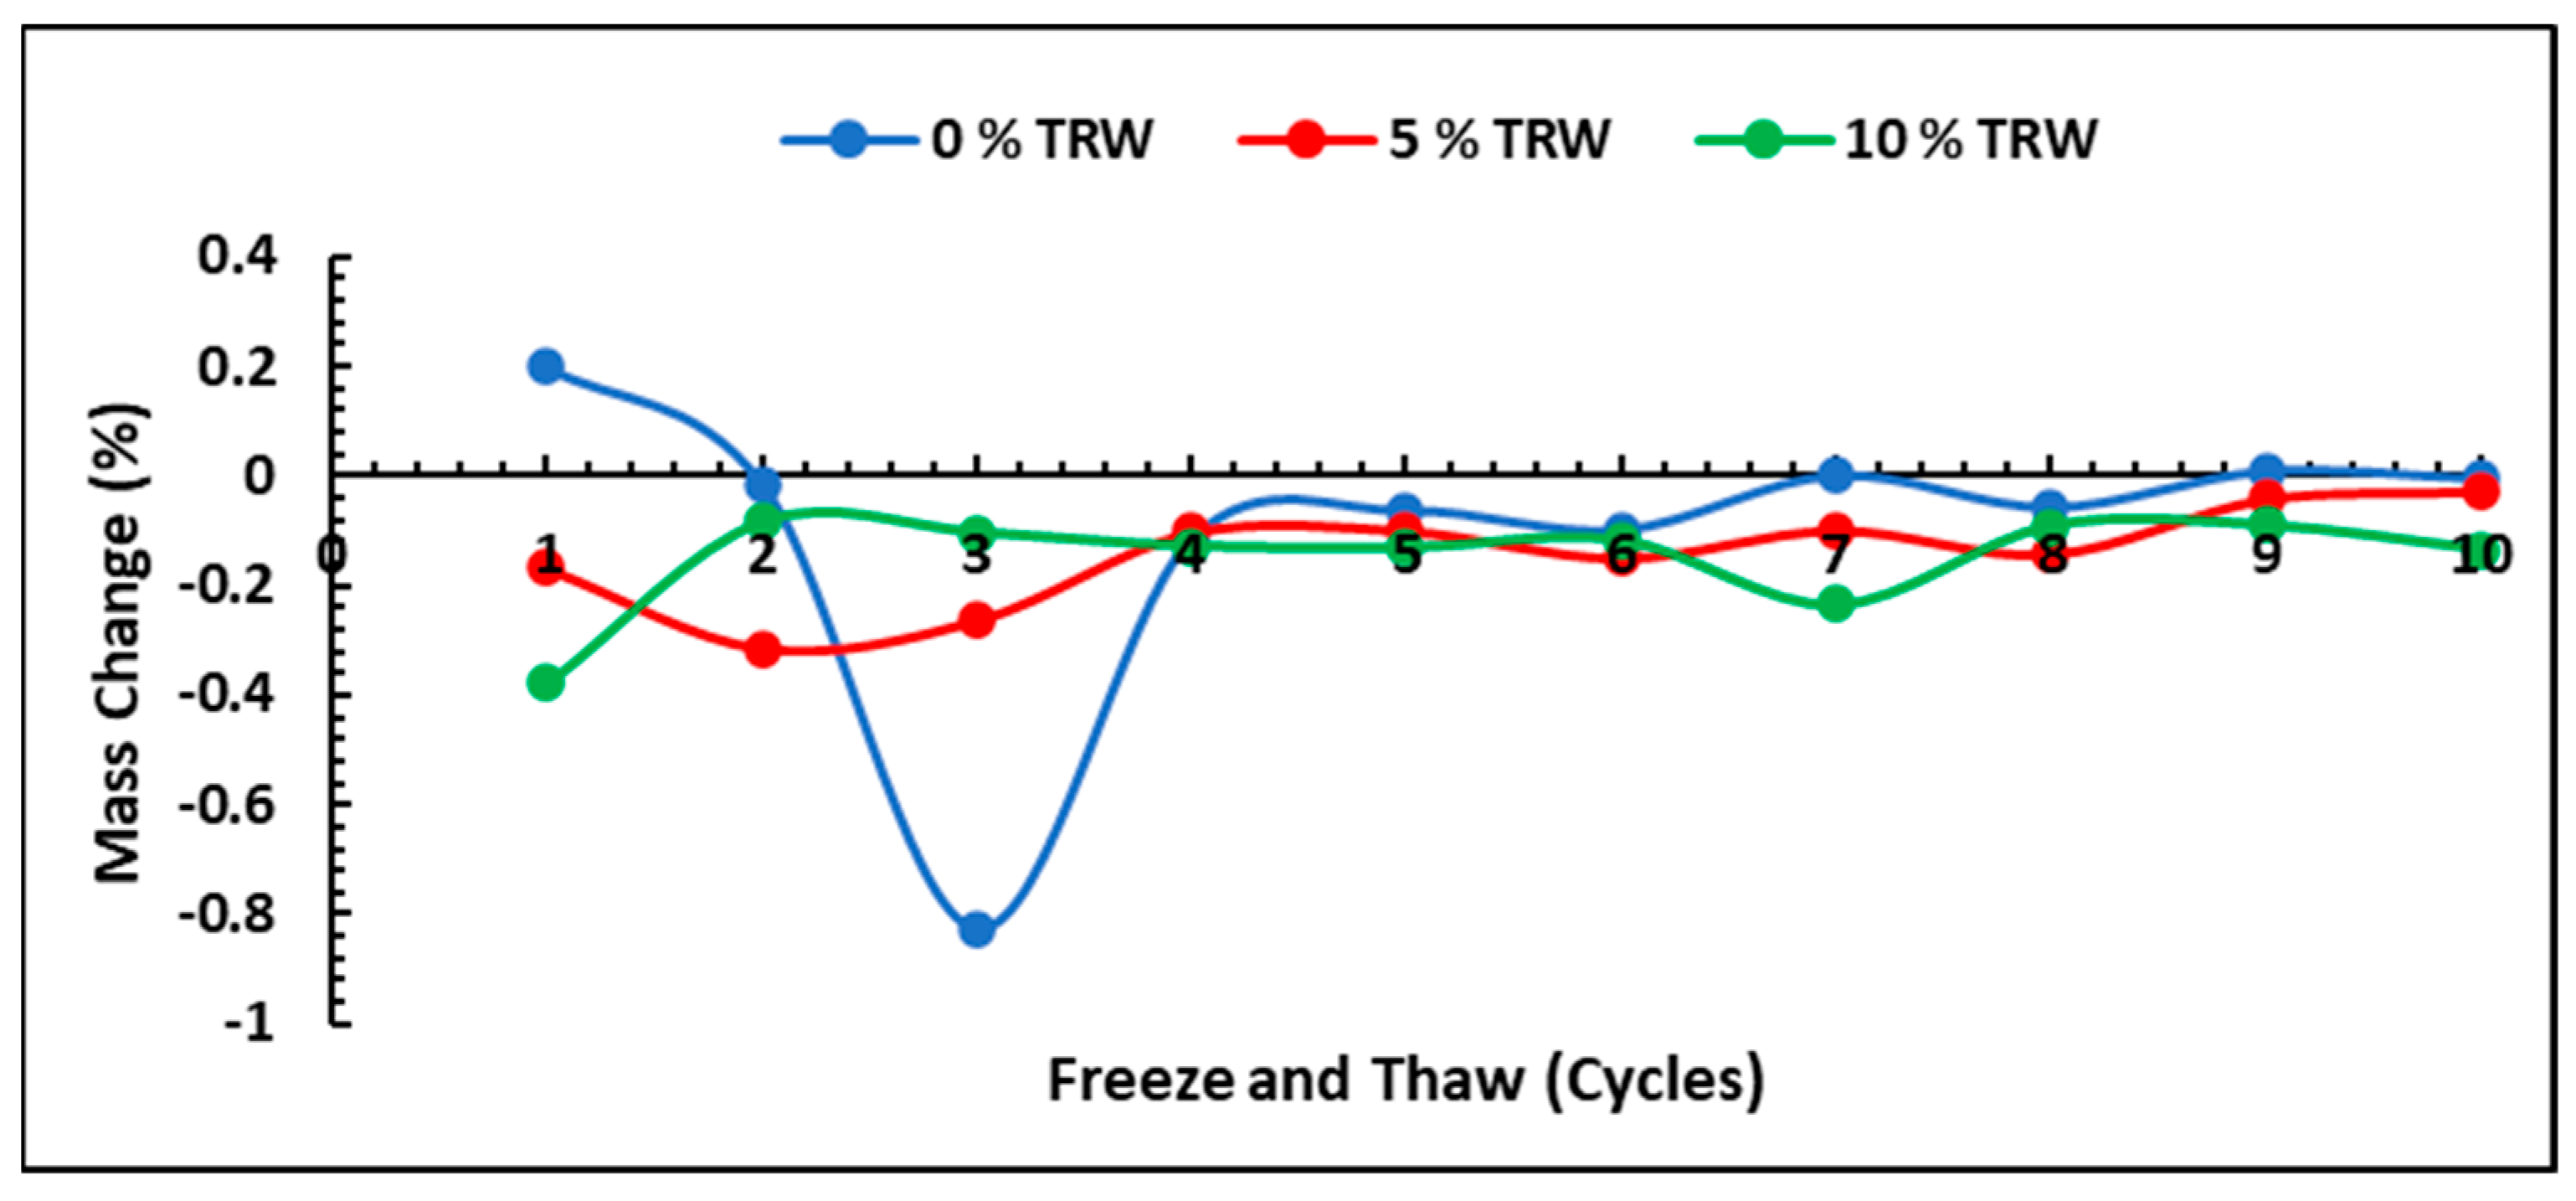
  • Mass change of the bricks during the F-T test
The mass change in the brick samples was also monitored during the F-T cycles. After each cycle, the bricks were weighed, and average values were taken. Figure 9 shows the plots of the F-T cycles against the mass change.
It can be observed from the plots in Figure 9 that there was not much mass change recorded for the brick samples that had 5 and 10% TRW. Bogas [70] has suggested that the voids inside the lightweight aggregates or concretes may function as expansion chambers, where the generated hydraulic pressure resulting from water freezing in the pore structure of the concrete is released, hence the negligible mass change. However, more surface changes were observed in the samples with 5 and 10% TRW. Verbeck and Landgren [71] and Mehta and Monteiro [72] reported that the surface changes usually result from the expansion of saturated aggregates near the surface of the specimen, which is followed by the disintegration of the surrounding cement paste (in this case, the LKD-GGBFS blend). When the water inside the aggregates is frozen, a pressure that leads to the failure of aggregates or disrupts the surrounding cement paste is generated, which was observed on the surface of the rubberized brick samples [70,72]. For the 0% TRW samples, the mass change was very evident, especially at the beginning of the test, and this can be attributed to the absorption and retention of water and the absence of TRW in the mix. Furthermore, the surface of the 0% TRW samples experienced no changes after the 10 cycles, because no expansion occurred near the surface of the bricks, due to the absence of TRW particles.

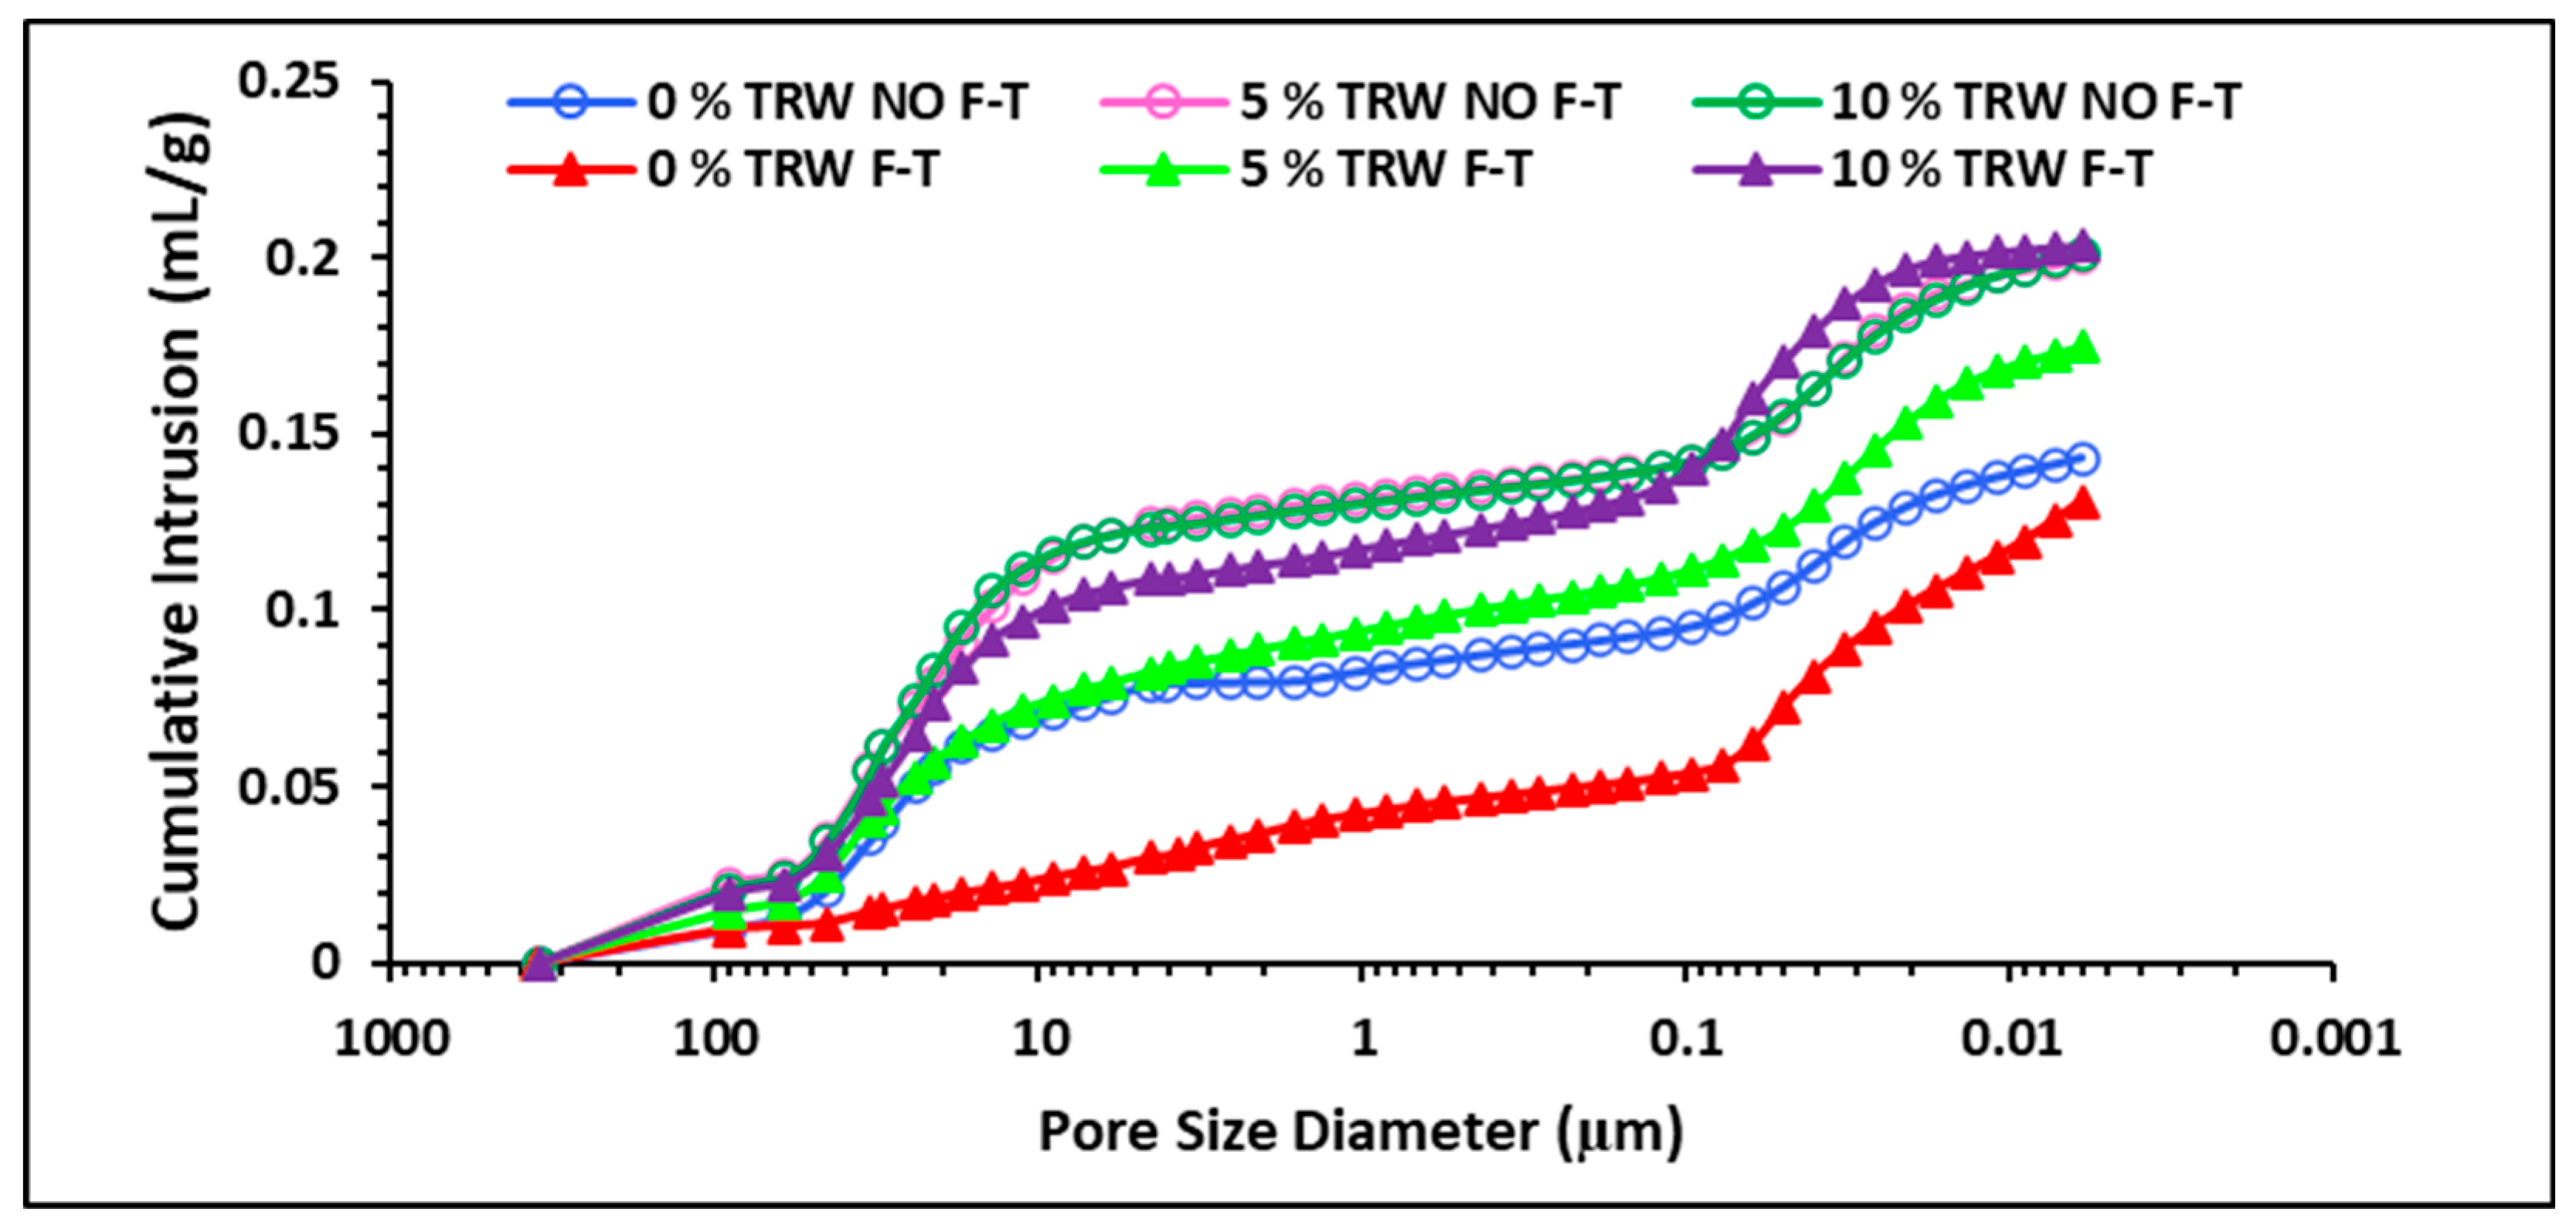
5.3. Mercury Intrusion Porosimetry (MIP)

Figure 10 and Figure 11 show plots of the cumulative distribution and log-differential distribution of the pore sizes, respectively, for the samples subjected to F-T cycles (F-T) and those not subjected to F-T cycles (NO F-T).
As observed in Figure 10 for both exposures (F-T and NO F-T), the pores with diameters greater than 3 µm were about 37%. Furthermore, the cumulative curves gradually became flat at pore diameters of about 0.1 µm, so we can safely conclude that, regardless of the TRW content, all of the bricks had about 63% of pores with diameters less than 3 µm. Hence, the average cumulative intrusion volume of 0.093 mL/g at 3 µm represents the total pore volume of the sample. However, for the samples exposed to F-T cycles, the PV values obtained were 0.1309 mL/g, 0.1747 mL/g, and 0.2035 mL/g for the 0, 5, and 10% TRW samples, respectively. Referring to Equation (4) and computing Fc with the obtained PV values, the brick samples that had 0% TRW fell under the durable region, the brick samples containing 5% TRW fell within the uncertain region, and the samples with 10% TRW fell in the non-durable region. A similar trend was observed for the samples not exposed to F-T cycles (NO F-T). PV values of 0.1433 mL/g, 0.2 mL/g, and 0.2014 mL/g were obtained, respectively, and the brick samples that had 0% TRW again fell under the durable region. The brick samples containing 5% and 10% TRW fell within the uncertain and non-durable regions, respectively. However, it was observed that the samples with 5 and 10% TRW (NO F-T) and 10% TRW (F-T) had similar pore size distribution, with high mercury intrusion, while the samples with 5% TRW (F-T) had a dissimilar pore size distribution, highlighting a lower volume of mercury intrusion. It can be concluded that the size of the pores larger than 3 µm in diameter contributed beneficially to the low mercury intrusion within the 5% F-T bricks [55,62], even though the 5% TRW (F-T) samples had abraded spots after the freeze–thaw cycles.
The bimodal trend observed in Figure 11 illustrates that two distinct pore sizes were present in the bricks, irrespective of the exposure conditions: macro- and micropores. The amount of TRW played a significant role in forming these pores, because the presence of the rubber created additional pores within the brick’s matrix, leading to a higher intrusion volume (pink and green curves for 10% TRW F-T and 10% TRW NO F-T, respectively). For the 0% TRW sample (yellow curve for F-T), a peak intrusion volume of 0.095 mL/g was recorded within the micropores section, after which the curve flattened. This indicates that, at 0% TRW, the intrusion was very low due to the sample’s micropore sizes, which translated to durability irrespective of the effect from the F-T cycles. For the other samples (5% and 10%), the intrusion volumes were higher when compared to the 0% TRW content, resulting in the bricks being classed as uncertain and non-durable.

5.4. Water Absorption

The results obtained for the WA tests are shown in Figure 12. It can be observed from the plot that, as the TRW content increased from 0% to 10%, the presence of the TRW created more pores, which were filled with water, leading to a higher WA in the brick samples. The brick samples with 0% and 10% TRW had the lowest and highest WA, respectively. It can be concluded that the WA obtained in this study meets requirements of less than 20% [48,50,67].
Following ASTM C62 [73], brick samples with water absorption values not exceeding 22% and 17% are recommended in moderate and severe exposure conditions, respectively. Furthermore, ASTM C90-22 [74] specifies a maximum water absorption of 15% for normal-weight bricks and 12% for lightweight units. Hence, the rubberized bricks produced in this study passed the requirements for units that can be used in severe and moderate exposure conditions.

6. Conclusions and Recommendations

In this study, strength properties considering the CS and FS tests, as well as durability properties considering the freeze–thaw (F-T), mercury intrusion porosimetry (MIP), and water absorption (WA) tests, were used to determine the durability of green bricks produced with LKD, GGBFS, and TRW waste. From the laboratory experiments, analysis, and validations performed, the following conclusions can be drawn:
  • The brick samples produced with 0, 5, and 10% TRW had CS and FS results of 6.17, 5.25, and 3.09 MPa and 2.52, 2, and 1.55 MPa respectively. As standards require, these bricks passed the specifications for load- and non-load-bearing units for small buildings [49]. Additionally, the bricks produced with up to 10% TRW replacement passed the FS requirements for concrete bricks, which range between 1.4 and 3.4 MPa [69]. Thus, it can be concluded that the bricks produced with up to 10% TRW passed the CS and FS requirements for masonry units that can be used in small buildings.
  • The power model developed in this study can be used to predict the flexural strength of the green bricks in the absence of a test. However, verification of the model considering different cementitious materials, types and sizes of aggregates, curing durations, and curing regimes can be performed.
  • For the F-T tests, the brick samples produced with 0% TRW were seen to have no physical changes after 10 cycles of F-T. Hence, the samples produced with 0% TRW can be classed as frost-resistant bricks or frost-durable bricks, which can be used in environments where temperatures can be as low as −43 °C. The samples with 5 and 10% TRW had some physical changes on their surface in terms of delamination. Hence, the bricks produced with 5 and 10% TRW are not recommended for cold regions where temperatures can drop as low as −43 °C.
  • The results of the MIP tests carried out on the brick samples containing 0, 5, and 10% TRW showed that two distinct pore sizes were present in the bricks. The bricks that had 0% TRW fell under the durable region, which was confirmed by their surface appearance after the F-T cycles. Furthermore, a peak intrusion volume of 0.095 mL/g was recorded for the 0% TRW (F-T), after which the curve flattened. This translates to durability, irrespective of the effect of the F-T cycles. The brick samples containing 5 and 10% TRW fell within the uncertain and non-durable regions, respectively, which can be attributed to the presence of the TRW in the bricks.
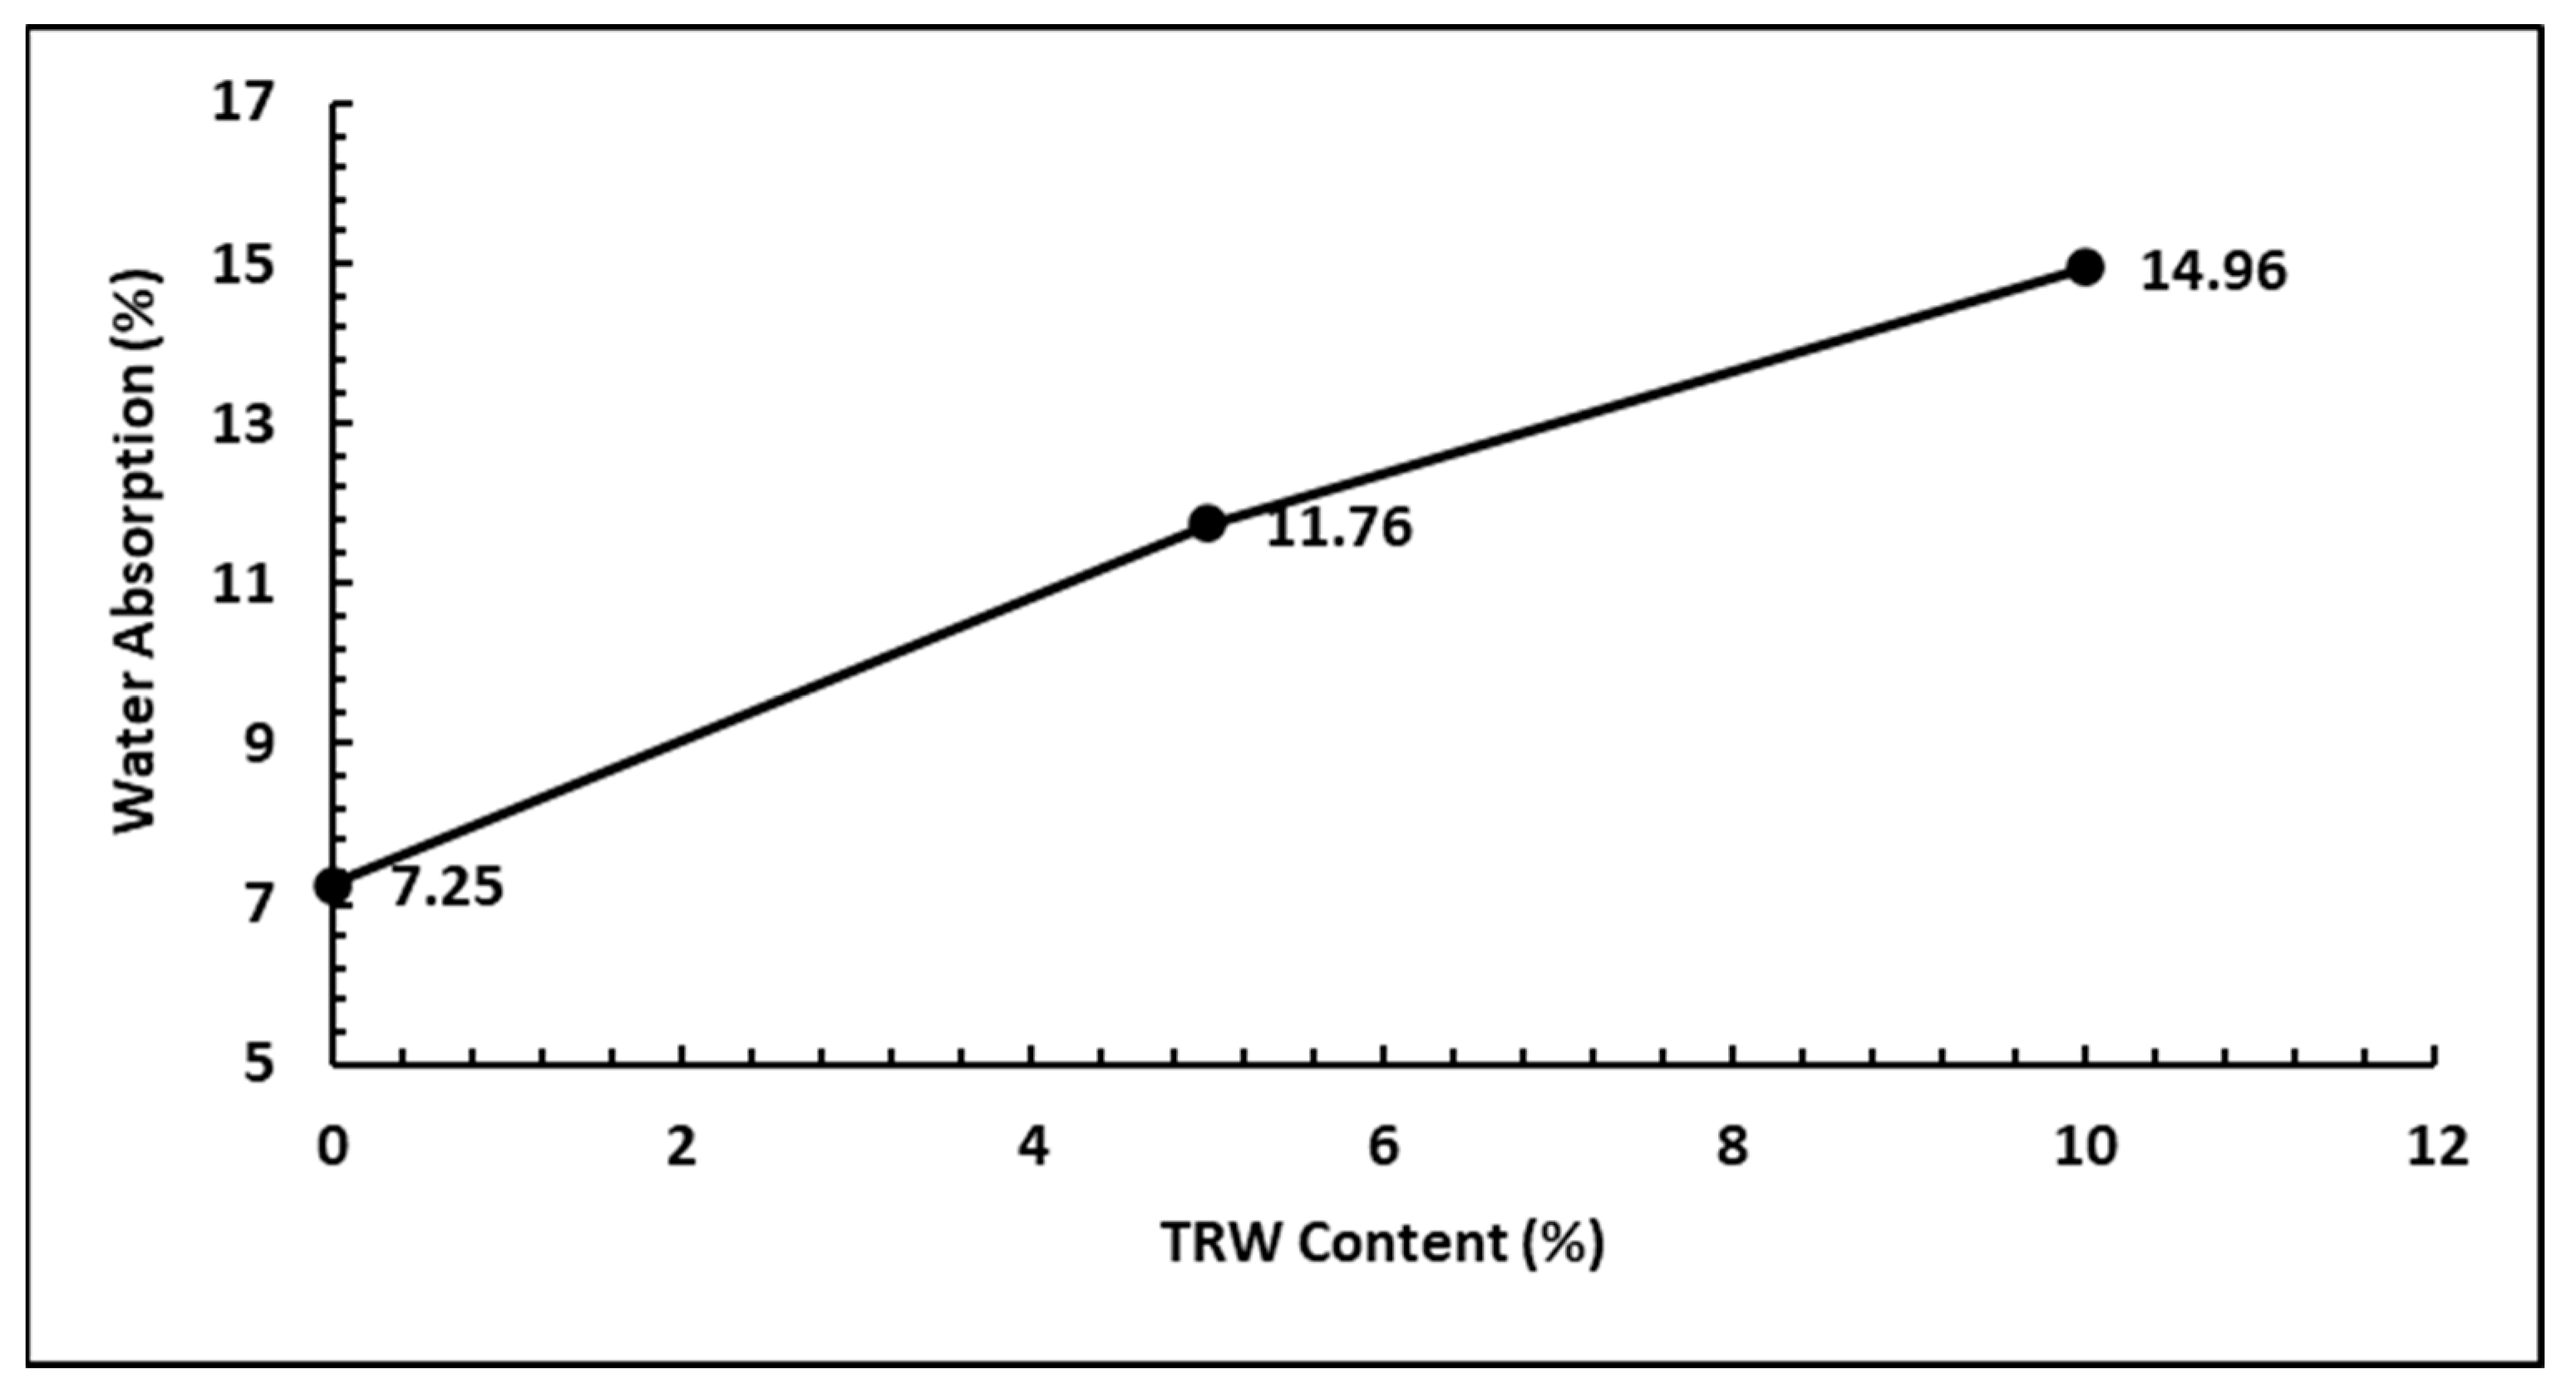
  • WA tests performed on the samples showed that the bricks met the <20% standard requirements for WA. The WA values recorded for the bricks that contained 0, 5, and 10% TRW were 7.25, 11.76, and 14.96%, respectively.
In conclusion, the bricks assessed in this study passed all of the durability tests performed. However, it is recommended that further studies using a smaller amount of TRW (<5%) should be performed to investigate the durability (F-T and MIP) properties of the green bricks.

Author Contributions

J.A.O.: Formal Analysis. J.A.O. and H.A.-N.: Conceptualization, Methodology, Writing—Original Draft. H.A.-N.: Supervision, Validation. J.A.O. and H.A.-N.: Writing—Review and Editing. All authors have read and agreed to the published version of the manuscript.

Funding

This research was supported by the Tertiary Education Trust Fund (TETFund).

Institutional Review Board Statement

Not applicable.

Informed Consent Statement

Not applicable.

Data Availability Statement

The data presented in this study are available on request from the corresponding author. The data are not publicly available due to ethical restrictions.

Acknowledgments

The first author acknowledges the Tertiary Education Trust Fund (TETFund) for funding her studies at La Trobe University, Melbourne, Australia. Furthermore, the authors wish to express their earnest appreciation to Cement Australia for the free LKD waste, and GGBFS samples, and Sika Australia Pty. Ltd., Melbourne, for the free WRA (Sika Plastiment-45) samples that were donated to support this research.

Conflicts of Interest

The authors declare that they have no conflicts of interest.

References

  1. Maraveas, C. Production of Sustainable Construction Materials Using Agro-Wastes. Materials 2020, 13, 262. [Google Scholar] [CrossRef] [PubMed]
  2. Tempa, K.; Chettri, N.; Thapa, G.; Phurba Gyeltshen, C.; Norbu, D.; Gurung, D.; Wangchuk, U. An experimental study and sustainability assessment of plastic waste asa binding material for producing economical cement-less paver blocks. Engineering Science and Technology. Int. J. 2022, 26, 101008. [Google Scholar] [CrossRef]
  3. Oke, J.A.; Abuel-Naga, H.; Leong, E.-C. De-carbonizing in Construction using Supplementary Cementitious Materials and Accelerated Carbonation Technique—A Review. Int. J. Geotech. Eng. 2024, 1–22. [Google Scholar] [CrossRef]
  4. Pahroraji, M.E.H.M.; Saman, H.M.; Rahmat, M.N.; Kamaruddin, K.; Rashid, A.F.A. Compressive Strength and Density of Cementless Unfired Lightweight Brick Utilizing Coal Ash from Coal-Fired Thermal Power Plant. Key Eng. Mater. 2014, 594–595, 527–531. [Google Scholar] [CrossRef]
  5. Arulrajah, A.; Mohammadinia, A.; D’Amico, A.; Horpibulsuk, S. Effect of lime kiln dust as an alternative binder in the stabilization of construction and demolition materials. Constr. Build. Mater. 2017, 152, 999–1007. [Google Scholar] [CrossRef]
  6. Li, X.; Ling, T.-C.; Hung Mo, K. Functions and impacts of plastic/rubber wastes as eco-friendly aggregate in concrete—A review. Constr. Build. Mater. 2020, 240, 117869. [Google Scholar] [CrossRef]
  7. Aditto, F.S.; Sobuz, M.H.R.; Saha, A.; Jabin, J.A.; Kabbo, M.K.I.; Hasan, N.M.S.; Islam, S. Fresh, mechanical and microstructural behaviour of high-strength self-compacting concrete using supplementary cementitious materials. Case Stud. Constr. Mater. 2023, 19, e02395. [Google Scholar] [CrossRef]
  8. Putra, R.D.; Dizaji, H.B.; Kulshresth, D.; Zeng, T.; Overmann, S.; Vollpracht, A. Characterisation ofBottom Ashes from Non-WoodyBiomass Combustion for Applicationas Sustainable SupplementaryCementitious Material. Energies 2024, 17, 468. [Google Scholar] [CrossRef]
  9. Farzadkia, M.; Jorfi, S.; Nikzad, M.; Nazari, S. Evaluation of industrial wastes management practices: Case study of the Savojbolagh industrial zone, Iran. Waste Manag. Res. 2020, 38, 44–58. [Google Scholar] [CrossRef]
  10. Thakur, A.; Senthil, K.; Singh, A.P. Experimental investigation on crumb rubber based concrete bricks along with polypropylene and steel fibers. Asian J. Civ. Eng. 2022, 23, 357–374. [Google Scholar] [CrossRef]
  11. Thomas, B.S.; Gupta, R.C.; Panicker, V.J. Recycling of waste tire rubber as aggregate in concrete: Durability-related performance. J. Clean. Prod. 2016, 112 Pt 1, 504–513. [Google Scholar] [CrossRef]
  12. Kashani, A.; Tuan Duc Ngo, T.D.; Hemachandra, P.; Hajimohammadi, A. Effects of surface treatments of recycled tire crumb on cement-rubber bonding in concrete composite foam. Constr. Build. Mater. 2018, 171, 467–473. [Google Scholar] [CrossRef]
  13. Mohajerani, A.; Burnett, L.; Smith, J.V.; Markovski, S.; Rodwell, G.; Rahman, M.T.; Kurmus, H.; Mirzababaei, M.; Arulrajah, A.; Horpibulsuk, S.; et al. Recycling waste rubber tires in construction materials and associated environmental considerations: A review. Resour. Conserv. Recycl. 2020, 155, 104679. [Google Scholar] [CrossRef]
  14. Oke, J.A.; Abuel-Naga, H. Assessment of a Non-destructive Testing Method Using Ultrasonic Pulse Velocity to Determine the Compressive Strength of Rubberized Bricks Produced with Lime Kiln Dust Waste. Geotechnics 2023, 3, 1294–1308. [Google Scholar] [CrossRef]
  15. Agyeman, S.; Obeng-Ahenkora, N.K.; Assiamah, S.; Twumasi, G. Exploiting recycled plastic waste as an alternative binder for paving blocks production. Case Stud. Constr. Mater. 2019, 11, e00246. [Google Scholar] [CrossRef]
  16. Figaredo, A.; Dhanya, M. Development of Sustainable Brick Materials Incorporating Agro-Wastes: An Overview. Int. Res. J. Eng. Technol. (IRJET) 2018, 5, 721–726. [Google Scholar]
  17. Nath, A.; Lal, R.; Das, A. Fired Bricks: CO2 Emission and Food Insecurity. Glob. Chall. 2018, 2, 1700115. [Google Scholar] [PubMed]
  18. Mageswari, M.; Vidivelli, D. The Use of Sheet Glass Powder as Fine Aggregate Replacement in Concrete. Open Civ. Eng. J. 2010, 4, 65–71. [Google Scholar] [CrossRef]
  19. Prusty, J.; Patro, S.; Basarkar, S. Concrete using agro-waste as fine aggregate for sustainable built environment—A review. Int. J. Sustain. Built Environ. 2016, 5, 312–333. [Google Scholar] [CrossRef]
  20. Bilal, H.; Yaqub, M.; Rehman, S.K.U.; Abid, M.; Alyousef, R.; Alabduljabbar, H.; Aslam, F. Performance of Foundry Sand Concrete under Ambient and Elevated Temperatures. Materials 2019, 12, 2645. [Google Scholar] [CrossRef] [PubMed]
  21. Andrew, R.M. Global CO2 Emissions from Cement Production,1928–2018. Earth Syst. Sci. Data 2019, 4, 1675–1710. [Google Scholar] [CrossRef]
  22. Chin, W.Q.; Lee, Y.H.; Amran, M.; Fediuk, R.; Vatin, N.; Kueh, A.B.H.; Lee, Y.Y. A Sustainable. Reuse of Agro-Industrial Wastes into Green Cement Bricks. Materials 2022, 15, 1713. [Google Scholar] [CrossRef] [PubMed]
  23. Mahoutian, M.; Shao, Y. Production of cement-free construction blocks from industry wastes. J. Clean. Prod. 2016, 137, 1339–1346. [Google Scholar] [CrossRef]
  24. Jitsanigam, P.; Biswas, W.; Compton, M. Sustainable utilization of lime kiln dust as active filler in hot mix asphalt with moisture damage resistance. Sustain. Mater. Technol. 2018, 17, e00071. [Google Scholar] [CrossRef]
  25. Taurino, R.; Ferretti, D.; Cattani, L.; Bozzoli, F.; Bondioli, F. Lightweight clay bricks manufactured by using locally available wine industry waste. J. Build. Eng. 2019, 26, 100892. [Google Scholar] [CrossRef]
  26. Lamba, P.; Kaur, D.; Raj, S.; Sorout, J. Recycling/reuse of plastic waste as construction material for sustainable development: A review. Environ. Sci. Pollut. Res. 2021, 29, 86156–86179. [Google Scholar] [CrossRef] [PubMed]
  27. Miah, M.J.; Huaping, R.; Paul, S.C.; Babafemi, A.J.; Li, Y. Long-term strength and durability performance of eco-friendlyconcrete with supplementary cementitious materials. Innov. Infrastruct. Solut. 2023, 8, 255. [Google Scholar] [CrossRef]
  28. Siddique, R.; Naik, T.R. Properties of concrete containing scrap-tire rubber—An overview. Waste Manag. 2004, 24, 563–569. [Google Scholar] [CrossRef]
  29. Tiwari, A.; Singh, S.; Nagar, R. Feasibility assessment for partial replacement of fine aggregate to attain cleaner production perspective in concrete: A review. J. Clean. Prod. 2016, 135, 490–507. [Google Scholar] [CrossRef]
  30. Ahmed, S.; Sharaky, I.A.; El Sayed, S.; Hassan, H.; Abdo, A. Effect of rubberized concrete integrating uncoated and coated crumb rubber on the flexural behavior of the RC beams reinforced with steel and GFRP bars. Constr. Build. Mater. 2024, 426, 136192. [Google Scholar] [CrossRef]
  31. Ma, H. Mercury intrusion porosimetry in concrete technology: Tips in measurement, pore structure parameter acquisition and application. J. Porous Mater. 2014, 21, 207–215. [Google Scholar] [CrossRef]
  32. Romero, E.; Simms, P.H. Microstructure investigation in unsaturated soils: A re-view with special attention to contribution of mercury intrusion porosimetry and environmental scanning electron microscopy. Geotech. Geol. Eng. 2008, 26, 705–727. [Google Scholar] [CrossRef]
  33. Lapierre, C.; Leroueil, S.; Locat, J. Mercury intrusion and permeability of Louisville clay. Can. Geotech. J. 1990, 27, 761–773. [Google Scholar] [CrossRef]
  34. Delage, P.; Lefebvre, G. Study of the structure of a sensitive Champlain clay and of its evolution during consolidation. Can. Geotech. J. 1984, 21, 21–35. [Google Scholar] [CrossRef]
  35. Wild, S. A discussion of the paper ‘‘Mercury porosimetry—An inappropriate method for the measurement of pore size distributions in cement-based materials’’ by S. Diamond. Cem. Concr. Res. 2001, 31, 1653–1654. [Google Scholar] [CrossRef]
  36. Zeng, Q.; Li, K.; Fen-chong, T.; Dangla, P. Pore structure characterization of cement pastes blended with high-volume fly-ash. Cem. Concr. Res. 2012, 42, 194–204. [Google Scholar] [CrossRef]
  37. Ye, G. Experimental Study and Numerical Simulation of the Development of the Microstructure and Permeability of Cementitious Materials. Ph.D. Thesis, Delft University of Technology, Delft, The Netherlands, 2003. [Google Scholar]
  38. Kakrasul, J.; Parsons, R.; Han, P. Lime Kiln Dust for Treated Subgrades; A Report on Research Sponsored; Kansas Department of Transportation: Topeka, KS, USA; The University of Kansaslawrence: Kansaslawrence, KS, USA, 2017.
  39. Shu, X.; Huang, B. Recycling of waste tire rubber in asphalt and portland cement concrete: An overview. Constr. Build. Mater. 2014, 67, 217–224. [Google Scholar] [CrossRef]
  40. Hesami, S.; Hikouei, I.S.; Emadi, S.A.A. Mechanical behavior of self-compacting concrete pavements incorporating recycled tire rubber crumb and reinforced with polypropylene fiber. J. Clean. Prod. 2016, 133, 228–234. [Google Scholar] [CrossRef]
  41. Mohammadi, I.; Khabbaz, H.; Vessalas, K. Enhancing mechanical performance of rubberised concrete pavements with sodium hydroxide treatment. Mater. Struct. 2016, 49, 813–827. [Google Scholar] [CrossRef]
  42. Guo, S.; Dai, Q.; Si, R.; Sun, X.; Lu, C. Evaluation of properties and performance of rubber-modified concrete for recycling of waste scrap tire. J. Clean. Prod. 2017, 148, 681–689. [Google Scholar] [CrossRef]
  43. Priyadharshini, M.; Naveen Kumar, M. Experimental Study on Crumb Rubber with Partial Replacement of Fine Aggregate. Int. Res. J. Eng. Technol. 2018, 5, 4584–4590. [Google Scholar]
  44. Ni¸s, A.; Eren, N.A.; Çevik, A. Effects of recycled tyre rubber and steel fibre on the impact resistance of slag-based self-compacting. Eur. J. Environ. Civ. Eng. 2023, 27, 519–537. [Google Scholar] [CrossRef]
  45. AS 1141.11.1; Methods for Sampling and Testing Aggregates. Standards Australia: Sydney, NSW, Australia, 2020.
  46. ASTM C33/C33M; Standard Specifications for Concrete Aggregates. ASTM: West Conshohocken, PL, USA, 2013.
  47. Frasson, A., Jr.; Casali, J.M.; Olivera, A.L.; Prudêncio, L.R., Jr. A Mix Design Methodology for Concrete Block Units. In Proceedings of the 15th International Brick and Block Masonry Conference, Florianapolis, Brazil, 3–6 June 2012. [Google Scholar]
  48. AS 3700; Masonry Structures. Standards Australia: Sydney, NSW, Australia, 2018.
  49. AS 4773.2; Masonry in Small Buildings Construction. Standards Australia: Sydney, NSW, Australia, 2015.
  50. AS-NZ-4456.14; Masonry Units, Segmental Pavers and Flags—Methods of Test Determining Water Absorption Properties (Reconfirmed 2023). Standards Australia: Sydney, NSW, Australia, 2003.
  51. AS 1012.11; Methods of Testing Concrete. Method 11: Determination of Modulus of Rupture. Standards Australia: Sydney, NSW, Australia, 2000.
  52. Koroth, S.R. Evaluation and Improvement of Frost Durability of Clay Bricks. Ph.D. Thesis, Concordia University, Montreal, QC, Canada, 1997. [Google Scholar]
  53. Mensinga, P. Determining the Critical Degree of Saturation of Brick Using Frost Dilatometry. Master’s Thesis, University of Waterloo, Waterloo, ON, Canada, 2009. [Google Scholar]
  54. Abu Bakar, B.H.; Wan Ibrahim, M.H.; Megat Johari, M.A. A review: Durability of fired clay brick masonry wall due to salt attack. Int. J. Integr. Eng. 2011, 1, 111–127. [Google Scholar]
  55. Grubeša, I.N.; Vračević, M.; Ducman, V.; Marković, B.; Szenti, I.; kos Kukovecz, Á. Influence of the Size and Type of Pores on Brick Resistance to Freeze-Thaw Cycles. Materials 2020, 13, 3717. [Google Scholar] [CrossRef] [PubMed]
  56. EN 772-22; Methods of Test for Masonry Units. Determination of Freeze/Thaw Resistance of Clay Masonry Units. European Committee: Brussels, Belgium, 2018.
  57. Winslow, D.N.; Diamond, S. A mercury porosimetry study of the evaluation of porosity in Portland cement. ASTM J. Mater 1970, 5, 564–585. [Google Scholar]
  58. Orr, C. Application of mercury penetration to materials analysis. Powder Technol. 1970, 3, 117–123. [Google Scholar] [CrossRef]
  59. Wardlaw, N.C.; Mckeller, M. Mercury porosimetry and the interpretation of pore geometry in sedimentary rocks and artificial models. Powder Technol. 1981, 29, 127–143. [Google Scholar] [CrossRef]
  60. Zeng, Q.; Li, K.; Fen-Chong, T.; Dangla, P. Analysis of pore structure, contact angle and pore entrapment of blended cement pastes from mercury porosimetry data. Cem. Concr. Compos. 2012, 34, 1053–1060. [Google Scholar] [CrossRef]
  61. Aligizaki, K.K. Pore Structure of Cement-Based Materials: Testing, Interpretation and Requirements; Taylor & Francis: London, UK, 2006. [Google Scholar]
  62. Maage, M. Frost Resistance and Pore Size Distribution in Bricks. Cement and Concrete Research Institute; The Foundation of Scientific and Industrial Research at the Norwegian Institute of Technology, 7034 Trondheim-NTH: Trondheim, Norway, 1984. [Google Scholar]
  63. Bracka, A.; Rusin, Z. Comparison of pore characteristics and water absorption in ceramics materials with frost resistance factor Fc. Struct. Environ. 2012, 4, 15–19. [Google Scholar]
  64. Vračević, M. A Contribution to Durability of Masonry Structures. Ph.D. Thesis, University J.J. Strossmayer, Faculty of Civil Engineering and Architecture Osijek, Osijek, Croatia, 2019. [Google Scholar]
  65. Elert, K.; Culturone, G.; Rodriguez-Navarro, C.; Pardo, E.S. Durability of bricks used in the conservation of historic buildings—Influence of composition and microstructure. J. Cult. Herit. 2003, 4, 91–99. [Google Scholar] [CrossRef]
  66. Stryszewska, T.; Kanka, S. Forms of Damage of Bricks Subjected to Cyclic Freezing and Thawing in Actual Conditions. Materials 2019, 12, 1165. [Google Scholar] [CrossRef] [PubMed]
  67. IS:1077-2-1992-(R2002); Common Burnt Clay Building Bricks—Specification. Bureau of Indian Standards: New Delhi, India, 1997.
  68. IS 3495-2 (1992); Methods of Tests of Burnt Clay Building Bricks: Part 2—Determination of Water Absorption (Third Revision). Bureau of Indian Standards: New Delhi, India, 1992.
  69. ASTM: C55-11: 2011; Standard Specification for Concrete Building Brick. American Society for Testing and Materials: Philadelphia, PA, USA, 2011.
  70. Bogas, J.A. Characterization of Structural Concretes with Expanded Clay Light Aggregates (In Portuguese). Ph.D. Thesis, Civil Engineering, Instituto Superior Tecnico, Lisboa, Portugal, 2011. [Google Scholar]
  71. Verbeck, G.; Landgren, R. Influence of Physical Characteristics of Aggregates on Frost Resistance of Concrete; Portland Cement Association: Washington, DC, USA, 1960. [Google Scholar]
  72. Mehta, P.; Monteiro, P. Concrete: Microstructure, Properties and Materials, 3rd ed.; McGraw Hill: New York, NY, USA, 2006. [Google Scholar]
  73. ASTM C62; Standard Specification for Building Brick (Solid Masonry Units Made from Clay or Shale). American Society for Testing and Materials: West Conshohocken, PA, USA, 2017.
  74. ASTM C90-22; Standard Specification for Loadbearing Concrete Masonry Units. American Society for Testing and Materials: Philadelphia, PA, USA, 2022.
Figure 1. Particle size distribution of TRW and sand.
Applsci 14 05131 g001
Figure 2. Samples wrapped with nylon film.
Applsci 14 05131 g002
Figure 3. (a) Sample before fracture. (b) Sample after fracture.
Applsci 14 05131 g003
Figure 4. Effect of TRW on the 7th-, 14th-, and 28th-day strength (CS).
Applsci 14 05131 g004
Figure 5. Effect of TRW on the 7th-, 14th-, and 28th-day strength (FS).
Applsci 14 05131 g005
Figure 6. Relationship between the CS and FS using the power model.
Applsci 14 05131 g006
Figure 7. (a) The 0% TRW samples before the test. (b) The 0% TRW samples after the test.
Applsci 14 05131 g007
Figure 8. (a) The 5% TRW samples after the test. (b) The 10% TRW samples after the test.
Applsci 14 05131 g008
Figure 9. Plots showing mass changes and corresponding F-T cycles.
Applsci 14 05131 g009
Figure 10. Cumulative intrusion distribution of pore sizes for freeze–thaw and non-freeze–thaw samples.
Applsci 14 05131 g010
Figure 11. Log-differential distribution of pore sizes for freeze–thaw and non-freeze–thaw samples.
Applsci 14 05131 g011
Figure 12. Water absorption levels in the rubberized bricks.
Applsci 14 05131 g012
Table 1. Oxides present in LKD and GGBFS.
SampleChemical Composition (%)
CaO SiO2Al2O3Fe2O3MgOK2ONa2OSO3
LKD63.4220.044.90,3.491.110.350.432.35
GGBFS42.133.113.20.36.5-0.52.0
Table 2. Blend ratios and corresponding compressive strength (CS).
LKD-GGBFS/Sand RatioLKD-GGBFS Blend Ratio28-Day CS (MPa)
1:390–101.67
1:380–203.69
1:370–306.17
1:360–4010.49
1:350–508.71
1:340–6011.94
1:330–7012.04
Table 3. Compressive strength and flexural strength of rubberized bricks.
TRW (%)Hydration (Days)Compressive Strength (MPa)Flexural Strength (MPa)
073.231.72
0144.221.92
0286.172.52
571.541.2
5143.791.81
5285.252
1070.760.82
10142.441.43
10283.091.55
1570.10.32
15141.10.92
15282.081.20
2070.040.21
20140.50.73
20280.680.82
Table 4. Mathematical models for different relationships.
Mathematical RelationshipMathematical ModelCorrelation Coefficient (R2)
Exponential σ = 0.5244e0.3073fc0.8237
Linear σ = 0.3326fc + 0.50220.9509
Power σ = 0.9519fc0.47290.9807
Logarithmic σ = 0.4157ln(fc) + 1.17190.8531
Disclaimer/Publisher’s Note: The statements, opinions and data contained in all publications are solely those of the individual author(s) and contributor(s) and not of MDPI and/or the editor(s). MDPI and/or the editor(s) disclaim responsibility for any injury to people or property resulting from any ideas, methods, instructions or products referred to in the content.

