Review

A Review of Characterization Techniques for Ferromagnetic Nanoparticles and the Magnetic Sensing Perspective

by
Alexandra C. Barmpatza
*,
Anargyros T. Baklezos
,
Ioannis O. Vardiambasis
and
Christos D. Nikolopoulos
*
Department of Electronics Engineering, Hellenic Mediterranean University, 73133 Chania, Greece
*
Authors to whom correspondence should be addressed.
Appl. Sci. 2024, 14(12), 5134; https://doi.org/10.3390/app14125134
Submission received: 17 April 2024 / Revised: 5 June 2024 / Accepted: 11 June 2024 / Published: 13 June 2024

Abstract

:
This article sums up and compares the most important techniques for magnetic sensing of ferromagnetic nanoparticles. In addition, the most well-known magnetic sensing instruments are presented, while the advantages and disadvantages of each instrument category are summarized. Finally, a measurement system based on fluxgate magnetometers is proposed for the magnetic characterization of a cobalt-based material applicable in the catalysis process. The authors conclude that this arrangement can provide ferromagnetic material sensing with the most advantages for this catalysis application. Indeed, as nanoparticle materials can be used in many applications, like catalysis, their properties and the phase of the catalyst should be known at any time. Moreover, as the industrial processes operate at a rapid pace, the need for simple, fast, and low-cost measurement systems that will also enable in vivo material characterization is rising. Consequently, this article aims to propose the best candidate magnetic sensing method as well as the best candidate instrument for every application based on the advantages and disadvantages of each sensor.

1. Introduction

Magnetic nanoparticles play a role in a great variety of applications like medicine because they can provide magnetic hyperthermia and magnetic drug targeting [1,2,3]. In addition, beyond medical applications, their presence is valuable in the industry fields of microelectronics, sensor technology, heterogeneous catalysis, and other important fields [2,4]. For this reason, the existence of rapid, economical, and simple methods for the characterization of magnetic nanoparticles is vital to have the possibility to know the moment and their properties and to detect possible faults as they appear.
The methods for catalyst characterization are many. The main categories of nanoparticle characterization methods are adsorption methods, thermal analysis, electron microscopy methods, X-ray and neutron methods, ion scattering techniques, vibrational spectroscopies, electron spectroscopies, magnetic measurements, etc. [5,6,7,8,9,10,11,12,13,14,15,16].
Adsorption methods are capable of providing information related to the catalyst’s total surface area, the surface area of the phase carrying the active sites, and the type and number of active sites. There are both methods related to adsorption: the flow and the dynamic methods. Consequently, the adsorption can be static or dynamic.
The microscopy methods can characterize the nanoparticle materials, providing details about the phase state of the crystal and the crystal structure. However, sometimes the image interpretation can be accompanied by complexities that make the characterization process difficult. In addition, some other difficulties derive from the procedure of preparation of specimens and the microscope environment itself. The main microscopy methods are conventional transmission electron microscopy (CTEM), dark field methods, high-resolution electron microscopy (HREM), reflection electron microscopy (REM) and reflection high energy electron diffraction (RHEED), scanning electron microscopy (SEM), the atomic force microscopy (AFM), and scanning transmission electron microscopy (STEM) [5,9,10,17,18]. CTEM can provide material characterization for nanoparticles with sizes smaller than 2–3 nm, as well as provide information about the particle location [5]. However, this method does not allow the investigation of the crystal’s periodic structure. This possibility is partially given using another technique, the HREM. According to [5], the HREM in some cases can be used for nanoparticle characterization smaller than 1 nm. STEM is similar to CTEM, but it is able to perform microanalysis at very high resolution. Nevertheless, all the methods that are based on microscopes are not economical, give exclusively local information and the need for time to prepare the sample [19,20].
Other structure investigation methods are the X-ray and neutron methods (neutron diffraction). X-ray diffraction [6,9,18,21] (XRD), also called WAXS, is one of the most important techniques for catalyst characterization. This method can give accurate results about the material structure when utilized for both zeolites and catalysts with good crystallinity [5,17]. One of the method’s drawbacks is that the XRD is limited to powder-pattern identification of crystalline phases. In materials, obtaining crystals with sizes smaller than 1–1.5 nm or in amorphous materials, the method cannot provide accurate results and because of this, the radial electron distribution (RED) is utilized. Another method is the extended X-ray absorption fine structure (EXAFS), which has application mainly in the case of multimetallic catalyst characterization, where the other methods do not provide satisfying results.
Referring to the ion scattering techniques are ion scattering spectroscopy (ISS), low-energy ion scattering (LEIS), Rutherford backscattering spectroscopy (RBS) [17], nuclear backscattering spectroscopy (BNS), and high-energy ion scattering (HEIS). In addition, in [22], nanoparticles of iron carbide iron oxide encapsulated into micelles of sodium dodecylsulfate and oleic acid and stabilized with chitosan were characterized using Scanning and transmission electron microscopy, dynamic light scattering, and laser doppler electrophoresis and Fourier transform infrared spectroscopy. These methods are very effective for performing chemical analysis but in order to provide structure characterization need some improvements. The RBS method provides an investigation of the geometry of the pores of the catalyst, even if the nanoparticle size is smaller than 2 nm, something the rest of the methods cannot provide. The main disadvantage of this technique is that it cannot be used for samples containing more than three elements.
Moreover, there are some categories of vibrational spectroscopies, like Transmission infrared spectroscopy (IR), infrared emission spectroscopy, diffuse reflectance spectroscopy (DRS), internal reflectance spectroscopy, Raman spectroscopy, inelastic neutron scattering spectroscopy, and the photoacoustic spectroscopy. These techniques are difficult to apply in metals, and as a consequence their use in catalyst sensing is limited.
Concerning electron spectroscopies, the main methods are X-ray photoelectron spectroscopy (XPES), ultraviolet photoelectron spectroscopy (UPES), and Auger electron spectroscopy (AES). While XPES has been used at large in order to examine the variations in the chemical environment, AES is limited to applications aiming to identify and quantify elements, especially in chemisorption systems.
As far as photon correlation spectroscopy (PCS) and photon cross-correlation spectroscopy (PCCS) are concerned, one of the main disadvantages of these two methods is that they cannot be applied in opaque media, such as blood [8,19]. Moreover, in contrast to the magnetic methods, both magnetorelaxometry (MRX) and AC susceptibility (ACS), the PCS investigated exclusively the particle hydrodynamic sizes [8] and as a result cannot provide knowledge about the magnetic core, like the size of the core, the size distribution, and the anisotropy constant. Moreover, this method proposes single scattering events and is sensitive to nonmagnetic contaminations.
Finally, comparing the temperature measurements for the hysteresis loop to the magnetic measurements, the latter category of measurements is more efficient, because it can provide quicker and more accurate results. From the measurement of the complete hysteresis loop, one can know the nanoparticles’ anisotropy, the saturation magnetization, the nanoparticle aggregation, etc. Moreover, the time of a hysteresis loop measurement demands a few microseconds, without delay between measurements, as opposed to the temperature measurements that need 1 min to be achieved and a 10-min delay between the previous and the next measurement [23].

2. Magnetic Characterization Techniques

Magnetochemistry, as a means for solving chemical problems, was introduced first by P.W. Selwood in 1943. The first magnetic measurements were based on the relation between the magnetism and the chemical bond [24]. In the same chronological period, another monitoring means was proposed, based on the variation of the phase of the iron [25]. Over time, many methods were developed for magnetic sensing of ferromagnetic materials, as presented and discussed in this article.
According to [26], while magnetic measurements are used routinely in the field of material science for the static magnetic characterization of nanoparticles, the application in the characterization of ferromagnetic materials is limited. The main methods used for magnetic characterization are magnetic susceptibility; remanence measurement, the technique that is based on the phase lag between the magnetic field and the magnetic moment of the nanoparticles [27,28]; and the magnetorelaxometry method [27,29].

2.1. Magnetic Susceptibility

A widespread method for nanoparticle characterization is the measurement of the AC susceptibility (ACS) as a function of frequency [30,31,32]. In an AC susceptibility measurement, the MNP sample is exposed to a sinusoidal magnetic field of constant amplitude, and the frequency is swept [8]. The first measurement setup based on this technology was introduced in 1925 by Hartshorn and contained a mutual inductance bridge [33]. Then, a variety of AC susceptometers using this technology appeared. This method can provide rapid magnetic characterization of magnetic nanoparticles [34]. The AC magnetometers can detect the magnetic responses using the Neel and Brown relaxation parameters. To have the most accurate measurement, there is a vital need for the sensors to be very sensitive and also have a high range of excitation frequency. This will provide knowledge about all magnetic relaxations that exist in the nanoparticle system [34,35,36]. This way, it is possible to determine the magnetic properties of the nanoparticles. The fields in which AC susceptometry has applications are many: magnetic detection, magnetic hyperthermia, the dynamic magnetic characterization of magnetic nanoparticles, and studies of particle stability [35]. Every AC magnetometer consists of two parts. The first part is the detection system, while the second part is the excitation system. One very common device that is used for sensor purposes is the induction coil because it is characterized by a simple structure and high sensitivity. As far as the excitation system is concerned, solenoid or Helmholtz coils, with conduction or superconduction coils, are utilized [36]. The use of alternating magnetic fields for magnetic characterization presents advantages over the use of direct current measurements because it can provide knowledge about the magnetization dynamic that measurement with direct current cannot [33]. Although the susceptometers that exist in the market present high precision in low frequencies, it is difficult to maintain an invariable excitation field, as well as to measure the induced voltage for higher frequencies. For these reasons, the use of susceptometers is limited for high frequencies [33].
The most important studies that use AC magnetometers for nanoparticle characterization are summarized below. Consequently, in [33], a mutual inductance AC susceptometer used for cobalt ferrite (CoFe2O4) nanoparticle characterization is proposed. This device has a constant excitation field with a value greater than 4.25 Oe and has the capability to operate between 10 kHz and 1 MHz. In [34], an induction AC magnetometer, for determining the profile of magnetic nanoparticles in bio-sensing applications, is presented. This device contains inductive coils, which offer a simple structure, economically efficient operation, as well as high frequency and dynamic range, compared to other magnetic sensors like SQUIDs, optically pumped magnetometers, or fluxgate magnetometers. One of the drawbacks of this device is the increased thermal noise that presents, but the phenomenon can be treated with methods like cooling with liquid nitrogen or optimizing the coil geometry, etc. In [35], a sensitive AC susceptometer is presented, which can operate in high frequencies from 25 kHz to 10 MHz. The sensors will be used for nanoparticle characterization purposes in a magnetic hyperthermia application. In [36], an AC magnetometer, which utilizes a resonant excitation coil with automatic frequency switching, is proposed for defining the characteristics of the nanoparticles.

2.2. Magnetorelaxometry (MRX)

Another common technique for magnetic characterization of the nanoparticles is magnetorelaxometry. According to [37], the first magnetometer used for magnetorelaxometry measurement purposes was the superconducting quantum interference device (SQUID) magnetometer. This technique, in comparison with other existing techniques, is fast as every measurement needs a few seconds in order to be achieved [19], and there is no need for a high dynamic range [38,39,40]. Consequently, the method presents improved behavior in terms of calibration, as well as bias and temperature stability. Magnetorelaxometry is a technique that measures the relaxation of previously aligned magnetic moments of the magnetic nanoparticles when an external magnetic field with a range of 1–2 mT is applied for 1–2 s [8] and then ceases to exist [1,20,32,41,42,43,44,45]. In other words, this method measures the relaxation of the magnetization of magnetic nanoparticles after switching off a magnetizing field Hmag [41,45]. The relaxation mechanisms are divided into two categories: the Brownian relaxation and the Neel relaxation. The first mechanism is related to the movement of the nanoparticles due to the temperature. The second mechanism exists because the magnetization vector rotates inside the particle [41,46]. The time of the relaxation can determine the size of the particle.
Comparing the magnetorelaxometry method to the magnetic susceptibility and the photon correlation spectroscopy method, the first is more accurate for the nanoparticle characterization procedure [8]. In addition, the MRX method is a rapid method, which allows investigation of both binding and aggregation kinetics and can be applied in opaque media, while enabling the study of the core properties and the hydrodynamic size distribution of the nanoparticles [8,19,20,47]. Moreover, compared to ACS and PCS, this method evaluates with a limited number of nanoparticles (411) [8]. Using this method, one can achieve rapid and accurate characterization of the material, as MRX gives details about the volume of the core, the anisotropy constant, and the energy barrier distribution [46]. Another important advantage of this method is its ability to provide separation between bound and unbound nanoparticles, which is very helpful in the case of biochemical assays [45].
In addition, in the international literature [48], another type of magnetorelaxometry is also referred to, namely temperature dependent magnetorelaxometry (TMRX). This method enables the characterization of even smaller nanoparticles and can be applied in lower temperatures, so that nanoparticles that cannot be detected at room temperature due to short relaxation time now can be detected.
There are many types of magnetometers [17,42,46] that can be used for magnetorelaxometry purposes such as optically pumped magnetometers (OPM), superconducting quantum interference devices (SQUID), giant magnetoresistive sensors (GMR), Hall effect magnetometers, and fluxgate magnetometers.

2.3. Other Recent Novel Characterization Techniques

In recent years additional techniques have been proposed for magnetic nanoparticle characterization, such as the method described in [49]. More specifically, this article proposes a characterization method based on artificial neural network (ANN) modeling and a resonant sensor. In [50], a sensing strategy that uses terahertz (THz) waves for characterization of magnetic scaffolds, applicable in biomedicine, is analyzed. In [51], a photonic sensor, which is based on optically detected magnetic resonance (ODMR) in nanodiamonds, is discussed for magnetic sensing purposes. According to the authors, these integrated photonic devices offer magnetic endoscopy of high sensitivity. In [52], an induction heating coil for the study of the thermal characterization of magnetic nanoparticles for hyperthermia applications is proposed. In [53], a cost-efficient, rapid, and flexible dynamic magnetic excitation method is proposed, which is based on a low-concentration magnetic beads sensor. In [54], an all-fiber Mach–Zehnder interferometer (MZI) magnetic field instrument is presented that uses few-mode fiber and hollow-core fiber. This device provides measurements of high sensitivity and low cost, while the device size is compact. Moreover, in [55] a highly sensitive magnetic field sensor, based on a D-type fiber with Bi2O2Se Film, is proposed. The magnetometer offers various advantages like high sensitivity and stability, straightforward design, robust repeatability, as well as strong anti-interference capability. In [56], an interferometric fiber optic vector magnetic field sensor is examined, based on MF cladding with core-offset fusion splicing of a PMF, for magnetic field measurement. The device can be characterized as quite sensitive and cost-effective and thus applicable for core-offset fusion structures. In [57], a novel magnetometer containing an optical registration system is proposed. The device is based on an yttrium-iron garnet film, while it is very useful for medical applications.

3. Magnetic Characterization Instruments

The magnetometer is a widely used device for many scopes, including biomedical purposes, geophysical studies, non-destructive testing, and catalytic materials characterization [58]. To serve the last scope, namely magnetic nanoparticle sensing, in the international literature exist several magnetometers, like the vibrating sample magnetometers (VSM), the optically pumped magnetometers (OPM), the magneto-optical Kerr effect magnetometers, the giant magnetoresistive sensors (GMR) [37,59], the alternating gradient magnetometers, the Faraday rotation magnetometers, the Hall effect magnetometers, the superconducting quantum interference devices (SQUIDs), the fluxgate magnetometers, etc., each with different sensitivity and cost [60,61]. In this paragraph, the most important types of magnetometers are presented and compared with their advantages and disadvantages.
The main issues that determine the effectiveness of every magnetic sensor can be narrowed down to two: the inherent sensitivity of the magnetometer and its ability to be placed near the sample.
One comparison between the different types of magnetometers derives from their field sensing range, as can be seen in Table 1 [62]. Observing this table, one can categorize the magnetometers into three categories: (1) the magnetometers that detect fields lower than 1 μG, (2) the magnetometers that detect fields between 1 mG to 10 G, and (3) the magnetometers that detect fields above 10 G.

3.1. Vibrating Sample Magnetometers

This type of magnetometer is one of the oldest technologies in the field of magnetic sensing of ferromagnetic materials. Starting from the 1960s until today, three different basic VSM setups have been proposed. The first was presented by the Centre National de la Recherche Scientifique (CNRS) in Paris, and it was a sensor for catalyst sensing in the ambient environment [63]. The second setup was based on acoustic oscillations [64]. The third setup was proposed by the Department of Chemical Engineering at the University of Cape Town in collaboration with scientists at Sasol R&T. To the authors’ knowledge, only these three setups are still active for sensing purposes, as the VSMs are devices that present problems and tend to be replaced with other magnetic sensor instruments or open the way for the use of hybrids of coiled magnetometers and magneto-optical devices.
The vibrating sample magnetometer, a costly and with low sensitivity device, contains bulky electromagnets as well as moving parts and an overall complex construction, compared to SQUIDs and fluxgate magnetometers [26]. According to the market prices, a VSM costs about 300 k€, and this price does not include the extra cost for the integration of the chemical reactor. Moreover, the time resolution of the signal is low, without the ability to be resolved in space. Another important issue that the vibration sample magnetometer has to face is the signal-to-noise ratio, which should be even more improved for this device to achieve accurate measurements [65]. In addition, according to [66], the VSM method demands a significant amount of time, and for this reason, it is not very efficient for clinical applications. Finally, the VSM demands mechanical vibration, while only few VSM implementations provide operation under gaseous atmospheres using a single measuring setup with the ability to face temperature levels up to 600 °C and pressure levels up to 50 bar.
The most important studies that use vibration sample magnetometers for nanoparticle materials characterization purposes are summarized below. Analytically, in [65], γ-Fe2O3 particles, used for medical applications are measured through a vibrating sample magnetometer. In [66], a vibrating sample magnetometer is used to provide magnetic information about formalin-fixated lymph nodes, with the further aim of this information to be used to construct a clinical magnetometer, instead of the vibrating sample magnetometer. In [67], the VSM was used for the characterization of Cobalt ferrite CoFe2O4 crystalline nanoparticles with sizes between 50 and 100 nm. In [68], three different methods, the XRD, the TEM, and the VSM, are used for the characterization of CoFe2O4 nanopowders. In [69], a vibration sample magnetometer is used for determining the magnetic characteristic of Fe3O4/polystyrene composite particles. In [70], cobalt ferrite nanoparticles, as well as nanorods and porous nanoparticles to methanol, are characterized and compared. For magnetic characterization purposes, the XRD, the SEM, and the VSM methods are applied. In [71], magnetic thioflavin-T silica-coated nanoparticles, used for medical purposes, are characterized using the XRD method, TEM method, VSM method, and Fourier transform infrared spectroscopy. In [72], characteristics of synthesized ferrofluid are measured using various methods including the VSM method. In [73], a vibrating sample magnetometer is used for magnetic measurements in creative proteins, and the method is proven simpler and more economical than a method that uses a SQUID magnetometer. In [74], Ni1−xZnxFe2O4 nanoparticles are characterized using the XRD method, TEM method, Fourier transform infrared, and VSM method. Finally, in [75], the VSM method is applied, among other methods, for magnetic characterization purposes of iron oxide nanoparticles functionalized with carboxyl groups.

3.2. Optically Pumped Magnetometers (OPM)

Using this device, the Larmor precession of spin-polarized atoms in a magnetic field is measured. The discovery of a spin-exchange relaxation-free (SERF) mode and the availability of solid-state lasers make its sensitivity level similar to the one that SQUIDs provide [76]. In recent years, OPMs have gained more and more attention in the fields of magnetorelaxometry and magnetorelaxometry imaging, due to their abilities to provide reduced target-field distance, the flexibility in the positioning, and the absence of cryogenic cooling [1,77,78]. Moreover, the total field OPM and the fluxgate magnetometers intrinsically measure the absolute magnetic field, compared to the SQUIDs that, during the nanoparticle excitation, have to be switched to an insensitive mode to prevent the saturation of the electronics. Nevertheless, when this device is used for magnetorelaxometry, one main drawback is the recovery time after the shut-off of the external magnetic field for the alignment of the nanoparticles, which leads to slow characterization [1].
The main studies in the field of the OPM for nanoparticle properties detection are summarized below. More specifically, in [1], a novel power pulsed-pump optically pumped magnetometer is presented, which is used for magnetorelaxometry measurements. This device has improved recovery time, high dynamic range, and high bandwidth and allows measurements without shielding. In [77], an OPM is used for drug monitoring purposes using a novel method. In [78], a novel off-the-shelf OPM magnetometer, used for magnetorelaxation investigation, that can characterize various nanoparticle categories is presented. In [79,80], two magnetometers for three-axis magnetic field measurements are proposed. The first one is a single-beam OPM and the second one is an improved version of the first, in terms of sensitivity. Specifically, it is about a novel pump-probe OPM, with a single fiber-coupled structure. In [81], an OPM is presented for measurements in the range of the magnetic field of the earth. This system presents low-frequency noise levels and low white noise floor, while it can be used in applications like geophysical exploration, biomagnetism, archeology, etc. In [82], an OPM that can be used for applications like nanoparticle characterization and contains a feedback-controlled spin ensemble of cesium atoms in spin-polarized vapor is proposed. In [83], an OPM is used for MRX measurements based on a 2D nanoparticle imaging setup. Finally, in [84], an OPM and a SQUID magnetometer are utilized and compared for the detection of cancer cells using the magnetorelaxometry method.

3.3. Faraday Rotation Magnetometers

These devices are magnetometers based on the Faraday effect. More specifically, according to the Faraday effect, in some materials, when an external magnetic field is applied, linearly polarized light rotates. A Faraday rotation magnetometer has polarizers that can specify the angle of the rotation, which comes from a variation of the intensity. Afterward, knowing the angle of the rotation, the magnetic field can be determined and thus knowledge about the source can be obtained. In every Faraday rotation magnetometer, the light is polarized and passes through a special material, with the name Faraday crystal. For the light polarization to rotate, the applied magnetic field of the crystal should be in the direction of the light propagation. The schematic diagram that describes the structure of a Faraday rotation magnetometer is depicted in Figure 1. Observing this figure, it can be seen that the light source is depicted with the letter A, the collimator with the letter B, the polarizer with the letter C, the Faraday crystal with the letter D, the mirror coating with the letter E, the analyzer with the letter F, the objective with the letter G, and the camera with the letter H, while with numbers 1, 2, and 3 are indicating the beamsplitter, the photodiode, and the Helmholtz coils, respectively [85]. This device can provide rapid and non-destructive measurements, while its applications are various, like in magnetic stripe cards or banknotes [85].
Some of the main drawbacks of this device are that it has limited use for quantitative measurements, the level of noise is considerably high, and the appearance of long-term displacements of the signal is a common phenomenon, thus there is a signal dependence from the time and the temperature. Moreover, the Faraday crystal has magnetic properties that can affect the quality of the measurements [85]. Some proposals for optimization of the characteristics of Faraday rotation magnetometers are presented in [86,87]. More specifically, in [86], the Faraday rotation alkali atomic magnetometer is investigated and the reliance of the amplitude of the magnetic resonance signal on the probe light frequency detuning is studied. To increase the sensitivity of the device, the frequency of the probe should be detuned appropriately, to achieve a greater signal-to-noise ratio. In [87], the sensitivity of a Faraday rotation magnetometer is also investigated. in this article, it is proven that the device can obtain better sensitivity, the best rotation angle, and the lowest noise, if the frequency of the probe light is tuned to the edge of Doppler profile wings.

3.4. Hall Effect Magnetometers

Another category of magnetometers is the Hall effect magnetometers. These devices present a high level of noise but can characterize the nanoparticles with accuracy, and the distance between the sensor and the target is small. In addition, they have a small dead time, less than 1 μs, as stated in [38], which presents a novel CMOS Hall effect sensor chip for magnetorelaxometry measurements with a dead zone of only 64 ns, in comparison to SQUID and Fluxgate magnetometers, which have dead zone times greater than 300 μs. Obtaining a small dead zone time provides the sensor the ability to characterize a great variety of nanoparticles. In [60], a novel Hall effect magnetometer is proposed, with various sensitivities, which can characterize both bulk materials and samples inside liquids. In [88], a Hall magnetometer with two stages is proposed for the sensitivity of the detection to be increased. In [89], a planar Hall effect magnetometer is studied for maghemite nanoparticle characterization. In [90], a modular Hall magnetometer is under for detecting the properties of iron oxide, nickel, and cobalt ferrite nanoparticles. In [91], iron oxide nanoparticles are also characterized using Hall magnetometers. Finally, in [92], a novel 3D Hall effect magnetometer is proposed for magnetic measurement purposes.

3.5. Giant Magnetoresistive (GMR) Sensors

Giant magnetoresistive sensors are compact, economical, high-sensitivity, large-scale, room-temperature devices for catalyst sensing applications [93,94]. In addition, they demand low power consumption, high thermal stability, and a relatively simple structure [95]. Moreover, their transduction efficiency is high compared to other magnetic sensor topologies, especially when the magnetic field is low [59]. Referring to their structure, GMR sensors consist of thin magnetic films, separated by a non-magnetic conducting layer of CuAgAu. The GMR sensitivity is in the plane of the film. According to [95], the thin film GMR sensor can be categorized into three different categories: (1) the sandwich, (2) the multilayer, and (3) the spin valve. The latter two present higher sensitivity compared to the sensor of the first category. The GMR sensor can be used, with success, in the field of catalytic nanoparticle characterization but also in applications like hard disk drives and magnetic recording [96]. However, the level of the noise of this device is high, higher than SQUID noise (0.1–10 pT/ H z ) and more specifically in the range of 0.1–1 nT/ H z [37,97,98]. According to [97], compared to SQUIDs magnetometers, GMR sensors could be antagonistic candidates if the field gain or magnetoresistance is further increased.
The most significant studies in the field of nanoparticle characterization using GMR sensors are summarized below. Particularly, in [37,59], the GMR sensor is proposed for magnetorelaxometry measurements of nanoparticles. In [93], MnFe2O4 nanoparticles are characterized using a GMR sensor and a direct current measurement method. In [94], the properties of supermagnetic nanoparticles are detected utilizing a GMR sensor and permanent magnets. In [95,96], a GMR sensor in the Wheatstone bridge is utilized for the characterization of iron oxide nanoparticles. In [99], the GMR sensor is used for medical purposes to detect the influenza A virus.

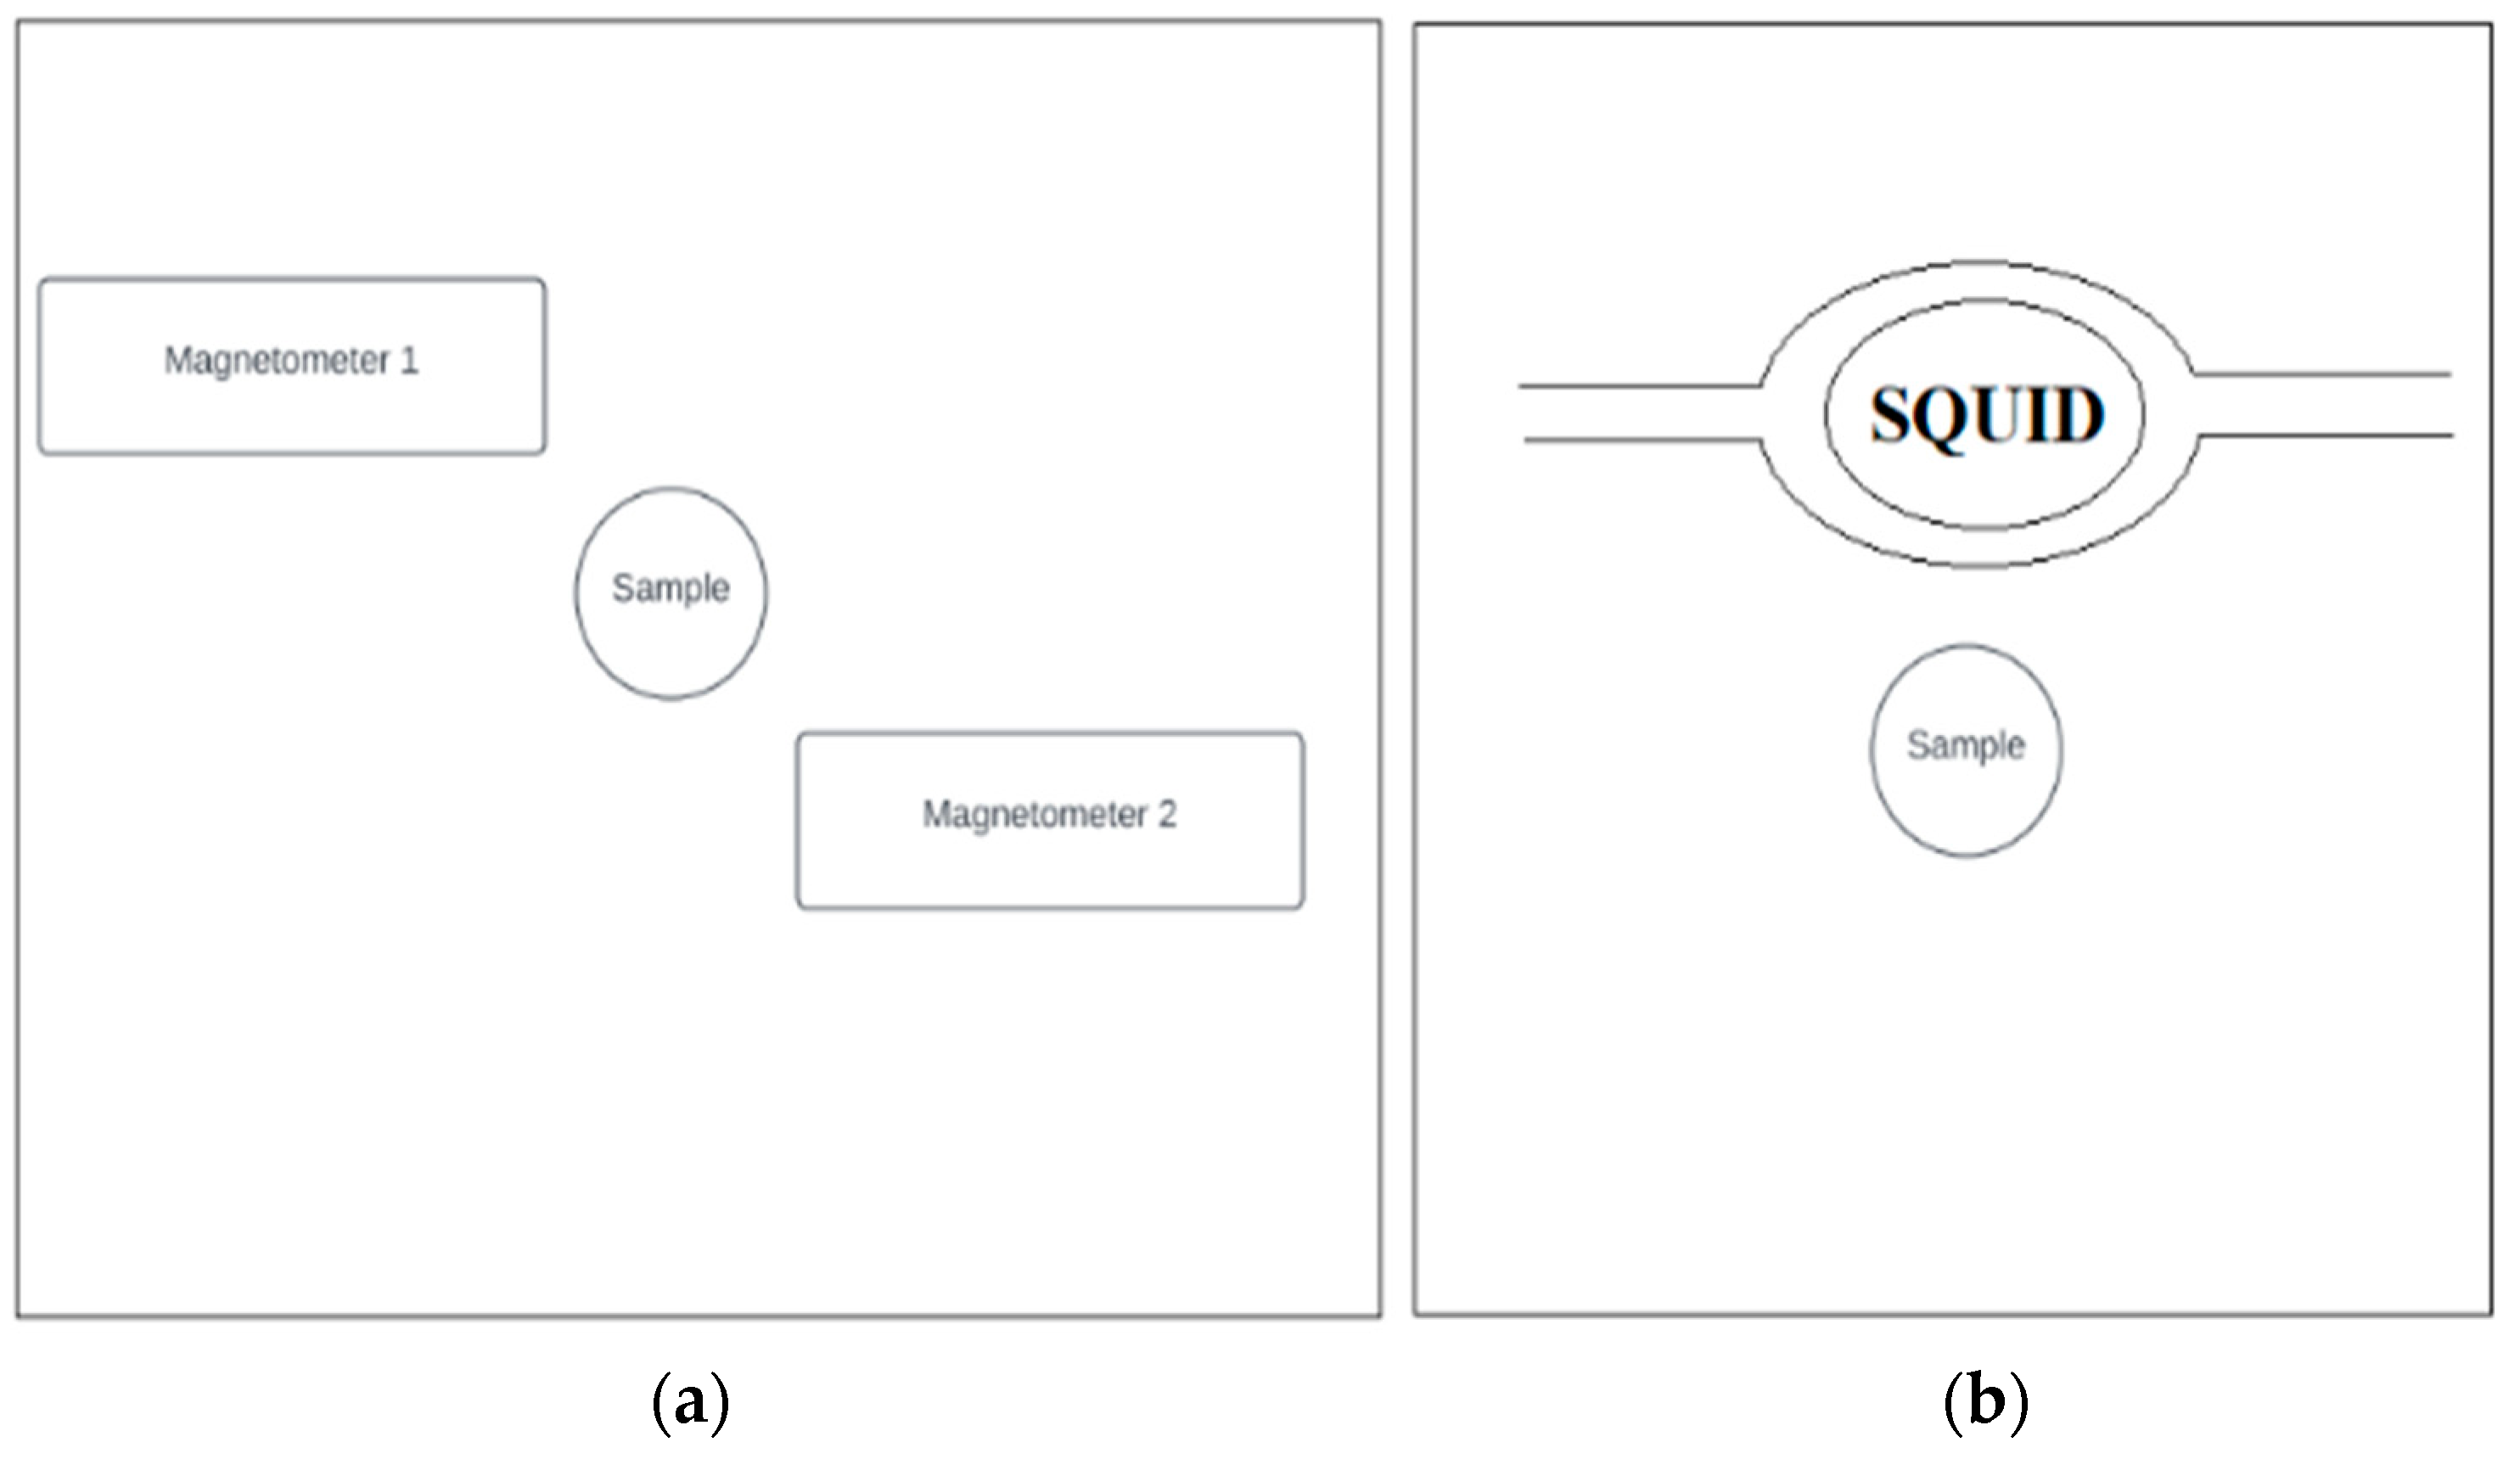
3.6. Superconducting Quantum Interference Device (SQUID)

A superconducting quantum interference device (SQUID) is a magnetic flux to voltage or current transducer and consists of a superconducting loop interrupted by two Josephson junctions [100,101]. The existence of the magnetic flux transducer increases the sensitivity of this type of magnetometer, in comparison to the conventional magnetometers that contain conventional amplifiers. This well-known magnetometer was developed around 1962 with the contribution of B.J. Josephson [62]. The sensitivity of this device is high [42,47], and according to [62], it is the most sensitive field sensor and can measure magnetic flux per unit bandwidth less than 10−6 Φ0 (where Φ0 = 2.07 × 10⁻¹⁵ Wb), corresponding to a magnetic field less than 1 fT over an effective area of about 2 mm2 [100]. Consequently, the range of the SQUID magnetometer is between 1 fT and 9 T, a fact that leads to the use of this device for medical applications because the neuromagnetic field of the human brain is a few tenths of a fT [62]. Therefore this instrument has a great variety of applications in many fields like medicine [102] (liver iron stores detection, sentinel lymph node biopsy, and breast cancer diagnostics), biomagnetism, magnetic microscopy, quantum computing, the non-destructive evaluation test, geophysics, the detection of axion dark-matter, the Hawking radiation, the dynamical Casimir effect, and the Majorana fermions [100].
According to [58,103,104,105], SQUIDs can be categorized in two types: the low temperature superconductor (LTS) SQUIDs and the high temperature superconductor (HTS) SQUIDs. The magnetometers of the first category are very sensitive and therefore can detect weak magnetic properties. The disadvantage of this type of sensor is that the liquid He systems need maintenance, resulting in the increment of the operating cost and making this device inappropriate for simple measurements. The materials by which it is constructed are conventional metal low transition temperature superconductors, operating at 4.2 K, which is the temperature that liquid helium boils [103]. However, when these devices are used to measure samples at room temperature, the difference in the temperatures of the sample and the operating temperature of the sensor is high. Except for the strong cooling need, there is also a need for either insulation, which is several millimeters thick, or operation in a vacuum, both of which result in worse resolution [103]. The magnetometers of the second category are characterized by a simple cooling system in high temperatures; they are compact and present similar performance and reliability compared to the magnetometers of the first category. There are simpler, economical, higher power, and lower weight devices. In contrast to the low-temperature SQUIDs, there is no need for high insulation, which reduces the distance between the sensor and sample enabling higher accuracy measurements. One of the most well-known sensors of this category is the high-temperature SQUID made by YBa2 Cu3 O7−δ (YBCO) superconductor [32,103]. This material is a ceramic transition metal oxide, with a 92K transition temperature. Although, the YBCO material presents high anisotropy, and difficulties in growing, patterning, and etching [103].
Another classification of SQUIDs is given by [106], in which it states that there are several types of SQUIDs, and among them, the most widespread are the bulk and the thin film SQUIDs. The bulk SQUIDs present high inductance and thus have the drawback of high flux noise, in comparison to thin film SQUIDs. The bulk SQUIDs, constructed by niobium, can be easily built, are economical devices, and have important reliability, but they do not have as high a sensitivity when compared to other SQUID types.
Compared to the fluxgate magnetometers, SQUIDs present low magnetic field noise [20,32,47,101] as well, and they are characterized by high bandwidths (of the order of MHz), while the corresponding fluxgate magnetometers have bandwidth in the order of kHz [32]. More specifically, according to [47], the conventional Nb SQUIDs present magnetic field noise values down to and below 1 fT/Hz1/2, while the corresponding values for YBCO SQUIDs are down to a few fT/Hz1/2. In addition, as the SQUIDs are cooled, one can achieve measurements that are not dependent on temperature [46,107]. Moreover, this device can measure at a close distance to the sample [44,108,109] and has a magnetorelaxometry dead time of approximately 200 μs [1].
Some important disadvantages of SQUIDs are the cooling demand [1,26,47,110], under the superconducting critical temperature, in either helium or nitrogen temperature; their disability to measure absolute magnetic fields, as they measure variations on the field; and their susceptibility to magnetic disturbances and the need of heavy magnetic shielding for preventing interference by environmental magnetic noises [42,103,110]. Moreover, when SQUIDs are used in magnetorelaxometry measurements, an important issue is their stability under high magnetic fields due to the rapid variations of the fields. In these cases, the noise performance of the device is downgraded, especially in the 1/f region, while the dynamic range of the device is limited [32]. Another important fact to take into consideration is the behavior of the SQUID under a large excitation magnetic field when a large offset interference signal is produced. In this case, the dynamic range of the device is reduced and a small magnetic response cannot be successfully investigated. Consequently, the ability of the SQUID to detect nanoparticles presents restrictions to some extent. In [104] a solution to this problem is attempted, using two detection coil configurations, one for AC and another for DC measurements, which increased the complexity of the system, demanding the use of two SQUIDs for concurrent measurements.
Next, the most important studies in the recent international literature using SQUID magnetometers are presented. More specifically, in [20], two systems that characterize magnetic nanoparticles through magnetorelaxation method using a differential fluxgate magnetometer and a low-temperature SQUID are compared, as depicted in Figure 2.
In [29], an improvement of an already existing AC/DC high-temperature SQUID magnetometer [104] is proposed. The aim of the optimization is the increment of the dynamic range of the device when an AC magnetic field is applied to it, using a tuned compensation coil, as well as the increment of the resolution of the DC magnetic field with the use of a secondary excitation coil. The compensation coil will contribute to the system’s capability to use only one SQUID for both AC and DC measurements, and it will increase the sensitivity level for the AC measurements. In [41], a thin film LTS SQUID magnetometer and the magnetorelaxation method are used to determine the magnetic nanoparticle distribution in large objects such as animals in a distributed environment. In [32], a high-temperature YBCO SQUID, connected with a slotted pick-up loop, has been used for magnetic nanoparticle characterization using the magnetorelaxometry method. The investigation showed that the system can achieve satisfactory noise levels, while it is appropriate for static magnetic fields.
In [46], a thin film planar low-temperature SQUID magnetometer of the second order is used for magnetorelaxometry measurements in an unshielded environment. In [100], two nanoSQUIDs with 0.5 μm2 sensitive area are presented. The asymmetric topology of nanoSQUID provides 10−4 Φ0 magnetic flux sensitivity, and the setup is proven appropriate for the characterization of nanoparticle clusters. In [102], a SQUID magnetometer is used for the detection of the minute magnetic field perturbations related to biocompatible nanoparticles when a novel sensing method is applied. In [103], a high-temperature SQUID magnetometer is presented, constructed by a YBCO thin film of 30 nm thickness, while the researchers’ ultimate goal is to create a helium ion beam fabricated nano-slit SQUID. In [106], a new bulk SQUID magnetometer, which contains two holes, is presented. The authors tried to optimize the connection of the RF-coil and the hole of the SQUID. In [111,112,113,114,115], several SQUID topologies are proposed to face the flux vortex motion phenomenon. In [111], a SQUID loop with narrow linewidths is proposed, while in [112] the flux dams are discussed. In [113,114], SQUID loops containing perforations are investigated, while the study in [115] slotted pick-up loops. In [116], an axial wire-wound SQUID and a planar thin-film SQUID magnetometer, as Figure 3 depicts, are compared for super-paramagnetic relaxometry measurements. The comparison revealed that a thin-film planar device is easier to manufacture in comparison to an axial wire-round SQUID as well as allows integrated chip design. However, in the thin-film planar topology, the flux can be trapped, and this phenomenon can prevent their appropriate function in the case that an external magnetic field is present.
In [117], magnetic characterization of glycerin and serum solvents was done using high-temperature SQUID magnetometers. The analysis is based on both AC and DC magnetometers: a hybrid magnetometer [58], with a vibrating and rotating sample, depicted in Figure 4, and an AC magnetometer for immunoassay.
In [118], a novel magnetic nanoparticle imaging (MPI) method is investigated. This method is the result of the combination of the MPI system, a high-temperature SQUID, and a laser scanning system. This new MPI method presents higher resolution compared to the conventional MPI methods. In [119], the activity of the small animal brain is studied, investigating the blood flow with magnetic nanoparticles, using three, connected in one chip, high-temperature SQUIDs. Finally, in [120] a novel YBCO micro-SQUID magnetometer, which uses a helium ion microscope, is proposed. Using this setup, the critical temperature decreases when the ion irradiation dose increases.

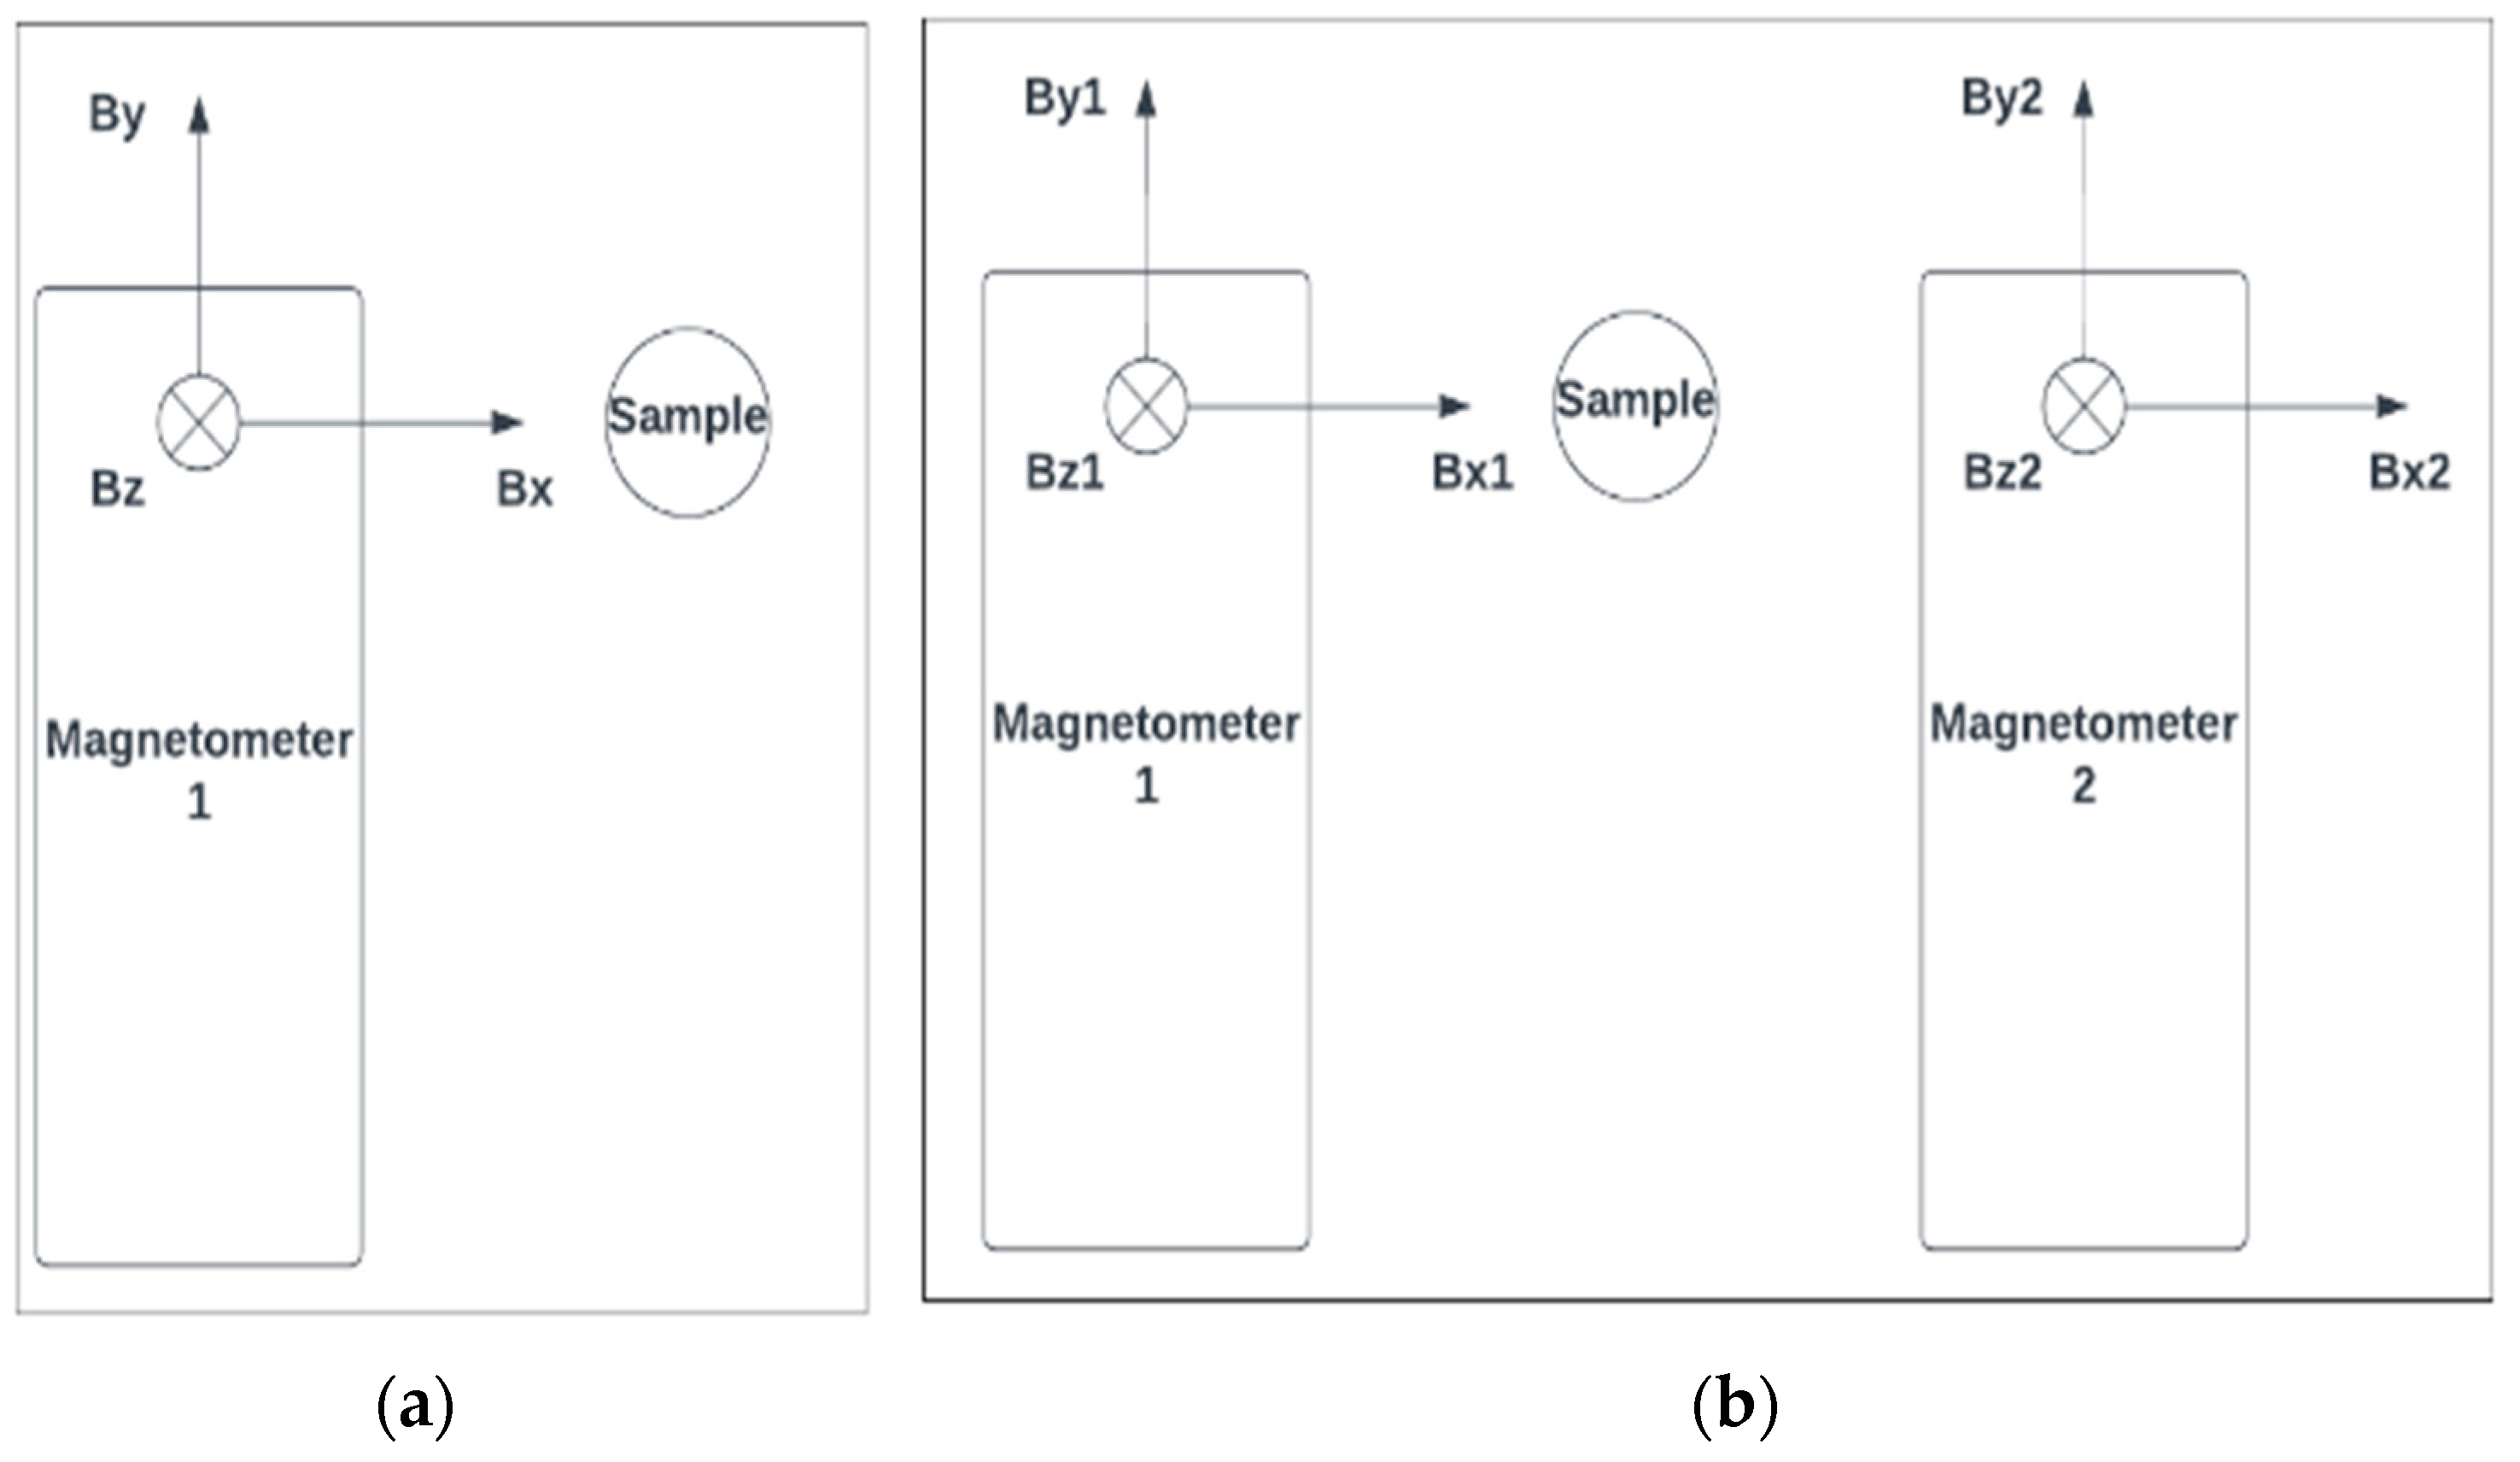
3.7. Fluxgate Magnetometers

An extremely popular measuring instrument is the fluxgate magnetometer. This device measures the time domain changes of the magnetic flux and therefore provides measurements of the time domain magnetic field in the three axes [26]. One of its major advantages is that are highly sensitive devices, with low noise levels (1 pT to 1 nT/ H z at 1 Hz) in comparison to Hall sensors and magnetoresistors [121]. According to [47], usually the fluxgate magnetometers that exist on the market present white-noise values in the range of a few pT/Hz1/2, while the lowest value of an already existing fluxgate magnetometer is 350 fT/Hz1/2 at 1 kHz. In addition, these devices can work at room temperature, while their structure is simple, without moving parts [121]. Moreover, they present high precision, are affordable, and can find application in the investigation of magnetic fields between 20 pT and 100 μΤ [20,26,42]. However, they are limited by their bandwidth in the lower kHz range [47]. As far as their dimensions are concerned, the size of the sensor varies from 1 mm, when the fluxgate is integrated, to 7 cm for the magnetometer with great precision [121].
Fluxgate magnetometers appear in a great range of applications. The signal in a fluxgate magnetometer has a proportional relationship with the density of the magnetic flux, contrary to the SQUID magnetometer where the signal is proportional to the average magnetic flux. Another important difference between a thin film SQUID and a fluxgate magnetometer is that the first is a vector magnetometer, while the second is a 3D device, whose sensitivity changes according to the factor of demagnetization on the shape of the magnetometer [47]. Fluxgate magnetometers, especially those with a differential arrangement, are compact and robust devices and sensitive low-noise sensors [15,19]. Compared to SQUIDs, there is no need for cryogenic cooling, and this method does not use extremely sensitive sensors so there is no need for magnetic shielding. Moreover, it can record the magnetic signal when an external field is also present as well as the signal behavior after canceling of the magnetic field because it measures the absolute value of the magnetic field and not only the changes of the magnetic field. Finally, it does not present susceptibility to magnetic disturbances [8,20,32,42,47,98]. To achieve measurements of the whole magnetization-relaxation cycle, these devices have the sensitive axes of the two magnetometers with perpendicular orientation, concerning the magnetic field, and thus exclusively the stray field from the nanoparticles is detected [20]. Moreover, using SQUID for magnetorelaxometry measurements, one can take data only in a specific period, after the deactivation of the external field, called dead time, and it lasts from several ms up to some hundred ms. Contrary to SQUIDs, using a fluxgate magnetometer, it is possible to know the signal before its deactivation, which allows obtaining knowledge about all nanoparticles’ magnetic moment [8].
In comparison to the SQUIDs, the fluxgate magnetometers present lower resolution [42]. In addition, the core of the fluxgate magnetometer is made of ferromagnetic material; consequently, the phenomenon of saturation and, for this reason, the magnetometer can affect the magnetic behavior of the nanoparticles [47]. However, the finding in [20] indicates that the magneto-relaxation of the ferromagnetic (in our case catalytic) nanoparticles is indeed influenced neither by the ferromagnetic core of the fluxgate sensors nor by the field of the feedback coils and that data from both systems (SQUIDs vs. FLUXGATE MAGNetometers.) can directly be compared.
Two common measurement ways, through the fluxgate magnetometers, are by using the single fluxgate arrangement and using the differential fluxgate arrangement, as Figure 5 depicts. In the case of the single fluxgate arrangement, where the sensitive axis of the magnetometer has an orientation perpendicular to the magnetic field, the greatest coupling of a magnetic dipole to the fluxgate signal is achieved, in the case that the dipole is located at one of the rod-shaped core ends [42]. One drawback of this configuration is that only the nanoparticles close to the fluxgate sensor contribute significantly to the signal as a consequence of the 1/r3 decay of the magnetic field of a magnetic dipole [42]. In the case of differential fluxgate arrangement, the sample is located with equal distances between the two magnetometers. The sensitive axes of each magnetometer are placed perpendicular to the magnetic field and consequently to the magnetic dipole axis. For this reason, in the case that the sample is absent, the magnetometer will register zero magnetic field. The total signal is the difference of the two signals. Consquently, the fields due to the environment are canceling each other, and the fields due to sample are constructivelly added, resulting in a total signal two times the signal that the single configuration provides. The topology of Figure 5b enables measurements in an unshielded environment, and the total signal is twice the signal of the single topology. Thus, the signal to noise ratio (SNR) is increased by a factor of √2 compared to the values of the topology of Figure 5a [42]. Compared to a SQUID-based system, the system based on a differential fluxgate gradiometer is more economical and with lower weight, providing a simpler measurement setup. A main drawback of the second arrangement is the need for two complete electronic sets since there are two magnetometers with their respective output signals [42]. Table 2 summarizes all the aforementioned pro and cons for the two different fluxgate magnetometer setups.
The most important studies that use the fluxgate magnetometer are summarized below. More specifically, in [19], two fluxgate magnetometers, in a gradiometer arrangement, have been used, for Fe3O4-based nanoparticle sample characterization, while the magnetization of samples is provided using Helmholtz coils. In [8] Fe3O4 nanoparticles are also characterized using fluxgate magnetorelaxometry, and the findings are compared with those provided by AC susceptibility, photon correlation, and transmission electron microscopy methods. In [26], a fluxgate magnetometer set up for cobalt-based nanoparticle characterization is proposed. The method is proven ideal for materials with high magnetic moment, while both the bed of the catalyst and peripherals, for temperature sensing or probes that monitor the reaction, can be successfully included in the measurement system. In [27], the behavior of magnetic nanoparticles in a rotating magnetic field is studied, using a setup based on fluxgate magnetometers. The configuration of the system is depicted in Figure 6. The investigation aims to detect the phase lag between the magnetization of the sample and the rotating magnetic field. This is also the novelty of the article, as the majority of the existing works on this topic focus on the magneto-mechanical coupling and not on the phase lag.
In [42], the magnetorelaxometry method has been applied for nanoparticle properties detection, while two magnetometers in differential fluxgate topology have been utilized. Moreover, Helmholtz coils are used instead of field coils, which can produce a homogeneous magnetic field in large samples. In [45], a fluxgate scanner that uses the magnetic relaxation imaging method is presented for the characterization of cell culture bag nanoparticles of immune cells. The schematic diagram of the setup is depicted in Figure 7. In [47], fluxgate magnetometers are used for nanoparticle characterization with the magnetorelaxometry method and the results are compared with those of a SQUID instead of the fluxgate magnetometer. In [110], a fundamental mode orthogonal fluxgate magnetometer is used for magnetorelaxometry purposes in an environment without shielding. In [121], the first fluxgate magnetometer that contains an inkjet-printed core is presented. This device is characterized by a wide open-loop linear range, enables the fully automatic manufacture process of the core, and offers the capability to manufacture the magnetometer on a substrate of arbitrary shape. The sensor, however, is characterized by small sensitivity.
In [122], a method is proposed to increase the permeability of the sensor core. According to [122], this can be achieved if a static magnetic field is applied while ink jetting the nanoparticles. In [123], iron oxide nanopowders are used as a core that guides the flux in a fluxgate magnetometer. The advantage of this material is that it contains supermagnetic nanoparticles, which are not affected by the hysteresis phenomenon at room temperatures.
In [124], a fundamental mode orthogonal fluxgate gradiometer that contains AC magnetizing coils is presented. In [125], a three-axial fluxgate magnetometer is proposed that can find application in autonomous aeromagnetic survey. In [126], a fluxgate magnetometer is used for nanoparticle properties investigation that applies the magnetic field strength method.
In [127], a measurement setup consisting of three applied field coils and two fluxgate magnetometers for the detection of nanoparticle properties in an economical way is proposed. The schematic diagram of the aforementioned setup is depicted in Figure 8, where both the compensation and drive coils are visible, as well as the fluxgate sensors, which are used for nanoparticle characterization.
In [128], a measurement setup is proposed that uses two fluxgate magnetometers to identify the effect of the rotating magnetic field, created by Helmholtz coils, on the nanoparticle characterization procedure. The impact of the rotating magnetic field, when defining the magnetic properties of iron oxide suspension nanoparticles, is compared to the impact of the alternating magnetic field. The used fluxgate magnetometers have been proposed also in [27]. In [129], a fluxgate sensor capable of operating at high temperatures is studied, and the analysis of its characteristics is done for temperatures up to 180 °C.

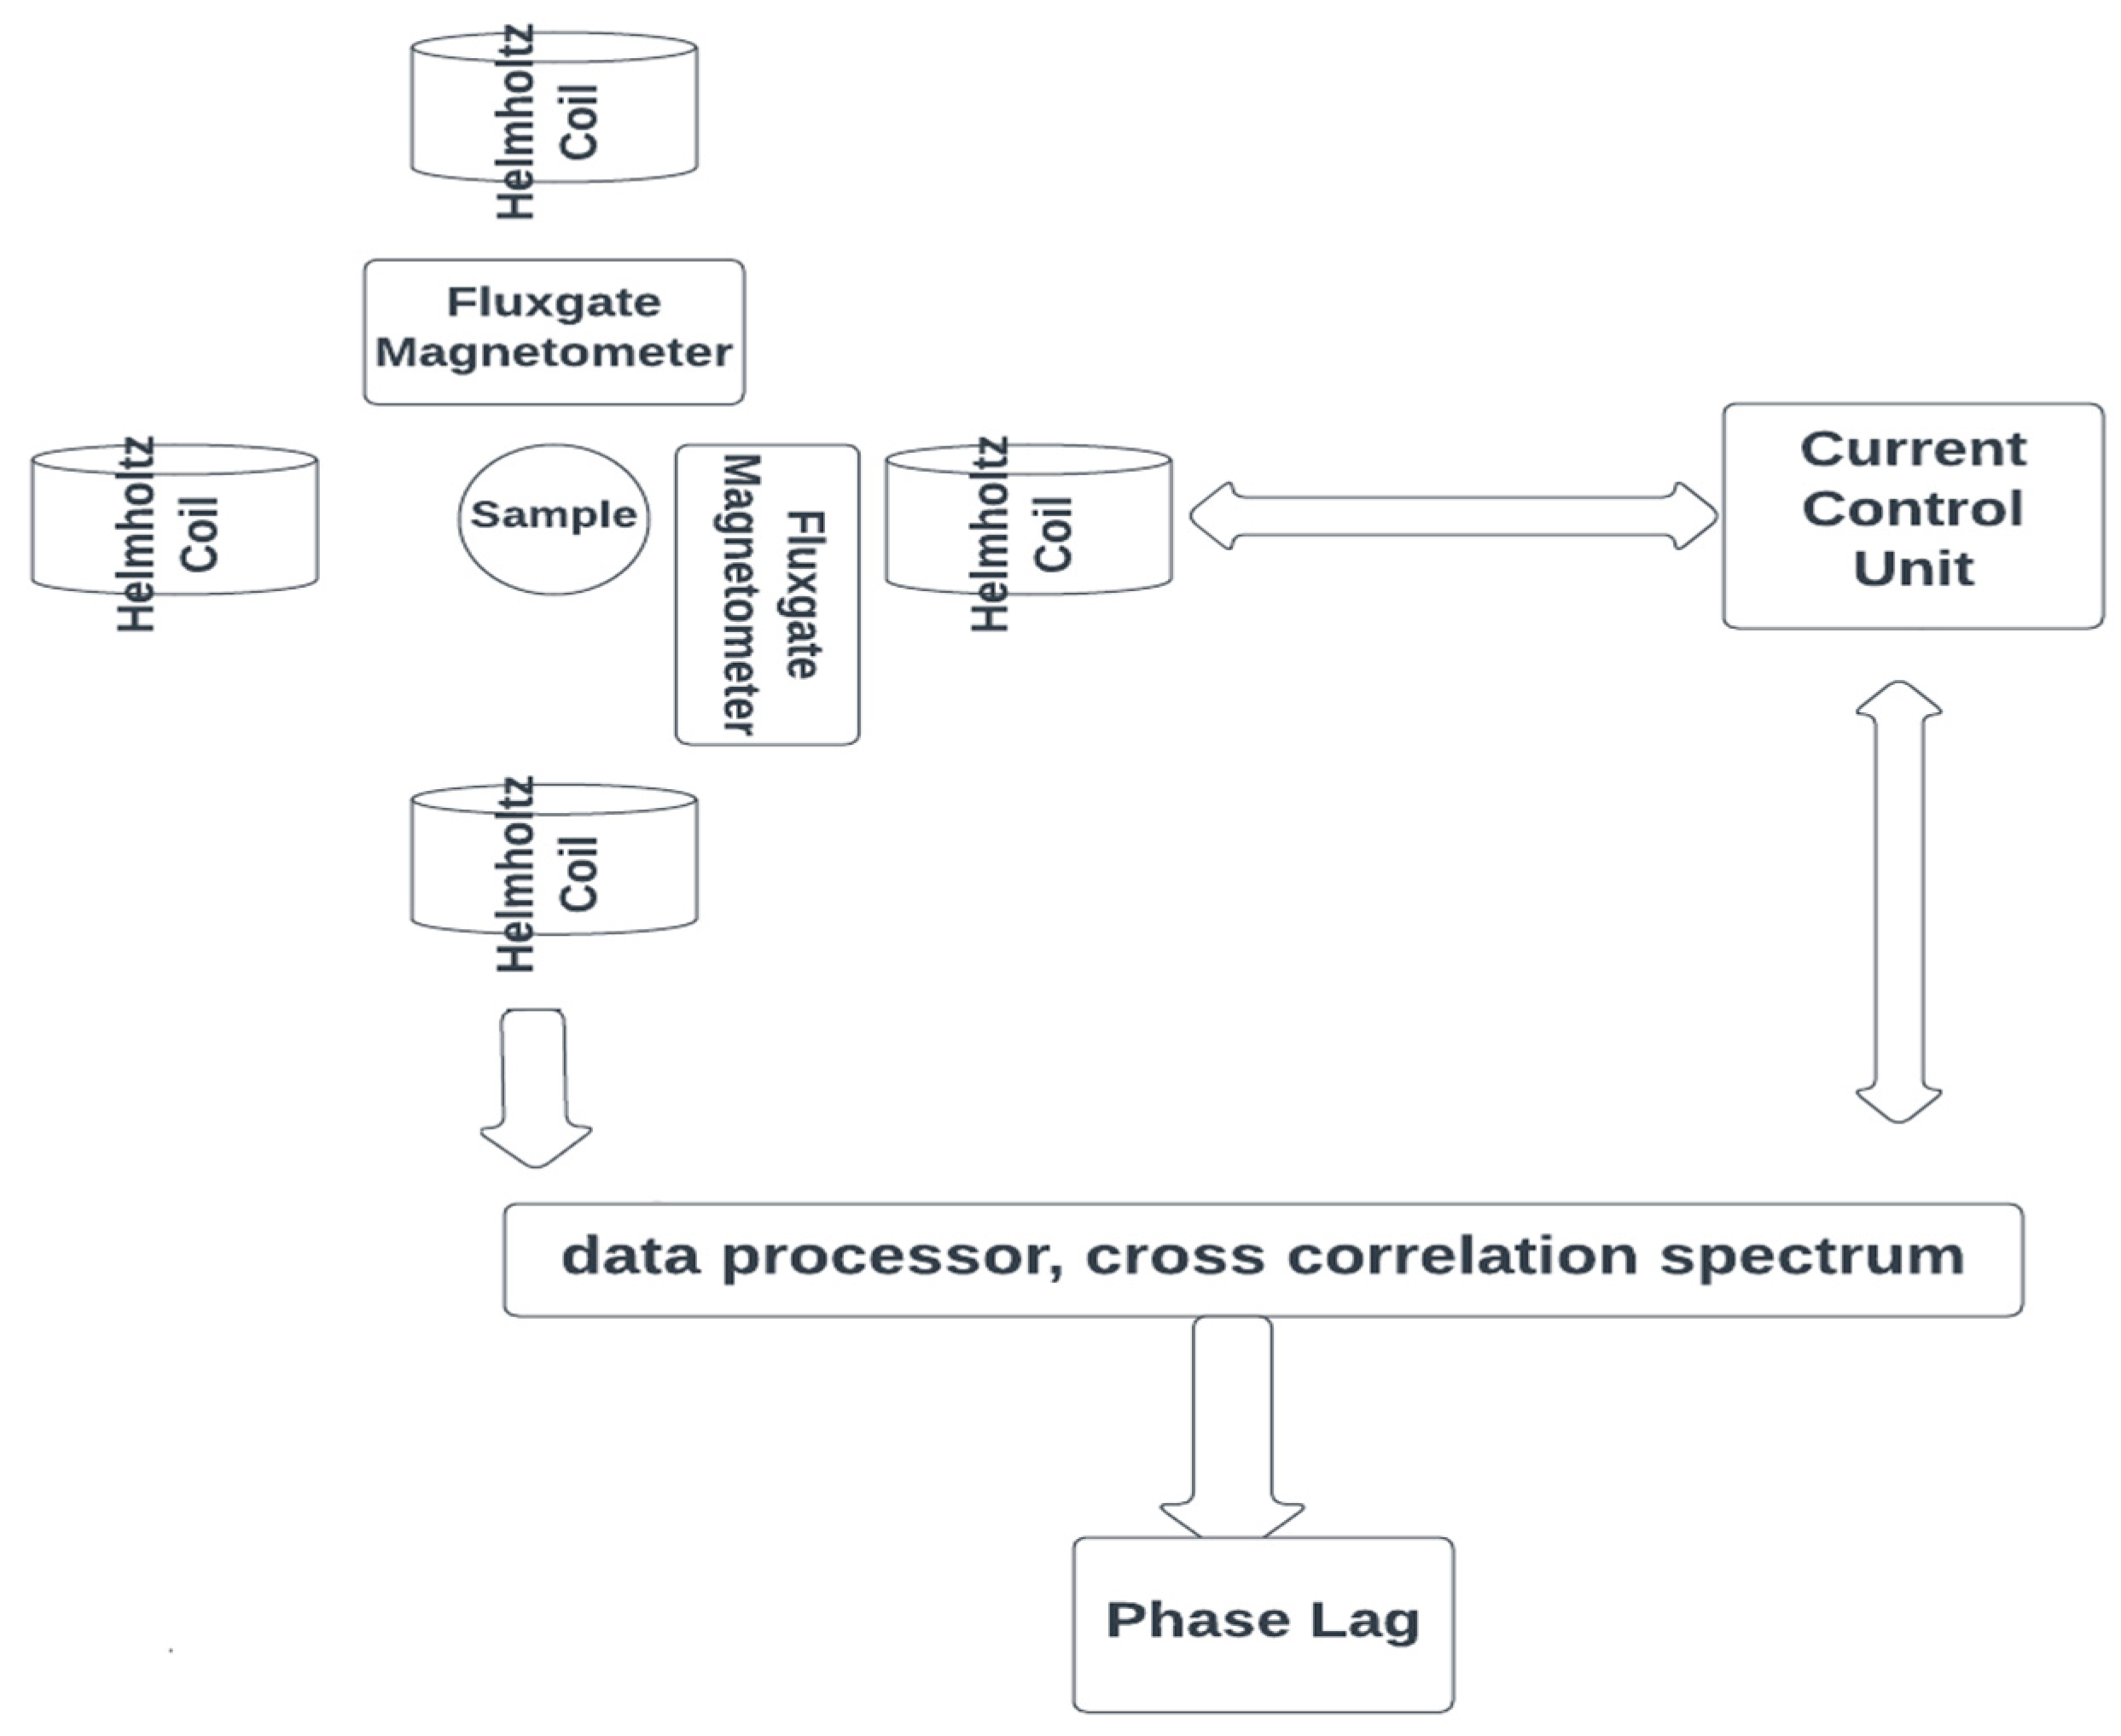
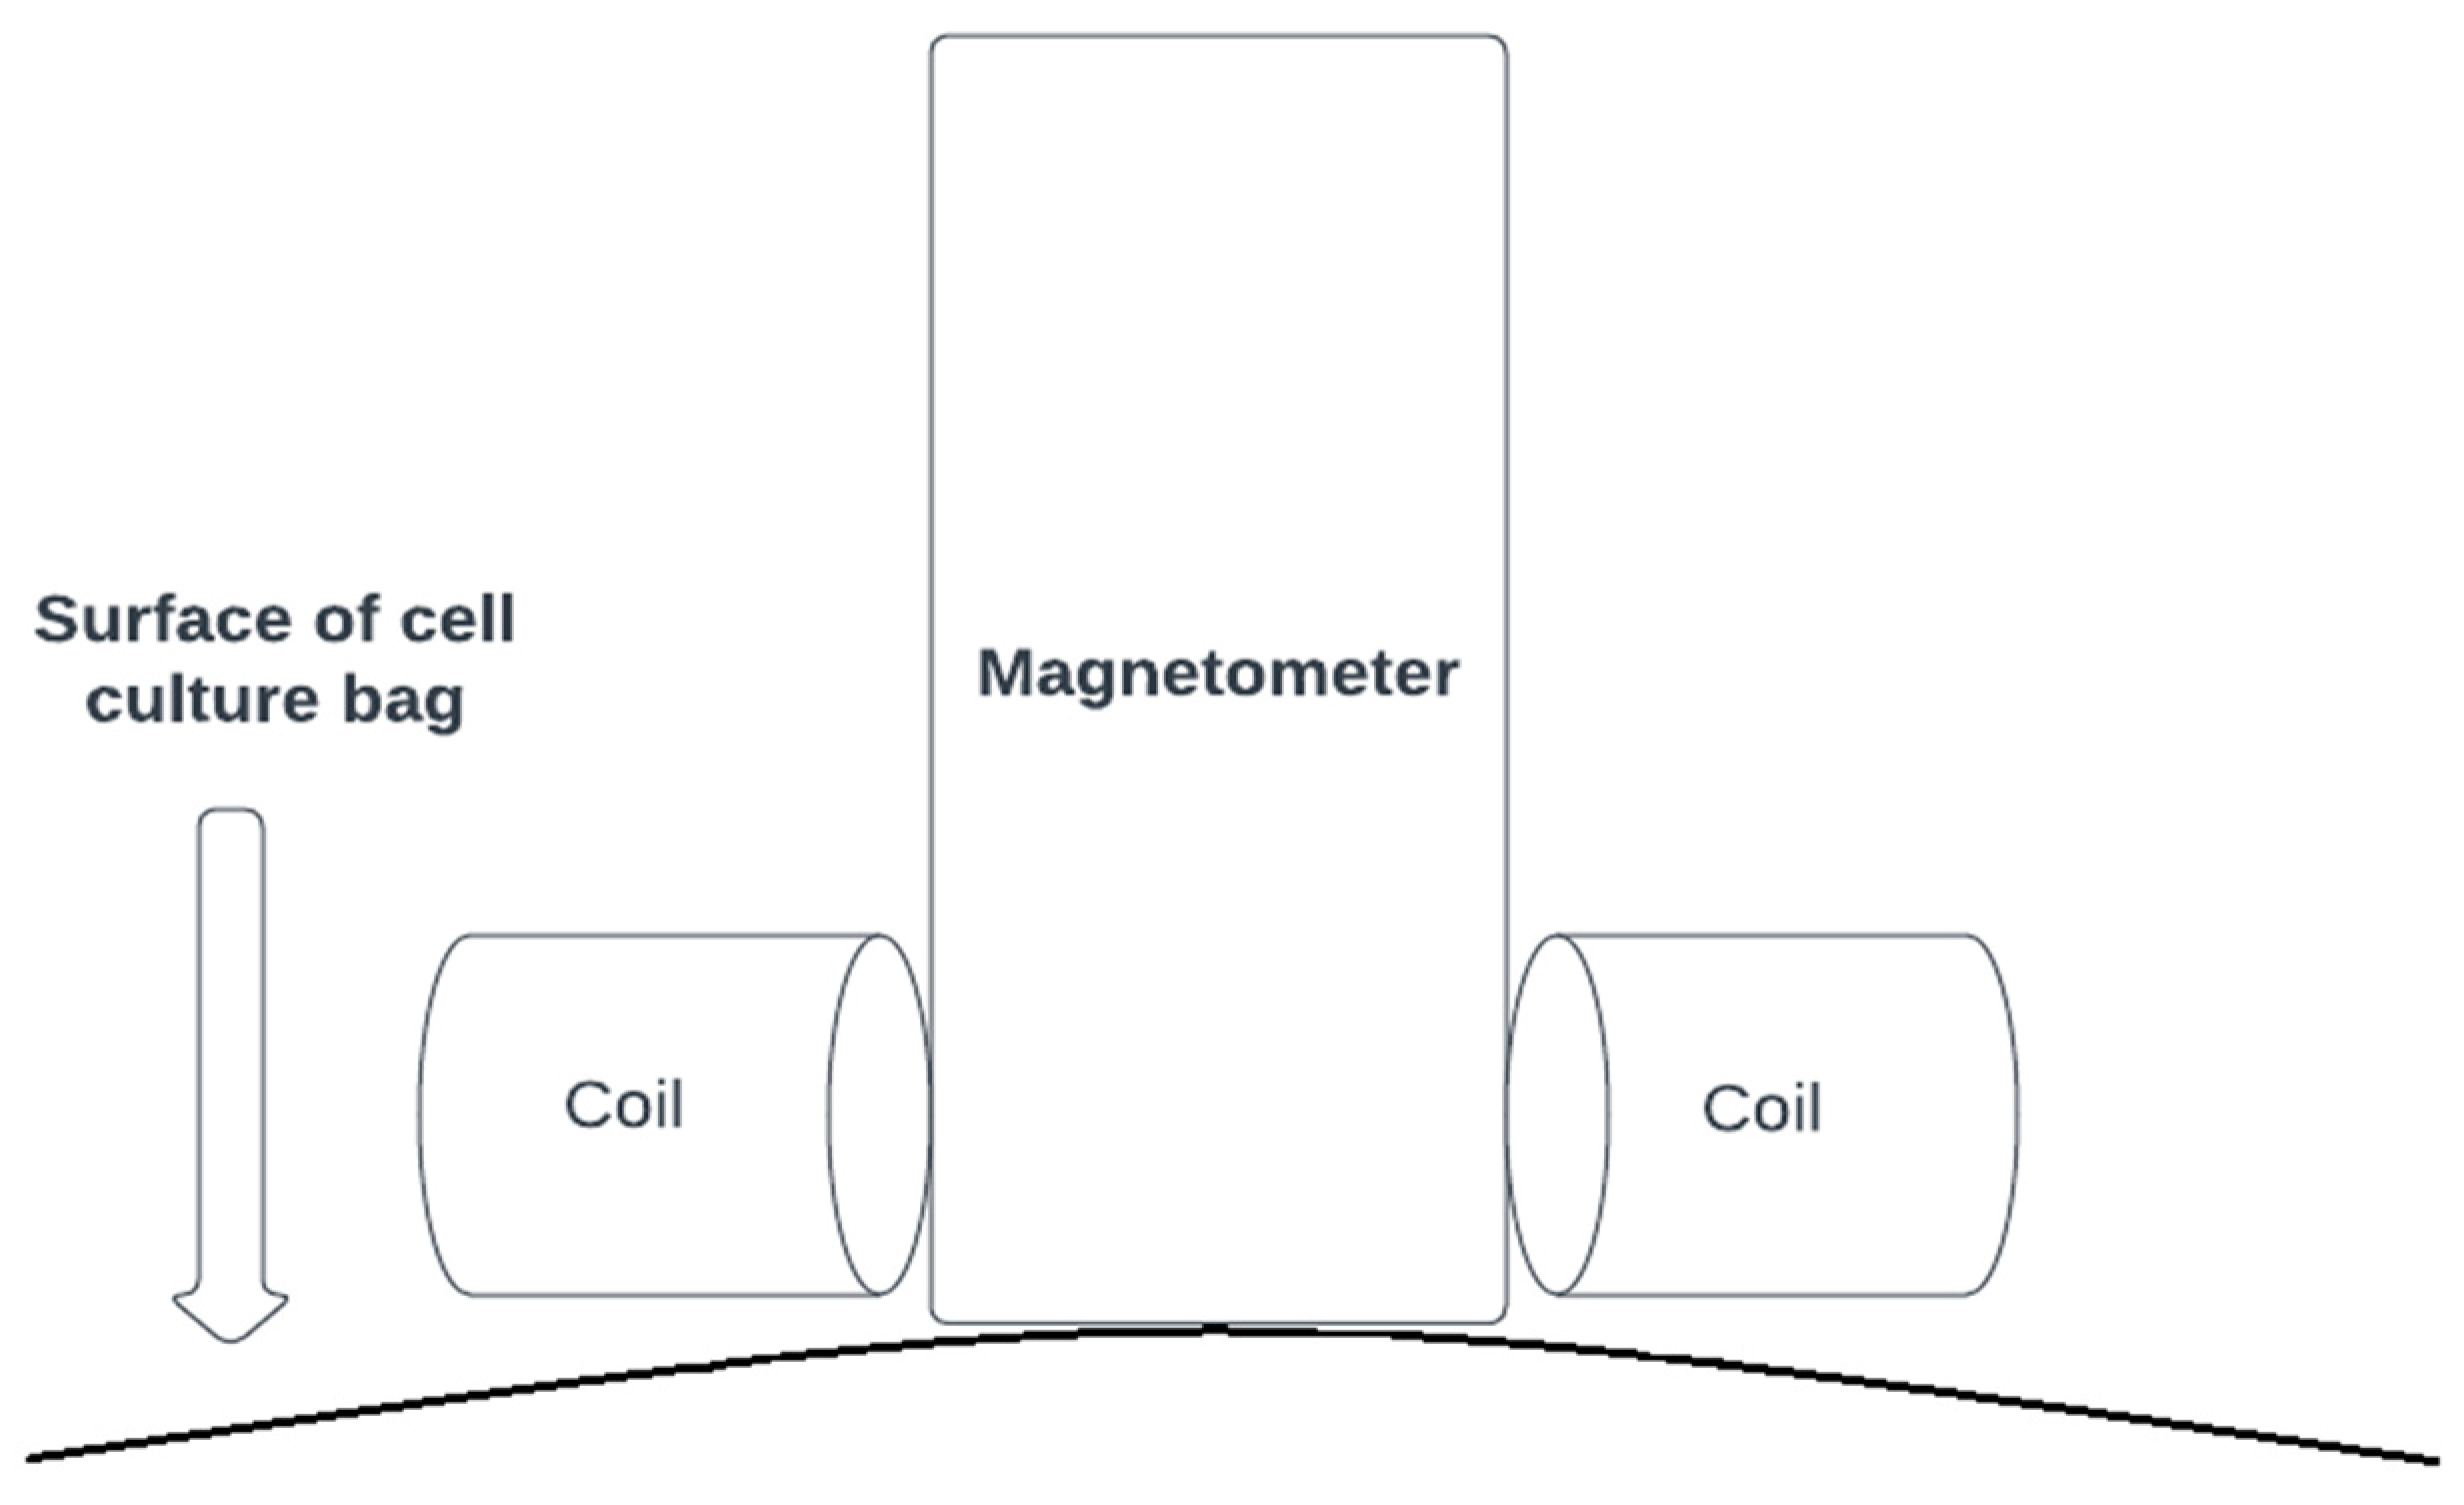
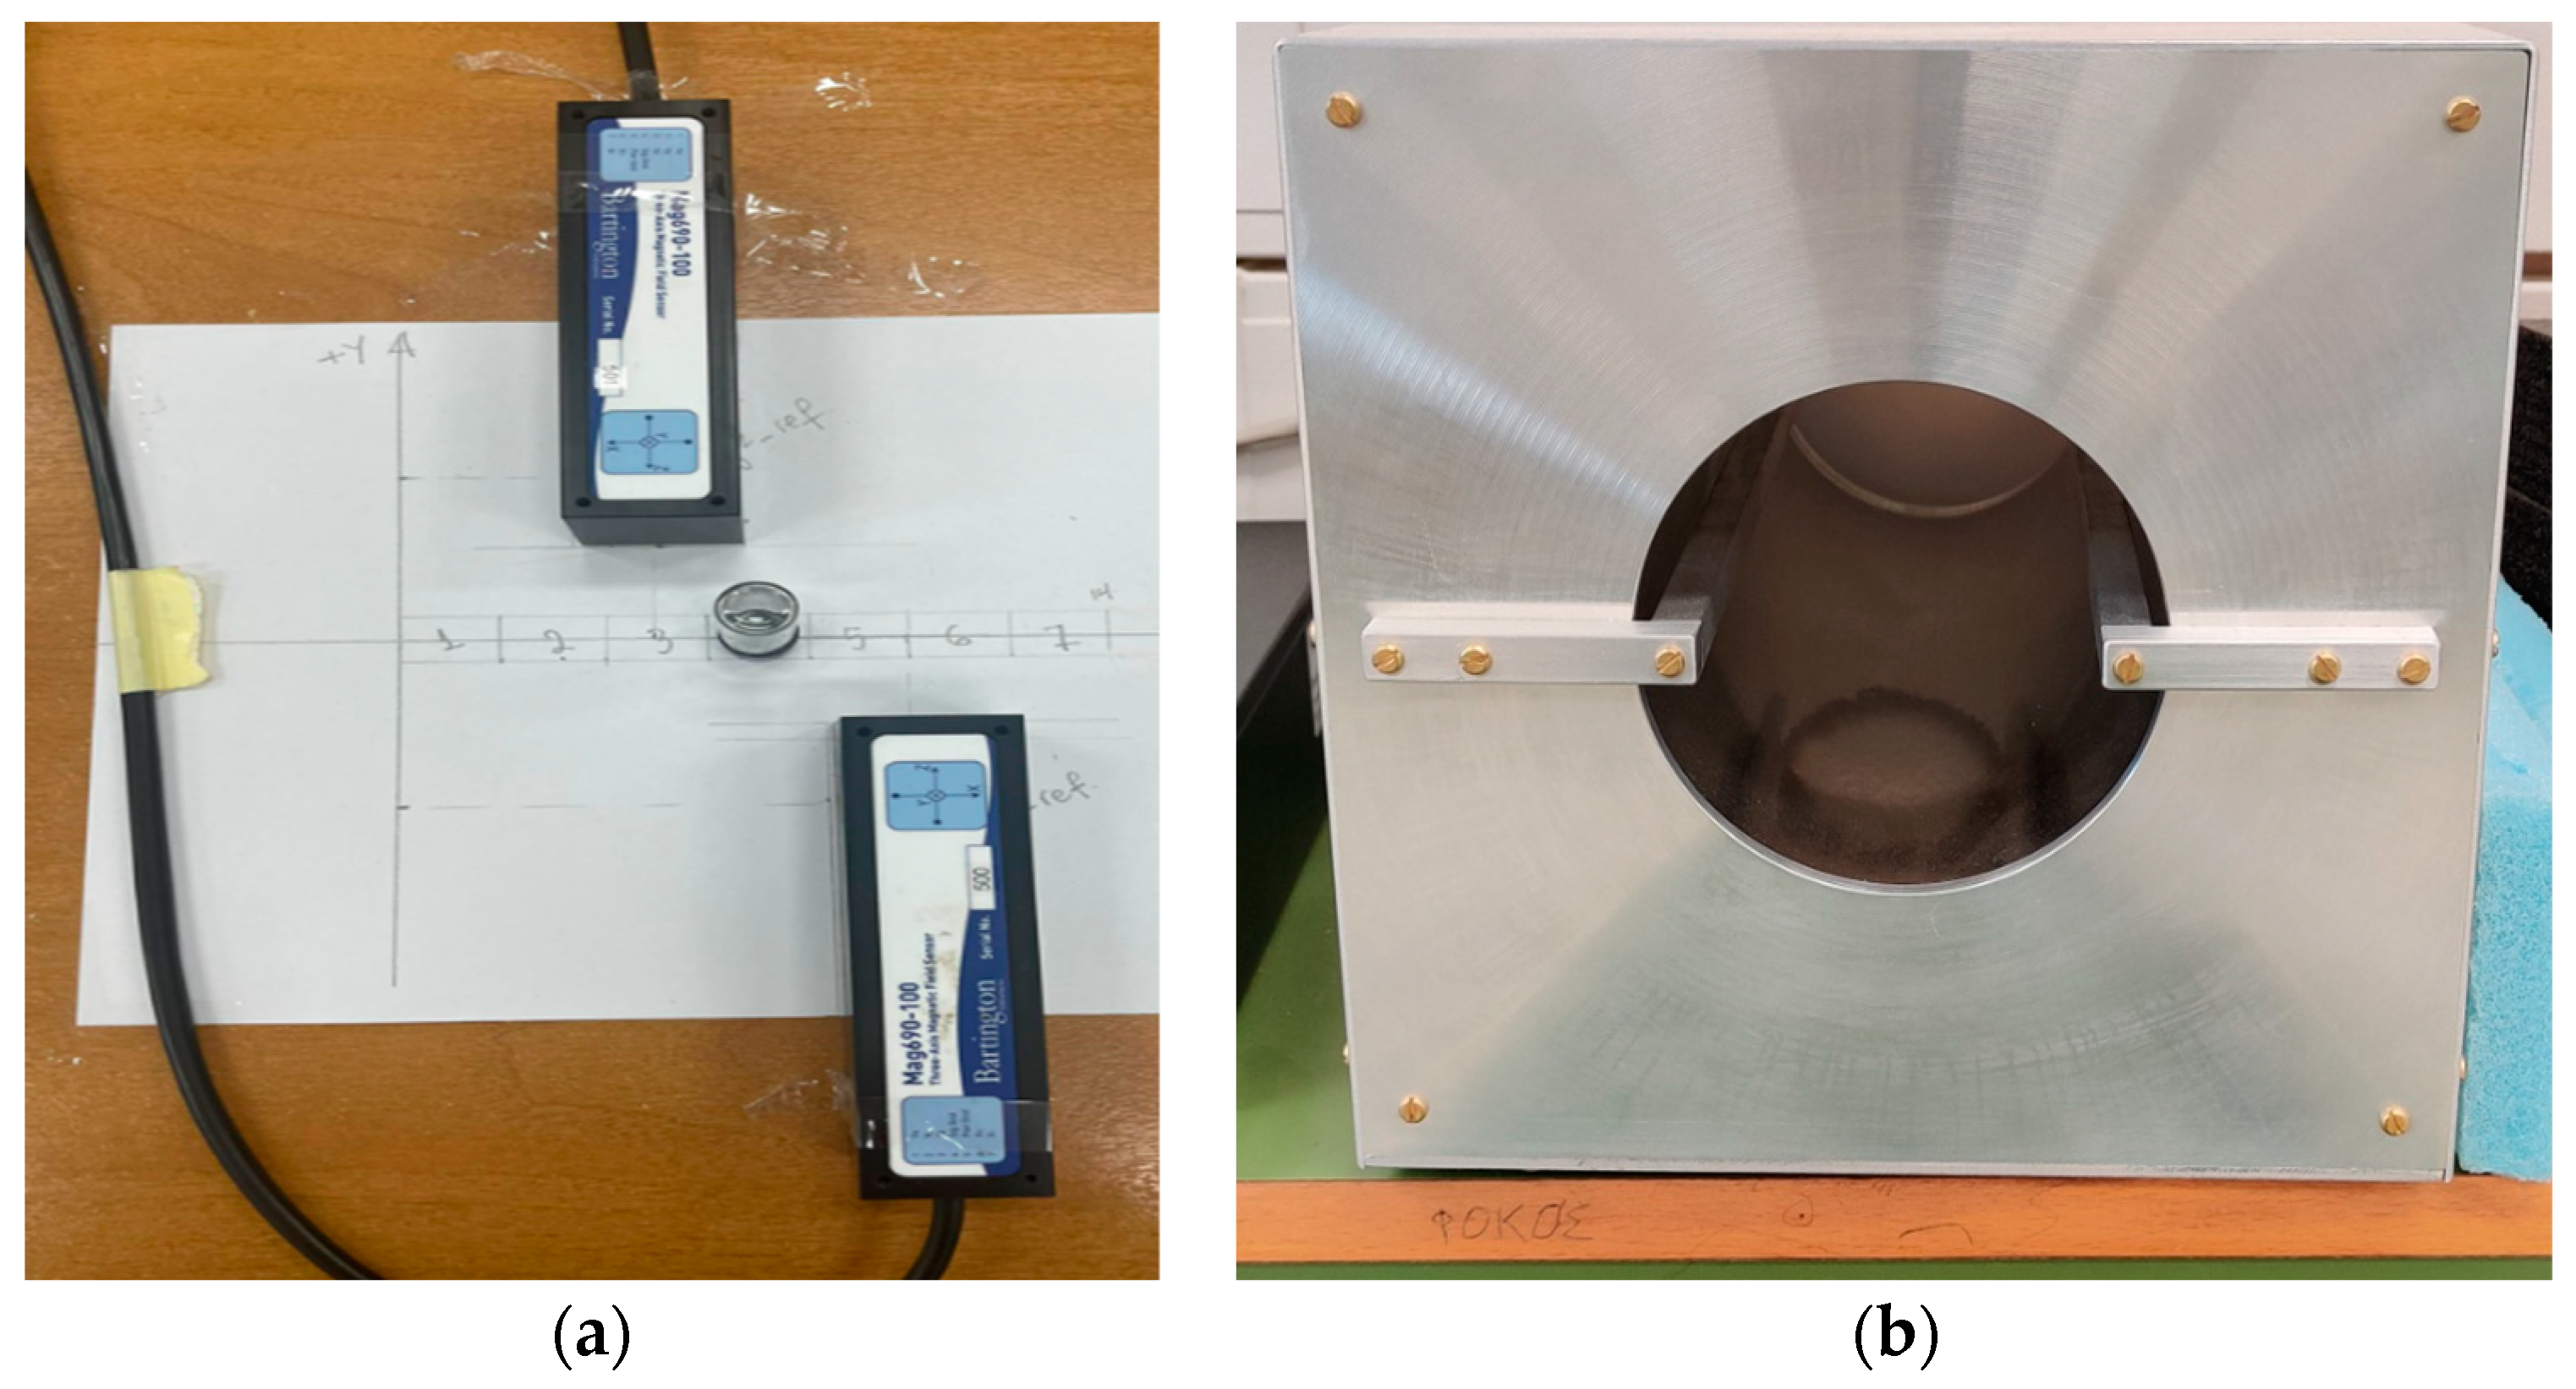
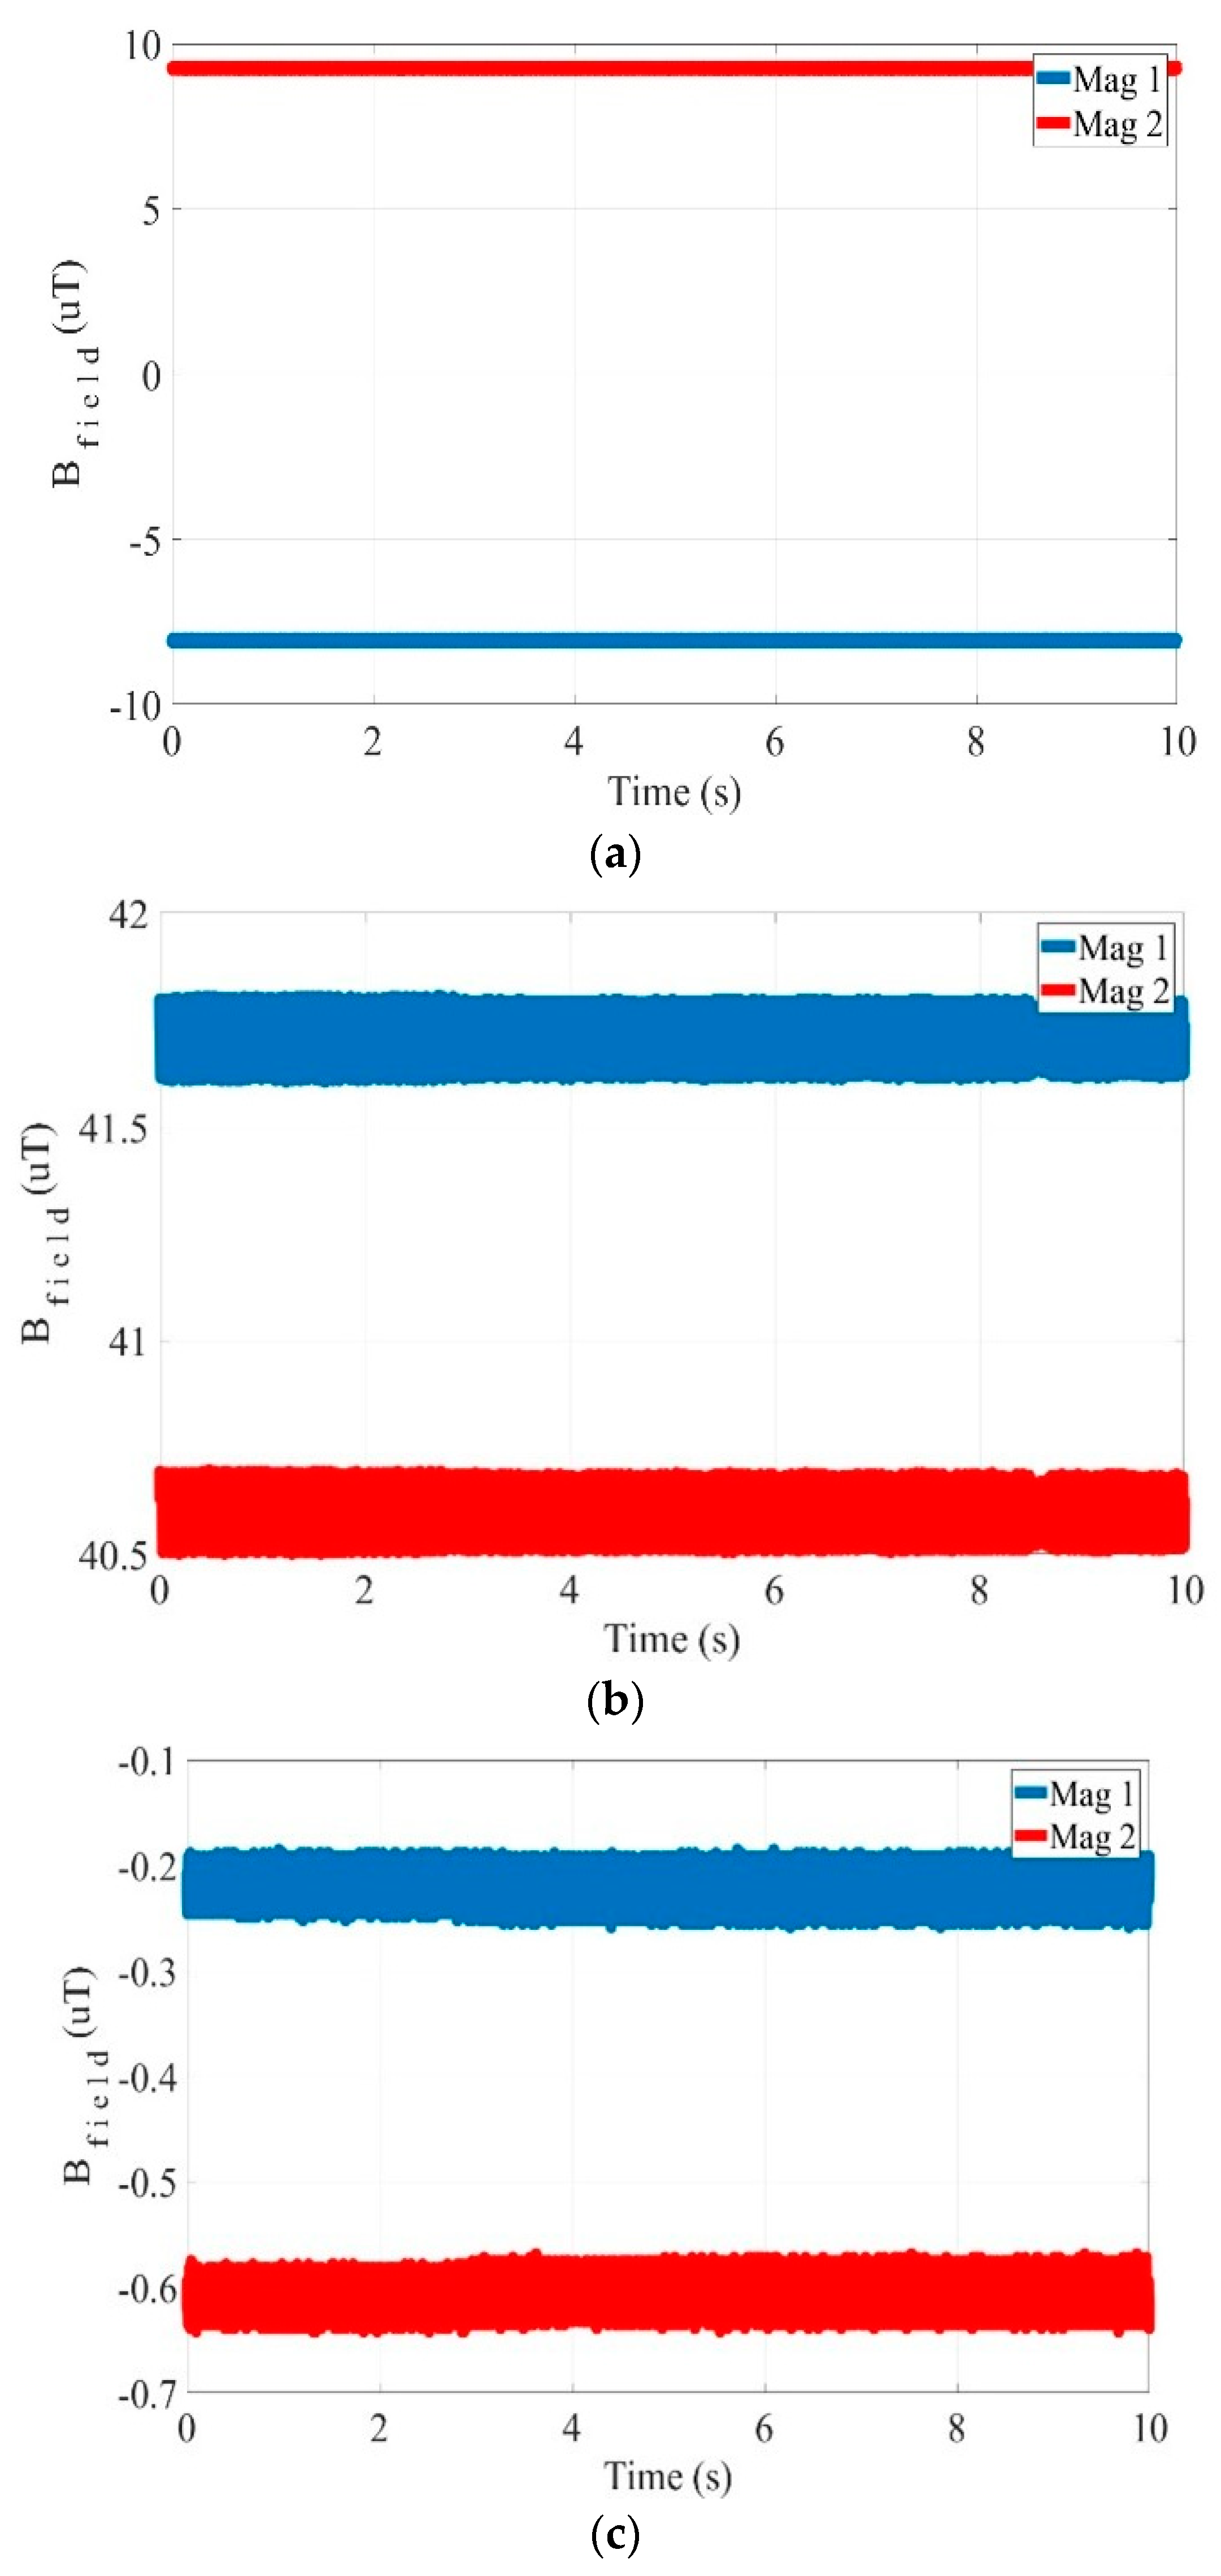
4. The Proposed Magnetic Characterization Method

Taking into account the aforementioned pros and cons of the already existing magnetic characterization techniques, the simple and differential arrangements of the fluxgate magnetometer are the most advantageous for a portable and low-cost catalyst characterization system. For this reason, the authors propose the following simple, economical, and novel magnetic measurement setup based on dual fluxgate magnetometers, as Figure 5b depicts.
A catalyst deactivation, the nanoparticle event this method is mainly developed to sense, reduces the production and resulta in extra cost in the industrial processes, so it is vital to have proper techniques to detect the aforementioned important information concerning catalytic materials. The proposed method of the dual arrangement aims to detect with accuracy the magnetization of the sample, as well as its position, albeit with different implementations.
The experimental setup is depicted in Figure 9, where the two magnetometers and the sample in STP conditions (1 atm pressure, 20 °C, and 0% humidity) can be seen. It should be noted that all magnetometers were calibrated before their use in a Bartington open-ended triple-layer magnetic shield (Figure 9b). Magnetic field offset is then identified and subtracted from the measured data to form the actual data fed to the inverse algorithm. The sample under study is a cobalt-based material, embedded in carbon, with a hexagonal close pack (hcp) crystal structure, weight of 0.076 gr, content of cobalt 20% wt., and saturation magnetization 150 emu/g. Magnetometer 1 is placed at x = 0.05 m, y = 0.05 m, and z = 0.015 m, while magnetometer 2 is positioned at x = 0.1 m, y = −0.05 m, and z = 0.015 m, in the system’s coordinate system. The positions the sample can be placed at are discretized in a grid of cells 2 cm long along the x-axis, starting at 0 cm as depicted in Figure 9. The sample is placed at the fourth cell of the constructed grid, which extends from 0.06 to 0.08 m.
Two experiments are conducted. First, the magnetization of the sample is calculated via the magnetic field measurements, considering the sample placement (cell ‘4’) known. Next, the magnetization and the position of the sample are both calculated from the measurements of the magnetometers.
Concerning the first experiment, the magnetization of the sample, under the effect of the earth’s magnetic field, is calculated. For this reason, two sets of measurements (Figure 9a) are conducted sequentially and in very fast succession: one with the sample present and a second without the sample present. The values of the magnetic field in the three axes for the two measurement sets are illustrated in Figure 10 and Figure 11, respectively. The values derived from magnetometer 1 are depicted in blue and the values derived from magnetometer 2 in red.
The magnetic field of the sample is calculated by subtracting the values of the fields depicted in Figure 11 (sample absent) from the values of the field depicted in Figure 10 (sample present) for each of the axes for both the magnetometers. This way the background field (sample absent) is minimally varied between the two measurements; it can be considered static in amplitude so the subtraction yields the magnetic field values due to the sample. Then, the differential evolution (DE) algorithm is applied to the sample magnetic field for the magnetization of the sample to be calculated, employing the values of both magnetometers. The magnetic field of the sample in the three axes has values Bx1 = 0.0045 × 10⁻⁶ T, By1 = 0.0322 × 10⁻⁶ T, and Bz1 = −4 × 10⁻¹⁰ T for magnetometer 1 and values Bx2 = 0.0066 × 10⁻⁶ T, By2 = 0.0166 × 10⁻⁶ T, and Bz2 = −1 × 10⁻¹⁰ T for magnetometer 2. The sample magnetization value is found equal to 1.39 emu/gr using this methodology and taking into account the values provided by magnetometer 1, while the magnetometer 2 was used for validation purposes. The methodology is presented in detail in [130].
Moreover, as long as the second experiment is considered, the magnetization and the position of the sample are calculated simultaneously, using the aforementioned values provided by the two magnetometers in tandem. Following the inverse problem solution as formulated in [131], the position is derived equal to 0.077 m, a location that corresponds to cell ‘4’ of the grid with the same value on the magnetization, values in agreement with the previous experiment and the sample characteristics. It should be noted that since the magnetic field is a nonlinear function to the distance, solving the inverse problem and thus calculate all the aforementioned parameters (three magnetic moments and one position of the source) would require at least four measurements (non-correlated); this way both magnetometers are used in this setup.
Consequently, it is evident that the system in one arrangement or the other can predict with satisfactory accuracy the position as well as the magnetization of the sample. This fact can play a crucial role in catalyst characterization, in an uninterrupted catalytic operation, to detect the deactivation of the catalyst as it occurs.

5. Discussion

In this article, the main techniques and the most important devices existing in the international literature to perform magnetic sensing of ferromagnetic nano-particles are presented. Table 3 summarizes the different types of magnetometers that can be used for magnetic measurements and presents an overview of their advantages and disadvantages for the specific application.
From the literature investigation, it is proved that the most commonly used instruments are the SQUIDs and the fluxgate magnetometers, although, observing Table 3, it can be seen that the fluxgate magnetometer displays the most advantages, relevant to catalysis monitoring, and it is a promising measurement instrument for nanoparticle characterization. These magnetometers present high precision, low noise levels, and simple structure; are applicable in a great range of magnetic fields; do not need cryogenic cooling and magnetic shielding, etc. compared with other types of magnetometers. The most important parameter is the cost analysis of the fluxgate sensors.
For this reason, these measurement instruments will be the foundation of a novel, accurate, and cost-effective system for magnetic characterization purposes as a next step of this work. The preliminary study is summarized in the last section of the article, where the magnetization and the position of a cobalt-based magnetic material are calculated using a dual fluxgate arrangement. It turns out that this experimental setup can detect the magnetization with accuracy, as well as the position of the sample, enabling the 2D mapping of the active remaining catalyst as a feasible process. This information is critical in real-time monitoring of the catalysts in the industry providing a portable, low-cost, and in vivo solution. Furthermore, a comparative measurement with different methods will be performed in order to evaluate the accuracy and the sensitivity of the proposed methodology for various samples, concluding also to the minimum detectable sample mass. Moreover, a future measurement campaign will reveal the catalyst deactivation mechanisms indirectly (fouling, poisoning, sintering, vapor-solid and solid-solid reactions) in-situ or operando by monitoring the changes in the measured magnetic field and thus the magnetic moment of the catalytic nanoparticles. Especially when deactivation occurs due to sintering the magnetic moment is expected to be reduced irreversibly but in case of oxidation the inverse process will reveal that the catalyst can be reactivated.

Author Contributions

Conceptualization, C.D.N.; methodology, C.D.N., A.T.B. and A.C.B.; validation A.T.B. and A.C.B.; formal analysis, I.O.V. and C.D.N.; investigation, C.D.N., A.T.B. and A.C.B.; resources, I.O.V.; data curation, C.D.N. and A.T.B.; writing—original draft preparation, A.C.B.; writing—review and editing, A.C.B., C.D.N. and I.O.V.; visualization, A.T.B. and A.C.B.; supervision, C.D.N.; project administration, I.O.V. and C.D.N. All authors have read and agreed to the published version of the manuscript.

Funding

This research is partially financed by the project “Strengthening and Optimizing the Operation of MODY Services and Academic and Research Units of the Hellenic Mediterranean University”, funded by the Public Investment Program of the Greek Ministry of Education and Religious Affairs.

Data Availability Statement

Not applicable.

Acknowledgments

The authors would like to thank Nikolaos Tsakoumis, researcher at Kinetics & Catalysis Group, SINTEF Industry, Norway for providing the cobalt nanoparticle samples and his insight and fruitful comments.

Conflicts of Interest

The authors declare no conflicts.

References

  1. Jaufenthaler, A.; Kornack, T.; Lebedev, V.; Limes, M.E.; Körber, R.; Liebl, M.; Baumgarten, D. Pulsed Optically Pumped Magnetometers: Addressing Dead Time and Bandwidth for the Unshielded Magnetorelaxometry of Magnetic Nanoparticles. Sensors 2021, 21, 1212. [Google Scholar] [CrossRef] [PubMed]
  2. Materón, E.M.; Miyazaki, C.M.; Carr, O.; Joshi, N.; Picciani, P.H.S.; Dalmaschio, C.J.; Davis, F.; Shimizu, F.M. Magnetic Nanoparticles in Biomedical Applications: A Review. Appl. Surf. Sci. Adv. 2021, 6, 100163. [Google Scholar] [CrossRef]
  3. McNamara, K.; Tofail, S.A.M. Nanoparticles in Biomedical Applications. Adv. Phys. X 2017, 2, 54–88. [Google Scholar] [CrossRef]
  4. Ali, A.; Shah, T.; Ullah, R.; Zhou, P.; Guo, M.; Ovais, M.; Tan, Z.; Rui, Y.K. Review on Recent Progress in Magnetic Nanoparticles: Synthesis, Characterization, and Diverse Applications. Front. Chem. 2021, 9, 629054. [Google Scholar] [CrossRef]
  5. Delmon, B.; Haber, J.; Block, J.H. Manual of Methods and Procedures for Catalyst Characterization (Technical Report). Pure Appl. Chem. 1995, 67, 1257–1306. [Google Scholar] [CrossRef]
  6. Wani, S.U.D.; Ali, M.; Masoodi, M.H.; Khan, N.A.; Zargar, M.I.; Hassan, R.; Mir, S.A.; Gautam, S.P.; Gangadharappa, H.V.; Riyaz, R.A. A Review on Nanoparticles Categorization, Characterization and Applications in Drug Delivery Systems. Vib. Spectrosc. 2022, 121, 103407. [Google Scholar] [CrossRef]
  7. Jodłowski, P.; Łojewska, J. In Situ and Operando Techniques in Catalyst Characterisation and Design. Chall. Adv. Comput. Chem. Phys. 2019, 26, 333–359. [Google Scholar] [CrossRef] [PubMed]
  8. Ludwig, F.; Heim, E.; Schilling, M. Characterization of Magnetic Core-Shell Nanoparticles by Fluxgate Magnetorelaxometry, Ac Susceptibility, Transmission Electron Microscopy and Photon Correlation Spectroscopy-A Comparative Study. J. Magn. Magn. Mater. 2009, 321, 1644–1647. [Google Scholar] [CrossRef]
  9. Akbari, B.; Tavandashti, M.P.; Zandrahimi, M. Particle Size Characterization of Nanoparticles—A Practicalapproach. Iran. J. Mater. Sci. Eng. 2011, 8, 48–56. [Google Scholar]
  10. Bender, P.; Balceris, C.; Ludwig, F.; Posth, O.; Bogart, L.K.; Szczerba, W.; Castro, A.; Nilsson, L.; Costo, R.; Gavilán, H.; et al. Distribution Functions of Magnetic Nanoparticles Determined by a Numerical Inversion Method. New J. Phys. 2017, 19, 073012. [Google Scholar] [CrossRef]
  11. Lecture 10 Catalyst Characterization. 42–46. Available online: https://www.uobabylon.edu.iq/eprints/publication_5_10702_432.pdf (accessed on 16 April 2024).
  12. Mohamed, R.M.; Aazam, E.S. Characterization and Catalytic Properties of Nano-Sized Au Metal Catalyst on Titanium Containing High Mesoporous Silica (Ti-HMS) Synthesized by Photo-Assisted Deposition and Impregnation Methods. Int. J. Photoenergy 2011, 2011, 137328. [Google Scholar] [CrossRef]
  13. Li, X.; Yang, X.; Zhang, J.; Huang, Y.; Liu, B. In Situ/Operando Techniques for Characterization of Single-Atom Catalysts. ACS Catal. 2019, 9, 2521–2531. [Google Scholar] [CrossRef]
  14. Leofanti, G.; Tozzola, G.; Padovan, M.; Petrini, G.; Bordiga, S.; Zecchina, A. Catalyst Characterization: Characterization Techniques. Catal. Today 1997, 34, 307–327. [Google Scholar] [CrossRef]
  15. Alsawalha, M. Characterization of Acidic and Basic Properties of Heterogeneous Catalysts by Test Reactions. Ph.D. Thesis, Universität Oldenburg, Oldenburg, Germany, 2004. [Google Scholar]
  16. Zhao, S.; Li, Y.; Stavitski, E.; Tappero, R.; Crowley, S.; Castaldi, M.J.; Zakharov, D.N.; Nuzzo, R.G.; Frenkel, A.I.; Stach, E.A. Operando Characterization of Catalysts through Use of a Portable Microreactor. ChemCatChem 2015, 7, 3683–3691. [Google Scholar] [CrossRef]
  17. Sytnyk, M.; Kirchschlager, R.; Bodnarchuk, M.I.; Primetzhofer, D.; Kriegner, D.; Enser, H.; Stangl, J.; Bauer, P.; Voith, M.; Hassel, A.W.; et al. Tuning the Magnetic Properties of Metal Oxide Nanocrystal Heterostructures by Cation Exchange. Nano Lett. 2013, 13, 586–593. [Google Scholar] [CrossRef] [PubMed]
  18. Mourdikoudis, S.; Pallares, R.M.; Thanh, N.T.K. Characterization Techniques for Nanoparticles: Comparison and Complementarity upon Studying Nanoparticle Properties. Nanoscale 2018, 10, 12871–12934. [Google Scholar] [CrossRef]
  19. Ludwig, F.; Heim, E.; Schilling, M. Characterization of Superparamagnetic Nanoparticles by Analyzing the Magnetization and Relaxation Dynamics Using Fluxgate Magnetometers. J. Appl. Phys. 2007, 101, 113909. [Google Scholar] [CrossRef]
  20. Ludwig, F.; Heim, E.; Eberbeck, D.; Schwarz, K.; Trahms, L.; Schilling, M. Comparison and Calibration of Fluxgate and Squid Magnetorelaxometry Techniques for the Characterization of Magnetic Core-Shell Nanoparticles. IEEE Trans. Magn. 2009, 45, 4857–4860. [Google Scholar] [CrossRef]
  21. Suturin, S.M.; Fedorov, V.V.; Korovin, A.M.; Valkovskiy, G.A.; Tabuchi, M.; Sokolov, N.S. Controllable CaF2 Nanosized Stripe Arrays on Si(001) Studied by X-ray and Electron Diffraction. Surfaces 2021, 4, 97–105. [Google Scholar] [CrossRef]
  22. Sauceda-Oloño, P.Y.; Cardenas-Sanchez, H.; Argüelles-Pesqueira, A.I.; Gutierrez-Valenzuela, C.; Alvarez-Ramos, M.E.; Lucero-Acuña, A.; Zavala-Rivera, P. Micelle Encapsulation of Ferromagnetic Nanoparticles of Iron Carbide@Iron Oxide in Chitosan as Possible Nanomedicine Agent. Colloids Interfaces 2020, 4, 22. [Google Scholar] [CrossRef]
  23. Connord, V.; Mehdaoui, B.; Tan, R.P.; Carrey, J.; Respaud, M. An Air-Cooled Litz Wire Coil for Measuring the High Frequency Hysteresis Loops of Magnetic Samples—A Useful Setup for Magnetic Hyperthermia Applications. Rev. Sci. Instrum. 2014, 85, 093904. [Google Scholar] [CrossRef] [PubMed]
  24. Lee, E.L.; Sabatka, J.A.; Selwood, P.W. The Mechanism of Chemisorption: Hydrogen on Nickel. II. J. Am. Chem. Soc. 1957, 79, 5391–5397. [Google Scholar] [CrossRef]
  25. You, A.; Be, M.A.Y.; In, I. Magnetic Balance for Ferromagnetism. Rev. Sci. Instrum. 2004, 33, 417–422. [Google Scholar]
  26. Tsakoumis, N.; Baklezos, A.T.; Vardiambasis, I.O.; Kapetanakis, T.N.; Nikolopoulos, C.D. Fluxgate Configuration for Obtaining Magnetic Properties of Catalytic Nanoparticles: A Feasibility Study. In Proceedings of the 2020 IEEE International Instrumentation and Measurement Technology Conference (I2MTC), Dubrovnik, Croatia, 25–28 May 2020. [Google Scholar]
  27. Dieckhoff, J.; Schilling, M.; Ludwig, F. Fluxgate Based Detection of Magnetic Nanoparticle Dynamics in a Rotating Magnetic Field. Appl. Phys. Lett. 2011, 99, 14–17. [Google Scholar] [CrossRef]
  28. Schrittwieser, S.; Schotter, J.; Maier, T.; Bruck, R.; Muellner, P.; Kataeva, N.; Soulantika, K.; Ludwig, F.; Huetten, A.; Brueckl, H. Homogeneous Biosensor Based on Optical Detection of the Rotational Dynamics of Anisotropic Nanoparticles. Procedia Eng. 2010, 5, 1107–1110. [Google Scholar] [CrossRef]
  29. Saari, M.M.; Ishihara, Y.; Tsukamoto, Y.; Kusaka, T.; Morita, K.; Sakai, K.; Kiwa, T.; Tsukada, K. Optimization of an AC/DC High-Tc SQUID Magnetometer Detection Unit for Evaluation of Magnetic Nanoparticles in Solution. IEEE Trans. Appl. Supercond. 2015, 25, 10–13. [Google Scholar] [CrossRef]
  30. Ludwig, F.; Balceris, C.; Jonasson, C.; Johansson, C. Analysis of AC Susceptibility Spectra for the Characterization of Magnetic Nanoparticles. IEEE Trans. Magn. 2017, 53, 6100904. [Google Scholar] [CrossRef]
  31. Enpuku, K.; Tanaka, T.; Tamai, Y.; Dang, F.; Enomoto, N.; Hojo, J.; Kanzaki, H.; Usuki, N. Size Distribution of Magnetic Marker Estimated from Ac Susceptibility in Solution for Biosensor Application. Jpn. J. Appl. Phys. 2008, 47, 7859–7865. [Google Scholar] [CrossRef]
  32. Guillaume, A.; Ludwig, F.; Scholtyssek, J.M.; Schilling, M. Field Stability of a Directly Coupled High-T\rm c Squid Design Regarding Mrx Measurements. IEEE Trans. Appl. Supercond. 2013, 23, 1600505. [Google Scholar] [CrossRef]
  33. Tafur, J.; Herrera, A.P.; Rinaldi, C.; Juan, E.J. Development and Validation of a 10 KHz–1 MHz Magnetic Susceptometer with Constant Excitation Field. J. Appl. Phys. 2012, 111, 07E349. [Google Scholar] [CrossRef]
  34. Saari, M.M.; Sulaiman, M.H.; Ahmad, H.; Lah, N.A.C.; Sakai, K.; Kiwa, T.; Tsukada, K. A Benchtop Induction-Based AC Magnetometer for a Fast Characterization of Magnetic Nanoparticles. Eng. Res. Express 2022, 4, 025047. [Google Scholar] [CrossRef]
  35. Ahrentorp, F.; Astalan, A.P.; Jonasson, C.; Blomgren, J.; Qi, B.; Mefford, O.T.; Yan, M.; Courtois, J.; Berret, J.F.; Fresnais, J.; et al. Sensitive High Frequency AC Susceptometry in Magnetic Nanoparticle Applications. AIP Conf. Proc. 2010, 1311, 213–223. [Google Scholar] [CrossRef]
  36. Saari, M.M.; Hadi Putera Zaini, M.A.; Ahmad, H.; Che Lah, N.A. An AC Magnetometer Using Automatic Frequency Switching of a Resonant Excitation Coil for Magnetic Nanoparticles Characterization. In Proceedings of the 2018 9th IEEE Control and System Graduate Research Colloquium (ICSGRC), Shah Alam, Malaysia, 3–4 August 2018; pp. 207–210. [Google Scholar] [CrossRef]
  37. Denouala, M.; Saeza, S.; Kauffmanb, F.; Dolabdjiana, C. Magnetorelaxometry Using Improved Giant Magneto Resistance Magnetometer. Sens. Actuators A Phys. 2010, 159, 184–188. [Google Scholar] [CrossRef]
  38. Liu, P.; Skucha, K.; Megens, M.; Boser, B. A CMOS Hall-Effect Sensor for the Characterization and Detection of Magnetic Nanoparticles for Biomedical Applications. IEEE Trans. Magn. 2011, 47, 3449–3451. [Google Scholar] [CrossRef] [PubMed]
  39. Besse, P.A.; Boero, G.; Demierre, M.; Pott, V.; Popovic, R. Detection of a Single Magnetic Microbead Using a Miniaturized Silicon Hall Sensor. Appl. Phys. Lett. 2002, 80, 4199–4201. [Google Scholar] [CrossRef]
  40. Florescu, O.; Mattmann, M.; Boser, B. Fully Integrated Detection of Single Magnetic Beads in Complementary Metal-Oxide-Semiconductor. J. Appl. Phys. 2008, 103, 17–20. [Google Scholar] [CrossRef]
  41. Schambach, J.; Warzemann, L.; Weber, P. SQUID Gradiometer Measurement System for Magnetorelaxometry in a Disturbed Environment. IEEE Trans. Appl. Supercond. 1999, 9, 3527–3530. [Google Scholar] [CrossRef]
  42. Ludwig, F.; Mäuselein, S.; Heim, E.; Schilling, M. Magnetorelaxometry of Magnetic Nanoparticles in Magnetically Unshielded Environment Utilizing a Differential Fluxgate Arrangement. Rev. Sci. Instrum. 2005, 76, 106102. [Google Scholar] [CrossRef]
  43. Kötitz, R.; Weitschies, W.; Trahms, L.; Brewer, W.; Semmler, W. Determination of the Binding Reaction between Avidin and Biotin by Relaxation Measurements of Magnetic Nanoparticles. J. Magn. Magn. Mater. 1999, 194, 62–68. [Google Scholar] [CrossRef]
  44. Chemla, Y.R.; Grossman, H.L.; Poon, Y.; McDermott, R.; Stevens, R.; Alper, M.D.; Clarke, J. Ultrasensitive Magnetic Biosensor for Homogeneous Immunoassay. Proc. Natl. Acad. Sci. USA 2000, 97, 14268–14272. [Google Scholar] [CrossRef]
  45. Ruehmer, D.; Heim, E.; Hirsch, A.; Piel, R.; Wawrzik, T.; Ludwig, F.; Schilling, M. Magnetic Relaxation Imaging with a Fluxgate Sensor Scanner. In Proceedings of the SENSOR+TEST Conferences 2009, Braunschweig, Germany, 26–28 May 2009; pp. 29–33. [Google Scholar]
  46. Gradiometers, D.; Büttner, M.; Schmidl, F.; Schiffler, M.; Seidel, P. Magnetorelaxation (MRX) Measurements with DC-SQUID Gradiometers. IEEE Trans. Appl. Supercond. 2011, 21, 473–476. [Google Scholar]
  47. Ludwig, F.; Heim, E.; Mäuselein, S.; Eberbeck, D.; Schilling, M. Magnetorelaxometry of Magnetic Nanoparticles with Fluxgate Magnetometers for the Analysis of Biological Targets. J. Magn. Magn. Mater. 2005, 293, 690–695. [Google Scholar] [CrossRef]
  48. Knopke, C.; Wiekhorst, F.; Eberbeck, D.; Gemeinhardt, I.; Ebert, M.; Schnorr, J.; Wagner, S.; Taupitz, M.; Trahms, L. Quantification of Magnetic Nanoparticle Uptake in Cells by Temperature Dependent Magnetorelaxometry. IEEE Trans. Magn. 2013, 49, 421–424. [Google Scholar] [CrossRef]
  49. Alvarez-Botero, G.; Lobato-Morales, H.; Hui, K.; Tarabay, N.; Sanchez-Vargas, J.; Velez, C.; Mendez-Jeronimo, G. Magneto-Dielectric Composites Characterization Using Resonant Sensor and Neural Network Modeling. IEEE Microw. Wirel. Technol. Lett. 2024, 34, 447–450. [Google Scholar] [CrossRef]
  50. Zappia, S.; Scapaticci, R.; Lodi, M.B.; Fanti, A.; Ruello, G.; Crocco, L.; Catapano, I. Nondestructive Characterization of Magnetic Polymeric Scaffolds Using Terahertz Time-of-Flight Imaging. IEEE Trans. Terahertz Sci. Technol. 2023, 13, 305–315. [Google Scholar] [CrossRef]
  51. Jani, M.; Czarnecka, P.; Orzechowska, Z.; Mrózek, M.; Gawlik, W.; Wojciechowski, A.M. Sensing of Magnetic-Field Gradients with Nanodiamonds on Optical Glass-Fiber Facets. ACS Appl. Nano Mater. 2023, 6, 11077–11084. [Google Scholar] [CrossRef]
  52. Drake, P.; Algaddafi, A.; Swift, T.; Abd-Alhameed, R.A. Design and Modelling of an Induction Heating Coil to Investigate the Thermal Response of Magnetic Nanoparticles for Hyperthermia Applications. BioMedInformatics 2024, 4, 1006–1018. [Google Scholar] [CrossRef]
  53. Chen, D.; Wen, Y.; Li, P.; Wang, Y. Dynamic Magnetic Excitation Detection Method for Low-Concentration Superparamagnetic Particles via Quartz Crystal Microbalance. IEEE Sens. J. 2022, 22, 22495–22502. [Google Scholar] [CrossRef]
  54. Guo, J.H.; Wang, W.; Dong, L.P.; Li, X.H.; Guo, Z.L.; Du, X.Z.; Zhang, J.Y. Highly Sensitive Magnetic Field Sensor Based on Few Mode Fiber Interferometry. IEEE Sens. J. 2024, 24, 16179–16187. [Google Scholar] [CrossRef]
  55. Yan, X.; Li, H.; Fu, R.; Hu, T.; Zhao, Y.; Wei, L.; Tang, H.; Cheng, T. Highly Sensitive Magnetic Field Sensors Based on a D-Type Fiber with Bi2O2Se Film. IEEE Sens. J. 2023, 23, 30293–30301. [Google Scholar] [CrossRef]
  56. Xu, R.; Xu, Y.; Luo, B.; Zhang, X.; Wei, Y.; Liu, H.; Deng, H.; Yuan, L. Vector Magnetic Field Sensing Characteristics of the Magnetofluid-Encapsulated Polarization-Maintaining Fiber Single-End Offset Fusion Spliced Hollow-Core Fiber Structure. IEEE Sens. J. 2024, 24, 10144–10155. [Google Scholar] [CrossRef]
  57. Koshev, N.; Kapralov, P.; Evstigneeva, S.; Leontyev, A.; Lutsenko, O.; Zharkov, M.; Pyataev, N.; Darwish, A.; Timin, A.; Ostras, M.; et al. YIG-Based Sensor System for Millisecond Time Range Magnetorelaxometry. IEEE Trans. Biomed. Eng. 2023, 71, 1640–1650. [Google Scholar] [CrossRef] [PubMed]
  58. Tsukada, K.; Morita, K.; Matsunaga, Y.; Saari, M.M.; Sakai, K.; Kiwa, T. Hybrid Type HTS-SQUID Magnetometer with Vibrating and Rotating Sample. IEEE Trans. Appl. Supercond. 2016, 26, 1601405. [Google Scholar] [CrossRef]
  59. Zhou, X.; Huang, C.C.; Hall, D.A. Giant Magnetoresistive Biosensor Array for Detecting Magnetorelaxation. IEEE Trans. Biomed. Circuits Syst. 2017, 11, 755–764. [Google Scholar] [CrossRef] [PubMed]
  60. Araujo, J.F.D.F.; Vieira, D.R.P.; Osorio, F.; Pöttker, W.E.; La Porta, F.A.; de la Presa, P.; Perez, G.; Bruno, A.C. Versatile Hall Magnetometer with Variable Sensitivity Assembly for Characterization of the Magnetic Properties of Nanoparticles. J. Magn. Magn. Mater. 2019, 489, 165431. [Google Scholar] [CrossRef]
  61. Blachowicz, T.; Kola, I.; Ehrmann, A.; Guenther, K.; Ehrmann, G. Magnetic Micro and Nano Sensors for Continuous Health Monitoring. Micro 2024, 4, 206–228. [Google Scholar] [CrossRef]
  62. Caruso, M.J.; Bratland, T.; Smith, C.H.; Schneider, R. A New Perspective on Magnetic Field Sensing. Sensors 1998, 15, 34–46. [Google Scholar]
  63. Dalmon, J. Magnetic Measurements and Catalysis. In Catalyst Characterization. Fundamental and Applied Catalysis; Springer: Boston, MA, USA, 1994; pp. 585–609. [Google Scholar]
  64. Chernavskii, P.A.; Pankina, G.V.; Lunin, V. V Magnetometric Methods of Investigation of Supported Catalysts. Russ. Chem. Rev. 2011, 80, 579–604. [Google Scholar] [CrossRef]
  65. Kishimoto, M.; Miyamoto, R.; Oda, T.; Ohara, Y.; Yanagihara, H.; Ohkohchi, N.; Kita, E. Measurement of Intravenously Administered γ-Fe2O3 Particle Amount in Mice Tissues Using Vibrating Sample Magnetometer. IEEE Trans. Nanobioscience 2014, 13, 425–430. [Google Scholar] [CrossRef]
  66. Visscher, M.; Pouw, J.J.; Van Baarlen, J.; Klaase, J.M.; Haken, B. Ten Quantitative Analysis of Superparamagnetic Contrast Agent in Sentinel Lymph Nodes Using Ex Vivo Vibrating Sample Magnetometry. IEEE Trans. Biomed. Eng. 2013, 60, 2594–2602. [Google Scholar] [CrossRef]
  67. Martirosyan, K.S.; Chang, L.; Rantschler, J.; Khizroev, S.; Luss, D.; Litvinov, D. Carbon Combustion Synthesis and Magnetic Properties of Cobalt Ferrite Nanoparticles. IEEE Trans. Magn. 2007, 43, 3118–3120. [Google Scholar] [CrossRef]
  68. Kubisztal, M.; Kubisztal, J.; Karolus, M.; Prusik, K.; Haneczok, G. Collective Superspin Glass State of Interacting Cobalt Ferrite Nanoparticles. IEEE Trans. Magn. 2019, 55, 2301306. [Google Scholar] [CrossRef]
  69. Gao, C.Y.; Lu, Q.; Choi, H.J. Effect of Magnetic Nanoparticle Additive on Viscoelastic Behaviors of Carbonyl Iron-Based Magnetorheological Suspension. IEEE Trans. Magn. 2018, 54, 54–57. [Google Scholar] [CrossRef]
  70. Halvaee, P.; Dehghani, S.; Hoghoghifard, S. Low Temperature Methanol Sensors Based on Cobalt Ferrite Nanoparticles, Nanorods, and Porous Nanoparticles. IEEE Sens. J. 2020, 20, 4056–4062. [Google Scholar] [CrossRef]
  71. Tsolakis, A.; Halevas, E.; Gounari, E.; Koliakos, G.; Salifoglou, A.; Litsardakis, G. Magnetic Fluorescent Nanoparticles Binding to Beta-Amyloid: Silica Coated, Thioflavin-T Functionalized Iron Oxide. In Proceedings of the 2017 IEEE International Magnetics Conference (INTERMAG), Dublin, Ireland, 24–28 April 2017; Volume 53, pp. 3–6. [Google Scholar] [CrossRef]
  72. Farhana, M.; Ariffin, K.; Idris, A.; Hasrul, N.; Ngadiman, A. Optimization of one-pot microwave-assisted ferrofluid nanoparticles synthesis using response surface methodology. IEEE Trans. Magn. 2018, 54, 3200606. [Google Scholar]
  73. Liao, S.H.; Huang, H.S.; Su, Y.K. Scaling Characteristics of the Magnetization Increments of Functionalized Nanoparticles Determined Using a Vibrating Sample Magnetometer for Liquid Magnetic Immunoassays. IEEE Sens. J. 2019, 19, 8990–8994. [Google Scholar] [CrossRef]
  74. Nanocrystals, Z.N.O.; Gabal, M.A.; Kosa, S.; Mutairi, T.S. Sucrose-assisted combustion synthesis and characterization of Zn-substituted NiFe2O4 nanocrystals. IEEE Trans Magn. 2016, 52, 2400104. [Google Scholar]
  75. Li, L.; Mak, K.Y.; Leung, C.W.; Chan, K.Y.; Chan, W.K.; Zhong, W.; Pong, P.W.T. Synthesis and Characterization of Self-Assembled Monolayer and Bilayer Carboxyl-Group Functionalized Magnetic Nanoparticles. IEEE Trans. Magn. 2012, 48, 3299–3302. [Google Scholar] [CrossRef]
  76. Photoemission, B.O. A Subfemtotesla Multichannel Atomic Magnetometer. Nature 2003, 422, 596–599. [Google Scholar]
  77. Ruan, Y.; He, X.; Ruan, L.; Liu, F.; Zhang, Z.; Weng, J.; Yan, Q.; Zhang, G.; Li, K.; Zheng, W.; et al. Drug Monitoring by Optically Pumped Atomic Magnetometer. IEEE Photonics J. 2022, 14, 3134305. [Google Scholar] [CrossRef]
  78. Baffa, O.; Matsuda, R.H.; Arsalani, S.; Prospero, A.; Miranda, J.R.A.; Wakai, R.T. Development of an Optical Pumped Gradiometric System to Detect Magnetic Relaxation of Magnetic Nanoparticles. J. Magn. Magn. Mater. 2019, 475, 533–538. [Google Scholar] [CrossRef]
  79. Tang, J.; Zhai, Y.; Cao, L.; Zhang, Y.; Li, L.; Zhao, B.; Zhou, B.; Han, B.; Liu, G. High-Sensitivity Operation of a Single-Beam Atomic Magnetometer for Three-Axis Magnetic Field Measurement. Opt. Express 2021, 29, 15641. [Google Scholar] [CrossRef] [PubMed]
  80. Zhao, B.; Tang, J.; Yang, H.; Li, L.; Zhang, Y.; Liu, Y.; Zhai, Y. High-Sensitivity Pump–Probe Atomic Magnetometer Based on Single Fiber-Coupled. Opt. Laser Technol. 2023, 159, 109025. [Google Scholar] [CrossRef]
  81. Oelsner, G.; Ijsselsteijn, R.; Scholtes, T.; Krüger, A.; Schultze, V.; Seyffert, G.; Werner, G.; Jäger, M.; Chwala, A.; Stolz, R. Integrated Optically Pumped Magnetometer for Measurements within Earth’s Magnetic Field. Phys. Rev. Appl. 2022, 17, 024034. [Google Scholar] [CrossRef]
  82. Lebedev, V.; Hartwig, S.; Middelmann, T. Fast and Robust Optically Pumped Cesium Magnetometer. Adv. Opt. Technol. 2020, 9, 275–286. [Google Scholar] [CrossRef]
  83. Jaufenthaler, A.; Schier, P.; Middelmann, T.; Liebl, M.; Wiekhorst, F.; Baumgarten, D. Quantitative 2D Magnetorelaxometry Imaging of Magnetic Nanoparticles Using Optically Pumped Magnetometers. Sensors 2020, 20, 753. [Google Scholar] [CrossRef] [PubMed]
  84. Johnson, C.; Adolphi, N.L.; Butler, K.L.; Lovato, D.M.; Larson, R.; Schwindt, P.D.D.; Flynn, E.R. Magnetic Relaxometry with an Atomic Magnetometer and SQUID Sensors on Targeted Cancer Cells. J. Magn. Magn. Mater. 2012, 324, 2613–2619. [Google Scholar] [CrossRef] [PubMed]
  85. Piepgras, R.; Michlmayr, S.; Egger, J.; Zagar, B.G. Measurement of Magnetic Microstructures with a Faraday Rotation Magnetometer. In Proceedings of the 2020 IEEE International Instrumentation and Measurement Technology Conference (I2MTC), Dubrovnik, Croatia, 25–28 May 2020; pp. 1–5. [Google Scholar] [CrossRef]
  86. Yang, Y.; Chen, J.; Peng, X.; Guo, H. Amplitude Dependence on Probe Frequency Detuning in Faraday-Rotation Alkali Atomic Magnetometers. In Proceedings of the 2019 Joint Conference of the IEEE International Frequency Control Symposium and European Frequency and Time Forum (EFTF/IFC), Orlando, FL, USA, 14–18 April 2019; pp. 7–8. [Google Scholar] [CrossRef]
  87. Li, W.; Lin, P.; Peng, X.; Guo, H. The Optimized Probe Light Frequency Detuning for Faraday-Rotation Cesium Atomic Magnetometer. Opt. InfoBase Conf. Pap. 2014, 2, 2–3. [Google Scholar] [CrossRef]
  88. Rostami, K.R.; Nikitin, I.P. High-Sensitivity Two-Stage Hall Magnetometer with Enhanced Linearity and Spatial Resolution. Meas. J. Int. Meas. Confed. 2020, 153, 107423. [Google Scholar] [CrossRef]
  89. Volmer, M.; Avram, M. On Magnetic Nanoparticles Detection Using Planar Hall Effect Sensors. In Proceedings of the International Semiconductor Conference, CAS, Sinaia, Romania, 15–17 October 2012. [Google Scholar]
  90. Arajo, J.F.D.F.; Bruno, A.C.; Carvalho, H.R. Characterization of Magnetic Nanoparticles by a Modular Hall Magnetometer. J. Magn. Magn. Mater. 2010, 322, 2806–2809. [Google Scholar] [CrossRef]
  91. Araujo, J.F.D.F.; Costa, M.C.; Louro, S.R.W.; Bruno, A.C. A Portable Hall Magnetometer Probe for Characterization of Magnetic Iron Oxide Nanoparticles. J. Magn. Magn. Mater. 2017, 426, 159–162. [Google Scholar] [CrossRef]
  92. Lozanova, S.; Noykov, S.; Roumenin, C. A Novel 3-D Hall Magnetometer Using Subsequent Measurement Method. Sens. Actuators A Phys. 2009, 153, 205–211. [Google Scholar] [CrossRef]
  93. Xu, J.; Li, Q.; Gao, X.Y.; Leng, F.F.; Lu, M.; Guo, P.Z.; Zhao, G.X.; Li, S.D. Detection of the Concentration of MnFe2O4 Magnetic Microparticles Using Giant Magnetoresistance Sensors. IEEE Trans. Magn. 2016, 52, 5200204. [Google Scholar] [CrossRef]
  94. Park, J. Superparamagnetic Nanoparticle Quantification Using a Giant Magnetoresistive Sensor and Permanent Magnets. J. Magn. Magn. Mater. 2015, 389, 56–60. [Google Scholar] [CrossRef]
  95. Nurpriyanti, I.; Pardede, I.; Suharyadi, E.; Kato, T.; Iwata, S. Detection of Fe3O4 Magnetic Nanoparticles Using Giant Magnetoresistance (GMR) Sensor Based on Multilayer and Spin Valve Thin Films by Wheatstone Bridge Circuit. In Proceedings of the 2016 International Seminar on Sensors, Instrumentation, Measurement and Metrology (ISSIMM), Malang, Indonesia, 10–11 August 2016; pp. 32–36. [Google Scholar] [CrossRef]
  96. Li, L.; Mak, K.Y.; Leung, C.W.; Ng, S.M.; Lei, Z.Q.; Pong, P.W.T. Detection of 10-Nm Superparamagnetic Iron Oxide Nanoparticles Using Exchange-Biased GMR Sensors in Wheatstone Bridge. IEEE Trans. Magn. 2013, 49, 4056–4059. [Google Scholar] [CrossRef]
  97. Shen, H.M.; Hu, L.; Fu, X. Integrated Giant Magnetoresistance Technology for Approachable Weak Biomagnetic Signal Detections. Sensors 2018, 18, 148. [Google Scholar] [CrossRef] [PubMed]
  98. Carr, C.; Matlachov, A.N.; Sandin, H.; Espy, M.A.; Kraus, R.H. Magnetic Sensors for Bioassay: HTS SQUIDs or GMRs? IEEE Trans. Appl. Supercond. 2007, 17, 808–811. [Google Scholar] [CrossRef]
  99. Krishna, V.D.; Wu, K.; Perez, A.M.; Wang, J.P. Giant Magnetoresistance-Based Biosensor for Detection of Influenza A Virus. Front. Microbiol. 2016, 7, 400. [Google Scholar] [CrossRef]
  100. Esposito, E.; Granata, C.; Russo, M.; Russo, R.; Vettoliere, A. High Sensitive Magnetic Nanosensors Based on Superconducting Quantum Interference Device. IEEE Trans. Magn. 2013, 49, 140–143. [Google Scholar] [CrossRef]
  101. Pelizzone, M.; Treyvaud, A. A SQUID Susceptometer for Fields up to 8.5 Tesla. Appl. Phys. 1981, 24, 375–379. [Google Scholar] [CrossRef]
  102. Tan, I.C.; Brazdeikis, A. Novel Biomagnetic Sensing Technique for Characterization of Inflammatory Tissues. IEEE Trans. Magn. 2007, 43, 2409–2411. [Google Scholar] [CrossRef]
  103. Wang, J.; Li, H.; Cho, E.Y.; Lefebvere, J.C.; Cybart, S.A. Measurement of Magnetic Nanoparticles Using High Transition Temperature Superconducting Quantum Interference Devices. IEEE Trans. Appl. Supercond. 2019, 29, 14–17. [Google Scholar] [CrossRef]
  104. Saari, M.M.; Takagi, R.; Kusaka, T.; Ishihara, Y.; Tsukamoto, Y.; Sakai, K.; Kiwa, T.; Tsukada, K. Development of Integrated AC-DC Magnetometer Using High-Tc SQUID for Magnetic Properties Evaluation of Magnetic Nanoparticles in Solution. J. Phys. Conf. Ser. 2014, 507, 042035. [Google Scholar] [CrossRef]
  105. Saari, M.M.; Sakai, K.; Kiwa, T.; Tsukada, K. Optimization of the Detection Technique for a Vibrating-Sample Magnetometer Using High-Tc SQUID. IEEE Trans. Appl. Supercond. 2012, 23, 1600204. [Google Scholar] [CrossRef]
  106. Carvalho, H.R.; Bruno, A.C. A Compact SQUID Magnetometer for Thermoremanent Magnetization Immunoassays. IEEE Trans. Appl. Supercond. 2011, 21, 481–484. [Google Scholar] [CrossRef]
  107. Romanus, E.; Berkov, D.V.; Prass, S.; Groß, C.; Weitschies, W.; Weber, P. Determination of Energy Barrier Distributions of Magnetic Nanoparticles by Temperature Dependent Magnetorelaxometry. Nanotechnology 2003, 14, 1251–1254. [Google Scholar] [CrossRef] [PubMed]
  108. Grossman, H.L.; Myers, W.R.; Vreeland, V.J.; Bruehl, R.; Alper, M.D.; Bertozzi, C.R.; Clarke, J. Detection of Bacteria in Suspension by Using a Superconducting Quantum Interference Device. Proc. Natl. Acad. Sci. USA 2004, 101, 129–134. [Google Scholar] [CrossRef]
  109. Wernsdorfer, W.; Hasselbach, K.; Mailly, D.; Barbara, B.; Benoit, A.; Thomas, L.; Suran, G. DC-SQUID Magnetization Measurements of Single Magnetic Particles. J. Magn. Magn. Mater. 1995, 145, 33–39. [Google Scholar] [CrossRef]
  110. Elrefai, A.L.; Sasada, I.; Yoshida, T. Fluxgate Gradiometer for Magnetic Nanoparticle Magnetorelaxometry in Unshielded Environment. In Proceedings of the 2015 IEEE International Magnetics Conference (INTERMAG), Beijing, China, 11–15 May 2015. [Google Scholar] [CrossRef]
  111. Dantsker, E.; Tanaka, S.; Nilsson, P.Å.; Kleiner, R.; Clarke, J. Reduction of 1/f Noise in High-Tc Dc Superconducting Quantum Interference Devices Cooled in an Ambient Magnetic Field. Appl. Phys. Lett. 1996, 69, 4099–4101. [Google Scholar] [CrossRef]
  112. Koch, R.H.; Sun, J.Z.; Foglietta, V.; Gallagher, W.J. Flux Dam, a Method to Reduce Extra Low Frequency Noise When a Superconducting Magnetometer Is Exposed to a Magnetic Field. Appl. Phys. Lett. 1995, 67, 709. [Google Scholar] [CrossRef]
  113. Cho, H.M.; Andresen, Y.T.; Clarke, J.; Dilorio, M.S.; Yang, K.Y.; Yoshizumi, S. Low-Frequency Noise in High-Transition-Temperature Superconducting Multilayer Magnetometers in Ambient Magnetic Fields. Appl. Phys. Lett. 2001, 79, 2438–2440. [Google Scholar] [CrossRef]
  114. Krey, S.; Barthelmess, H.J.; Schilling, M. Low-Frequency Noise and Linearity of a YBa2Cu3O7 Dc Superconducting Quantum Interference Device Magnetometer in Static Magnetic Fields. J. Appl. Phys. 1999, 86, 6602–6604. [Google Scholar] [CrossRef]
  115. Ludwig, F.; Drung, D. Low-Frequency Noise of Improved Direct-Coupled High-Tc Superconducting Quantum Interference Device Magnetometers in Ac and Dc Magnetic Fields. Appl. Phys. Lett. 1999, 75, 2821–2823. [Google Scholar] [CrossRef]
  116. Anderson, W.H.; Flynn, E.R.; Karaulanov, T.; Matlashov, A.N.; Nettles, C.; Radigan, W. Comparison of Axial Wire-Wound and Planar Thin-Film SQUID-Based Gradiometers for Super-Paramagnetic Relaxometry Measurements. IEEE Trans. Appl. Supercond. 2017, 27, 22–25. [Google Scholar] [CrossRef]
  117. Isshiki, R.; Nakamura, Y.; Takeuchi, S.; Hirata, T.; Sakai, K.; Kiwa, T.; Tsukada, K. Evaluation of the Magnetization Properties of Magnetic Nanoparticles in Serum Using HTS-SQUID. IEEE Trans. Appl. Supercond. 2018, 28, 1600605. [Google Scholar] [CrossRef]
  118. Kiwa, T.; Morita, K.; Matsunaga, Y.; Saari, M.M.; Sakai, K.; Tsukada, K. High-Resolution Laser-Assisted Magnetic Nanoparticle Imaging Using a High-TC SQUID Magnetometer. IEEE Trans. Appl. Supercond. 2017, 27, 1601804. [Google Scholar] [CrossRef]
  119. Carvalho, H.R.; Bruno, A.C.; Anderson, W.H.; Flynn, E.R.; Karaulanov, T.; Matlashov, A.N.; Nettles, C.; Radigan, W.; Isshiki, R.; Nakamura, Y.; et al. Measurement of Magnetic Nanoparticles by Small HTS SQUID Array. IEEE Trans. Appl. Supercond. 2013, 49, 10–13. [Google Scholar] [CrossRef]
  120. Cho, E.Y.; Li, H.; Lefebvre, J.C.; Zhou, Y.W.; Dynes, R.C.; Cybart, S.A. Direct-Coupled Micro-Magnetometer with Y-Ba-Cu-O Nano-Slit SQUID Fabricated with a Focused Helium Ion Beam. Appl. Phys. Lett. 2018, 113, 162602. [Google Scholar] [CrossRef]
  121. Hrakova, D.; Ripka, P.; Laposa, A.; Novotny, D.; Kroutil, J.; Povolný, V.; Kaman, O.; Veverka, P. Inkjet-Printed Mn-Zn Ferrite Nanoparticle Core for Fluxgate. J. Magn. Magn. Mater. 2022, 563, 170003. [Google Scholar] [CrossRef]
  122. Al-Milaji, K.N.; Hadimani, R.L.; Gupta, S.; Pecharsky, V.K.; Zhao, H. Inkjet Printing of Magnetic Particles Toward Anisotropic Magnetic Properties. Sci. Rep. 2019, 9, 16261. [Google Scholar] [CrossRef] [PubMed]
  123. Kennedy, J.; Leveneur, J.; Turner, J.; Futter, J.; Williams, G.V.M. Applications of Nanoparticle-Based Fluxgate Magnetometers for Positioning and Location. In Proceedings of the 2014 IEEE Sensors Applications Symposium (SAS), Queenstown, New Zealand, 18–20 February 2014; pp. 228–232. [Google Scholar] [CrossRef]
  124. Karo, H.; Sasada, I. Superparamagnetic Nanoparticle Detection System by Using a Fundamental Mode Orthogonal Fluxgate (FM-OFG) Gradiometer. AIP Adv. 2017, 7, 056716. [Google Scholar] [CrossRef]
  125. Macharet, D.G.; Perez-Imaz, H.I.A.; Rezeck, P.A.F.; Potje, G.A.; Benyosef, L.C.C.; Wiermann, A.; Freitas, G.M.; Garcia, L.G.U.; Campos, M.F.M. Autonomous Aeromagnetic Surveys Using a Fluxgate Magnetometer. Sensors 2016, 16, 2169. [Google Scholar] [CrossRef] [PubMed]
  126. Zhou, X.; Zeng, T. Faint Magnetic Field Measurement Based on Fluxgate Sensor. In Proceedings of the 2017 First International Conference on Electronics Instrumentation & Information Systems (EIIS), Harbin, China, 3–5 June 2017; pp. 1–4. [Google Scholar] [CrossRef]
  127. Ficko, B.W.; Nadar, P.M.; Hoopes, P.J.; Diamond, S.G. Development of a Magnetic Nanoparticle Susceptibility Magnitude Imaging Array. Phys. Med. Biol. 2014, 59, 1047–1071. [Google Scholar] [CrossRef] [PubMed]
  128. Dieckhoff, J.H.; Yoshida, T.; Enpuku, K.; Schilling, M.; Ludwig, F. Homogeneous Bioassays Based on the Manipulation of Magnetic Nanoparticles by Rotating and Alternating Magnetic FieldsA Comparison. IEEE Trans. Magn. 2012, 48, 3792–3795. [Google Scholar] [CrossRef]
  129. Sebbes, P.; Ludwig, F.; Schilling, M. Fluxgate Magnetometer for Temperatures up to 180 °C. J. Electr. Eng. 2013, 61, 21–23. [Google Scholar]
  130. Barmpatza, A.C.; Baklezos, A.T.; Vardiambasis, I.O.; Nikolopoulos, C.D. Estimation of the Magnetic Signature of Ferromagnetic Nanoparticles by Earth’s Magnetic Field. IEEE Access 2023, 11, 14832–14840. [Google Scholar] [CrossRef]
  131. Baklezos, A.T.; Nikolopoulos, C.D.; Spantideas, S.T.; Chatzineofytou, E.G.; Nicoletto, M.; Marziali, I.; Boschetti, D.; Capsalis, C.N. Steady State Emissions Modeling of Low Frequency Magnetic and Electric Fields Generated by GOCE CDMU. In Proceedings of the 2019 ESA Workshop on Aerospace EMC (Aerospace EMC), Budapest, Hungary, 20–22 May 2019. [Google Scholar]
Figure 1. Schematic diagram that describes the structure of a Faraday rotation magnetometer [85].
Applsci 14 05134 g001
Figure 2. (a) The differential fluxgate measurement system, (b) The SQUID measurement system [20].
Applsci 14 05134 g002
Figure 3. (a) The axial wire-wound measurement system, (b) the planar thin-film measurement system [116].
Applsci 14 05134 g003
Figure 4. The hybrid magnetometer with vibrating and rotating sample [58].
Applsci 14 05134 g004
Figure 5. Schematic diagram of the two different fluxgate setups: (a) single fluxgate arrangement, (b) differential fluxgate arrangement [42].
Applsci 14 05134 g005
Figure 6. The schematic diagram of the setup for the measurements [27].
Applsci 14 05134 g006
Figure 7. Schematic diagram of the setup with fluxgate scanner for magnetorelaxation imaging [45].
Applsci 14 05134 g007
Figure 8. Schematic diagram of the proposed setup consists of two fluxgate magnetometers, two compensation coils, and three drive coils [127].
Applsci 14 05134 g008
Figure 9. The experimental setup in the laboratory consisted of two fluxgate magnetometers and (a) the under-study sample, (b) the three-layer magnetic shield.
Applsci 14 05134 g009
Figure 10. The magnetic field values, when the sample is present, are derived from the two magnetometers in (a) x axis, (b) y axis, and (c) z axis.
Applsci 14 05134 g010
Figure 11. The magnetic field values, when the sample is absent, are derived from the two magnetometers in (a) x axis, (b) y axis, and (c) z axis.
Applsci 14 05134 g011
Table 1. Comparison between different magnetometer types.
Magnetic Sensor TechnologyDetectable Field Range (Gauss)
Squid≈10−9–105
Fiber-Optic≈10−6–101
Optically Pumped≈10−8–100
Nuclear Procession≈10−7–102
Search-Coil≈10−8–1010
Anisotropic Magnetoresistive≈10−7–101
Fluxgate≈10−6–102
Magnetotransistor≈10−1–104
Magnetodiode≈10−1–104
Giant Magnetoresistive≈10−1–108
Hall Effect Sensor≈101–106
Table 2. Comparison Between Simple and Differential Fluxgate Magnetometers.
Fluxgate Magnetometer TypeAdvantagesDisadvantages
Simple
Fluxgate
Magnetometer
Need for only one magnetometerOnly nanoparticles located close enough to the fluxgate sensor contribute to the output signal
Differential
Fluxgate
Magnetometer
SNR increases by a factor of √2
More accurate measurements
Need for two complete electronic sets
Table 3. Overview of the Existing Magnetometers.
Magnetometer TypeAdvantagesDisadvantagesRelated References
Vibrating
Sample
Magnetometer
Old and widely used technologyCostly
Low sensitivity
Contains bulky electromagnets
Contains moving parts
Overall complex construction
The low time resolution of the signal
Bad quality of signal-to-noise ratio
[65,66,67,68,69,70,71,72,73,74,75]
Optically Pumped
Magnetometer
Provides reduced target-field distance
Flexibility in the positioning
Absence of cryogenic cooling
Measures the absolute magnetic field
High recovery time[1,77,78,79,80,81,82,83,84]
Faraday
Rotation
Magnetometer
Provide rapid and non-destructive measurementsLimited use for quantitative measurements
High level of noise
Long-term displacements of the signal
[85,86,87]
Hall-Effect
Magnetometer
Small dead time, less than 1 μs
Can characterize the nanoparticles with accuracy, even if the distance between the sensor and the target is small
High level of noise[36,49,76,78,79,80]
Giant
Magnetoresistive Sensor
Compact
Economical
High sensitivity
Large-scale device
Work at room temperature
Demand low power consumption
Appear high thermal stability
Relatively simple structure
High transduction efficiency
High noise level (in the range of 0.1–1 nT/ H z )[37,59,93,94,95,96,99]
Superconducting Quantum
Interference Device Magnetometer
High sensitivity (the most sensitive field sensor [62])
High bandwidths (of the order of MHz)
Function range between 1 fT–9 T
Enables measurements with close distance between the source and the sample
Low noise level (0.1–10 pT/ H z )
Not suitable for room temperature measurements
Needs Cooling
Needs Insulation
Measures variations on the field and not the absolute magnetic fields
Susceptibility to magnetic disturbances
Need of heavy magnetic shielding
Restrictions to the nanoparticle detection ability
Dead zone time greater than 300 μs
The signal is proportional to the average magnetic flux
Vector magnetometer
[20,29,32,41,46,100,102,103,104,106,111,112,113,114,115,116,117,118,119,120]
Fluxgate
Magnetometer
The signal has a proportional relationship with the magnetic flux density
Highly sensitive device
Low noise levels (1 pT to 1 nT/ H z at 1 Hz)
White-noise values in the range of a few pT/Hz1/2
Able to work at room temperatures
Simple structure without moving items
High precision
3D device
No need for cryogenic cooling
No need for magnetic shielding
Measure the absolute value of the magnetic field
Able to know the signal before its deactivation
Application in the magnetic fields between 20 pT and 100 μΤ
Are limited by their bandwidth in the lower kHz range[8,19,26,27,42,45,47,110,121,122,123,124,125,126,127,128,129]
Disclaimer/Publisher’s Note: The statements, opinions and data contained in all publications are solely those of the individual author(s) and contributor(s) and not of MDPI and/or the editor(s). MDPI and/or the editor(s) disclaim responsibility for any injury to people or property resulting from any ideas, methods, instructions or products referred to in the content.

