Abstract
One of the main goals of human genetics is to understand the connections between genomic variation and the predisposition to develop a complex disorder. These disease–variant associations are usually studied in a single independent manner, disregarding the possible effect derived from the interaction between genomic variants. In particular, in a background of complex diseases, these interactions can be directly linked to the disorder and may play an important role in disease development. Although their study has been suggested to help complete the understanding of the genetic bases of complex diseases, this still represents a big challenge due to large computing demands. Here, we take advantage of high-performance computing technologies to tackle this problem by using a combination of machine learning methods and statistical approaches. As a result, we created a containerized framework that uses multifactor dimensionality reduction (MDR) to detect pairs of variants associated with type 2 diabetes (T2D). This methodology was tested on the Northwestern University NUgene project cohort using a dataset of 1,883,192 variant pairs with a certain degree of association with T2D. Out of the pairs studied, we identified 104 significant pairs: two of which exhibit a potential functional relationship with T2D. These results place the proposed MDR method as a valid, efficient, and portable solution to study variant interaction in real reduced genomic datasets.
1. Introduction
The human genome reference sequence is composed of a chain of more than 3 billion nucleotide pairs. By comparing the DNA sequences between any two individuals, up to 3.78 million differences can be found, which are known as genomic variants. In fact, more than 400 million genomic variants have been characterized [1]. Among other reasons, the study of genomic variation is crucial for understanding disease predisposition, and therefore, one of the main goals of the computational genomics field is to identify disease-associated variants. Particularly, complex diseases, such as type 2 diabetes, asthma, or Alzheimer’s disease, are caused by the simultaneous effects of multiple genomic variants and environmental factors.
The necessity for understanding genetically complex diseases has driven the search for significant associations between genomic variants and complex diseases. During the last decade, these associations have been broadly characterized by genome-wide association studies (GWAS) [2,3,4]. These studies, which rely on a wide variety of methods such as logistic regression or genetic programming [5,6], focus on discovering variants associated with the risk of developing the disease. While GWAS performs association tests for each variant in a single independent manner, in variant interaction studies, the search is broadened to inspect the effects from the interaction of variants, which can be either additive or epistatic [7]. To tackle variant interaction studies, different methods, tools, and strategies have thus arisen, focusing mainly on pairwise interactions [8].
There is a wide range of tools and frameworks that can be used to analyze variant interactions. Particularly, some of the tools commonly used for GWAS detection have been adapted to analyze interactions, such as PLINK [9], which is based on logistic regression, and other frameworks such as GWIS [10], which is based on receiver operating characteristic (ROC) curves, or BOOST [11], which relies on contingency tables and chi-square tests, but other techniques have been newly generated to approach the problem. However, despite all these tools facilitating the discovery of variant interactions associated with the disease and the inspection of their effects, the obstacle of analyzing variant interactions is still a computational and methodological challenge. In the simplest approach, where only pairwise interactions are analyzed, the number of combinations to study ascends to more than . As a result, the combination of the computational challenge that represents the execution of billions of tests and the extremely restrictive multiple testing burden penalty [12] required in this type of analysis represent the main limitations of these methods.
One of the potential strategies to overcome these major limitations is a two-stage approach, where the first step involves reducing the dimensionality of the problem. This reduction focuses on decreasing the number of variant interactions that will be analyzed and, in most cases, involves filtering the data. This filter can be done, among other methods, based on data mining techniques, such as the ones used in Relief [13], where a proximity measure is calculated between individuals based on genome-wide similarity, or using data-integration techniques, which involve selecting only the genomic variants that are relevant to the study based on previous biological information, such as protein–protein interaction databases like ChEMBL [14] or BioGRID [15]. After reducing the size of the problem, non-exhaustive explorations can be performed using statistical methods and artificial intelligence. In this direction, multiple approaches have been tested and have identified pairwise combinations that show associations with complex diseases in reduced datasets. Some examples are random forest [16], Bayesian networks [17], computational evolution systems [18], and ant colony optimization [19].
Importantly, among these methods, multifactor dimensionality reduction (MDR), which is a supervised classification approach based on contingency tables, has been previously used to approach the analyses of gene–gene interactions [20] and variant–variant interactions. However, the complexity of the analysis surrounding the study of interactions has limited the inspection and the use of this methodology to the analysis of reduced datasets [21]. Since this method performs the analysis of the interactions as independent events—loading only two variants at a time and, thus, avoiding any memory bottlenecks, making it ideal for parallelizing the processing of big datasets—in this study we tackle the pairwise interaction problem at a genome-wide level. To that extent, in this work, we have developed a containerized framework using high-performance computing (HPC) technologies and applied MDR to discover relevant variant interactions in an efficient parallel environment. This method has been tested to find associations with type 2 diabetes (T2D) in a subset from the Northwestern University NUGene cohort [22].
Contributions
- Contribution 1: a containerized HPC architecture for detecting disease-associated variant pairs.
- Contribution 2: discovery and functional interpretation of pairs of variant interactions associated with T2D.
From the 1,883,192 pairs studied, 104 were found by the MDR to be associated with type 2 diabetes. From this subset, we have identified two variant pairs for which their connection to type 2 diabetes can be explained by gene expression genomic variation and variant impact on gene pathways.
2. Materials and Methods
2.1. Input Dataset Preparation
The 70KforT2D dataset is a type 2 diabetes (T2D) case-control dataset that includes different cohorts with individuals of European ancestry [23]. From this dataset, we analyzed the Northwestern University NUgene project (NUgene) cohort [22], which consists of 1128 individuals: 601 non-diabetic and 527 diabetics. The human datasets used for this study are publicly available through the dbGaP platform (phs000237.v1.p1). The access to this data was approved by the Institutional Review Board of the Barcelona Supercomputing Center (BSC). Informed consent was obtained from all subjects for the use of their coded DNA samples and data for a broad range of genetic research by third-party investigators.
2.2. Multifactor Dimensionality Reduction
MDR is a non-parametric statistical method for detecting and characterizing nonlinear interactions. It follows a naive Bayes approach, building a probabilistic classifier for each variant–variant interaction and finding the best combinations in terms of prediction. The higher the prediction power of a pair is, the stronger its association with the disease is. The steps of the method can be found in Figure 1 and are described as follows.
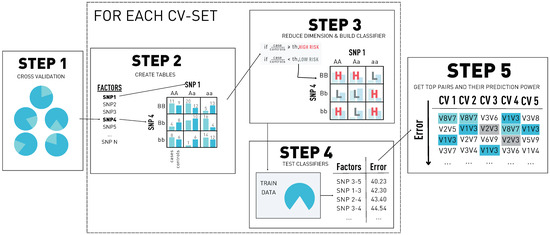
Figure 1.
The five steps of multifactor dimensionality reduction (MDR). In step 1, we build the cross-validation (CV) sets. In step 2, for each possible pair of single nucleotide polymorphisms (SNPs) in the dataset, we create a contingency table. Then, in step 3, we transform each contingency table into a classifier, and in step 4, we get the misclassification error of each pair. Finally, in step 5, we select the top pairs by their misclassification error for each CV set and obtain the prediction error using the independent test set.
- The first step consists of a k-fold cross-validation and is performed to avoid potential over-fitting. The dataset is subdivided into k parts, where k − 1 data parts are used for training and one part is used for testing. Since we generate k different distributions of the dataset, the following steps are going to be performed k times: one for each distribution.
- In the second step, for each variant pair, we cross-tabulate genotypes for cases and controls using only the individuals from the training dataset. This generates two factor tables (variant–variant): each one has three classes corresponding to the variant genotypes (AA, Aa, aa). In the end, we have a nine-cell table with two dimensions: the number of cases and the number of controls.
- In step three, each of the tables is going to be transformed into a one-dimensional space using the case-control ratio from the training distribution set as a threshold T. The cells where the ratio of cases to controls is greater than T are going to be classified as ‘high risk’; the other cells are classified as ‘low risk’. As a result of this step, we reduce the dimension of the problem from two classes to one.
- In step four, each of the variant–variant tables is used to classify the individuals of the training set. The classification is done as follows: for each individual, we extract the variant–variant genotypes and determine class of the multifactor table it belongs to. Then, if the class corresponds to a high-risk cell, we classify the individual as a case. Otherwise, we classify it as a control. After classifying every individual, we compare the predicted classes with the original labels, obtaining the misclassification error of the variant–variant table.
- In step five, the model with the best misclassification error is selected, and the prediction power of the model is estimated using the independent test data and determining the percentage of patients correctly classified. After these steps are repeated for each of the possible cross-validation sets, the best and most consistent variant–variant combinations are selected. This means picking the ones that appear the most times in the cross-validation sets as a top predictor pair.
2.3. Chi-Square p-Value Threshold Selection
The required p-value threshold has been chosen in concordance with the reduction of the dataset for performing MDR in a feasible time and retaining the majority of pairs related to the disease.
2.4. Framework
The optimization of the method is key to making it feasible to analyze current genomic datasets with billions of pairwise combinations or even trios and more complex combinations. We have used a high-performance computing (HPC) [24] framework to maximize the efficiency of the method, relying on technologies such as Apache Spark [25] and HDFS [26]. To obtain the best performance using these technologies, first, it is necessary to optimize the method, and then, we must to parallelize it.
The optimization of the method relies on efficient vector multiplications. We use Python 3.9 [27] as the main programming language and numpy [28], which is a library that has been specially prepared to perform fast vector operations. MDR benefits from the use of this library because it is composed of count and compare actions that can be better defined as matrix multiplications using binarized data, reducing the computational time drastically.
One of the reasons why our combined architecture is a great tool for analyzing variant–variant interactions is its scalability capabilities. Since in the MDR each of the combinations is computed in solitude, with no need to share any information but the final results, it presents an excellent opportunity for parallel computing. We have implemented our methodology using Apache Spark, which is a tool based on the use of resilient distributed datasets (RDDs) [29]. As a result of using Apache Spark, the operations over a data item can be distributed over a cluster of machines, processing the data efficiently in memory. This overcomes the limitations of other technologies in the cluster computing paradigm, such as MapReduce [30]. To maintain track of the operations performed to the RDD in the different nodes, we use a directed acyclic graph (DAG) [31].
To make these on-memory operations more efficient, it is important to count with a distributed file system that allows fast access to the data in every machine. The use of the Hadoop distributed file system (HDFS) [26] allows us to distribute the storage, and by combining it with Apache Spark RDD, we can distribute both the input data and the operations across a cluster system.
Cluster computing and cloud computing are key resources for HPC applications. To increase the compatibility of our architecture, we have developed a Singularity container with all the necessary software to run the application. Using Singularity over other containerization technologies such as Docker allows us to run our system in user-shared environments since no root permission is needed to run a Singularity container. Also, the use of containers provides a lightweight and portable solution with less overhead than other solutions, such as virtual machines [32], increasing the efficiency of our application. We have tested all of our frameworks using a cloud-based OpenStack [33] environment and the supercomputer MareNostrum IV [34]. This framework has been published in an open-source repository [35].
2.5. Functional Interpretation Analyses
To discuss the novelty of our results, we annotated the resulting loci (LD variants in 1 Mb windows) using the significant signals from GWAS summary statistics for glycemic traits [36] and diverse large T2D GWAS meta-analyses [23,37,38,39] (). Additionally, to further inspect the possible links between these loci and changes in gene expression, we annotated them with the significant signals present in the summary statistics from expression quantitative trait loci (eQTL) in pancreatic islets () [40] and other tissues (5% FDR) [41], combined allelic specific expression (cASE) in islets (5% FDR) [40], and a variant effect predictor [42]. The results obtained were compared with a 1000 randomization pairwise interaction control distribution.
To investigate the possible underlying biological molecular mechanisms for the pairs, the list of genes obtained for each pair from the annotations was analyzed to find any possible functional enrichment by mapping genes to their molecular functions, pathways, motifs, tissue specificity, and protein complexes [43]. The full command for g:Profiler was: gostres gost(query = genes, organism = “hsapiens”). The results obtained were compared with a 1000 randomization pairwise interaction control distribution.
3. Results
3.1. Overall Strategy
To develop, optimize, and benchmark the MDR method to find variant interactions associated with T2D, we used the Northwestern NuGENE project cohort [22]. The complete dataset is composed of 11,297,253 variants and 1128 individuals. The data are stored in compressed CSV format, following the structure in Table 1. As we are studying the effects of variant interactions in disease risk development, we begin by analyzing pairwise combinations, which are the most basic interaction. In this dataset, the amount of possible pairwise combinations rises to approximately .

Table 1.
Three example rows of the input data. The first four columns contain the identification of the variant, while the rest of the columns contain the value of the variant for each patient of the 1128 individuals.
While MDR is a powerful method for detecting pairwise interactions, our need to analyze the complete genomic dataset (billions of pairwise combinations) in a realistic amount of time and resources forced us to reduce the input dataset. As a result, we applied a first filter to keep only the pairs of variants with a certain degree of association with the disease based on the results of a chi-square test p-value.
To deal with the huge volume of pairwise combinations, we used the MareNostrum IV and Greasy software [44] to distribute more than 2000 parallel tasks across 16 working nodes (48 CPUs and 96 GB of RAM); we tested the associations between the pairwise combinations of 11,297,253 variants in less than 4 days. Then, for the MDR, we only kept the pairs with a degree of association with the disease (p-value < ), which corresponds to 1,883,192 pairs.
3.2. Reducing the Computational Cost by Leveraging High-Performance Computing Technologies
In order to analyze the performance of the MDR and study the scalability, we designed a virtual environment in OpenStack using four virtual interconnected nodes with 16 CPUs and 16 GB of DDR3 RAM each. Since we are dealing with a dataset with a relatively small amount of patients (1128) and the application has a high computational expense, we decided to fix the k-fold cross-validation value to 5. This way, we ensure that our test set will be big enough to contain sufficient variation such that the underlying distribution is represented with a lower computational cost than if using higher k values. In the first phase of code optimization, we confirmed that the use of vector operations is key for the optimization, reducing the computational time by approximately 23 times: we passed from an average time of 28 min for every 1000 variants to just 72 s.
In terms of scalability, our interest is in knowing how the application scales when more nodes are available and how it scales when more data are included. We performed the following experiments:
3.2.1. Resource Scalability
We processed 1,000,000 pair combinations in a distributed environment and tested with one node, two nodes, and three nodes as workers (Figure 2). The algorithm shows great scalability capabilities, reducing the computation time with the increase in the number of working nodes. This is something to be expected since the computations are independent and we are using Apache Spark to distribute the work, with HDFS for data distribution; thus, we achieve efficient communication across nodes and avoid unnecessary overhead that could affect the scalability capabilities.
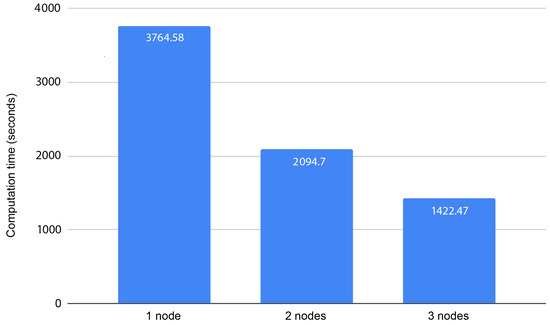
Figure 2.
Computation times for processing 1,000,000 pair combinations using 1, 2, or 3 nodes.
3.2.2. Sample Scalability
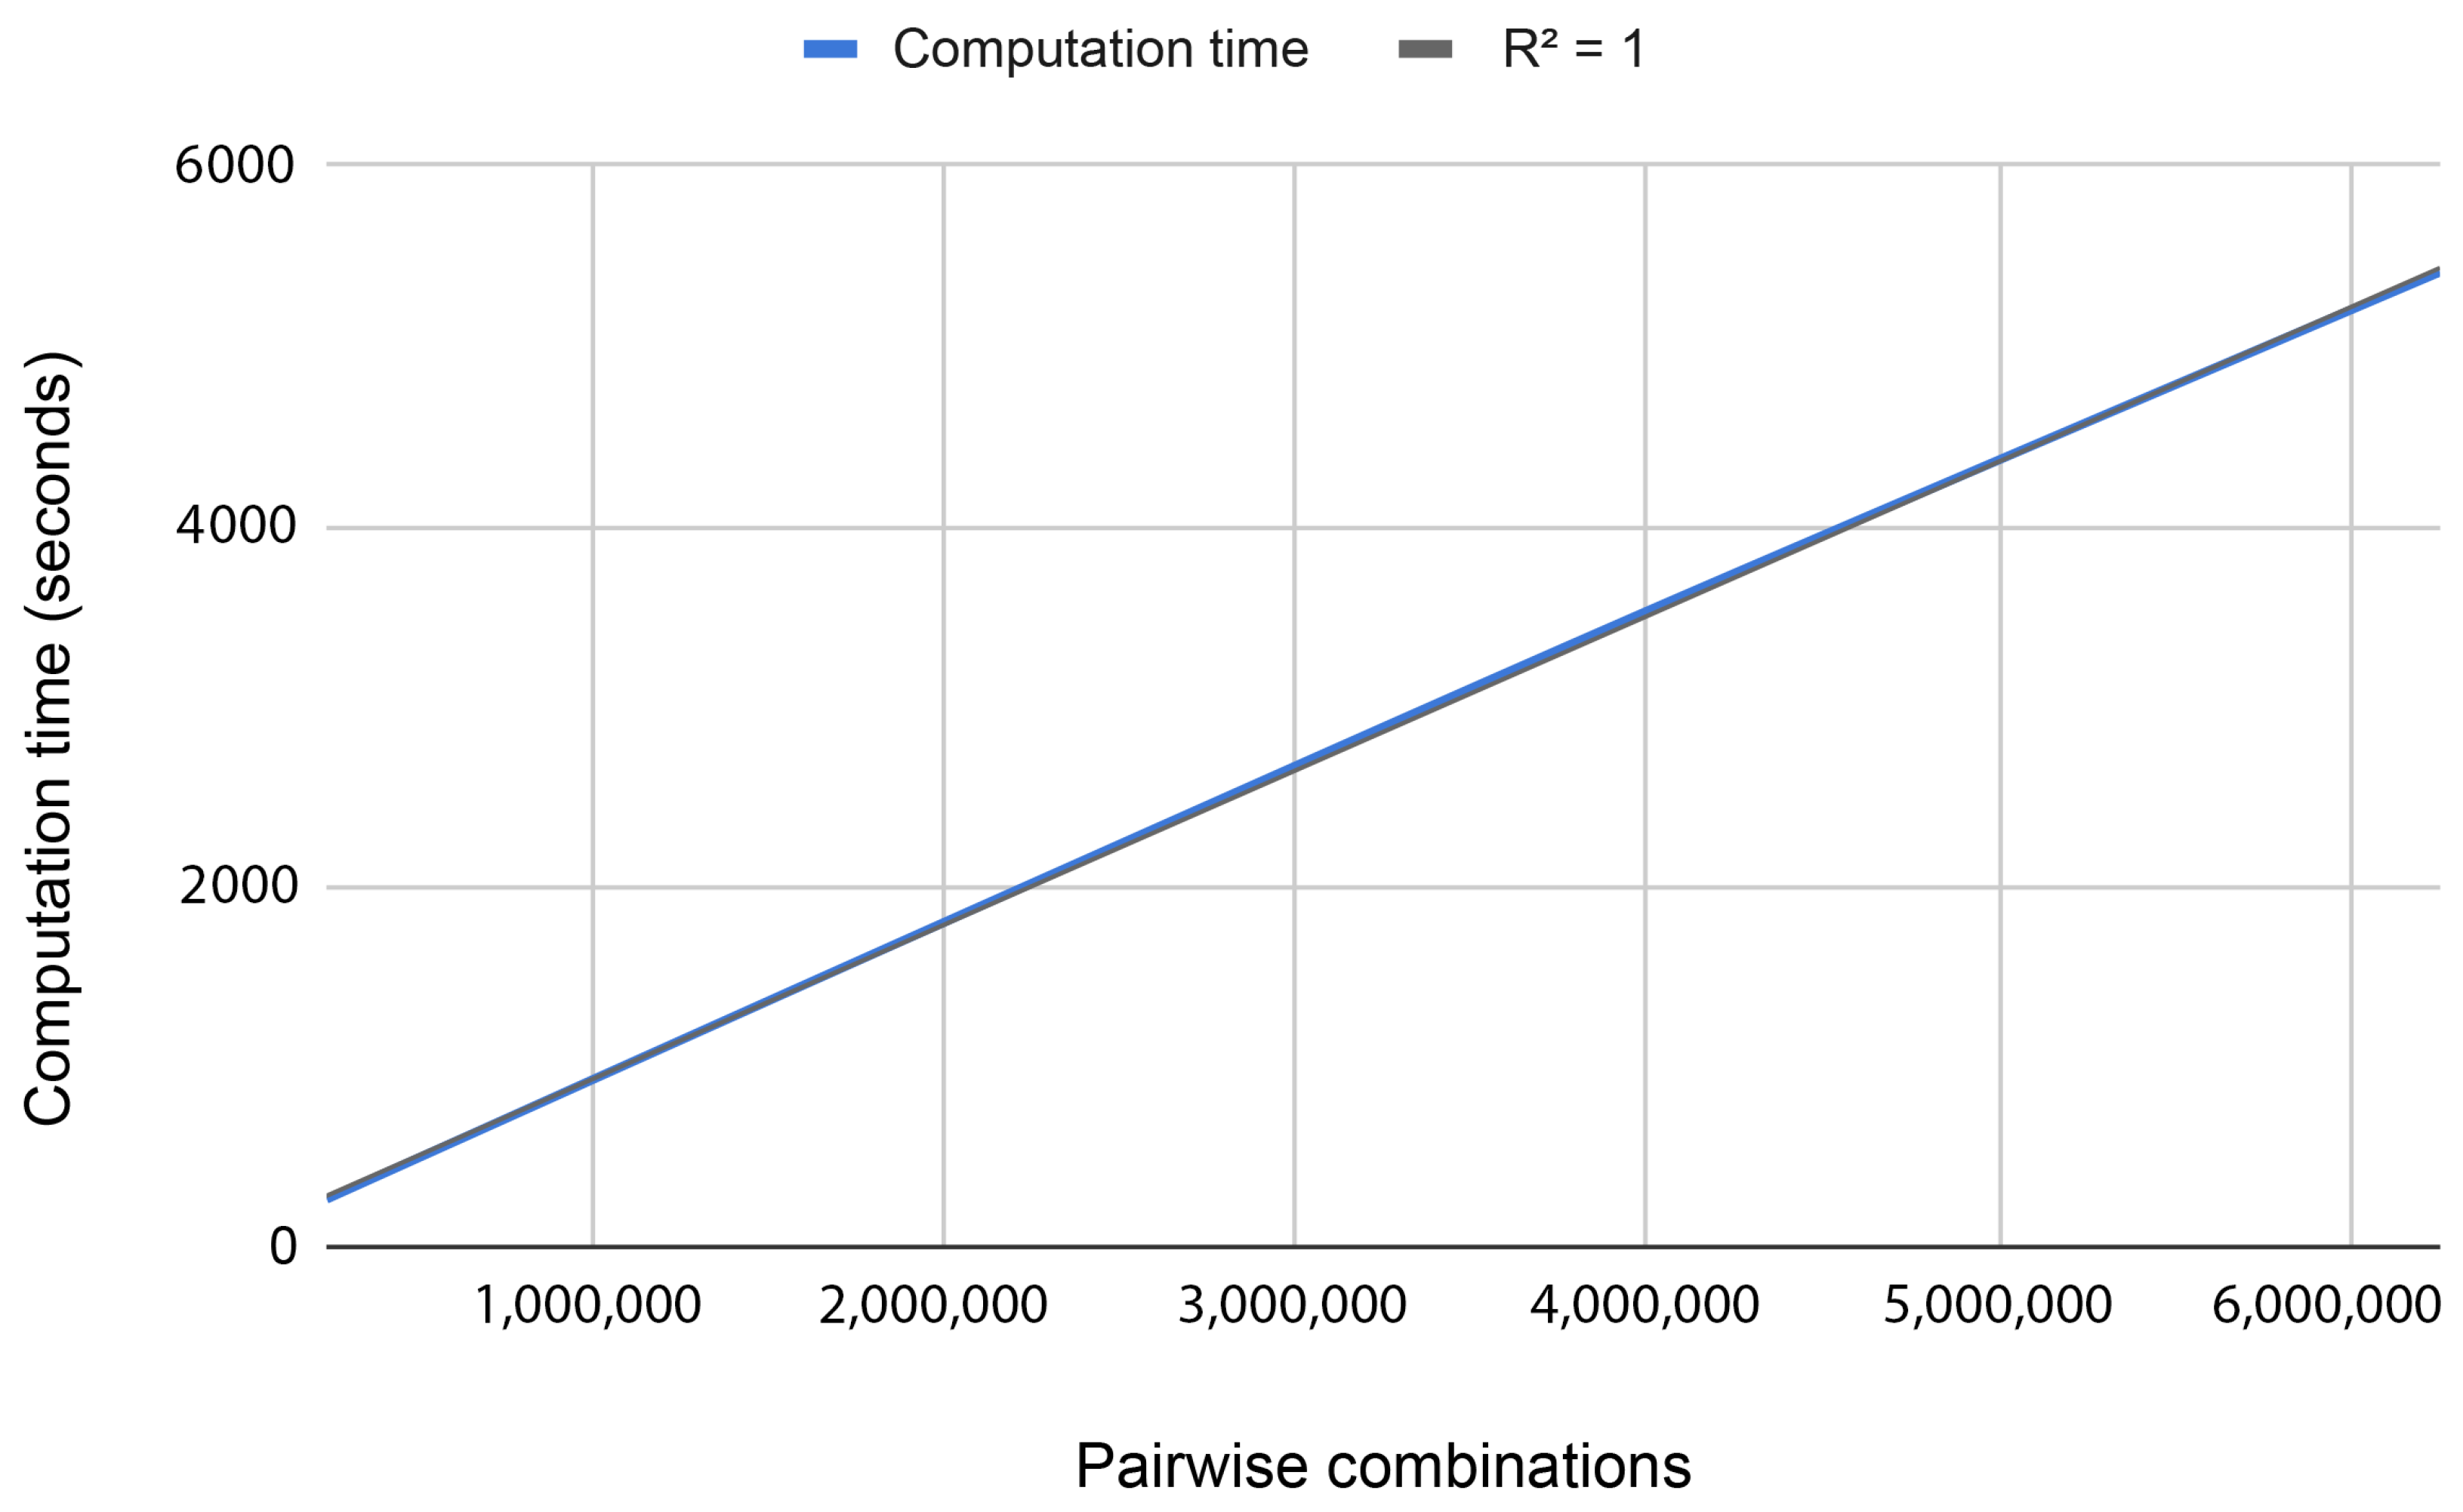
To study the scalability of the problem, we processed batches of data with different sizes (N = 1 M, 2 M, 3 M, 4 M, 5 M, and 6 M, where M equals million). Figure 3 shows that the behavior is completely linear (i.e., the execution time increases when the number of combinations increases at the same ratio). These results were expected since each pair is processed independently.
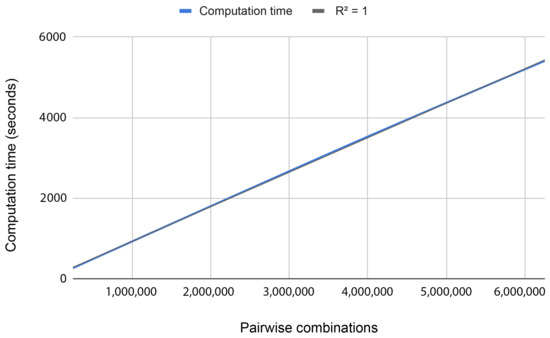
Figure 3.
Computation time for processing different amounts of pair combinations using 3 working nodes.
Testing the proposed methodology in our HPC environment, we were able to process 1 million combinations in 15 min using three regular machines. Doing a simple extrapolation, using a supercomputer such as MareNostrum IV with 3456 nodes and 48 cores each, we will have a computational time of 100 days. With these experiments, we conclude that processing the whole dataset nowadays is unfeasible. For this reason, we performed a reduction of the data based on the degree of association with the disease (p-value < ) using the chi-square test.
3.3. Applying the MDR Model to Detect Pairwise Interactions Associated with T2D
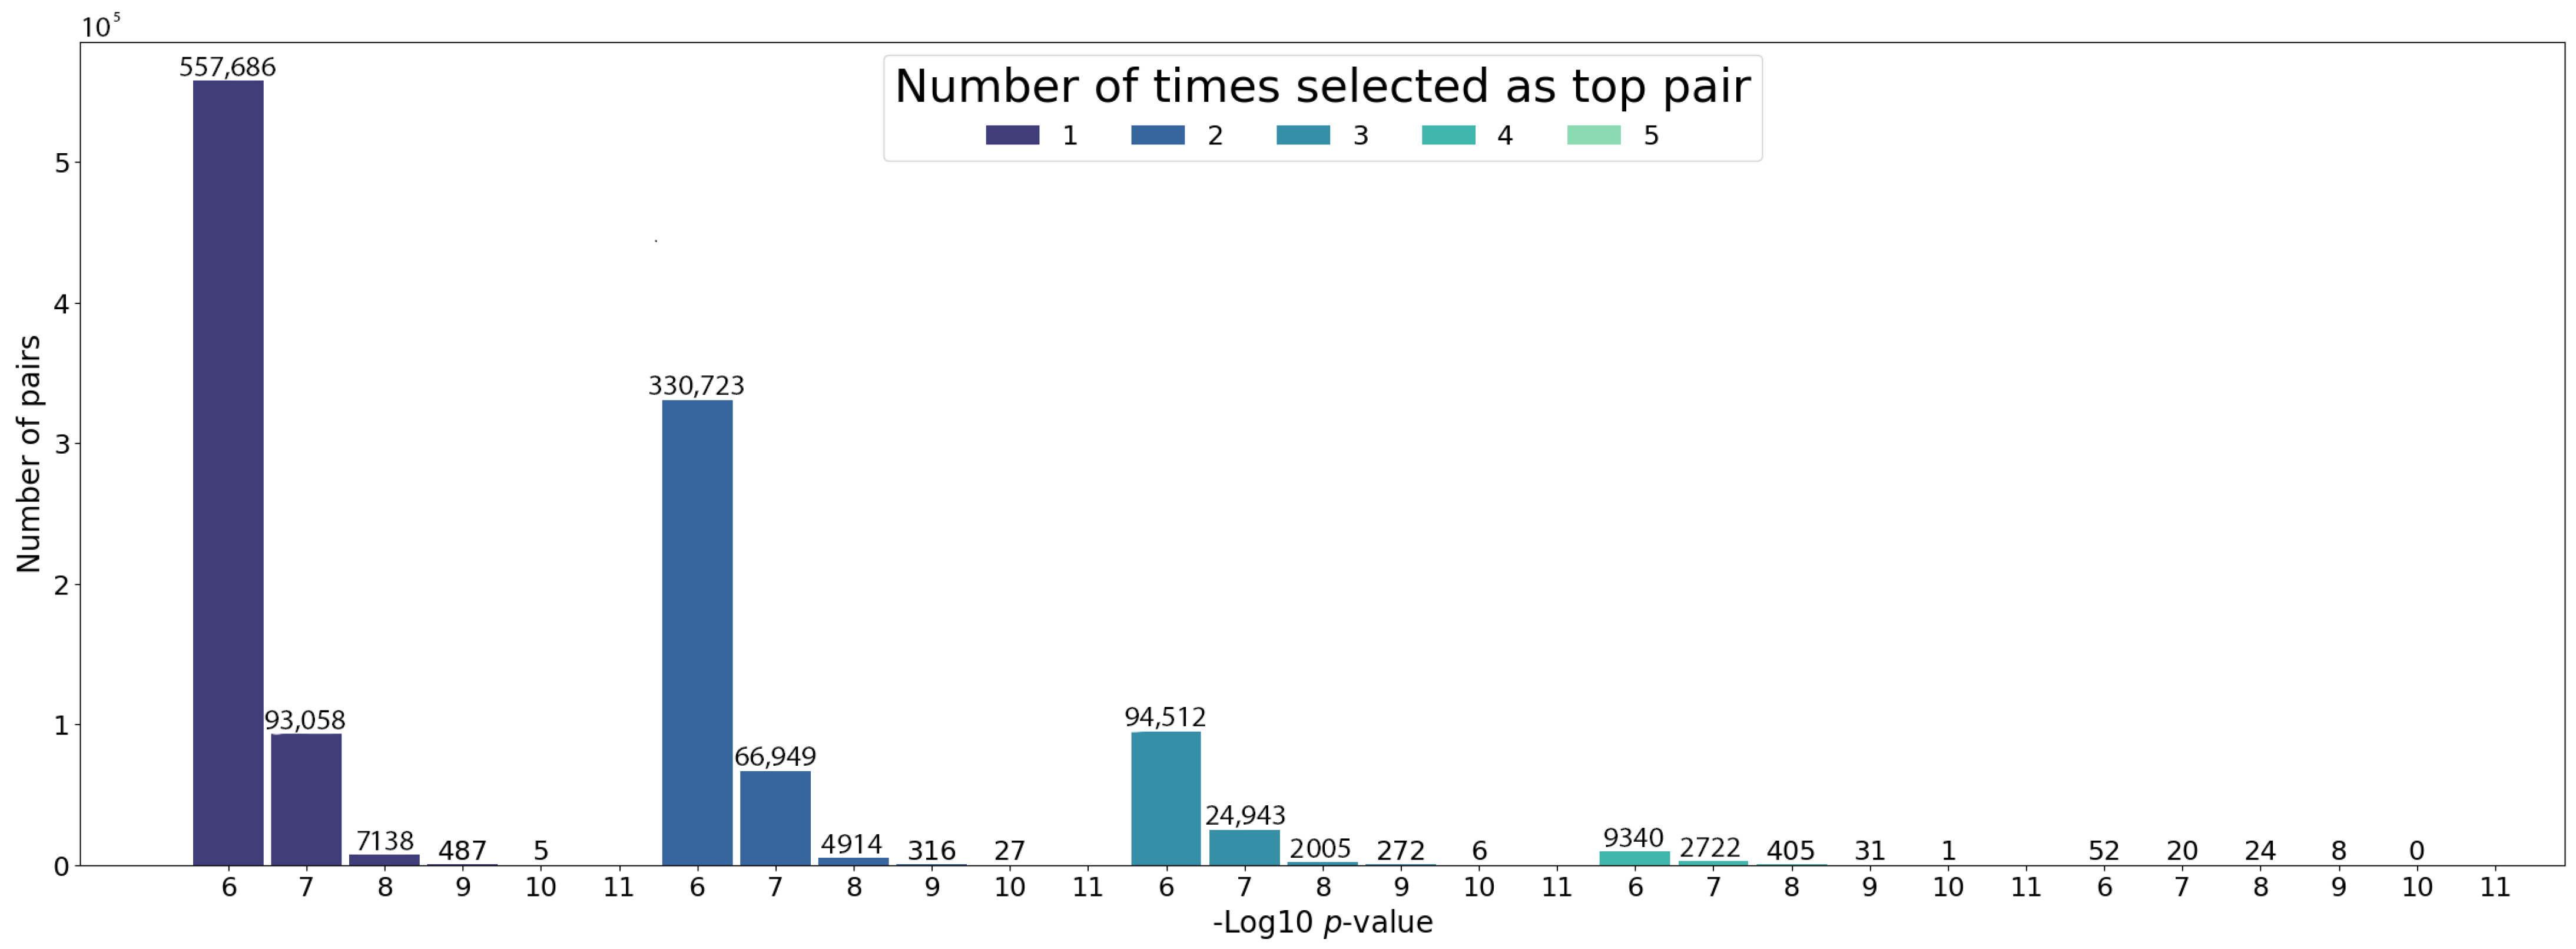
Using the same HPC environment with three working nodes, processing the 1,883,192 combinations takes no longer than 30 min (Figure 3). For selecting the final top pairs with the MDR, we set a hard filter for keeping only the pairs with a consistency value of 5, which corresponds to the number of times a pair appears in the top 20% of pairs in the five cross-validation sets. From the 1,883,192 pairs analyzed, we obtained a set of 104 pairs (Supplementary Table S1). Figure 4 shows the distribution of the chi-square pairwise interaction p-values depending on the MDR consistency value. Consistently, the total number of pairs decreases after each step of the cross-validation, ending with only a few pairs that the MDR detects to be relevant independent of the dataset partition. Importantly, 34 of these selected pairs have a p-value lower than (5FDR with Bonferroni correction). These results suggest that the discovery of the interacting pairs only depends on the calculated effect size that the variants will have with the disease and is independent of how much lower the p-value is.

Figure 4.
The p-value distribution in logarithmic scale for the studied pairs, grouped by the times they were selected as top pairs from the 5 cross-validation datasets.
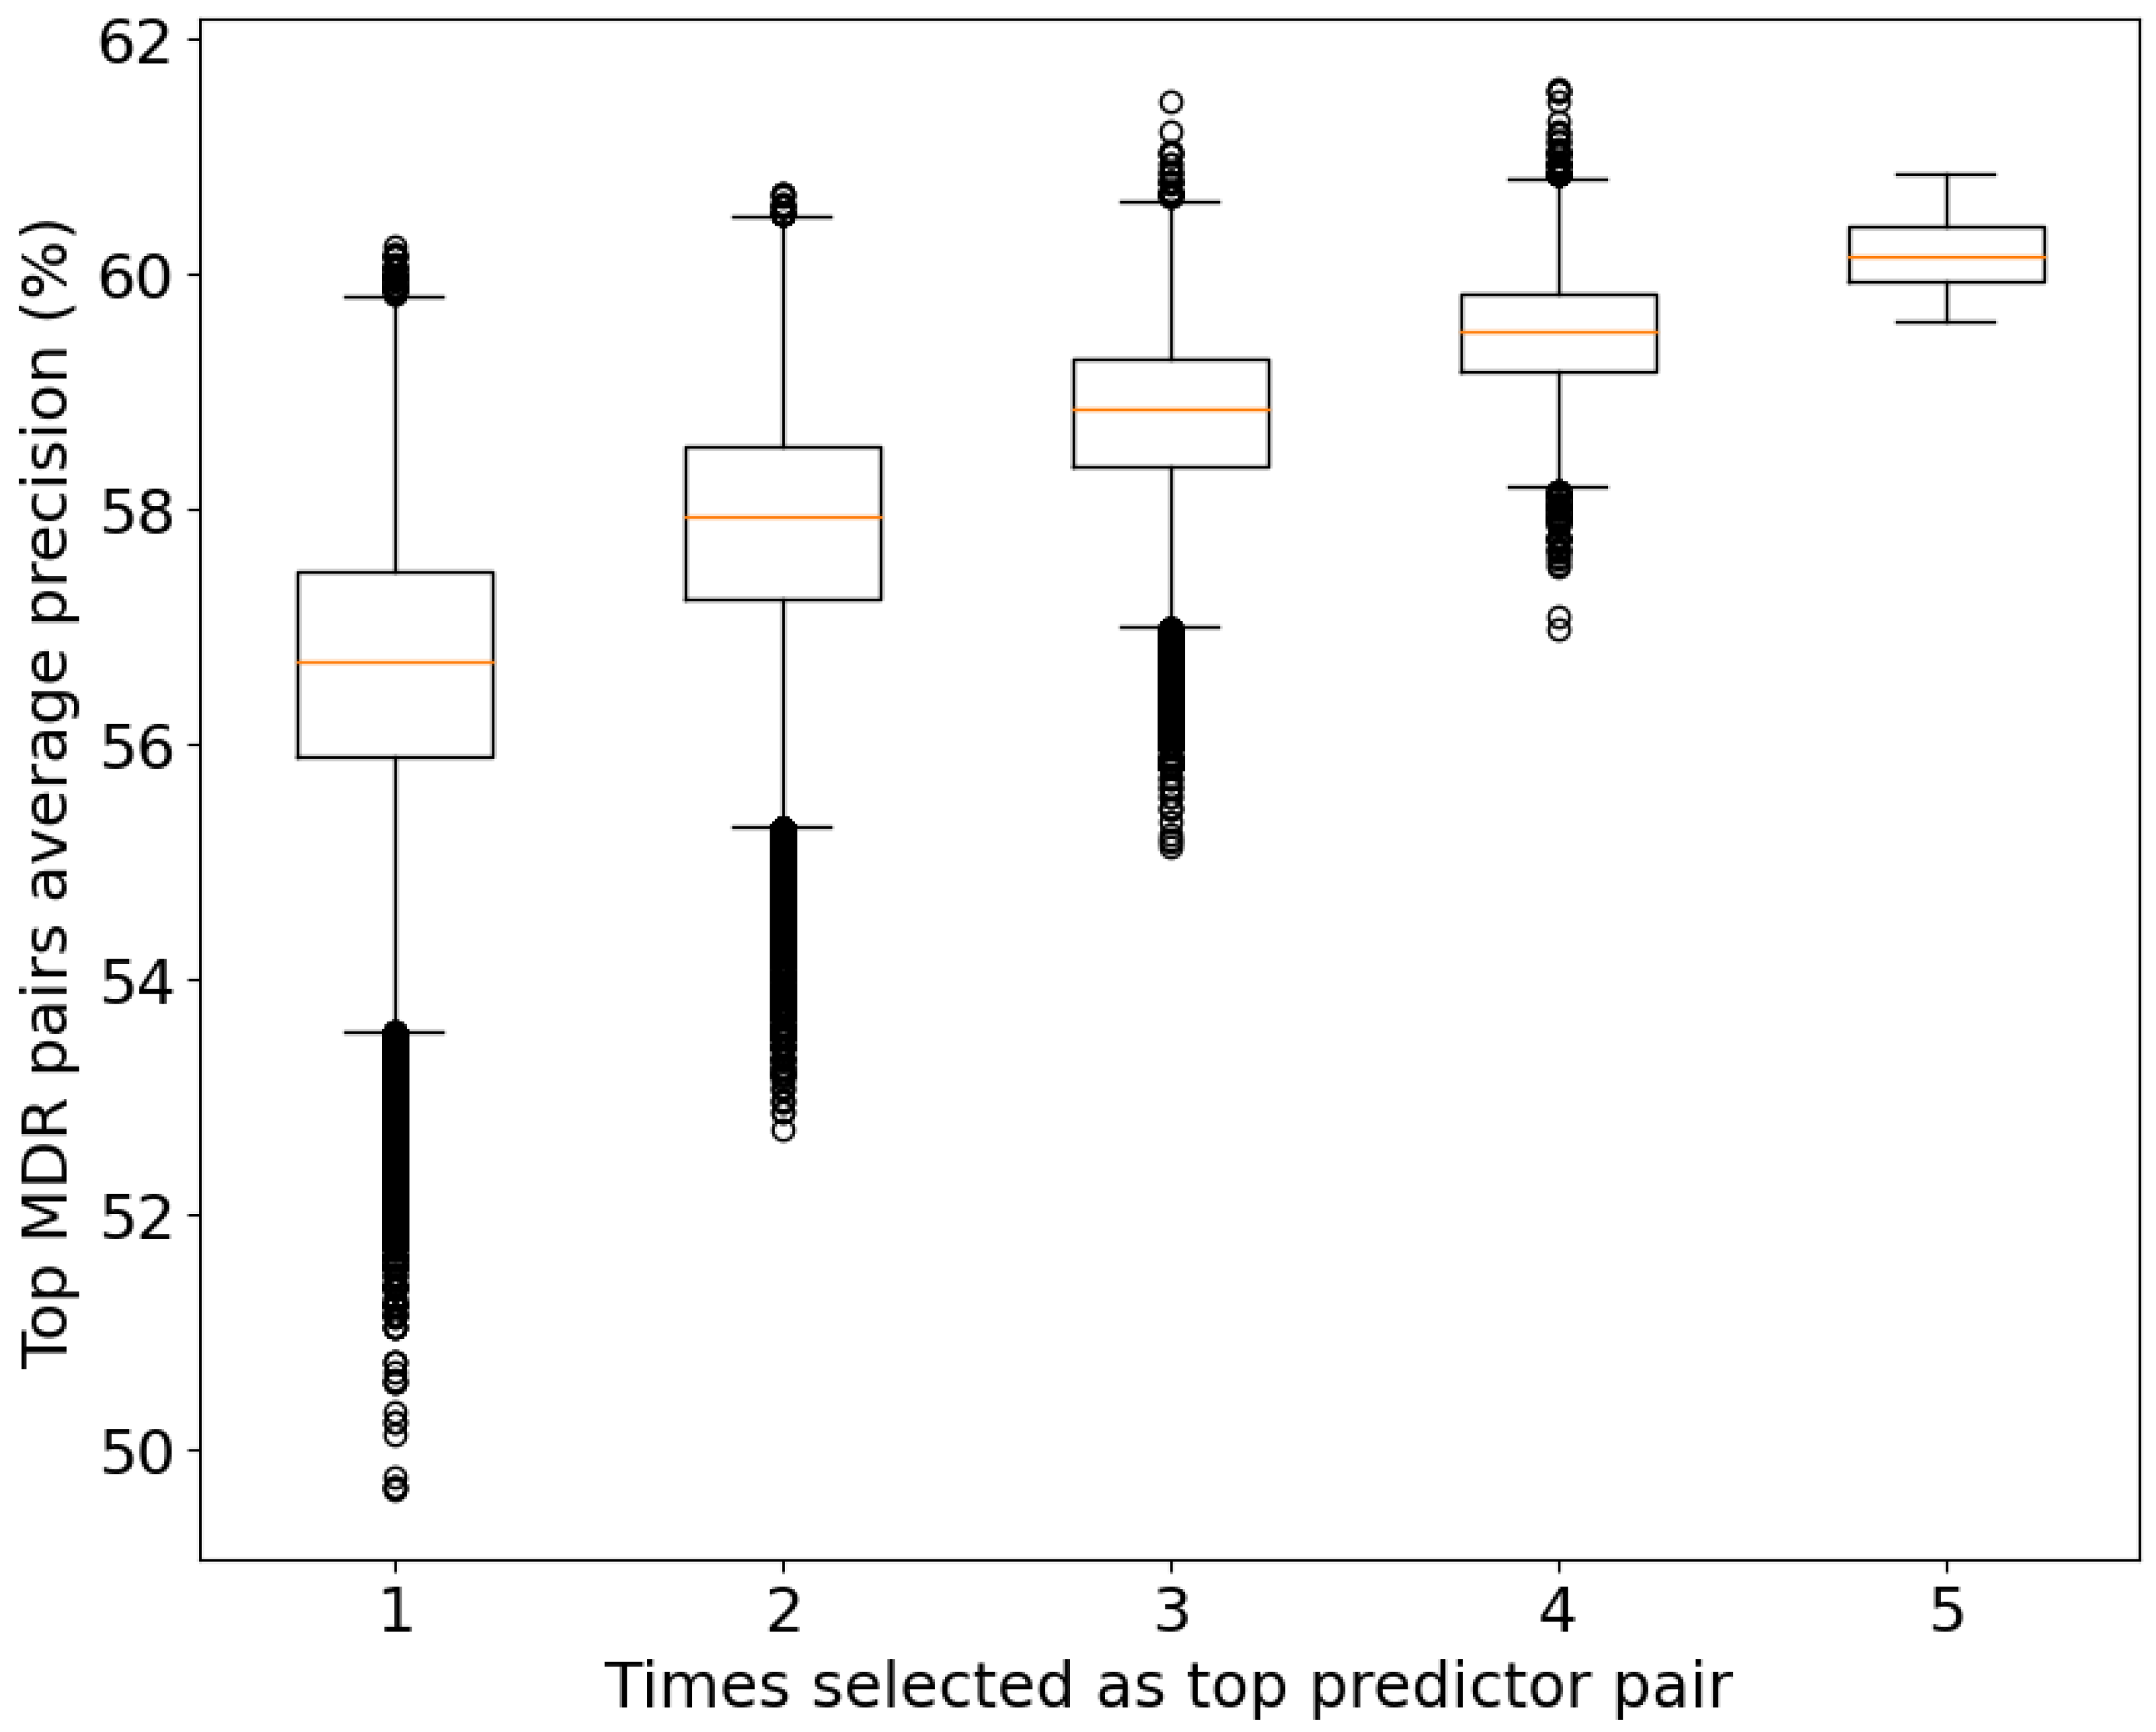
Regarding the significance level of the top 104 pairs, we measured the prediction power of the top pairs from the MDR using the average precision power (Figure 5) of the five CV sets. As expected, the group with the best average precision power (60.17%) corresponds to the group of top pairs common across all the CV sets. However, some pairs have a higher average precision in other groups. This can be explained by overfitting in that set, meaning that its relation with the disease is completely related to the data analyzed.
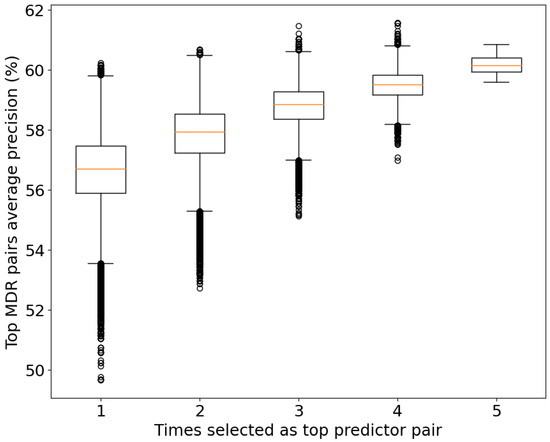
Figure 5.
Box plot of the average prediction power (precision) for the studied pairs and their consistency values. To be selected as a top predictor in each CV set, a pair must be inside the top 20% of predictor pairs of the set.
3.4. Functional Interpretation of the T2D-Associated Pairs
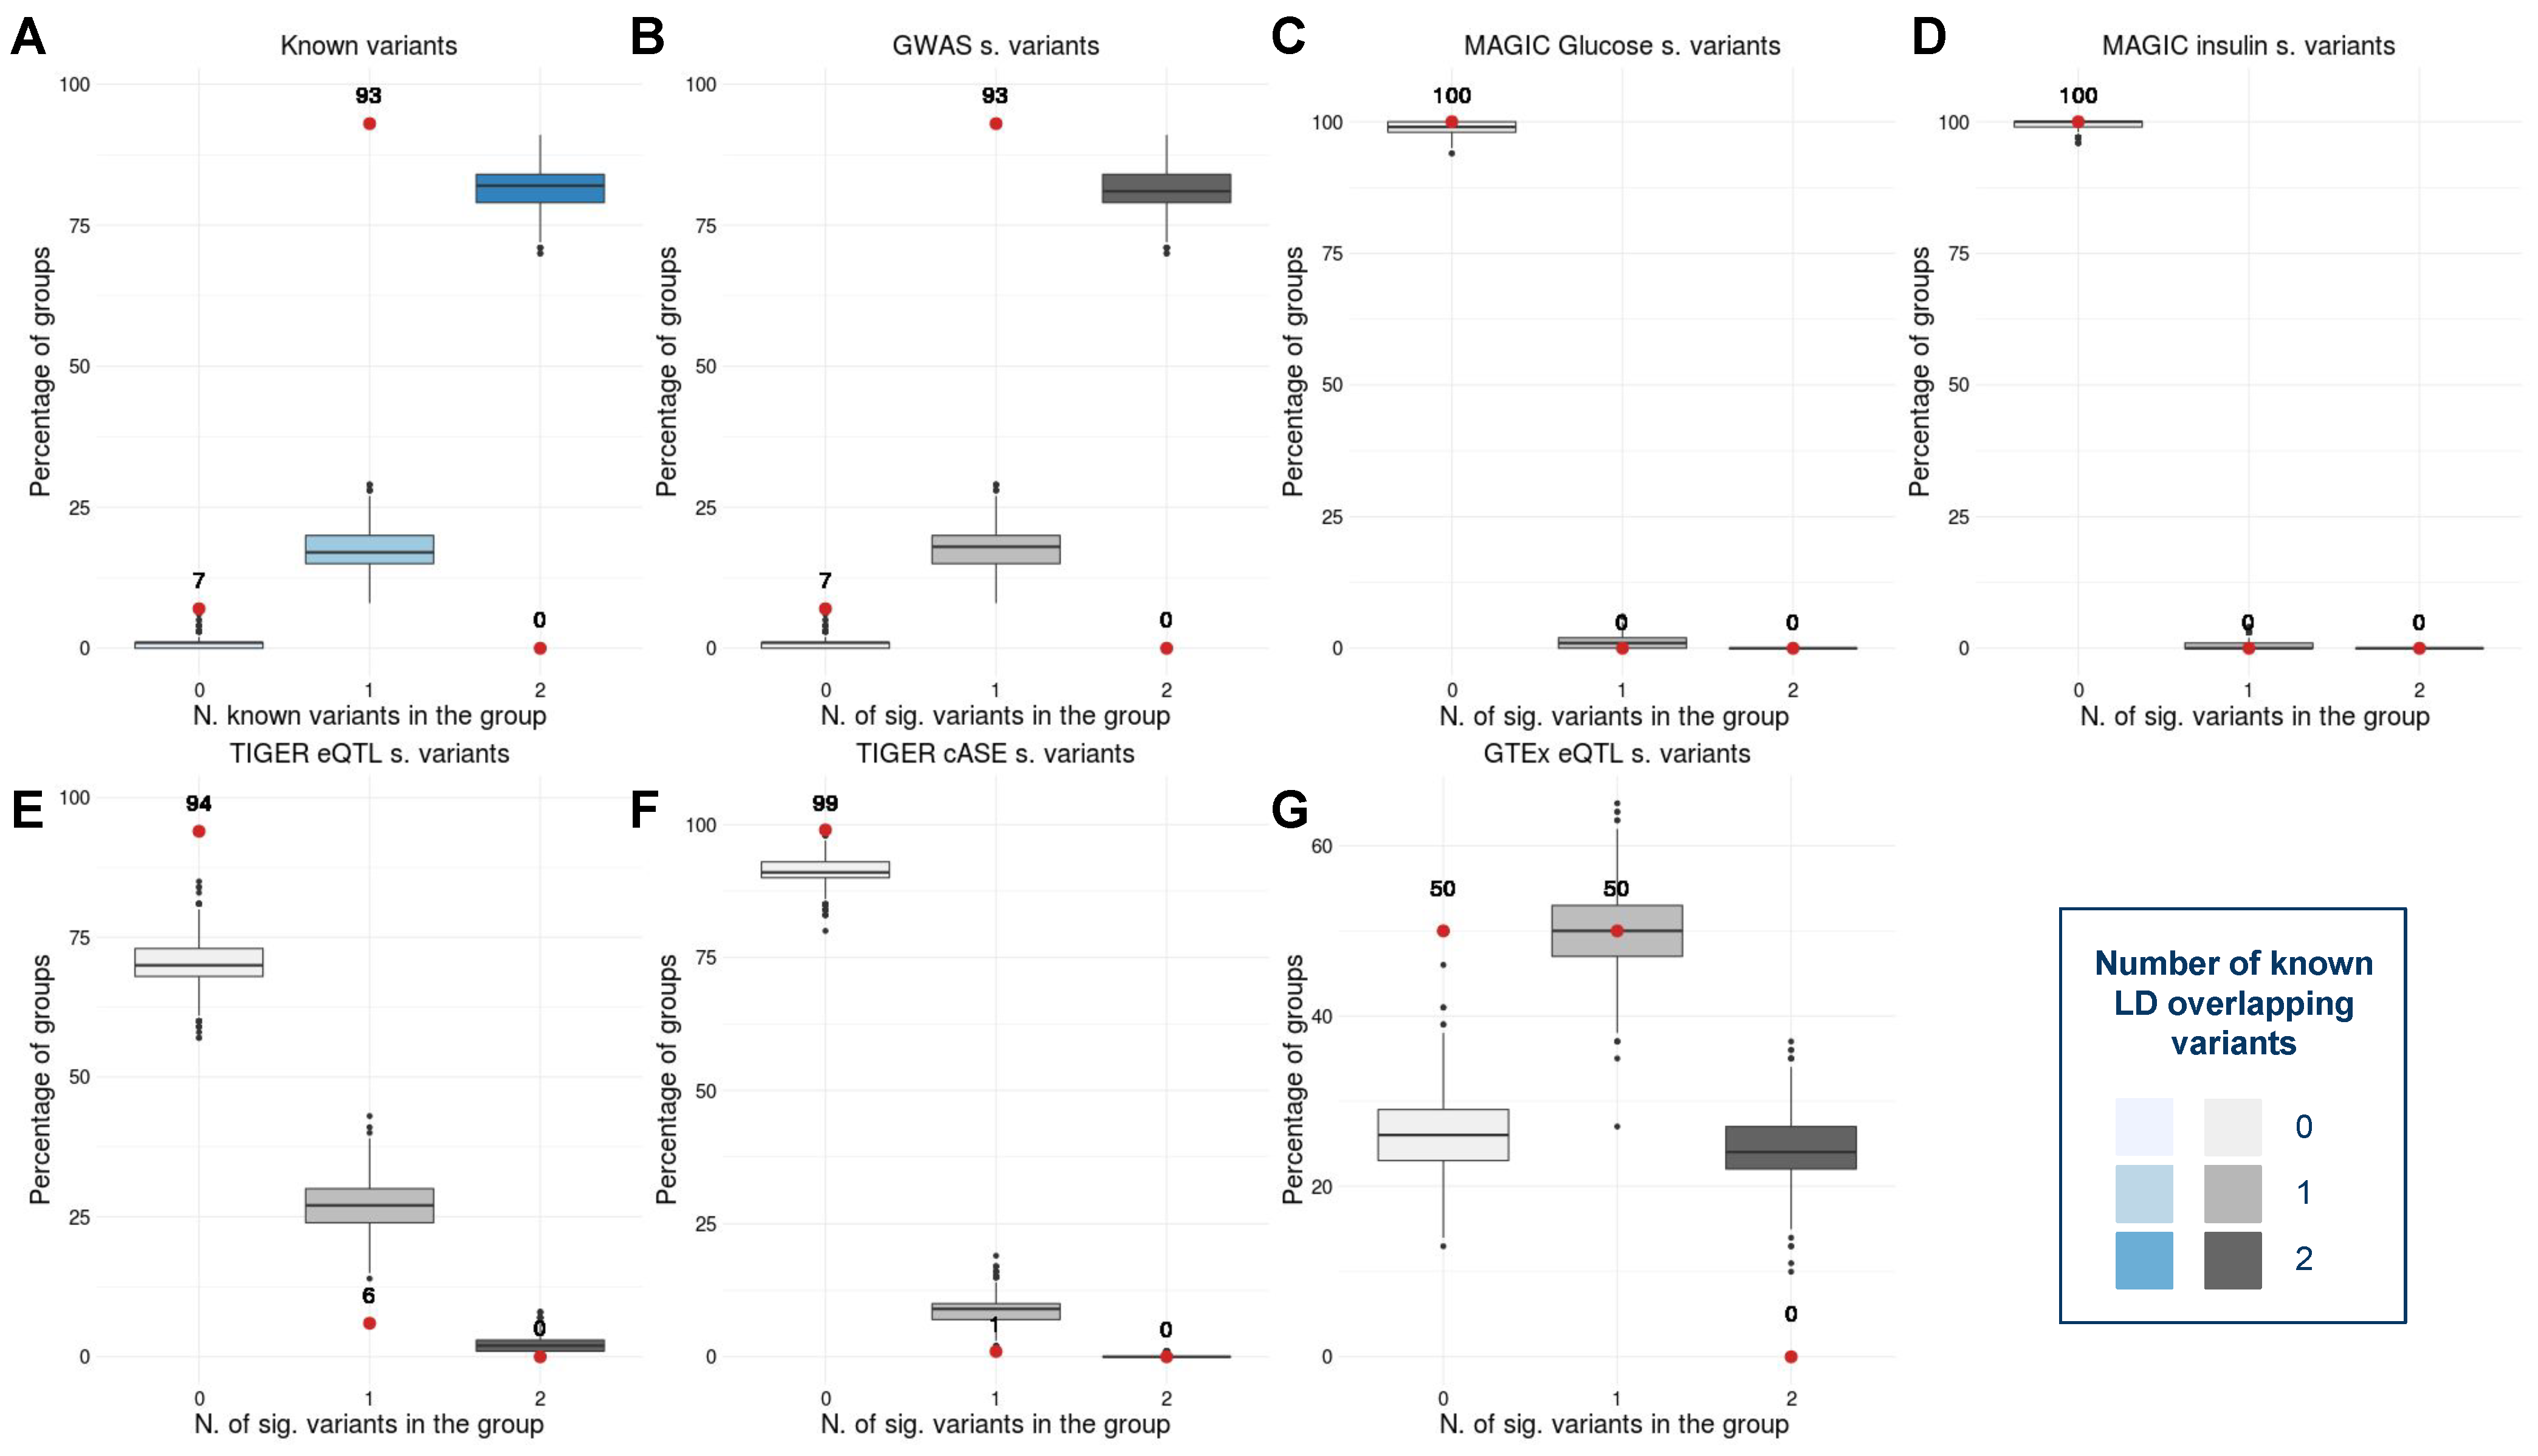
To investigate the connections between the signals detected by the MDR model and the disease, we first annotated the variants present in each pair. The 104 pairs of variants statistically associated with type 2 diabetes (T2D) obtained by applying our method contain 125 unique variants. Importantly, after annotating the 125 loci with GWAS meta-analyses and gene expression [23,36,37,38,39,40,41], we observed that a large number of variants were already known when compared with a control set. More specifically, 93% (4.65-fold) of the variants are in LD with an already known T2D-related signal. Notably, 6% of the variants are in LD with an islet eQTL, 1% cASE, and 50% GTEx eQTL (Figure 6). While the replication of these signals is a reflection of the additive effect of the variants in the disease, the 7% of novel signals remain unexplained under a non-interaction model.
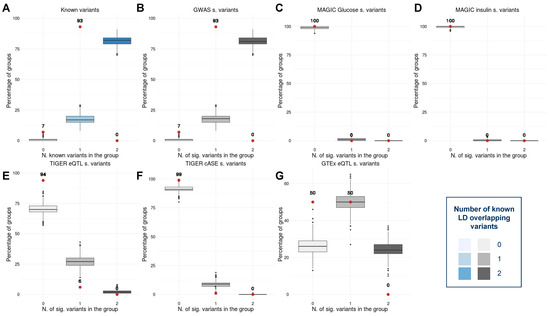
Figure 6.
Box plots showing the percentage of already known variants in the interacting pairs in contrast with a control set in (A) general, (B) GWAS significant variants [23,37,38,39], (C) 2 h glucose and fasting-glucose significant variants [36], (D) insulin significant variants [36], (E) pancreatic islet expression quantitative trait loci significant signals [40], (F) islet combined allelic specific expression significant signals [40], and (G) GTEx expression quantitative trait loci significant signals [41]. The red dots represent the percentage of variants in each pairwise interaction with a known annotation. The blue and grayscale box plots correspond to the distribution of the percentage of annotated variants in the control set.
In addition, to understand the possible biological mechanisms underlying our findings, we conducted a gene functional enrichment analysis. The list of genes obtained for each pair from these annotations was used for a gene functional enrichment analysis [43]. Among the results obtained from the analysis, we found to be of particular interest the one derived from the pair composed of rs6450946 (chr5:33120048) and rs1219643 (chr10:123348355), which involves FGFR2 signaling. Importantly, FGFR2 is known to upregulate adiposity [45]. Decreased expression of this gene might be a compensatory response to enhanced adiposity, thus suggesting its possible relevance as a novel therapeutic approach for obesity [46], and its overexpression has been suggested to be linked with embryo development and infertility in maternal diabetes [47]. In addition, the pair composed of rs200776585 (chr1:162626640) and rs72806227 (chr5:159084262) is connected with the regulation of the hepatic stellate cell proliferation pathway. Interestingly, diabetic hepatic fibrosis is a progressive liver disease and a chronic complication of diabetes mellitus and is known to be mainly caused by the activation of quiescent hepatic stellate cells (HSCs) by high glucose stimulation [48]. The activation of these cells is known to be promoted by TSC22D4 [49], which is a gene that acts as a critical controller of diabetic hyperglycemia [50] and has elevated levels in patients with T2D with non-alcoholic fatty liver disease or steatohepatitis. In summary, these results suggest that the associations found between the interactions and type 2 diabetes can be mediated by the connection between variants with gene expression and their combined effects on gene pathways.
4. Discussion
Even though some studies have approached the analysis of variant interaction and its relation with complex disorders, it still represents a challenge. This is a consequence of the vast computational power needed to perform an extensive search across all the possible interactions at a genome-wide level. Thanks to technological advances, the combination of HPC methodologies with low-cost methods, such as the ones used in our study, is beginning to allow the analysis of the simplest interaction case: pairwise interactions. However, these low-cost methods have diverse limitations that can result in low statistical power for detecting significant pairs in real genomic datasets [5]. In this study, we confirmed that the use of more powerful methods, such as MDR, is key to detecting these significant pairwise interactions [51,52].
However, even after developing an optimized HPC architecture with some of the state-of-the-art technologies, processing a whole genomic dataset is still out of the picture, thus limiting the analysis to a reduced dataset. For this reason, in this study, we ensured some degree of association between the pairs and the disease using a chi-square method to filter and reduce the input dataset (p-value < ). Importantly, in contrast with other studies based on stricter filters [21,53], and despite the reduction of the dataset to a feasible size, our proposed p-value threshold facilitated the inclusion in the study of potentially significant pairs.
Our implementation of the MDR to detect pairwise variant interactions was implemented in a Singularity container, allowing the easy reproduction of the methodology in any environment. It is a plug-and-play framework, does not need the installation of any additional software other than Singularity itself, and can run on any operating system (OS) without root access. In comparison with traditional virtual machine environments, it also reduces the number of resources needed, since no OS image is needed [32]. While the use of a multi-node setup is encouraged to reduce the computational time, the model can also run in a single-node environment. Although it can be argued that other possible lines of work or hardware implementations may reduce the computational time, such as the use of GPUs or FPGAs [54], these technologies are not typically available and may restrict the method’s access to other research groups. However, some interesting future work could focus on optimizing the method by further exploring different technologies.
In terms of applicability, the use of our MDR approach on a subset of 1,883,192 pairs has enhanced the discovery of 104 pairs of variants associated with type 2 diabetes (T2D). Importantly, 93% of these associations correspond to already known T2D independent signals, and, according to previous research, 2 of the 104 pairs have some functional connection with the disease [45,46,47,48,49,50]. These findings suggest gene expression and gene pathways as one of the putative underlying molecular mechanisms to mediate the link between these pairs and T2D and, therefore, possibly enhance the development of the disease.
However, for the 7% of novel associations with T2D found in this study, further experimental validation will be necessary to confirm the relations between these pairs and their association with the disease as well as to improve the understanding of disease pathophysiology. In addition to this, further efforts will be necessary to translate the results into clinical practice—involving, for example, the integration of the outcomes with current predictors and even the use of other cohorts to ensure their generalization across different populations. The advances in that direction will pave the way towards the early detection of the disease and the generation of new prevention and treatment protocols.
Notably, this study is limited to inspecting pairs of variants, while hundreds of variants combined with multiple environmental variables are expected to be involved in complex disease development [55]. Based on the results obtained in this study, the analysis of trios, quadruplets, and groups of higher-order interactions and their combination with environmental factors will enhance understanding of the underlying molecular mechanisms of complex phenotypes in future studies. In this direction, increasing the computational power of the method and even using other models such as random forests or Bayesian additive regression trees will enhance the exploration of these complex experiments.
Finally, although this study is focused on type 2 diabetes, other complex phenotypes can be analyzed in the future using the same methodology. This will enhance the genomic exploration of complex disorders and will pave the way toward a better comprehension of the underlying molecular mechanisms of this type of disorder.
Regarding the performance of the model, the multiple approaches that have been previously tested to identify pairwise combinations associated with complex diseases have only been applied in reduced datasets: thus, adding a layer of complexity for the comparison with other methodological and computational frameworks. For this reason, the replication of the outcomes obtained in this work was limited to the inspection of previously identified variants associated in a single independent manner with disease development, and further efforts will be needed to allow the comparison of different methods applied to the same dataset.
In any case, all these results place the proposed MDR architecture as a valid, efficient, and portable solution to study variant interactions in real reduced genomic datasets. Future work should focus on further optimization of the method to reduce the computational cost and to be able to process bigger datasets. Some technologies could be explored in this direction, such as implementing a serverless architecture to use the available resources efficiently. Also, other implementations based on low-level code may be able to reduce the computational time but could impede portability.
5. Conclusions
We propose a computational pipeline able to study variant interaction in real genomic datasets. Using a two-step approach, we use a statistical test of interaction to reduce the dataset and a containerized MDR as a valid, efficient, and portable solution to analyze the interactions. The proposed methodology was able to find 104 pairs statistically associated with type 2 diabetes, containing both variants that were already known as associated and novel signals that were discovered in this study.
Supplementary Materials
The following supporting information can be download at the following www.mpdi.com/xxx/s1, Table S1, List of significant pairs; Table S2, Variant combinations and the presence of the alternative allele, Equations (S1)–(S3), Odds ration.
Author Contributions
G.G.-S. and J.L.B. designed the framework. G.G.-S. developed the application and performed the main experiments. I.M. performed the chi-square method, and L.A. performed the functional interpretation. Both M.Á.P. and D.T. collaborated on the design of the experiments and the analysis. All authors have read and agreed to the published version of the manuscript.
Funding
This work was partially financed by the European Commission (EU-HORIZON NEARDATA GA.101092644) and by the Universitat Politècnica de Catalunya (45-FPIUPC2018); it was also partially financed by Generalitat de Catalunya (AGAUR) under grant agreement 2021-SGR-00478; it was also partially financed by the Spanish Ministry of Science (MICINN), the Research State Agency (AEI), and European Regional Development Funds (ERDF/FEDER) under grant agreement PID2021-126248OB-I00, MCIN/AEI/10.13039/501100011033/FEDER, UE.
Institutional Review Board Statement
The access to this data was approved by the Institutional Review Board of the Barcelona Supercomputing Center (BSC). Informed consent was obtained from all subjects to use their coded DNA samples and data for a broad range of genetic research by third-party investigators.
Informed Consent Statement
Not applicable.
Data Availability Statement
The data that support the findings of this study are available from the Center for Genetic Medicine at Northwestern University, but restrictions apply to the availability of these data, which were used under license for the current study and so are not publicly available. Data are, however, available from the authors (gonzalo.gomez@upc.edu) upon reasonable request and with permission of the Center for Genetic Medicine at Northwestern University.
Acknowledgments
We acknowledge PRACE for awarding us access to the MareNostrum supercomputer at the Barcelona Supercomputing Center, based in Barcelona, Spain, under proposal number 2018194698.
Conflicts of Interest
The authors declare no conflicts of interest.
References
- Taliun, D.; Harris, D.N.; Kessler, M.D.; Carlson, J.; Szpiech, Z.A.; Torres, R.; Taliun, S.A.G.; Corvelo, A.; Gogarten, S.M.; Kang, H.M.; et al. Sequencing of 53,831 diverse genomes from the NHLBI TOPMed Program. Nature 2021, 590, 290–299. [Google Scholar] [CrossRef] [PubMed]
- Uffelmann, E.; Huang, Q.Q.; Munung, N.S.; De Vries, J.; Okada, Y.; Martin, A.R.; Martin, H.C.; Lappalainen, T.; Posthuma, D. Genome-wide association studies. Nat. Rev. Methods Prim. 2021, 1, 59. [Google Scholar] [CrossRef]
- Visscher, P.M.; Brown, M.A.; McCarthy, M.I.; Yang, J. Five years of GWAS discovery. Am. J. Hum. Genet. 2012, 90, 7–24. [Google Scholar] [CrossRef] [PubMed]
- Hayes, B. Overview of statistical methods for genome-wide association studies (GWAS). In Genome-Wide Association Studies and Genomic Prediction; Springer: Berlin/Heidelberg, Germany, 2013; pp. 149–169. [Google Scholar]
- Alonso, L.; Morán, I.; Salvoro, C.; Torrents, D. In Search of Complex Disease Risk through Genome Wide Association Studies. Mathematics 2021, 9, 3083. [Google Scholar] [CrossRef]
- Yang, W.; Charles Gu, C. Random forest fishing: A novel approach to identifying organic group of risk factors in genome-wide association studies. Eur. J. Hum. Genet. 2014, 22, 254–259. [Google Scholar] [CrossRef] [PubMed]
- Moore, J.H. A global view of epistasis. Nat. Genet. 2005, 37, 13–14. [Google Scholar] [CrossRef] [PubMed]
- Niel, C.; Sinoquet, C.; Dina, C.; Rocheleau, G. A survey about methods dedicated to epistasis detection. Front. Genet. 2015, 6, 285. [Google Scholar] [CrossRef] [PubMed]
- Purcell, S.; Neale, B.; Todd-Brown, K.; Thomas, L.; Ferreira, M.A.; Bender, D.; Maller, J.; Sklar, P.; De Bakker, P.I.; Daly, M.J.; et al. PLINK: A tool set for whole-genome association and population-based linkage analyses. Am. J. Hum. Genet. 2007, 81, 559–575. [Google Scholar] [CrossRef] [PubMed]
- Goudey, B.; Rawlinson, D.; Wang, Q.; Shi, F.; Ferra, H.; Campbell, R.M.; Stern, L.; Inouye, M.T.; Ong, C.S.; Kowalczyk, A. GWIS-model-free, fast and exhaustive search for epistatic interactions in case-control GWAS. BMC Genom. 2013, 14, S10. [Google Scholar] [CrossRef]
- Wan, X.; Yang, C.; Yang, Q.; Xue, H.; Fan, X.; Tang, N.L.; Yu, W. BOOST: A fast approach to detecting gene-gene interactions in genome-wide case-control studies. Am. J. Hum. Genet. 2010, 87, 325–340. [Google Scholar] [CrossRef]
- Jafari, M.; Ansari-Pour, N. Why, when and how to adjust your P values? Cell J. 2019, 20, 604. [Google Scholar] [PubMed]
- Greene, C.S.; Himmelstein, D.S.; Kiralis, J.; Moore, J.H. The informative extremes: Using both nearest and farthest individuals can improve relief algorithms in the domain of human genetics. In Proceedings of the Evolutionary Computation, Machine Learning and Data Mining in Bioinformatics: 8th European Conference, EvoBIO 2010, Istanbul, Turkey, 7–9 April 2010; Proceedings 8. Springer: Berlin/Heidelberg, Germany, 2010; pp. 182–193. [Google Scholar]
- Mendez, D.; Gaulton, A.; Bento, A.P.; Chambers, J.; De Veij, M.; Félix, E.; Magariños, M.P.; Mosquera, J.F.; Mutowo, P.; Nowotka, M.; et al. ChEMBL: Towards direct deposition of bioassay data. Nucleic Acids Res. 2019, 47, D930–D940. [Google Scholar] [CrossRef]
- Oughtred, R.; Stark, C.; Breitkreutz, B.J.; Rust, J.; Boucher, L.; Chang, C.; Kolas, N.; O’Donnell, L.; Leung, G.; McAdam, R.; et al. The BioGRID interaction database: 2019 update. Nucleic Acids Res. 2019, 47, D529–D541. [Google Scholar] [CrossRef] [PubMed]
- Jiang, R.; Tang, W.; Wu, X.; Fu, W. A random forest approach to the detection of epistatic interactions in case-control studies. BMC Bioinform. 2009, 10, S65. [Google Scholar] [CrossRef]
- Zhang, Y.; Liu, J.S. Bayesian inference of epistatic interactions in case-control studies. Nat. Genet. 2007, 39, 1167–1173. [Google Scholar] [CrossRef]
- Payne, J.L.; Greene, C.S.; Hill, D.P.; Moore, J.H. Sensible initialization of a computational evolution system using expert knowledge for epistasis analysis in human genetics. In Exploitation of Linkage Learning in Evolutionary Algorithms; Springer: Berlin/Heidelberg, Germany, 2010; pp. 215–226. [Google Scholar]
- Wang, Y.; Liu, X.; Robbins, K.; Rekaya, R. AntEpiSeeker: Detecting epistatic interactions for case-control studies using a two-stage ant colony optimization algorithm. BMC Res. Notes 2010, 3, 117. [Google Scholar] [CrossRef]
- Ritchie, M.; Hahn, L.; Moore, J. Power of multifactor dimensionality reduction for detecting gene-gene interactions in the presence of genotyping error, missing data, phenocopy, and genetic heterogeneity. Genet. Epidemiol. Off. Publ. Int. Genet. Epidemiol. Soc. 2003, 24, 150–157. [Google Scholar] [CrossRef] [PubMed]
- Greene, C.S.; Sinnott-Armstrong, N.A.; Himmelstein, D.S.; Park, P.J.; Moore, J.H.; Harris, B.T. Multifactor dimensionality reduction for graphics processing units enables genome-wide testing of epistasis in sporadic ALS. Bioinformatics 2010, 26, 694–695. [Google Scholar] [CrossRef]
- Omri Gottesman, E.A. The Electronic Medical Records and Genomics (eMERGE) Network: Past, present, and future. Genet. Med. 2013, 15, 761–771. [Google Scholar] [CrossRef]
- Bonàs-Guarch, S.; Guindo-Martínez, M.; Miguel-Escalada, I.; Grarup, N.; Sebastian, D.; Rodriguez-Fos, E.; Sánchez, F.; Planas-Fèlix, M.; Cortes-Sánchez, P.; González, S.; et al. Re-analysis of public genetic data reveals a rare X-chromosomal variant associated with type 2 diabetes. Nat. Commun. 2018, 9, 321. [Google Scholar] [CrossRef]
- Chavarría-Miranda, D.; Huang, Z.; Chen, Y. High-performance computing (HPC): Application & use in the power grid. In Proceedings of the 2012 IEEE Power and Energy Society General Meeting, San Diego, CA, USA, 22–26 July 2012; pp. 1–7. [Google Scholar]
- Zaharia, M.; Xin, R.S.; Wendell, P.; Das, T.; Armbrust, M.; Dave, A.; Meng, X.; Rosen, J.; Venkataraman, S.; Franklin, M.J.; et al. Apache spark: A unified engine for big data processing. Commun. ACM 2016, 59, 56–65. [Google Scholar] [CrossRef]
- Shvachko, K.; Kuang, H.; Radia, S.; Chansler, R. The hadoop distributed file system. In Proceedings of the 2010 IEEE 26th Symposium on Mass Storage Systems and Technologies (MSST), Incline Village, NV, USA, 3–7 May 2010; pp. 1–10. [Google Scholar]
- Van Rossum, G. Python Programming Language. In Proceedings of the USENIX Annual Technical Conference, Santa Clara, CA, USA, 17–22 June 2007; Volume 41, pp. 1–36. [Google Scholar]
- Harris, C.R.; Millman, K.J.; Van Der Walt, S.J.; Gommers, R.; Virtanen, P.; Cournapeau, D.; Wieser, E.; Taylor, J.; Berg, S.; Smith, N.J.; et al. Array programming with NumPy. Nature 2020, 585, 357–362. [Google Scholar] [CrossRef] [PubMed]
- Zaharia, M.; Chowdhury, M.; Das, T.; Dave, A.; Ma, J.; McCauley, M.; Franklin, M.J.; Shenker, S.; Stoica, I. Resilient Distributed Datasets: A Fault-Tolerant Abstraction for in-Memory Cluster Computing. In Proceedings of the 9th USENIX Conference on Networked Systems Design and Implementation, San Jose, CA, USA, 25–27 April 2012; p. 2. [Google Scholar]
- Patel, A.B.; Birla, M.; Nair, U. Addressing big data problem using Hadoop and Map Reduce. In Proceedings of the 2012 Nirma University International Conference on Engineering (NUiCONE), Ahmedabad, India, 6–8 December 2012; pp. 1–5. [Google Scholar]
- Digitale, J.C.; Martin, J.N.; Glymour, M.M. Tutorial on directed acyclic graphs. J. Clin. Epidemiol. 2022, 142, 264–267. [Google Scholar] [CrossRef] [PubMed]
- Potdar, A.M.; Narayan, D.; Kengond, S.; Mulla, M.M. Performance evaluation of docker container and virtual machine. Procedia Comput. Sci. 2020, 171, 1419–1428. [Google Scholar] [CrossRef]
- Sefraoui, O.; Aissaoui, M.; Eleuldj, M. OpenStack: Toward an open-source solution for cloud computing. Int. J. Comput. Appl. 2012, 55, 38–42. [Google Scholar] [CrossRef]
- Barcelona Supercomputing Center. Marenostrum Technical Information. 2017. Available online: https://www.bsc.es/marenostrum/marenostrum/technical (accessed on 1 June 2023).
- Variant Interaction Analysis Application Open-Data Repository. Available online: https://gitlab.bsc.es/datacentric-computing/via.git (accessed on 1 June 2023).
- Chen, J.; Spracklen, C.N.; Marenne, G.; Varshney, A.; Corbin, L.J.; Luan, J.; Willems, S.M.; Wu, Y.; Zhang, X.; Horikoshi, M.; et al. The trans-ancestral genomic architecture of glycemic traits. Nat. Genet. 2021, 53, 840–860. [Google Scholar] [CrossRef]
- Mahajan, A.; Taliun, D.; Thurner, M.; Robertson, N.R.; Torres, J.M.; Rayner, N.W.; Payne, A.J.; Steinthorsdottir, V.; Scott, R.A.; Grarup, N.; et al. Fine-mapping type 2 diabetes loci to single-variant resolution using high-density imputation and islet-specific epigenome maps. Nat. Genet. 2018, 50, 1505–1513. [Google Scholar] [CrossRef]
- Scott, R.A.; Scott, L.J.; Mägi, R.; Marullo, L.; Gaulton, K.J.; Kaakinen, M.; Pervjakova, N.; Pers, T.H.; Johnson, A.D.; Eicher, J.D.; et al. An expanded genome-wide association study of type 2 diabetes in Europeans. Diabetes 2017, 66, 2888–2902. [Google Scholar] [CrossRef] [PubMed]
- DIAbetes Genetics Replication And Meta-analysis (DIAGRAM) Consortium; Asian Genetic Epidemiology Network Type 2 Diabetes (AGEN-T2D) Consortium; South Asian Type 2 Diabetes (SAT2D) Consortium; Mexican American Type 2 Diabetes (MAT2D) Consortium; Type 2 Diabetes Genetic Exploration by Nex-generation sequencing in muylti-Ethnic Samples (T2D-GENES) Consortium; Mahajan, A.; Go, M.J.; Zhang, W.; Below, J.E.; Gaulton, K.J.; et al. Genome-wide trans-ancestry meta-analysis provides insight into the genetic architecture of type 2 diabetes susceptibility. Nat. Genet. 2014, 46, 234–244. [Google Scholar] [CrossRef]
- Alonso, L.; Piron, A.; Morán, I.; Guindo-Martínez, M.; Bonàs-Guarch, S.; Atla, G.; Miguel-Escalada, I.; Royo, R.; Puiggròs, M.; Garcia-Hurtado, X.; et al. TIGER: The gene expression regulatory variation landscape of human pancreatic islets. Cell Rep. 2021, 37, 109807. [Google Scholar] [CrossRef]
- Consortium, G. The GTEx Consortium atlas of genetic regulatory effects across human tissues. Science 2020, 369, 1318–1330. [Google Scholar] [CrossRef]
- McLaren, W.; Gil, L.; Hunt, S.E.; Riat, H.S.; Ritchie, G.R.; Thormann, A.; Flicek, P.; Cunningham, F. The ensembl variant effect predictor. Genome Biol. 2016, 17, 112. [Google Scholar] [CrossRef]
- Raudvere, U.; Kolberg, L.; Kuzmin, I.; Arak, T.; Adler, P.; Peterson, H.; Vilo, J. g: Profiler: A web server for functional enrichment analysis and conversions of gene lists (2019 update). Nucleic Acids Res. 2019, 47, W191–W198. [Google Scholar] [CrossRef]
- Barcelona Supercomputing Center. GREASY User Guide. 2014. Available online: https://github.com/BSC-Support-Team/GREASY (accessed on 1 June 2023).
- Nonogaki, K.; Kaji, T.; Yamazaki, T.; Murakami, M. Treatment with FGFR2-IIIc monoclonal antibody suppresses weight gain and adiposity in KKAy mice. Nutr. Diabetes 2016, 6, e233. [Google Scholar] [CrossRef]
- Yılmaz Kara, B.; Kalcan, S.; Özyurt, S.; Gümüş, A.; Özçelik, N.; Karadoğan, D.; Şahin, Ü. Weight loss as the first-line therapy in patients with severe obesity and obstructive sleep apnea syndrome: The role of laparoscopic sleeve gastrectomy. Obes. Surg. 2021, 31, 1082–1091. [Google Scholar] [CrossRef]
- Typiak, M.; Kulesza, T.; Rachubik, P.; Rogacka, D.; Audzeyenka, I.; Angielski, S.; Saleem, M.A.; Piwkowska, A. Role of klotho in hyperglycemia: Its levels and effects on fibroblast growth factor receptors, glycolysis, and glomerular filtration. Int. J. Mol. Sci. 2021, 22, 7867. [Google Scholar] [CrossRef]
- Sugimoto, R.; Enjoji, M.; Kohjima, M.; Tsuruta, S.; Fukushima, M.; Iwao, M.; Sonta, T.; Kotoh, K.; Inoguchi, T.; Nakamuta, M. High glucose stimulates hepatic stellate cells to proliferate and to produce collagen through free radical production and activation of mitogen-activated protein kinase. Liver Int. 2005, 25, 1018–1026. [Google Scholar] [CrossRef]
- Sakurai, M.; Weber, P.; Wolff, G.; Wieder, A.; Szendroedi, J.; Herzig, S.; Üstünel, B.E. TSC22D4 promotes TGFβ1-induced activation of hepatic stellate cells. Biochem. Biophys. Res. Commun. 2022, 618, 46–53. [Google Scholar] [CrossRef]
- Zhao, B.; Li, S.; Guo, Z.; Chen, Z.; Zhang, X.; Xu, C.; Chen, J.; Wei, C. Dopamine receptor D2 inhibition alleviates diabetic hepatic stellate cells fibrosis by regulating the TGF-β1/Smads and NFκB pathways. Clin. Exp. Pharmacol. Physiol. 2021, 48, 370–380. [Google Scholar] [CrossRef]
- Moore, J.H.; Andrews, P.C. Epistasis analysis using multifactor dimensionality reduction. In Epistasis: Methods and Protocols; Springer: Berlin/Heidelberg, Germany, 2015; pp. 301–314. [Google Scholar]
- Ritchie, M.D.; Hahn, L.W.; Roodi, N.; Bailey, L.R.; Dupont, W.D.; Parl, F.F.; Moore, J.H. Multifactor-dimensionality reduction reveals high-order interactions among estrogen-metabolism genes in sporadic breast cancer. Am. J. Hum. Genet. 2001, 69, 138–147. [Google Scholar] [CrossRef] [PubMed]
- Collins, R.L.; Hu, T.; Wejse, C.; Sirugo, G.; Williams, S.M.; Moore, J.H. Multifactor dimensionality reduction reveals a three-locus epistatic interaction associated with susceptibility to pulmonary tuberculosis. BioData Min. 2013, 6, 4. [Google Scholar] [CrossRef] [PubMed]
- Kuon, I.; Tessier, R.; Rose, J. FPGA architecture: Survey and challenges. Found. Trends Electron. Des. Autom. 2008, 2, 135–253. [Google Scholar] [CrossRef]
- Manolio, T.A.; Brooks, L.D.; Collins, F.S. A HapMap harvest of insights into the genetics of common disease. Am. Soc. Clin. Investig. 2008, 118, 1590–1605. [Google Scholar] [CrossRef] [PubMed]


Disclaimer/Publisher’s Note: The statements, opinions and data contained in all publications are solely those of the individual author(s) and contributor(s) and not of MDPI and/or the editor(s). MDPI and/or the editor(s) disclaim responsibility for any injury to people or property resulting from any ideas, methods, instructions or products referred to in the content. |
© 2024 by the authors. Licensee MDPI, Basel, Switzerland. This article is an open access article distributed under the terms and conditions of the Creative Commons Attribution (CC BY) license (https://creativecommons.org/licenses/by/4.0/).