Article

AI-Enhanced Prediction of Peak Rate of Torque Development from Accelerometer Signals

1
Sport Technology Research Laboratory, Faculty of Kinesiology, University of Calgary, 2500 University Drive NW, Calgary, AB T2N 1N4, Canada
2
Neuromuscular Research Laboratory, National Institute of Traumatology and Orthopedics (INTO), Rio de Janeiro 20940-070, Brazil
*
Author to whom correspondence should be addressed.
Appl. Sci. 2024, 14(12), 5137; https://doi.org/10.3390/app14125137
Submission received: 4 April 2024 / Revised: 30 May 2024 / Accepted: 10 June 2024 / Published: 13 June 2024

Abstract

:
This study explores the use of accelerometer signals as the predictors of Rate of Torque Development (RTD) using an artificial neural network (ANN) prediction model. Sixteen physically active men participated (29 ± 5 years), performing explosive isometric contractions while acceleration (ACC) signals were measured. The dataset, comprising ACC signals and corresponding RTD values, was split into training and testing (70–30%) sets for ANN training. The trained model predicted the peak RTD values from the ACC signal inputs. The measured and predicted peak RTD values were compared, with no significant differences observed (p = 0.852). A strong linear fit (R² = 0.81), ICC = 0.94 (p < 0.001), and a mean bias of 30.8 Nm/s demonstrated almost perfect agreement between measures. The study demonstrates the feasibility of using accelerometer data to predict peak RTD, offering a portable and cost-effective method compared to traditional equipment. The ANN prediction model provides a reliable means of estimating RTD from ACC signals, potentially enhancing accessibility to RTD assessment in sports and rehabilitation settings. The findings support the use of ANN models for predicting RTD, highlighting the potential of AI in developing performance analysis tools.

1. Introduction

Rate of Torque Development (RTD) is a crucial metric that assesses an individual’s ability to rapidly generate strength—also known as explosive strength [1,2,3]. RTD has been categorized as early (≤100 ms) or late (≥200 ms) [4,5]. The former is mainly affected by mechanisms involving neural activation transmitted by motor neurons to muscles [1,2,5,6,7], and the latter is strongly linked to maximal strength and is influenced by similar underlying mechanisms [4,8,9]. Consequently, a higher RTD indicates a faster and more efficient neuromuscular response, determined by motor unit activation rate (i.e., higher neural drive increases the explosive capacity) and muscle morphology (i.e., muscle thickness and muscle architecture) [1,10,11,12]. RTD extends our capacity to evaluate the maximal force-generating capacity and plays a pivotal role in activities requiring quick muscle contractions and short-duration execution, such as jumping, sprinting, or weightlifting [13,14,15,16,17], as it reflects the muscles’ capability to swiftly generate force during the very initial phase of muscle contraction [1,2]. Also, RTD is often associated with enhanced athletic performance, injury prevention, and return to sport readiness [18,19,20,21,22,23,24,25,26,27].
Thus, by incorporating a time-restricted framework for strength generation, RTD enhances our understanding of muscle force production by examining how someone can respond appropriately to external stimuli and adjust their motor responses during specific events. A quick motor adaptation could be a key factor not only in enhancing performance but also in preventing injuries by theoretically improving dynamic joint stabilization and reducing the risk of orthopedic injuries, such as anterior cruciate ligament tears. Furthermore, measuring RTD in general clinical populations can provide insights into the rehabilitation progress and functional capabilities of patients recovering from musculoskeletal injuries or neurological disorders. Therefore, monitoring RTD can serve as a valuable diagnostic and prognostic tool in both, sports medicine, and physical therapy [28,29].
Measuring RTD typically demands specialized equipment such as an isokinetic dynamometer or load cells [2,30,31]. It is a fact that relying on an isokinetic dynamometer is a costly and laboratory-based choice. However, while this option may suit major sports institutions, scheduling an evaluation session remains a logistical challenge to balance with training sessions. Although load cells are relatively less costly and can be used in the field, they still face technical struggles regarding signal processing—including onset detection—and data extraction. In fact, to the best of our knowledge, there is currently no commercially available tool for generating RTD indexes in real-time [31], and the torque x time signal requires post-processing by a digital signal processing expert, limiting its accessibility to sports practitioners. Those factors are barriers to the widespread use of RTD for sports and the general population. Thus, our work looks at creating the opportunity to investigate viable alternatives for measuring explosive strength capacity.
Inertial sensors, particularly accelerometers, are capable of measuring acceleration or vibrations and are widely accessible nowadays [32,33]. Accelerometers are specifically designed sensors to measure linear acceleration (ACC). These sensors are commonly found in devices such as smartphones and fitness trackers [34,35]. In human performance sciences, accelerometers are utilized to monitor and analyze human movement patterns, providing valuable insights into activities like walking, running, jumping, and other physical activities [33,36]. They can measure acceleration in multiple axes—typically the x, y, and z axes—allowing for a comprehensive analysis of motion dynamics. An accelerometer placed on the segment moved by a muscle can provide information about muscle contraction, including initial force production. Considering that RTD is measured as torque per unit time (e.g., Nm/s), it can be considered analogous to a velocity measure. During explosive contraction testing, it is expected that the evaluated individual produces the maximum force in an isometric task in the least time, increasing from total rest (relaxed muscle). This rapid increase in force leads to a corresponding sudden increase in limb acceleration. Thus, theoretically, accelerometers can provide an indirect but informative signal about explosive force production. If possible, using accelerometers to indirectly measure RTD offers advantages in terms of accessibility, cost-effectiveness, and ease of use compared to traditional methods that require specialized equipment.
The implementation of such a system has the potential to be transformative, enabling more precise monitoring and the optimization of explosive strength training routines. Specifically, the integration of real-time data analysis through portable technology can facilitate immediate feedback and dynamically adjust training parameters to maximize performance gains while minimizing the risk of injury.
With the current increase in accessibility to Artificial Intelligence (AI), attributed to the popularization of the technique and the increase in computing power, it has become possible to utilize AI for the development of new performance analysis tools [37]. In this context, an artificial neural network (ANN) prediction model can be employed to predict the RTD from ACC signals. ANNs are computational models inspired by the structure and function of the human brain, capable of learning complex patterns in data [37]. The ANN can be trained on a dataset comprising ACC signals as input and corresponding RTD values as output, using a supervised learning approach. Then, the trained model can be used to predict RTD values from ACC signal inputs.
This study explored the use of accelerometer signals as predictors of peak RTD using an ANN prediction model. We chose the peak RTD because it is not affected by the onset determination and reflects the maximum explosive capacity. Specifically, a dataset was used to train an ANN using a supervised learning approach. The prediction model was then used to predict the peak RTD and compare the measured and predicted values. We hypothesized that the accelerometer signal could predict the RTD signals.

2. Materials and Methods

2.1. Participants

A convenience sample of 16 physically active men (mean age ± SD: 29 ± 5 years, body mass: 83 ± 11 kg, height: 177 ± 11 cm) with experience in strength training was recruited for the study. The participants were selected based on their familiarity with strength training routines, ensuring a level of expertise in the exercises being assessed. The exclusion criteria included a history of lower limb or spine orthopedic surgery, as well as any pre-existing pain that could interfere with the assessments. Additionally, the individuals with recent (less than 1 year) lower limb joint or muscle injuries were excluded from participation to ensure the integrity of the data collected. The study protocol was approved by the local ethics committee for human experiments, ensuring that all the procedures adhered to the ethical guidelines and standards. Prior to participating in the study, all the participants provided written informed consent, indicating their understanding of the study procedures, potential risks, and benefits. This ensured that the participants were fully aware of their involvement and consented to take part in the research.

2.2. Experimental Protocol

All the participants attended the laboratory for two sessions. Each testing session lasted approximately 60 min, allowing sufficient time to explain and execute the assessments. To minimize potential fatigue effects and ensure consistency in performance, the time elapsed between the two sessions ranged from 2 to 7 days, providing ample recovery time for the participants. During the testing sessions, the participants engaged in a series of explosive isometric contractions targeting the knee extensors. Concurrently, we recorded the ACC signal.

2.3. Explosive Isometric Contractions (Strength and Acceleration Signals)

Explosive knee extensor strength was assessed using an isokinetic dynamometer (Humac Norm II, CSMI, USA). The participants performed three explosive MVCs of ~3 s at 60° of flexion (0° = full extension), interspersed by rest periods of 30 s. The participants were consistently instructed to produce force “as fast and hard as possible” during the explosive MVC and to keep the maximum effort as long as requested by the examiner. To minimize the dampening effect occurring at the interface between the shin and the lever, and simultaneously to avoid pain, a standard soccer hard shin guard was used [1,22]. Our group has used this same procedure in previous investigations [1,10,16,22]. An accelerometer (EMG 830c®, EMG System do Brasil, São José dos Campos, SP, Brazil) was placed on the shin guard to measure ACC signals in the x, y, and z axes (measured in g, Figure 1). Both torque and ACC signals were sampled at 1 kHz and synchronized (EMG 830c®, EMG System do Brasil, São José dos Campos, SP, Brazil). Both the right and left limbs were tested randomly.

2.4. Signal Processing and Dataset Organization

The signals were smoothed using a Butterworth 4th order lowpass, 50 Hz cut-off frequency, zero-lag [1]. The torque signal onset was automatically identified and visually checked using a 1 Nm threshold [1,22]. Then, the RTD signal was calculated using the torque signal first derivate. The RTD and ACC signals were cropped using the onset as a reference. A period of 500 ms was included before and after the onset to equalize the signal length (1000 samples). Both the right and left limbs from the two testing sessions were used to create the dataset with a total of 192 signals (16 participants × 2 limbs × 3 MVCs × 2 sessions).

2.5. Deep Learning

We utilized an artificial neural network (ANN) approach to predict the RTD signal from the ACC signal. To ensure robust model performance, the dataset was split into distinct training (70%) and testing (30%) sets, allowing for the rigorous evaluation of the predictive capabilities of the model. The architecture of the neural network model, as outlined in Table 1, was designed to capture the intricate dynamics between the ACC and RTD signals. It comprised multiple dense layers equipped with rectified linear unit (ReLU) activation functions, known for their ability to introduce non-linearity into the model, thereby capturing complex patterns in the data. The model culminated in a final linear activation output layer, facilitating the prediction of RTD values based on the input ACC signals.
To optimize model training, we employed the mean squared error loss function and stochastic gradient descent optimizer, ensuring efficient convergence towards optimal model parameters. The training process involved iteratively updating the model parameters using batches of data, with a batch size of 20 and 1000 epochs to iteratively refine the model’s predictive performance. Following model training, the prediction model was applied to the testing set, comprising a subset of the dataset (n = 58), to assess its generalization ability to unseen data. To enhance the smoothness and clarity of the predicted signals, a low-pass, 4th-order Butterworth filter with a 50 Hz cut-off frequency and zero lag was applied. This filtering process helped to mitigate noise and artifacts, ensuring the reliability of the predicted RTD signals. The implementation of the ANNs was carried out in a Python environment using TensorFlow and Keras libraries. The computational resources utilized for model training included a Google Collaboratory Notebook with a CPU-based backend boasting 12 GB of RAM, ensuring sufficient computational power for complex model computations. Further analyses were then performed using the signals.

2.6. Rate of Torque Development

We calculated the peak RTD (maximum instantaneous values) from the measured signals (using the isokinetic dynamometer) and the predicted signals (from the ANN). We chose the peak RTD due to its widespread use in the literature and its consistent measurement [38] and because it is not affected by onset fluctuations.

2.7. Statistical Analysis
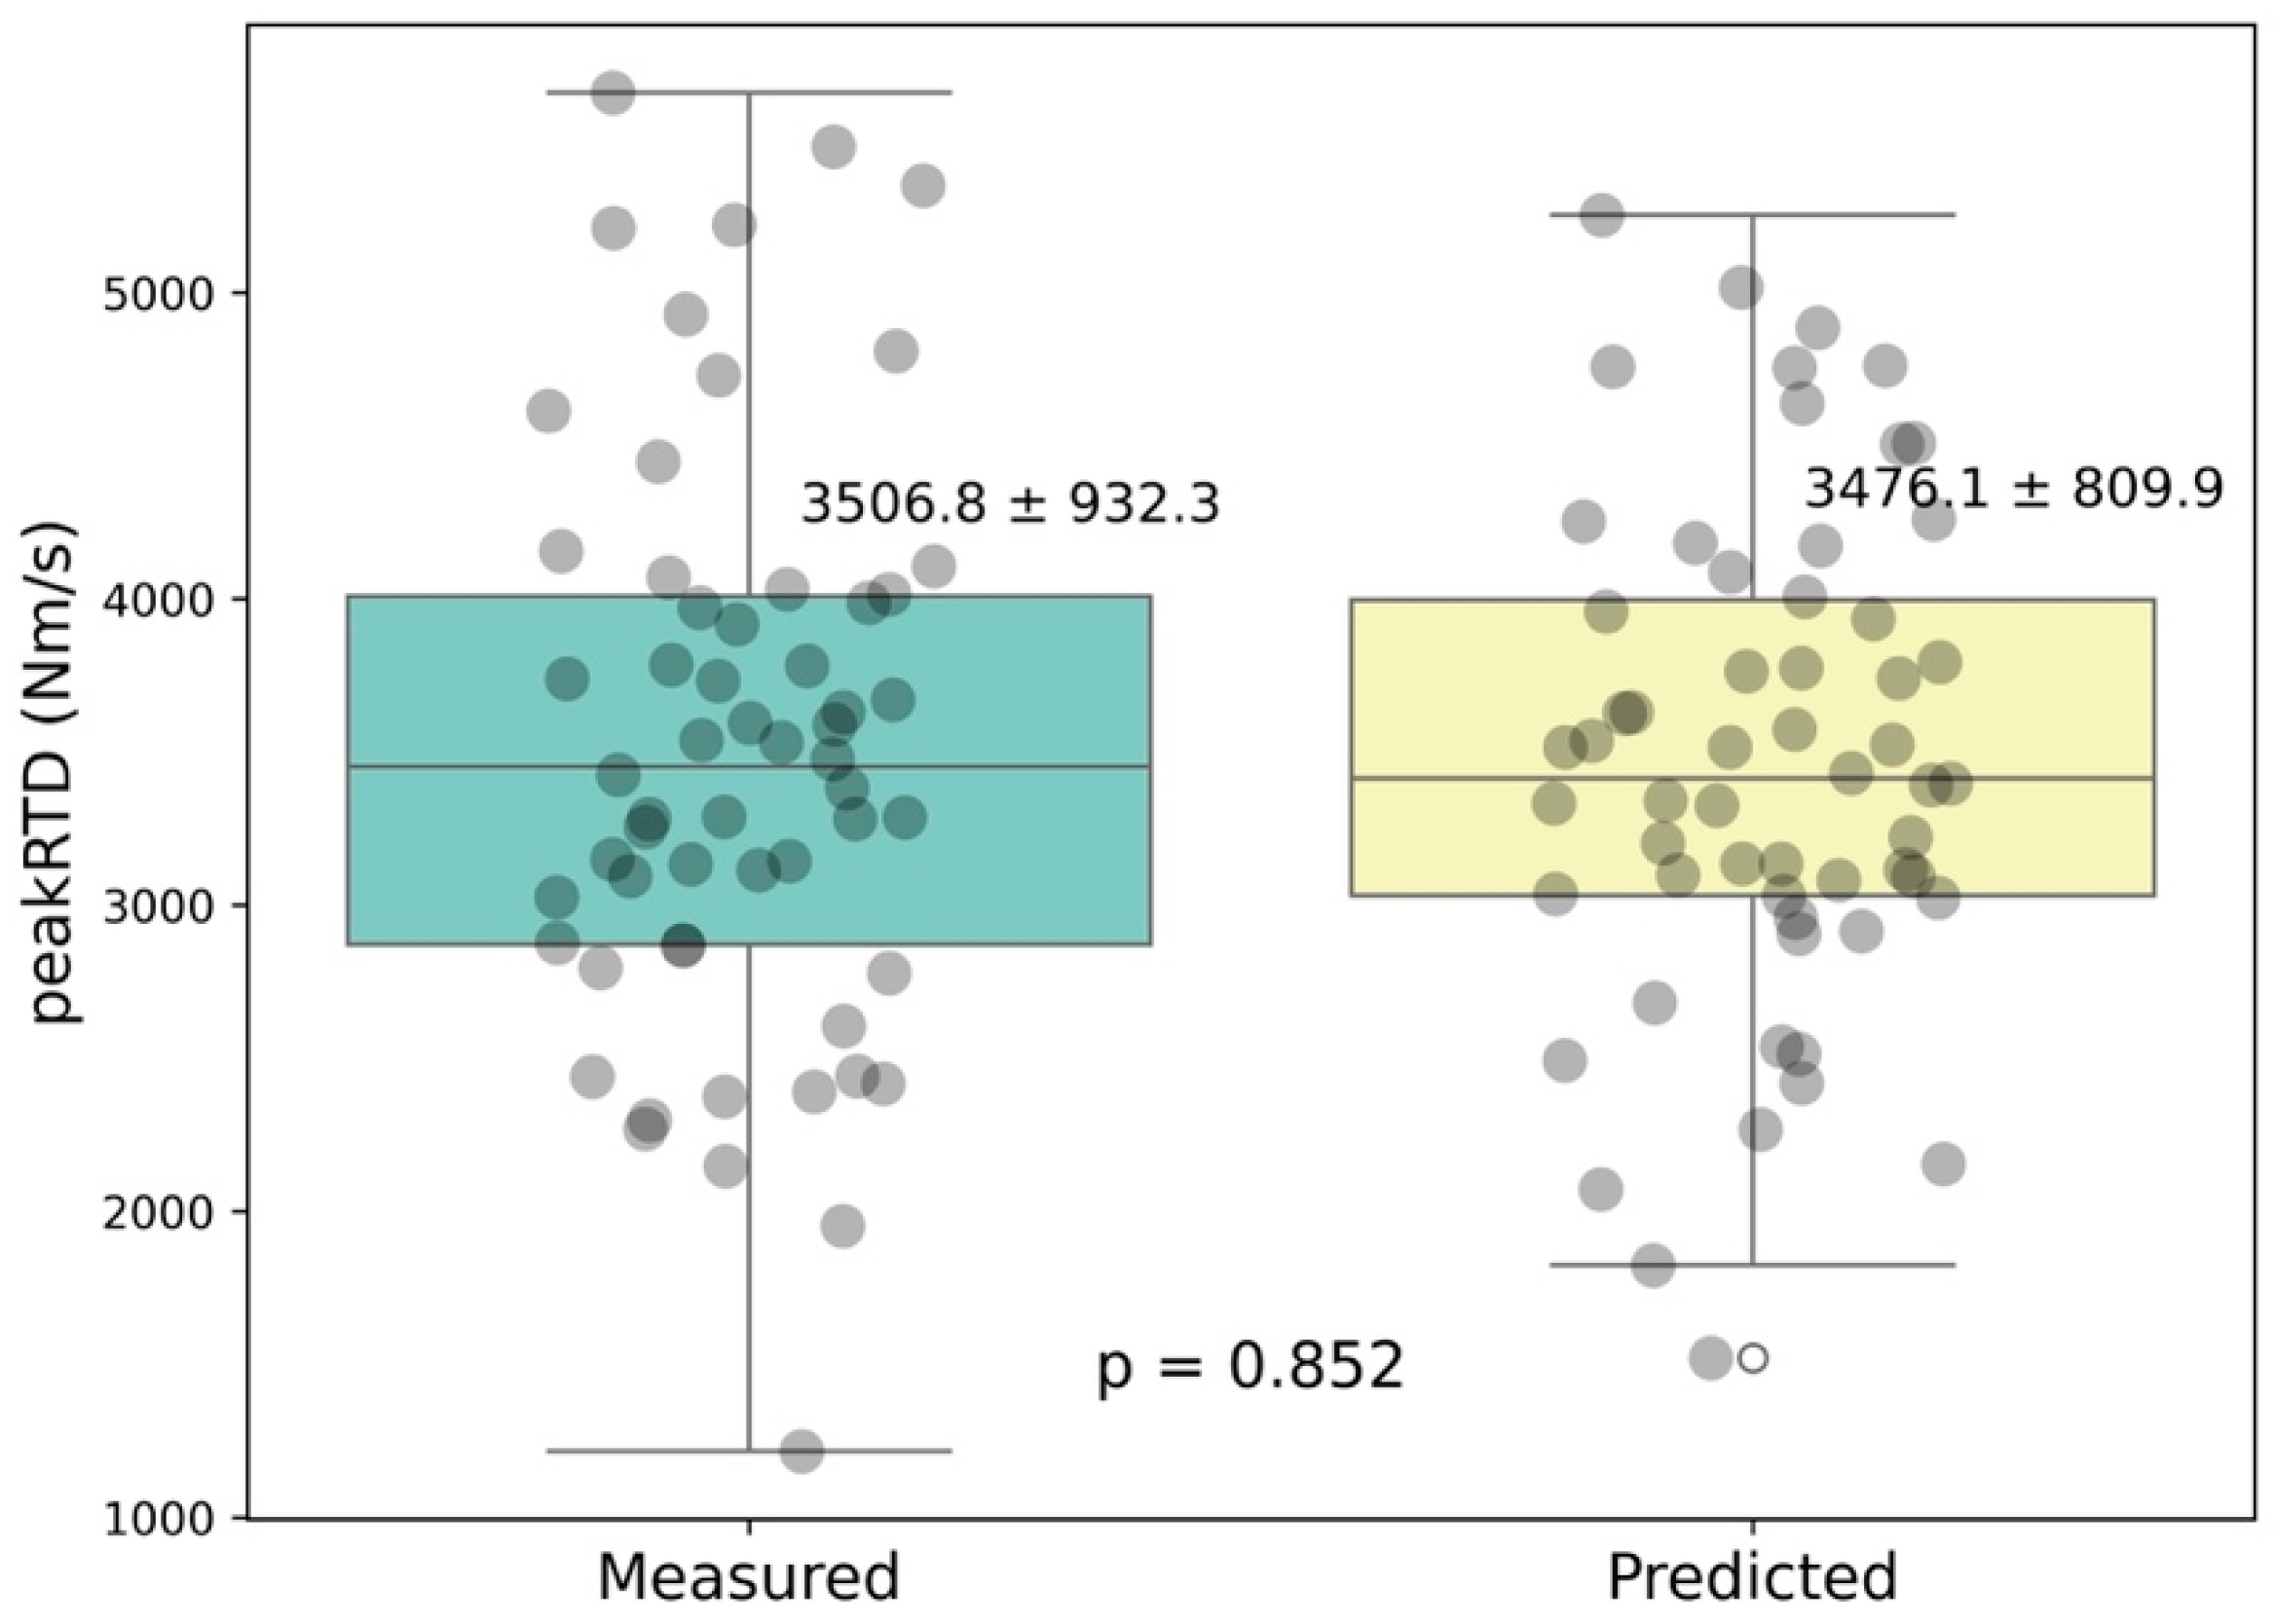
Both the measured and predicted peak RTD were normally distributed (tested using the Shapiro–Wilk test, both p > 0.05). The measured and predicted RTDs were compared using a paired t-test. The linear fit, relationship, and agreement levels were accessed using linear regression analysis, intra-class correlation (ICC2,1), and Bland–Altman plots. The ICC values classified as less than 0.5 were indicative of poor reliability, values between 0.5 and 0.75 indicate moderate reliability, values between 0.75 and 0.9 indicate good reliability, and values greater than 0.90 indicate excellent reliability [39]. For all analyses, the alpha was set at 5%. The statistical analyses were implemented using Pingouin (version 0.5.4) and graphics were generated with Matplotlib for Python (version 3).

3. Results

All the participants completed the two sessions of testing. Figure 2 depicts the measured and predicted signals obtained. It is possible to see a clear overlapping between the measure and AI-predicted signals. The peak RTD analysis revealed no significant differences between the measured (3506 ± 932 Nm/s) and predicted (3476 ± 809 Nm/s) peak RTDs (p = 0.852, Figure 3). Furthermore, the analysis revealed a strong linear fit (R2 = 0.81, Figure 4) and almost perfect agreement, as indicated by an excellent ICC = 0.94 (p < 0.001) and a lower mean bias (30.8 Nm/s, less than 1% of the peak RTD observed values) between the measured and predicted values (Figure 4).

4. Discussion

This study explored the prediction of peak RTD from a 3-axial ACC signal during knee extensors explosive MVCs using an ANN prediction model following a supervised learning approach. As hypothesized, the ACC signal demonstrated a reliable source of information to indirectly measure the RTD-based. In fact, our AI prediction model was able to successfully predict the peak RTD values. These preliminary observations highlight the potential use of accelerometers as an alternative for measuring RTD, offering several advantages over traditional methods (e.g., testing logistics, cost).
Although RTD is recognized as an important variable regarding neuromuscular function [1,2] and is highly associated with human performance [14,15,16,22], the need for specialized equipment and personnel remains a barrier to widespread adoption for field-based measures [2,31]. This limitation extends beyond sports and athletic contexts to clinical settings, where deep neuromuscular assessments could benefit populations such as seniors [40,41]. On the other hand, accelerometers are widely accessible and cost-effective, making them a practical tool for assessing neuromuscular function in various settings [42].
Wearable sensors have undergone significant technological advancements, resulting in reduced size and power requirements, improved wearability, and enhanced data quality and variety [43]. These advancements have facilitated the application of wearable sensors to address critical clinical challenges affecting human health. In fact, ACC signals have been utilized in a wide application regarding predicting physical activity levels and biomechanical variables through deep learning techniques [44,45,46].
In this study, we demonstrated that a relatively simple ANN architecture was able to predict the peak RTD from ACC signals with high precision. Deep learning techniques offer several advantages over traditional statistical approaches when developing prediction models for complex datasets [47]. One key advantage is their ability to automatically learn and extract intricate patterns and features from raw data. Another advantage is the scalability and flexibility of deep learning models [37]. They can effectively handle large volumes of data and capture nonlinear relationships between variables, which may be missed by traditional statistical methods. Additionally, deep learning models are robust to noisy data and can adapt to new data patterns, making them suitable for real-world applications where data may be incomplete or noisy [48].
As mentioned earlier, we selected the peak RTD to analyze the present dataset. The rationale behind this choice is directly related to the onset determination in time-based RTD measurements (e.g., 0–50 ms) [2]. Various approaches have been proposed, including both automatic and visual/manual methods [2]. Currently, the visual/manual approach is considered more reliable, especially for checking countermovement before an explosive contraction [2]. Using the peak RTD avoids the onset determination issue because it represents the instantaneous maximum value and does not depend on a specific time from the contraction onset. Therefore, when considering a practical and automated tool for measuring explosive strength in the field, the peak RTD emerges as a good candidate.
Although the present study provides valuable new insights, this study has some limitations. We used a relatively small dataset of signals and a limited training and testing setting for the ANN prediction model. The model was trained and tested on a single dataset, which may not fully capture the variability in RTD across individuals and for different performance levels. Using a larger and more diverse dataset for ANN training could improve the robustness of the model and its ability to generalize to new datasets or populations. Also, our data was limited to the peak RTD due to its widespread use, and consistent measurement [38]. Future studies should amplify the scope and include different time-based RTD measures (e.g., 0–50 ms) to explore differences underneath mechanical and neural variables well known to be linked to early and later RTD. Furthermore, future investigations could utilize a longitudinal design to track RTD changes over time in response to training interventions or rehabilitation programs using our approach. Lastly, the integration of real-time feedback systems into training environments holds promise for optimizing performance and minimizing injury risk. Further research could focus on developing and validating such systems and exploring their efficacy in various athletic and clinical settings. Additionally, investigating the long-term effects of implementing real-time feedback on performance outcomes and injury rates could provide valuable insights into its practical utility and effectiveness. In summary, while our study represents a significant step forward in understanding RTD and its implications, there are numerous opportunities for future research to expand upon these findings and advance our knowledge in this field.

5. Conclusions

This study investigated the use of accelerometer signals as the predictors of peak RTD using an ANN prediction model. The results demonstrate that the accelerometer signal can effectively predict the peak RTD, with no significant differences between the measured and predicted values. The ANN model showed a strong linear fit and almost perfect agreement between measured and predicted values, highlighting the potential of using accelerometer data for RTD prediction. This approach could lead to the development of a standalone device for direct RTD measurement from accelerometer data, offering advantages in portability and accessibility for sports practitioners and researchers. Overall, this study contributes to the understanding of RTD assessment and opens avenues for future research in this area.

Author Contributions

V.R.A.C. and C.T.L. conducted the idealization, data collection, and data analysis. V.R.A.C. drafted the manuscript. L.K. and C.T.L. reviewed the analysis and manuscript. All authors have read and agreed to the published version of the manuscript.

Funding

This research did not receive specific funding.

Data Availability Statement

The raw data supporting the conclusions of this article will be made available by the authors on request.

Conflicts of Interest

The authors declare no conflicts of interest.

References

  1. Cossich, V.; Maffiuletti, N.A. Early vs. Late Rate of Torque Development: Relation with Maximal Strength and Influencing Factors. J. Electromyogr. Kinesiol. 2020, 55, 102486. [Google Scholar] [CrossRef] [PubMed]
  2. Maffiuletti, N.A.; Aagaard, P.; Blazevich, A.J.; Folland, J.; Tillin, N.; Duchateau, J. Rate of Force Development: Physiological and Methodological Considerations. Eur. J. Appl. Physiol. 2016, 116, 1091–1116. [Google Scholar] [CrossRef] [PubMed]
  3. Kozinc, Ž.; Smajla, D.; Šarabon, N. Relationship between Hip Abductor Strength, Rate of Torque Development Scaling Factor and Medio-Lateral Stability in Older Adults. Gait Posture 2020, 95, 264–269. [Google Scholar] [CrossRef] [PubMed]
  4. Andersen, L.L.; Aagaard, P. Influence of Maximal Muscle Strength and Intrinsic Muscle Contractile Properties on Contractile Rate of Force Development. Eur. J. Appl. Physiol. 2006, 96, 46–52. [Google Scholar] [CrossRef]
  5. Folland, J.P.; Buckthorpe, M.W.; Hannah, R. Human Capacity for Explosive Force Production: Neural and Contractile Determinants. Scand. J. Med. Sci. Sports 2014, 24, 894–906. [Google Scholar] [CrossRef] [PubMed]
  6. Del Vecchio, A.; Negro, F.; Holobar, A.; Casolo, A.; Folland, J.P.; Felici, F.; Farina, D. You Are as Fast as Your Motor Neurons: Speed of Recruitment and Maximal Discharge of Motor Neurons Determine the Maximal Rate of Force Development in Humans. J. Physiol. 2019, 597, 2445–2456. [Google Scholar] [CrossRef] [PubMed]
  7. Del Vecchio, A.; Negro, F.; Falla, D.; Bazzucchi, I.; Farina, D.; Felici, F. Higher Muscle Fiber Conduction Velocity and Early Rate of Torque Development in Chronically Strength-Trained Individuals. J. Appl. Physiol. 2018, 125, 1218–1226. [Google Scholar] [CrossRef] [PubMed]
  8. Blazevich, A.J.; Gill, N.D.; Zhou, S. Intra- and Intermuscular Variation in Human Quadriceps Femoris Architecture Assessed in Vivo. J. Anat. 2006, 209, 289–310. [Google Scholar] [CrossRef]
  9. Maden-Wilkinson, T.M.; Balshaw, T.G.; Massey, G.J.; Folland, J.P. What Makes Long-Term Resistance-Trained Individuals so Strong? A Comparison of Skeletal Muscle Morphology, Architecture, and Joint Mechanics. J. Appl. Physiol. 2020, 128, 1000–1011. [Google Scholar] [CrossRef]
  10. Cossich, V.R.A.; Laett, C.T.; Gavilão, U.F.; Blazevich, A.J.; Oliveira, C.G.d. Faster Intrinsic Rate of Torque Development in Elbow Flexors than Knee Extensors: Effect of Muscle Architecture? J. Electromyogr. Kinesiol. 2021, 59, 102570. [Google Scholar] [CrossRef]
  11. Mornas, A.; Racinais, S.; Brocherie, F.; Alhammoud, M.; Hager, R.; Desmedt, Y.; Guilhem, G. Faster Early Rate of Force Development in Warmer Muscle: An in Vivo Exploration of Fascicle Dynamics and Muscle-Tendon Mechanical Properties. Am. J. Physiol. Regul. Integr. Comp. Physiol. 2022, 323, R123–R132. [Google Scholar] [CrossRef] [PubMed]
  12. Aeles, J.; Bellett, M.; Lichtwark, G.A.; Cresswell, A.G. The Effect of Small Changes in Rate of Force Development on Muscle Fascicle Velocity and Motor Unit Discharge Behaviour. Eur. J. Appl. Physiol. 2022, 122, 1035–1044. [Google Scholar] [CrossRef] [PubMed]
  13. James, L.P.; Suchomel, T.J.; Comfort, P.; Haff, G.G.; Connick, M.J. Rate of Force Development Adaptations After Weightlifting-Style Training: The Influence of Power Clean Ability. J. Strength Cond. Res. 2022, 36, 1560–1567. [Google Scholar] [CrossRef] [PubMed]
  14. Mangine, G.T.; Huet, K.; Williamson, C.; Bechke, E.; Serafini, P.; Bender, D.; Hudy, J.; Townsend, J. A Resisted Sprint Improves Rate of Force Development During a 20-m Sprint in Athletes. J. Strength Cond. Res. 2018, 32, 1531–1537. [Google Scholar] [CrossRef] [PubMed]
  15. Connolly, S.; Peeling, P.; Binnie, M.J.; Goods, P.S.R.; Latella, C.; Taylor, J.L.; Blazevich, A.J.; Timmerman, W.P.; Abbiss, C.R. Sprint Cycling Rate of Torque Development Associates with Strength Measurement in Trained Cyclists. Eur. J. Appl. Physiol. 2023, 123, 1215–1227. [Google Scholar] [CrossRef] [PubMed]
  16. Laett, C.T.; Silva, R.; Cossich, C.F.S.; Monteiro, W.; Barcellos, L.C.; Cossich, V.R.A. Maximum and Explosive Strength in Brazilian Kickboxing Athletes: Asymmetries between Limbs and the Relationship with the Single Jump Distance. Sport Sci. Health 2023, 19, 241–247. [Google Scholar] [CrossRef]
  17. Grgic, J.; Grgic, I. Resistance Training-Induced Gains in Rate of Force Development Are Maintained during Training Cessation: A Meta-Analysis. Strength Cond. J. 2023, 45, 325–332. [Google Scholar] [CrossRef]
  18. Turpeinen, J.T.; Freitas, T.T.; Rubio-Arias, J.Á.; Jordan, M.J.; Aagaard, P. Contractile Rate of Force Development after Anterior Cruciate Ligament Reconstruction—A Comprehensive Review and Meta-Analysis. Scand. J. Med. Sci. Sport. 2020, 30, 1572–1585. [Google Scholar] [CrossRef]
  19. Goes, R.A.; Cossich, V.R.A.; França, B.R.; Campos, A.S.; Souza, G.G.A.; Bastos, R.D.C.; Neto, J.A.G. Return to Play after Anterior Cruciate Ligament Reconstruction. Rev. Bras. Med. Esporte 2020, 26, 478–486. [Google Scholar] [CrossRef]
  20. Jordan, M.J.; Aagaard, P.; Herzog, W. Rapid Hamstrings/Quadriceps Strength in ACL-Reconstructed Elite Alpine Ski Racers. Med. Sci. Sports Exerc. 2015, 47, 109–119. [Google Scholar] [CrossRef]
  21. Buckthorpe, M.; Roi, G.S. The Time Has Come to Incorporate a Greater Focus on Rate of Force Development Training in the Sports Injury Rehabilitation Process. Muscle Ligaments Tendons J. 2017, 7, 435. [Google Scholar] [CrossRef]
  22. Cossich, V.R.A.; Gavilão, U.F.; Goes, R.A.; Perini, J.A.; Laett, C.T.; Maffiuletti, N.A. Maximal vs. Explosive Knee Extensor Strength in Professional Soccer Players: Inter-Limb Asymmetries and Relationship with Knee Function. Eur. J. Sport Sci. 2023, 23, 877–884. [Google Scholar] [CrossRef] [PubMed]
  23. Qiu, J.; Jiang, T.; Ong, M.T.Y.; He, X.; Choi, C.Y.; Fu, S.C.; Fong, D.T.P.; Yung, P.S.H. Bilateral Impairments of Quadriceps Neuromuscular Function Occur Early after Anterior Cruciate Ligament Injury. Res. Sport. Med. 2024, 32, 72–85. [Google Scholar] [CrossRef] [PubMed]
  24. Qiu, J.; Ong, M.T.Y.; Choi, C.Y.; He, X.; Lau, L.C.M.; Fu, S.C.; Fong, D.T.P.; Yung, P.S.H. Associations of Patient Characteristics, Rate of Torque Development, Voluntary Activation of Quadriceps with Quadriceps Strength, and Knee Function before Anterior Cruciate Ligament Reconstruction. Res. Sport. Med. 2024, 32, 491–503. [Google Scholar] [CrossRef] [PubMed]
  25. Botta, A.F.B.; Waiteman, M.C.; Ducatti, M.H.M.; Garcia, C.L.G.; Farinelli, L.A.L.B.; Bazett-Jones, D.M.; Briani, R.V.; de Azevedo, F.M. Patellofemoral Pain over Time: Protocol for a Prospective, Longitudinal Study Investigating Physical and Non-Physical Features. Front. Sport. Act. Living 2023, 4, 1081943. [Google Scholar] [CrossRef]
  26. Dawes, J.; Orr, R.; Heinrich, K.M.; Ferguson, H.; Piquet, J.; Jemni, M.; Delextrat, A. Effects of a Football Simulated Exercise on Injury Risk Factors for Anterior Cruciate Ligament (ACL) Injury in Amateur Female Players. Biology 2023, 12, 124. [Google Scholar] [CrossRef] [PubMed]
  27. Symons, T.B.; Roberts, A.H.; Carter, K.A.; Caruso, J.F. The Addition of Sprint Interval Training to Field Lacrosse Training Increases Rate of Torque Development and Contractile Impulse in Female High School Field Lacrosse Players. J. Funct. Morphol. Kinesiol. 2023, 8, 89. [Google Scholar] [CrossRef] [PubMed]
  28. Angelozzi, M.; Madama, M.; Corsica, C.; Calvisi, V.; Properzi, G.; McCaw, S.T.; Cacchio, A. Rate of Force Development as an Adjunctive Outcome Measure for Return-to-Sport Decisions after Anterior Cruciate Ligament Reconstruction. J. Orthop. Sports Phys. Ther. 2012, 42, 772–780. [Google Scholar] [CrossRef]
  29. Kuenze, C.; Lisee, C.; Birchmeier, T.; Triplett, A.; Wilcox, L.; Schorfhaar, A.; Shingles, M. Sex Differences in Quadriceps Rate of Torque Development within 1 year of ACL Reconstruction. Phys. Ther. Sport 2019, 38, 36–43. [Google Scholar] [CrossRef]
  30. Rodríguez-Rosell, D.; Pareja-Blanco, F.; Aagaard, P.; González-Badillo, J.J. Physiological and Methodological Aspects of Rate of Force Development Assessment in Human Skeletal Muscle. Clin. Physiol. Funct. Imaging 2018, 38, 743–762. [Google Scholar] [CrossRef]
  31. Palmer, T.B.; Blinch, J.; Farrow, A.C.; Agu-Udemba, C.C.; Mitchell, E.A. Real-Time Measurement of Isometric Peak Torque and Rate of Torque Development Using a Novel Strength Testing Device: A Validity and Reliability Study. Physiol. Meas. 2020, 41, 115005. [Google Scholar] [CrossRef] [PubMed]
  32. Benson, L.C.; Clermont, C.A.; Bošnjak, E.; Ferber, R. The Use of Wearable Devices for Walking and Running Gait Analysis Outside of the Lab: A Systematic Review. Gait Posture 2018, 63, 124–138. [Google Scholar] [CrossRef] [PubMed]
  33. Kristoffersson, A.; Lindén, M. A Systematic Review of Wearable Sensors for Monitoring Physical Activity. Sensors 2022, 22, 573. [Google Scholar] [CrossRef] [PubMed]
  34. Grouios, G.; Ziagkas, E.; Loukovitis, A.; Chatzinikolaou, K.; Koidou, E. Accelerometers in Our Pocket: Does Smartphone Accelerometer Technology Provide Accurate Data? Sensors 2023, 23, 192. [Google Scholar] [CrossRef] [PubMed]
  35. Aroganam, G.; Manivannan, N.; Harrison, D. Review on Wearable Technology Sensors Used in Consumer Sport Applications. Sensors 2019, 19, 1983. [Google Scholar] [CrossRef] [PubMed]
  36. Gurchiek, R.D.; Cheney, N.; McGinnis, R.S. Estimating Biomechanical Time-Series with Wearable Sensors: A Systematic Review of Machine Learning Techniques. Sensors 2019, 19, 5227. [Google Scholar] [CrossRef]
  37. Cossich, V.R.A.; Carlgren, D.; Holash, R.J.; Katz, L. Technological Breakthroughs in Sport: Current Practice and Future Potential of Artificial Intelligence, Virtual Reality, Augmented Reality, and Modern Data Visualization in Performance Analysis. Appl. Sci. 2023, 13, 12965. [Google Scholar] [CrossRef]
  38. D’Emanuele, S.; Maffiuletti, N.A.; Tarperi, C.; Rainoldi, A.; Schena, F.; Boccia, G. Rate of Force Development as an Indicator of Neuromuscular Fatigue: A Scoping Review. Front. Hum. Neurosci. 2021, 15, 701916. [Google Scholar] [CrossRef]
  39. Koo, T.K.; Li, M.Y. A Guideline of Selecting and Reporting Intraclass Correlation Coefficients for Reliability Research. J. Chiropr. Med. 2016, 15, 155. [Google Scholar] [CrossRef]
  40. Lomborg, S.D.; Dalgas, U.; Hvid, L.G. The Importance of Neuromuscular Rate of Force Development for Physical Function in Aging and Common Neurodegenerative Disorders—A Systematic Review. J. Musculoskelet. Neuronal Interact. 2022, 22, 562. [Google Scholar]
  41. Winters, J.D.; Christiansen, C.L.; Stevens-Lapsley, J.E. Preliminary Investigation of Rate of Torque Development Deficits Following Total Knee Arthroplasty. Knee 2014, 21, 382–386. [Google Scholar] [CrossRef] [PubMed]
  42. Alba-Jiménez, C.; Moreno-Doutres, D.; Peña, J. Trends Assessing Neuromuscular Fatigue in Team Sports: A Narrative Review. Sports 2022, 10, 33. [Google Scholar] [CrossRef] [PubMed]
  43. Matthews, J.; Kim, J.; Yeo, W.H. Advances in Biosignal Sensing and Signal Processing Methods with Wearable Devices. Anal. Sens. 2023, 3, e202200062. [Google Scholar] [CrossRef]
  44. Nunavath, V.; Johansen, S.; Johannessen, T.S.; Jiao, L.; Hansen, B.H.; Berntsen, S.; Goodwin, M. Deep Learning for Classifying Physical Activities from Accelerometer Data. Sensors 2021, 21, 5564. [Google Scholar] [CrossRef] [PubMed]
  45. Breasail, M.; Biswas, B.; Smith, M.D.; Mazhar, M.K.A.; Tenison, E.; Cullen, A.; Lithander, F.E.; Roudaut, A.; Henderson, E.J. Wearable GPS and Accelerometer Technologies for Monitoring Mobility and Physical Activity in Neurodegenerative Disorders: A Systematic Review. Sensors 2021, 21, 8261. [Google Scholar] [CrossRef] [PubMed]
  46. Mantashloo, Z.; Abbasi, A.; Tazji, M.K.; Pedram, M.M. Lower Body Kinematics Estimation during Walking Using an Accelerometer. J. Biomech. 2023, 151, 111548. [Google Scholar] [CrossRef]
  47. Sawan, N.; Eltweri, A.; De Lucia, C.; Cavaliere, L.P.L.; Faccia, A.; Moşteanu, N.R. Mixed and Augmented Reality Applications in the Sport Industry. In ACM International Conference Proceedings Series, Proceedings of the EBEE 2020: 2020 2nd International Conference on E-Business and E-Commerce Engineering, Bangkok, Thailand, 29–31 December 2020; Association for Computing Machinery: New York, NY, USA, 2021; pp. 55–59. [Google Scholar] [CrossRef]
  48. Whang, S.E.; Roh, Y.; Song, H.; Lee, J.G. Data Collection and Quality Challenges in Deep Learning: A Data-Centric AI Perspective. VLDB J. 2023, 32, 791–813. [Google Scholar] [CrossRef]
Figure 1. Illustrative image demonstrating the accelerometer placement during the explosive strength assessment. The accelerometer was fixed on the shin guard, with detailed orientation along the x, y, and z axes.
Applsci 14 05137 g001
Figure 2. Measured and predicted RTD signals. The solid and dotted lines represent the measured and predicted RTD signals, respectively. The shaded areas around each line indicate the standard deviation. The overlap between the signals suggests a degree of correspondence and highlights the RTD prediction model capabilities from the ACC signals. The gray shaded area highlights the window between onset and peak RTD.
Applsci 14 05137 g002
Figure 3. Measured and predicted peak RTD. Boxplots were used to demonstrate the measured and predicted peak RTD data. The circles represent the individual observed values. The mean and standard deviation are included to aid in interpreting the image. The p-value obtained from a paired t-test was not significant.
Applsci 14 05137 g003
Figure 4. Linear fit and limit of agreements measured vs. predicted peak RTD. (Left panel): The scatter plot showing the linear relationship between the measured and predicted peak RTD. The solid line represents the best-fit line described by the equation y = 1.03x + 76.06, indicating a strong linear correlation (R² = 0.81). The ICC (Intraclass Correlation Coefficient) value of 0.94 signifies excellent correlation between measures. (Right panel): The Bland–Altman plot assessing the agreement between the measured and predicted peak RTD. The mean difference is indicated by the solid line (Mean bias = 30.75 Nm/s), with the dashed lines representing the limits of agreement at ±1.96 standard deviations, suggesting that most differences fall within these bounds.
Applsci 14 05137 g004
Table 1. Artificial neural network model summary.
LayerOutput Shape
Input[3, 1000]ACC (x, y, and z)
Dense (ReLU)[3, 9000]
Flatter[27,0]
Dense (ReLU)[9000]
Dense (ReLU)[6000]
Output[1000]Predicted RTD
Disclaimer/Publisher’s Note: The statements, opinions and data contained in all publications are solely those of the individual author(s) and contributor(s) and not of MDPI and/or the editor(s). MDPI and/or the editor(s) disclaim responsibility for any injury to people or property resulting from any ideas, methods, instructions or products referred to in the content.

