Article

Holistic Workload Quantification within a Professional Soccer Microcycle Considering Players’ Match Participation

by
Rodrigo dos Santos Guimarães
,
Tomás García-Calvo
*,
David Lobo-Triviño
,
José C. Ponce-Bordón
and
Javier Raya-González
Faculty of Sport Sciences, University of Extremadura, Avenida de la Universidad S/N, 10003 Caceres, Spain
*
Author to whom correspondence should be addressed.
Appl. Sci. 2024, 14(12), 5139; https://doi.org/10.3390/app14125139
Submission received: 11 March 2024 / Revised: 27 May 2024 / Accepted: 8 June 2024 / Published: 13 June 2024
(This article belongs to the Section Applied Biosciences and Bioengineering)

Abstract

:
This study analyzed workload variations (internal, external, and mental) in training sessions based on soccer players’ match participation. Thirty-six professional Brazilian players from a single team were categorized into three groups: starter (G1), non-starter (G2) and non-participant (G3) players. Monitoring during sessions involved assessing internal load via perceived exertion, mental load through affective, emotional, and motivational factors, and external load using Global Positioning System devices. On MD+2, starter players exhibited significantly lower values in all categories compared to non-starters (p < 0.001) and non-participants (p < 0.001), while on MD, they displayed the highest values. MD-4 and MD-3 showed no cognitive or emotional load differences; however, variations were observed in RPE, motivation, mental fatigue, and physical metrics. Notably, starters’ lowest values occurred on MD-2 and MD-1. Findings emphasize the need to manage starter players’ load, implementing recovery strategies for optimal performance. Additionally, tailored tasks should be provided for non-starter and non-participant players to compensate for non-performed efforts during match downtime. This study underscores the significance of an individualized training approach based on players’ match participation, contributing valuable insights for optimizing performance and recovery strategies.

1. Introduction

Soccer is a highly demanding team sport, where high-intensity actions such as jumping, sprinting or changes in direction have great importance [1,2]. In recent years, an increase in high-intensity actions during matches has been observed [3,4]. These actions are closely related to success in soccer, so players must be adequately prepared to achieve optimal performance [5]. For this reason, high-intensity actions have become one of the main contents in training sessions in this sport [6]; however, the characteristics of modern soccer, where congested calendars are increasingly frequent [7,8], have meant that the training time for professional teams is reduced [9]. Therefore, it is essential to apply load quantification strategies that allow for understanding the demands covered weekly by soccer players, both in training and in competition [10].
To make the control and optimization of soccer training easier, a weekly microcycle structure has been proposed [11]. This distribution consists of a fixed microcycle to be used across the season, considering the match location when distributing training sessions, with each of them having a different physical orientation (i.e., recovery, strength, endurance, speed and activation) (Silva et al. [12]). To confirm it, Buchheit et al. [13] compared the neuromuscular responses during strength, endurance and speed sessions in young French soccer players. These authors observed a similar lower limb fatigue derived from each session, although the muscle groups affected were likely session orientation-dependent. More specifically, Castillo et al. [14] analyzed and compared the external load supported by young Spanish soccer players during the different sessions of the typical microcycle (i.e., strength, endurance and speed sessions), in addition to the comparison of these demands with those obtained in competition. These authors reported that external loads were consistently higher during matches when compared with all training sessions. Also, they reported that greater external loads during strength and endurance sessions were observed when compared with speed sessions, with the only difference between strength and endurance sessions obtained in the distance covered above 21 km·h−1 in favor of the strength sessions. Despite these promising findings, these authors only analyzed the external load, so future studies based on a holistic load quantification, including internal and mental load, seem necessary.
For a better comprehension of the workload supported by soccer players during their practice, prior studies have analyzed the match load considering the players’ participation [7,15]. The aforementioned studies confirmed that starter players met adequate demands and maintained relevant physical condition. However, some authors have revealed that substitute players show reductions in their performance, since they do not seem to reach the minimum weekly load for it [16]. The main characteristic of starters versus non-starters is greater participation (i.e., minutes) during matches, allowing them to accumulate higher physical and physiological loads during the microcycle [17]. As such, it may be necessary to include compensatory training strategies for non-starters to maintain or improve their training status [11]. Thus, Díaz-Serradilla et al. [18] are analyzing the different strategies to apply with non-starter players the day after the competition. Due to the importance of the application of these compensatory strategies, it seems necessary to deepen the analysis of the demands imposed on non-starter players in order to optimize these compensatory strategies, and consequently, to improve the non-starters’ physical performance.
Although previous studies have compared the weekly workload attendance with players’ match participation (i.e., starters, non-starters and players who did not participate in the match), the total workload of the microcycle was analyzed [7,15]. In addition, the aforementioned studies only considered the external load, so holistic day-to-day quantifications are essential. Therefore, the main aim of this study was to analyze the differences in workload (i.e., internal, external and mental load) between attending training sessions and the players’ match participation. Based on previous studies [11,16], we hypothesize that differences in internal and external load variables were observed between starter, non-starter and non-participant players in most of the sessions that comprised the microcycle.

2. Materials and Methods

2.1. Participants

Thirty-six Brazilian professional male soccer players (age = 27.7 ± 5.6 years; height = 181.3 ± 7.1 cm; weight = 79.3 ± 9.6 kg) voluntarily participated in this study. Players belonged to the same team, which participated in national (i.e., Mineiro Championship, n = 11 matches; Brasileirao Championship, n = 38 matches; and Brazilian Cup, n = 6 matches) and international (i.e., Libertadores Cup = 10 matches) tournaments during the 2022 season. All players had 9.3 ± 5.28 years of experience systematically playing soccer. During the experimental period, players completed five training sessions per week, with an average of 79 min per session, and played, at least, one official match every week. All players underwent a thorough medical assessment to verify their health status prior to participation and were free from illness or injury at the time of this study. Goalkeepers were not included in the analysis due to their specific role during the game. Participants were informed about the purposes and potential risks associated with participating in this research, and they gave their informed consent prior to starting the study. This investigation was conducted in accordance with the Declaration of Helsinki (2013), and the protocol was approved by the ethics committee of the University of Extremadura (protocol number: 239/2019).

2.2. Study Design and Procedures

A retrospective, descriptive longitudinal design was applied to analyze the differences in internal, external and mental load between different days in a training week, considering the participation of soccer players in the previous match. All matches and training sessions were monitored during the 2022 season (from 25 January 2022 to 12 November 2022). Data were collected every day of the week to examine the differences in the internal, external and mental load variables. According to the distance from the match and considering the training schedule of the team, each training day was considered as follows [12]: MD+2, two days after match; MD-4, four days before match; MD-3, three days before match; MD-2, two days before match; MD-1, one day before match; MD, match day. In addition, to examine the between-players differences according to their match participation, players were classified into three groups: players who completed the entire match (G1); players who were non-starters (G2), and players who did not participate in the match (G3).

2.3. Instruments and Variables

Mental Load. To assess the mental load perceived after each training session, the Questionnaire to quantify the Mental Load in Team Sports was used [19]. The 4-item questionnaire requires players to self-report their (i) rate of perceived exertion (RPE; how demanding would you quantify the physical effort of this session?); (ii) cognitive load (how demanding would you quantify the cognitive effort of this session?); (iii) affective load (how demanding would you quantify the effort made in this session to manage emotional relationships with the other participants?); and (iv) emotional load (how demanding would you quantify the effort made to manage your emotions during this session?). This instrument uses a Likert scale format with a response range from 0 (none at all) to 10 (maximal) for each question. This questionnaire has demonstrated reliability and validity for the assessment of mental load in team sports and it has been previously used in soccer studies [20,21].
Motivation. A Visual Analogue Scale (VAS-100 mm) was used to assess motivation. This scale has already been used in previous soccer studies to measure motivation [22,23,24]. Participants marked their degree of motivation along a line from 0 (minimum) to 100 (maximum). The specific question given to the players was: “How motivating does you quantify the session on a line from 0 to 100?”. Original units of the VAS-100 mm for motivation were transformed to their equivalent on a scale from 0 to 10 to be consistent with the format of the other scales obtained.
Mental Fatigue (MF). To quantify the subjective feelings of MF after each training session, a Visual Analogue Scale (VAS-100 mm) was used. Athletes were asked to indicate on a single horizontal line from 0 (none at all) to 100 (maximal) how mentally fatigued they felt after the training session. During analysis, the original units of the VAS-100 mm for MF were transformed to their equivalent on a 0–10 scale (e.g., 66 mm was transformed to 6.6). This transformation allowed us to show all the response options in a range from 0 to 10 to align with the format of other obtained scales. This instrument has been used in previous studies exploring MF in soccer [22,23,24].
Vector S7. To examine the external load of the training sessions, Vector S7 was used. This Global Position System (GPS) device was manufactured by Catapult Sports (Catapult Sports, Melbourne, Australia) and includes a tri-axial accelerometer, tri-axial gyroscope, and tri-axial magnetometer; each provided sampling rates of 100 Hz, whereas the GPS provided a sampling rate of 10 Hz. For a better performance, Vector S7 devices were positioned on each player in the center of their upper back, with each player using the same device during the entire experimental period. Catapult devices have previously been found to have high rates of reliability [25]. The variables considered for further analysis were the following: distance covered above 19 km·h−1 (TD > 19); distance covered above 25 km·h−1 (TD > 25); sprint number performed by soccer players; the maximum velocity achieved during sessions (max. speed); total high-intensity accelerations (>3 m·s−2; ACC); total high-intensity decelerations (>3 m·s−2; DEC); and player load (PLoad), considered as the accelerometer-derived measurements of total body load in its 3 axes (i.e., vertical, anterior–posterior and medial–lateral).

2.4. Statistical Analysis

All statistical analyses were conducted using R-studio (http://www.rstudio.org/) [26]. Considering the characteristics of the sample, organized hierarchically, nested in groups, and with a longitudinal structure, the best procedure to analyze the data is through linear mixed models (LMMs). LMMs have demonstrated their ability to cope with unbalanced and repeated-measures data [27]. For instance, variables related to distances covered in training sessions are nested into players (i.e., each player has a record for every training session they have participated in, and each training session has observations of several players). Thus, the cross-classified multilevel models are suitable for data structures that are not purely hierarchical. Consequently, a general multilevel modelling strategy was applied where fixed and random effects in different steps were included [27]. First, a two-level hierarchy was modeled for the analysis. The external load variables (i.e., distances covered) and internal and mental variables were included as dependent variables in the models, and the type of players (i.e., starters, non-starters and non-played) and different days (e.g., MD, MD+2, etc.) were the independent variables included as fixed effects. The player variable was considered as the random effect in the analysis. Values were represented as coefficients and the standard error (Coeff (SE)). Statistical significance was set at p < 0.05.

3. Results

3.1. Internal and Mental Load

Between-groups differences according to internal and mental load variables are summarized in Table 1. On MD+2, G1 reached a significantly lower RPE than G2 and G3 (p < 0.001); significantly lower cognitive load than G2 and G3 (p < 0.001); significantly lower emotional load than G2 and G3 (p < 0.001); significantly lower affective load than G2 and G3 (p < 0.001); significantly lower motivation than G3 (p < 0.001); and significantly lower MF than G2 and G3 (p < 0.001).
On MD-4, G3 reached significantly higher motivation than G1 (p < 0.01) and G2 (p < 0.05), while MF was significantly higher in G2 than G1 (p < 0.05). On MD-3, G2 reached higher RPE than G3 (p < 0.01).
Regarding MD-2, G1 obtained a significantly lower RPE than G2 and G3 (p < 0.001); significantly lower cognitive load than G2 and G3 (p < 0.001); significantly lower emotional load than G2 and G3 (p < 0.001); significantly lower affective load than G2 and G3 (p < 0.001); and significantly lower MF than G3 (p < 0.01).
With respect to MD-1, G1 reached a significantly lower RPE than G2 (p < 0.01) and G3 (p < 0.001); significantly lower cognitive load than G3 (p < 0.001); significantly lower emotional load than G2 (p < 0.05) and G3 (p < 0.001); significantly lower affective load than G3 (p < 0.001); significantly lower motivation than G3 (p < 0.05); and significantly lower MF than G3 (p < 0.05).
In terms of MD values, all variables followed the same trend. G1 reached higher values than G2 and G3 (p < 0.001), and G2 obtained higher values than G3 (p < 0.001).

3.2. External Load

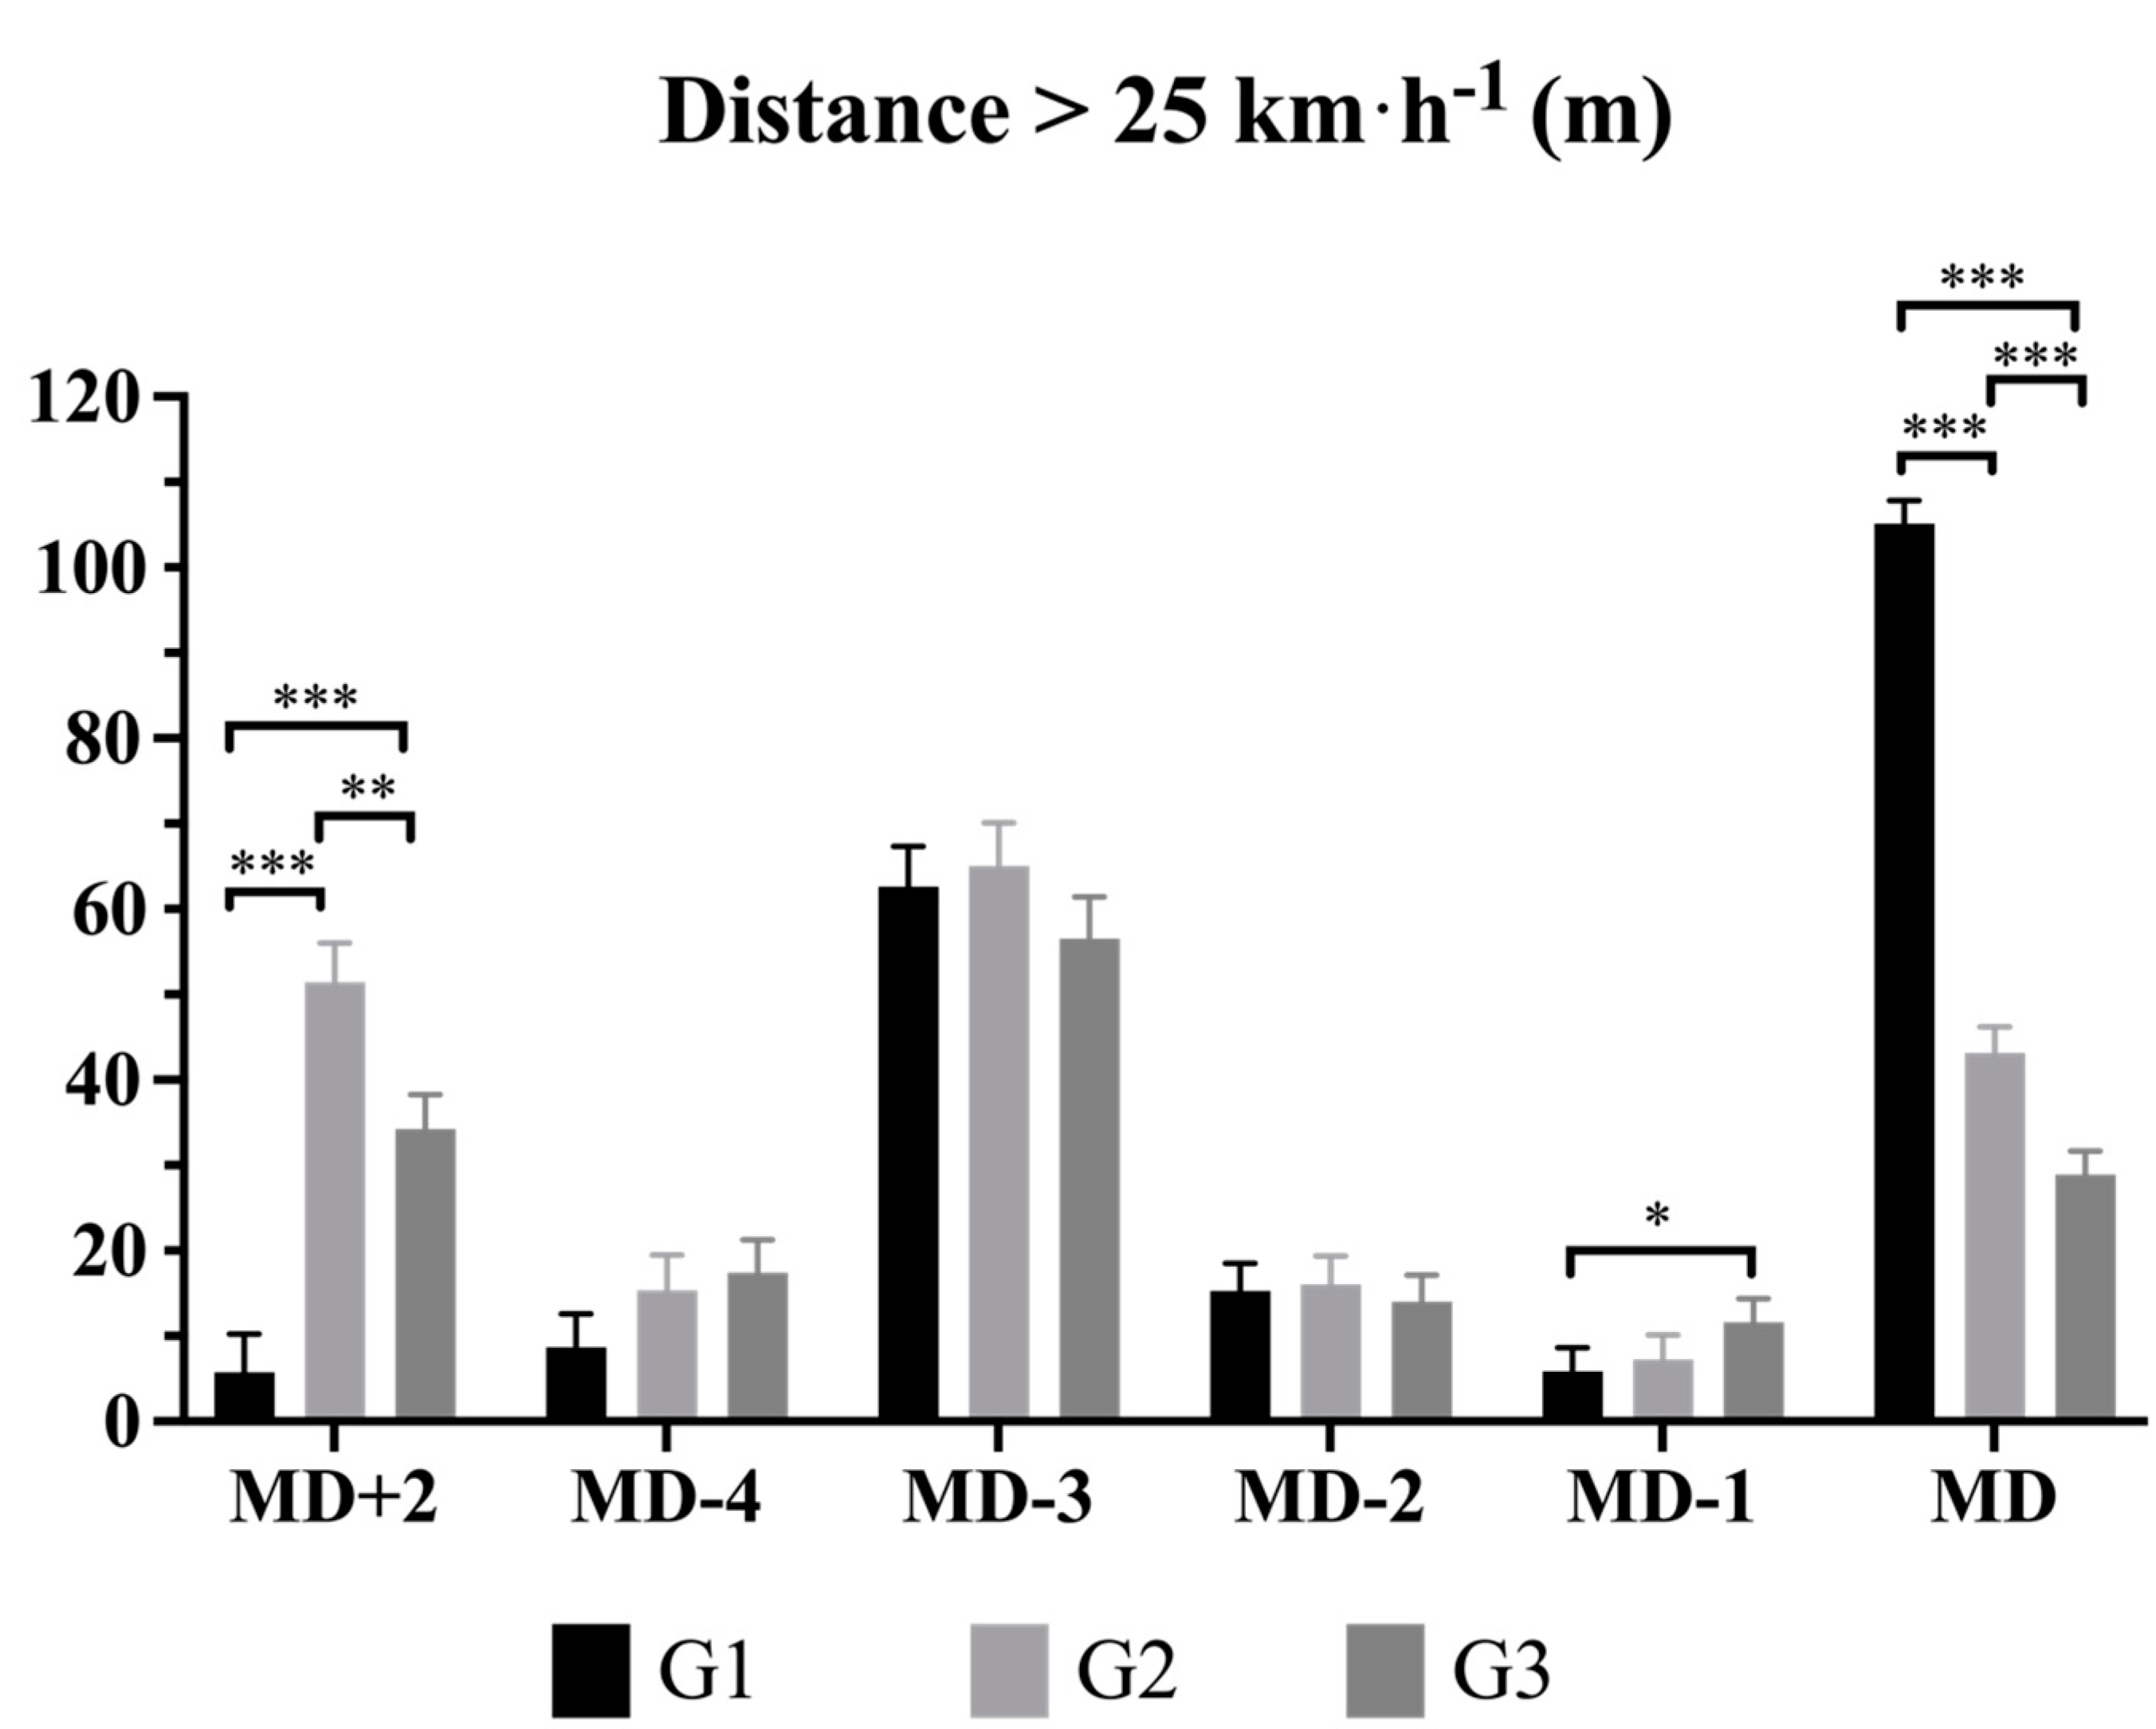
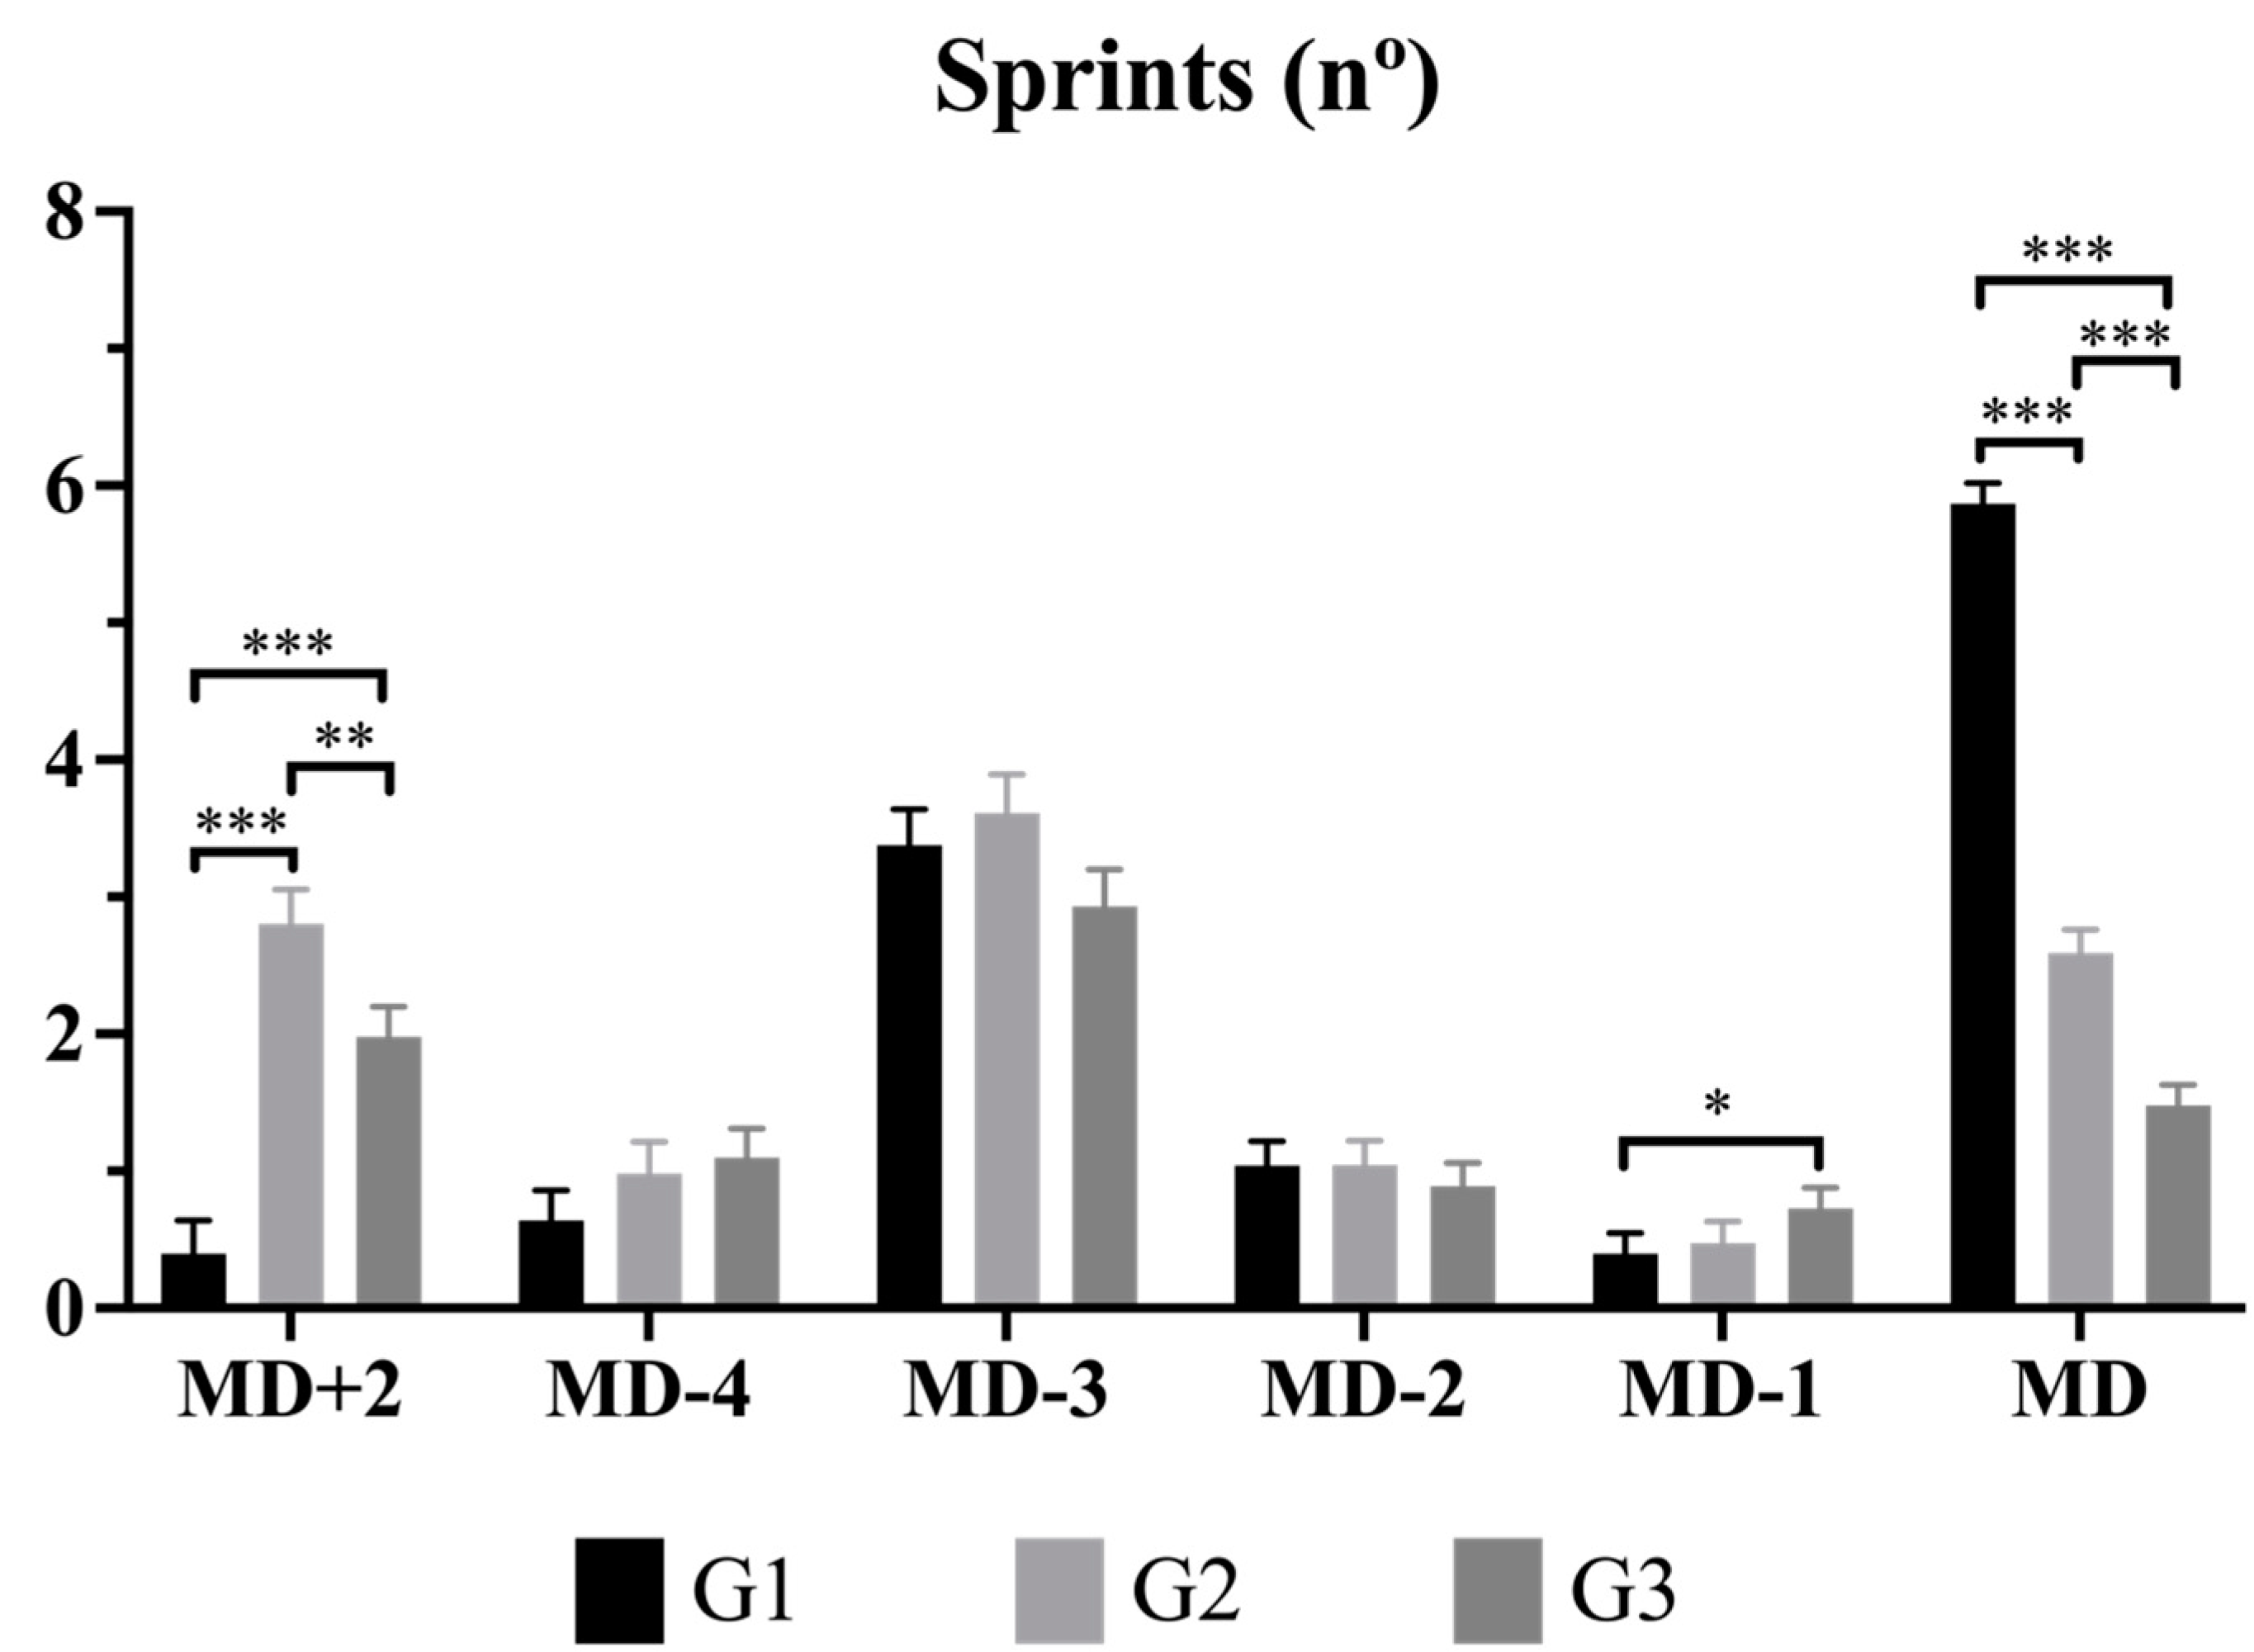
Figure 1, Figure 2, Figure 3 and Figure 4 present the between-groups differences according to the distance covered at different speed thresholds. On MD+2, G2 covered significantly higher TD > 19 km·h−1 than G1 (p < 0.001) and G3 (p < 0.05); significantly higher TD > 25 km·h−1 than G1 (p < 0.001) and G3 (p < 0.01); a significantly higher number of sprints than G1 (p < 0.001) and G3 (p < 0.01). Also, G1 achieved the lowest max. speed (p < 0.01).
Regarding MD-4 values, G1 covered significantly lower TD > 19 km·h−1 than G3 (p < 0.05). On MD-3, G1 achieved a greater max. speed than G2 (p < 0.05), while on MD-2, G2 achieved a higher max. speed than G3 (p < 0.01).
On MD-1, G3 covered significantly higher TD > 19 km·h−1 than G1 (p < 0.05); significantly higher TD > 25 km·h−1 than G1 (p < 0.05); and a significantly higher number of sprints than G1 (p < 0.05).
With respect to MD, G1 covered higher TD > 19 km·h−1 and TD > 25 km·h−1 than G3 (p < 0.001), performed a significantly higher number of sprints than G3 (p < 0.001) and achieved the greatest max. speed values (p < 0.001).
Between-groups differences according to variables related to mechanical demands are shown in Table 2. On MD+2, G1 had a significantly lower number of ACC than G2 and G3 (p < 0.001); significantly lower number of DEC than G2 and G3 (p < 0.001); and covered a significantly lower PLoad than G2 and G3 (p < 0.001).
Regarding MD-3 values, G3 had a significantly lower number of ACC than G1 (p < 0.05) and significantly lower number of DEC than G1 (p < 0.001) and G2 (p < 0.01). On MD-2, G1 had a significantly lower number of ACC than G2 (p < 0.001) and G3 (p < 0.01); significantly lower number of DEC than G2 and G3 (p < 0.001); and covered a significantly lower PLoad than G2 and G3 (p < 0.001).
Regarding MD-1 values, G1 had a significantly lower number of DEC than G2 (p < 0.01) and covered a significantly lower PLoad than G2 and G3 (p < 0.01). On MD, G1 had a significantly higher number of ACC than G2 and G3 (p < 0.001); significantly higher number of DEC than G2 and G3 (p < 0.001); and covered a significantly higher PLoad than G2 and G3 (p < 0.001).

4. Discussion

This study aimed to analyze the differences in workload (i.e., internal, external, and mental load) between training sessions based on players’ match participation. This is the first study that compares the load imposed on soccer players, considering their participation in the previous match in a holistic model (i.e., considering internal, external, and mental load). The main findings of this study revealed significant differences in all categories during MD+2, with starter players exhibiting the lowest values. Conversely, starter players presented the highest values on MD in all categories. Regarding MD-4 and MD-3, no differences were found in cognitive, emotional and affective loads, TD > 25 km·h−1, sprint number and PLoad, while significant differences were observed in RPE (i.e., MD-3, G2 vs. G3), motivation (i.e., MD-4, G1 vs. G3; MD-3, G1 vs. G2 and G3), mental fatigue (i.e., MD-4, G1 vs. G2), TD > 19 km·h−1 (i.e., MD-4, G1 vs. G2), max. speed (i.e., MD-3, G1 vs. G2), ACC (i.e., MD-3, G1 vs. G3) and DEC (i.e., MD-3, G3 vs. G1 and G2). Finally, the lowest values in all variables for the starter players were observed on MD-2 and MD-1.
Understanding the perceived load by soccer players is essential to check if the scheduled training is being executed as planned [28] or to assess the effort performed during competition [29]. In this regard, starter players showed the lowest RPE values on MD+2 compared to their counterparts. This could be because the aim of this session was to compensate the competition efforts for those players who completed a few minutes in the previous match (i.e., G2 and G3), while starting players (i.e., G1) carried out some recovery strategies [11]. No significant differences were found on MD-4, and only differences between non-starter and non-participant players were observed during MD-3. On MD-2 and MD-1, lower values of RPE were found in starters players, possibly due to the lower accumulation of weekly fatigue since the MD+2 session was softer for starter players compared to non-starter and non-participant players. Finally, the highest RPE values on MD were found in starter players as expected since they played a greater number of minutes during the match than non-starter and non-participant players.
In recent years, mental load analyses have increased in team sports [20,21], since research has reported that mental load is related to mental fatigue, which could impair soccer performance [30]. Although there is scarce literature related to mental load in a soccer microcycle week, these findings provide knowledge about this question in a professional soccer team over a full season. In our study, in MD+2 sessions, the lowest values were observed in starter players, without differences, in MD-4 and MD-3 sessions. On the other hand, starter players presented the lowest values in the sessions prior to the match (i.e., MD-2 and MD-1), possibly because, in these sessions, coaches apply tasks where players could guess their participation in the next match (i.e., tactical or strategic orientation), implying a possible decrease in the mean values of mental load. Conversely, these players presented the highest values on MD, influenced by their match participation. Regarding motivation, non-participant players presented the highest values in the MD+2 session, perhaps influenced by their interest in demonstrating their performance in order to obtain opportunities in the next matches. In MD-4, starter players presented lower values of motivation compared to the other groups, possibly due to the accumulated fatigue from their significant participation in the match. No differences were observed on MD-3 and MD-2, although non-participant players increased their motivation values during MD-1, as they could experience positive expectations about their inclusion in the next match. As in the rest of the variables, starter players presented the highest values of motivation since non-starter players and non-participant players experienced a reduction in this variable by not obtaining the role of starters on MD. Finally, starter players presented the lowest values of mental fatigue during the MD+2. This could be because this training session was performed two days after the matches instead of the next day, in which a high mental fatigue could be expected in players with more minutes during the match [24]. In the rest of the microcycle, starter players presented the lowest values, except for the MD, with the highest values. This highlights the relevance of participating in matches, being key players for the team and reducing worries that could generate a high level of mental fatigue.
High-intensity actions have a key role in soccer success due to their relationship with goal actions [31]. Thus, it is necessary to ensure the correct exposure of all players to optimize their performance and reduce the injury risk [32]. In MD+2, starter players covered lower distances in all variables related to high-intensity running due to the different session orientation regarding match participation [18]. Curiously, non-starter players (i.e., G2), who played some minutes during the prior match, covered more distance at high intensity than non-participant players. We hypothesize that seeing themselves as close to starting the game may have a better predisposition in the MD+2 than those players who did not play any minutes in the match. On MD-4, MD-3, and MD-2, no significant differences were found as expected, since in these sessions, all players train together, mainly through integrated tasks adapted to each playing position and style [11]. Although starter players covered lower distances at high intensity during MD-1 sessions, possibly due to autoregulation since they perceived their role as starters in the next match, non-starter players increased their values to influence the coach’s decision for the next match. Similar to the other variables, starter players presented the highest values on MD. Finally, the max. speed achieved by the starter players was lower compared to their counterparts in the MD+2 due to the type of task prescribed in this session. Conversely, this group achieved the highest values of this variable on the MD. In the other sessions, hardly any differences were observed between groups. Interestingly, on MD-3, a session characterized by tasks performed on larger pitch sizes [11], starter players achieved the highest values of max. speed. In these tasks, players can showcase their potential regarding maximum velocity [33], so these characteristics could influence their role as a starter in the team, given the demands in modern soccer [3].
Research has shown that acceleration and deceleration actions also belong to training load [34] and play a key role in soccer [35], determining performance in competition [31], due to the direct relationship between these actions and the risk of suffering a calf muscle injury [36]. In MD+2, starter players covered the lowest number of actions accelerating and decelerating due to the aforementioned session structure, while no significant differences were revealed on MD-4, since in this session, small-sided games prevail, with a great number of acceleration and deceleration actions and similar physical demands for all players [12]. In MD-3, MD-2, and MD, players who achieved the highest max. speed (i.e., starter players) also completed more acceleration and deceleration actions, as they must accelerate to reach high speeds and then decelerate to cover the different actions of the match. Conversely, starter players reduced their accelerating and decelerating actions because they perceived themselves as starters, while non-starter players tried to influence the coach’s decision. Finally, regarding PLoad, reduced values of this variable were found in starter players, while these players showed the highest PLoad values during MD. Also, no differences were observed on MD-4 and MD-3, and starter players presented lower values than the other players on MD-2 and MD-1, maybe due to autoregulation. As observed, the PLoad variable showed a similar pattern to high-intensity running due to a widely recognized relationship [37].
This study has some limitations that must be acknowledged by practitioners. One of them is that the study was conducted with only one male soccer team, so the analysis must be replicated in female populations or young athletes participating in academic levels to extrapolate the obtained findings. Also, this study was performed in a specific environment (i.e., a professional Brazilian soccer team), so possible differences with European teams must be investigated. Additionally, the requirements of strength and conditioning coaching and the work model within team could influence the results, especially regarding external load variables. In this sense, future studies classifying the players according to their physical fitness profile are required.

5. Conclusions

This is the first study that provides knowledge about the workload imposed on professional soccer players, considering their participation in the previous match in a holistic model (i.e., considering internal, external, and mental load). In conclusion, the findings revealed significant differences in all categories during MD+2, with starter players reaching the lowest values in the analyzed variables. Conversely, starter players presented the highest values on MD in all categories. Regarding MD-4 and MD-3, no differences were found in cognitive, emotional and affective loads, TD > 25 km·h−1, sprint number and PLoad, while significant differences in different days were observed in RPE, mental fatigue, TD > 19 km·h−1, max. speed, ACC and DEC variables. Finally, starter players reached the lowest values in all variables on MD-2 and MD-1. These results suggest the need to control the load of the starter players, applying the necessary recovery strategies to optimize their performance in the next match. Furthermore, it seems essential to apply specific tasks that allow for the non-starter and non-participant players to compensate for the efforts they did not make on the MD, not only in terms of TD but also by performing high-intensity efforts such as sprints, accelerations and decelerations.

Author Contributions

Conceptualization, T.G.-C., D.L.-T. and J.R.-G.; data curation, R.d.S.G. and D.L.-T.; formal analysis, T.G.-C.; investigation, R.d.S.G., T.G.-C., D.L.-T., J.C.P.-B. and J.R.-G.; methodology, T.G.-C., D.L.-T. and J.C.P.-B.; supervision, D.L.-T., J.C.P.-B. and J.R.-G.; writing—original draft, T.G.-C., D.L.-T., J.C.P.-B. and J.R.-G.; writing—review and editing, R.d.S.G., T.G.-C., D.L.-T., J.C.P.-B. and J.R.-G. All authors have read and agreed to the published version of the manuscript.

Funding

Javier Raya-González was supported by a Ramón y Cajal postdoctoral fellowship (RYC2021-031072-I) given by the Spanish Ministry of Science and Innovation, the State Research Agency (AEI) and the European Union (NextGenerationEU/PRTR). José Carlos Ponce-Bordón was supported by Fernando Valhondo Calaff Foundation.

Institutional Review Board Statement

This investigation was conducted in accordance with the Declaration of Helsinki (2013), and the protocol was approved on 21 March 2024 by the ethics committee of the University of Extremadura (protocol number: 48//2024).

Informed Consent Statement

Participants signed an informed consent form that explained the purposes and potential risk associated with participating in this research.

Data Availability Statement

Data are available upon request to the corresponding author. The data are not publicly available due to privacy.

Conflicts of Interest

The authors declare no conflicts of interest.

References

  1. Ade, J.; Fitzpatrick, J.; Bradley, P.S. High-Intensity Efforts in Elite Soccer Matches and Associated Movement Patterns, Technical Skills and Tactical Actions. Information for Position-Specific Training Drills. J. Sports Sci. 2016, 34, 2205–2214. [Google Scholar] [CrossRef]
  2. Pons, E.; Ponce-Bordón, J.C.; Díaz-García, J.; Del Campo, R.L.; Resta, R.; Peirau, X.; García-Calvo, T. A Longitudinal Exploration of Match Running Performance during a Football Match in the Spanish La Liga: A Four-Season Study. Int. J. Environ. Res. Public Health 2021, 18, 1133. [Google Scholar] [CrossRef] [PubMed]
  3. Lago-Peñas, C.; Lorenzo-Martinez, M.; López-Del Campo, R.; Resta, R.; Rey, E. Evolution of Physical and Technical Parameters in the Spanish LaLiga 2012–2019. Sci. Med. Footb. 2023, 7, 41–46. [Google Scholar] [CrossRef]
  4. Allen, T.; Taberner, M.; Zhilkin, M.; Rhodes, D. Running More than before? The Evolution of Running Load Demands in the English Premier League. Int. J. Sports Sci. Coach. 2023, 19, 779–787. [Google Scholar] [CrossRef]
  5. Oliva-Lozano, J.M.; Fortes, V.; Muyor, J.M. When and How Do Elite Soccer Players Sprint in Match Play? A Longitudinal Study in a Professional Soccer League. Res. Sports Med. 2023, 31, 1–12. [Google Scholar] [CrossRef]
  6. Beato, M.; Drust, B.; Iacono, A. Dello Implementing High-Speed Running and Sprinting Training in Professional Soccer. Int. J. Sports Med. 2021, 42, 295–299. [Google Scholar] [CrossRef]
  7. Gualtieri, A.; Rampinini, E.; Sassi, R.; Beato, M. Workload Monitoring in Top-Level Soccer Players During Congested Fixture Periods. Int. J. Sports Med. 2020, 41, 677–681. [Google Scholar] [CrossRef] [PubMed]
  8. Vieira, L.H.P.; Aquino, R.; Lago-Peñas, C.; Martins, G.H.M.; Puggina, E.F.; Barbieri, F.A. Running Performance in Brazilian Professional Football Players during a Congested Match Schedule. J. Strength Cond. Res. 2018, 32, 313–325. [Google Scholar] [CrossRef]
  9. Carling, C.; Gregson, W.; McCall, A.; Moreira, A.; Wong, D.P.; Bradley, P.S. Match Running Performance during Fixture Congestion in Elite Soccer: Research Issues and Future Directions. Sports Med. 2015, 45, 605–613. [Google Scholar] [CrossRef]
  10. Oliveira, R.; Brito, J.; Martins, A.; Mendes, B.; Calvete, F.; Carriço, S.; Ferraz, R.; Marques, M.C. In-Season Training Load Quantification of One-, Two- and Three-Game Week Schedules in a Top European Professional Soccer Team. Physiol. Behav. 2019, 201, 146–156. [Google Scholar] [CrossRef]
  11. Martín-García, A.; Gómez Díaz, A.; Bradley, P.S.; Morera, F.; Casamichana, D. Quantification of a Professional Football Team’s External Load Using a Microcycle Structure. J. Strength Cond. Res. 2018, 32, 3511–3518. [Google Scholar] [CrossRef] [PubMed]
  12. Silva, H.; Nakamura, F.Y.; Castellano, J.; Marcelino, R. Training Load within a Soccer Microcycle Week—A Systematic Review. Strength Cond. J. 2023, 45, 568–577. [Google Scholar] [CrossRef]
  13. Buchheit, M.; Lacome, M.; Cholley, Y.; Simpson, B.M. Neuromuscular Responses to Conditioned Soccer Sessions Assessed via GPS-Embedded Accelerometers: Insights into Tactical Periodization. Int. J. Sports Physiol. Perform. 2017, 13, 577–583. [Google Scholar] [CrossRef] [PubMed]
  14. Castillo, D.; Raya-González, J.; Weston, M.; Yanci, J. Distribution of External Load During Acquisition Training Sessions and Match Play of a Professional Soccer Team. J. Strength Cond. Res. 2021, 35, 3453–3458. [Google Scholar] [CrossRef] [PubMed]
  15. Teixeira, J.E.; Branquinho, L.; Ferraz, R.; Leal, M.; Silva, A.J.; Barbosa, T.M.; Monteiro, A.M.; Forte, P. Weekly Training Load across a Standard Microcycle in a Sub-Elite Youth Football Academy: A Comparison between Starters and Non-Starters. Int. J. Environ. Res. Public Health 2022, 19, 1611. [Google Scholar] [CrossRef] [PubMed]
  16. Nobari, H.; Alijanpour, N.; Martins, A.D.; Oliveira, R. Acute and Chronic Workload Ratios of Perceived Exertion, Global Positioning System, and Running-Based Variables Between Starters and Non-Starters: A Male Professional Team Study. Front. Psychol. 2022, 13, 860888. [Google Scholar] [CrossRef] [PubMed]
  17. Oliveira, R.; Canário-Lemos, R.; Morgans, R.; Rafael-Moreira, T.; Vilaça-Alves, J.; Brito, J.P. Are Non-Starters Accumulating Enough Load Compared with Starters? Examining Load, Wellness, and Training/Match Ratios of a European Professional Soccer Team. BMC Sports Sci. Med. Rehabil. 2023, 15, 129. [Google Scholar] [CrossRef] [PubMed]
  18. Díaz-Serradilla, E.; Castillo, D.; Rodríguez-Marroyo, J.A.; Raya González, J.; Villa Vicente, J.G.; Rodríguez-Fernández, A. Effect of Different Nonstarter Compensatory Strategies on Training Load in Female Soccer Players: A Pilot Study. Sports Health 2023, 15, 835–841. [Google Scholar] [CrossRef] [PubMed]
  19. Díaz-García, J.; González-Ponce, I.; Ponce-Bordón, J.C.; López-Gajardo, M.; García-Calvo, T. Diseño y Validación Del Cuestionario Para Valorar La Carga Mental En Los Deportes de Equipo (CCMDE). Cuad. Psicol. Deporte 2021, 21, 138–145. [Google Scholar] [CrossRef]
  20. García-Calvo, T.; Pulido, J.J.; Ponce-Bordón, J.C.; López-Gajardo, M.Á.; Costa, I.T.; Díaz-García, J. Can Rules in Technical-Tactical Decisions Influence on Physical and Mental Load during Soccer Training? A Pilot Study. Int. J. Environ. Res. Public Health 2021, 18, 4313. [Google Scholar] [CrossRef]
  21. Díaz-García, J.; Pulido, J.J.; Ponce-Bordón, J.C.; Cano-Prado, C.; López-Gajardo, M.Á.; García-Calvo, T. Coach Encouragement During Soccer Practices Can Influence Players’ Mental and Physical Loads. J. Hum. Kinet. 2021, 79, 277–288. [Google Scholar] [CrossRef] [PubMed]
  22. Badin, O.O.; Smith, M.R.; Conte, D.; Coutts, A.J. Mental Fatigue: Impairment of Technical Performance in Small-Sided Soccer Games. Int. J. Sports Physiol. Perform. 2016, 11, 1100–1105. [Google Scholar] [CrossRef]
  23. Smith, M.R.; Coutts, A.J.; Merlini, M.; Deprez, D.; Lenoir, M.; Marcora, S.M. Mental Fatigue Impairs Soccer-Specific Physical and Technical Performance. Med. Sci. Sports Exerc. 2016, 48, 267–276. [Google Scholar] [CrossRef]
  24. Smith, M.R.; Thompson, C.; Marcora, S.M.; Skorski, S.; Meyer, T.; Coutts, A.J. Mental Fatigue and Soccer: Current Knowledge and Future Directions. Sports Med. 2018, 48, 1525–1532. [Google Scholar] [CrossRef]
  25. Castillo, D.; Yanci, J.; Cámara, J.; Weston, M. The Influence of Soccer Match Play on Physiological and Physical Performance Measures in Soccer Referees and Assistant Referees. J. Sports Sci. 2016, 34, 557–563. [Google Scholar] [CrossRef] [PubMed]
  26. R-Studio Team. RStudio: Integrated Development for R; RStudio: Boston, MA, USA, 2020. [Google Scholar]
  27. Heck, R.H.; Thomas, S.L. An Introduction to Multilevel Modeling Techniques: MLM and SEM Approaches; Routledge: New York, NY, USA, 2020. [Google Scholar]
  28. Los Arcos, A.; Mendez-Villanueva, A.; Martínez-Santos, R. In-Season Training Periodization of Professional Soccer Players. Biol. Sport 2017, 34, 149–155. [Google Scholar] [CrossRef] [PubMed]
  29. Los Arcos, A.; Méndez-Villanueva, A.; Yanci, J.; Martínez-Santos, R. Respiratory and Muscular Perceived Exertion during Official Games in Professional Soccer Players. Int. J. Sports Physiol. Perform. 2016, 11, 301–304. [Google Scholar] [CrossRef]
  30. Van Cutsem, J.; Marcora, S.; De Pauw, K.; Bailey, S.; Meeusen, R.; Roelands, B. The Effects of Mental Fatigue on Physical Performance: A Systematic Review. Sports Med. 2017, 47, 1569–1588. [Google Scholar] [CrossRef]
  31. Faude, O.; Koch, T.; Meyer, T. Straight Sprinting Is the Most Frequent Action in Goal Situations in Professional Football. J. Sports Sci. 2012, 30, 625–631. [Google Scholar] [CrossRef]
  32. Filter, A.; Olivares-Jabalera, J.; Dos’Santos, T.; Madruga, M.; Lozano, J.; Molina, A.; Santalla, A.; Requena, B.; Loturco, I. High-Intensity Actions in Elite Soccer: Current Status and Future Perspectives. Int. J. Sports Med. 2023, 44, 535–544. [Google Scholar] [CrossRef]
  33. Castillo, D.; Raya-González, J.; Manuel Clemente, F.; Yanci, J. The Influence of Youth Soccer Players’ Sprint Performance on the Different Sided Games’ External Load Using GPS Devices. Res. Sports Med. 2020, 28, 194–205. [Google Scholar] [CrossRef] [PubMed]
  34. Dalen, T.; Jorgen, I.; Gertjan, E.; Havard, H.; Ulrik, W. Player Load, Acceleration and Deceleration during Forty-Five Competitive Matches of Elite Soccer. J. Strength Cond. Res. 2016, 30, 351–359. [Google Scholar] [CrossRef] [PubMed]
  35. Buchheit, M.; Al Haddad, H.; Simpson, B.M.; Palazzi, D.; Bourdon, P.C.; Di Salvo, V.; Mendez-Villanueva, A. Monitoring Accelerations with Gps in Football: Time to Slow Down. Int. J. Sports Physiol. Perform. 2014, 9, 442–445. [Google Scholar] [CrossRef] [PubMed]
  36. Soler, A.; Agullo, F.; Hernández-Davó, J.L.; Raya-González, J.; del Coso, J.; Gonzalez-Rodenas, J.; Moreno-Pérez, V. Influence of the External Workload on Calf Muscle Strain Injuries in Professional Football Players: A Pilot Study. Sports Health Multidiscip. J. 2024. ahead of print. [Google Scholar] [CrossRef]
  37. García-Calvo, T.; Ponce-Bordón, J.C.; Pons, E.; del Campo, R.L.; Resta, R.; Raya-González, J. High Metabolic Load Distance in Professional Soccer According to Competitive Level and Playing Positions. PeerJ 2022, 10, e13318. [Google Scholar] [CrossRef]
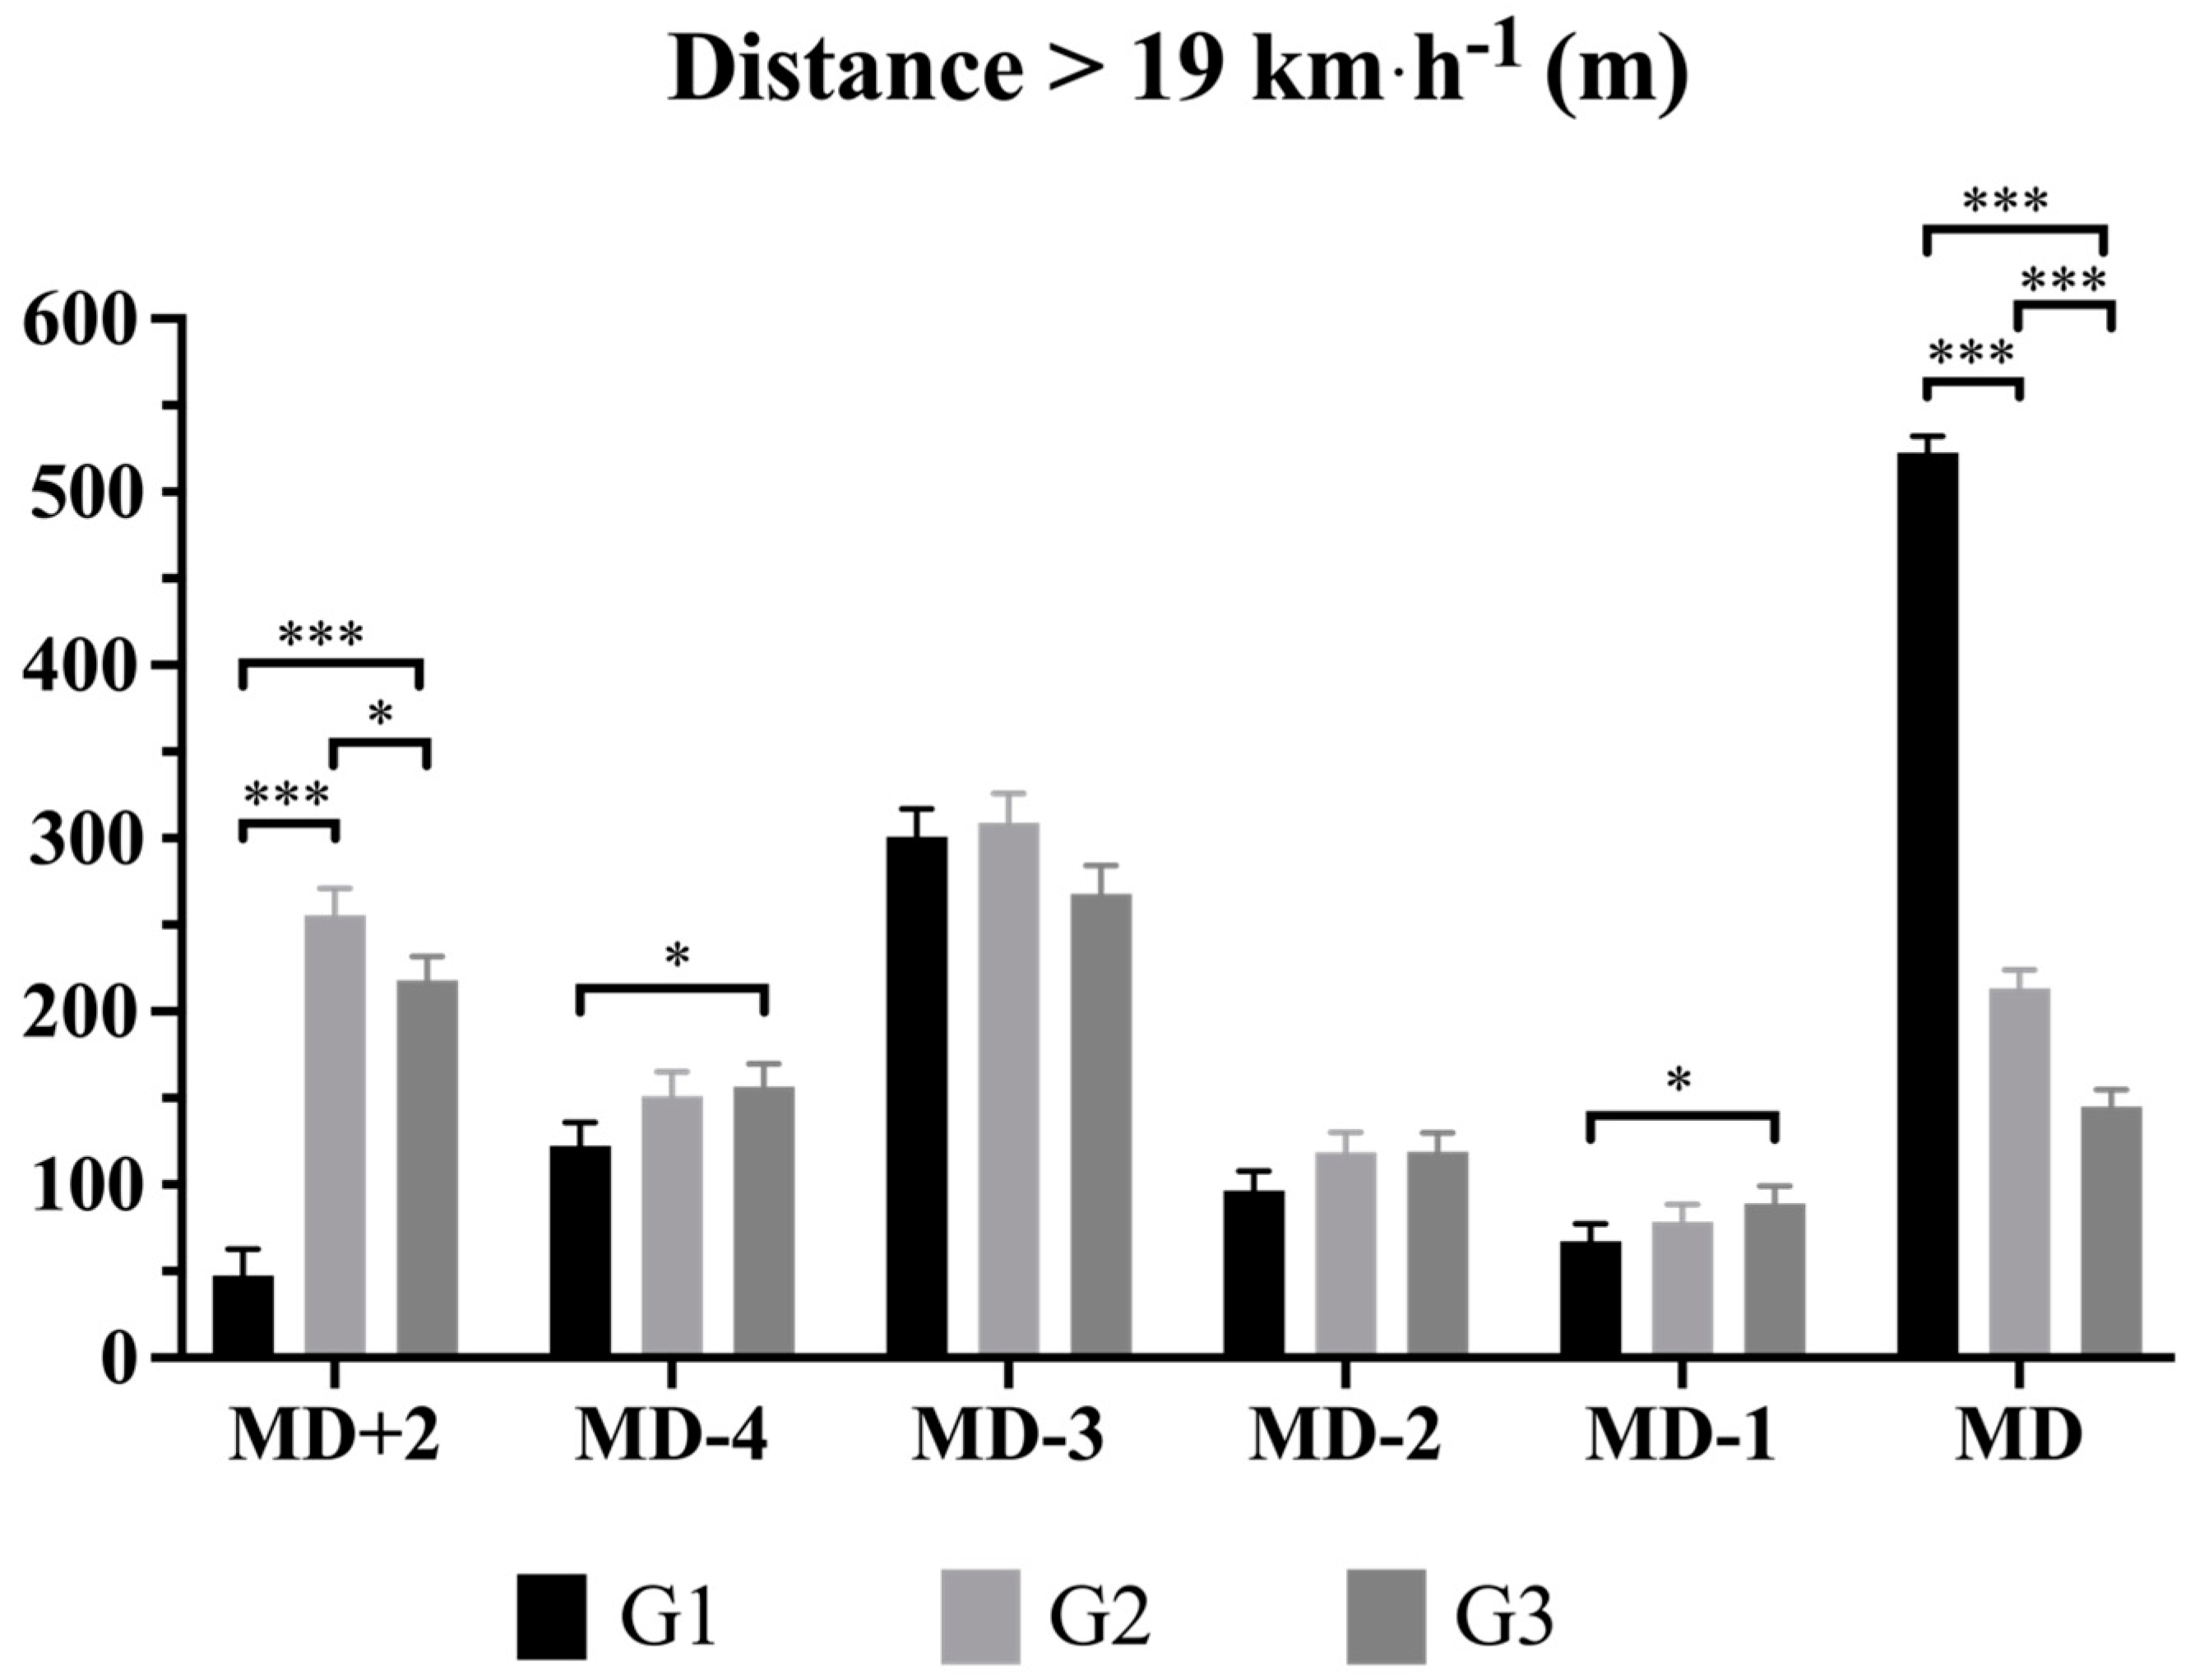
Figure 1. Differences in distance covered >19 km·h−1 between different group players by training day. Note. m = meters; MD+2 = two days after match; MD-4 = four days before match; MD-3 = three days before match; MD-2 = two days before match; MD-1 = one day before match; MD = match day; * p < 0.05; *** p < 0.001.
Applsci 14 05139 g001
Figure 2. Differences in distance covered > 25 km·h−1 between different group players by training day. Note. m = meters; MD+2 = two days after match; MD-4 = four days before match; MD-3 = three days before match; MD-2 = two days before match; MD-1 = one day before match; MD = match day; * p < 0.05; ** p < 0.01; *** p < 0.001.
Applsci 14 05139 g002
Figure 3. Differences in number of sprints performed between different group players by training day. Note. nº = number; MD+2 = two days after match; MD-4 = four days before match; MD-3 = three days before match; MD-2 = two days before match; MD-1 = one day before match; MD = match day; * p < 0.05; ** p < 0.01; *** p < 0.001.
Applsci 14 05139 g003
Figure 4. Differences in maximum speed reached between different group players by training day. Note. MD+2 = two days after match; MD-4 = four days before match; MD-3 = three days before match; MD-2 = two days before match; MD-1 = one day before match; MD = match day; * p < 0.05; ** p < 0.01; *** p < 0.001.
Applsci 14 05139 g004
Table 1. Between-groups differences according to internal and mental load variables.
MD+2MD-4MD-3MD-2MD-1MD
Coeff (SE)pCoeff (SE)pCoeff (SE)pCoeff (SE)pCoeff (SE)pCoeff (SE)p
RPEG13.94 (0.11)a ***, b ***6.35 (0.10) 6.27 (0.12)c **4.42 (0.08)a ***, b ***3.90 (0.06)a **, b ***, c ***8.46 (0.06)a ***, b ***, c ***
G26.28 (0.12)6.48 (0.10)6.57 (0.13)5.16 (0.08)4.09 (0.07)6.29 (0.07)
G36.11 (0.10)6.35 (0.10)6.10 (0.12)5.15 (0.07)4.42 (0.06)5.05 (0.06)
Cognitive loadG13.90 (0.13)a ***, b ***6.06 (0.11) 6.04 (0.14) 4.48 (0.08)a ***, b ***4.05 (0.07)b ***, c ***7.91 (0.07)a ***, b ***, c ***
G25.96 (0.13)6.09 (0.12)6.22 (0.15)5.13 (0.09)4.18 (0.07)6.79 (0.08)
G35.89 (0.11)6.33 (0.11)6.14 (0.14)5.33 (0.08)4.74 (0.07)5.93 (0.07)
Emotional loadG13.90 (0.12)a ***, b ***6.05 (0.10) 6.06 (0.13) 4.50 (0.08)a ***, b ***, c *4.03 (0.07)a *, b ***, c ***7.84 (0.06)a ***, b ***, c ***
G26.01 (0.13)6.25 (0.11)6.32 (0.14)5.10 (0.09)4.23 (0.07)6.76 (0.07)
G35.97 (0.11)6.26 (0.10)6.03 (0.14)5.34 (0.08)4.75 (0.07)5.91 (0.06)
Affective loadG13.82 (0.12)a ***, b ***6.08 (0.11) 6.16 (0.13) 4.52 (0.08)a ***, b ***4.05 (0.07)b ***, c ***7.92 (0.07)a ***, b ***, c ***
G25.98 (0.13)6.23 (0.11)6.39 (0.14)5.12 (0.09)4.20 (0.07)6.81 (0.08)
G35.90 (0.11)6.22 (0.11)6.10 (0.14)5.32 (0.08)4.70 (0.07)5.94 (0.07)
MotivationG16.22 (0.17)b *6.83 (0.14)b **, c *6.52 (0.18) 6.47 (0.11) 6.28 (0.08)b *8.15 (0.08)a ***, b ***, c ***
G26.60 (0.18)6.90 (0.15)6.80 (0.20)6.49 (0.11)6.41 (0.09)7.23 (0.10)
G36.78 (0.15)7.41 (0.14)6.87 (0.19)6.65 (0.10)6.55 (0.08)6.69 (0.08)
Mental FatigueG13.91 (0.13)a ***, b ***4.80 (0.11)a *4.89 (0.14) 4.29 (0.08)b **3.66 (0.06)b *7.52 (0.06)a ***, b ***, c ***
G24.86 (0.13)5.19 (0.12)4.96 (0.15)4.44 (0.09)3.73 (0.07)6.08 (0.08)
G34.67 (0.11)5.07 (0.11)4.92 (0.14)4.60 (0.08)3.85 (0.07)5.20 (0.06)
Notes. Coeff = coefficient; SE = standard error; MD+2 = two days after match; MD-4 = four days before match; MD-3 = three days before match; MD-2 = two days before match; MD-1 = one day before match; MD = match day; RPE = rate of perceived exertion; G1 = starter players; G2 = non-starter players; G3 = players who did not participate in the match. a = significant differences between G1 and G2; b = significant differences between G1 and G3; c = significant differences between G2 and G3. * p < 0.05, ** p < 0.01, *** p < 0.001.
Table 2. Between-groups differences according to variables related to mechanical demands.
MD+2MD-4MD-3MD-2MD-1MD
Coeff (SE)pCoeff (SE)pCoeff (SE)pCoeff (SE)pCoeff (SE)pCoeff (SE)p
ACC (nº)G16.84 (0.95)a ***, b ***24.38 (0.85) 19.36 (1.01)b *12.13 (0.71)a ***, b **12.35 (0.62) 26.61 (0.61)a ***, b ***, c *
G218.11 (0.98)24.44 (0.90)19.05 (1.08)14.86 (0.74)13.09 (0.65)14.41 (0.67)
G320.15 (0.87)22.93 (0.84)16.71 (1.05)14.09 (0.693)13.21 (0.62)15.93 (0.61)
DEC (nº)G15.27 (0.94)a ***, b ***20.11 (0.84) 18.45 (0.99)b ***, c **9.77 (0.73)a ***, b ***9.45 (0.65)a **32.28 (0.64)a ***, b ***, c ***
G219.05 (0.96)20.23 (0.88)18.19 (1.04)12.81 (0.75)10.94 (0.67)13.78 (0.69)
G318.90 (0.86)18.50 (0.84)14.33 (1.02)12.26 (0.71)10.18 (0.65)11.42 (0.65)
PLoad (m)G1310 (18.1)a ***, b ***, c *464 (16.1) 561 (19.2) 409 (13.6)a ***, b ***374 (12.0)a **, b **892 (11.7)a ***, b ***
G2587 (18.6)474 (17.0)554 (20.4)471 (14.1)411 (12.4)395 (12.8)
G3545 (16.5)467 (16.0)529 (19.8)473 (13.1)415 (11.9)402 (11.8)
Notes. Coeff = coefficient; SE = standard error; MD+2 = two days after match; MD-4 = four days before match; MD-3 = three days before match; MD-2 = two days before match; MD-1 = one day before match; MD = match day; ACC = number of actions accelerating above 3 m·s2; DEC = number of actions accelerating above −3 m·s2; PLoad = player load; G1 = starter players; G2 = non-starter players; G3 = players who did not participate in the match. a = significant differences between G1 and G2; b = significant differences between G1 and G3; c = significant differences between G2 and G3. * p < 0.05, ** p < 0.01, *** p < 0.001.
Disclaimer/Publisher’s Note: The statements, opinions and data contained in all publications are solely those of the individual author(s) and contributor(s) and not of MDPI and/or the editor(s). MDPI and/or the editor(s) disclaim responsibility for any injury to people or property resulting from any ideas, methods, instructions or products referred to in the content.