Abstract
Marine diesel engines are the preferred power equipment for ships and are the most important component among the numerous electromechanical devices on board. Accidents involving these engines can potentially cause immeasurable damage to the vessel, making fault detection in marine diesel engines crucial. This design enables the detection and reporting of faults in marine diesel engines at the earliest possible time through the computation of convolutional neural networks, which is of great significance for ensuring the safe navigation of ships. For this functionality, the Xilinx ZYNQ-7000 XC7Z010 is selected as the main control chip, and the LoRa wireless network is used as the transmission module. The FreeRTOS embedded operating system is ported, with sensor data collection completed on the PS side of the ZYNQ chip and algorithm acceleration calculations on the PL side. Data are then transmitted to the host computer via the LoRa module paired with a custom protocol. Experimental test results show that the program provides stable data transmission, with each module of the algorithm generally accelerating by more than 95% and an accuracy rate of 92.86%. Additionally, the host computer can display the received data in real time. The custom protocol’s header also allows for precise judgments about the completeness and origin of messages, facilitating the expansion of other SOC’s message uplink and the host computer’s message downlink.
1. Introduction
Marine diesel engines are the primary power source for ships, driving the propellers that move the ship through water. Besides propulsion, these engines also drive generator sets to produce electricity for various electrical devices onboard, and the heat generated can be used to warm various compartments and provide hot water. The safe operation of a ship is closely linked to the reliability and safety of its main propulsion system, which plays an indispensable role during development. The reliability of any component or system refers to the ability to perform required functions under specified operating conditions over a certain period of time, and is usually expressed in terms of probability [1]. Safety factor refers to additional safety measures or margins adopted during the design or operation of a system or equipment to ensure safety, commonly used to prevent potential personal injury, loss of life, or damage to equipment and the surrounding environment, with the safety factor of a ship primarily dependent on reliability [2]. However, due to the complex nature of marine main engines and related systems, it is difficult for crew members to identify faults timely based on large amounts of data, or to predict the onset and severity of faults. The marine diesel engine, being the core power unit of a ship, plays a crucial role in its operation. A fault in the marine diesel engine can easily paralyze the ship, and if occurring during navigation, could lead to incidents such as a loss of contact or collisions, making fault detection in marine diesel engines crucial.
To detect and prevent unnecessary faults at an early stage, fault diagnosis was developed. Fault diagnosis primarily involves the detection, isolation, and analysis of faults. The main purpose of fault diagnosis is to determine the type, size, timing, and location of a fault [3]. In the operation of ships, it is crucial to continuously monitor and record the technical condition and parameters of all primary and auxiliary equipment. Once these condition data are digitized, the reliability and safety of any component can be estimated, and measures to reduce the risk of failure can be taken based on these data. Additionally, equipment does not fail abruptly but shows pre-failure changes, allowing for focused attention on parameters that are prone to provide early warnings, further customizing and enhancing the maintenance plans for any component of the system.
From an economic standpoint, monitoring data allows for maintenance before failures occur, extending the equipment’s lifespan, which can effectively reduce repair costs and lower the lifecycle costs such as preventative costs, the costs of materials, new energy, and spare parts transportation and installation. Marine diesel engines, while ensuring safety and reliability, can also reduce unnecessary costs and enhance environmental performance.
The purpose of this program is to promptly identify and report any faults in diesel engines. Compared to traditional embedded devices like Raspberry Pi and microcontrollers, the ZYNQ chip combines ARM and FPGA, offering hardware acceleration as well as the general computing capabilities of a processor. With algorithms continuously advancing, traditional embedded devices might struggle to keep up. Therefore, high-performance devices like ZYNQ will likely have an advantage in fault diagnostics moving forward.
The program uses a convolutional neural network that has many advantages in classification. It can automatically extract features from the input data without the need for manually designed feature extractors. Additionally, it employs local connectivity and weight sharing, meaning each neuron is only connected to a local part of the input data. This reduces the number of parameters, lowers computational complexity, and enhances the model’s robustness to variations such as rotations, scaling, and shifts. This hierarchical structure also makes the model easier to understand. Convolutional neural networks can also mitigate risks like overfitting, commonly encountered in algorithms, through techniques such as parameter sharing and regularization.
Marine diesel engines are monitored using many sensors, which means a large volume of sensor data needs to be transmitted to a supervisory computer for data analysis and processing. After the analysis, the results are used for fault diagnosis and a health assessment of the ship’s equipment. Currently, as the development of ship intelligence increasingly leans towards unmanned operations, analyzing data via supervisory computers inevitably faces two problems. First, with numerous devices in the ship’s engine room, uploading large amounts of data simultaneously can cause data confusion, data loss, and insufficient bandwidth to support the volume of data. Second, the process of the supervisory computer sending commands to the corresponding devices is complex and lacks feedback, which is a significant issue in communication.
This paper, after studying factors affecting marine diesel engine failures, proposes a multi-protocol aggregation message transmission protocol. It facilitates the connection of sensors using different protocols with the ZYNQ PS side and communication with the supervisory computer. Additionally, through using open-source data to simulate the operation data of the marine diesel engine during navigation, the ZYNQ PL side’s convolutional neural network is used for fault diagnosis. Finally, communication between the LoRa module and the PC, as well as command transmission from the PC to the ZYNQ, is achieved.
Researchers both domestically and internationally have made significant progress in the field of fault detection. For instance, Baris Yigin and Metin Celik employed generative adversarial networks (GANs) for monitoring ship machinery equipment, achieving excellent results when applied to real ships, with data processing conducted on upper computers [4]. Myung-Kyo Seo and Won-Young Yun utilized convolutional neural networks (CNNs) to achieve over 95% accuracy in monitoring gearbox conditions, demonstrating the capability of CNNs in fault diagnosis [5]. Additionally, Cihan Ates, Tobias Höfchen, and others utilized Convolutional Autoencoders for predictive maintenance of rolling bearings, exhibiting impressive performance [6]. Jin Yan, Jian-bin Liao, and their colleagues combined second-order convolutional neural networks (QCNN) with audio and vibration signals from bearings, indicating the improved CNNs’ ability to diagnose complex parameters such as vibration signals [7]. Jan Monieta, Lech Kasyk, and others achieved a diagnostic accuracy of over 90% for fuel injection systems using neural network (NN) machine learning methods for amplitude and frequency analysis [8]. Caiyun Wu, Kai Zhang, and their team established an improved BAS algorithm on FPGA and verified its feasibility through hardware simulation, demonstrating FPGA’s capability for algorithmic computations [9]. Jinxin Wang, Chi Zhang, and their collaborators used a multi-statistical parameter fault detection method for monitoring weak characteristic faults in diesel engines, showing that even engines with weak characteristics can be diagnosed using algorithms [10]. Dong-Yeong Lee, Hayotjon Aliev, and others conducted target detection using convolutional neural networks on System-on-Chip (SOC), providing significant reference value for implementing CNN calculations on ZYNQ in this paper [11]. Lastly, Bohan Liu, Qihai Wei, and their team completed defogging tasks using ZYNQ, indicating its feasibility for algorithmic computations and real-time calculations [12]. Collectively, these papers provide valuable references for this paper and contribute to the design of this program.
2. Methods
2.1. Basic Architecture Design
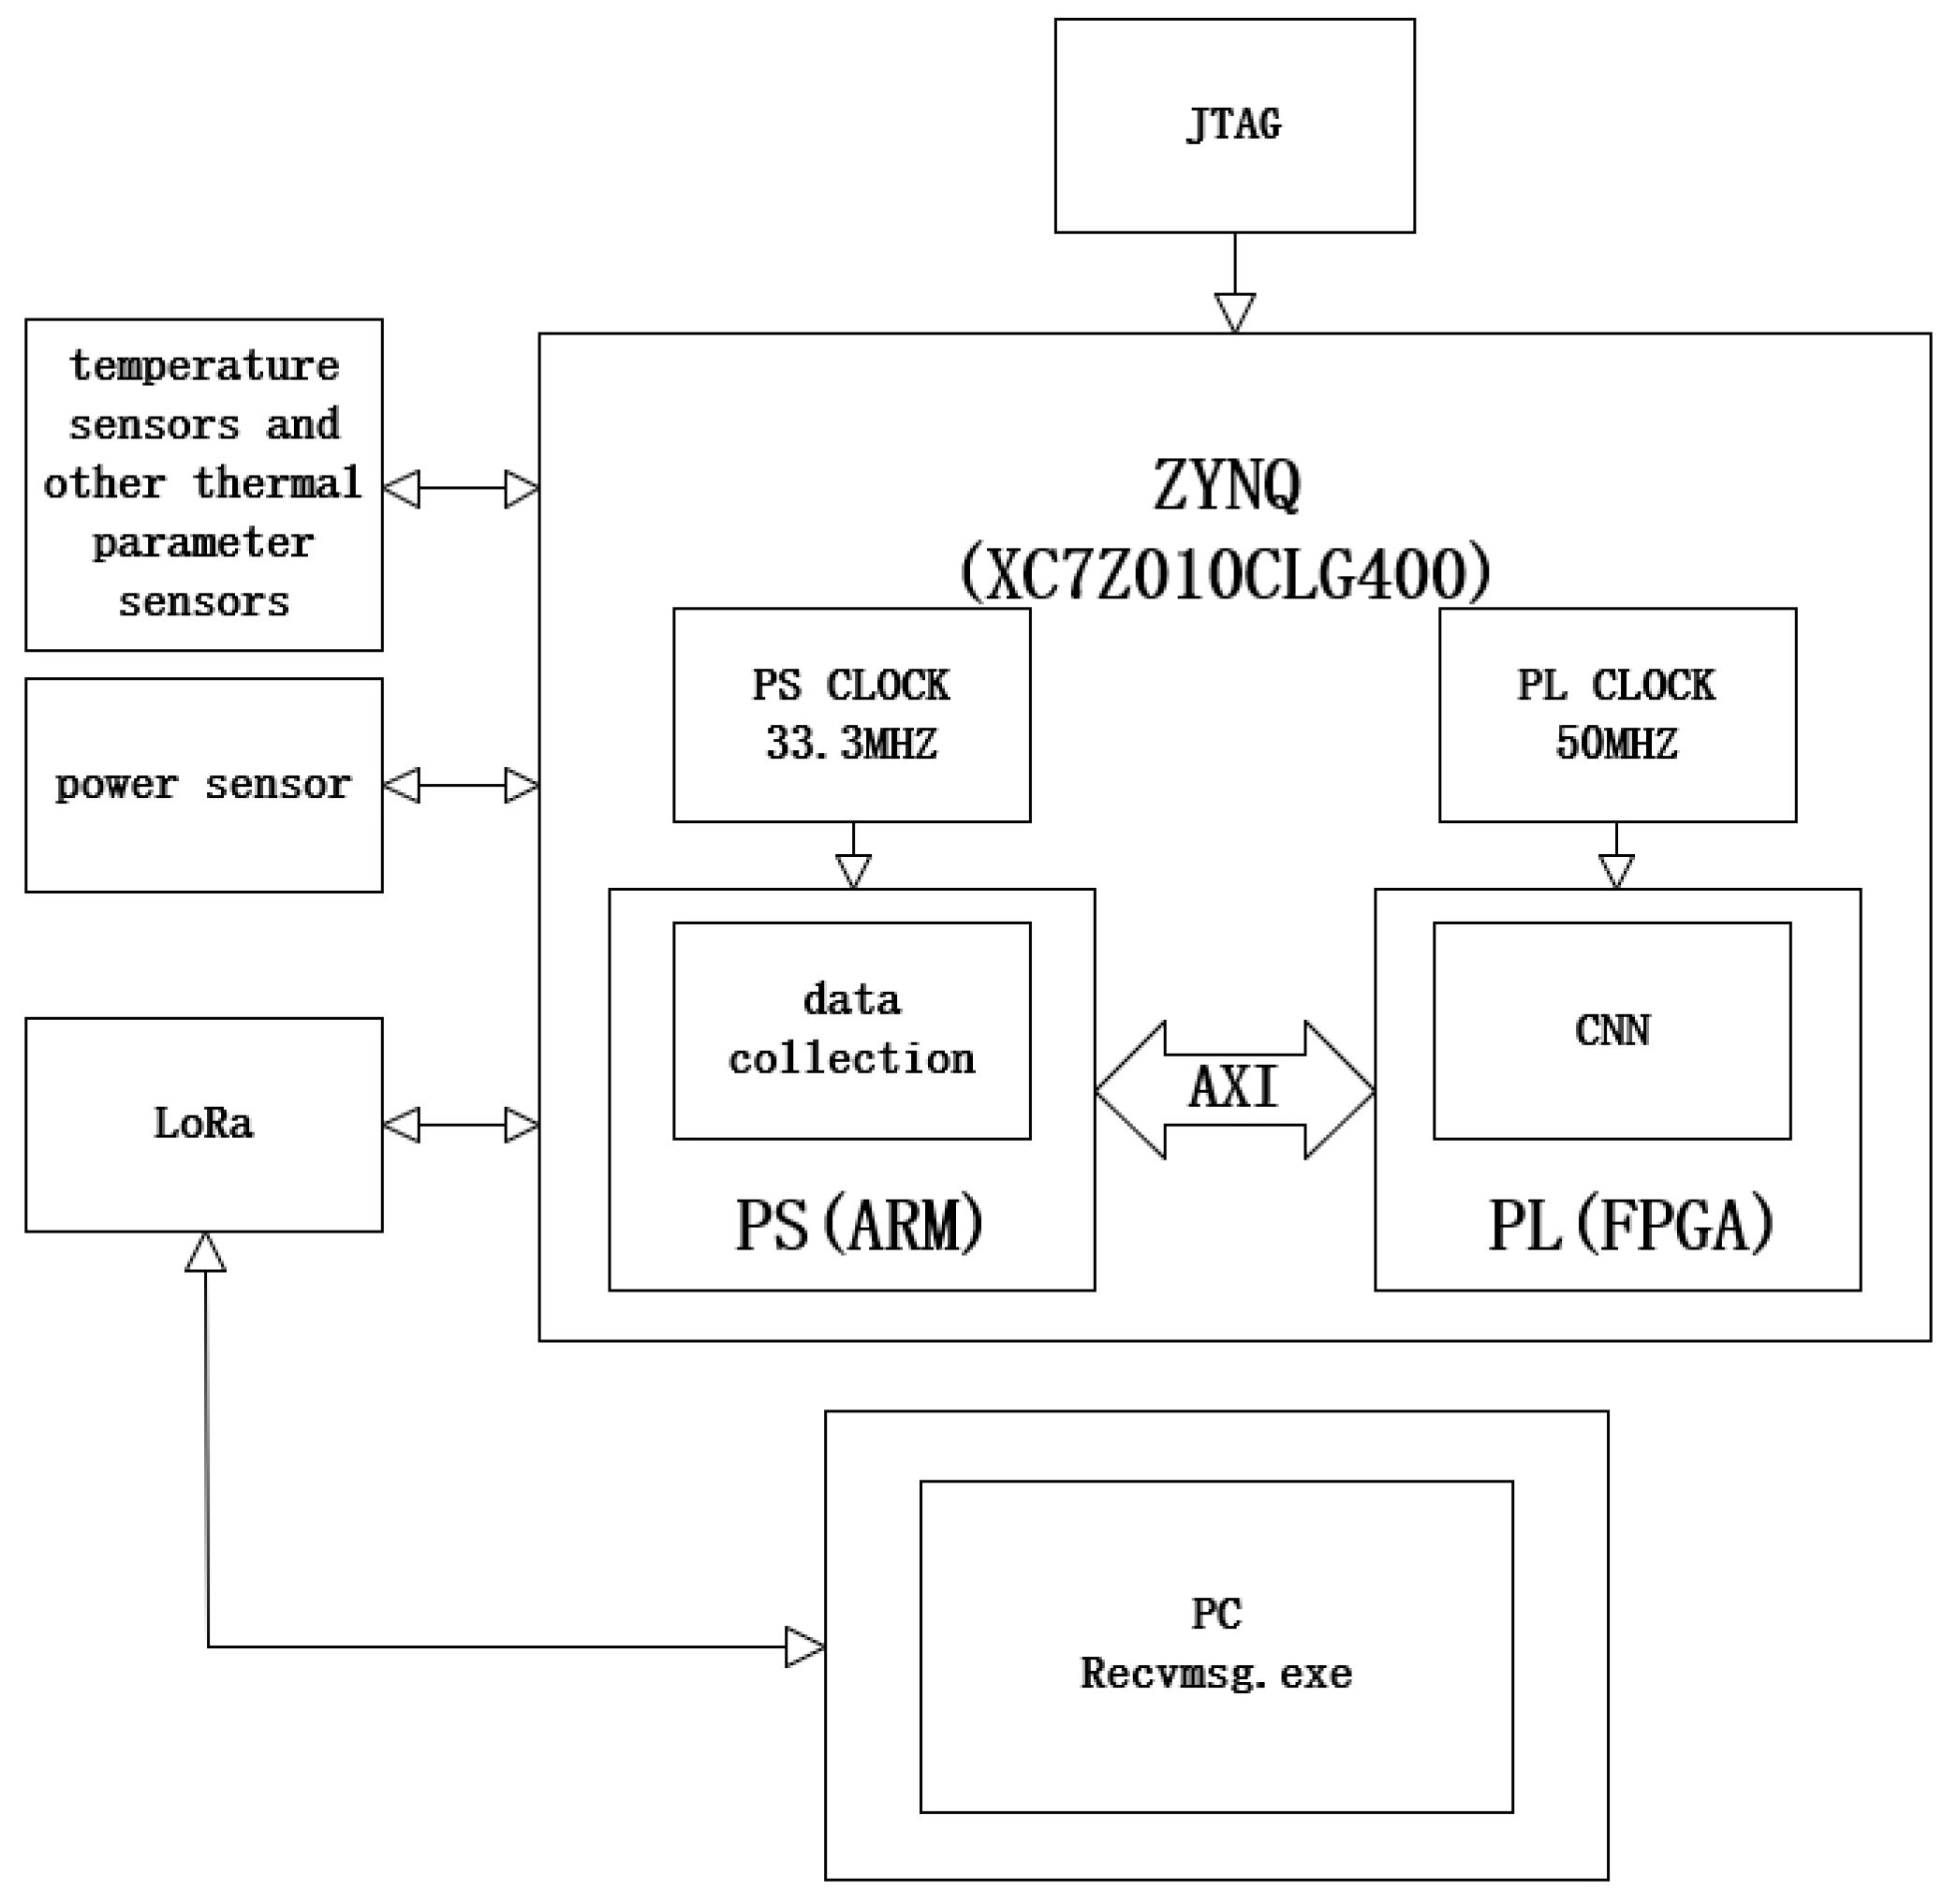
As shown in Figure 1, the basic architecture design involves the ZYNQ main control chip which is programmed into ZYNQ’s FLASH via JTAG using the supervisory computer, enabling a “power-on-and-go” functionality. The PS side of ZYNQ is responsible for connecting to sensors and appends protocol-specific source data type headers to the data. It then transfers the accumulated data to the PL side for FPGA-accelerated processing. The processed results are returned to the PS side, where a parsing header is added and then transmitted to the supervisory computer through ZYNQ’s LoRa module. The supervisory computer’s LoRa module receives these data, which are then processed using a custom reception program that displays the parsed data in real-time. Additionally, the supervisory computer can send commands to retrieve source data to display them in real-time as line graphs.

Figure 1.
Basic architecture design.
This program is an idealized version of marine diesel engine fault detection. The diagnostic dataset used in future stages will come from publicly available data of a Wärtsilä 9L34DF dual-fuel medium-speed turbocharged engine mounted on a natural gas transport vessel. To fully utilize all functionalities of ZYNQ, the integration of communication protocols between sensors and the supervisory computer on the ZYNQ’s PS side (ARM side) has been enhanced. This setup is designed to simulate the process of transmitting data from actual ship sensors to the ZYNQ chip, processing and parsing the data, and then sending the diagnostic results back to the supervisory computer, aiming to maximize the simulation of real-ship operations.
2.2. Chip Introduction
The ZYNQ chip, developed by Xilinx, is a System-on-Chip (SoC) that integrates a high-performance programmable logic section (PL) with a dual-core ARM Cortex-A9 processor system (PS). This configuration endows the ZYNQ chip with high flexibility and performance in processing large-scale data and real-time tasks. The Xilinx ZYNQ-7000 XC7Z010 used in this paper can reach a main frequency of 666 MHz, and its two processor cores can operate independently or collaboratively to execute various applications and system tasks. The PS side’s FPGA programmable logic offers approximately 28,000 logic cells (Look-Up Tables, LUTs) and 17,600 flip-flops, enabling the implementation of various custom digital logic functions. The Xilinx Zynq-7000 EPP chip series is a versatile processing platform that has been employed in diverse research fields [13]. Monson and others optimized a complex optical flow algorithm in C language on both desktop PCs and Xilinx Zynq-7000, demonstrating competitive performance and significantly reduced energy consumption on Zynq devices [14]. Vipin and colleagues performed effective partial reconfiguration on their open-source controller ZyCAP on Xilinx Zynq, aimed at reducing reconfiguration overhead and enhancing hardware resource utilization [15]. Additionally, Zhou and others proposed a co-design method of software and hardware for OpenFlow switches on heterogeneous SoC platforms, achieving high throughput on Xilinx Zynq [16]. Che and colleagues analyzed the security features of the authentication protocol of Xilinx Zynq FPGA, emphasizing the use of hardware-embedded delay PUF to protect privacy [17]. Habib and others introduced an efficient PUF design based on SR-Latch, validated on Xilinx Zynq SoC devices, showing improved area utilization for low-area designs [18]. Moreira and colleagues explored the implementation of PTP functionality on Xilinx Zynq-7000 SoC devices to achieve nanosecond-level synchronization accuracy in substation automation systems [19]. Gong and others proposed a fully pipelined convolutional neural network FPGA accelerator, and implemented various CNN models on Xilinx Zynq-7020 and Virtex-7 690t FPGA platforms [20]. Lastly, He and others implemented a predictive control scheme for PMSM drives based on Luenberger disturbance observers on Xilinx Zynq SoC, comparing area utilization and time consumption for FPGA implementation [21]. In these studies, the Xilinx Zynq platform is extensively used in various research areas due to its flexibility, performance, and energy efficiency in applications such as accelerators, authentication protocols, PTP functionality, and neural network accelerators.
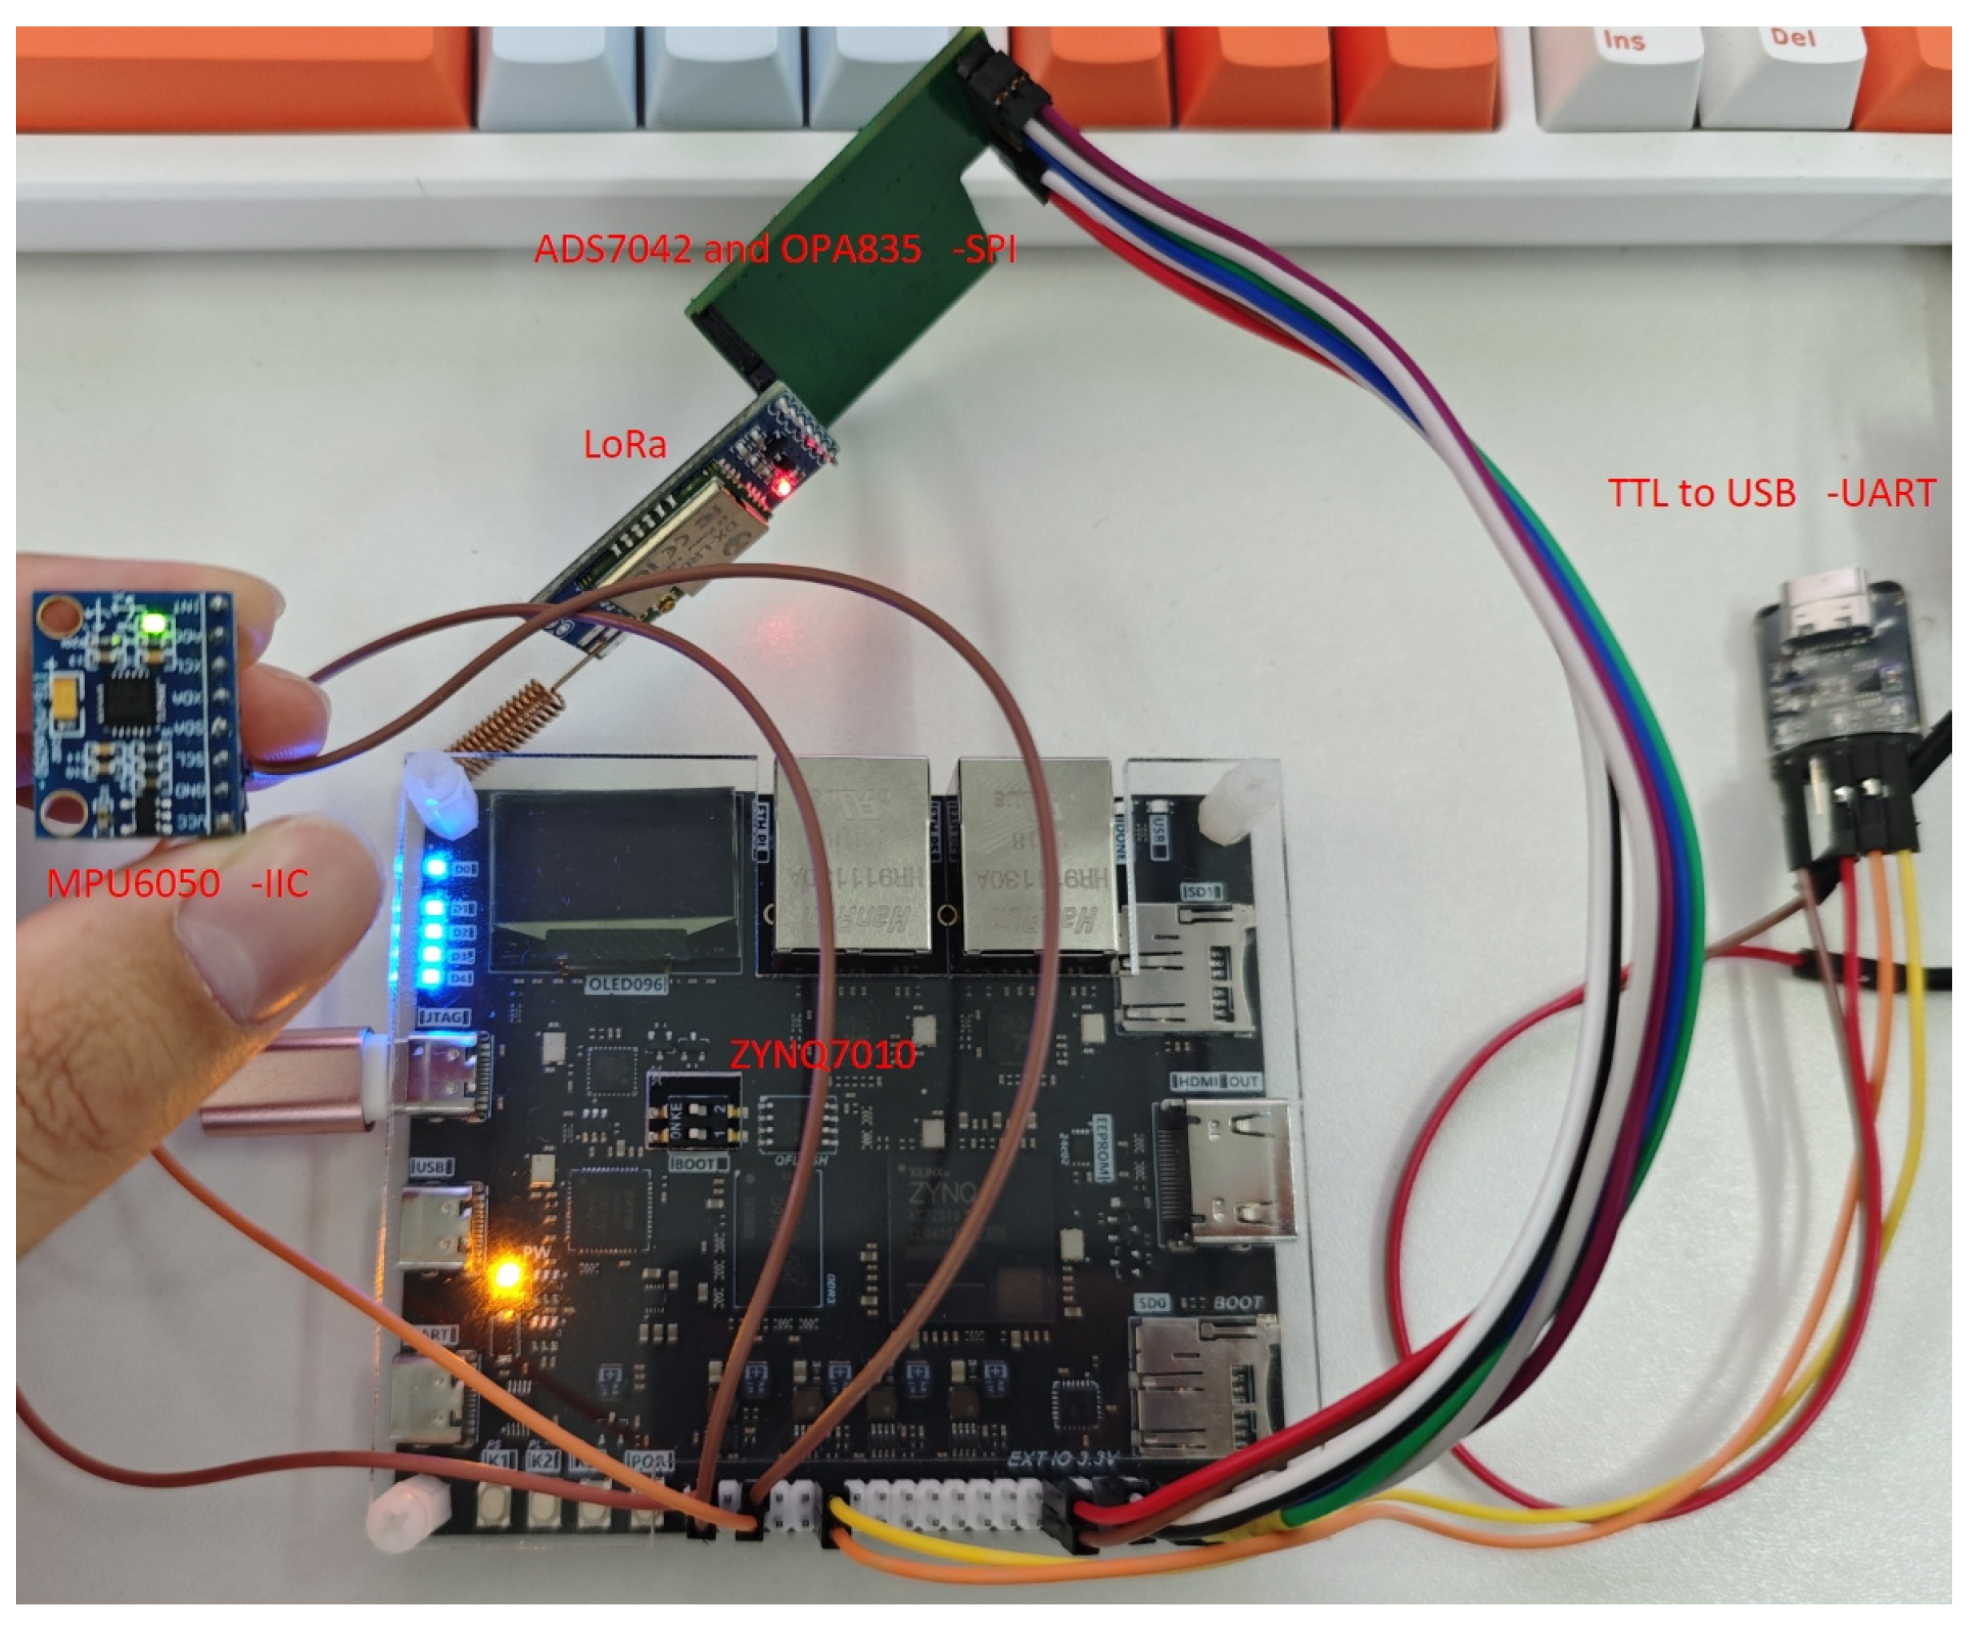
Figure 2 shows the physical connection diagram in this paper, illustrating the connections among the MPU6050, LoRa module, UART, and ZYNQ7010, demonstrating the feasibility of the experiment.
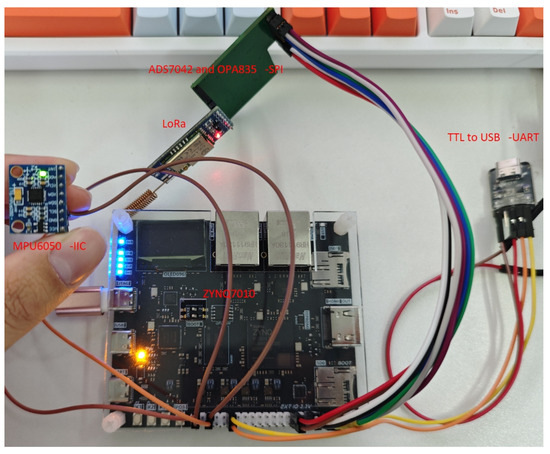
Figure 2.
Physical diagram of the ZYNQ chip.
2.3. Development Software Introduction
The design employs Vivado 2018.3, an integrated circuit (IC) design suite released by Xilinx. It is used for developing and verifying the hardware designs of FPGAs, SoCs, and programmable logic devices. Vivado provides an intuitive graphical user interface (GUI) that facilitates easy design, simulation, and debugging. It also allows for the construction of hardware designs through drag-and-drop and connecting graphical elements, reducing the need for extensive coding. Moreover, it offers advanced synthesis and implementation tools that can convert design code into configurable hardware resources, optimizing the design to meet performance, area, and power requirements.
High-Level Synthesis (HLS) is an automated process that converts algorithm descriptions written in high-level languages like C or C++ into hardware description languages such as Verilog or VHDL. HLS tools can map algorithms described in high-level languages onto hardware platforms like FPGAs, enabling hardware acceleration.
Matlab R2022a is an advanced technical computing and programming environment that provides a rich set of tools and features for data analysis, visualization, numerical computation, and simulation tasks. This paper primarily utilizes its Deep Learning Toolbox, a toolkit specifically designed for developing, training, and deploying deep learning models. This toolbox allows for the creation of custom deep learning models using MATLAB’s advanced programming capabilities. With simple APIs, it is easy to create various types of neural networks, such as the convolutional neural networks discussed in this paper, and it supports various training techniques including adaptive learning rate adjustments and batch normalization. Additionally, Matlab APP functionality is used, which offers a graphical interface enabling APP feature development without extensive coding. Users can design the user interface of applications via drag-and-drop operations and add interactive capabilities through MATLAB code.
2.4. Neural Network Related
2.4.1. Introduction to Convolutional Neural Networks
A convolutional neural network (CNN) is a type of deep learning model specifically designed for image recognition and data classification. CNNs are capable of automatically learning and extracting features from images, thereby facilitating content recognition and classification.
The main components of a CNN include the following layers:
Convolutional Layer: This is the core layer of the network, aimed at feature extraction. Each convolutional layer consists of multiple filters, each capable of learning different features. The primary method involves padding the input feature map so that the filter can perform convolution operations on the overlapping sections with the content. Each filter then combines to output a new feature map. The formula for the convolution operation is as follows:
and represent the spatial positions of the output feature map, k represents the channel of the output feature map, and F is the size of the filter. represents the number of channels in the input feature map, s is the stride, p is the padding, represents a pixel in the input feature map, is the weight of the filter, and is the bias term.
Pooling Layer: After the convolutional layer, the output image has a data volume similar to the input image, necessitating the use of a pooling layer to reduce the dimensions of the feature maps and decrease sensitivity to position. The main operations include max pooling and average pooling.
Activation Function Layer: This layer introduces non-linear properties, enabling the CNN to learn more complex functional relationships. This paper utilizes the ReLU (Rectified Linear Unit) function, which allows for faster convergence during training. The formula for the ReLU function is as follows:
x is the input value. The ReLU function sets all negative values to zero, while leaving positive values unchanged.
Fully Connected Layer: This layer integrates the features extracted from the convolutional and pooling layers and outputs the final classification results and feature representations. In the fully connected layer, the output of each neuron can be represented as follows:
n is the number of neurons in the previous layer, represents the weight connecting the input neuron to the output neuron, is the bias of the output neuron, and f is the activation function.
2.4.2. Batch Normalization Introduction
Batch Normalization (BN) is a commonly used technique in deep learning designed to accelerate the training of neural networks and enhance their performance. The basic idea is to normalize each feature dimension before it enters each layer of the neural network, ensuring that each feature has a mean close to 0 and a standard deviation close to 1. This effectively mitigates issues such as gradient vanishing and gradient explosion during neural network training, thus accelerating network convergence. It also significantly reduces the need for other regularization techniques, greatly simplifying the model design and debugging process.
Suppose an input layer is represented by B = {}, then its calculation formula is as follows:
and represent the variance and mean of the feature dimension, respectively. is a small constant used to prevent division by zero. is the scaling factor, and is the bias term.
2.4.3. Introduction to CNN Optimization Algorithms
(1) Adam (Adaptive Moment Estimation) combines the advantages of momentum and adaptive learning rate techniques. It calculates the first-order moment estimate (the mean of the gradients) and the second-order moment estimate (the mean of the squares of the gradients), using these estimates to adjust the learning rate for each weight. Here is the formula for it:
is the parameters at step t, is the gradient at step t, α is the learning rate, and are decay factors, and are the first and second moment estimates of the gradients, and is a small number used for numerical stability.
Compared to other optimization algorithms, Adam is relatively insensitive to the choice of hyperparameters and is well-suited for dealing with sparse gradients.
(2) SGDM (Stochastic Gradient Descent with Momentum) is a variant of stochastic gradient descent that introduces the concept of momentum. This allows updates to have inertia in their direction, which helps speed up convergence and reduce oscillation.
Here is the formula for it:
represents the parameters at step t, represents the gradient at step t, α is the learning rate, is the momentum coefficient, and denotes the momentum of the gradient.
(3) RMSprop is an adaptive learning rate method designed to adjust the learning rate for each weight. It calculates the exponentially weighted moving average of the squared gradients and uses this to normalize the magnitude of the gradients.
Here is the formula for it:
represents the parameters at step t, represents the gradient at step t, α is the learning rate, is the decay coefficient, denotes the exponentially weighted moving average of the squared gradients, and is a very small number used for numerical stability.
RMSprop automatically adapts the learning rate and maintains a smaller learning rate for parameters with large gradient variations, making it easier to use compared to other optimization algorithms.
2.5. Universal Communication Protocol
This section introduces both generic and custom communication protocols. The data obtained are solely used to verify the connection between the sensors and the ZYNQ device, not for input into the algorithm model. The focus is on facilitating mutual communication from the sensor to ZYNQ to the supervisory computer, with the algorithm dataset employing more authoritative public datasets.
There are various sensors inside a ship’s engine room, each supporting different communication protocols and data formats, such as I2C, SPI, and CAN bus protocols. Therefore, it is necessary for the SoC to adapt and handle different communication protocols and ensure stable and reliable data exchange with the sensors. If the SoC merely receives data and directly uploads them to the supervisory computer, it could lead to data confusion and loss. The supervisory computer would also be unable to properly command specific devices, resulting in one-sided communication. Economically, it is also impractical to dedicate one SoC to a single sensor. Consequently, the integrated communication protocol designed in this paper can integrate most protocols. Besides the protocols supported using the chip, it can use an IP core based on the AXI (Advanced eXtensible Interface) bus standard provided by Xilinx or the AXI_GPIO IP core to simulate communication protocols. For instance, in this design, the I2C is simulated to communicate with the MPU6050 module using the I2C protocol.
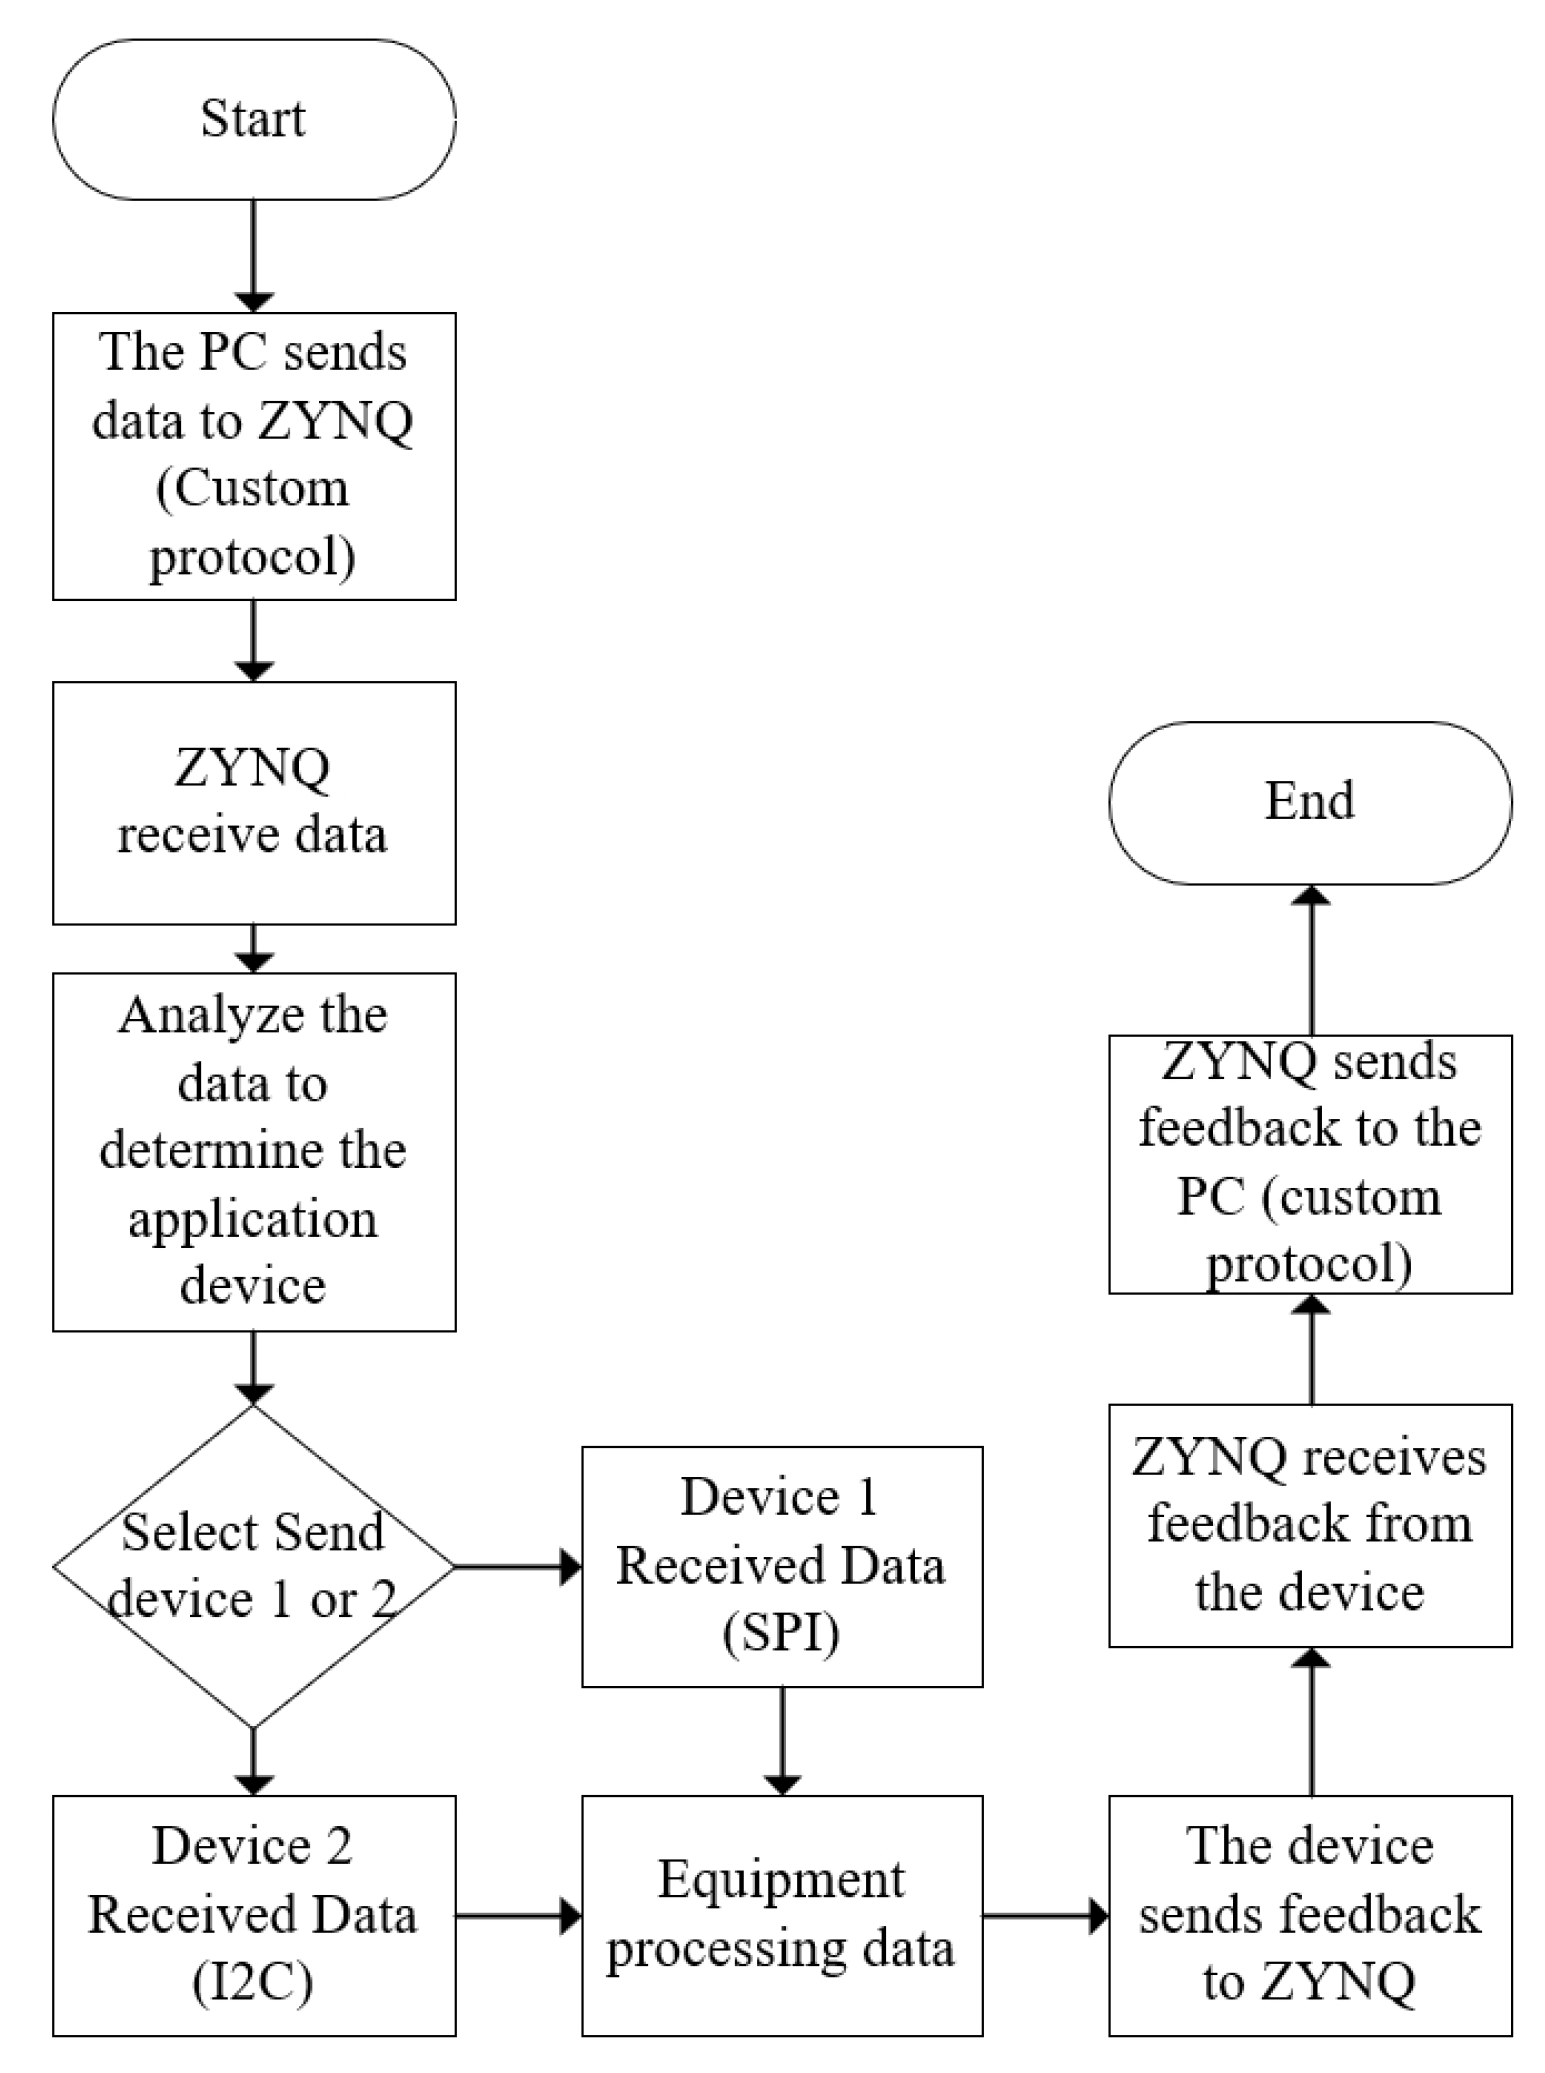
A universal communication protocol is used for interaction between the ZYNQ and various shipboard devices. Given the wide range of equipment on board, the communication protocols applied to the ship according to the categories in this paper’s dataset include I2C, SPI, and serial communication protocols. These standard protocols are used to connect the devices with the ZYNQ. Once the ZYNQ is connected to the devices, the collected data are stored within the ZYNQ. At this point, a custom communication protocol comes into play. The collected data become a message body, which, after processing using the internal programs of the ZYNQ, results in a header. This header and message body are then transmitted to the supervisory computer via LoRa, as illustrated in the flowchart in Figure 3.

Figure 3.
Communication protocol flowchart.
Upon receiving a custom protocol command from the PC, the ZYNQ processes this command to determine the destination of the message before forwarding it. Conversely, upon receiving messages uploaded from the device, it processes these messages and uploads them to the PC using the custom protocol. The PC side also has custom protocol parsing code to analyze and identify the source of the messages, thus facilitating mutual communication between the devices, ZYNQ, and PC.
2.5.1. UART
The common protocols used in this paper are UART, I2C, and SPI, among which only the UART protocol employs an official IP core from Xilinx. The program uses the UART16550, which supports asynchronous communication, meaning that data transmission does not rely on a clock signal. It is a common serial communication interface in computer systems, providing reliable data transfer functionality. Compared to ordinary serial ports, UART16550 typically offers more stable and reliable serial communication.
2.5.2. I2C
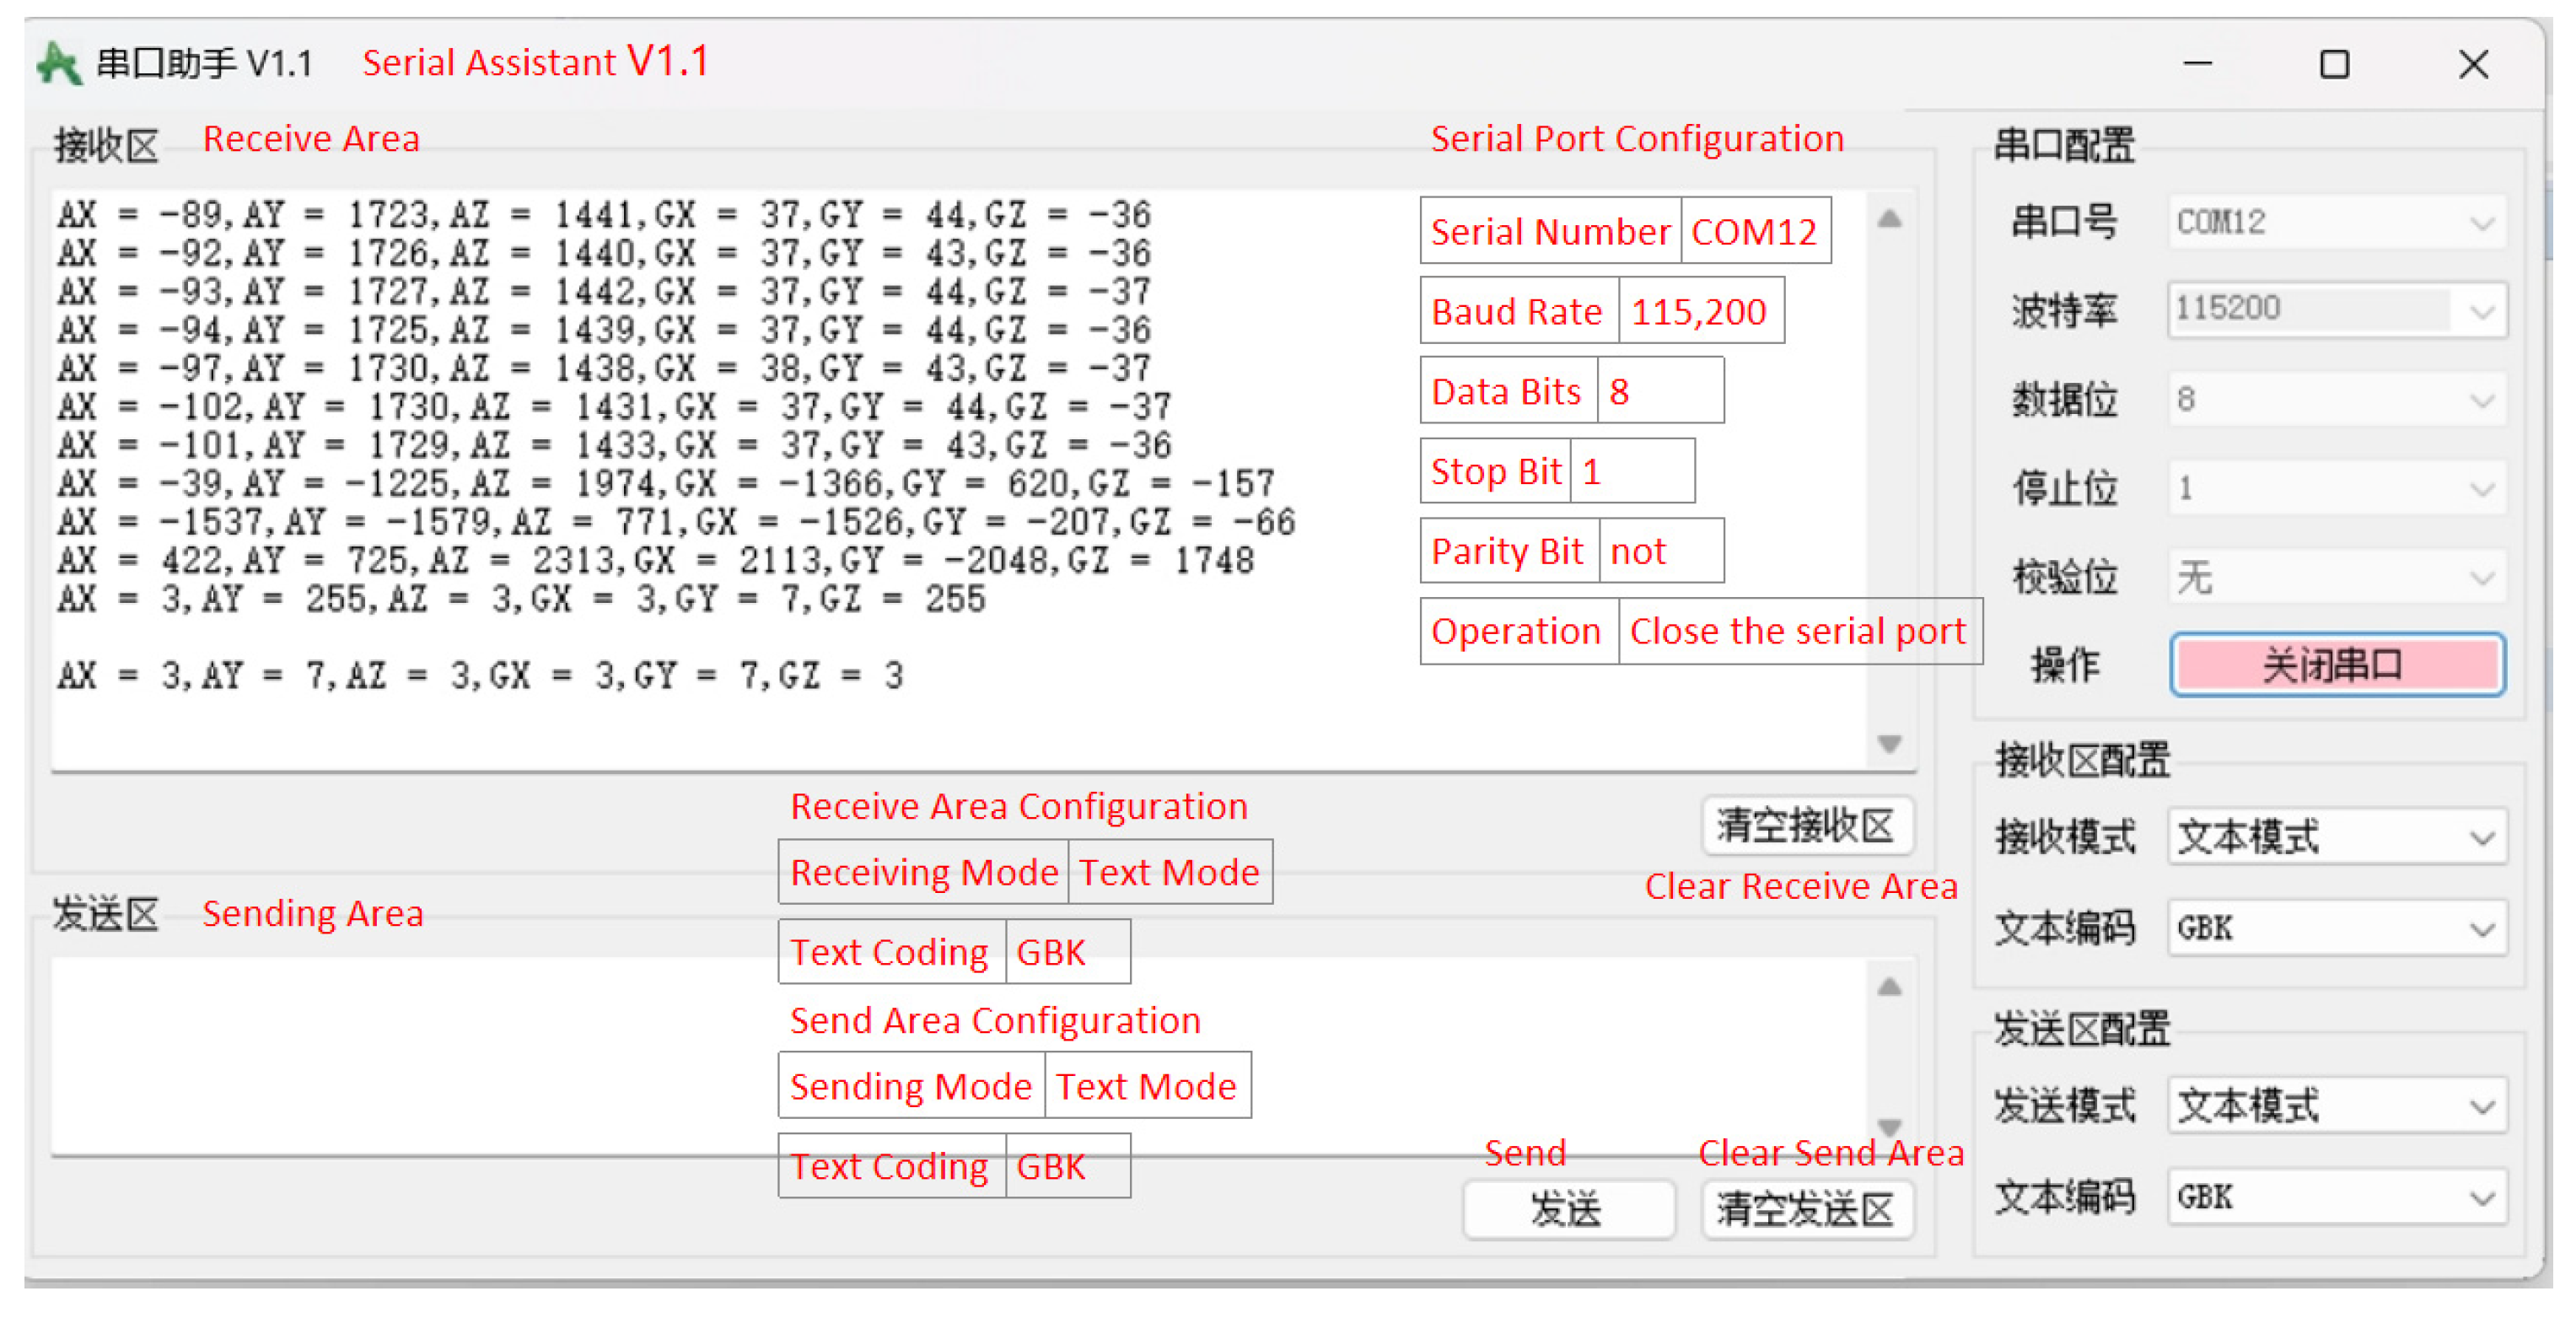
The I2C protocol used in this article does not utilize an official IP core from Xilinx; instead, it employs a method designed to validate the feasibility of simulating the protocol using GPIO. According to the I2C protocol, it is necessary to generate clock pulses on the clock line and read or write data on these clock pulses. Therefore, timing control must be implemented in the code, including generating clock pulses and setting the high and low levels of the data line. Subsequently, this paper utilizes the MPU6050 integrated MEMS (Micro-Electro-Mechanical Systems) inertial measurement unit for testing and also simulates the sensor input device of an inertial navigation system. Figure 4 demonstrates the successful reception of gyroscope and accelerometer data transmitted via the MPU6050.
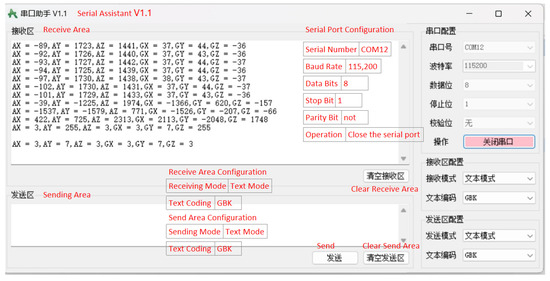
Figure 4.
Using the I2C protocol to connect the MPU6050 sensor to obtain and print data.
Figure 4 shows the window of the Serial Port Assistant. Please refer to the translated English notes for the relevant settings.
2.5.3. SPI
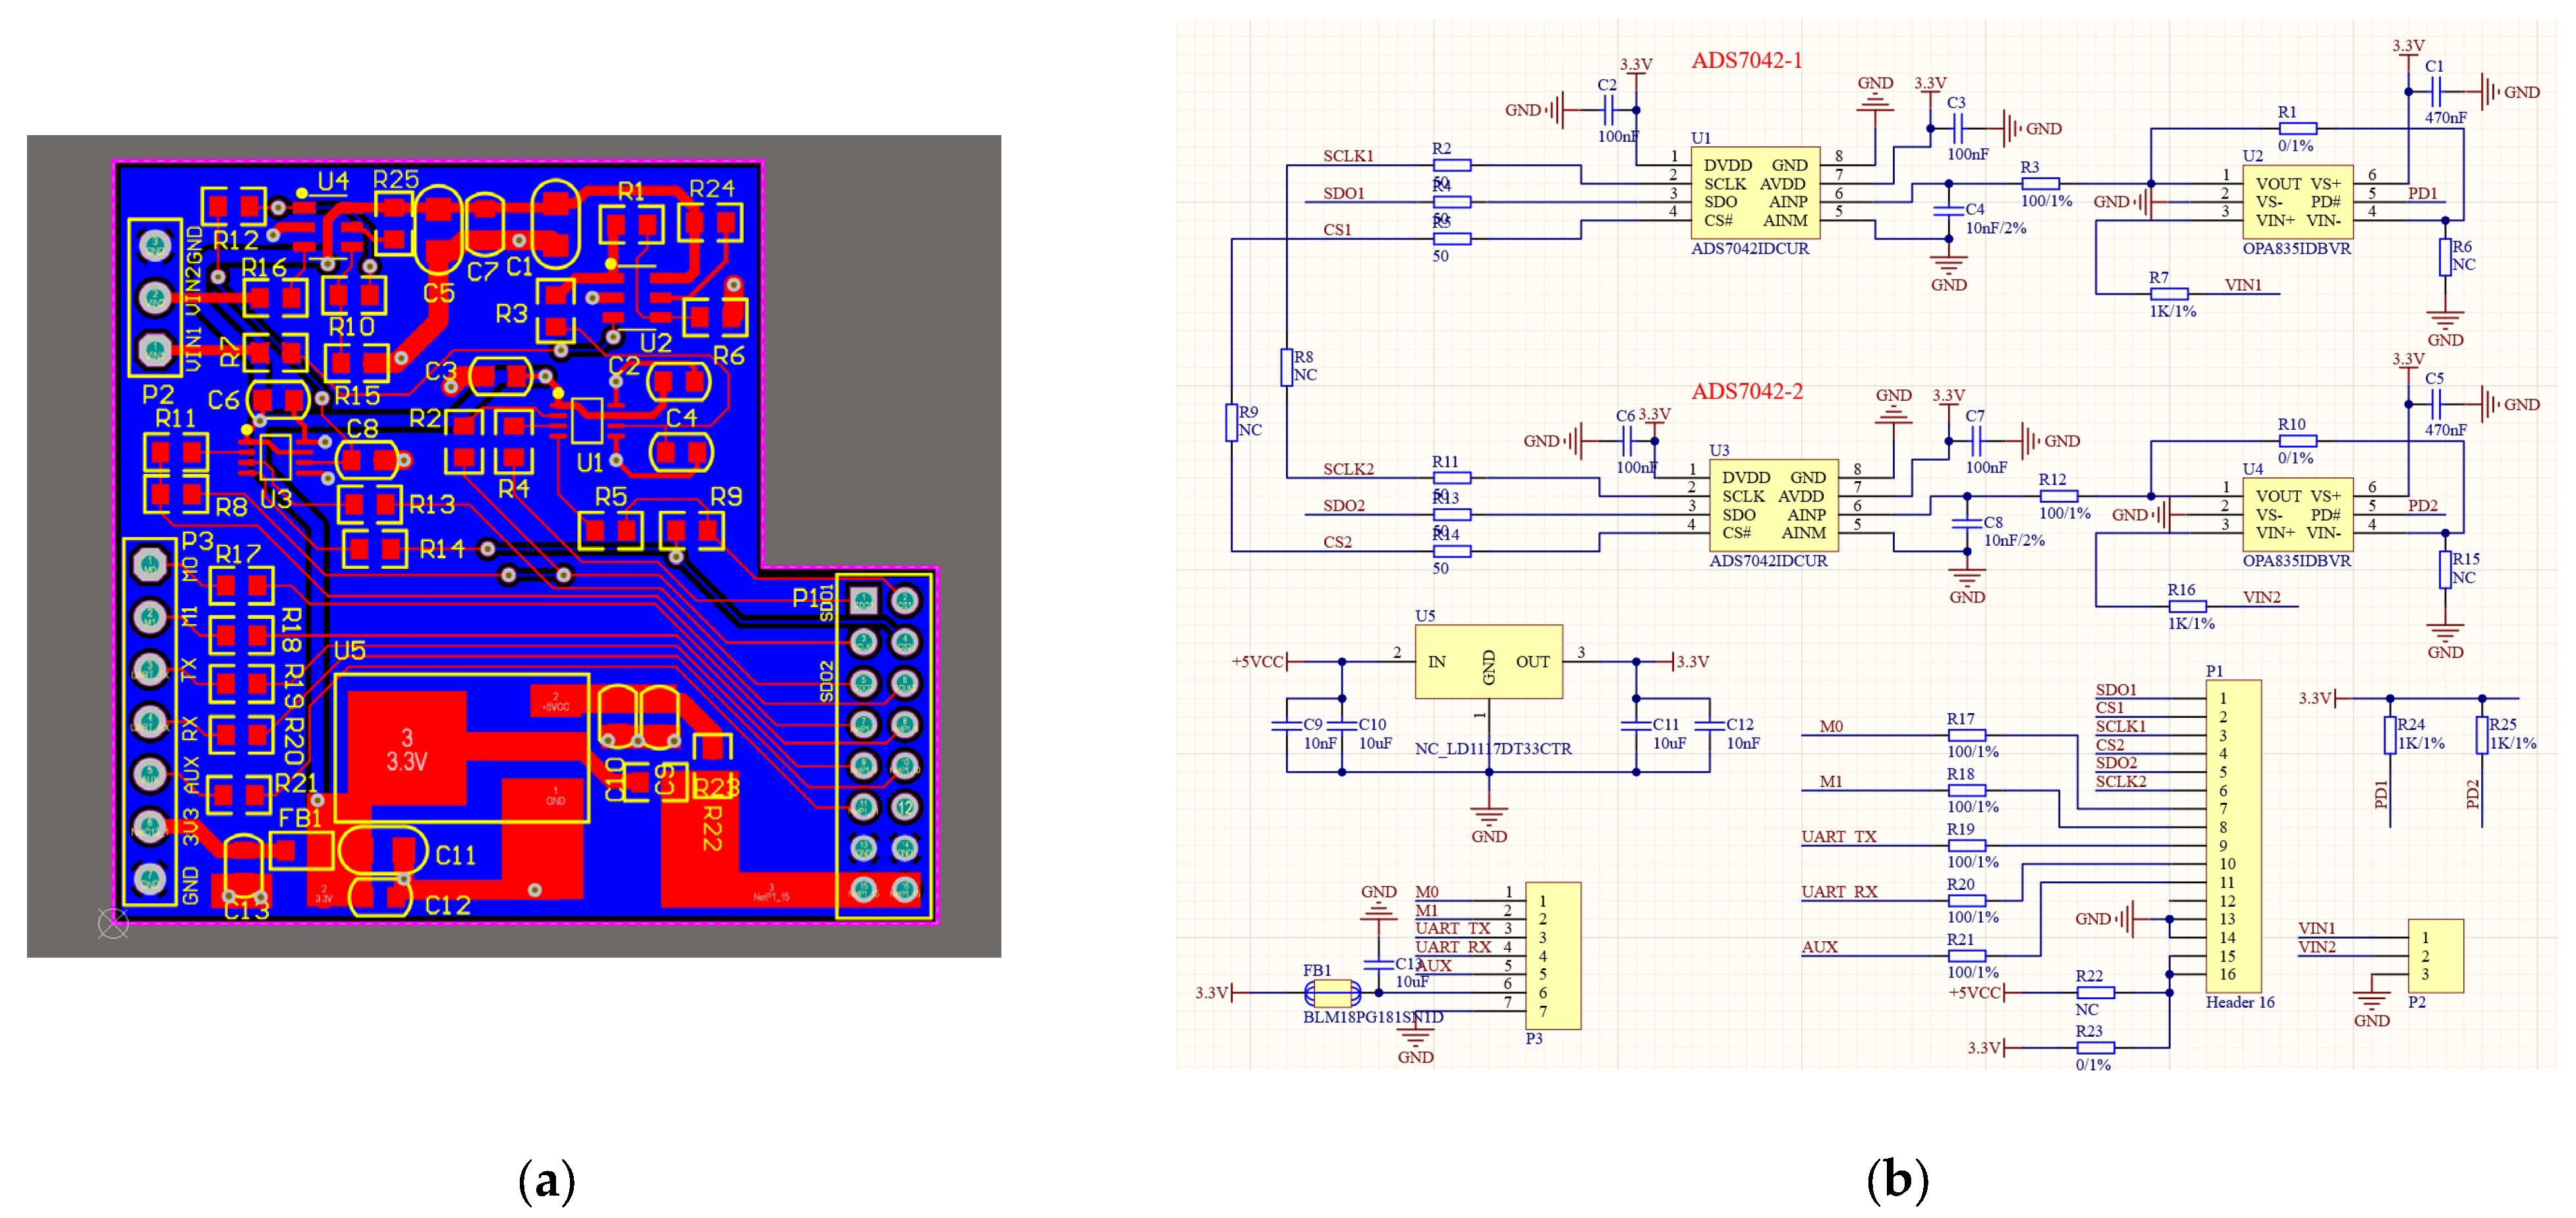
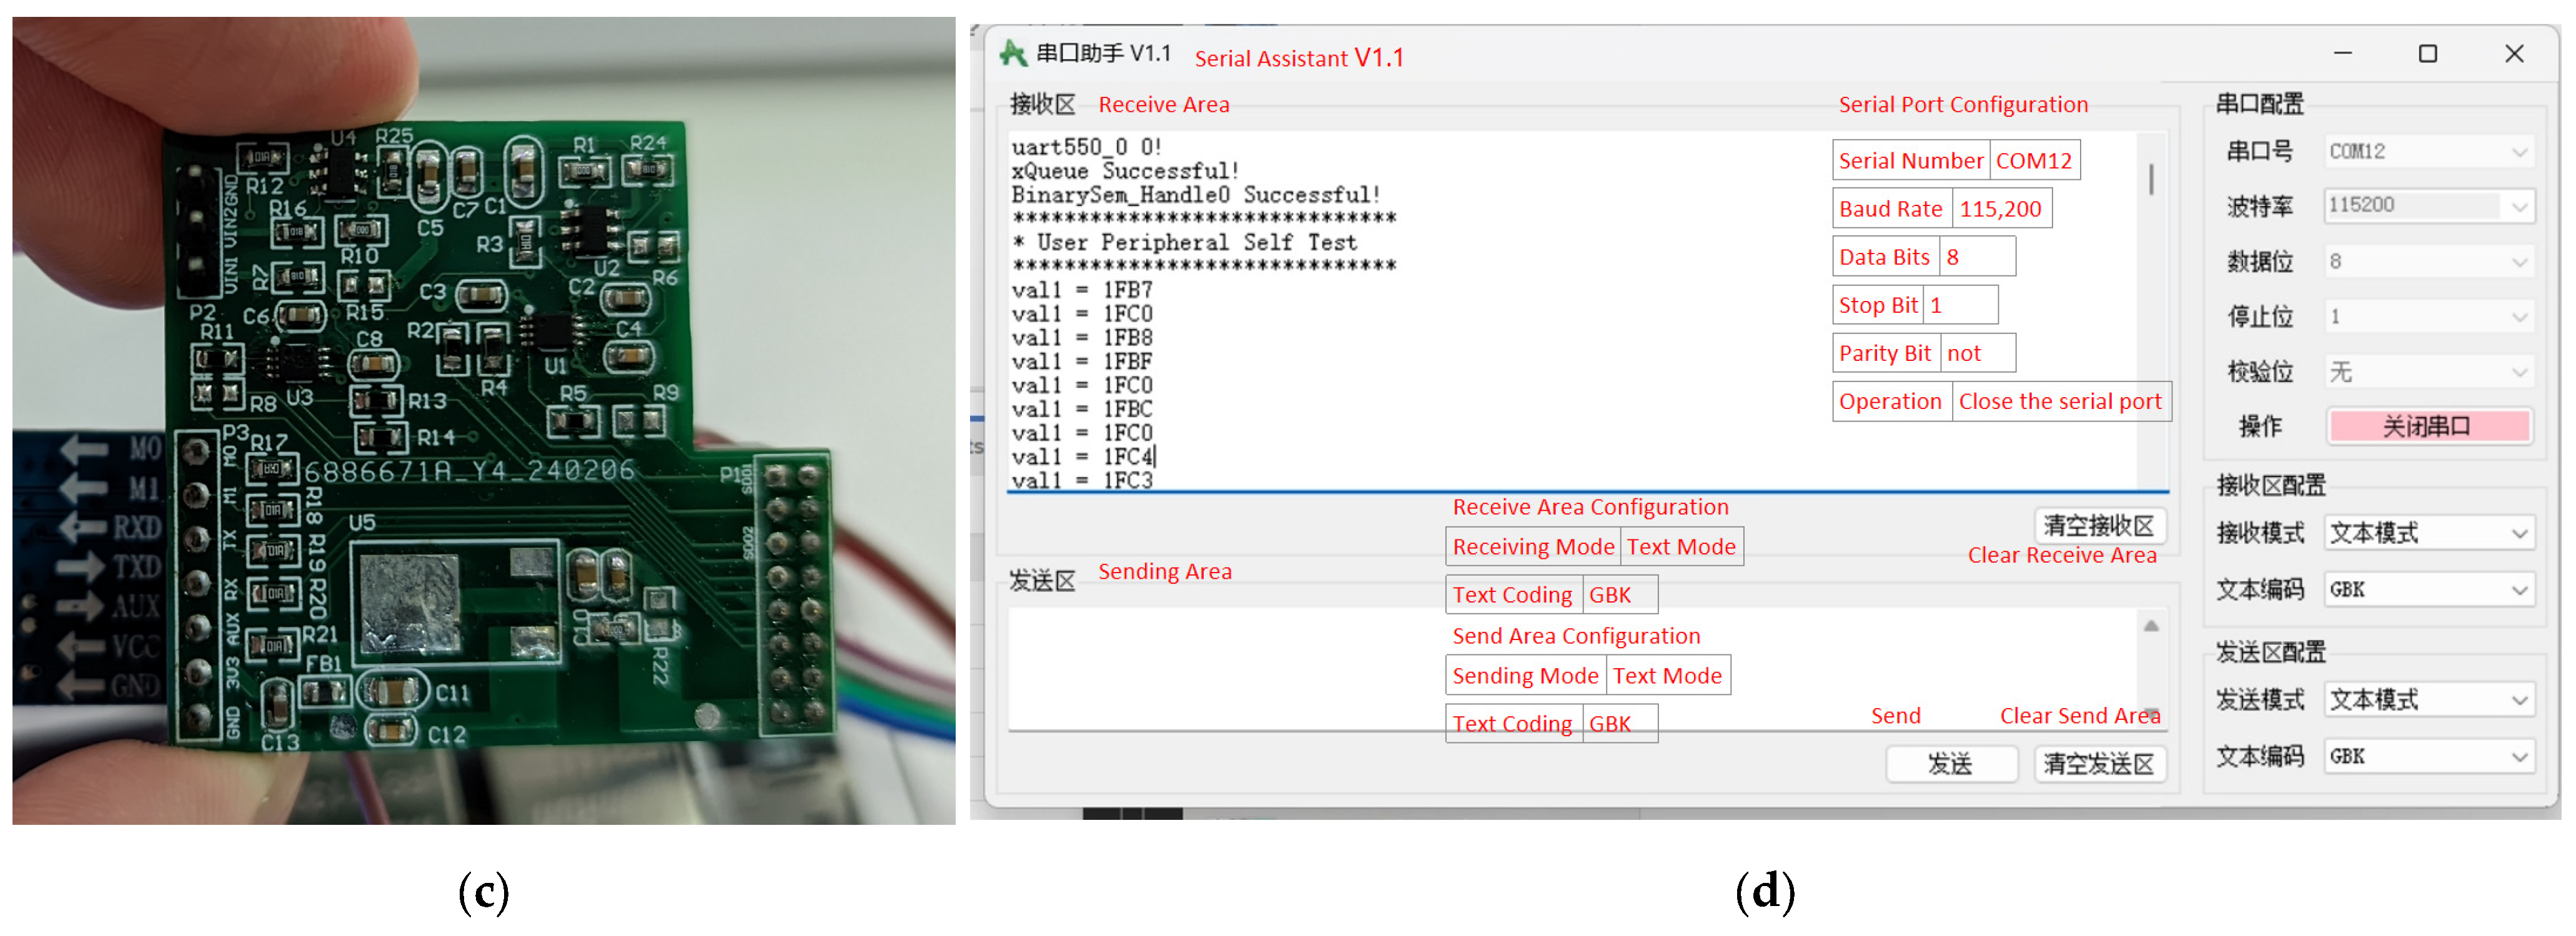
The SPI protocol used in this paper represents the third method for connecting devices, leveraging the combined capabilities of ARM and FPGA in the ZYNQ device. This third protocol is an FPGA-level simulation of the SPI protocol, configuring the FPGA’s GPIO pins to function as needed for the SPI bus, such as SCLK, MISO, MOSI, and CS. It also uses the FPGA’s internal clock module to generate the SCLK clock signal, connecting to the ADS7042 and other sensors that utilize the SPI communication protocol. This program simulated SPI device communication by creating a PCB board, as shown in Figure 5, which includes the PCB layout, schematic, and actual board image. This is intended to demonstrate its scalability. The board incorporates two ADS7042 converters and two OPA835 operational amplifiers, and also integrates a LoRa module for complete communication integration. The image below shows normal reception of sensor-transmitted data at default 0 voltage. The bottom left corner features the circuitry for the LoRa module, the top left corner shows the ADS7042 and OPA835 devices, and the right side displays the interface circuits connecting to ZYNQ. Figure 5d shows the window of the Serial Port Assistant. Please refer to the translated English notes for the relevant settings.

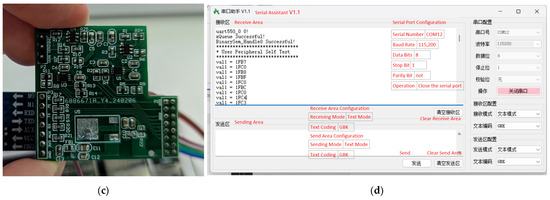
Figure 5.
(a) PCB file. (b) PCB schematic diagram. (c) PCB physical drawing. (d) Using the SPI protocol to connect the ADS7042 transverter to obtain and print data.
2.5.4. Custom Communication Protocol
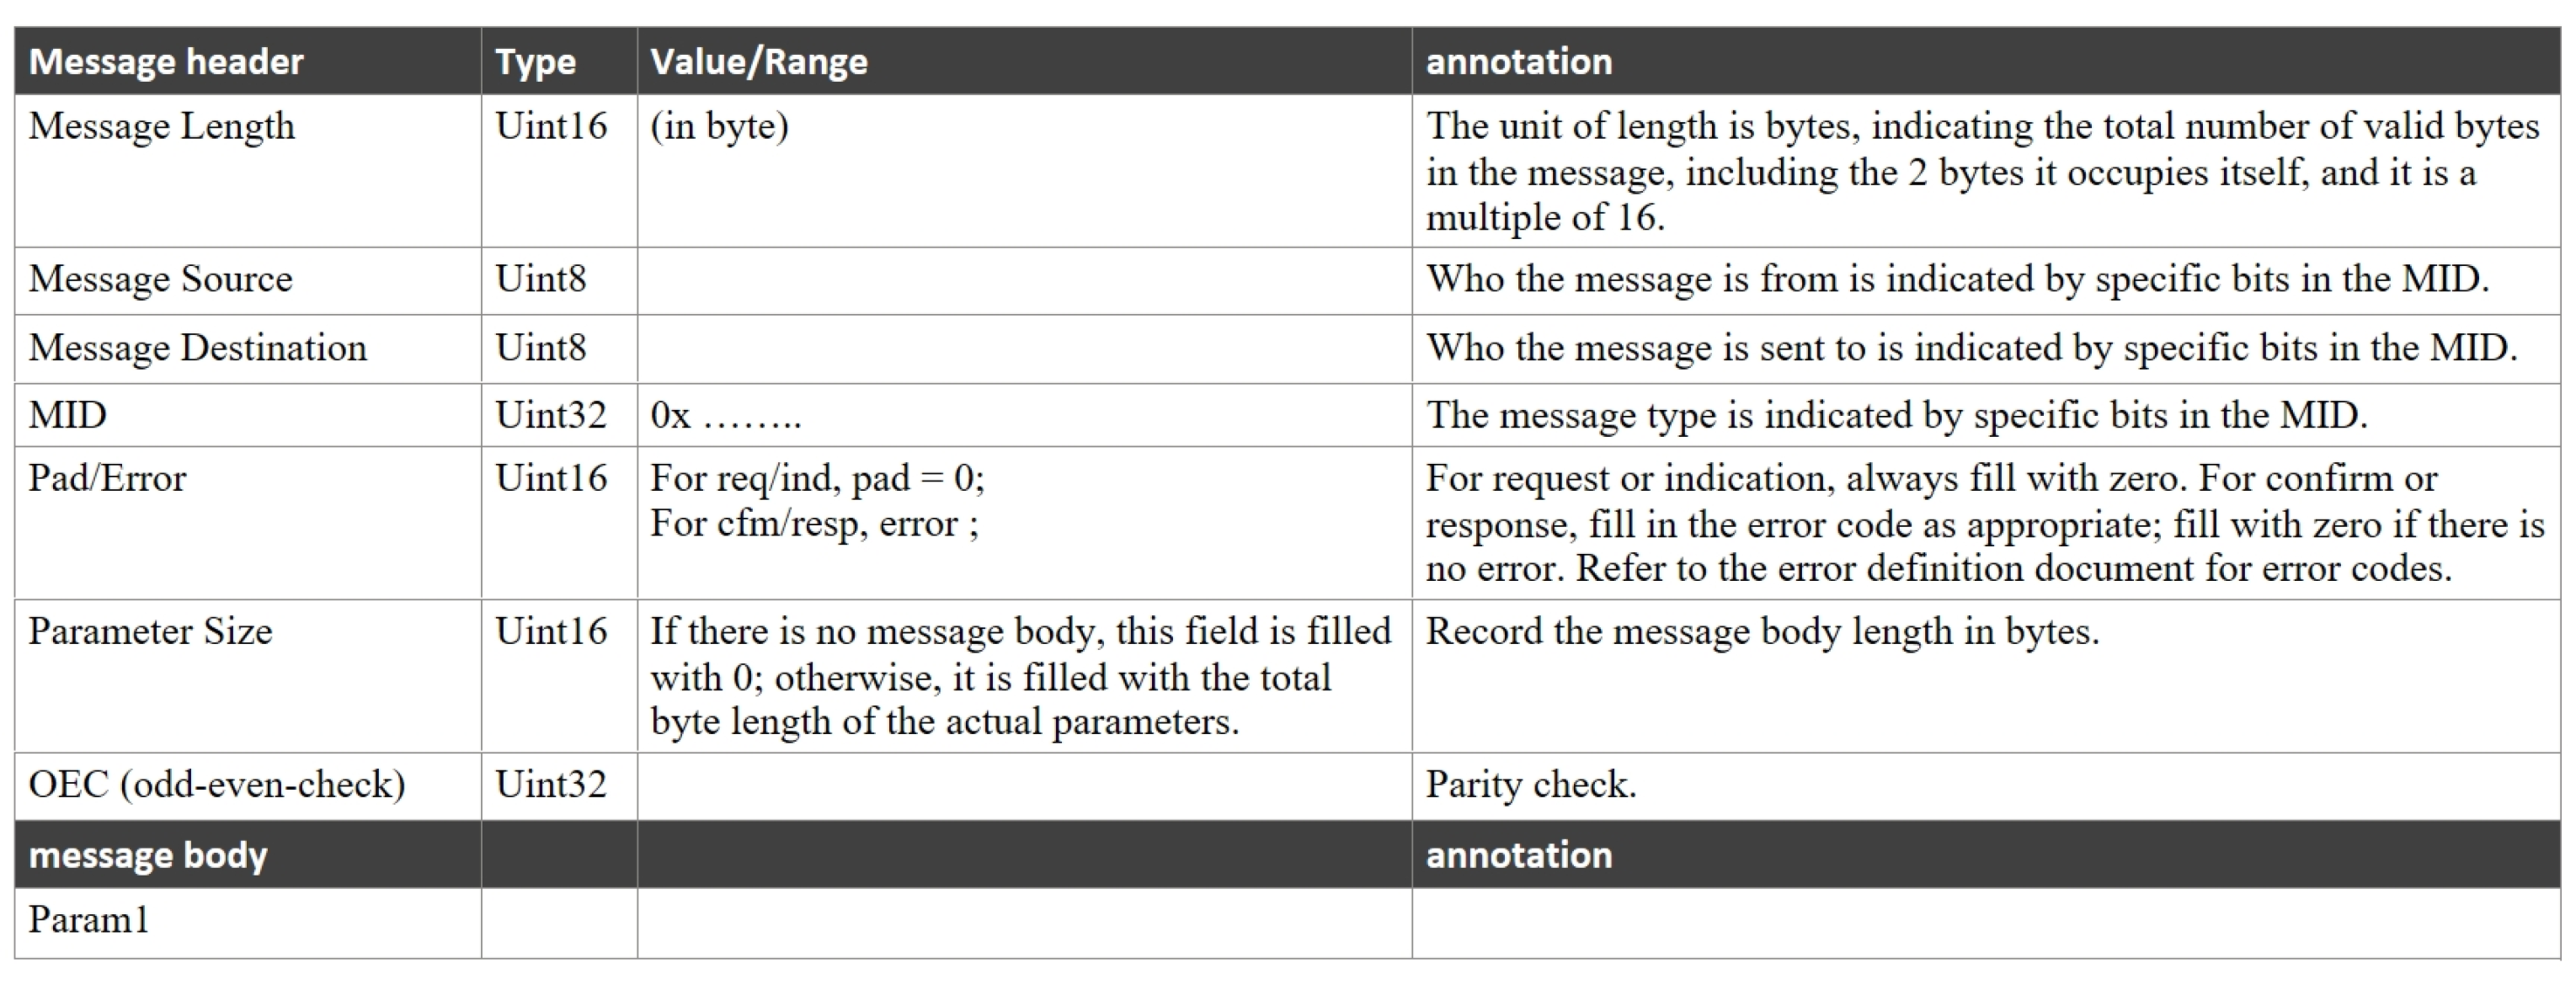
After receiving the data, it is necessary to add a header to define the received data. Since there is no universal protocol for this part, a custom protocol is required to facilitate bidirectional communication of data. The protocol utilized in this program consists of seven parts: a 2-byte message total length, a 1-byte message source, a 1-byte message destination, a 4-byte message ID, a 2-byte flag indicating normal or error message, a 2-byte length of the message body, and a 4-byte parity check, totaling 16 bytes. This structure allows for indicating the source and destination of the message, combined with the checksum and message length to effectively prevent message loss during transmission, thereby meeting the requirements of different application scenarios. Additionally, there is a maximum data quantity limit for the message body, serving as an effective buffer for data transmission to prevent interruptions due to insufficient bandwidth.
The message body is also annotated for different devices, using JSON format. JSON (JavaScript Object Notation) is a lightweight data interchange format with two basic structures: object and array/collection. Object format is represented by curly braces {}, for example: {“key1”: “value1”, “key2”: “value2”}. In this program, “key1” represents “t” for type, and “key2” represents “c” for content.
Figure 6 shows the format of the received message.
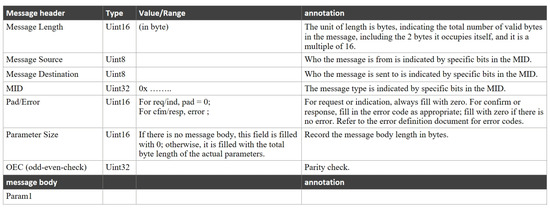
Figure 6.
Message format.
3. Results
3.1. Data Processing on the PS Terminal in ZYNQ
The data required for convolutional neural networks (CNNs) need to be processed. The data for this study were generated using booster diesel engine simulation software. The model was provided by the Research Group of Marine Engineering Automation and Intelligence at Dalian Maritime University, and the diagnostic data are sourced from publicly available data [22]. The diagnostic target is the Wärtsilä 9L34DF dual-fuel medium-speed turbocharged engine installed on natural gas transport ships. Table 1 presents the main technical parameters of the Wärtsilä 9L34DF diesel engine. This model is based on the AVL-Boost simulation model of the 9L34DF diesel engine and is calibrated for four operating conditions: 25%, 50%, 75%, and 100%. While ensuring the simulation accuracy of fault simulation, the simulation model’s parameters were adjusted by analyzing the fault mechanism to simulate faults.

Table 1.
Characteristic parameter list.
The parameters listed in Table 2 below cannot currently be obtained in real-time with the existing equipment. Therefore, we use simulation software to generate the data, which are then stored in corresponding arrays. The data are transferred to the PL side through a data collection program. In practical applications, we substitute the data collected from sensors with the data obtained from the simulation software, thereby continuing to implement the process described in the paper.
Table 2.
Characteristic parameter list.
Table 2 lists the required parameters.
3.1.1. Fault Type That Can Be Detected
The faults detectable using this program include fuel injection timing advance, fuel injection timing retardation, decreased efficiency of the turbocharger (turbocharger impeller carbon deposit), decreased efficiency of the intercooler (intercooler pipe blockage), as well as normal operation. Therefore, the program assigns the following results: normal operation is denoted as 0, fuel injection timing advance as 1, fuel injection timing retardation as 2, decreased efficiency of the intercooler (intercooler pipe blockage) as 3, and decreased efficiency of the turbocharger (turbocharger impeller carbon deposit) as 4, totaling five types of fault results.
Advance fuel injection may cause premature ignition, incomplete combustion, increased emissions, decreased fuel efficiency, and may lead to diesel engine knocking, potentially resulting in piston damage and engine shutdown when severe. Similarly, the retardation of fuel injection is also unfavorable as it leads to incomplete combustion, lower fuel efficiency, increased smoke emissions, and environmental pollution.
Decreased turbocharger efficiency leads to reduced engine power, lower fuel economy, and may cause engine overheating, resulting in more severe damage to the diesel engine.
Decreased intercooler efficiency leads to insufficient engine cooling and engine overheating which in turn leads to decreased engine performance, and may even cause cylinder detonation when such problems occur.
3.1.2. PS Terminal Data Collection Program
According to the communication protocol mentioned above, corresponding IP cores were established on the Block Design interface. Among them, AXI_GPIO emulates the I2C protocol using GPIO, the UART is implemented using the official Uart16550 IP core, and the SPI section utilizes the AXI_SPI IP core written in VHDL language. Following the testing mentioned earlier, we confirm that data acquisition is achievable. It only requires connecting sensors with the aforementioned parameters to the PS port of ZYNQ. Through experimentation, it has been determined that ZYNQ can support up to 32 connected devices; refer to the Block Design schematic in Figure 7.
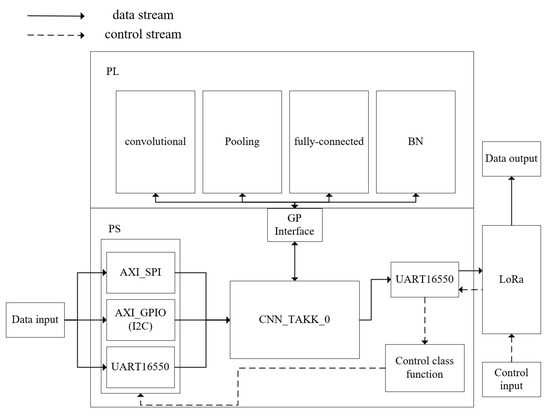
Figure 7.
Block design schematic.
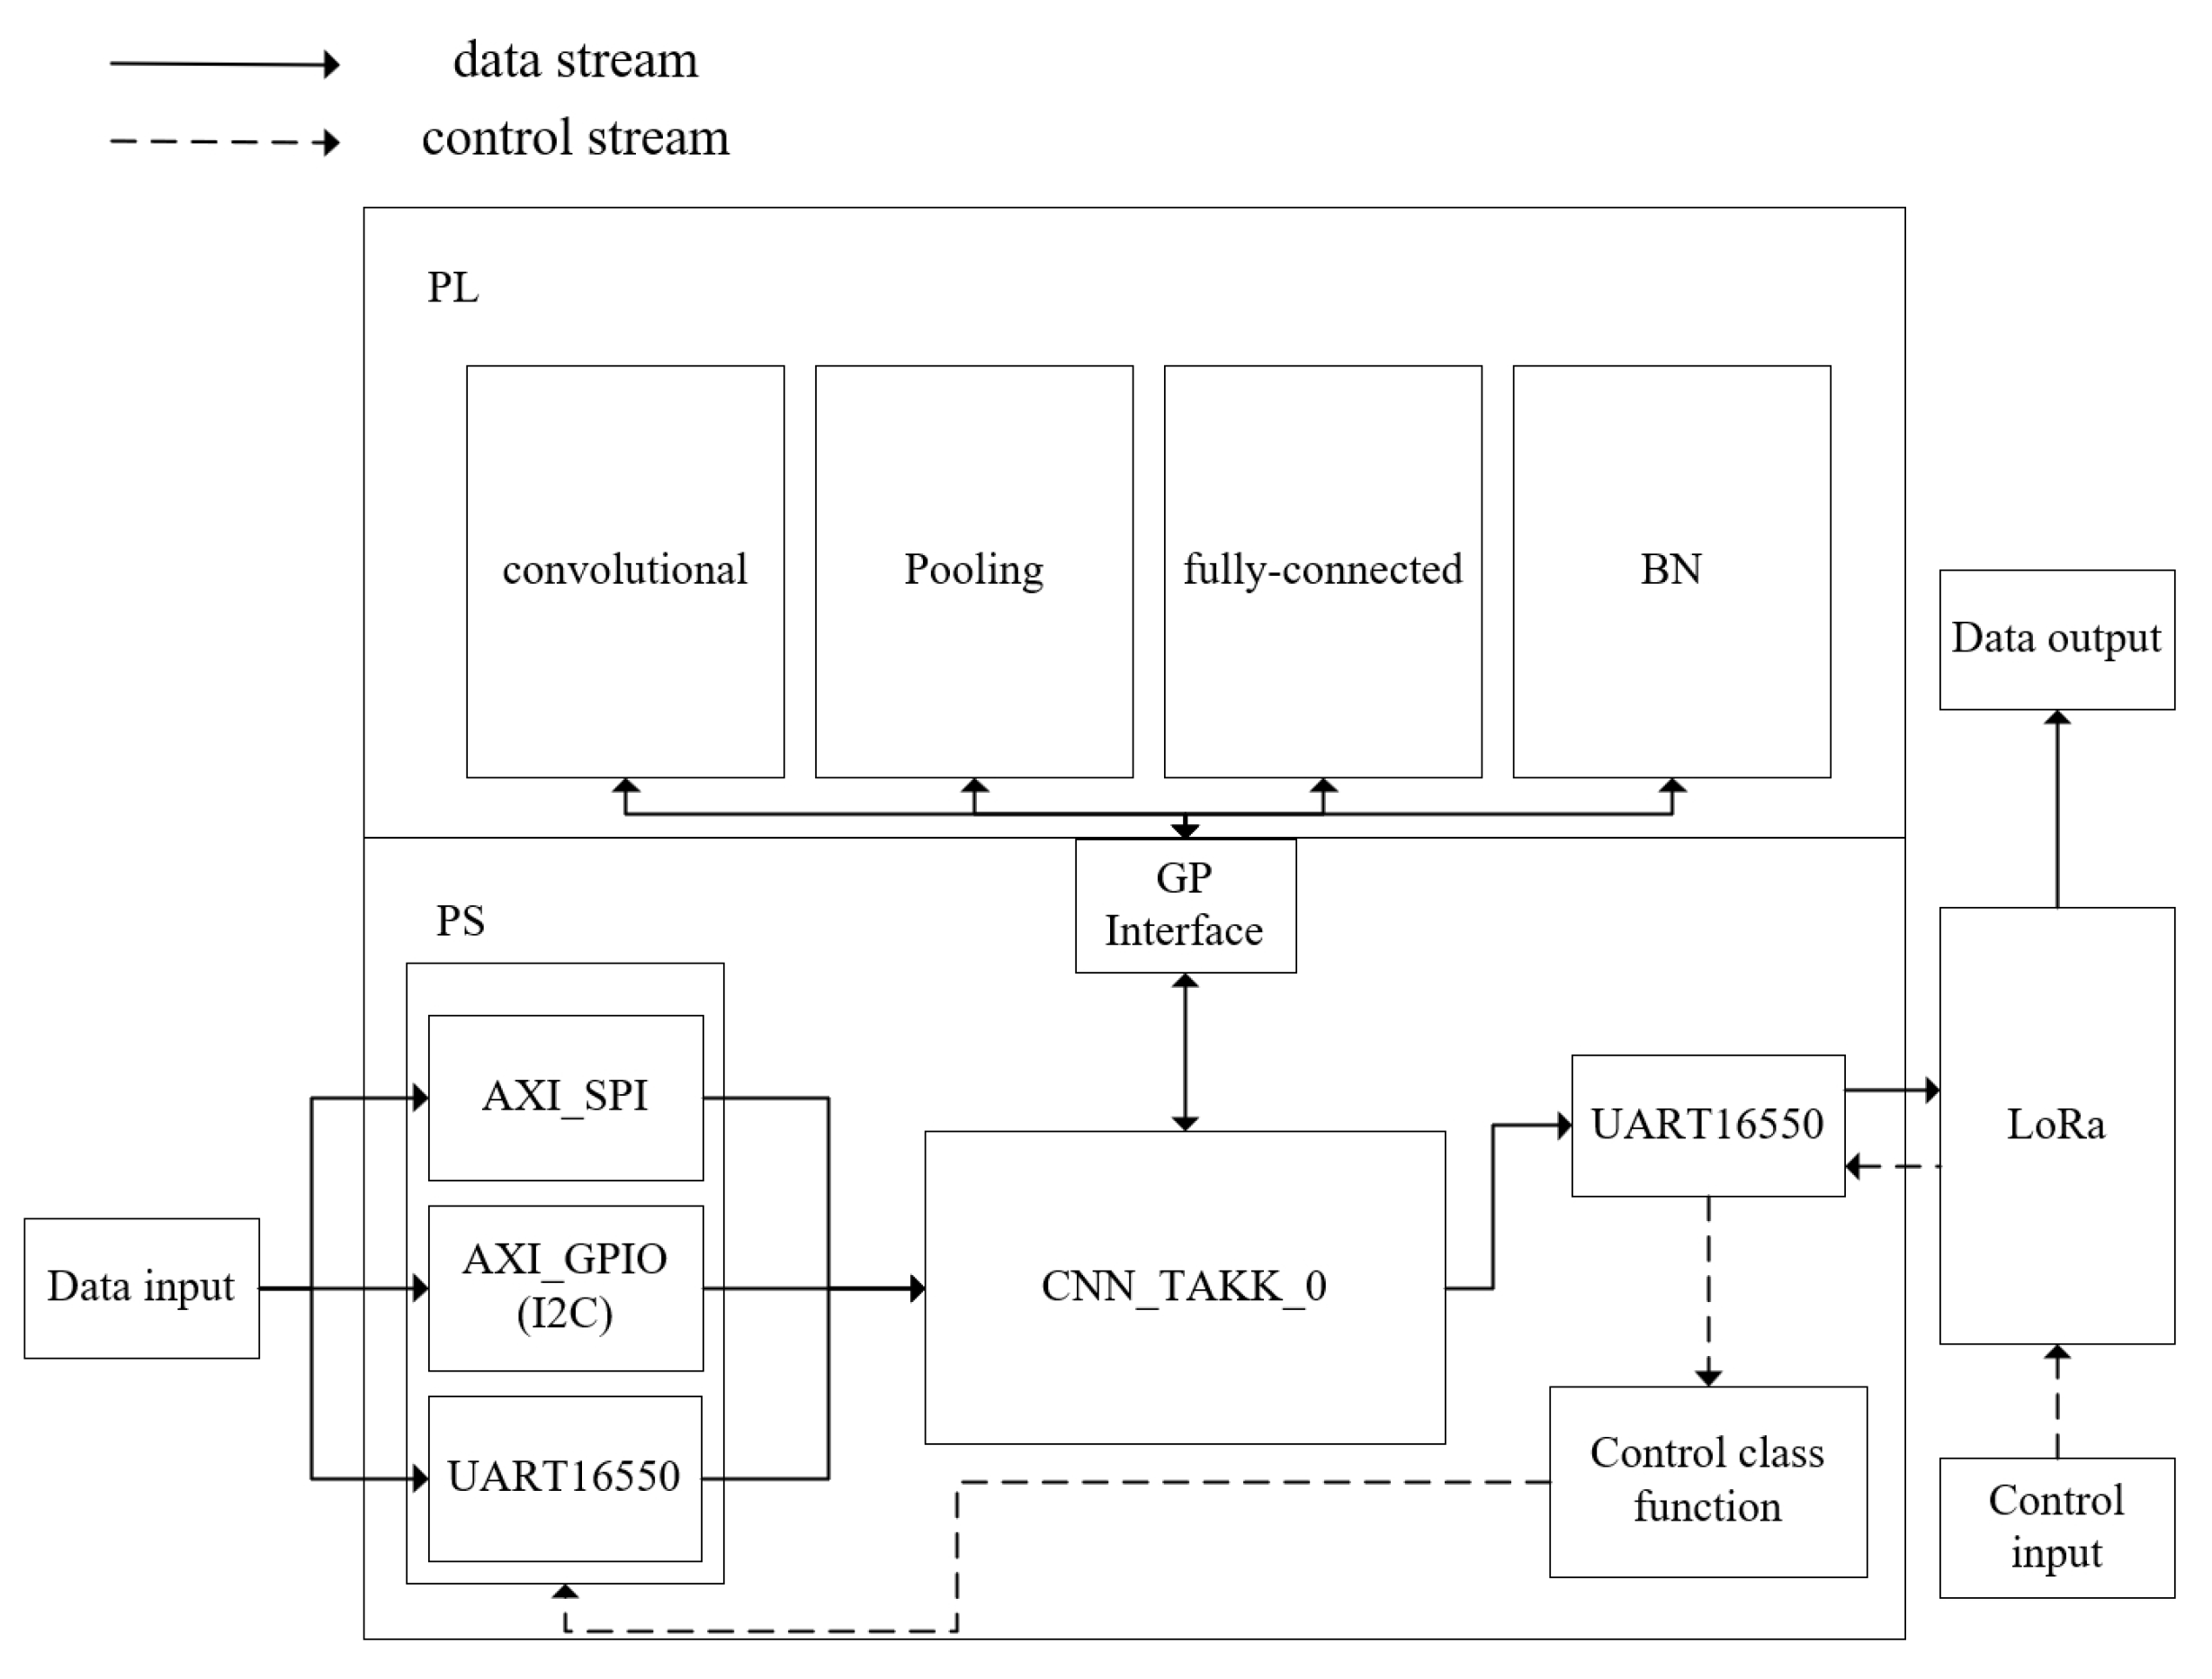
When the upper computer sends a start command, the LoRa module will receive the command through the RX pin of the UART16550. The command will be parsed using the command parsing function on the PS side, which will start the designated module. When the sensor detects data, it will enter the corresponding IP core module according to the communication protocol. After data processing using the PS side function, the data will be sent to the CNN IP module. The IP module will interact with the four convolution modules on the PL side via the AXI bus of the GP interface. After the CNN IP module completes the calculation, the result will be sent to the LoRa module through the TX pin of the UART16550, thereby completing one data processing cycle. This process repeats, allowing for real-time computing functionality.
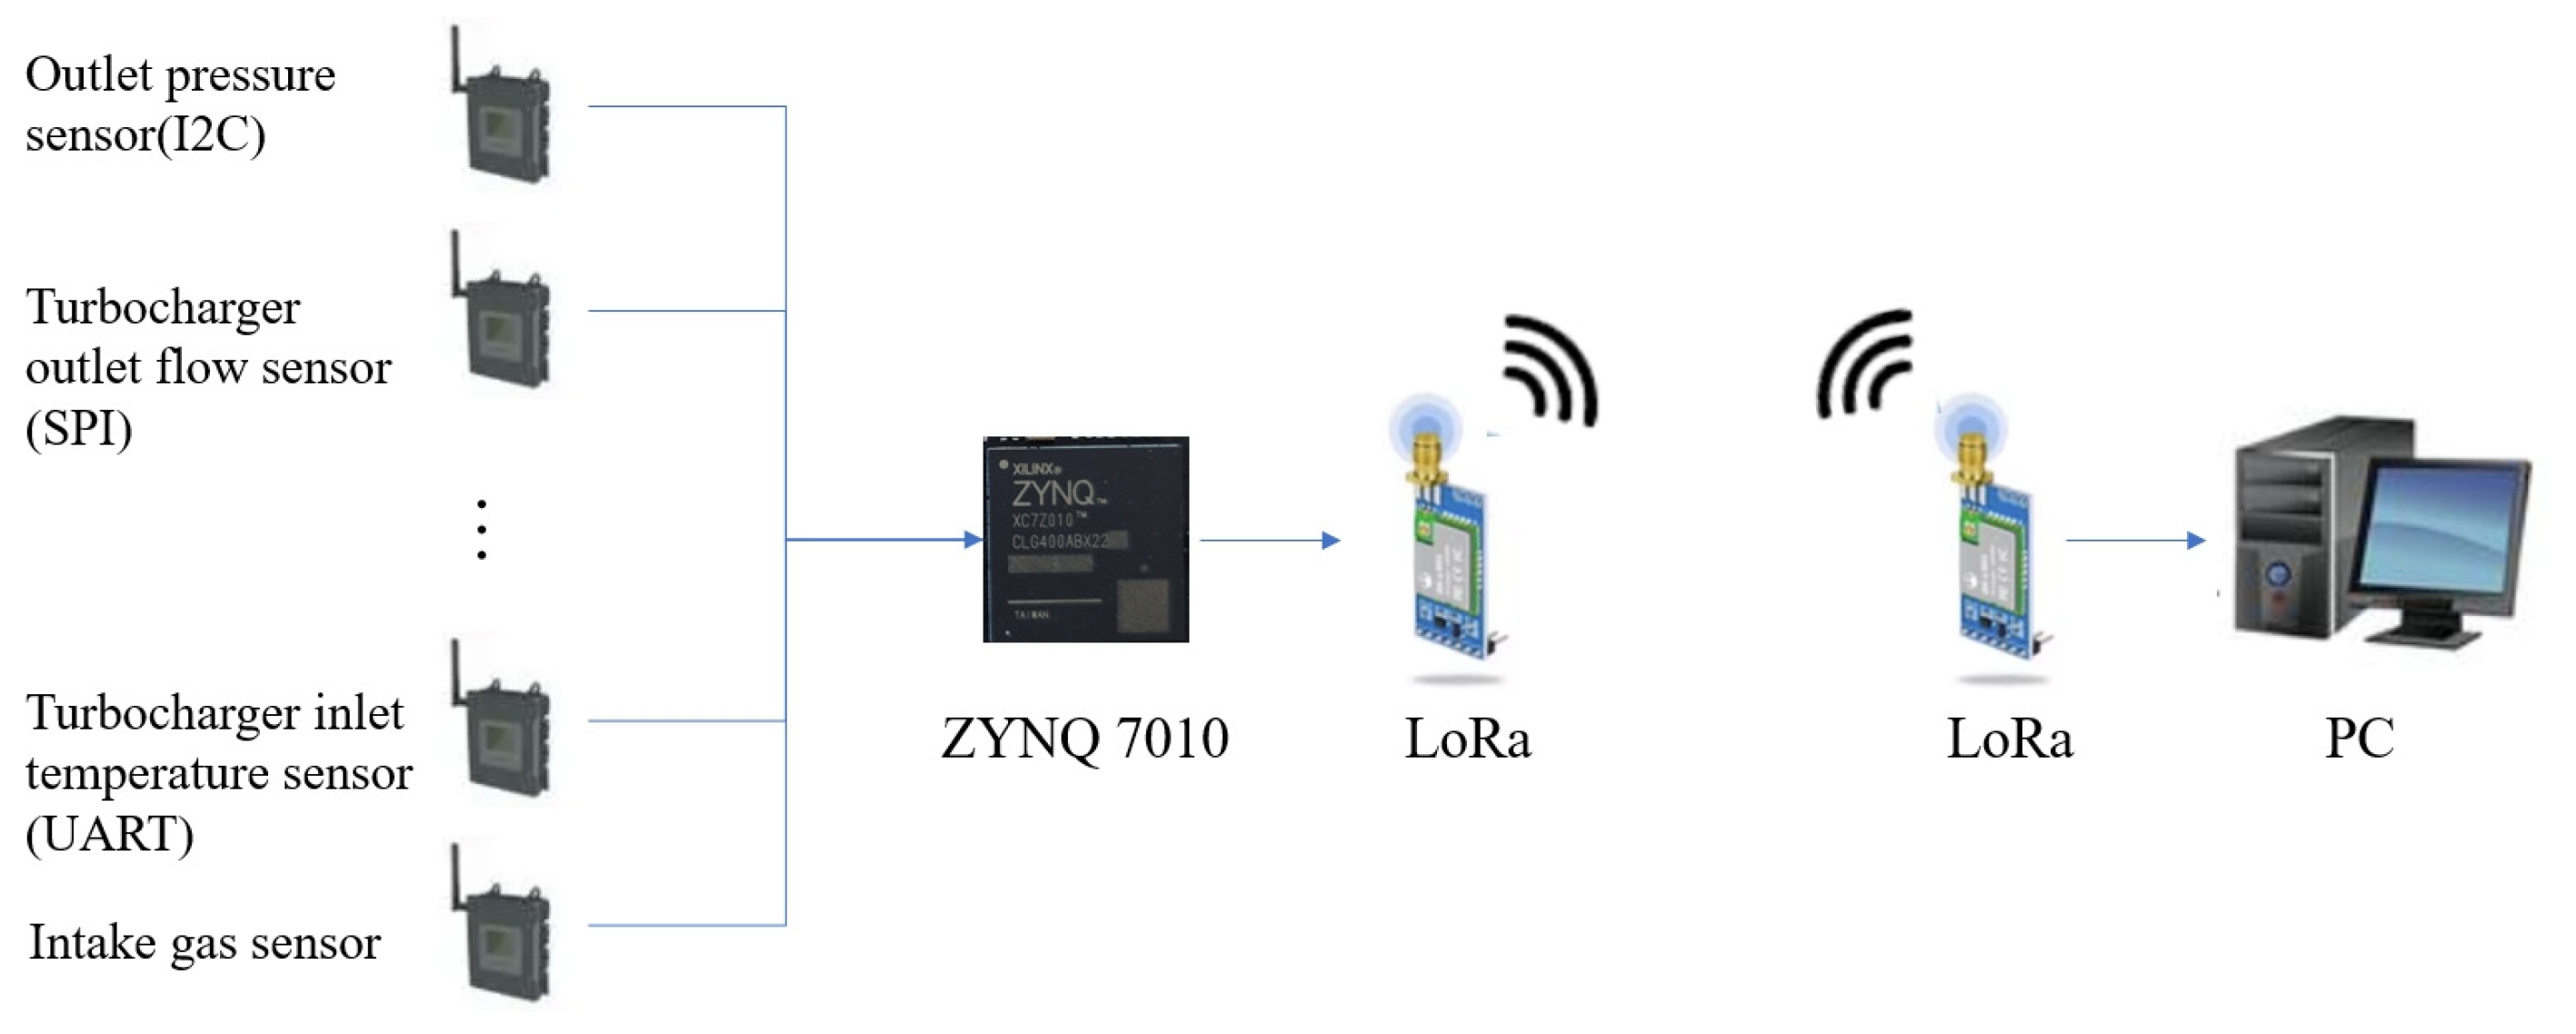
The actual implementation effect can be referred to in the topology diagram in Figure 8. Since it supports SPI, I2C, and UART communication protocols, compatible sensors can be connected to the ZYNQ7010. After data processing, messages are sent via the LoRa module. The LoRa module on the PC side receives the messages and displays the results on a PC application, achieving data visualization.
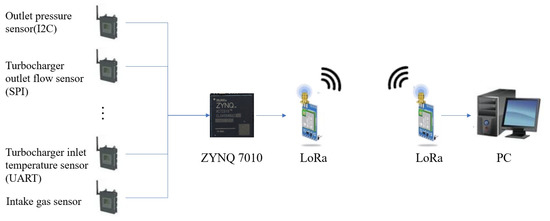
Figure 8.
Hardware implementation topology.
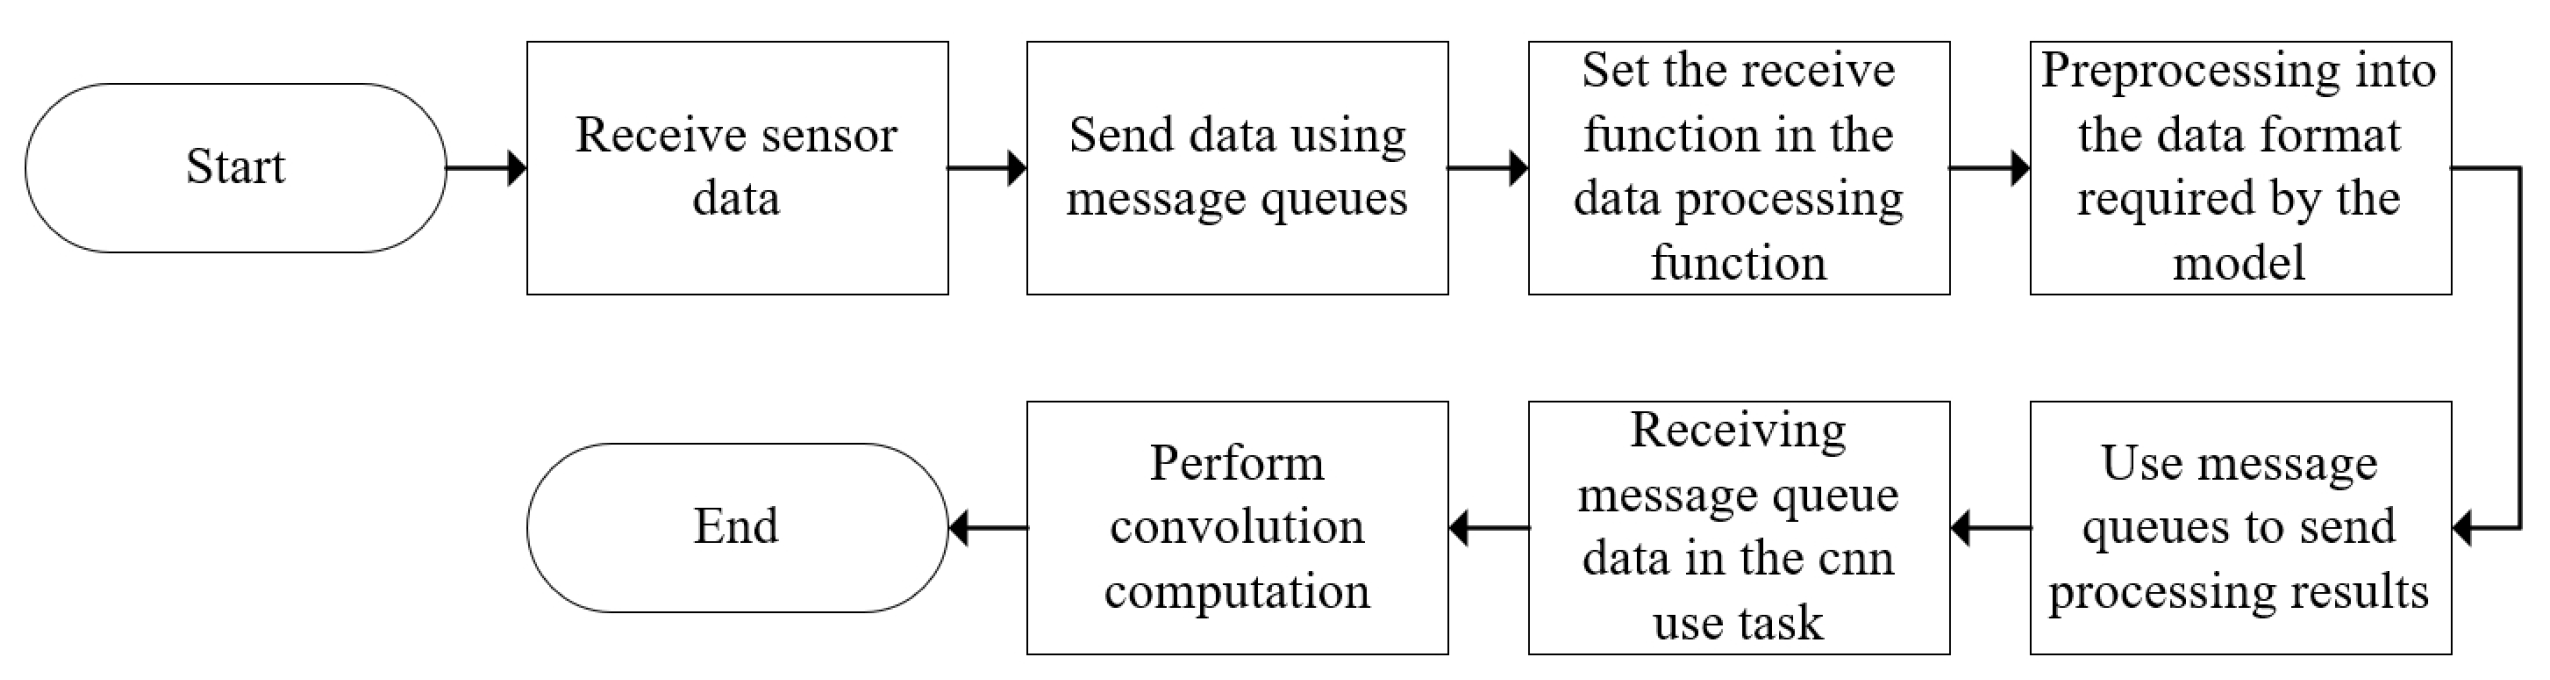
The data received from the sensors are processed on the PS side of ZYNQ. Data processing is conducted using C language within the “static void data processing(void *pvParameters)” task of the FreeRTOS operating system. When data are received from other sensors, such as MPU6050, after a certain amount of data accumulation, the FreeRTOS message queue’s sending function is utilized. Simultaneously, within the data processing function, the message queue’s data receiving functionality is set up. Upon receiving the data, the data undergo processing, and subsequently, using the message queue functionality, the processed data are sent to the “static void cnn_use(void *pvParameters)” task for convolutional calculations; refer to the flow chart in Figure 9.

Figure 9.
Data processing flowchart.
3.2. Convolutional Neural Network in the PL of ZYNQ
In addition to having an ARM compiler on the processing end, Vivado software also features HLS (High-Level Synthesis), a technology used to convert high-level languages (such as C/C++) code into hardware description languages (such as Verilog or VHDL). We programmed convolutional layers, pooling layers, activation functions, and fully connected layers in the HLS software. Since we utilized the ZYNQ7010, which is a relatively basic chip in the series, it is not feasible to place all the training on the PL side. However, we adopted a modular approach by placing the four layers of convolution as general layers on the PL side, and then called them through the PS side to achieve convolutional neural network computations. Although this approach consumes computational time, it alleviates hardware limitations.
3.2.1. Data Processing and Model Building
We simulated a dataset consisting of 2200 data points to identify five types of fault states. The data were converted into a three-dimensional matrix of size (11 × 23 × 200) and then input into the convolutional neural network (CNN) model. The model was trained using 70% randomly selected data as the training set and 30% as the validation set.
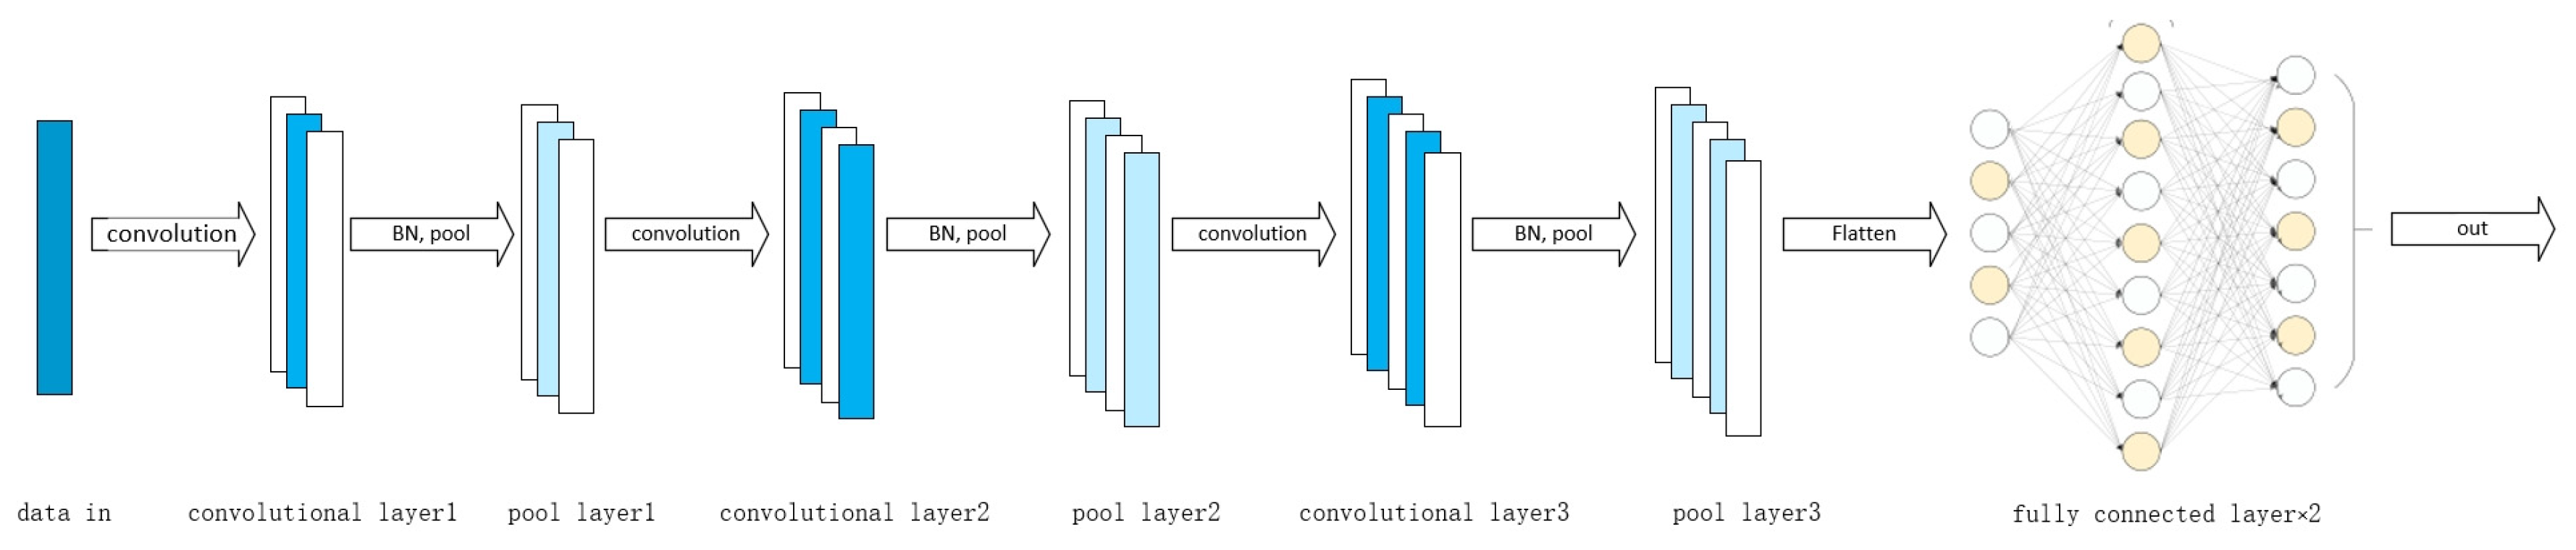
In this program, we employed three convolutional layers, each followed by normalization, activation, and pooling operations. The three convolutional layers used 16, 32, and 64 filters of size 22, respectively. The choice of filter size affects computational complexity, and using 22 filters instead of 3 × 3 helps simplify computations, thus reducing hardware stress. Batch normalization, a technique to accelerate neural network training and improve performance, was utilized to address gradient vanishing or exploding issues and also acts as a regularization method, reducing model complexity and enhancing generalization ability.
After the convolutional layers, the data flow into fully connected layers. The first fully connected layer in this program consists of 50 neurons with ReLU activation function, and the final layer comprises one neuron to produce the ultimate result.
The diagram in Figure 10 illustrates the convolutional neural network model employed in this program.
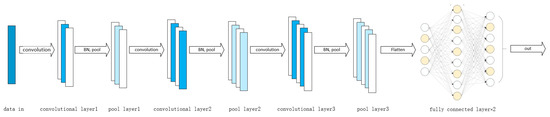
Figure 10.
Convolutional neural network model.
3.2.2. Comparison of Optimization Algorithms
There are three mainstream optimization algorithms for CNNs: SGD, Adam, and RMSprop. The principles of these three optimization methods have been introduced earlier. For this comparison, we will use the parameters listed in Table 3 below.
Table 3.
Optimization algorithm coefficients.
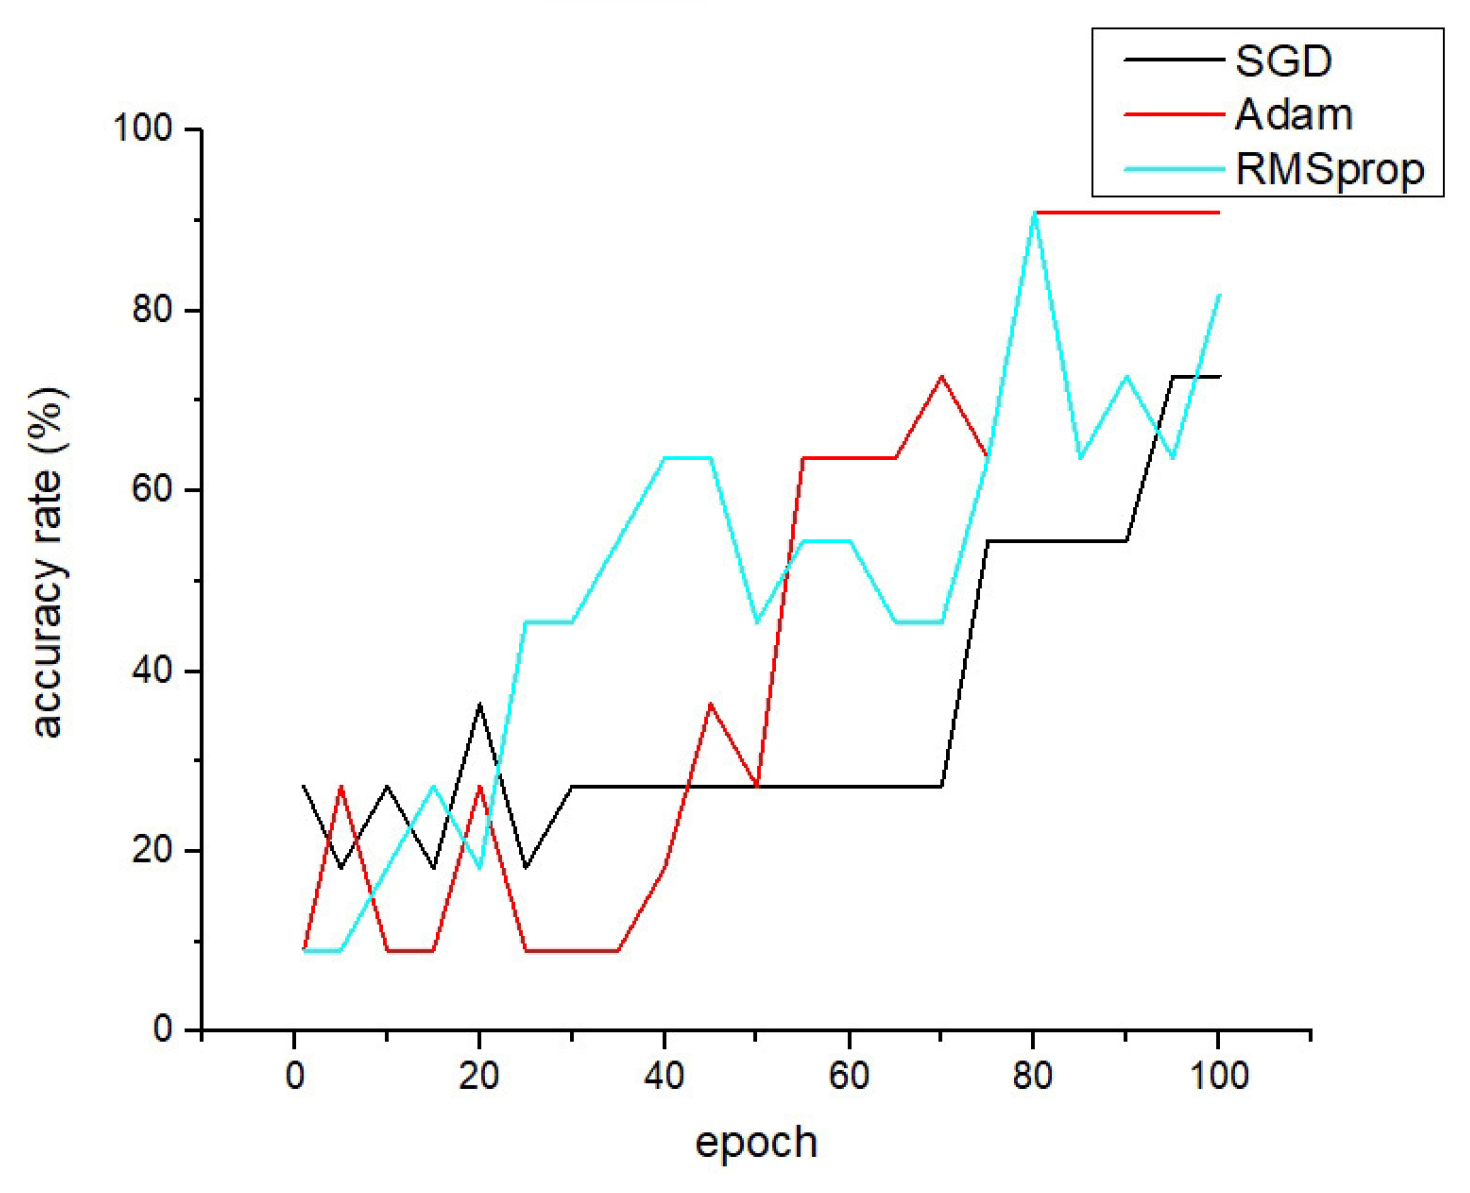
After training separately, we used the same convolutional model, as described in this paper, to generate the line chart of training accuracy changes as shown in Figure 11:
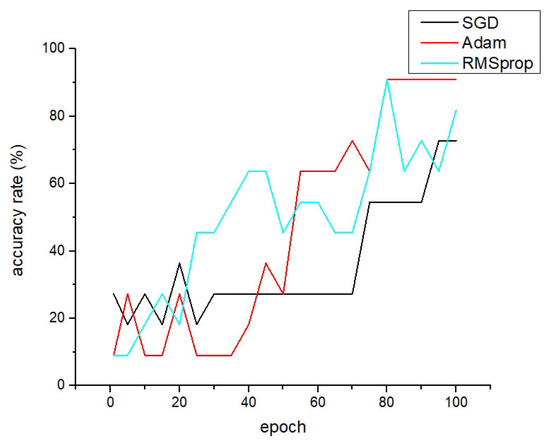
Figure 11.
Change curve of training accuracy under different parameter optimization algorithms.
We can observe significant fluctuations in the three optimization algorithms. The Adam optimization algorithm achieves 90.01% accuracy after 80 epochs, but it converges slower in the early stages of training. On the other hand, the SGD optimization algorithm only reaches 72.73% accuracy in the end. The RMSprop optimization algorithm achieves a final accuracy of 81.82%, with the fastest convergence speed. Considering all factors, we chose Adam as our optimization algorithm and will implement its principles using C language in HLS for algorithm optimization.
3.2.3. The Approach to HLS Programming
The above operations yield parameters such as filter weights and thresholds. We can send these parameters to the ZYNQ via commands from the host computer. The ZYNQ’s PS interprets the commands and inputs the filter parameters into the convolutional neural network model on the ZYNQ. Subsequently, convolutional operations and other operations will be performed in the PL.
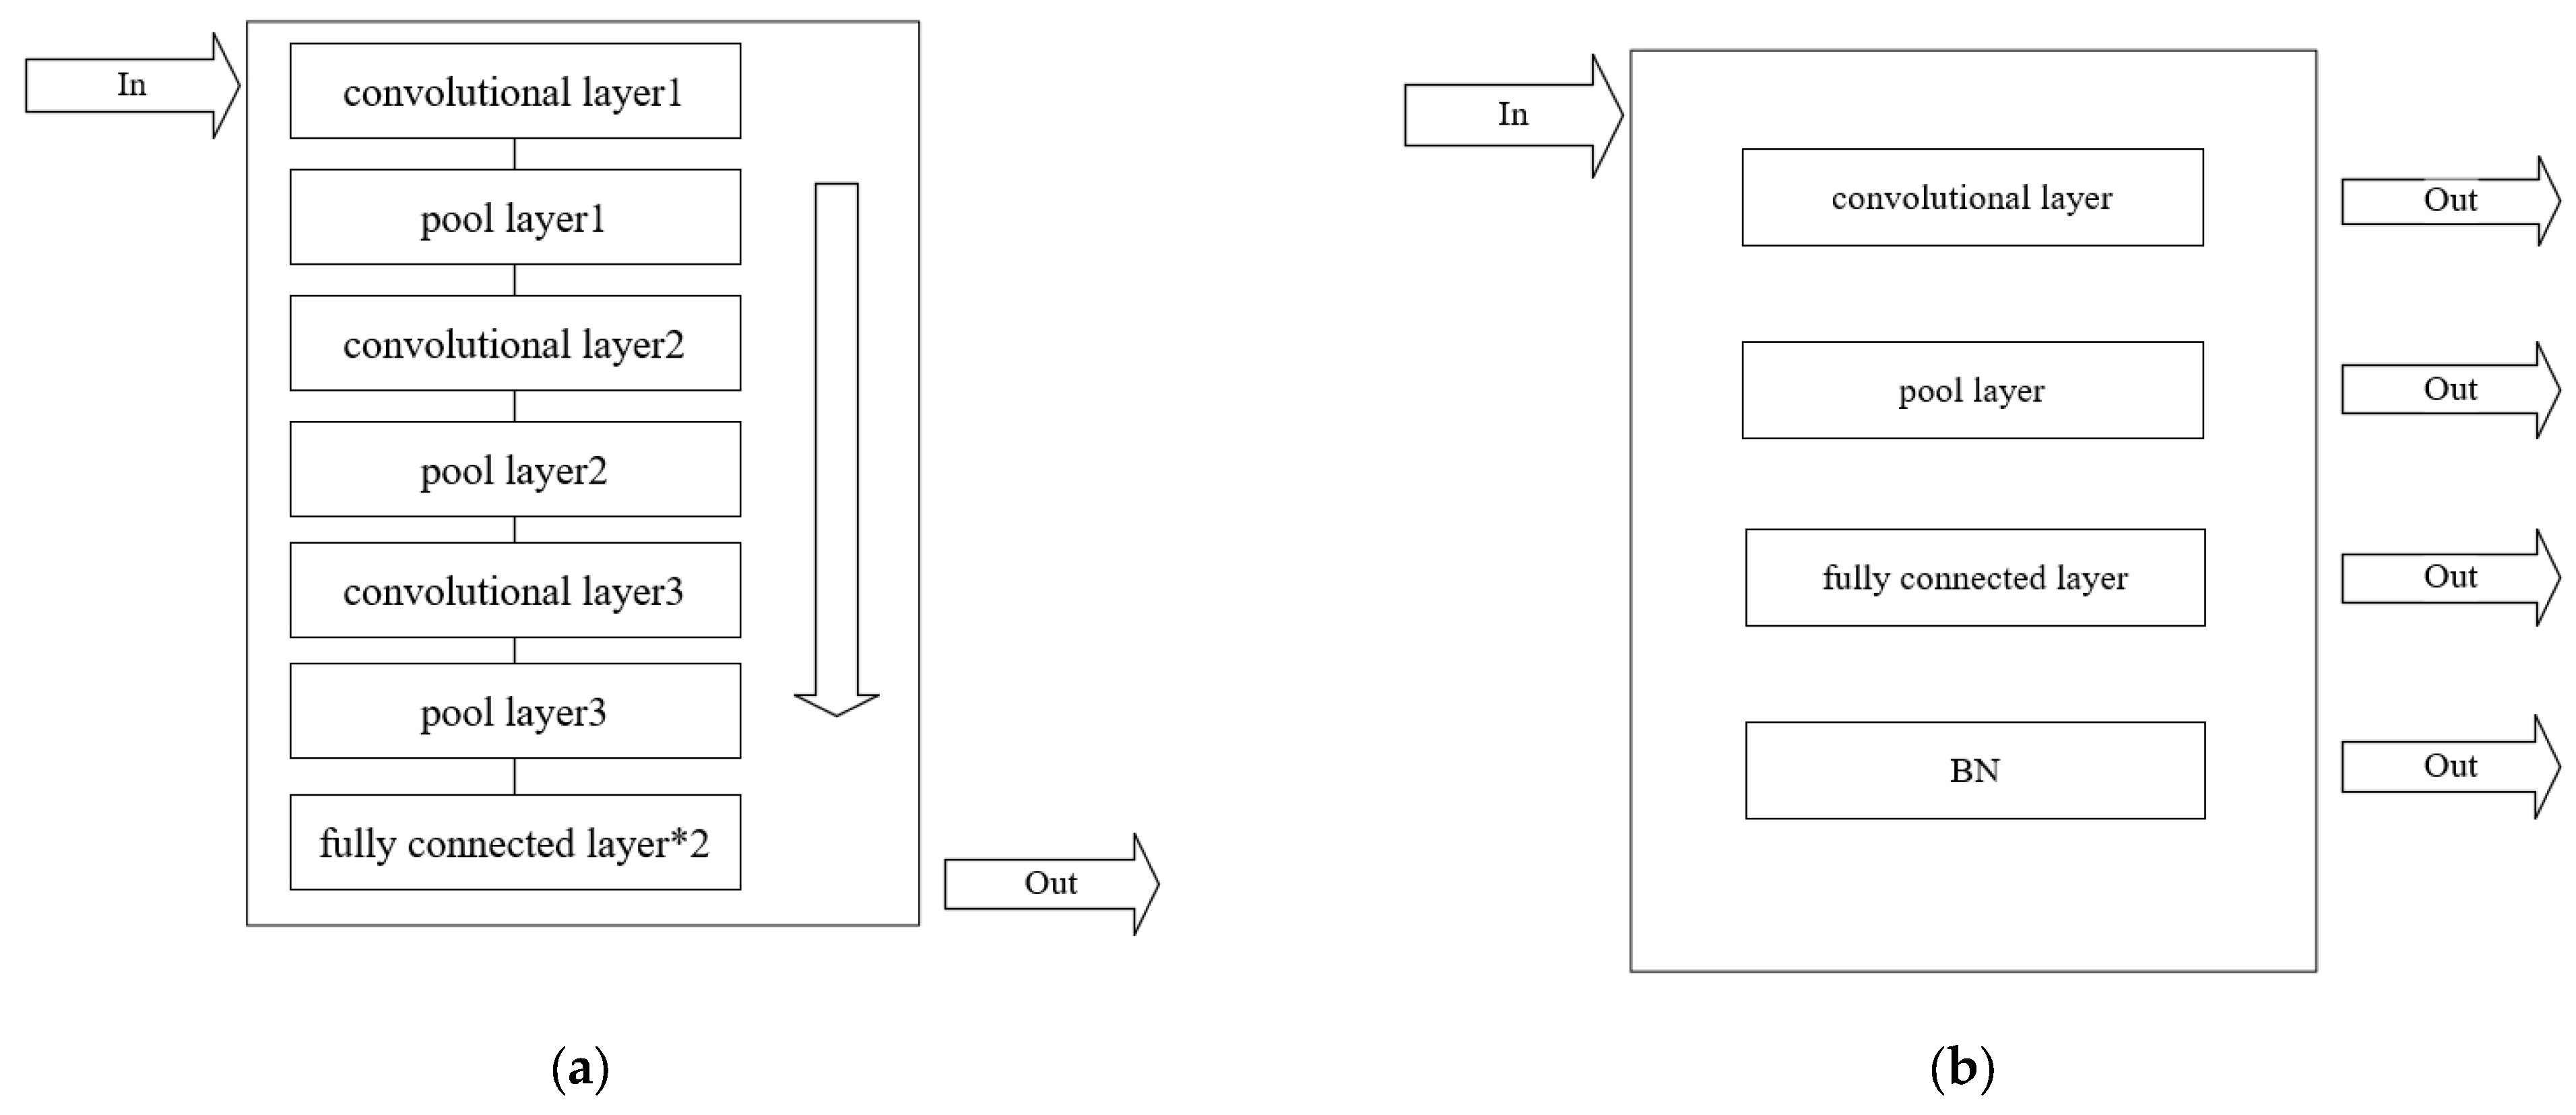
The ideal approach is to place the entire convolutional neural network model into the PL for FPGA algorithm acceleration, as shown in Figure 12a. In this approach, data collected using the PS are fed into the convolutional IP core, undergo algorithmic calculations, and then the data are transferred back to the PS and sent to the host computer following the established protocol. However, due to the limited performance of the ZYNQ7010, which is the basic version of the ZYNQ series, there is a significant performance gap in algorithm requirements compared to the ZYNQ7020. Therefore, it is not feasible to deploy the entire convolutional network for continuous calculations in the PL.
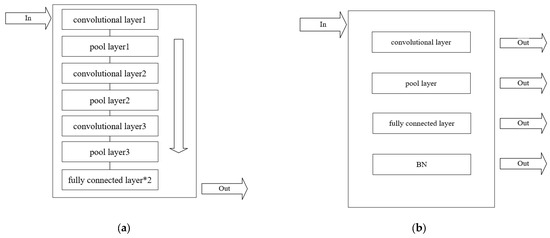
Figure 12.
(a) Integrated convolutional neural network computation. (b) Modular convolutional neural network computation.
Hence, the approach we adopt is modular computation, as illustrated in Figure 12b. The convolutional neural network comprises convolutional layers, pooling layers, activation function layers, and fully connected layers, along with batch normalization algorithms. The activation function layers are relatively simple and can be embedded within the convolutional layers. Therefore, we generalize these four layers, i.e., the data collected are input into the convolutional layer in the PL, and the results are returned to the PS. The PS then inputs the data into the pooling layer in the PL, and so on. Compared to the aforementioned approach of placing the entire network in the PL, this method effectively reduces hardware usage but introduces additional time for data transmission back and forth.
3.2.4. Hardware Algorithm Acceleration
The PL side of the ZYNQ consists of FPGA, which can be utilized for FPGA acceleration. Unlike traditional general-purpose processors (such as CPUs) or graphics processing units (GPUs), FPGAs have programmable hardware structures that can be customized for specific tasks. In this program, convolutional operations in the convolutional layer, pooling operations, and matrix multiplication and bias addition operations in the fully connected layer are all performed in parallel using the FPGA’s computing units to accelerate feature extraction.
Due to the deep convolutional layers, incorporating the entire computation of the convolutional neural network would lead to insufficient hardware resources. Therefore, modular computation is adopted. The data obtained from each layer are stored on the PS side and then re-input into the PL side for CNN computation. As can be seen from Table 4, the most complex convolution layer algorithm has been accelerated by approximately 96.15%, the pooling layer by about 99.09%, and the fully connected layer has been optimized by 99.26%. The computation of the activation layer is relatively simple and can be left unoptimized to conserve hardware resources. Table 5 also shows that the hardware remains at a reasonable level overall. There is no high load, yet the requirements for hardware acceleration are met. The program tested focuses on the first convolution layer, pooling layer, and fully connected layer, which are the stages that exert the most pressure on hardware parameters. If the initial feature extraction proceeds normally, the parameters will decrease after the completion of feature extraction, leading to reduced subsequent hardware pressure. Additionally, the use of a high-bandwidth AXI bus interface minimizes data transfer delays and overhead. The actual performance loss is not significant, allowing for real-time responses and rapid processing, suitable for data transmission scenarios.
Table 4.
Performance improvement in convolutional neural network layers before and after optimization.
Table 5.
Resource utilization of FPGA logic in convolutional neural network layers on ZYNQ.
3.2.5. Results Analysis and Comparative Validation
We evaluated the overall classification ability of five types of fault detection models, i.e., how many samples were correctly classified relative to the total sample set. However, the discrimination for some specific categories was not sufficiently precise. Refer to Table 6.
Table 6.
Comparative accuracy of CNN and SVN algorithms across different fault conditions.
According to Table 6, the accuracy of the algorithm for the G3 fault condition reached 100%, while for conditions G1 and G4, the accuracies were 81.82% and 83.41%, respectively. These two conditions might be areas that require improvement. For the other two conditions, the performance reached a very satisfactory level. Thus, it can be validated that the improved CNN presented in this paper possesses excellent diagnostic performance.
Compared to directly using machine learning models (such as SVM) without adopting a feature extraction algorithm, the diagnostic accuracy was below 50%. The reason is that the dataset used in this study is high-dimensional. CNNs excel at feature extraction, whereas SVM might require complex computations and substantial memory for high-dimensional spaces, which does not adapt well to extensive computations.
In the SDK, the computation time for the fully connected layer is obtained through a time acquisition function, yielding the total running time of the CNN with FPGA acceleration. This time is then compared with the CNN running solely on the ARM side. As shown in the in Table 7, the results averaged over multiple experiments indicate that with FPGA hardware acceleration, the ARM’s completion time is improved by 2.1 times compared to the non-hardware-accelerated scenario. This demonstrates that hardware acceleration can indeed reduce running time while maintaining accuracy.
Table 7.
CNN running time on ARM and FPGA + ARM platforms.
3.3. Operational Testing
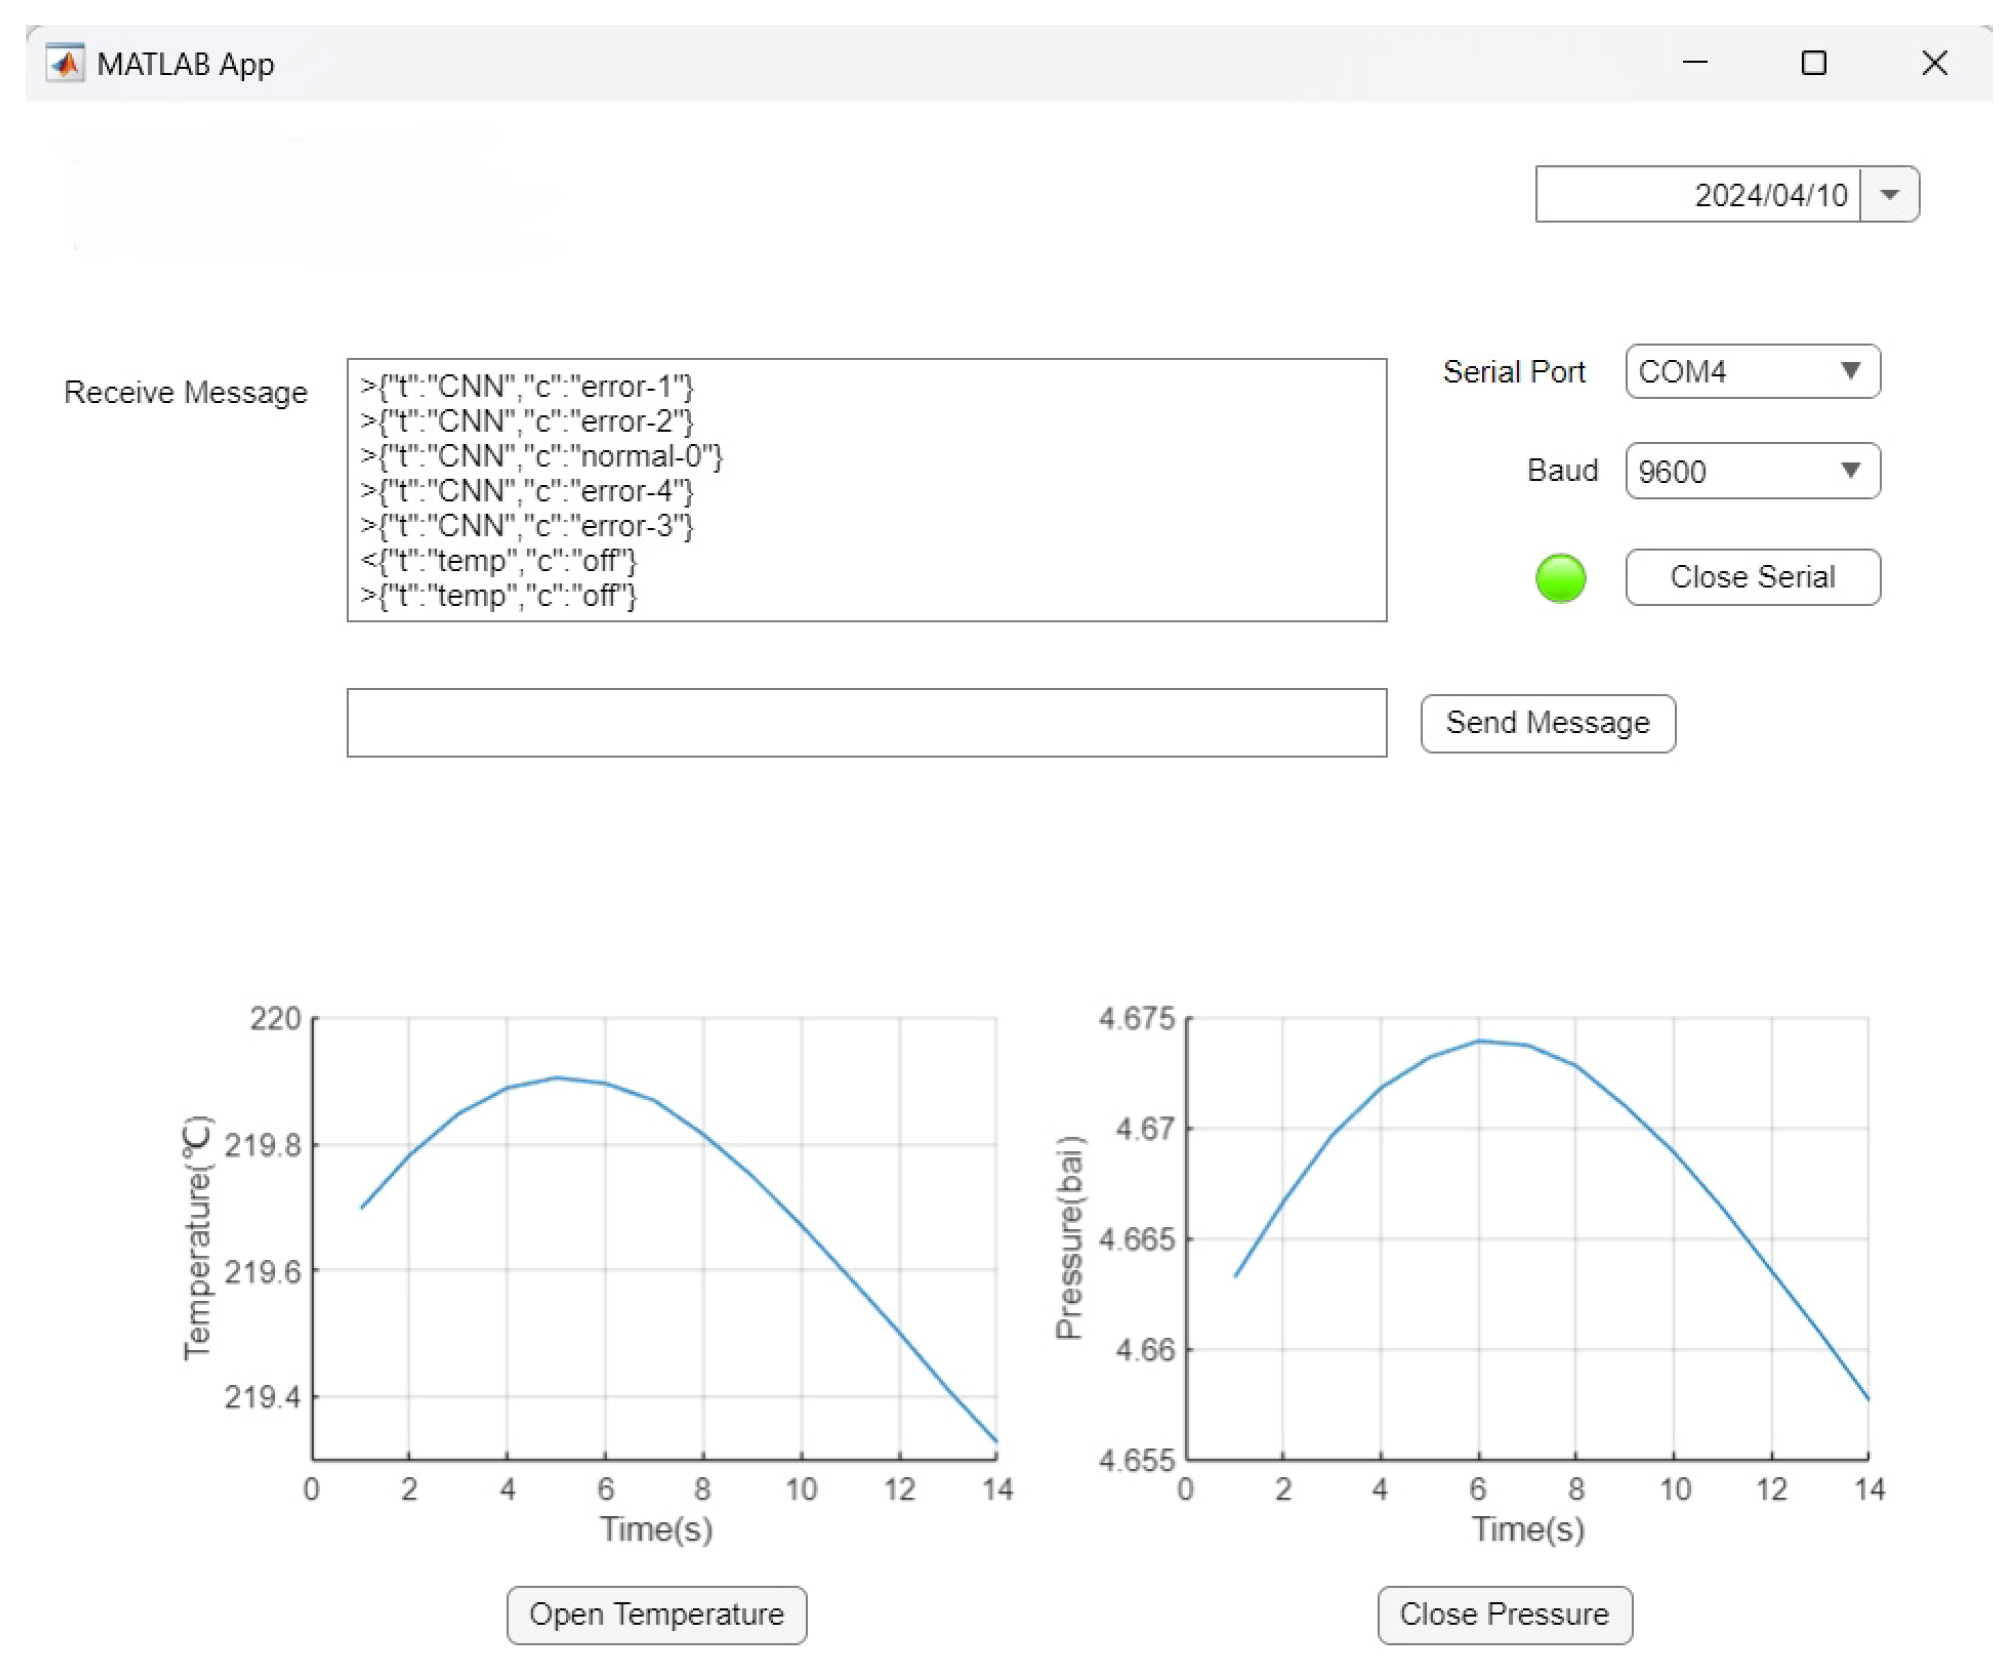
Referencing Figure 13, the general process is as follows: the “Receive Messages” column represents the data received by the LoRa module. Within the ZYNQ, the data have been classified into normal and abnormal categories. If there is a need to deactivate sensors, commands can be sent in the “Send Messages” column through custom communication protocols, allowing for sensor deactivation and other operations.
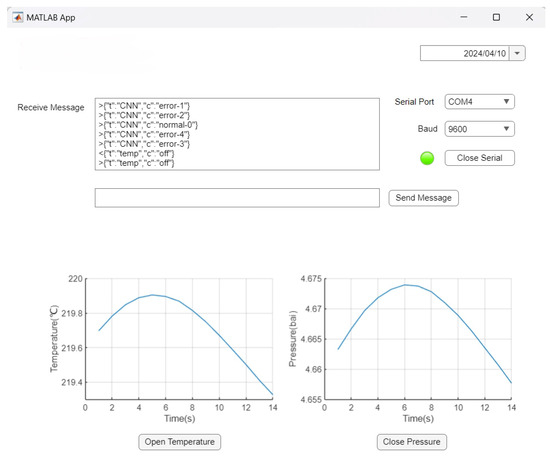
Figure 13.
The interface received by the upper computer.
The testing procedure attempted this time involved setting up test dataset computations on the ZYNQ side, sending the results to the host computer, receiving the results five times, and clicking the button below the chart to automatically send a command to deactivate the temperature sensor data. Upon successful deactivation, a receipt confirming the temperature sensor’s deactivation is returned.
The detailed testing procedure is as follows:
The host computer is connected to the LoRa module, and the COM4 port is identified and connected via serial port, indicated by the transition of the adjacent LED from red to green.
The ZYNQ board is powered on, and the modules begin operation. In an ideal scenario, data received by sensors on the ship would be stored in the ZYNQ’s memory. However, lacking actual ship testing conditions, simulated data generated using a simulator are sent to the ZYNQ via Ethernet to simulate data reception and storage in memory.
The ZYNQ begins operation, and the first data received indicate a significant increase in cylinder inlet temperature, which could lead to premature ignition due to the early combustion of fuel in the cylinder. The computed data received by the host computer display fault 1, indicating advance fuel injection timing.
In the second test, simulated data are sent indicating a significant increase in cylinder inlet flow rate, suggesting delayed combustion and an increase in fuel quantity in the cylinder, indicative of delayed fuel injection timing. The received fault detection indicates error 2, aligning with the expected fault data result.
The third test involves sending normal data, resulting in fault detection indicating normal operation, in line with the expected fault data result.
In the fourth test, data simulating a significant decrease in outlet pressure from the turbocharger are sent to the ZYNQ, mimicking turbocharger impeller carbon accumulation and decreased efficiency. The received data indicate error 4, aligning with the expected fault data result.
The fifth test involves sending data indicating a significant increase in outlet temperature from the intercooler to the ZYNQ, simulating blockage in the intercooler pipeline. The received data indicate error 3, aligning with the expected fault data result.
The line chart displays the last test’s inlet temperature and outlet pressure of the turbocharger, showing normal range fluctuations. Due to space limitations, two charts are temporarily placed.
Finally, the button below the line chart is tested. Pressing the button automatically sends “{“t”:“temp”, “c”:“off”}”, instructing the ZYNQ to stop sending temperature data. The button displays as “open”, and the ZYNQ replies to the received command.
The chart below represents the received data presented in graphical form. After multiple tests, the program demonstrates stable performance, achieving an accuracy rate of 92.86% when compared on the host computer.
4. Discussion
This program aims to achieve edge computing for fault detection in marine diesel engines. However, considering the complexity of the marine environment, the convolutional neural network (CNN) structure can be further optimized or replaced with other superior algorithms to improve fault detection accuracy and speed. Additionally, since the LoRa module has not been tested on actual ships, the signal conditions in marine environments remain unknown. Furthermore, issues concerning the security and privacy protection of information communication have not been addressed. In practical applications, it is necessary to consider how to enhance security protocols to prevent data leakage. Moreover, the cost has not been reduced to the lowest possible level, and there is still potential for further cost reduction.
Furthermore, the ZYNQ chip used in this program is the basic version of the ZYNQ series (7010). If it were replaced with a higher version such as 7020 or 7030, the entire model could be placed into the ZYNQ chip, further reducing computation time. Additionally, using a more advanced ZYNQ chip could reduce code complexity by decreasing the need for data replication methods. Optimization can also be performed within the system. For instance, a Linux system could be used instead of the FreeRTOS system, which would be more suitable for this type of thread operation.
5. Conclusions
This program utilizes the ZYNQ as the main control chip, combined with a convolutional neural network (CNN) fault detection and classification algorithm. It can identify potential fault signs and promptly alert or notify maintenance personnel for repairs, reducing the risks associated with diesel engine malfunctions. The communication end adopts the wireless LoRa network as the communication module, enabling stable communication between the ship’s diesel engine and the cockpit, ensuring timely data transmission and processing. In summary, this program can effectively enhance the safety of ship’s diesel engines, providing reliable support and protection for maritime navigation. Furthermore, the test results obtained from the booster diesel engine simulation software align with expectations.
In the maritime industry, most researchers use traditional embedded devices such as Raspberry Pi and microcontrollers for algorithmic computations. ZYNQ research is generally used in high-performance areas such as image recognition. However, the maritime industry also requires high-performance equipment for technological advancement. While algorithms need to keep pace with the times, they also require sufficiently powerful carriers to enable a greater intelligence and automation of facilities on board ships. This paper aims to explore the possibility of combining ZYNQ with ships, validate it, and ultimately discover its feasibility. However, the learning curve of ZYNQ is much higher than that of traditional embedded devices, and the economic cost is also higher. Yet, these costs bring about superior performance, coupled with the advantages of FPGA integration. As a product after 2010, ZYNQ is an emerging device for the maritime industry, which is also urgently needed for the development of intelligent unmanned ships. Both equipment and technology require further development. Thus, the original intention of this paper is to promote the integration of emerging chips with ships.
Author Contributions
Conceptualization, H.W. and R.J.; funding acquisition, R.J.; methodology, H.W.; software, H.W.; validation, X.W., X.C. and T.L.; formal analysis, X.C.; investigation, X.W.; resources, H.W.; data curation, H.W.; writing—original draft preparation, H.W.; writing—review and editing, H.W.; visualization, H.W.; supervision, R.J.; project administration, T.L. All authors have read and agreed to the published version of the manuscript.
Funding
This research was funded by Innovation Project of the Offshore LNG Equipment Industry Chain (CBG3N21-2-7), by Development of Ship Operation Condition Monitoring and Simulation Platform, Liaoning Provincial Department of Natural Resources (No. 1638882993269) and by Development of liquid cargo and electromechanical simulation operation system for LNG ship, Ministry of Industry and Information Technology of the People’s Republic China (CBG3N21-3-3).
Institutional Review Board Statement
Not applicable.
Informed Consent Statement
Not applicable.
Data Availability Statement
The data presented in this study are available on request from the corresponding author. The data are not publicly available due to privacy.
Acknowledgments
The authors extend their appreciation to the anonymous reviewers for their valuable feedback.
Conflicts of Interest
The authors declare no conflicts of interest.
References
- Smith, D.J. Reliability, Maintainability and Risk—7th Edition. Available online: https://www.elsevier.com/books/reliability-maintainability-and-risk/smith/978-0-7506-6694-7 (accessed on 17 September 2020).
- Ebeling, C.E. An Introduction to Reliability and Maintainability Engineering, 3rd ed.; Waveland Press: Long Groove, IL, USA, 2019; ISBN 978-1-4786-3933-6. [Google Scholar]
- Golub, I.; Antoníc, R.; Dobrota, Ð.; Golub, I.; Antoníc, R. Dobrota, Optimization of heavy fuel oil separator system by applying diagnostic inference methods. Pomorstvo 2011, 25, 173–188. [Google Scholar]
- Yigin, B.; Celik, M. A Prescriptive Model for Failure Analysis in Ship Machinery Monitoring Using Generative Adversarial Networks. J. Mar. Sci. Eng. 2024, 12, 493. [Google Scholar] [CrossRef]
- Seo, M.; Yun, W. Hot Strip Mill Gearbox Monitoring and Diagnosis Based on Convolutional Neural Networks Using the Pseudo-Labeling Method. Appl. Sci. 2024, 14, 450. [Google Scholar] [CrossRef]
- Ates, C.; Höfchen, T.; Witt, M.; Koch, R.; Bauer, H. Vibration-Based Wear Condition Estimation of Journal Bearings Using Convolutional Autoencoders. Sensors 2023, 23, 9212. [Google Scholar] [CrossRef] [PubMed]
- Yan, J.; Liao, J.; Gao, J.; Zhang, W.; Huang, C.; Yu, H. Fusion of Audio and Vibration Signals for Bearing Fault Diagnosis Based on a Quadratic Convolution Neural Network. Sensors 2023, 23, 9155. [Google Scholar] [CrossRef] [PubMed]
- Monieta, J.; Kasyk, L. Application of Machine Learning to Classify the Technical Condition of Marine Engine Injectors Based on Experimental Vibration Displacement Parameters. Energies 2023, 16, 6898. [Google Scholar] [CrossRef]
- Wu, C.; Zhang, K.; Zhang, X. FPGA-Based Speed Control Strategy of PMSM Using Improved Beetle Antennae Search Algorithm. Energies 2024, 17, 1870. [Google Scholar] [CrossRef]
- Wang, J.; Zhang, C.; Ma, X.; Wang, Z.; Xu, Y.; Cattley, R. A Multivariate Statistics-Based Approach for Detecting Diesel Engine Faults with Weak Signatures Title of the article. Energies 2020, 13, 873. [Google Scholar] [CrossRef]
- Lee, D.; Aliev, H.; Junaid, M.; Park, S.; Kim, H.; Lee, K.; Sim, S. High-Speed CNN Accelerator SoC Design Based on a Flexible Diagonal Cyclic Array. Electronics 2024, 13, 1564. [Google Scholar] [CrossRef]
- Liu, B.; Wei, Q.; Ding, K. ZYNQ-Based Visible Light Defogging System Design Realization. Sensors 2024, 24, 2276. [Google Scholar] [CrossRef]
- Rajagopalan, V.; Boppana, V.; Dutta, S.; Taylor, B.; Wittig, R. Xilinx Zynq-7000 EPP: An extensible processing platform family. In Proceedings of the 2011 IEEE Hot Chips 23 Symposium (HCS), Stanford, CA, USA, 17–19 August 2011. [Google Scholar]
- Monson, J.; Wirthlin, M.; Prasanna, V.K. A flexible and scalable high-performance OpenFlow switch on heterogeneous SoC platforms. In Proceedings of the 2013 IEEE 24th International Conference on Application-Specific Systems, Architectures and Processors, Washington, DC, USA, 5–7 June 2013. [Google Scholar]
- Vipin, K.; Fahmy, S.A. ZyCAP: Efficient Partial Reconfiguration Management on the Xilinx Zynq. IEEE Embed. Syst. Lett. 2014, 6, 41–44. [Google Scholar] [CrossRef]
- Zhou, S.; Jiang, W.; Hutchings, B.L. Implementing high-performance, low-power FPGA-based optical flow accelerators in C. In Proceedings of the 2014 IEEE 33rd International Performance Computing and Communications Conference (IPCCC), Austin, TX, USA, 5–7 December 2014. [Google Scholar]
- Che, W.; Martin, M.; Pocklassery, G.; Kajuluri, V.K.; Saqib, F.; Plusquellic, J. A Privacy-Preserving, Mutual PUF-Based Authentication Protocol. Cryptography 2017, 1, 3. [Google Scholar] [CrossRef]
- Habib, B.; Kaps, J.; Gaj, K. Implementation of efficient SR-Latch PUF on FPGA and SoC devices. Microprocess. Microsyst. 2017, 53, 92–105. [Google Scholar] [CrossRef]
- Moreira, N.; Lázaro, J.; Bidarte, U.; Jimenez, J.; Astarloa, A. On the Utilization of System-on-Chip Platforms to Achieve Nanosecond Synchronization Accuracies in Substation Automation Systems. IEEE Trans. Smart Grid 2017, 8, 1932–1942. [Google Scholar] [CrossRef]
- Gong, L.; Wang, C.; Li, X.; Chen, H.; Zhou, X. MALOC: A Fully Pipelined FPGA Accelerator for Convolutional Neural Networks With All Layers Mapped on Chip. IEEE Trans. Comput. Aided Des. Integr. Circuits Syst. 2018, 37, 2601–2612. [Google Scholar] [CrossRef]
- He, L.; Wang, F.; Wang, J.; Rodríguez, J. Zynq Implemented Luenberger Disturbance Observer Based Predictive Control Scheme for PMSM Drives. IEEE Trans. Power Electron. 2020, 35, 1770–1778. [Google Scholar] [CrossRef]
- Liu, X. Research on Fault Diagnosis of Marine Diesel Engine Based on Data. Master’s Thesis, Dalian Maritime University, College of Marine Engineering, Dalian, China, May 2022. [Google Scholar]
Disclaimer/Publisher’s Note: The statements, opinions and data contained in all publications are solely those of the individual author(s) and contributor(s) and not of MDPI and/or the editor(s). MDPI and/or the editor(s) disclaim responsibility for any injury to people or property resulting from any ideas, methods, instructions or products referred to in the content. |
© 2024 by the authors. Licensee MDPI, Basel, Switzerland. This article is an open access article distributed under the terms and conditions of the Creative Commons Attribution (CC BY) license (https://creativecommons.org/licenses/by/4.0/).