Abstract
The aim of this study was to determine the effect of plant spacing on the growth, yield and chemical composition of stevia grown in Poland. The variable factor was spacings of 50 cm × 30 cm, 45 cm × 25 cm and 30 cm × 30 cm. Seedlings were planted during the first ten days of June, and the plant material was harvested between the 10th and 20th of September. In July and September, seedlings were subjected to biometric measurements, and plant samples were taken for chemical analyses. Plants grown at 50 cm × 30 cm spacing were characterised by an increased content of reducing sugars, nitrates, phosphorous, potassium and magnesium, but the yield of the herb and leaves was smallest. The greatest yield of the herb and leaves was found for the 30 cm × 30 and 45 cm × 25 cm spacings with the lowest mass of single plants. Leaves from plants grown in the 30 cm × 30 cm spacing were also characterised as having the greatest concentration of dry mass and phenolic compounds and the lowest concentration of phosphorus and magnesium. Spacing did not significantly affect the biometric parameters of the plants in July, but in September, a difference was observed in the lateral width and total number of shoots. Spacing did not affect the plant pigment contents in the leaves of stevia.
1. Introduction
Stevia rebaudiana Bert. is a plant of the Asteraceae family originating from Paraguay. Stevia produces an interesting array of biologically active compounds characterised by a very sweet taste. The plant-derived steviol glycosides present in stevia (over 30 have been identified) may be up to 300 times sweeter than sucrose [1]. At the same time, the stevia plant possesses a low energetic value at the level of 2.7 kcal·g−1 d.m. Stevia is also a source of important antioxidants, such as polyphenolic metabolites, including flavons, flavonols and chlorogenic acids. Due to these properties, the stevia plant is widely used in the food, pharmaceutical and cosmetic industries [1,2]. As diabetes, caused mainly by sugar consumption, becomes a more crucial problem worldwide, more analyses of the viable sources of sugar substitutes seem like an adequate avenue of research in the fields of agriculture, biotechnology and food technology. Various in vitro and in vivo studies have revealed that steviol glycosides possess glucogonostatic, insulinotropic and antihyperglycemic properties [3]. Rebaudioside A and steviol can induce various anti-inflammatory, antidiarrhoeal, diuretic and immunomodulatory actions [4]. Furthermore, studies on rats revealed that the consumption of stevia leaves can decrease glycaemia and gluconeogenesis [5]. In a similar study performed by Aswar et al. (2019) [6], the consumption of stevioside had positive effects on blood glucose levels and lipid profiles as well as on advanced glycated end products. A study performed on humans, with a group consisting of lean and obese individuals, revealed that the consumption of stevia (compared with sucrose or aspartame) has shown positive effects, such as reduced postprandial glucose levels or postprandial insulin levels. Other authors [7] also describe the positive effects of stevia consumption on the postprandial glucose level. A study conducted by Mohd-Radzman et al. (2013) [8] has shown that steviosides from stevia can improve 3T3-L1 insulin sensitivity by enhancing the expression of proteins that are involved in the insulin signalling pathway. Rebaudoside A, another stevioside, in the study by Saravanan et al. (2012) [9], had an influence on reducing blood glucose levels in rats with diabetes and has exhibited protective action towards the pancreas. Stevia and steviosides also have anti-inflammatory and antimicrobial properties [10]. Research conducted by Atas et al. (2018) [11] has shown that stevia leaves can be used to produce extracts that possess antimicrobial properties against Bacillus subtilis, Klebsiella pneumonia, Proteus vulgaris, Streptococcus pneumonia, Staphylococcus aureus and Pseudomonas fluorescence. These results and the fact that people have a growing interest in a healthy lifestyle and in having natural ingredients in food results in an increased demand for herbal raw materials and consequently leads to the more extensive cultivation of plants with functional and healthy properties, stevia included [12,13,14]. This plant is currently grown in a variety of countries besides South America, such as China, Malaysia, Singapore, South Korea, Taiwan and Thailand [15]. However, there is not much information about the viability of Stevia rebaudiana plantations in various countries characterised with a cooler climate than the native region of stevia. Due to the fact that stevia is currently used worldwide, stevia cultivation in the country in which stevia plants would be used in the production of various food products or cosmetics could possibly reduce costs and carbon emissions due to the reduction in the distances needed for stevia transportation [16,17]. This study analysed the possibility of cultivating Stevia rebaudiana Bertoni plants in Poland and additionally aimed to determine whether varying plant spacing during stevia cultivation can influence various characteristics of stevia plantation, such as yield, growth parameters and the composition of the produced plants. Research on the selection of appropriate spacing for plant cultivation, particularly in new areas with climatic conditions differing from natural sites, can be of significant interest to potential farmers in the new regions. Data acquired in this study could be of great economic and physiological importance. They could be potentially used in optimising field surface usage to enhance yield quantity and biological significance by selecting the optimal space for plant growth, thereby influencing the attainment of higher-quality raw materials [18,19,20].
2. Materials and Methods
2.1. Experimental Design
Stevia plants used in the experiment were planted on black degraded soil characterised by a humus content of 1.8%, salinity of 54 µS/cm3 and pH of 7.44 in the years 2014, 2015 and 2016; the values are given as the average of the years of the experiment. Stevia was planted at the Research and Didactic Station in Psary, Wroclaw University of Environmental and Life Sciences (51°19′055913609418″ N, 17°03′36781036313″ E). The experiment was performed using a one-factor randomised block design in triplicate on plots with an area of 1.5 m2. Each of the field plots were separated from the other plots by an uncultivated plot of soil with a width of 50 cm. The total area of the experiment was equal to 33.75 m2. The variable factor of the experiment was the spacing between the stevia plants, which was equal to 50 cm × 30 cm (10 plants per plot), 45 cm × 25 cm (12 plants per plot) and 30 cm × 30 cm (15 plants per plot). The seedlings were obtained from a self-heated greenhouse, where seeds were grown in plastic boxes filled with peat substrate. Seeds were sown during the first ten days of April. Three weeks after sowing, stevia plants were transferred to 54-site seedling trays filled with peat substrate. Plants with at least three pairs of foliage leaves were planted between the 20th and 30th of May in 10 cm pots filled with peat substrate, and then, during the first ten days of June, plants were planted into the plots which were fertilized with ammonium nitrate at 100 kg N·ha−1 and covered with black agrotextile. The concentration of phosphorus in the soil was 45 mg·dm−3; the concentration of potassium was 310 mg·dm−3; the concentration of calcium was 2800 mg·dm−3; the concentration of magnesium was 34 mg·dm−3. An additional fertilizer in the form of ammonium nitrate (50 kg N·ha−1) was used as a top-dressing four weeks after transplanting the seedlings into the field. Standard agronomic practices were followed for plant care, and irrigation was provided during dry periods at a rate of 20 mm of water per square meter of the plot (20 dm3 per m2).
Weather conditions at the site of the stevia plantation (temperature and amount of rainfall) during the experimental months are detailed in Table 1.

Table 1.
Rainfall and temperature on site of the experiment during the time of the stevia growth.
Plants were harvested manually by cutting the stalk 10 cm above the ground during the second decade of September each year. After the harvest, the plants were weighed to assess the total yield of herbs and leaves (kg·m−2). These data were then used to calculate the yield and the percentage of leaves in the yield. Leaves and shoots from individual plants were also weighed separately to determine their respective contributions to the total yield. Biometric measurements, including plant height, lateral width (measured at two-thirds of the plant height), total number of first-order shoots, and the total number of leaves on the lowest lateral shoot, were taken in July (during intensive growth) and just before harvest in September. The height of all plants was measured, and three healthy stevia plants of average height from each plot were selected for a complete analysis of biometric measurements (three per plot, nine per spacing, 27 per spacing over the 3-year experiment). Healthy, undamaged leaves (approximately 10–15 g per plant) were collected for the chemical analyses from the middle portion of the plant (at half the plant height). Measurements were taken three times per year in July and September for each field (nine per spacing, 27 per spacing over the 3-year experiment).
2.2. Analytical Methods
The concentration of dry mass in stevia leaves was determined via the gravimetric method, using a Binder ED400 (Merazet, Poznan, Poland) dryer and a WTC2000 (Radwag, Radom, Poland) analytical scale [21]. Vitamin C concentration was measured in fresh stevia leaves using Tillman’s method [22]. Approximately 10 g of stevia leaves was homogenized with oxalic acid (200 cm3, 2%) using a Koenic blender. The homogenate was filtered, and 10 cm3 of the resulting filtrate was titrated with 2,6-dichlorophenolindophenol (Tillman’s reagent) until a persistent light pink colour was present for at least one minute.
Chlorophyll a + b and carotenoid concentrations were analysed spectrophotometrically. Fresh leaves (0.4 g) were ground in a mortar with dried sand, calcium carbonate, and a few drops of 80% acetone to form a homogeneous mass. Twenty cm3 of acetone was used to transfer ground leaves from the mortar to the Schott filtration system, where the homogenous mass was filtered under vacuum. The resulting filtrate was then transferred to a 50 cm3 volumetric flask, which was filled with 80% acetone and mixed. The filtrate’s absorbance was measured in quartz cuvettes (10 mm optical path) at wavelengths of 470 nm, 645 nm and 663 nm. A blank sample was 80% acetone [23].
Reducing sugars were analysed by weighing 20 g of fresh stevia leaves and adding them to 200 cm3 volumetric flasks, which was followed by the addition of 10 cm3 of distilled water. Flasks were then heated in the water bath, and the flasks contents were boiled for 30 min. The reducing sugar concentration was determined using the Lane–Eynon volumetric method [24]. Phenolic compounds were measured using the Folin–Ciocalteu method [25] with compounds extracted from approximately 5 g of fresh stevia leaves in 20 cm3 of 80% methanol. To analyse nitrates, magnesium, potassium, calcium, and phosphorus extracts were prepared according to Nowosielski [26]. Dried and ground leaves (0.4 g) were mixed with 100 cm3 of 2% acetic acid and 1 g of activated carbon in screw-cap containers and shaken for 30 min at 150 rpm using a MaxQ2000 shaker (Thermo Fisher Scientific, Waltham, MA, USA). The mixture was filtered, and the filtrate was used for subsequent element and ion concentration analyses.
Magnesium content was determined using a WPA S106 spectrophotometer (Biochrom, Cambridge, UK). First, 5 cm3 of the filtrate was mixed with 20 cm3 of a compound reagent (containing sodium hydroxide, glycerol, hydroxylammonium chloride, polyvinyl alcohol, and titan yellow), and 3.5 cm3 of this solution was transferred to the polystyrene cuvette (10 mm optical path), and absorbance was measured at 555 nm. A blank sample was prepared by adding 5 cm3 of 2% acetic acid solution to 20 cm3 of the compound reagent.
Phosphorus content was also assessed spectrophotometrically. First, 20 cm3 of the filtrate was mixed with 5 cm3 of a reagent solution containing ammonium metavanadate and ammonium heptamolybdate, and 3.5 cm3 of this mixture was transferred to the polystyrene cuvette (optical path of 10 mm), and absorbance was measured at 470 nm. A blank sample was prepared with 20 cm3 of 2% acetic acid and 5 cm3 of the reagent solution.
Calcium and potassium concentrations were analysed using flame photometry utilizing a Carl Zeiss Jena-type flame photometer. Nitrate ion concentration was measured in the filtrate using an Orion 5 Star ionometer (Thermo Fisher Scientific, Waltham, MA, USA) calibrated for 10–1000 mg NO3− per dm3 of the sample.
2.3. Data Analysis
Data gathered throughout the study were statistically analysed using the Statistica 13 program (Statsoft, Tulsa, USA) using one-way ANOVA at α = 0.05. A Tukey test was utilised to determine homogenous groups. Principal component analysis (PCA) was conducted to compare analysed parameters of the stevia grown in different spacings. The single-linkage agglomerative method was used, employing the Euclidean measure to determine the distance between each analysed parameter and the samples of stevia.
3. Results
Results of the experiment have demonstrated a significant effect of various spacing of stevia plants on their growth, biometric measurements, yield and chemical composition of stevia plants.
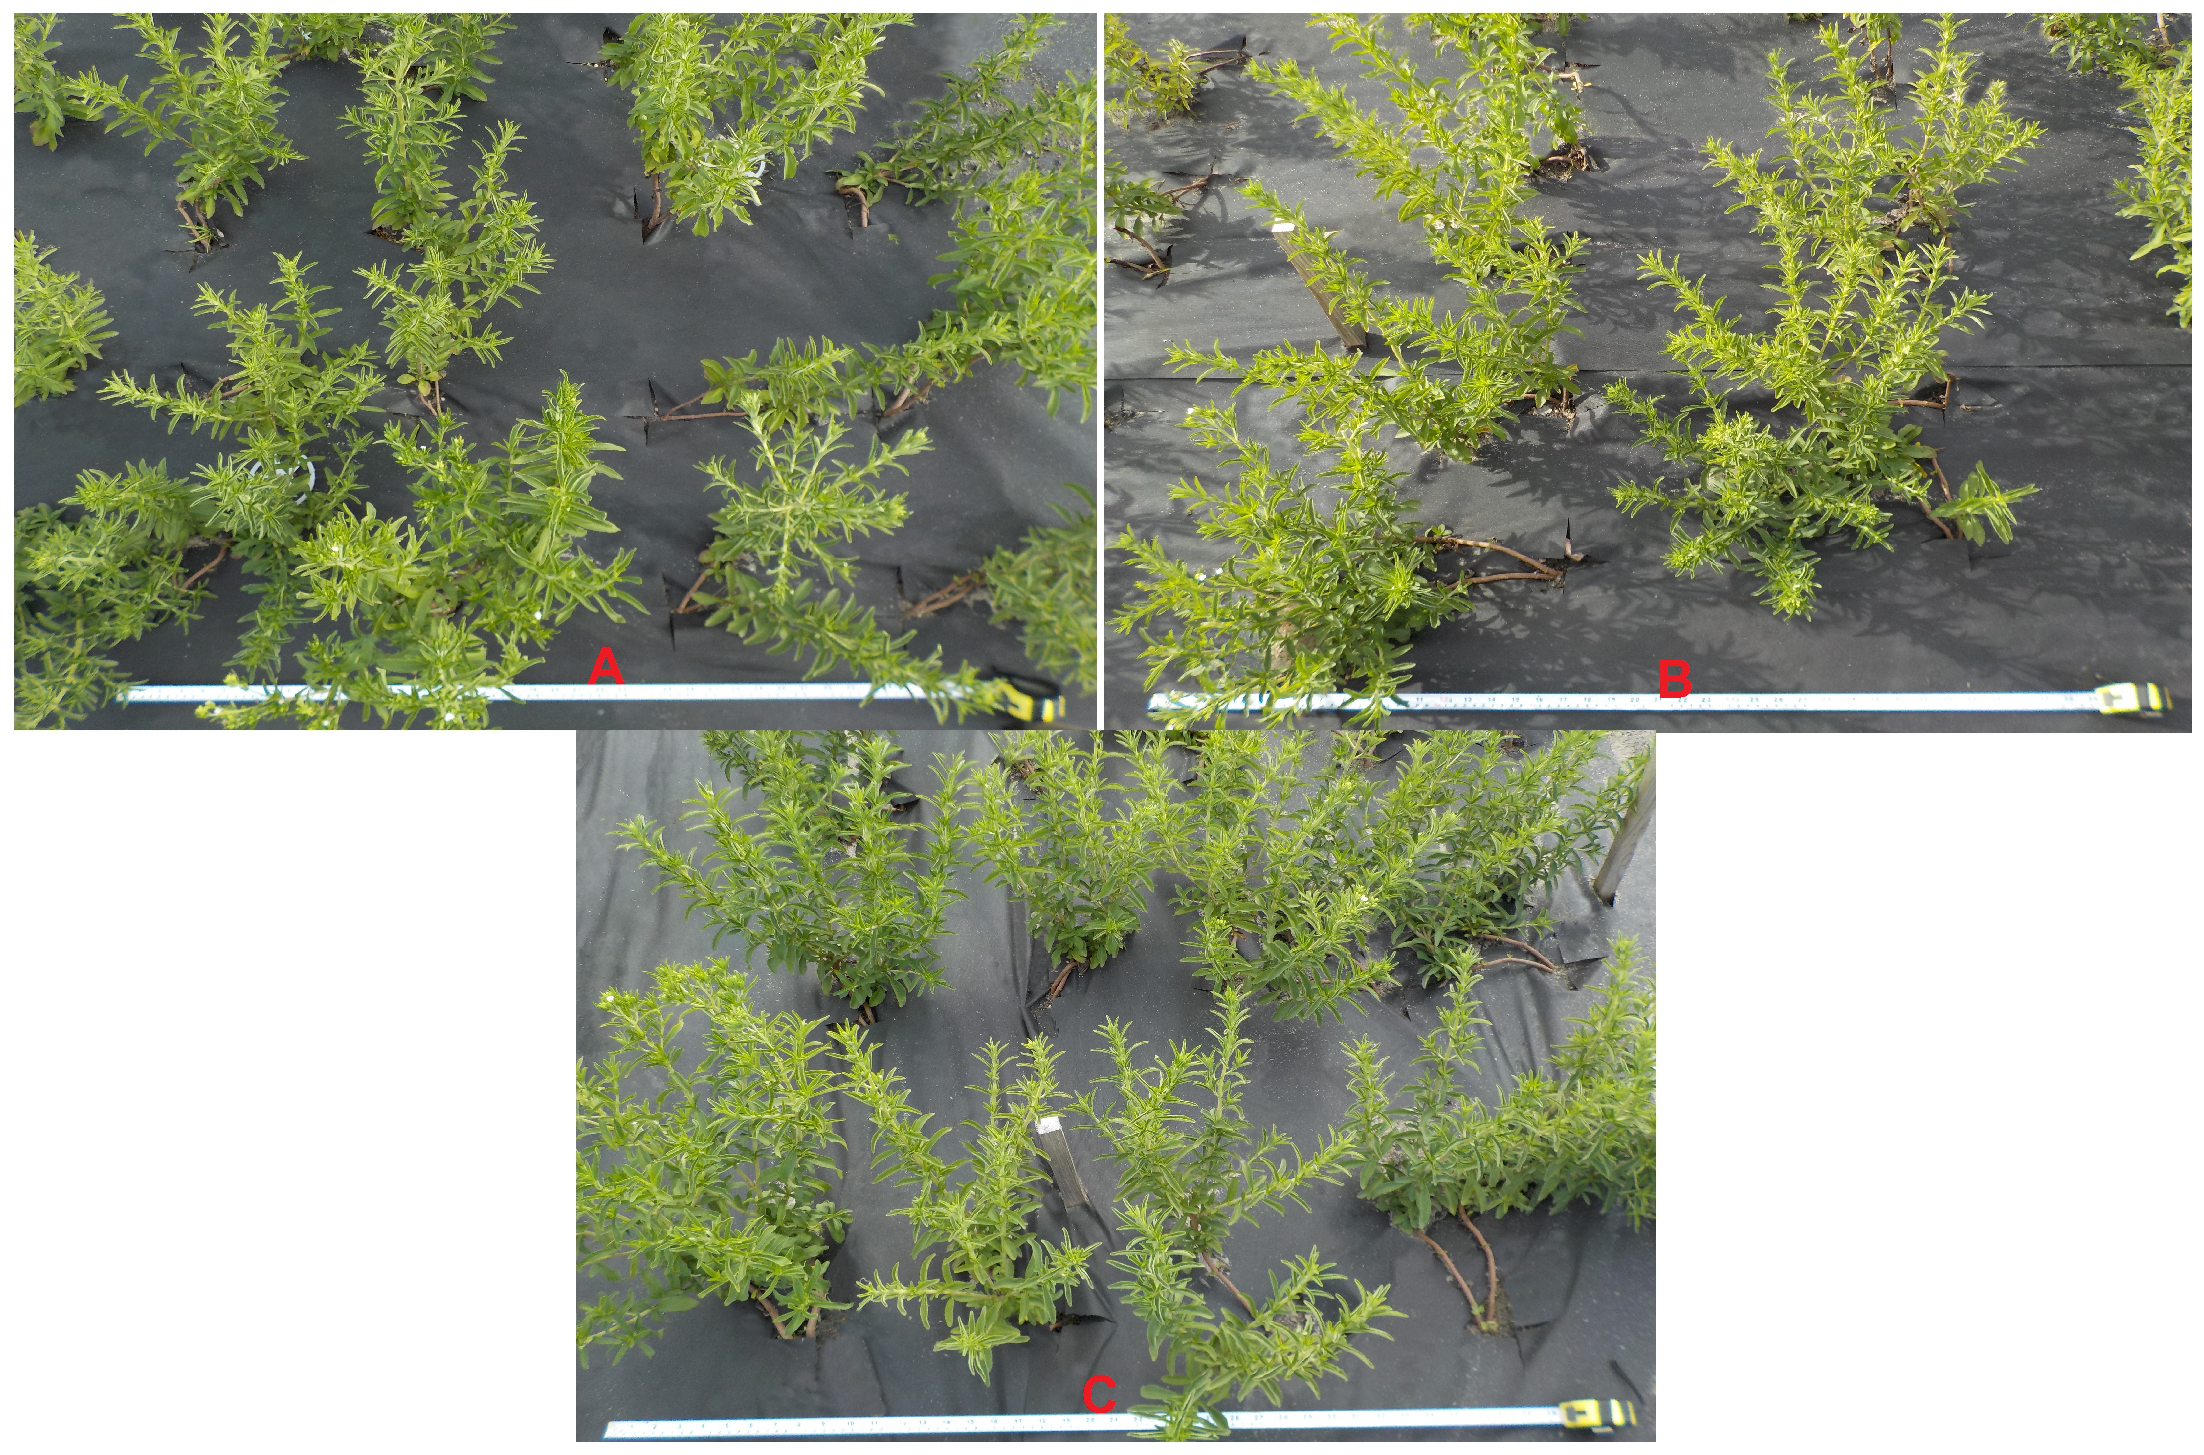
Selected stevia plants cultivated in the study are illustrated in Figure 1.
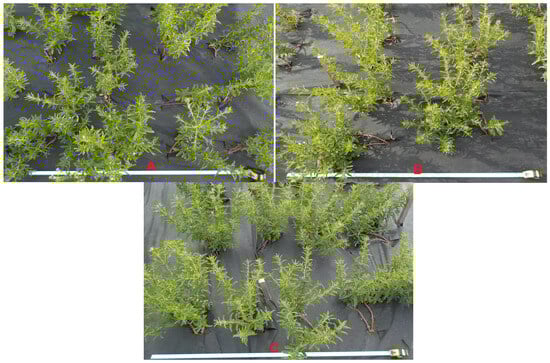
Figure 1.
Stevia plants grown in the spacing of 30 cm × 30 cm (A), 45 cm × 25 cm (B) and 50 cm × 30 cm (C).
The greatest average weight of a single plant, as well as the average weight of leaves and shoots from a single plant, was observed in the stevia plants cultivated in spacing of 50 cm × 30 cm (Figure 2). The weight of the analysed plants was utilized to determine the yield of the stevia and is presented in Table 2.
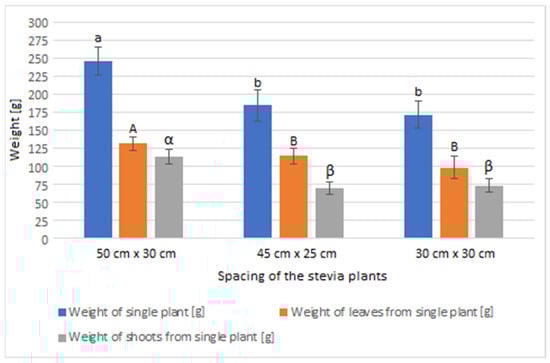
Figure 2.
Weight of the stevia plants grown in different spacings. Data are given as means (n = 27) with standard deviation. Small letters show homogenous groups in the measurement of weight of the stevia plants (Tukey test, α = 0.05), capital letters show homogenous groups in the measurement of weight of the leaves from the stevia plants (Tukey test, α = 0.05), Greek letters show homogenous groups in the measurement of weight of the shoots from the stevia plants (Tukey test, α = 0.05).
Table 2.
Yield of the stevia plants grown in different spacings.
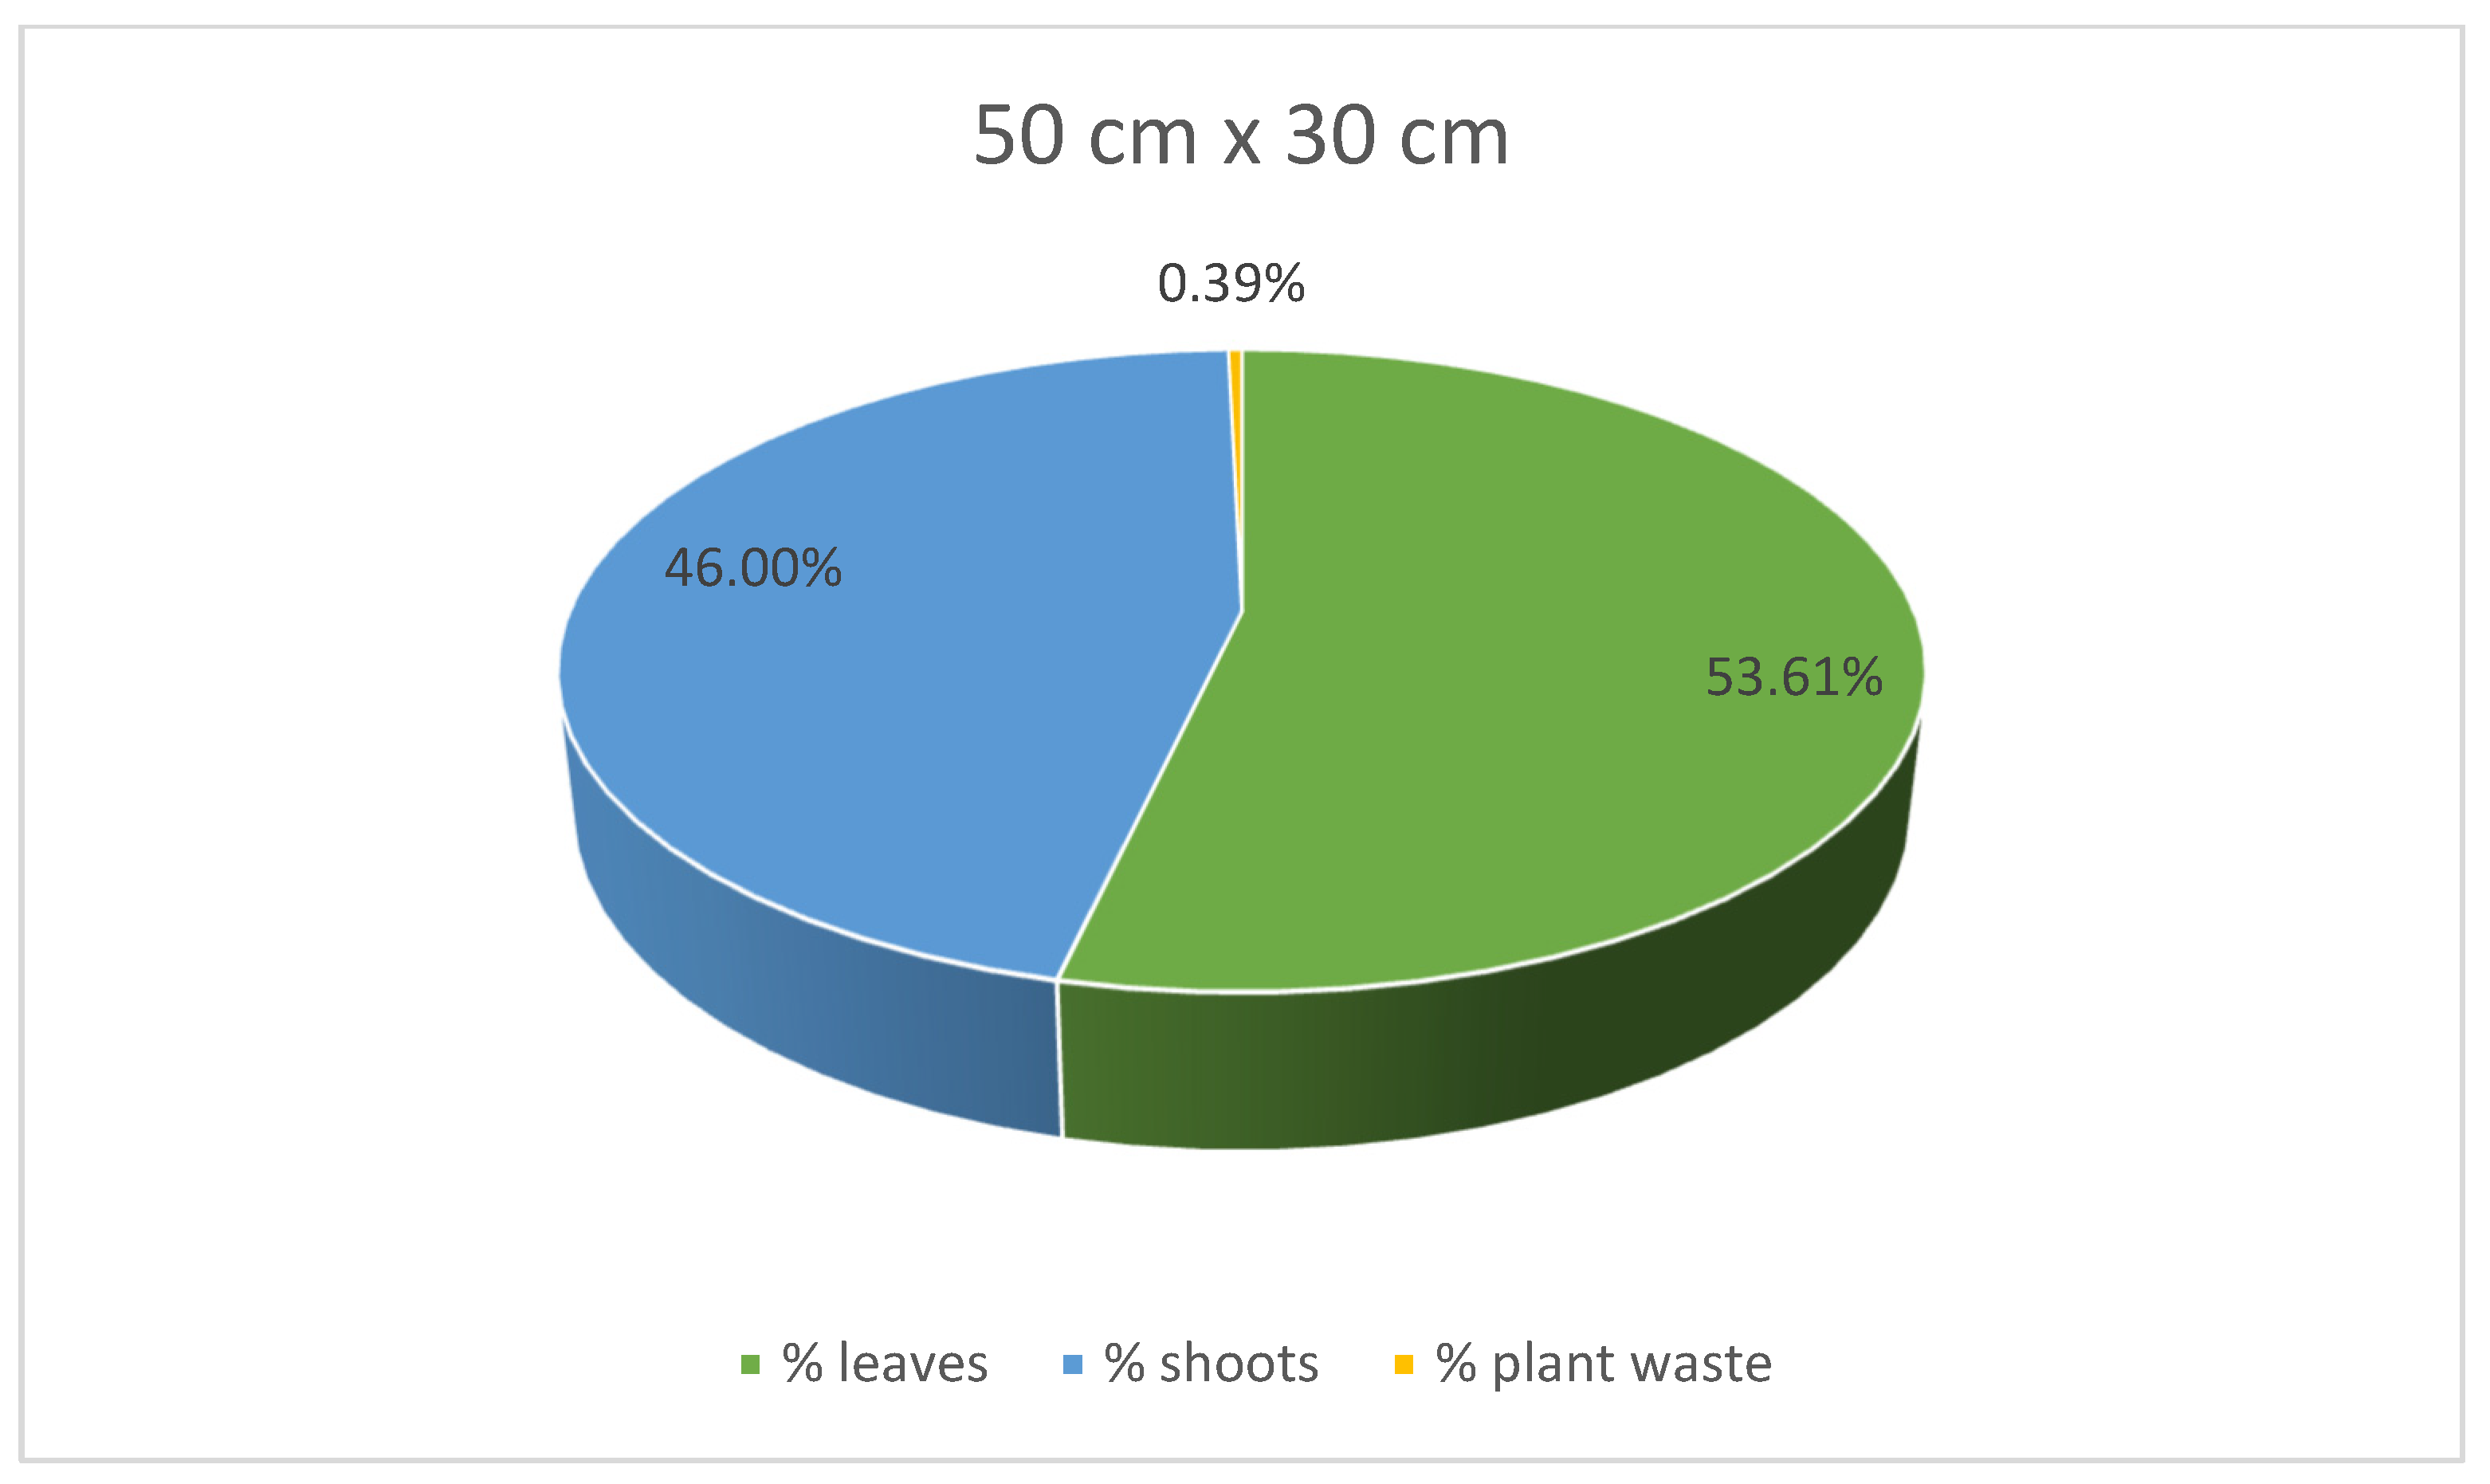
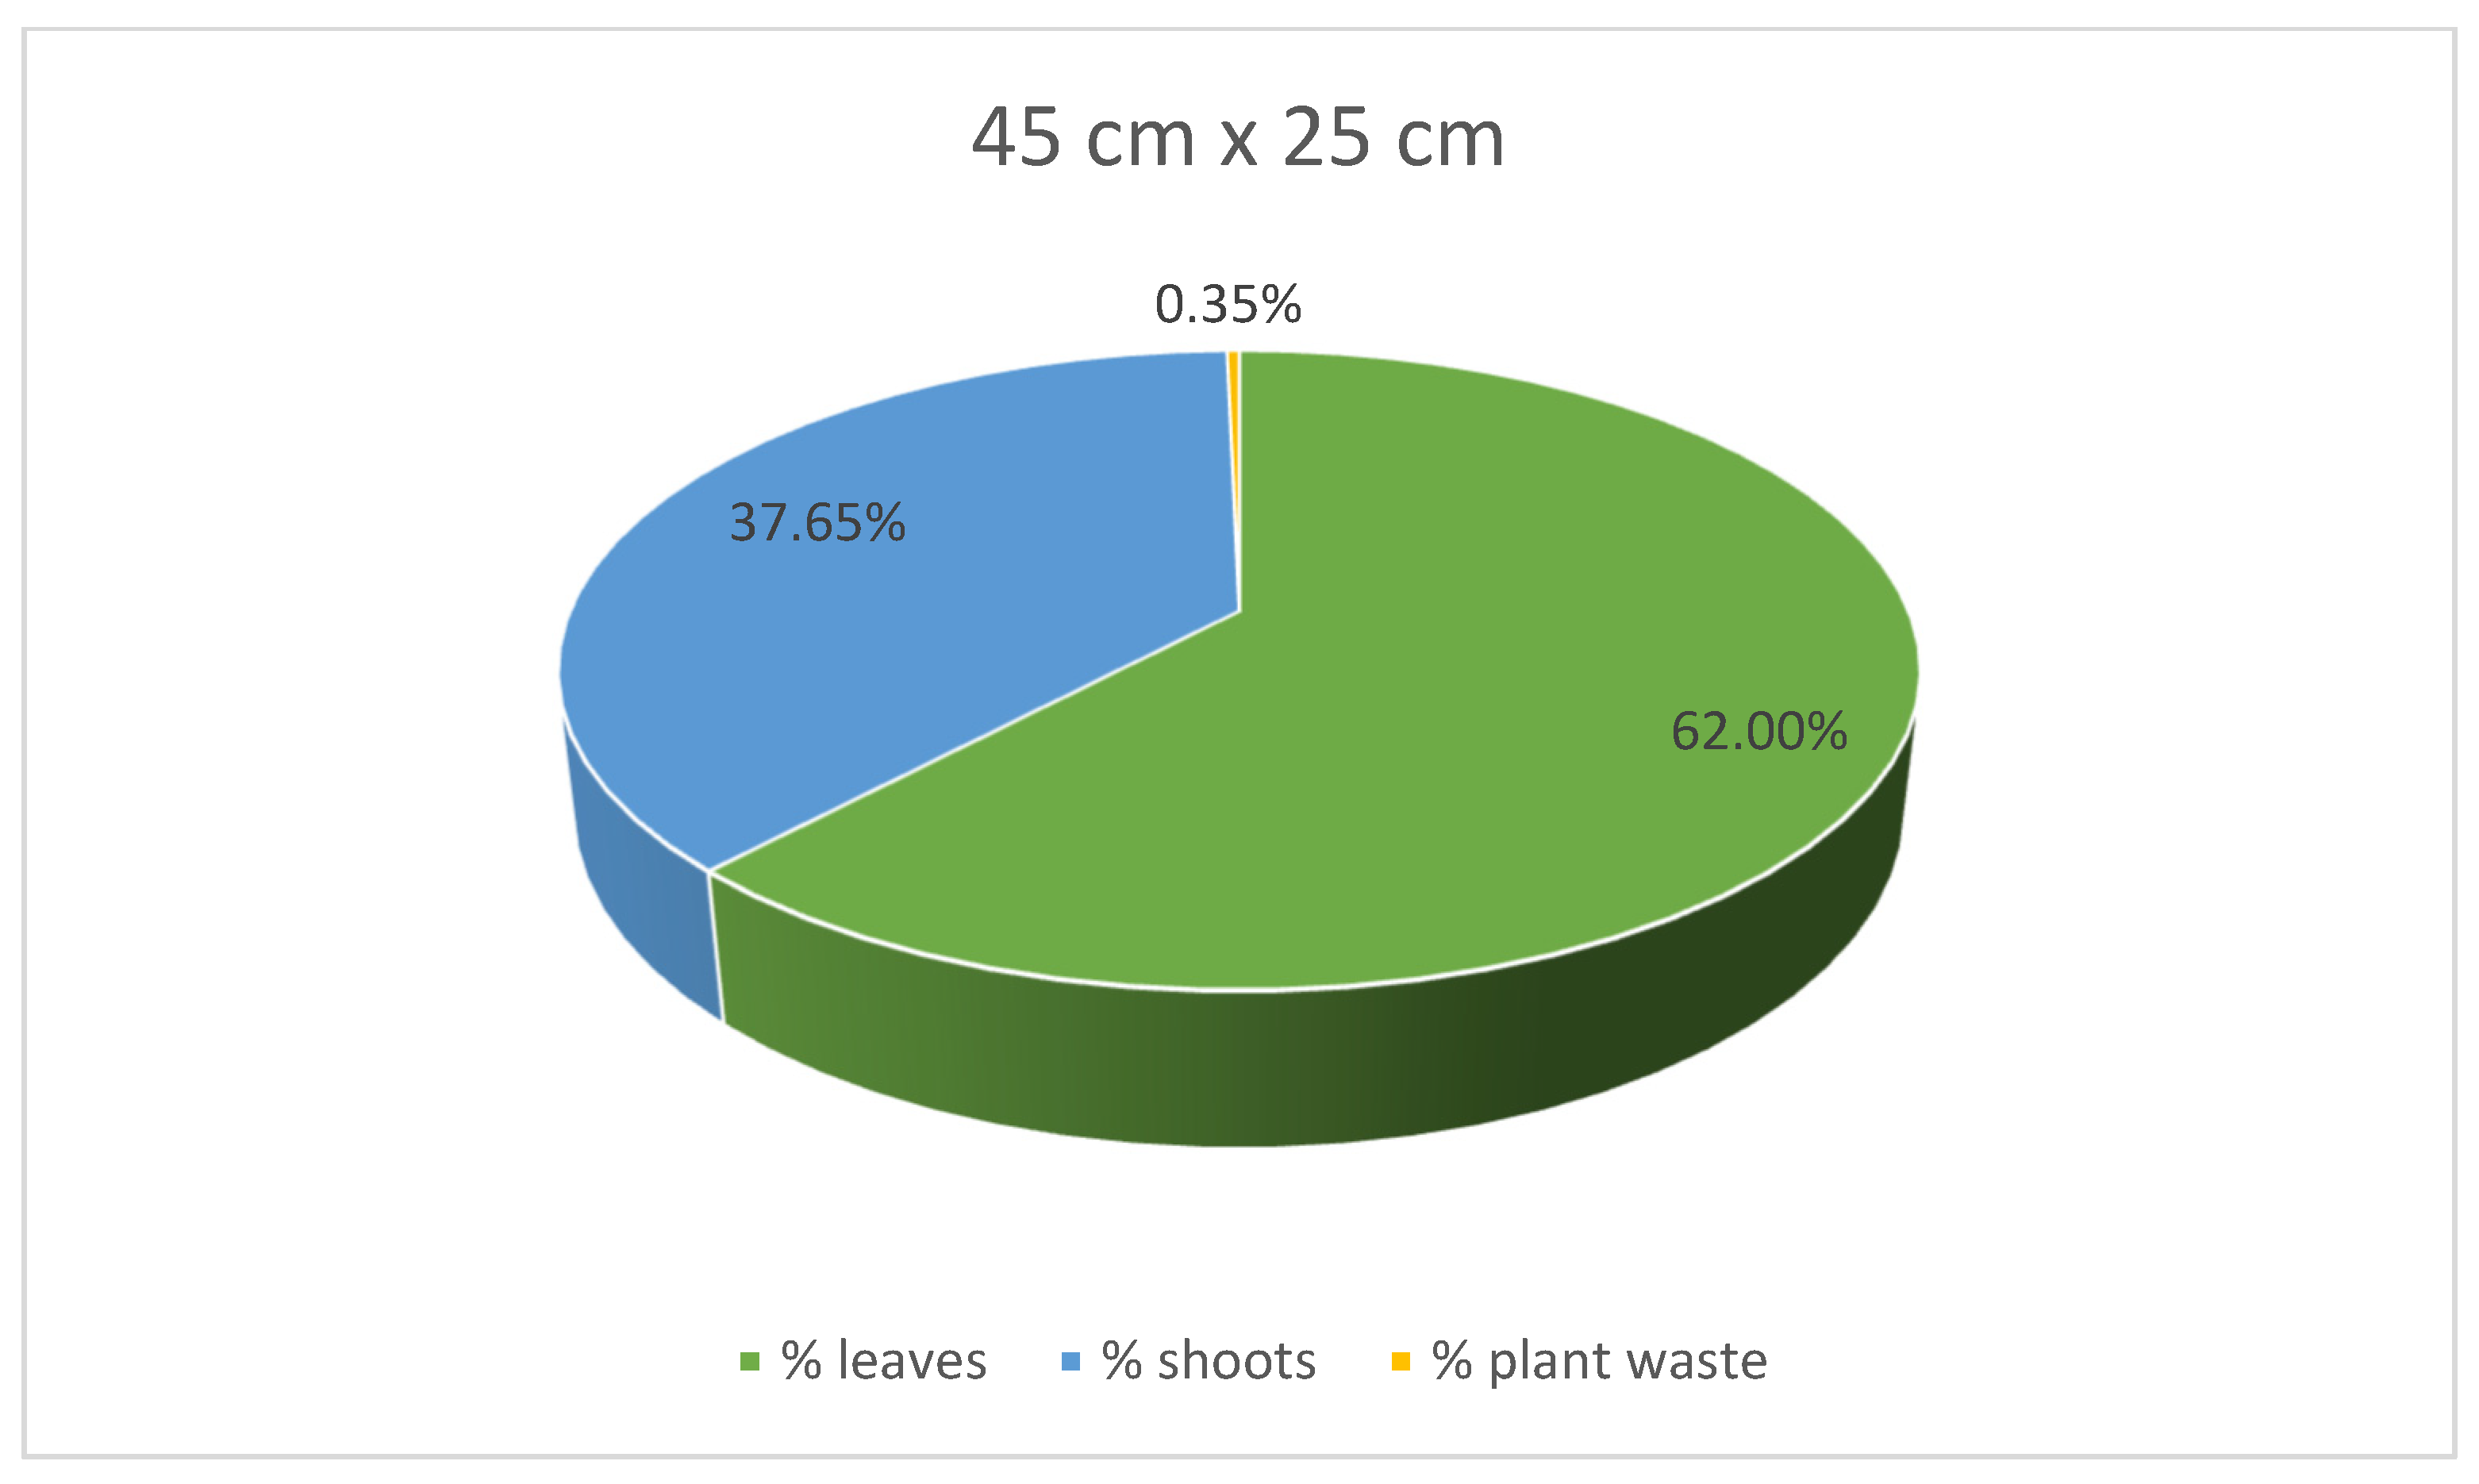
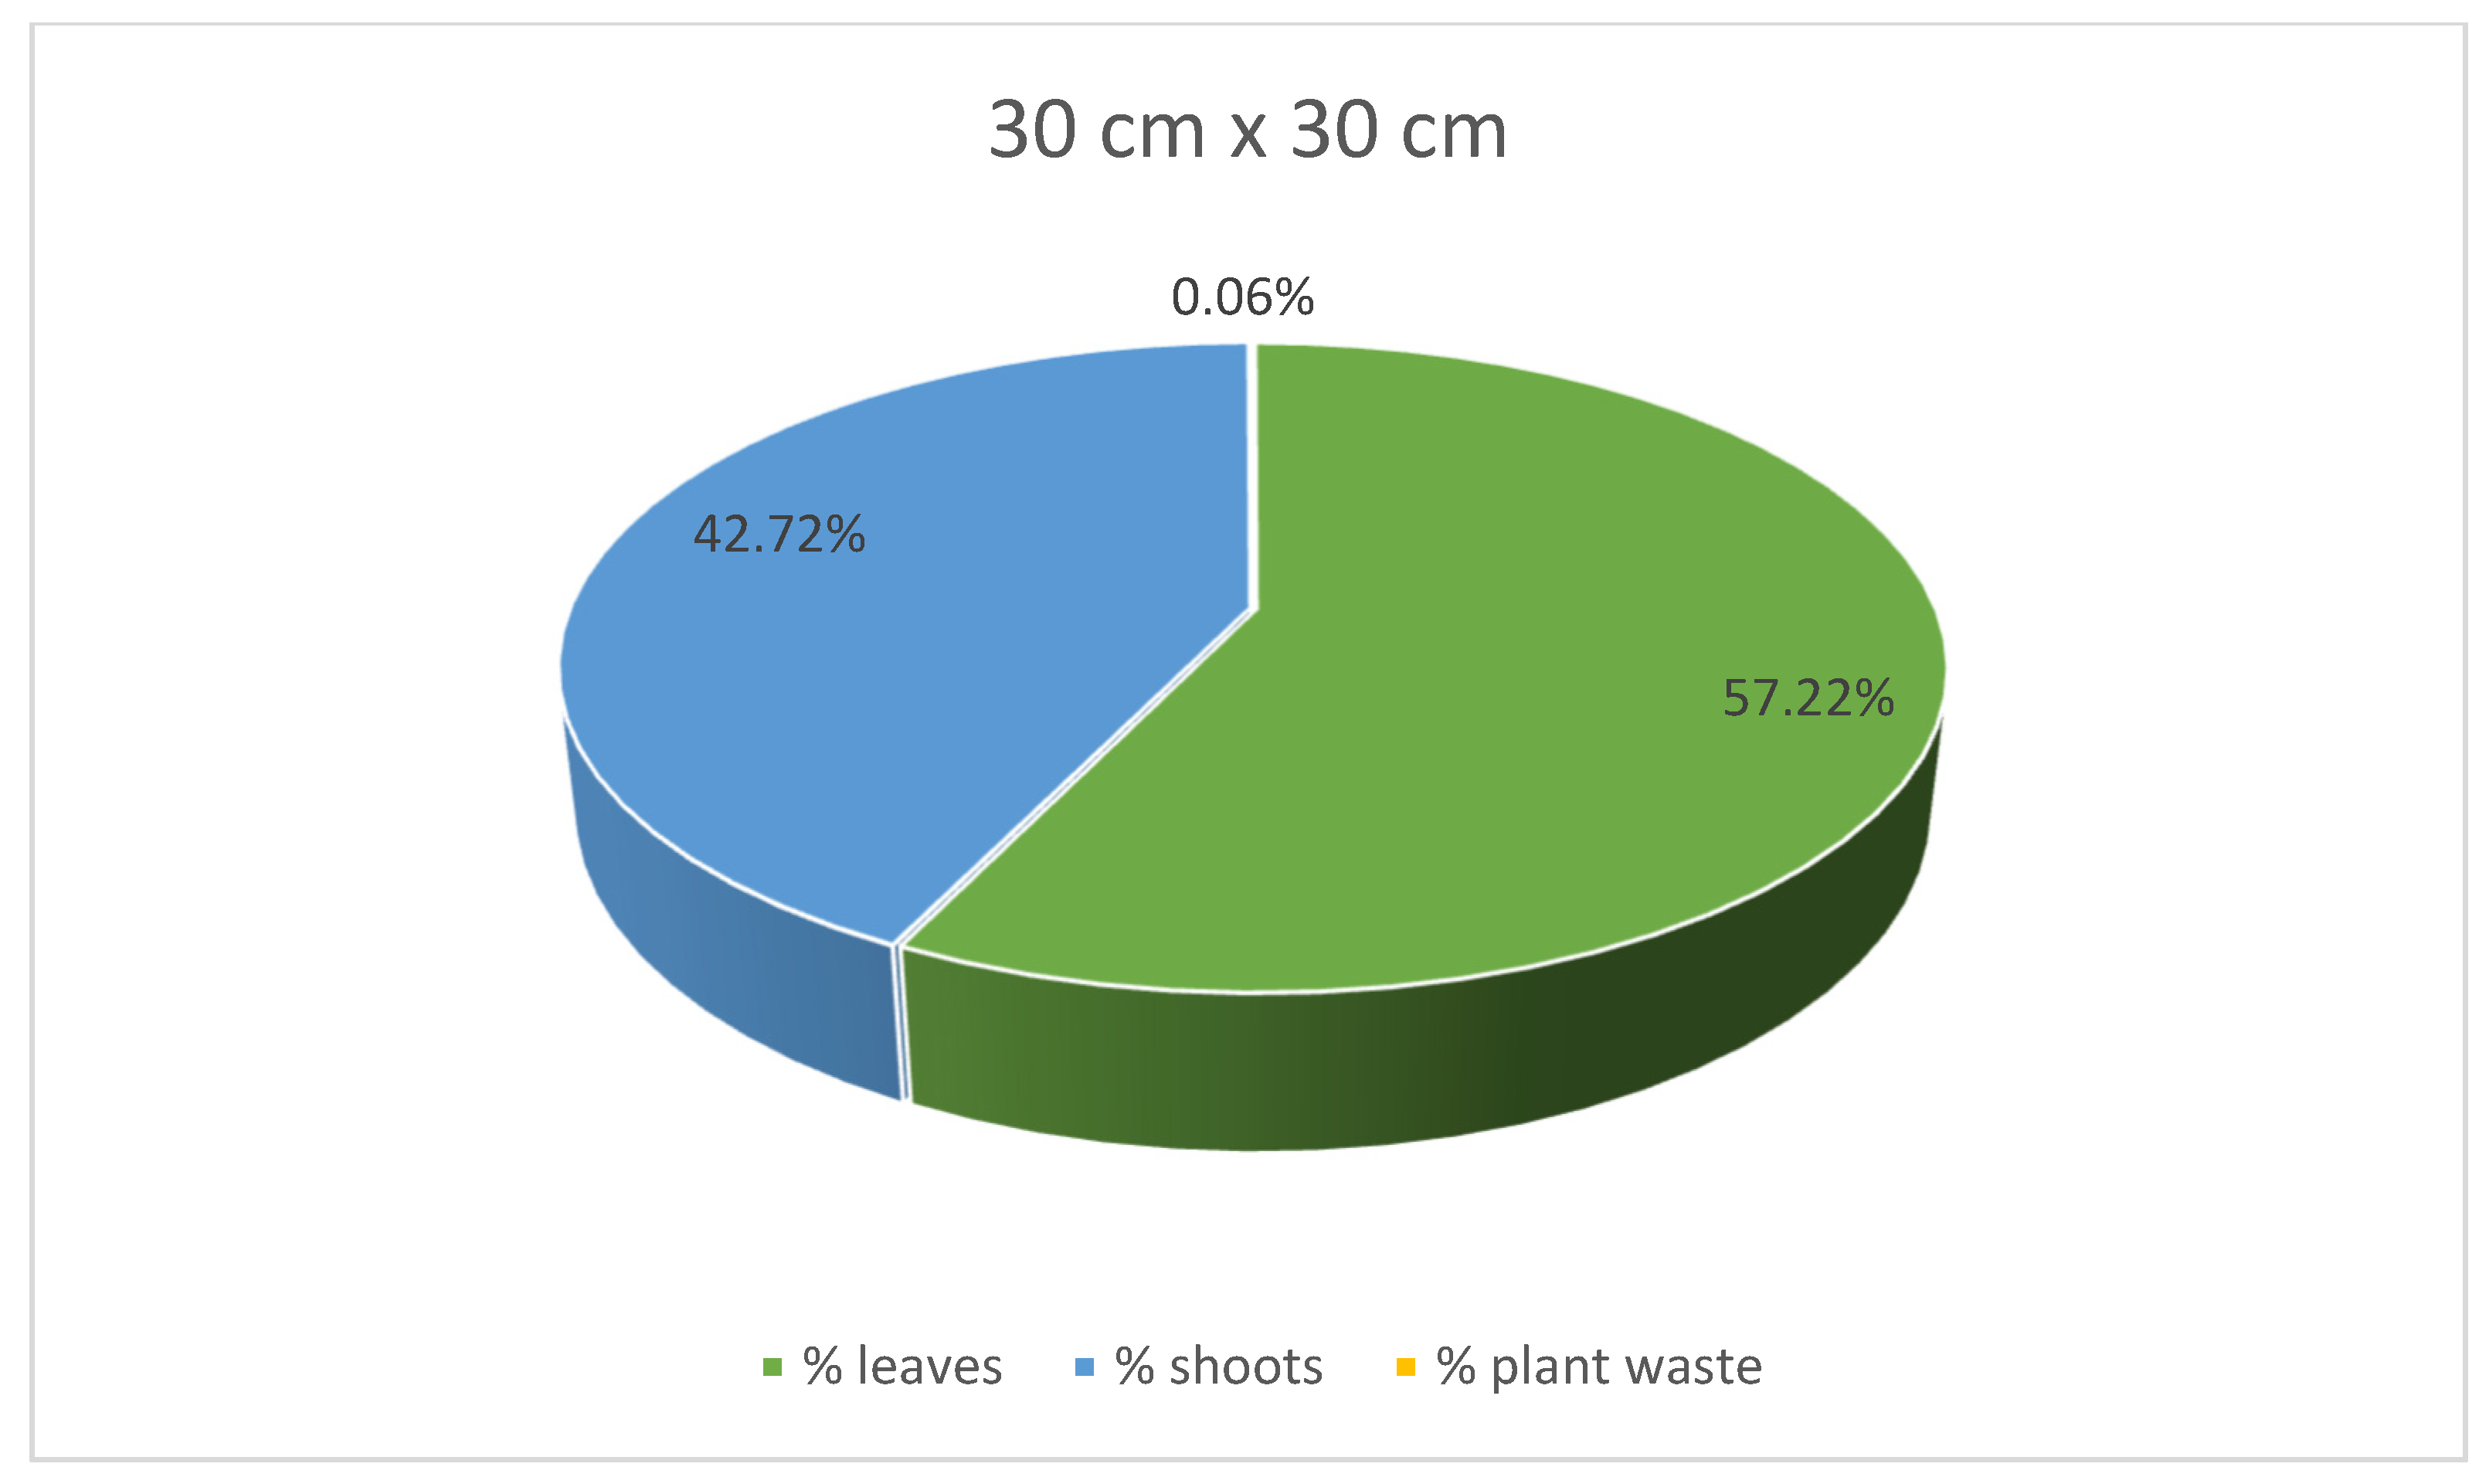
At the same time, stevia plants grown in spacings of 45 cm × 25 cm and 30 cm × 30 cm were characterised with lower mass for each plant compared to those grown in the spacing of 50 cm × 30 cm. Despite the greatest average weight of individual plants, leaves, and shoots of the stevia plants cultivated in spacing of 50 cm × 30 cm, the yield of the stevia plants grown in the spacing of 50 cm × 30 cm was lower than that of stevia plants grown in the spacings of 45 cm × 25 cm or 30 cm × 30 cm. Despite this difference, the yield of stevia shoots and plant waste was similar in all the analysed samples. Additionally, stevia plants grown in spacings of 45 cm × 25 cm and 30 cm × 30 cm exhibited a greater percentage of leaf weight in the total plant weight, with the highest percentage observed for the spacing of 45 cm × 25 cm, at 62.00%, compared to 53.61% for the spacing of 50 cm × 30 cm (Figure 3, Figure 4 and Figure 5).

Figure 3.
Contribution of various parts of the stevia plants (leaves, shoots and plant waste: dried and damaged leaves and shoots) in the total yield of stevia grown in the spacing of 50 cm × 30 cm.

Figure 4.
Contribution of various parts of the stevia plants (leaves, shoots and plant waste: dried and damaged leaves and shoots) in the total yield of stevia grown in the spacing of 45 cm × 25 cm.
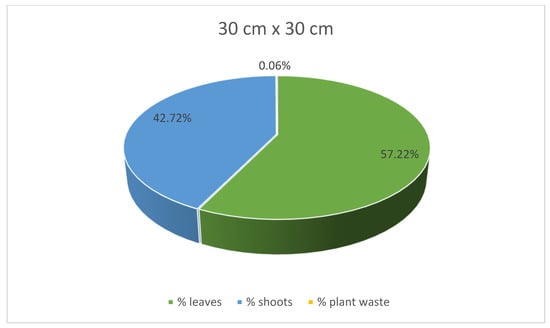
Figure 5.
Contribution of various parts of the stevia plants (leaves, shoots and plant waste: dried and damaged leaves and shoots) in the total yield of stevia grown in the spacing of 30 cm × 30 cm.
Analysis of biometric measurements (Table 3) conducted in July did not reveal any significant differences among stevia plants grown in different spacings. However, measurements taken in September indicated that the height of the plants and number of leaves on the lowest lateral shoot were still similar across all spacing variations, but the width and number of shoots on a single plant were lower in stevia plants grown in spacings of 45 cm × 25 cm and 30 cm × 30 cm.
Table 3.
Biometric measurements of stevia plants grown in different spacings.
Results of the analysis of elements and nitrates in the stevia leaves are shown in Table 4.
Table 4.
Concentration of nitrates and elements in the leaves of stevia plants grown in different spacings.
Stevia plants grown in the spacing of 30 cm × 30 cm exhibited the lowest concentration of nitrate ions in July (1003.1 mg·kg−1 f.m.) and in September (1073 mg·kg−1 f.m.). In contrast, stevia plants grown in spacings of 50 cm × 30 cm and 45 cm × 25 cm were characterized with a similar concentration of nitrate ions in July (1360.99 and 1343.82 mg·kg−1 f.m., respectively), but the concentration was higher in September for the stevia plants grown in the spacing of 50 cm × 30 cm (1856.18 mg·kg−1 f.m.). In July, the concentration of phosphorus was similar across all analysed samples (ranging from 117.50 to 134.58 mg·100 g−1 d.m.). However, in September, phosphorus concentration was highest in stevia plants grown in the spacing of 50 cm × 30 cm (234.17 mg·100 g−1 d.m.) and lowest in those grown in the spacing of 30 cm × 30 cm (155.69 mg·100 g−1 d.m.). Potassium concentration was greater in the samples harvested in September. Stevia grown at 50 cm × 30 cm spacing exhibited a higher concentration of potassium compared to other spacings. Calcium content was similar across all samples in September (835.31–888.18 mg·100 g−1 d.m.), while in July, the highest calcium concentration was detected in plants grown in the spacing of 50 cm × 30 cm and 45 cm × 25 cm (836.11–841.67 mg·100 g−1 d.m.). Stevia plants grown in the spacing of 30 cm × 30 cm had the lowest concentration of magnesium in July (143.89 mg·100 g−1 d.m.) and in September (156.94 mg·100 g−1 d.m.). The highest magnesium concentrations were found in plants grown in 45 cm × 25 cm and 50 cm × 30 cm spacings (166.11–168.89 mg·100 g−1 d.m. in July and 172.22–176.39 mg·100 g−1 d.m. in September).
The various kinds of spacings between stevia plants also affected the dry mass content, concentration of reducing sugars, concentration of vitamin C, and phenolic compounds in the leaves of stevia plants, as shown in Table 5.
Table 5.
Concentration of dry mass, reducing sugars, vitamin C and phenolic compounds in the leaves of stevia plants grown in different spacings.
The dry mass content was similar for all analysed samples in June (24.48–25.16%), but in September, it was highest in stevia plants grown in the spacing of 30 cm × 30 cm (28.67%). Despite this, stevia plants grown in the spacing of 30 cm × 30 cm exhibited the lowest concentration of reducing sugars (0.72% in July and 1.64%. in September), while those grown in the spacing of 50 cm × 30 cm were characterised with the highest concentration of sugars (1.42% in July and 2.48% in September). In July, the concentration of vitamin C was highest in stevia plants grown in the spacing of 45 cm × 25 cm (144.39 mg·100 g−1 f.m.), while in September, it was highest in those grown in the spacing of 50 cm × 30 cm (134.19 mg·100 g−1 f.m.). The total concentration of phenolic compounds varied significantly depending on plant spacing and the time of analysis. Stevia grown in the spacing of 30 cm × 30 cm was characterised with the highest concentration of phenolic compounds in July (202.11 mg·100 g−1 f.m.) compared to 176.86–187.61 mg·100 g−1 f.m. in plants grown in the spacing of 45 cm × 25 cm and 50 cm × 30 cm, which increased to 314.66 mg·100 g−1 f.m. in September.
The concentration of chlorophyll a + b (Table 6) was similar across all samples, ranging from 1.26 to 1.42 mg·g−1 f.m. in June and from 1.47 to 1.58 mg·g−1 f.m. in September. Statistical analysis did not show significant differences in carotenoid concentrations in stevia samples, with carotenoid content ranging from 2.68 to 2.80 mg·g−1 f.m. in July and from 2.83 to 3.07 mg·g−1 f.m. in September.
Table 6.
Concentration of chlorophylls and carotenoids in the leaves of stevia plants grown in different spacings.
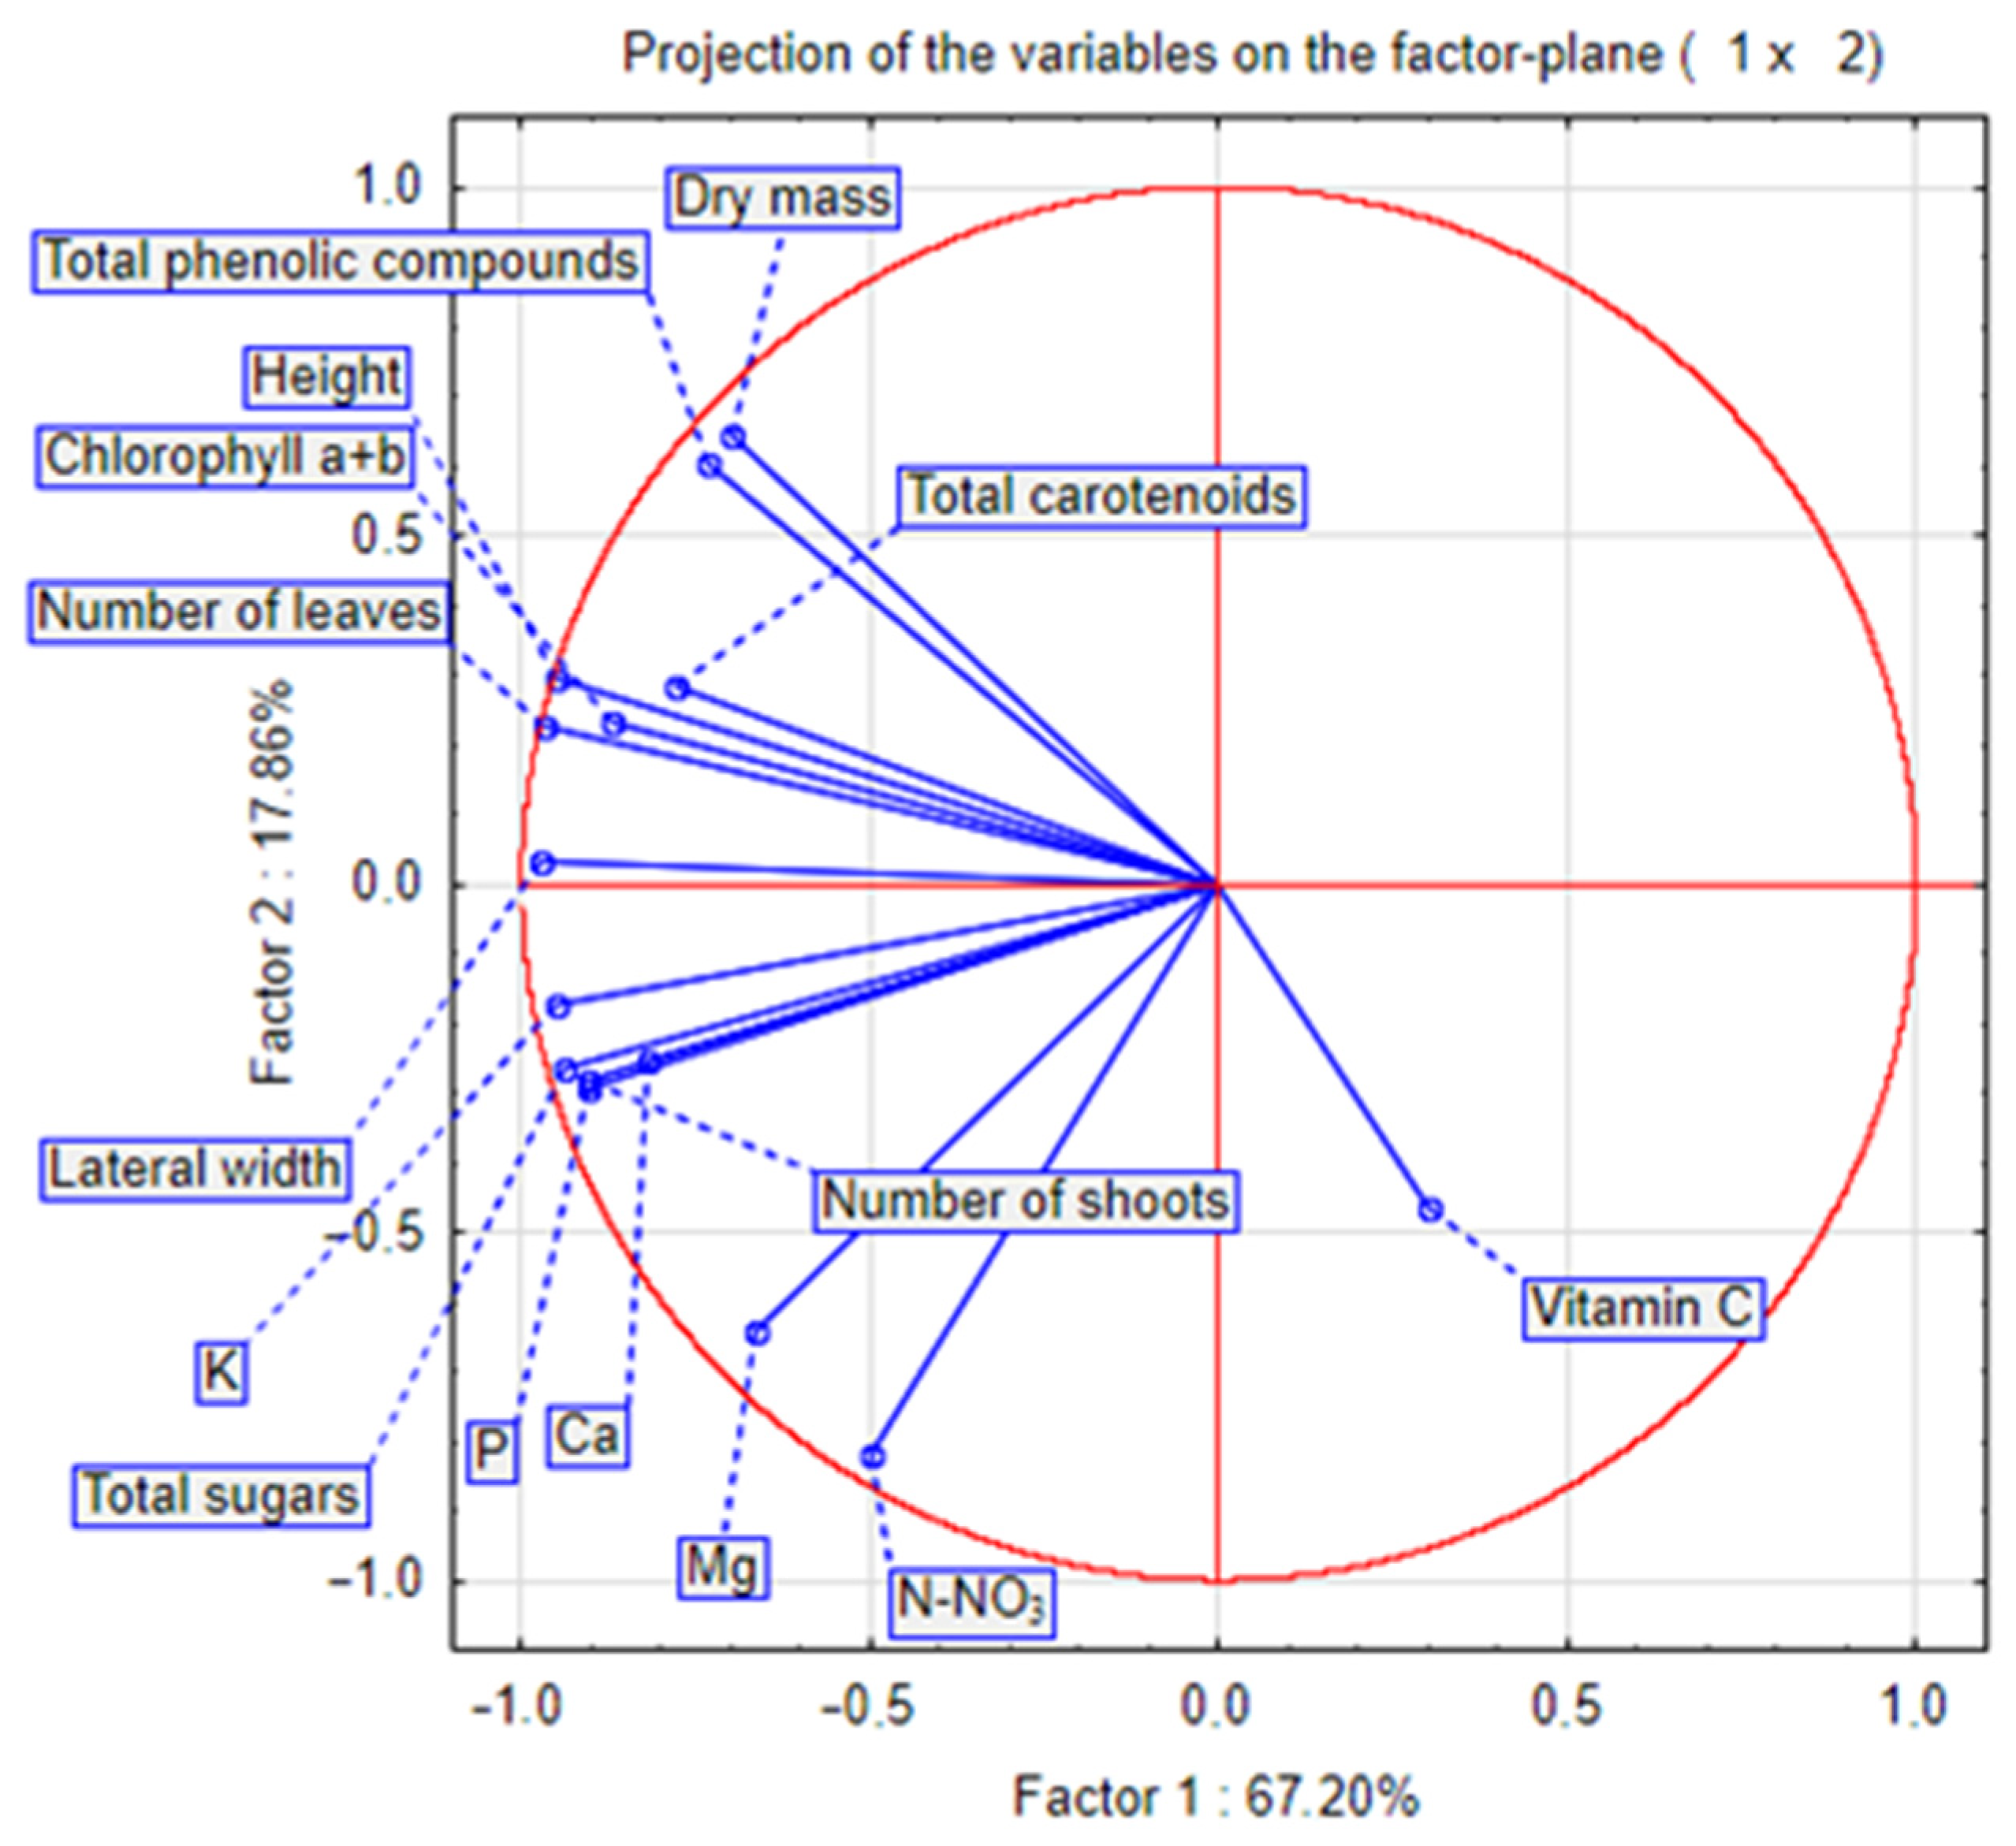
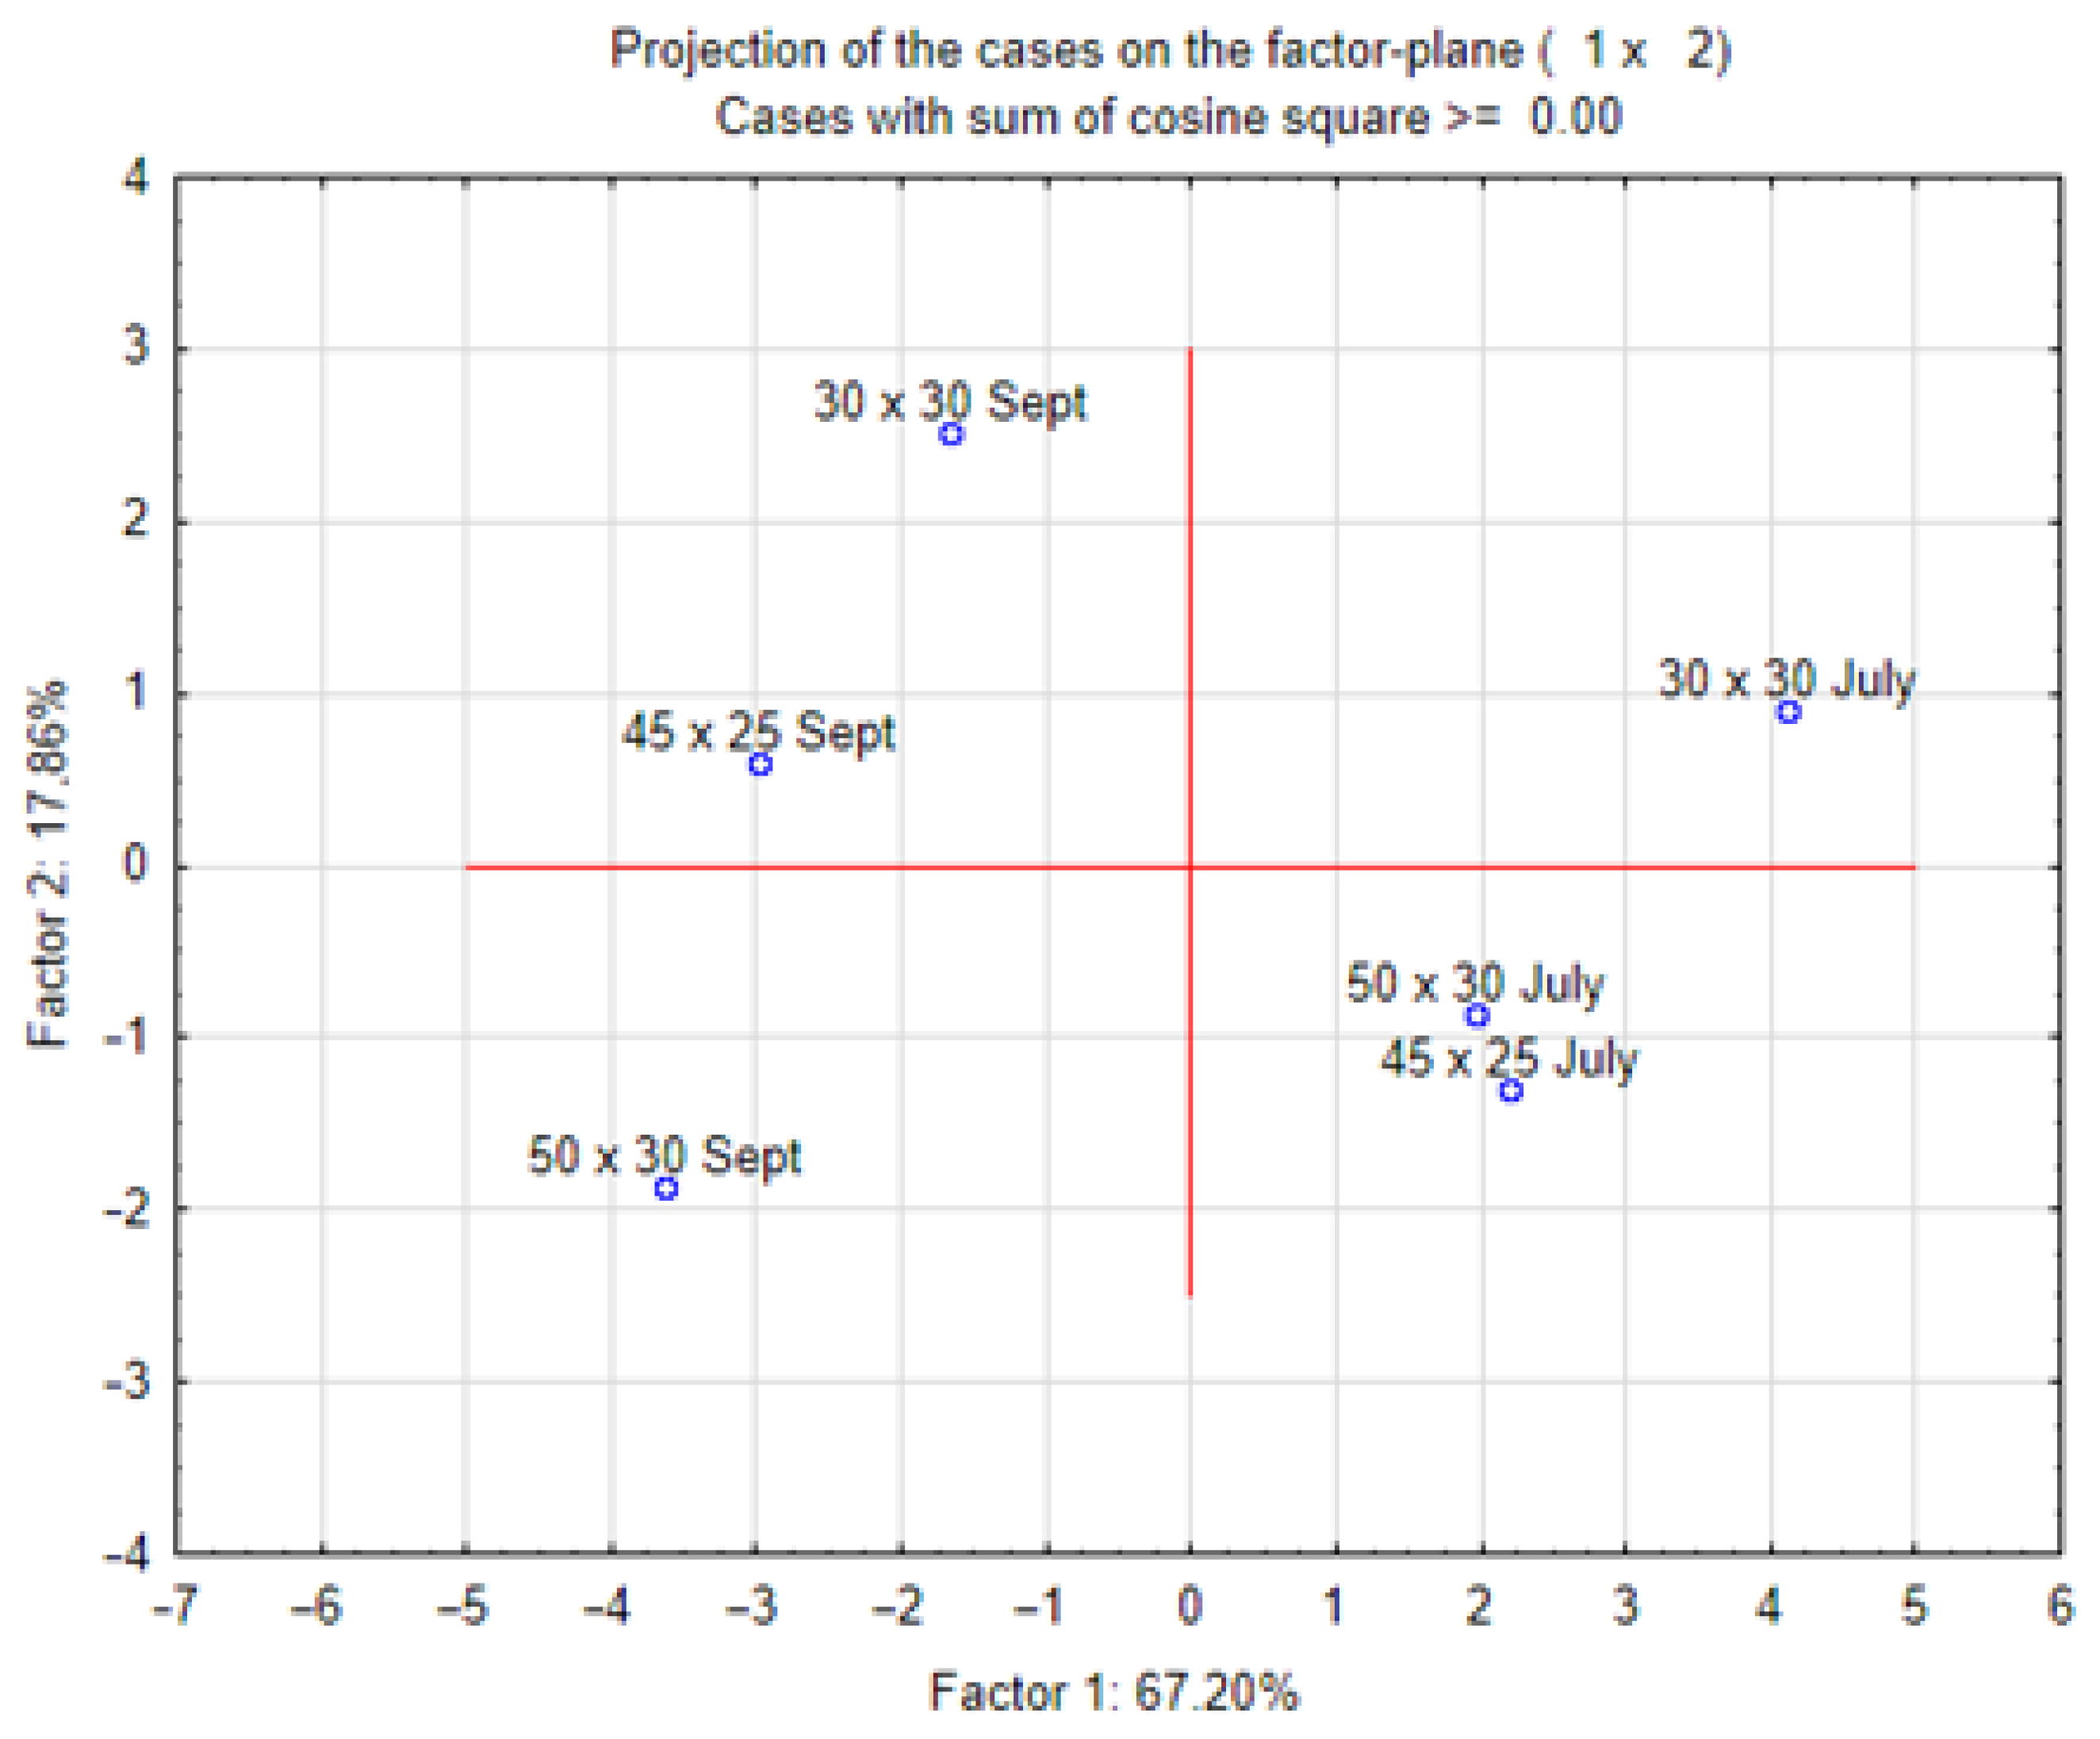
Figure 6 and Figure 7 show the results of the principal component analysis (PCA) of all analysed characteristics of stevia grown in different spacings. Dry mass content correlated positively with carotenoid content and negatively with vitamin C content. Plant height correlated with the number of leaves, and these biometric characteristics correlated positively with the concentration of chlorophyll and carotenoids. The number of shoots correlated with the concentration of potassium, calcium and phosphorus. The PCA results (Figure 7) show that in July, there were many similarities between stevia plants grown in spacings of 50 cm × 30 cm and 45 cm × 25 cm, but in September, different spacings had a greater influence on the differentiation of the characteristics of stevia.
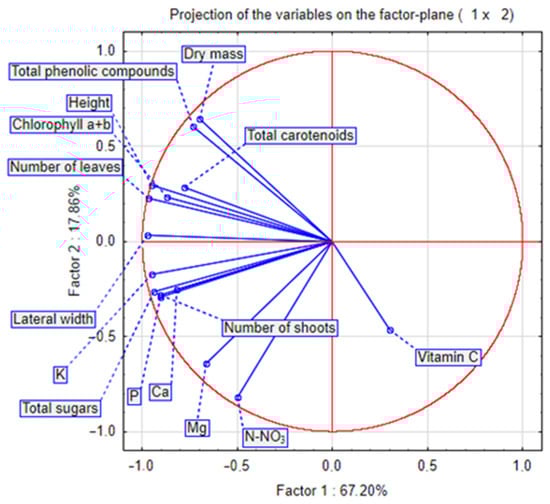
Figure 6.
PCA analysis chart for characteristics of stevia grown in different spacings.
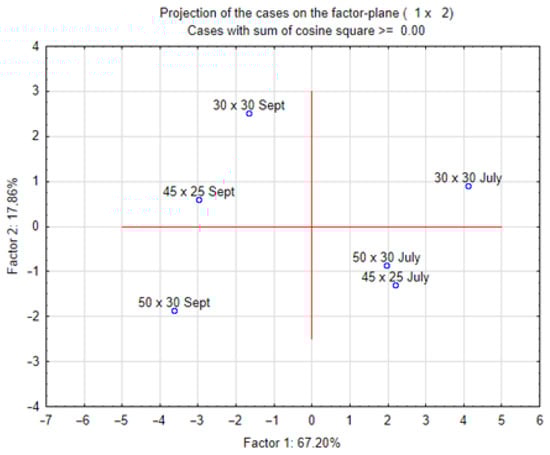
Figure 7.
Projection of results of PCA analysis for characteristics of stevia grown in different spacings.
4. Discussion
Kumar et al. [27] obtained similar results regarding plant height in a study where Stevia rebaudiana seedlings were planted in spacings of 30 cm × 30 cm and 45 cm × 30 cm, and different spacings used in this study did not affect plant height. However, in the study of Kumar et al. [27], stevia plants grown in the spacing of 30 cm × 30 cm had a higher number of shoots than those grown in the spacing of 45 cm × 30 cm, which was contrary to the results acquired in this study. Observations by Ramesh et al. [28] showed that with perennial cultivation, steviaroots extend over 30 cm from each side of the plant, suggesting that the spacing should be greater than 30 cm × 30 cm. However, studies by Tan et al. [29], Liu et al. [30] and Kumari et al. [31], where the spacing distance was 20 cm, did not show any adverse effects. Additionally, from a farmer’s perspective, the yield of stevia plants, especially the leaves, is most important, and smaller spacing positively affects total yield due to the greater number of plants per area. This was confirmed by various researchers, such as Tadesse et al. [32], Singh et al. [33] and Taleie et al. [34]. Both during intensive growth in July and before harvest in September, spacing did not significantly affect plant height, as confirmed by earlier studies on stevia by Kumar et al. [27,35] and on Chelidonium majus L. by Mordalski et al. [36]. Spacing affected the number of shoots formed by the plants, which was particularly noticeable at the end of the stevia cultivation period. However, Kumar et al. [27] observed a different effect, with a 20% increase in shoot number for stevia plants grown at a spacing of 30 cm × 30 cm. In a subsequent study, Kumar et al. [37] found a greater number of shoots in plants grown at 45 cm × 45 cm spacing compared to those grown at 30 cm × 30 cm, 45 cm × 30 cm, and 60 cm × 45 cm spacings. A study on the nitrogen fertilization of stevia plants in Poland by Śniegowska et al. [38] showed that stevia plants grown with various nitrogen fertilization rates (50, 100 or 150 kg of N per hectare, in the form of ammonium nitrate, ammonium sulfate or urea) in the spacing of 45 cm × 20 cm had an average height of 57.86 cm, which was similar to the height of plants grown in the spacing of 50 cm × 30 cm of this study. The lateral width of unfertilized stevia plants grown by Śniegowska et al. [38] was 26.61 cm, which was comparable to the lateral width of the stevia grown in spacings of 30 cm × 30 cm and 45 cm × 25 cm. The number of shoots in stevia plants grown in spacings of 50 cm × 30 cm and 45 cm × 25 cm was greater than the average number of shoots (10.97) in the study of Śniegowska et al. [38]. However, plants in the nitrogen fertilization study had a greater average number of leaves on the lowest lateral shoot (29.21) than those grown in different spacings. In the study of Büyük et al. [39], stevia plants grown in the spacing of 70 cm × 33 cm in Turkey had an average height of 68.1 cm, which was significantly greater than the height of stevia plants grown in different spacings in Poland. Additionally, the plants in Büyük et al. [39] were also characterised by a greater number of shoots, averaging 20.4 per plant. Unlike biometric measurements, different spacings significantly influenced the chemical composition of stevia leaves during two periods: in July, during intensive growth, and in September prior to harvest. Different authors have not analysed the influence of plant spacing on the concentration of various components in the stevia leaves. In other plants, such as Sorghum saccharatum (L.) Moench, changes in spacing have not significantly influenced the mineral concentrations in plant tissues [40]. Similar results were noted for Columbus grass (Sorghum almum stapf) [41]. However, the plant variety can greatly impact the influence of plant variety on the concentration of elements. For example, in a study on broccoli by Grabowska et al. [42], the phosphorus content was greatest in the plants grown with the largest spacing, which was similar to the finding in this study about stevia plants. In the study by Büyük [39], stevia plants had an average phosphorus level similar, though slightly lower (0.27%), to the concentration in stevia plants grown in the spacing of 50 cm × 30 cm. However, the total potassium content in plants analysed by Büyük [39] was almost two times lower than the content of potassium in the stevia plants grown in Poland. The stevia plants analysed by Śniegowska et al. [38] had similar potassium concentrations. However, the phosphorus content of stevia plants grown by Śniegowska et al. [38] was similar to that in plants grown in spacings of 45 cm × 25 cm and 30 cm × 30 cm, but it was lower than in stevia plants grown in the spacing of 50 cm × 30 cm. This suggests that plant spacing could affect the total concentration of phosphorus in stevia plants. Different results were seen in the concentration of calcium and magnesium. The average concentration of these elements in stevia plants grown in the study by Śniegowska et al. [38] was 20–25% higher. Additionally, plant spacing can affect the root system, influencing nitrate capture, which might explain why stevia plants grown at the largest spacing (50 cm × 30 cm) had the highest nitrate content [43]. However, stevia plants grown by Śniegowska et al. [38] had similar nitrate concentrations to those grown in the spacing of 30 cm × 30 cm and lower than those grown in the spacing of 50 cm × 30 cm. This suggests that it may not be the plant spacing directly but the availability of nitrogen that influences nitrate concentration, as nitrogen fertilization was applied per area, not per plant, giving plants in larger spacings access to more fertilized soil. Currently, there are no data on the influence of plant spacing on the concentration of phenolic compounds or vitamin C in stevia plants, but similar analyses have been performed on other species. For example, a study by Riad et al. [44] on cabbage (Brassica oleracea L. var. capitata) found that various planting densities (four, six and eight plants per square meter) did not significantly affect the concentration of phenolic compounds or vitamin C. However, a study by Mujahid and Gupta [45] on the Lactuca sativa showed that denser planting resulted in a lower concentration of vitamin C and carotenoids. Similar results were noted for stevia, where in September, plants grown in the smallest spacing (30 cm × 30 cm) had lower vitamin C concentrations than those grown in the 50 cm × 30 cm spacing. The study by Śniegowska et al. [38] on stevia plants grown with different nitrogen fertilization showed that the plants had phenolic compound concentrations similar to those in plants grown at spacings of 50 cm × 30 cm and 45 cm × 25 cm. The stevia plants also had similar vitamin C content to those in the spacing of 50 cm × 30 cm. Carotenoid and chlorophyll (a + b) concentrations were not affected by plant spacing, which was similar to findings in garlic cultivation described by Rekowska and Skupień [46]. This results contrast with a study by Ren et al. [47] on maize, where increasing planting density increased the concentration of carotenoids, but it did not significantly impact chlorophyll concentration at the time of harvest. The dry mass content of stevia leaves was similar in July, but before harvest, plants grown in the spacing of 30 cm × 30 cm had higher dry mass content. A meta-analysis by Postma et al. [48] over hundreds of plant species has shown that it is a typical phenomenon during plant cultivation. All these results indicate that different spacings of stevia plants can significantly impact the quality of the plant material. It is important, however, to note that the main goal for stevia plantation is to achieve the greatest yield of high-quality leaves, which was determined in spacings of 30 cm × 30 cm and 45 cm × 25 cm.
5. Conclusions
The study showed that the spacing of stevia plants significantly influences the yield and chemical composition of stevia leaves. Data gathered in this study indicate that by adjusting the spacing of the stevia plants grown in Poland, both the final chemical composition of the plant material and yield might be modified. The greatest plant and leaf weight per plant were observed in stevia planted at a spacing of 50 cm × 30 cm, while the highest total yield (including both plants and leaves) was recorded for stevia plants grown at spacings of 45 cm × 25 cm and 30 cm × 30 cm. These spacings also had the highest percentage of leaves in the total plant weight and yield. In July, no significant differences in the biometric measurements were observed regardless of the spacing used. However, in September, a notable difference was observed for stevia plants grown in the spacing of 50 cm × 30 cm, which had the largest width and number of shoots. Differences in spacing had no effect on the height of the plants or the average amount of leaves per shoot. Stevia plants grown in the smallest spacing (30 cm × 30 cm) were characterised with the greatest concentration of dry mass and phenolic compounds, though the smaller number of plants per unit area (spacing of 50 cm × 30 cm) resulted in an increased content of various elements and nitrate ions in stevia leaves. Considering all the analysed parameters, the spacing of 45 cm × 25 cm is recommended due to its high yield and large percentage of leaves, indicating its good quality.
Author Contributions
Conceptualization, A.B. and J.Ś.; methodology, A.B. and J.Ś.; software, J.Ś.; validation, A.B. and J.Ś.; formal analysis, J.Ś.; investigation, J.Ś.; resources, A.B.; data curation, J.Ś.; writing—original draft preparation, J.Ś.; writing—review and editing, A.B. and J.Ś.; supervision, A.B.; project administration, A.B.; funding acquisition, A.B. All authors have read and agreed to the published version of the manuscript.
Funding
The article is part of a PhD dissertation titled ‘The effect of selected agronomic factors on growth, yielding and chemical composition of Stevia rebaudiana Bert.’, prepared during Doctoral Studies at the Wrocław University of Environmental and Life Sciences. The APC is financed by Wrocław University of Environmental and Life Sciences.
Institutional Review Board Statement
Not applicable.
Informed Consent Statement
Not applicable.
Data Availability Statement
Data are available from authors on a reasonable request.
Conflicts of Interest
The authors declare no conflicts of interest.
References
- Kulczyński, B.; Gramza-Michałowska, A.; Człapka-Matyasik, M. Dietary characteristics of Stevia- current state of knowledge. Bromat. Chem. Toksykol. 2015, 47, 11–18. [Google Scholar]
- Bugaj, B.; Leszczyńska, T.; Pysz, M.; Kopeć, A.; Pacholarz, J.; Pysz-Izdebska, K. Profile and pro-health properties of Stevia rebaudiana Bertoni. Żywn. Nauka. Technol. Jakość. 2013, 3, 27–38. [Google Scholar]
- Bastaki, S. Pharmacotherapy of nonnutritive sweeteners in diabetes mellitus. Int. J. Diabetes Metab. 2015, 23, 11–22. [Google Scholar] [CrossRef]
- Sharangi, A.B.; Bhutia, P.H. Stevia: Medicinal Miracles and therapeutic magic. Int. J. Crop Sci. Technol. 2016, 2, 45–59. [Google Scholar]
- Ferreira, E.B.; Neves, F.D.A.R.; da Costa, M.A.D.; do Prado, W.A.; Ferri, L.D.A.F.; Bazotte, R.B. Comparative effects of Stevia rebaudiana leaves and stevioside on glycaemia and hepatic gluconeogenesis. Planta Med. 2006, 72, 691–696. [Google Scholar] [CrossRef]
- Aswar, U.; Gogawale, V.; Miniyar, P.; Patil, Y. Beneficial effects of Stevioside on AGEs, blood glucose, lipid profile and renal status in streptozotocin-induced diabetic rats. J. Appl. Biomed. 2019, 17, 190–197. [Google Scholar] [CrossRef] [PubMed]
- Marcinek, K.; Krejpcio, Z. Stevia rebaudiana Bertoni: Health promoting properties and therapeutic applications. J Verbrauch Leb. 2016, 11, 3–8. [Google Scholar] [CrossRef]
- Mohd-Radzman, N.H.; Ismail, W.I.W.; Jaapar, S.S.; Adam, Z.; Adam, A. Stevioside from Stevia rebaudiana Bertoni increases insulin sensitivity in 3T3-L1 adipocytes. Evid.-Based Complement. Altern. Med. 2013, 2013, 938081. [Google Scholar] [CrossRef]
- Saravanan, R.; Vengatash Babu, K.; Ramachandran, V. Effect of Rebaudioside A, a diterpenoid on glucose homeostasis in STZ-induced diabetic rats. J. Physiol. Biochem. 2012, 68, 421–431. [Google Scholar] [CrossRef]
- Khatun, M.C.S.; Muhit, M.A.; Hossain, M.J.; Al-Mansur, M.A.; Rahman, S.A. Isolation of phytochemical constituents from Stevia rebaudiana (Bert.) and evaluation of their anticancer, antimicrobial and antioxidant properties via in vitro and in silico approaches. Heliyon 2021, 7, e08475. [Google Scholar] [CrossRef]
- Atas, M.; Eruygur, N.; Ucar, E.; Ozyigit, Y.; Turgut, K. The Effects of different nitrogen doses on antioxidant and antimicrobial activity of Stevia (Stevia rebaudiana Bert.). Cell Mol. Biol. 2018, 64, 39–45. [Google Scholar] [CrossRef] [PubMed]
- Vishvakarma, P.; Mandal, S.; Pandey, J.; Bhatt, A.K.; Banerjee, V.B.; Gupta, J.K. An Analysis of the Most Recent Trends in Flavoring Herbal Medicines in Today’s Market. J. Pharm Negat. Results 2022, 13, 9189–9198. [Google Scholar]
- Williamson, E.M.; Liu, X.; Izzo, A.A. Trends in use, pharmacology, and clinical applications of emerging herbal nutraceuticals. Br. J. Pharmacol. 2020, 177, 1227–1240. [Google Scholar] [CrossRef] [PubMed]
- Jadhav, C.A.; Vikhe, D.N.; Jadhav, R.S. Global and domestic market of herbal medicines: A review. Res. J. Sci. Technol. 2020, 12, 327–330. [Google Scholar] [CrossRef]
- Samuel, P.; Ayoob, K.T.; Magnuson, B.A.; Wölwer-Rieck, U.; Jeppesen, P.B.; Rogers, P.J.; Rowland, I.; Mathews, R. Stevia Leaf to Stevia Sweetener: Exploring Its Science, Benefits, and Future Potential. J. Nutr. 2018, 148, 1186S–1205S. [Google Scholar] [CrossRef] [PubMed]
- Enthoven, L.; Van den Broeck, G. Local food systems: Reviewing two decades of research. Agric. Syst. 2021, 193, 103226. [Google Scholar] [CrossRef]
- Li, M.; Jia, N.; Lenzen, M.; Malik, A.; Wei, L.; Jin, Y.; Raubenheimer, D. Global food-miles account for nearly 20% of total food-systems emissions. Nat. Food 2022, 3, 445–453. [Google Scholar] [CrossRef] [PubMed]
- Peake, A.S.; Bell, K.L.; Fischer, R.A.; Gardner, M.; Das, B.T.; Poole, N.; Mumford, M. Cultivar × management interaction to reduce lodging and improve grain yield of irrigated spring wheat: Optimising plant growth regulator use, N application timing, row spacing and sowing date. Front. Plant Sci. 2020, 11, 401. [Google Scholar] [CrossRef] [PubMed]
- Haegele, J.W.; Becker, R.J.; Henninger, A.S.; Below, F.E. Row arrangement, phosphorus fertility, and hybrid contributions to managing increased plant density of maize. Agron. J. 2014, 106, 1838–1846. [Google Scholar] [CrossRef]
- Craine, J.M.; Dybzinski, R. Mechanisms of plant competition for nutrients, water and light. Funct. Ecol. 2013, 27, 833–840. [Google Scholar] [CrossRef]
- PN-90/A-75101/03:1990; Determination of Dry Matter Content. The Polish Committee for Standardization: Warsaw, Poland, 1990.
- PN-90/A-75101/11; Determination of Vitamin C Content. The Polish Committee for Standardization: Warsaw, Poland, 1990.
- Rumińska, A.; Suchorska, K.; Węglarz, Z. Medicinal and Special Plants; SGGW-AR: Warszawa, Poland, 1990. [Google Scholar]
- PN-90/A-75101/07:1990; Determination of Sugar Content. The Polish Committee for Standardization: Warsaw, Poland, 1990.
- Slinghart, K.; Singleton, V.L. Total phenol analysis: Automation and comparison with manual method. Am. J. Enol. Vitic. 1977, 28, 49–55. [Google Scholar] [CrossRef]
- Nowosielski, O. Methods for Determining Fertilizer Requirements; PWRiL: Warszawa, Poland, 1974; pp. 1–91. [Google Scholar]
- Kumar, R.; Sood, S.; Sharma, S.; Kasana, R.C.; Pathania, V.L.; Singh, B.; Singh, R.D. Effect of plant sparing and organic mulch on growth, yield and quality of natural sweetener plant Stevia and soil fertility in western Himalayas. Int. J. Plant Prod. 2014, 8, 311–334. [Google Scholar]
- Ramesh, K.; Singh, V.; Megeji, N.W. Cultivation of Stevia [Stevia rebaudiana (Bert.) Bertoni]: A comprehensive review. Adv. Agron. 2006, 89, 137–177. [Google Scholar] [CrossRef]
- Tan, S.L.; Muhammad Ghawas, M.; Mohamad Najib, M.Y.; Zawayi, M. Preliminary evaluation and selection of stevia under Malaysian conditions. J Trop. Agric. Food Sci. 2008, 36, 171–177. [Google Scholar]
- Liu, X.; Ren, G.; Shi, Y. The effect of organic manure and chemical fertilizer on growth and development of Stevia rebaudiana Bertoni. Energy Procedia 2011, 5, 1200–1204. [Google Scholar] [CrossRef]
- Kumari, S.; Ghosh, G.; Meshram, M.R. TSS, yield and energetics of stevia as influenced by nitrogen levels and spacing under eastern UP conditions. Agric. Sci. Dig. 2021, 41, 319–323. [Google Scholar] [CrossRef]
- Tadesse, N.; Gebere, A.; Lulie, B.; Hordofa, M. Influence of plant population density on growth and yield of Stevia (Stevia rebaudiana Bertoni L.) at Wondo Genet South Ethiopia. Acad. Res. J. Agri. Sci. Res. 2016, 4, 321–329. [Google Scholar] [CrossRef]
- Singh, B.; Singh, J.; Kaur, A. Agro-production, processing and utilization of Stevia rebaudiana as natural sweetener. J. Agric. Eng. Food Technol. 2014, 1, 28–31. [Google Scholar]
- Taleie, N.; Hamidoghli, Y.; Rabiei, B.; Hamidoghli, S. Effects of plant density and transplanting date on herbage, stevioside, phenol and flavonoid yield of Stevia rebaudiana Bertoni. Int. J. Agric. Crop Sci. 2012, 4, 298–302. [Google Scholar]
- Kumar, R.; Sharma, S.; Ramesh, K.; Ramesh, K.; Singh, B. Effects of shade regimes and planting geometry on growth, yield and quality of the natural sweetener plant Stevia (Stevia rebaudiana Bertoni) in North- western Himalaya. Arch. Agron. Soil Sci. 2013, 59, 963–979. [Google Scholar] [CrossRef]
- Mordalski, R.; Kucharski, W.A.; Gryszczyńska, A.; Buchwald, W. Impact of raw sparing on the yield of Chelidonium majus L. herb and biological value of raw material. Post. Fitoter. 2014, 3, 150–154. [Google Scholar]
- Kumar, R.; Sharma, S.; Sood, S. Yield components, light interception and marker compound accumulation of Stevia (Stevia rebaudiana Bertoni) affected by planting material and plant density under western Himalayan conditions. Arch. Agron. Soil Sci. 2014, 60, 1731–1745. [Google Scholar] [CrossRef]
- Śniegowska, J.; Biesiada, A.; Gasiński, A. Influence of the Nitrogen Fertilization on the Yield, Biometric Characteristics and Chemical Composition of Stevia rebaudiana Bertoni Grown in Poland. Molecules 2024, 29, 1865. [Google Scholar] [CrossRef]
- Villalbazo-García, T.D.C.; Hernández-Zárate, G.; Trejo-Téllez, L.I.; Bello-Bello, J.J. Endomycorrhizal fungi inoculation improves development of Stevia (Stevia rebaudiana Bertoni) plantlets during ex vitro acclimatization. Symbiosis 2023, 90, 53–60. [Google Scholar] [CrossRef]
- Kruczek, A. Chemical composition of sucro- sorghum in dependence of the sowing term, plants density and distance of rows. Nauka Przyr. Technol. 2014, 8, 1–10. [Google Scholar]
- Olanite, J.A.; Anele, U.Y.; Arigbede, O.M.; Jolaosho, A.O.; Onifade, O.S. Effect of plant spacing and nitrogen fertilizer levels on the growth, dry-matter yield and nutritive quality of Columbus grass (Sorghum almum Stapf) in southwest Nigeria. Grass Forage Sci. 2010, 65, 369–375. [Google Scholar] [CrossRef]
- Grabowska, A.; Sękara, A.; Kunicki, E.; Kalisz, A. Content of macroelements in index part of broccoli in relation to cultivation metod and sparing. Acta Agroph. 2013, 20, 295–314. [Google Scholar]
- Dunbabin, V.; Diggle, A.; Rengel, Z. Is there an optimal root architecture for nitrate capture in leaching environments? Plant Cell Env. 2003, 26, 835–844. [Google Scholar] [CrossRef] [PubMed]
- Riad, G.; Ghoname, A.; Ahmed, A.; El-Baky, M.A.; Hegazi, A. Cabbage nutritional quality as influenced by planting density and nitrogen fertilization. Fruit Veg. Cereal Sci. Biotechnol. 2009, 3, 68–74. [Google Scholar]
- Mujahid, A.M.; Gupta, A.J. Effect of plant spacing, organic manures and inorganic fertilizers and their combinations on growth, yield and quality of lettuce (Lactuca sativa). Indian J. Agric. Sci. 2010, 80, 177–181. [Google Scholar]
- Rekowska, E.; Skupień, K. Estimation of yield and chemical composition of winter garlic grown for bunch-harvest. J. Cent. Eur. Agric. 2008, 9, 711–714. [Google Scholar]
- Ren, B.; Liu, W.; Zhang, J.; Dong, S.; Liu, P.; Zhao, B. Effects of plant density on the photosynthetic and chloroplast characteristics of maize under high-yielding conditions. Sci. Nat. 2017, 104, 12. [Google Scholar] [CrossRef] [PubMed]
- Postma, J.A.; Hecht, V.L.; Hikosaka, K.; Nord, E.A.; Pons, T.L.; Poorter, H. Dividing the pie: A quantitative review on plant density responses. Plant Cell Environ. 2021, 44, 1072–1094. [Google Scholar] [CrossRef] [PubMed]

Disclaimer/Publisher’s Note: The statements, opinions and data contained in all publications are solely those of the individual author(s) and contributor(s) and not of MDPI and/or the editor(s). MDPI and/or the editor(s) disclaim responsibility for any injury to people or property resulting from any ideas, methods, instructions or products referred to in the content. |
© 2024 by the authors. Licensee MDPI, Basel, Switzerland. This article is an open access article distributed under the terms and conditions of the Creative Commons Attribution (CC BY) license (https://creativecommons.org/licenses/by/4.0/).