
Effect of Surface Reinforcer on Compressive Strength and Microscopic Mechanism of Freeze–Thaw-Deteriorated Concrete


Abstract
1. Introduction
2. Experimental Materials and Methods
2.1. Materials and Mix Design
2.2. Test Design
2.2.1. Fast Freezing Test
2.2.2. Surface Reinforcer Test
2.2.3. Uniaxial Compression Test
2.2.4. NMR Test
2.2.5. SEM Test
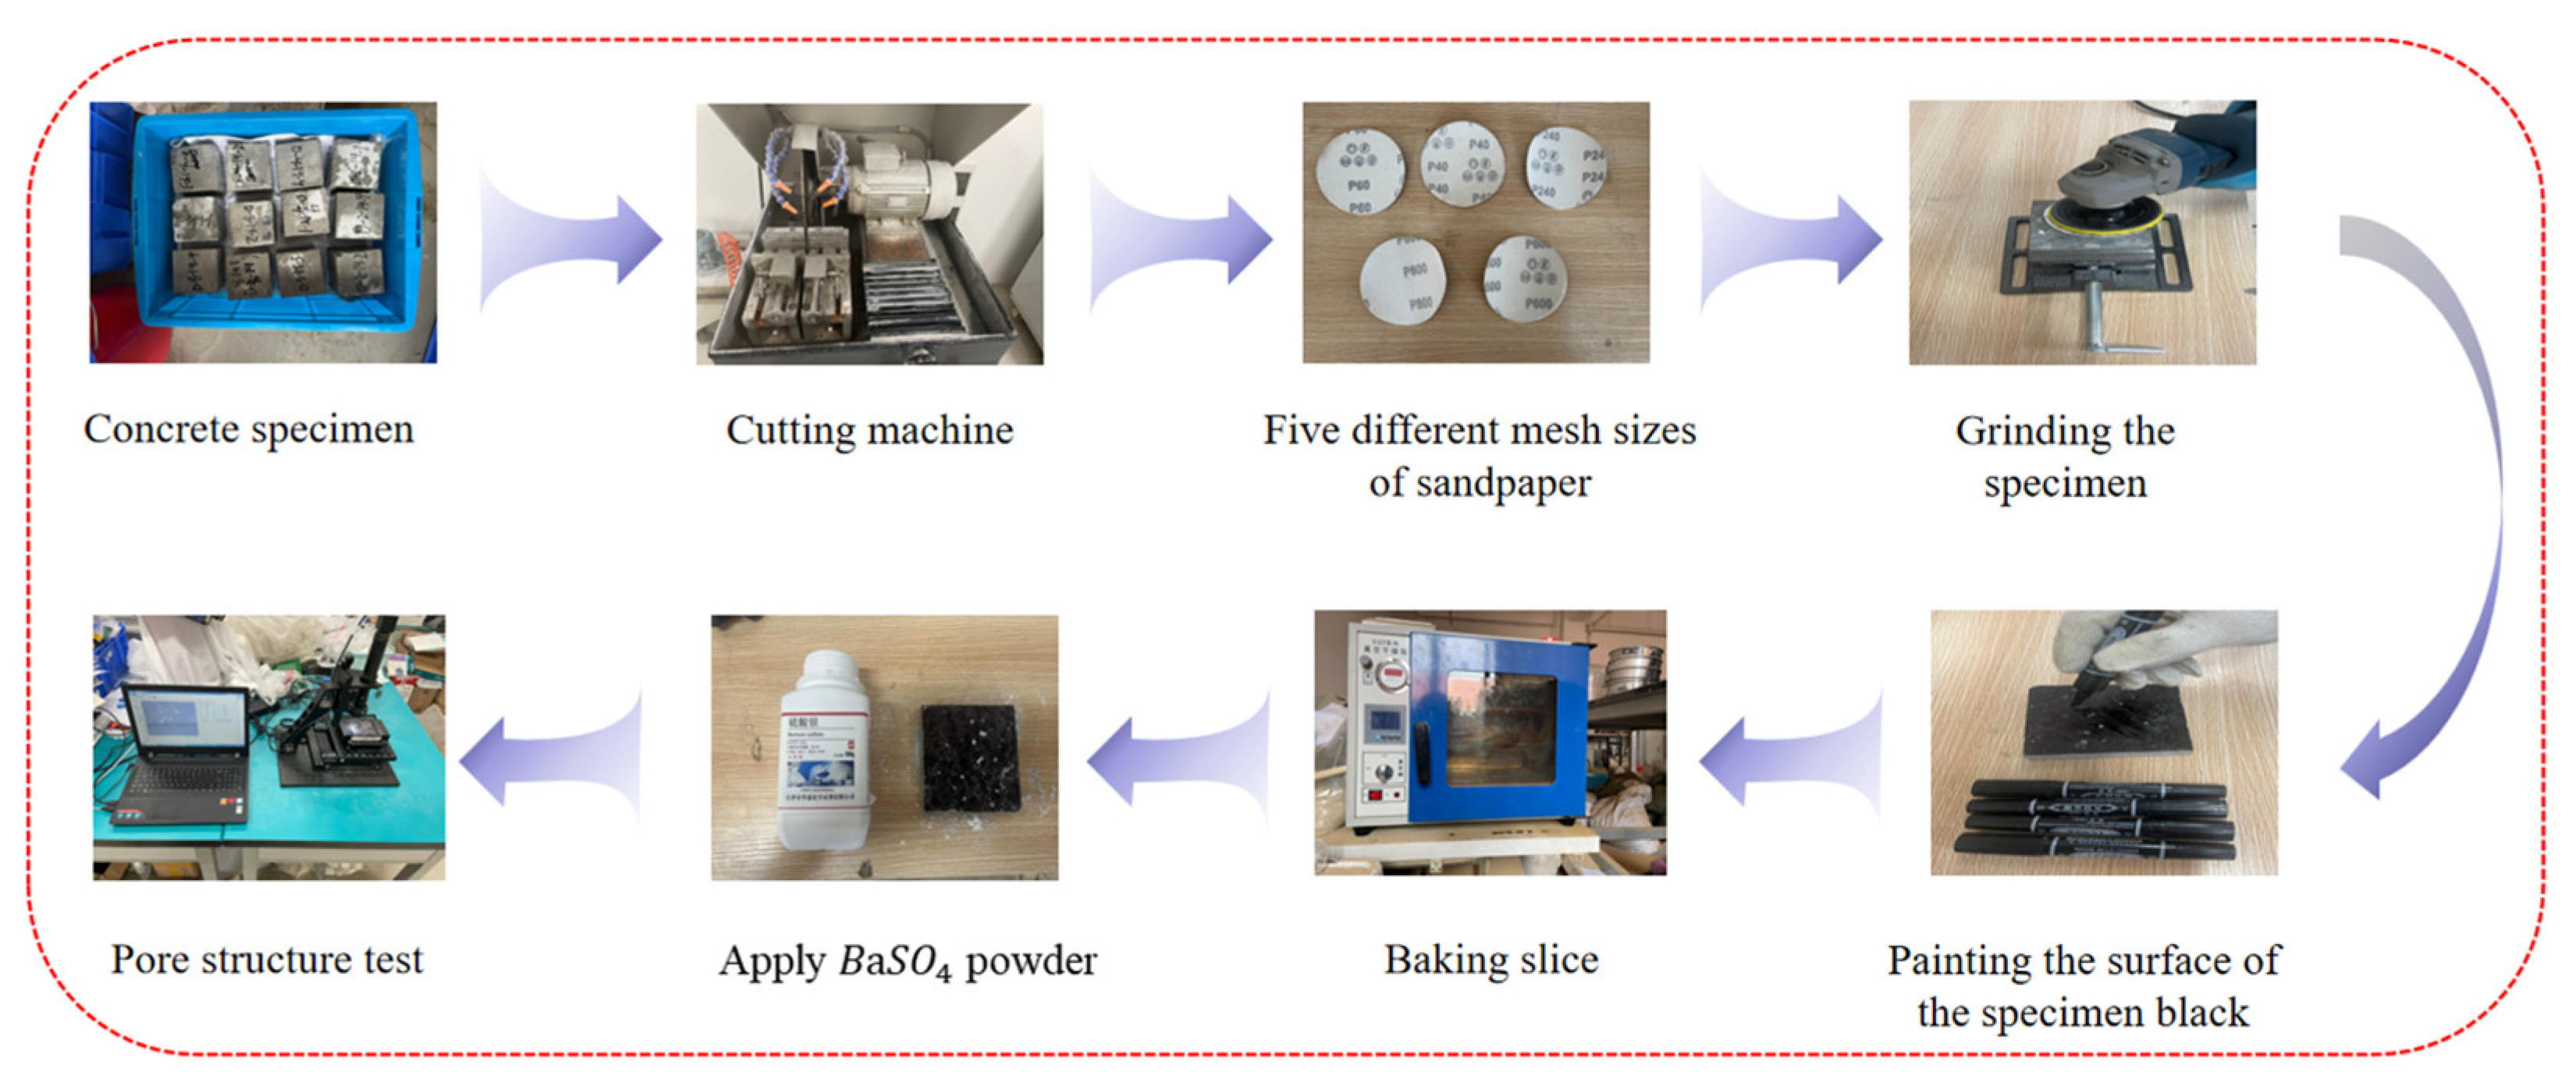
2.3. Pore Structure Test
3. Experimental Results and Discussion
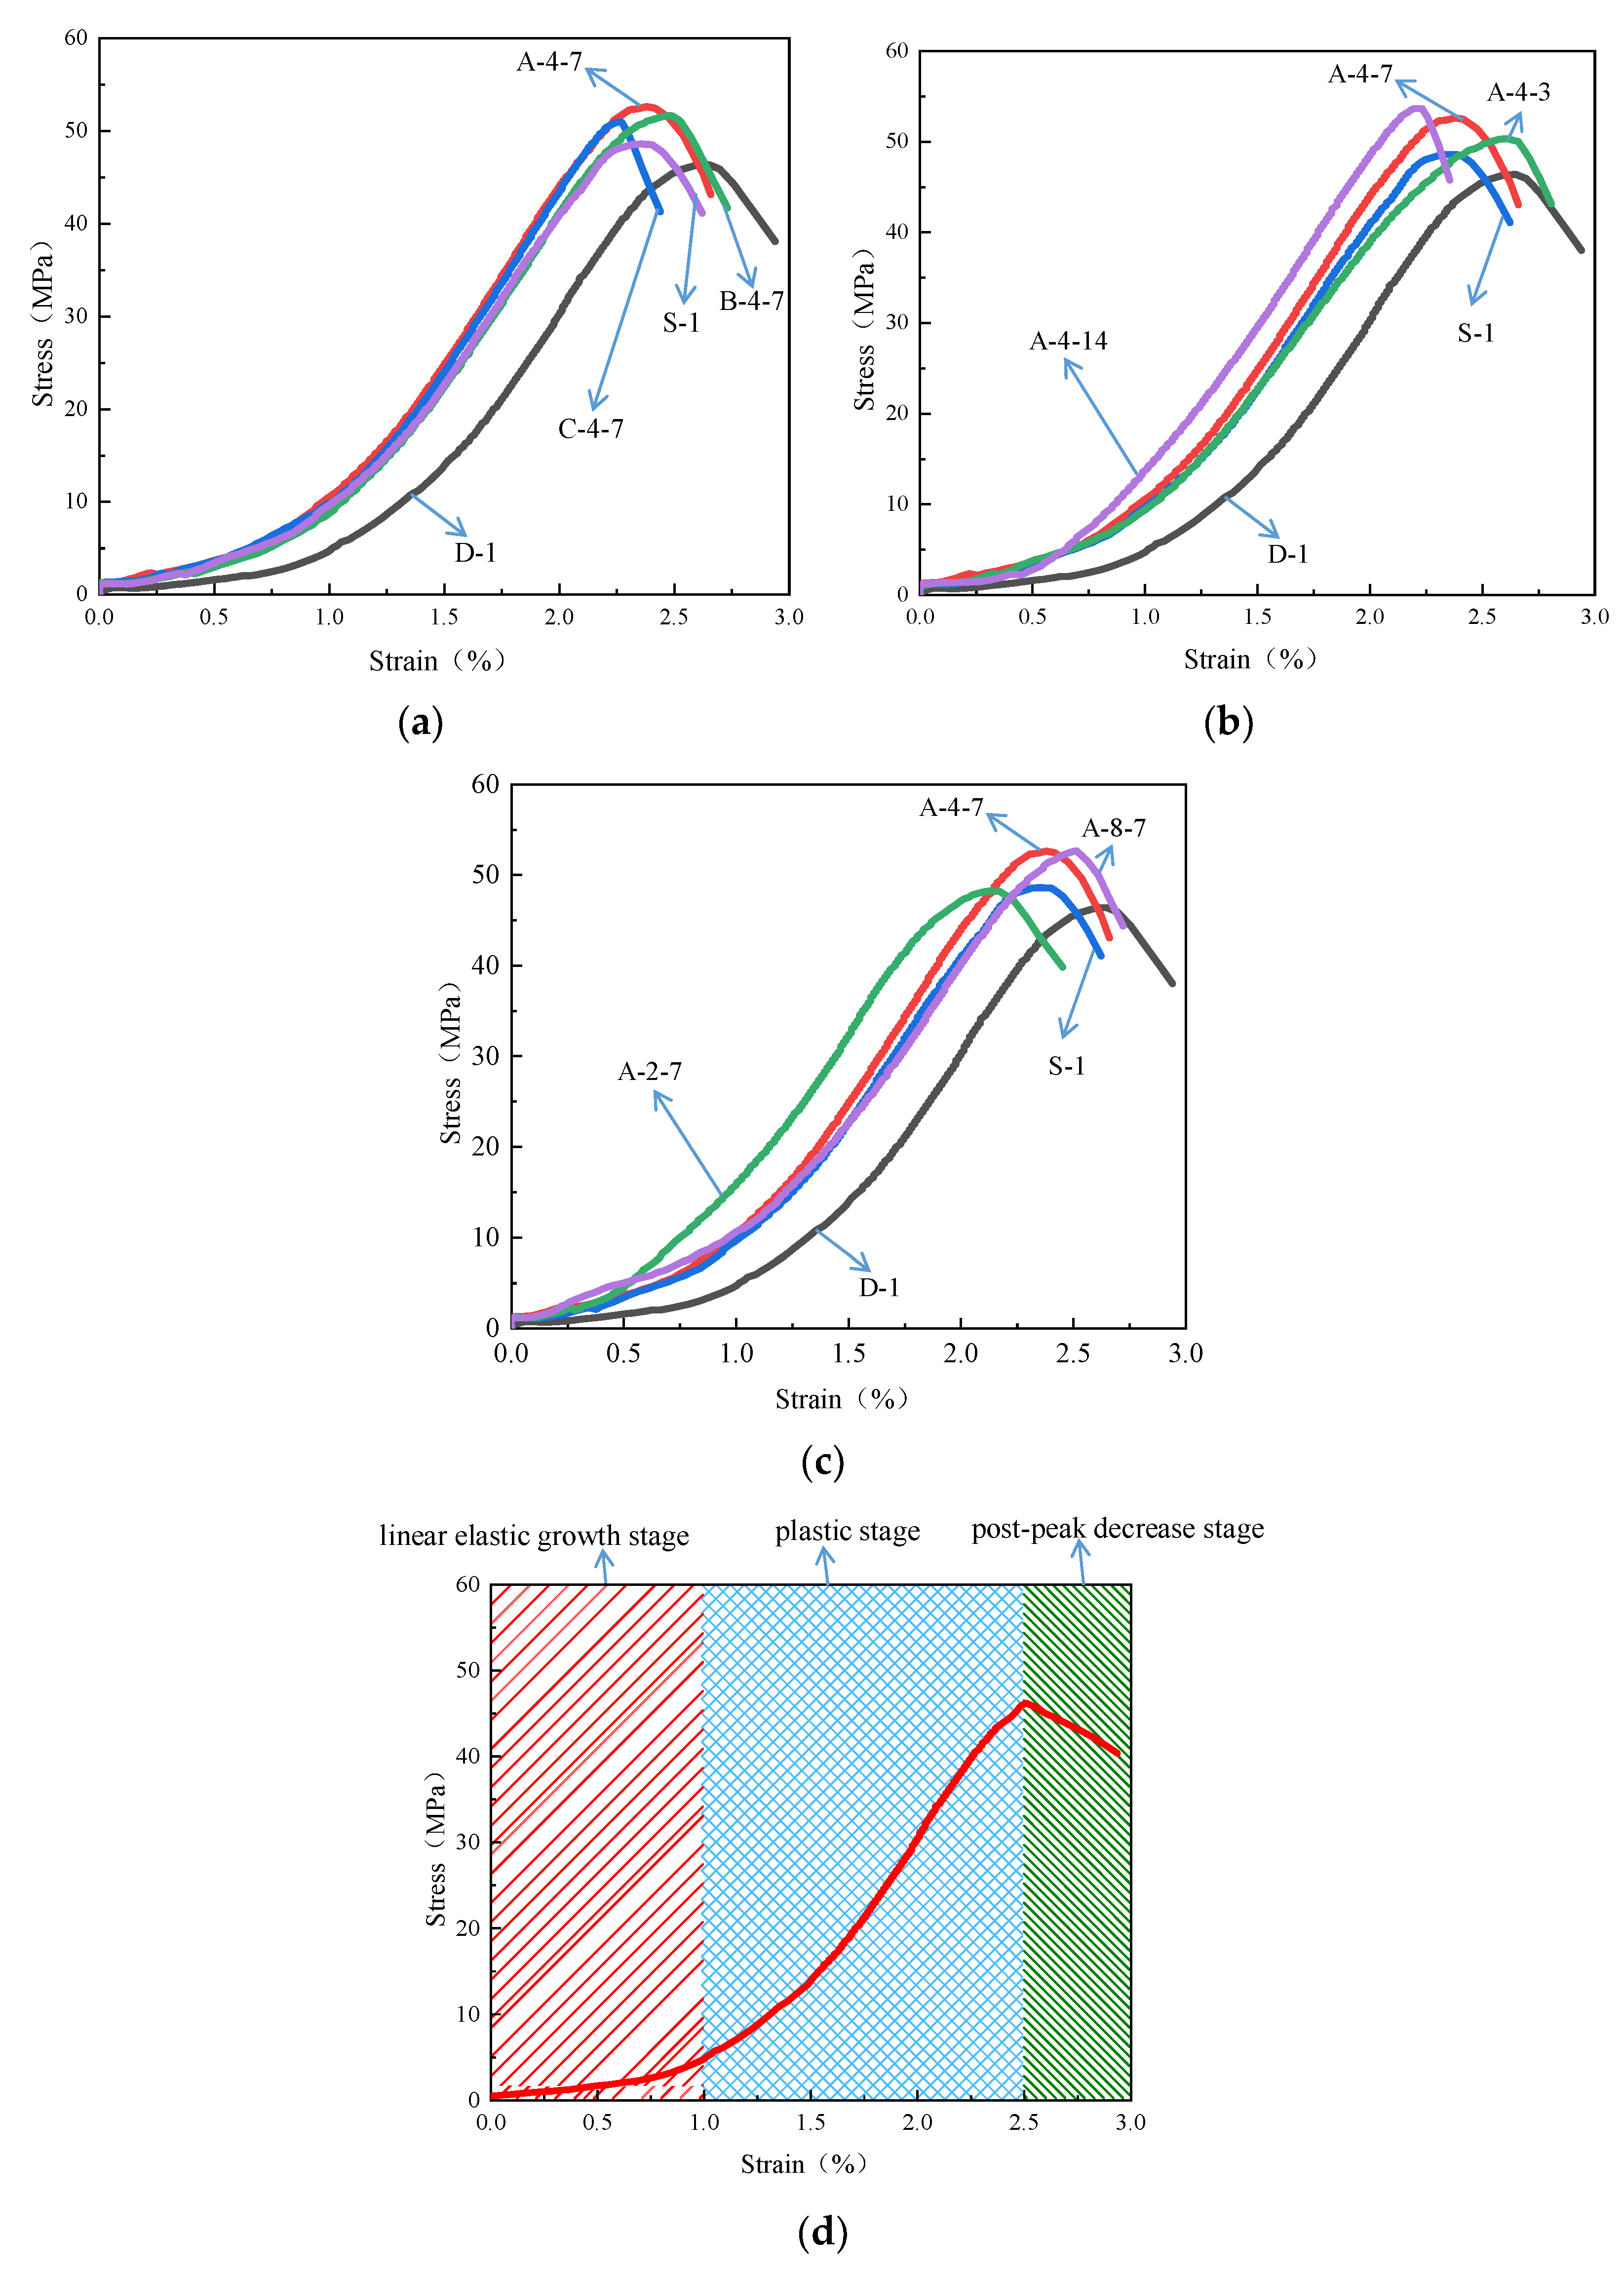
3.1. Stress–Strain Curves
3.2. Compressive Strength
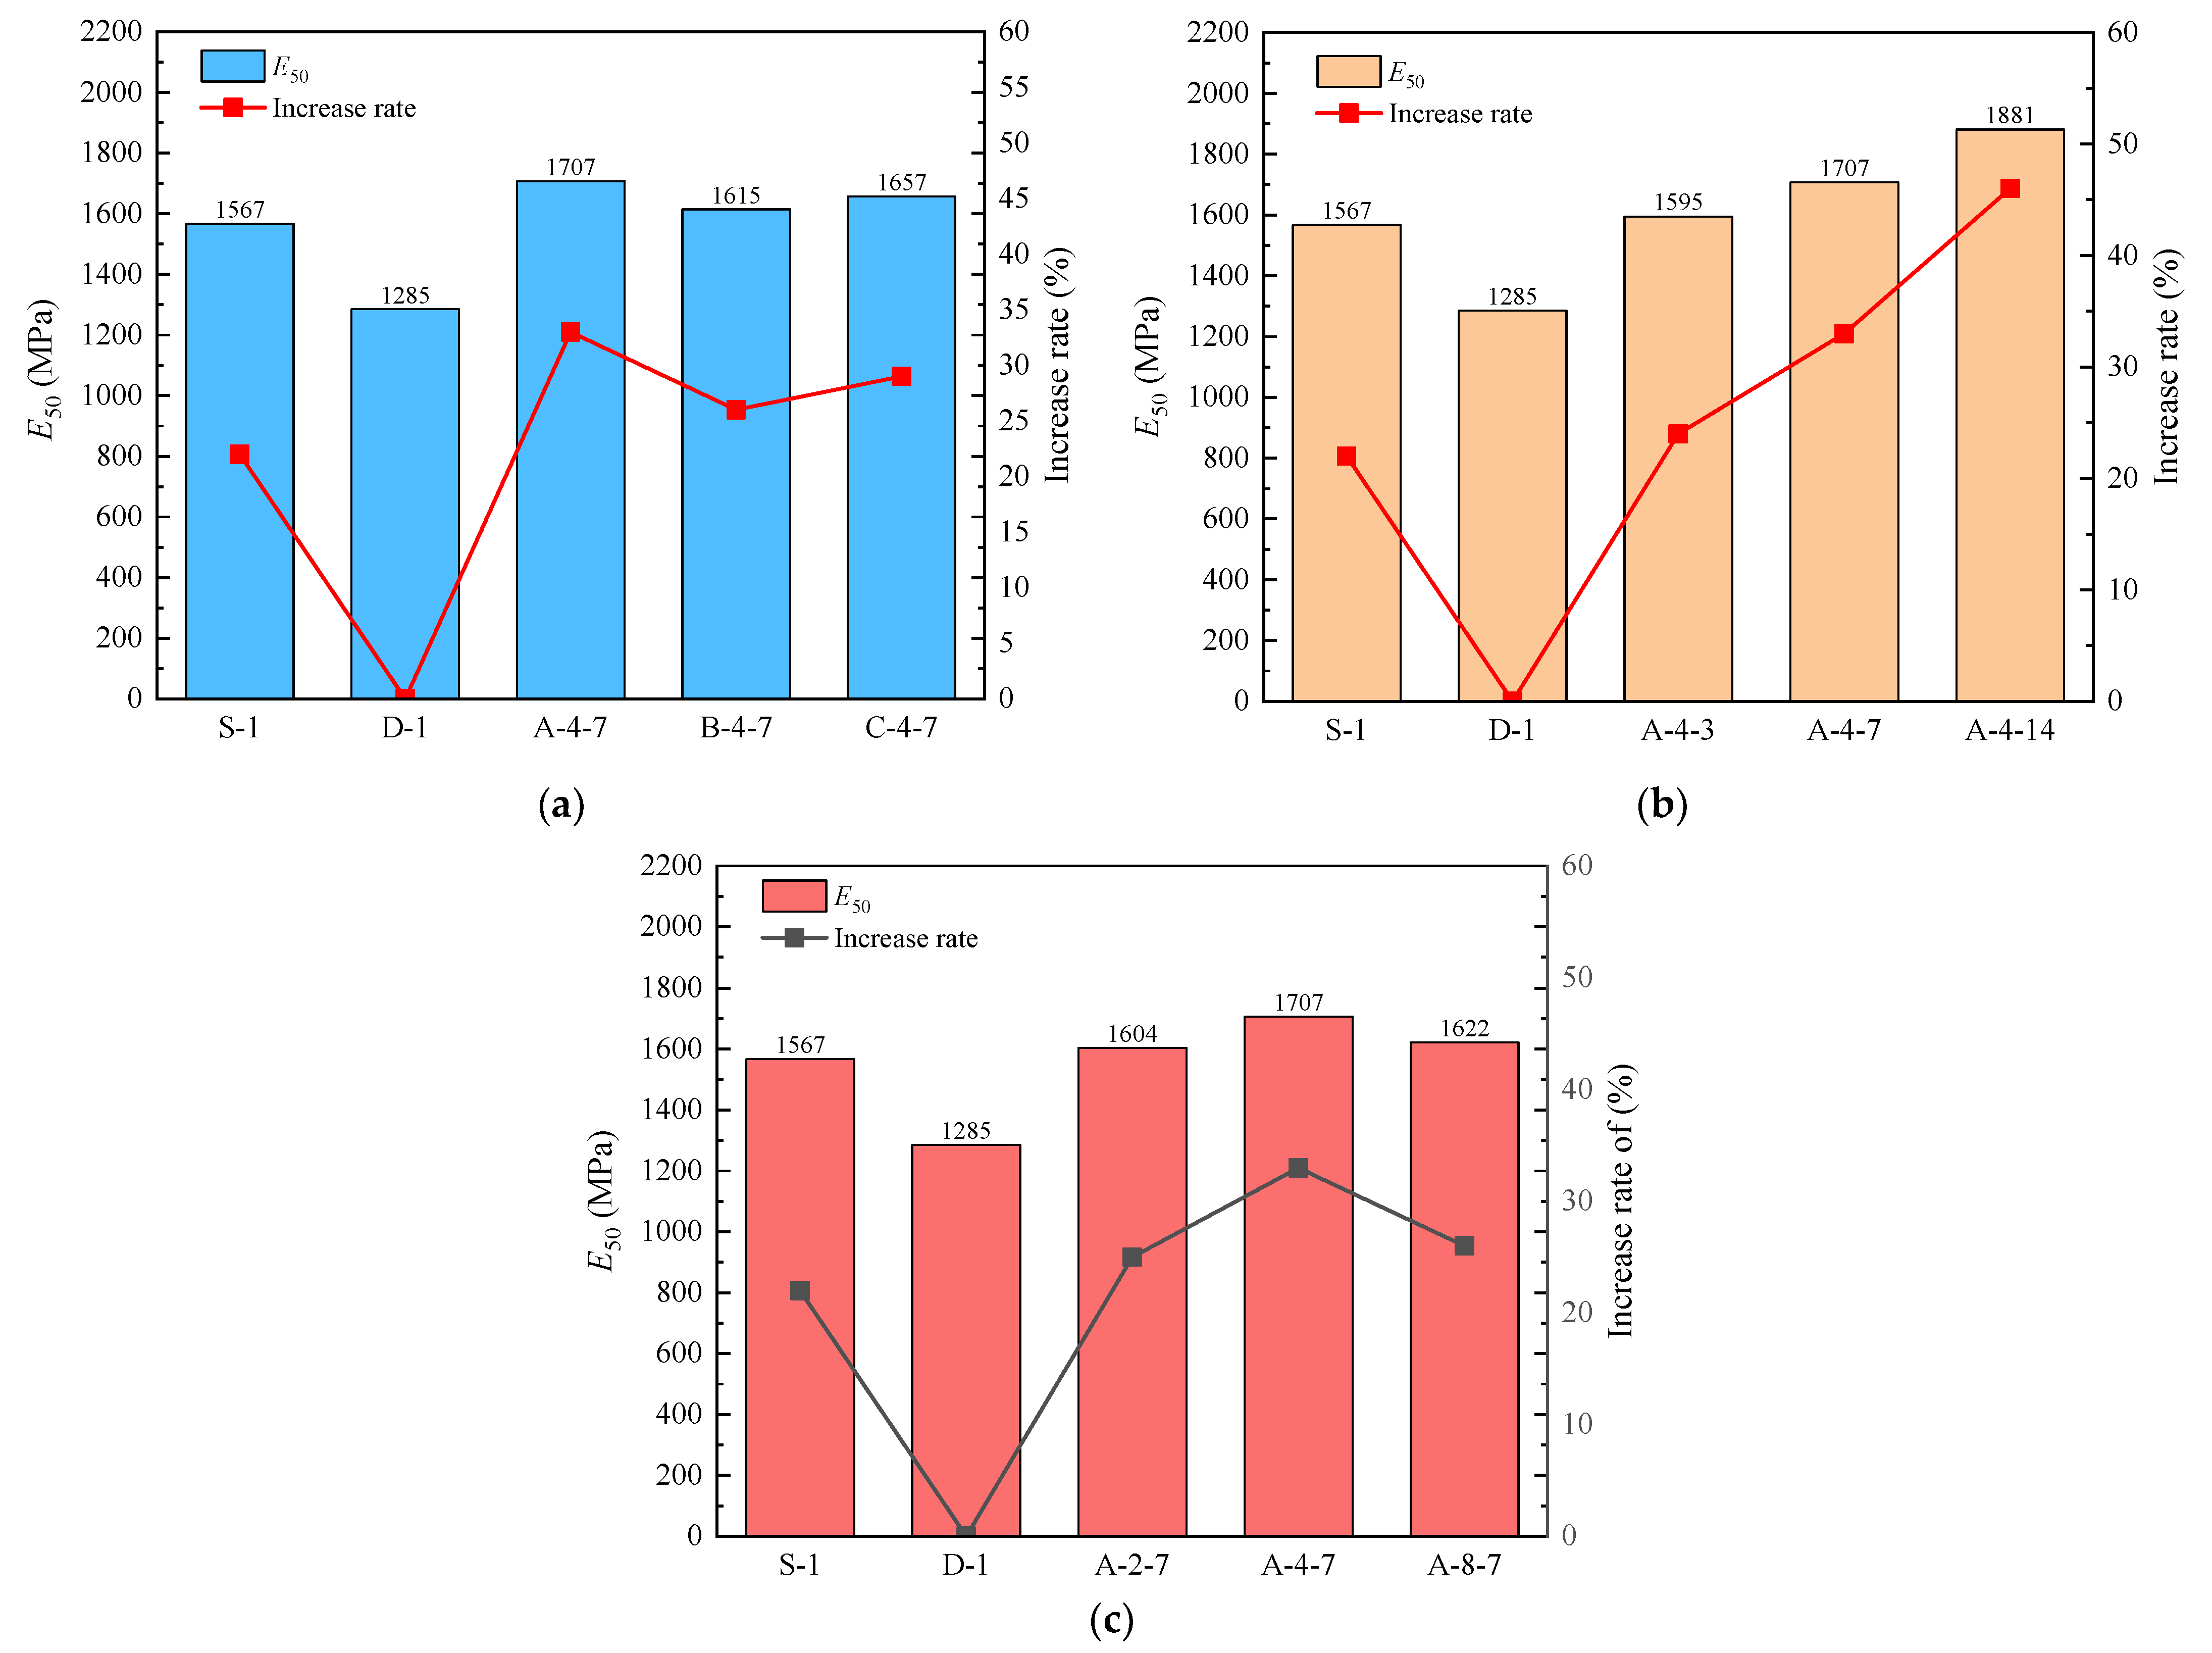
3.3. E50
3.4. NMR Results
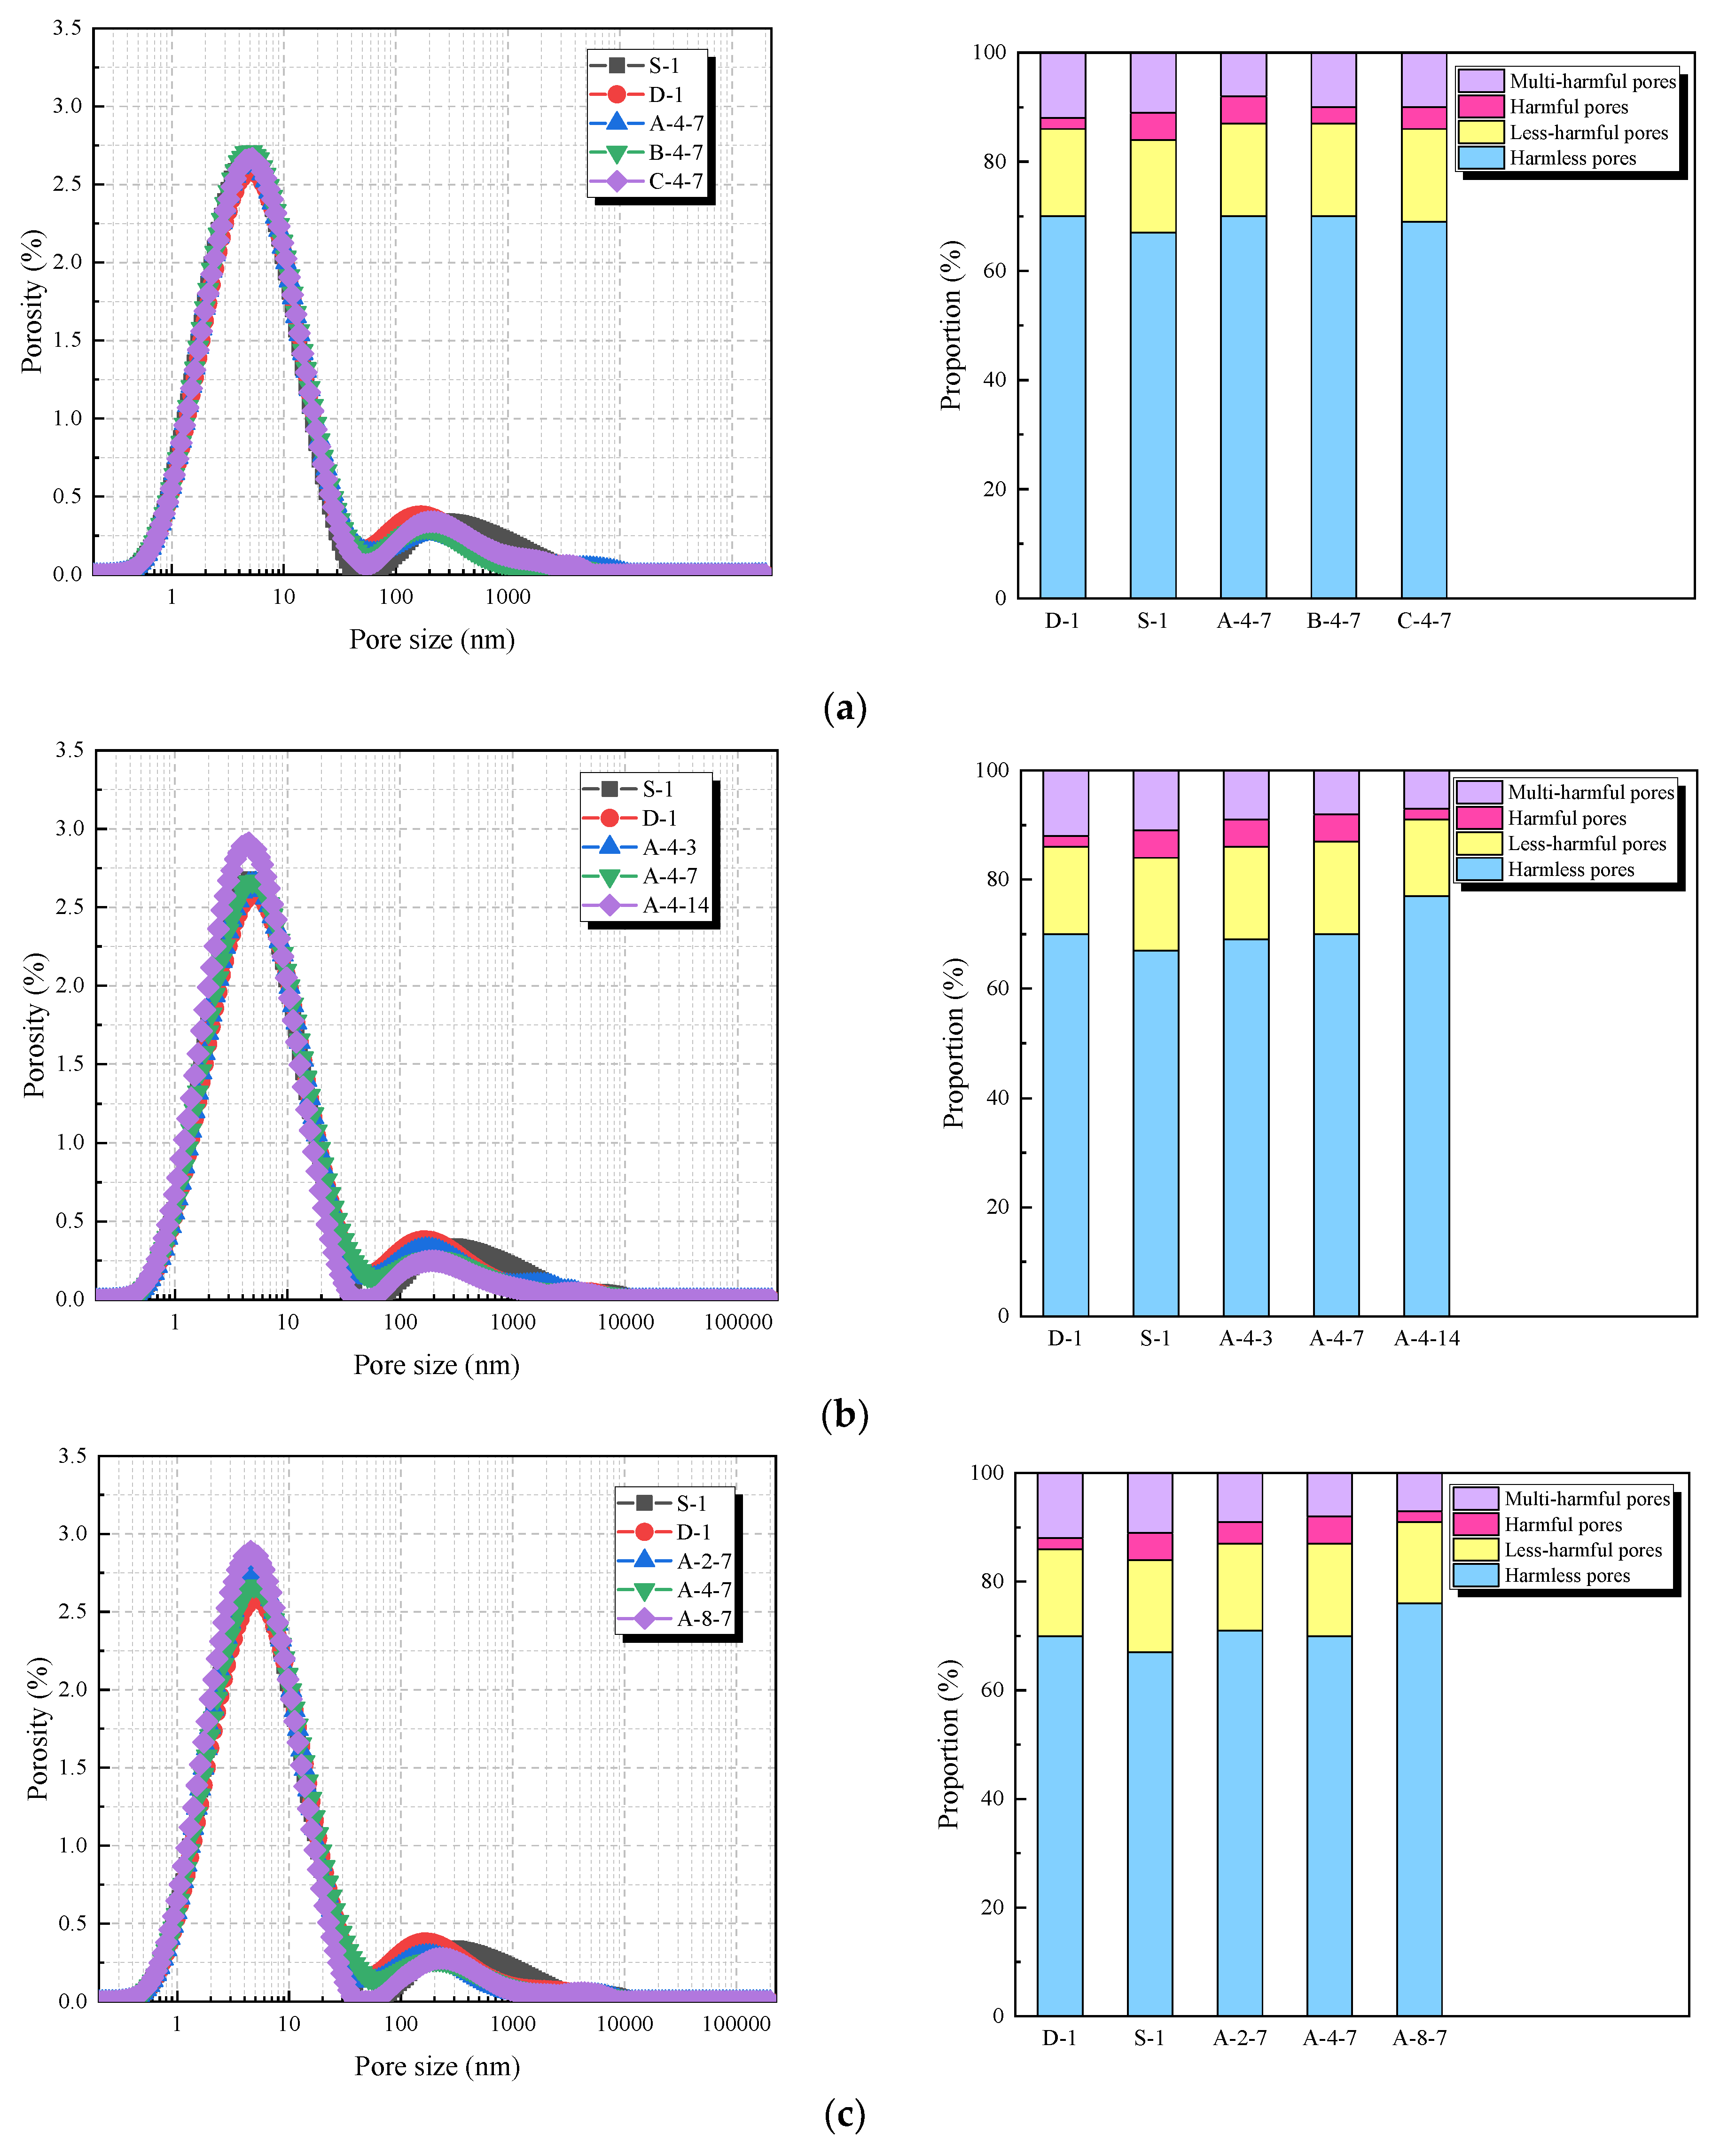
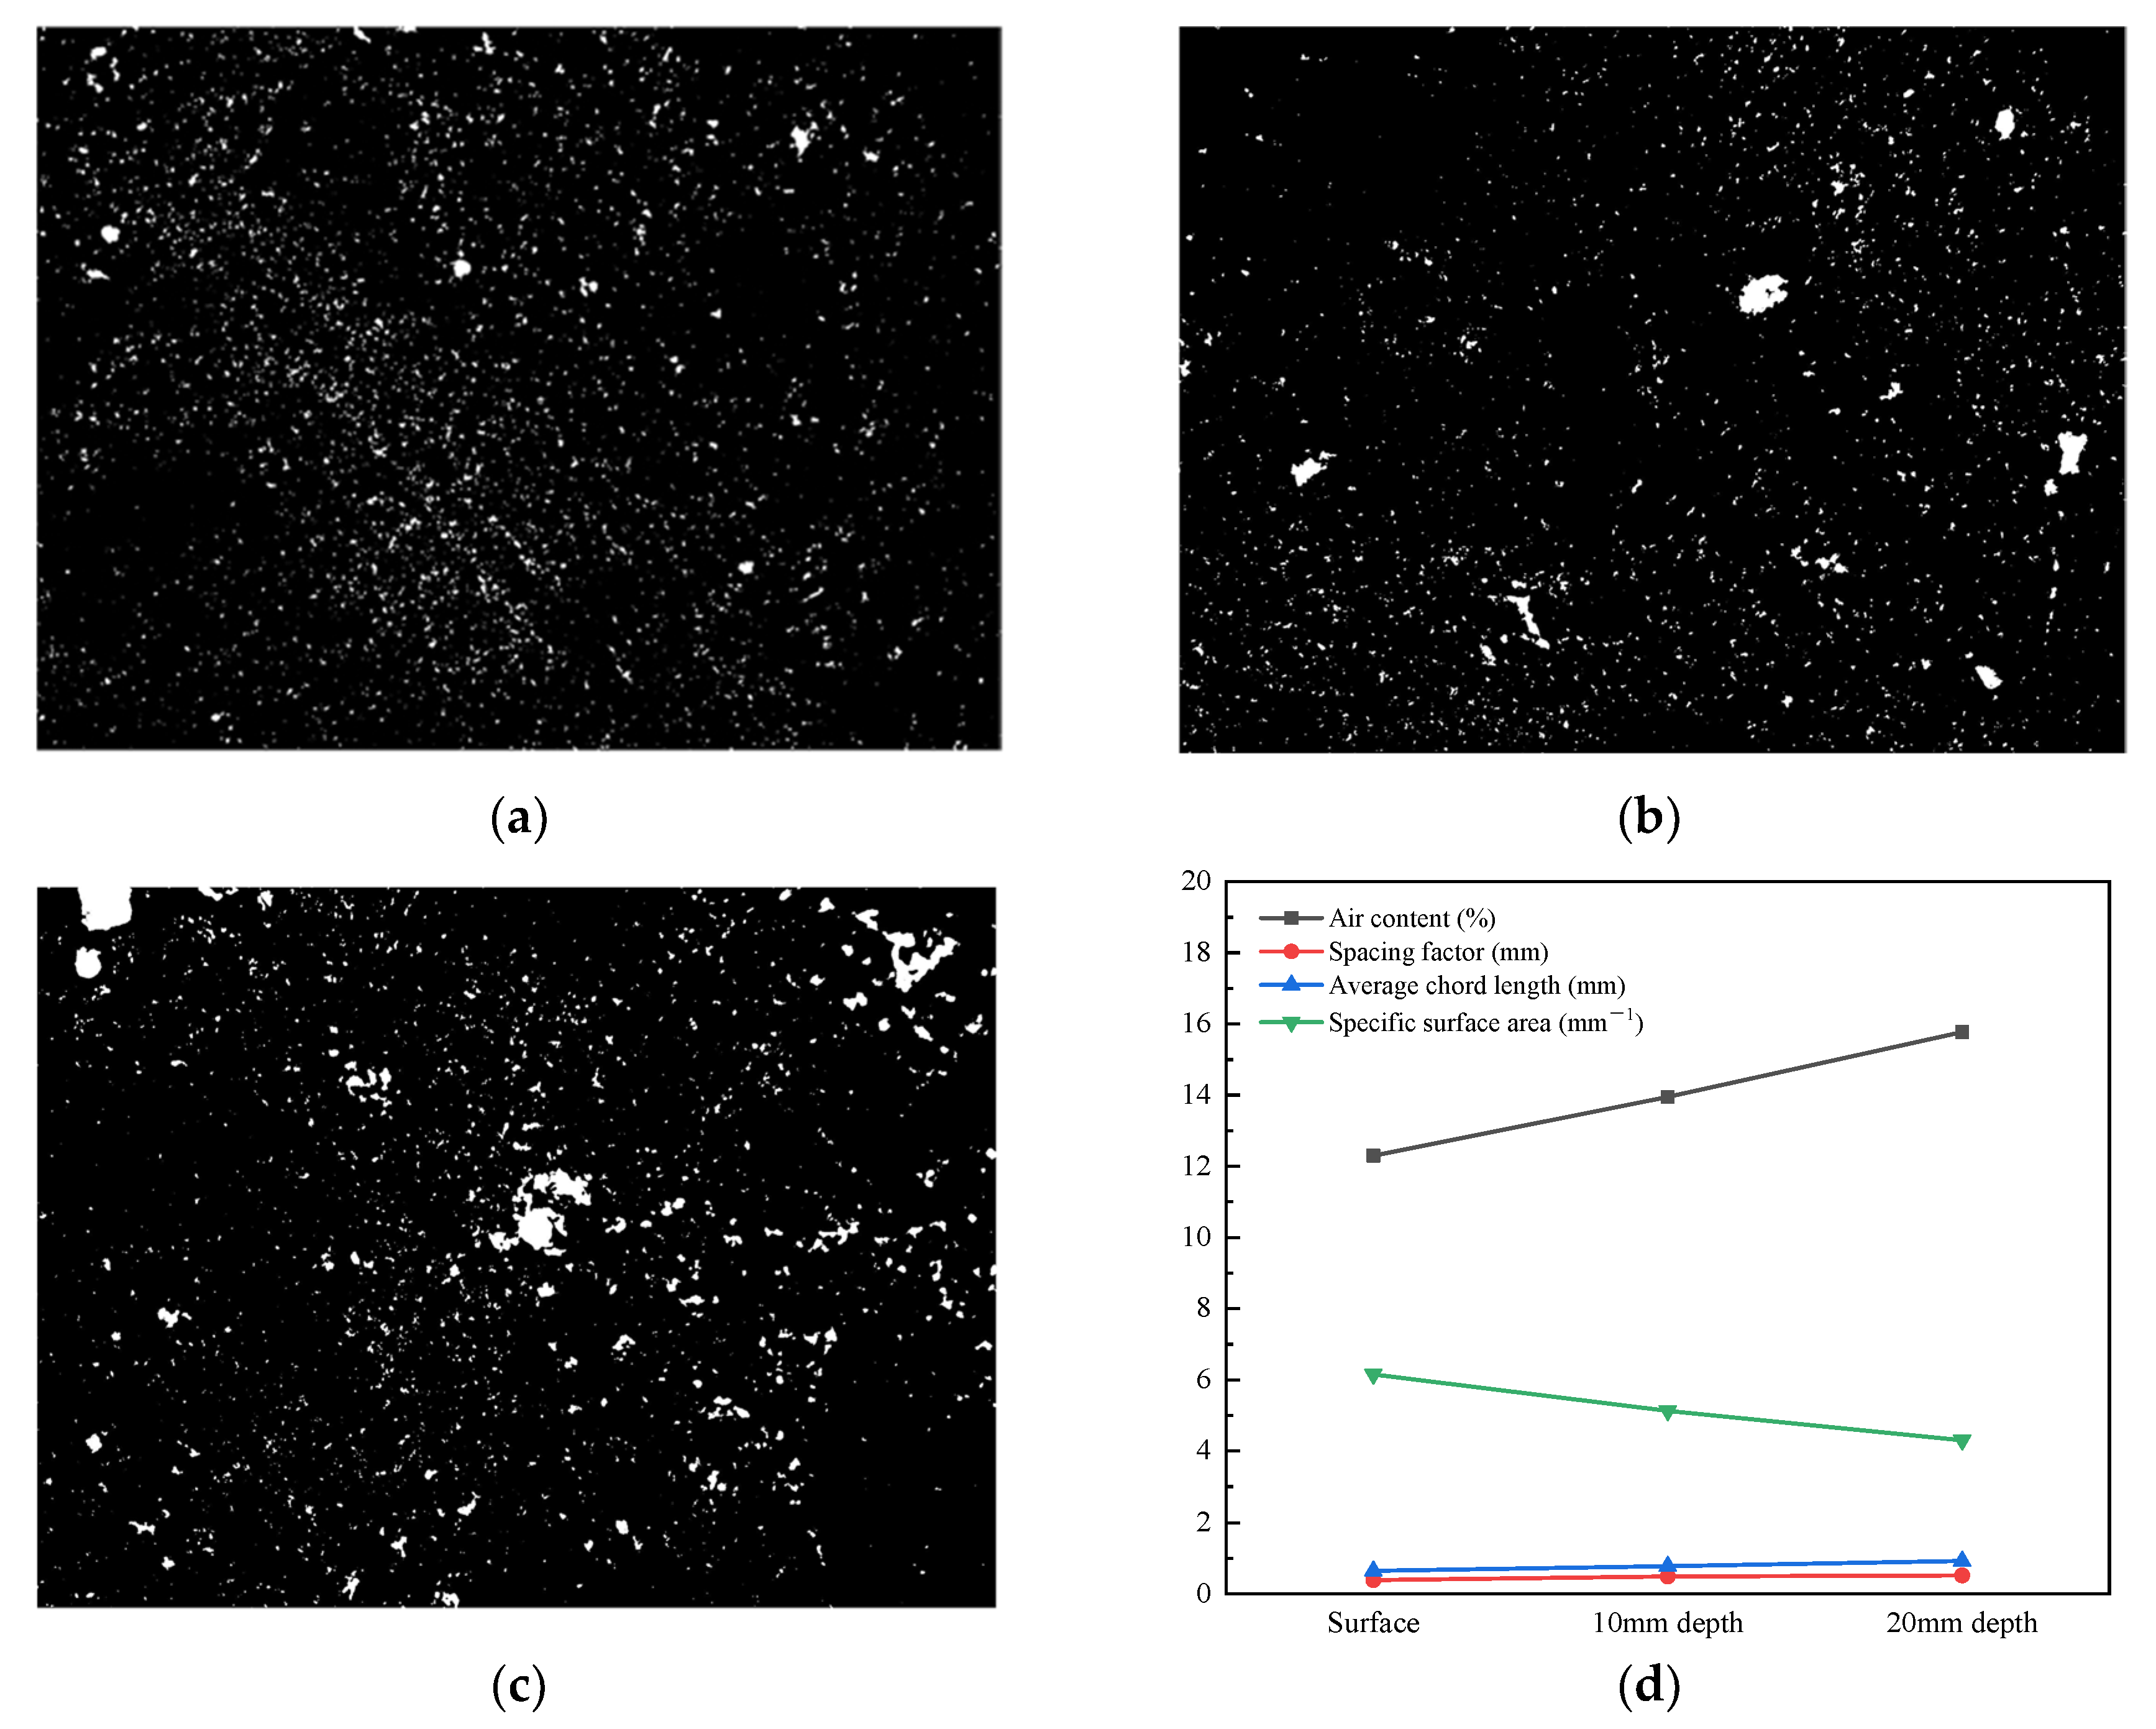
3.5. Pore Structure
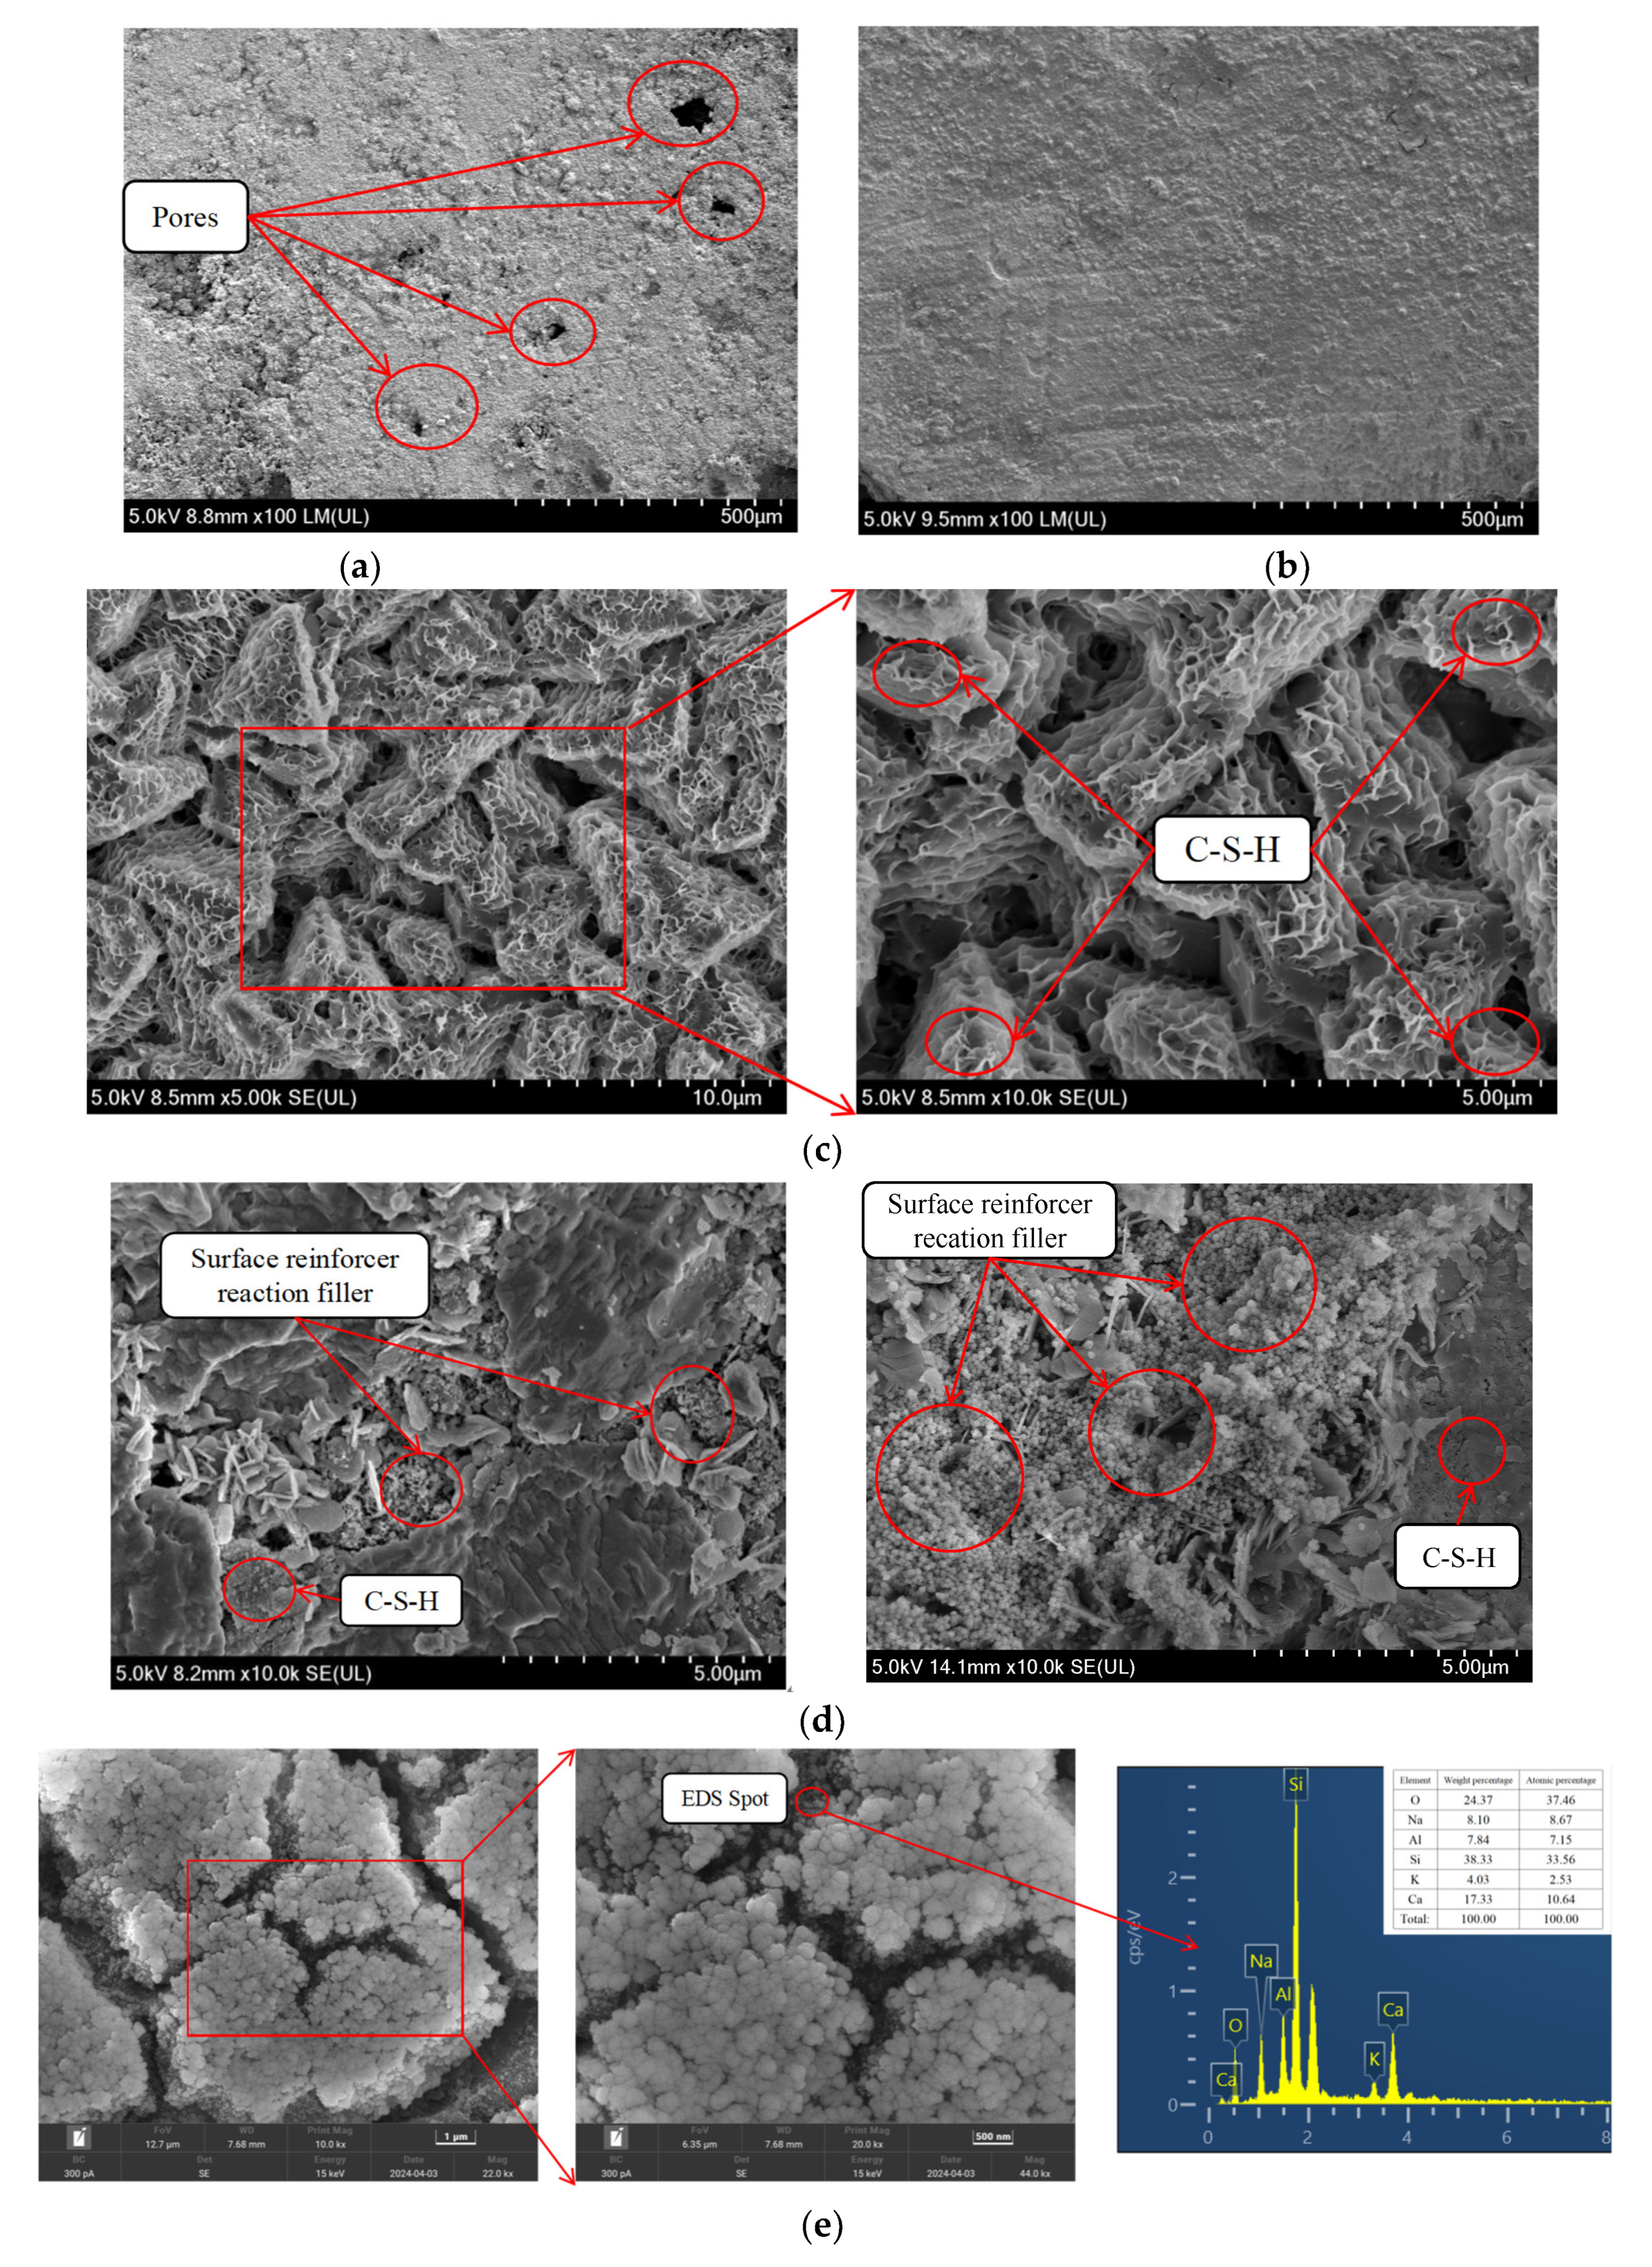
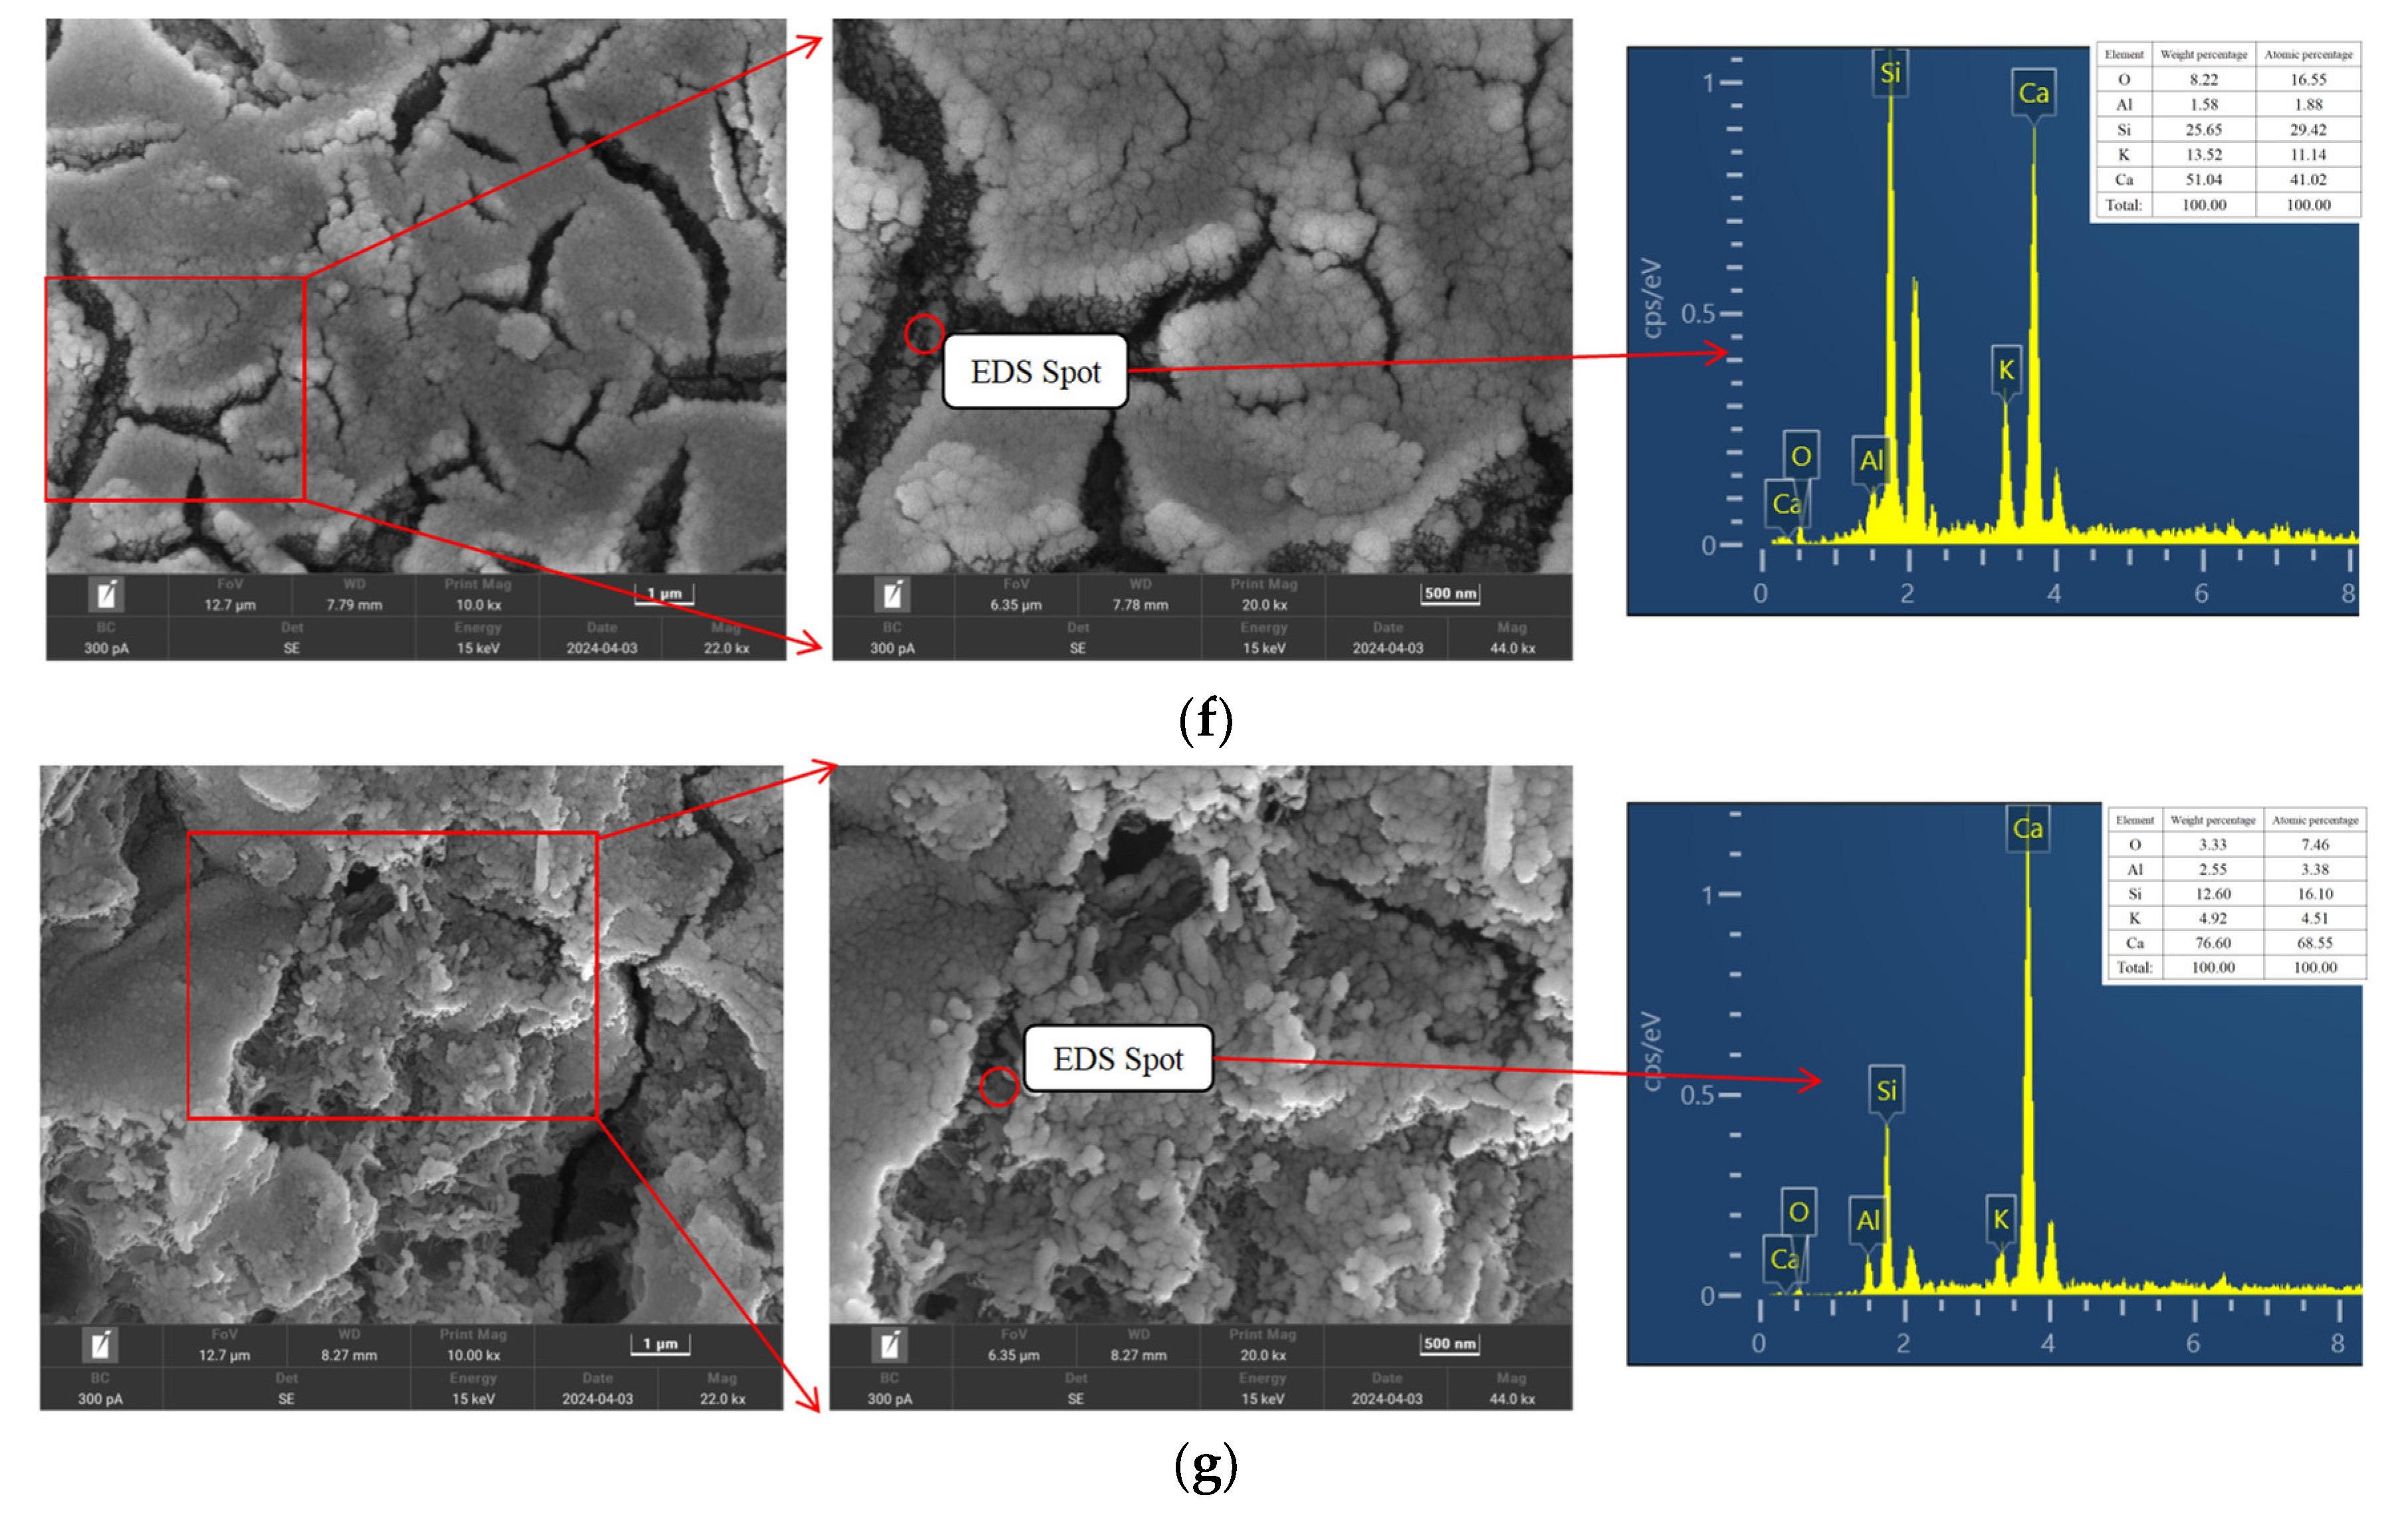
3.6. SEM Results and Analysis
4. Conclusions
- (1)
- Three types of surface reinforcer were able to efficiently improve compressive strength and deformation modulus E50, and the action duration and number of applications had a positive effect on the repair effect of the surface reinforcer.
- (2)
- As the surface reinforcer penetrated the specimens, the proportions of harmful pores and multi-harmful pores decreased and transformed into less-harmful pores and harmless pores. This contributed to the compressive strength of the concrete.
- (3)
- With the increase in the depth of repaired concrete, the air content, spacing factor, and average chord length decreased, while the specific surface area of the specimens gradually increased. In addition, in this research the pore structure parameters were significantly improved at 10 mm depth.
- (4)
- Surface reinforcer was able to generate more cementitious materials and fill the microvoids after penetrating the specimen. Two microscopic morphology shapes (i.e., spherical and columnar) of surface reinforcer were observed for types A, B, and C in the present research. The main components of the above three types of surface reinforcer were Si, Al, O, and K.
Author Contributions
Funding
Institutional Review Board Statement
Informed Consent Statement
Data Availability Statement
Conflicts of Interest
References
- Aitcin, P.-C. Cement of yesterday and concrete of tomorrow. Cem. Concr. Res. 2000, 30, 1349–1359. [Google Scholar] [CrossRef]
- Chen, Z.; Li, M.; Guan, L. Safety and Effect of Fly Ash Content on Mechanical Properties and Microstructure of Green Low-Carbon Concrete. Appl. Sci. 2024, 14, 2796. [Google Scholar] [CrossRef]
- Fu, J.; Zhang, Y.; Qin, Y. Experimental Investigation of TR-UHPC Composites and Flexural Behavior of TR-UHPC Composite Slab. Appl. Sci. 2024, 14, 3161. [Google Scholar] [CrossRef]
- He, Z.; Su, C.; Deng, Y. A Novel Hybrid Approach for Concrete Crack Segmentation Based on Deformable Oriented-YOLOv4 and Image Processing Techniques. Appl. Sci. 2024, 14, 1892. [Google Scholar] [CrossRef]
- Chen, D.; Zhu, C.; Shi, X.; Song, J. Influence of Random Vehicle-Bridge Coupling Vibration on the Anti-Disturbance Performance of Concrete Materials. Appl. Sci. 2023, 13, 7584. [Google Scholar] [CrossRef]
- Shi, J.; Lu, Y.; Zhu, R.; Liu, Y.; Zhang, Y.; Lv, Q. Experimental evaluation of fracture toughness of basalt macro fiber reinforced high performance lightweight aggregate concrete. Constr. Build. Mater. 2024, 411, 134638. [Google Scholar] [CrossRef]
- GB 50010-2010; Code for the Design of Concrete Structures. China Construction Industry Press: Beijing, China, 2015.
- Reeves, C.M. How to Make Today’s Concrete Durable for Tomorrow; The Institution of Civil Engineers: London, UK, 1985. [Google Scholar]
- Report of the ACI222 Committee, USA; The Third Research Institute of Navigation Engineering, Ministry of Communications: Shanghai, China, 1988.
- Wang, X. Design of low-cost and low-CO2 air-entrained fly ash-blended concrete considering carbonation and frost durability. J. Clean. Prod. 2020, 272, 122675. [Google Scholar] [CrossRef]
- Su, J.; Zhu, J.; Shi, C.; Fang, Z. Dimensional effect of compressive strength of silica fume reinforcerd recycled concrete. J. Hunan Univ. Nat. Sci. Ed. 2022, 49, 174–180. [Google Scholar]
- Thomas, R.J.; Andrew, J.F.; Andrew, D.S. Durability analysis of recycled asphalt pavement as partial coarse aggregate replacement in a high-strength concrete mixture. J. Mater. Civ. Eng. 2018, 30, 04018061. [Google Scholar] [CrossRef]
- Xu, Y. Analysis and control of cracks in reinforcerd concrete. West. Prospect. Eng. 2002, 36, 140–141. [Google Scholar]
- Kang, H.; Jiang, P.; Yang, J.; Wang, Z.; Yang, J. Coal mine kilometre deep shaft roadway loose and soft coal body high-pressure anchor injection-grouting synergistic control technology. J. Coal 2021, 46, 747–762. [Google Scholar]
- Xu, W.; Du, D.; Kazuhiko, K.; Wang, S. Optimal arrangement of viscous dampers and its application to the strengthening of high-rise steel structures. J. Build. Struct. 2022, 43, 32–44. [Google Scholar]
- Zhao, Z.; Chu, F.; Zhang, R.; Zhou, K.; Li, H. Correlation analysis of different bond strength test methods for waterproof bonding layer. New Build. Mater. 2022, 6, 64–68. [Google Scholar]
- Li, Z.; Xiong, Z. Repair technology and application of hydraulic concrete protection in alpine area. J. Chang. Acad. Sci. 2022, 39, 1–8. [Google Scholar]
- Zhang, X. Research and application of repair technology for surface defects of concrete structure. N. Traffic 2022, 8, 55–58. [Google Scholar]
- Li, Q.; Liang, T.; Du, H.; Cui, Z. Repair of concrete compressive strength after high temperature by inorganic coating. J. Constr. Mater. 2019, 22, 60–64. [Google Scholar]
- Liu, L.; Dai, Z. UV-modified isophorone diamine for concrete repair. J. Build. Mater. 2021, 24, 644–647. [Google Scholar]
- Tao, X.; Huang, J.; Wu, J.; Liu, D. Study on the effect of inorganic waterborne penetrating crystalline high-efficiency protective agent on the durability performance of concrete. China Build. Waterproofing 2010, 18, 17–20. [Google Scholar]
- Li, Y.; Du, X.; Yan, Q.; Zhang, Q. Repair effect of cementitious penetration crystalline material on concrete. Build. Mater. World 2010, 31, 1–3. [Google Scholar]
- Almusallam, A.A.; Khan, F.M.; Dulaijan, S.U. Effectiveness of surface coatings in improving concrete durability. Cem. Concr. Compos. 2003, 25, 473–481. [Google Scholar] [CrossRef]
- Fattuhi, N.I. Carbonation of concrete as affected by mix constituents and initial water curing period. Borads-Gauthier-Villars. 1986, 2, 131–136. [Google Scholar] [CrossRef]
- Wang, X. Research on the Promotion of Performance Recovery of Deteriorated Concrete. Master’s Thesis, China University of Mining and Technology, Beijing, China, 2014. [Google Scholar]
- Shi, L.; Liu, J.; Liu, J. Effect of polymer coating on carbonation of concrete and its mechanism. J. Southeast Univ. Nat. Sci. Ed. 2010, 40, 208–213. [Google Scholar]
- GB/T 50082-2009; Standard for Long-term Performance and Durability Test Methods for Ordinary Concrete. China Construction Industry Press: Beijing, China, 2010.
- Wei, D.; Sun, A.; Wang, X. NMR-based analysis of fractal characteristics of the pore structure of fully aeolian sand concrete under carbonation-dry-wet cycles. Mater. Today Commun. 2024, 39, 108815. [Google Scholar]
- Wen, X.; Yin, G.; Xia, L.; Zhou, M.; Feng, L.; Wu, J. Spatiotemporal evolution of water and pore structure in cement-based material containing SRA by LF NMR. Mater. Today Commun. 2023, 35, 106076. [Google Scholar]
- Gao, F.; Tian, W.; Cheng, X. Investigation of moisture migration of MWCNTs concrete after different heating-cooling process by LF-NMR. Constr. Build. Mater. 2021, 288, 123146. [Google Scholar] [CrossRef]
- Sun, N.; Ji, R.; Zhang, F.; Song, X.; Xie, A.; Liu, J.; Zhang, M.; Niu, L.; Zhang, S. Structural evolution in poly (acrylic-co-acrylamide) pH-responsive hydrogels by low-field NMR. Mater. Today Commun. 2020, 22, 100748. [Google Scholar] [CrossRef]
- Liu, W.; Li, Y.; Tang, L.; Dong, Z. XRD and 29Si MAS NMR study on carbonated cement paste under accelerated carbonation using different concentration of CO2. Mater. Today Commun. 2019, 19, 464–470. [Google Scholar] [CrossRef]
- Faure, P.; Peter, U.; Lesueur, D.; Coussot, P. Water transfers within Hemp Lime Concrete followed by NMR. Cem. Concr. Res. 2012, 42, 1468–1474. [Google Scholar] [CrossRef]
- Muhedin, D.A.; Ibrahim, R.K. Effect of waste glass powder as partial replacement of cement & sand in concrete. Case Stud. Constr. Mater. 2023, 19, e02512. [Google Scholar]
- Kaur, M.; Pandey, A.; Yadav, R.; Verma, S.; Husale, S. Growth and characterization of gold nanoislands & quantum dots on marker-based SiO2/Si substrate for SEM resolution intercomparison studies. Mater. Today Commun. 2023, 35, 105741. [Google Scholar]
- Song, Y.; Davy, C.A.; Troadec, D.; Bourbon, X. Pore network of cement hydrates in a High Performance Concrete by 3D FIB/SEM—Implications for macroscopic fluid transport. Cem. Concr. Res. 2019, 115, 308–326. [Google Scholar] [CrossRef]
- Shen, J.; Xu, Q.; Liu, M. Statistical analysis of defects within concrete under elevated temperatures based on SEM image. Constr. Build. Mater. 2021, 293, 123503. [Google Scholar] [CrossRef]
- Wu, Q.; Ma, Q.; Wang, Y. Compressive tensile strength test and fine structure of basalt fibre-slag powder-fly ash concrete under freeze-thaw cycle. J. Compos. Mater. 2021, 38, 953–965. [Google Scholar]
- Wu, Q.; Ma, Q. Freeze resistance and damage modelling of BSFC under freeze-thaw cycles. J. Build. Mater. 2021, 24, 1169–1178. [Google Scholar]
- Li, D.; Niu, D.; Fu, Q.; Luo, D. Fractal analysiss of pore structure of basalt-polypropylene hybrid fibre reinforcerd concrete. Mater. Her. 2022, 36, 115–120. [Google Scholar]
- ASTM C457-2016; Standard Test Method for Microscopical Determination of Parameters of the Air-Void System in Hardened Concrete. American Society for Testing and Materials: West Conshohocken, PA, USA, 2016.
- Chen, C.; Wei, S.; Cai, H. Effect of temperature change on mechanical properties of cement soil. J. Railw. Sci. Eng. 2023, 20, 190–199. [Google Scholar]
- Wu, Z.; Lian, H. High Performance Concrete; China Railway Press: Beijing, China, 1999. [Google Scholar]


| SiO2 | Al2O3 | Fe2O3 | CaO | MgO | SO3 | Na2O | K2O |
|---|---|---|---|---|---|---|---|
| 21.80 | 3.31 | 2.78 | 64.12 | 0.75 | 1.03 | 0.04 | 0.68 |
| Cement | Fine Aggregate | Coarse Aggregate | Water |
|---|---|---|---|
| 380 | 630 | 1120 | 190 |
| Freezing Time/h | Melting Time/h | Freeze–Thaw Cycle/h | Freeze–Thaw Cycles Number |
|---|---|---|---|
| 4 | 4 | 8 | 0, 20, 40, 60, and 80 |
| Specimen Number | Harmless Pores | Less-Harmful Pores | Harmful Pores | Multi-Harmful Pores |
|---|---|---|---|---|
| S-1 | 70 | 16 | 2 | 12 |
| D-1 | 67 | 17 | 5 | 11 |
| A-4-7 | 70 | 17 | 5 | 8 |
| B-4-7 | 70 | 17 | 3 | 10 |
| C-4-7 | 69 | 17 | 4 | 10 |
| A-4-3 | 69 | 17 | 5 | 9 |
| A-4-14 | 77 | 14 | 2 | 7 |
| A-2-7 | 71 | 16 | 4 | 9 |
Disclaimer/Publisher’s Note: The statements, opinions and data contained in all publications are solely those of the individual author(s) and contributor(s) and not of MDPI and/or the editor(s). MDPI and/or the editor(s) disclaim responsibility for any injury to people or property resulting from any ideas, methods, instructions or products referred to in the content. |
© 2024 by the authors. Licensee MDPI, Basel, Switzerland. This article is an open access article distributed under the terms and conditions of the Creative Commons Attribution (CC BY) license (https://creativecommons.org/licenses/by/4.0/).
Share and Cite
Ma, D.; Zheng, A.; Li, C.; Yuan, J. Effect of Surface Reinforcer on Compressive Strength and Microscopic Mechanism of Freeze–Thaw-Deteriorated Concrete. Appl. Sci. 2024, 14, 5154. https://doi.org/10.3390/app14125154
Ma D, Zheng A, Li C, Yuan J. Effect of Surface Reinforcer on Compressive Strength and Microscopic Mechanism of Freeze–Thaw-Deteriorated Concrete. Applied Sciences. 2024; 14(12):5154. https://doi.org/10.3390/app14125154
Chicago/Turabian StyleMa, Dongdong, Ang Zheng, Chao Li, and Jiaming Yuan. 2024. "Effect of Surface Reinforcer on Compressive Strength and Microscopic Mechanism of Freeze–Thaw-Deteriorated Concrete" Applied Sciences 14, no. 12: 5154. https://doi.org/10.3390/app14125154
APA StyleMa, D., Zheng, A., Li, C., & Yuan, J. (2024). Effect of Surface Reinforcer on Compressive Strength and Microscopic Mechanism of Freeze–Thaw-Deteriorated Concrete. Applied Sciences, 14(12), 5154. https://doi.org/10.3390/app14125154