Article

Numerical and Experimental Investigation on Performance of Thermal Energy Storage Integrated Micro-Cold Storage Unit

1
Mechanical Engineering Department, Symbiosis Institute of Technology, Symbiosis International (Deemed) University, Pune 412115, India
2
School of Engineering, University of East Anglia, Norwich Research Park, Norwich NR4 7TJ, UK
*
Authors to whom correspondence should be addressed.
Appl. Sci. 2024, 14(12), 5166; https://doi.org/10.3390/app14125166
Submission received: 25 April 2024 / Revised: 7 June 2024 / Accepted: 11 June 2024 / Published: 14 June 2024
(This article belongs to the Topic Energy Storage and Conversion Systems, 2nd Volume)

Abstract

:
Preservation of perishable food produce is a major concern in the cold chain supply system. Development of an energy-efficient on-farm cold storage facility, hence, becomes essential. Integration of thermal storage into a vapor compression refrigeration (VCR)-driven cold room is a promising technology that can reduce power consumption and act as a thermal backup. However, designing a latent heat energy storage heat exchanger encounters challenges, such as low thermal conductivity of phase change materials (PCMs) and poor heat exchanger efficiencies, leading to ineffective charging–discharging cycles. The current study investigates the effect of the integration of a Phase Change Material (PCM) in terms of the selection of the PCM, the optimal positioning of the PCM heat exchanger, and the selection of heat exchanger encapsulation material. Numerical analysis was undertaken using 3D Experience software (version: 2024x.D31.R426rel.202403212040) by creating a 3D model of a 3.4 m3 micro-cold storage unit to understand the inner temperature distribution profile. Further, the experimental setup was developed, and tests were conducted, during which the energy consumption of 1.1 kWh was recorded for the total compressor run time of 1 h. Results indicated that an improved cooling effect was achieved by positioning the PCM trays on the wall opposite the evaporator. It is seen that a temperature difference in the range of 5 to 7 °C exists between the phase change temperature of PCM and the optimal storage temperature depending on the encapsulation material. Hence, PCM selection for thermal storage applications would have an important bearing on the material and configuration of the PCM encapsulation.

1. Introduction

Cold storage technology forms an integral part of cold-chain management, which ensures the nutritional value of the products stored remains intact and reaches the consumers within its shelf-life period. Perishable commodities, such as fruits and vegetables, continue their metabolic activities even post-harvest and start deteriorating with time in the absence of proper storage facilities. These storages ensure maintenance of the required temperature and humidity, as specified for various products, to provide post-harvest cooling that removes the field heat and prevents microbial growth in the harvest [1,2]. Particularly pertaining to a tropical country like India, which is the second largest producer of fruits and vegetables in the world, the cold storage facility is quintessential [3]. However, according to the statistics published by the Ministry of Agriculture and Farmers Welfare, India, almost 50% of the country’s cold storage is concentrated in the states of Uttar Pradesh and West Bengal [4]. The lack of cold storage in rural areas, especially in states other than those mentioned, to store fresh farm produce negatively affects the farmers’ livelihood [5]. It can, thus, be inferred that the development of on-farm cold storage facilities would directly result in food loss reduction, income generation for farmers, and, eventually, rural development [5].
Specific energy consumption of cold storage systems, when compared globally, shows considerable variation ranging from 19 to 379 kWh/m3 amongst different countries due to various factors such as technologies used, mode of operation, and temperature variation in products handled, as well as ambient temperature [6]. To reduce the specific energy consumption, it, therefore, becomes necessary to incorporate energy-efficient technologies; and phase change material (PCM) integration with conventional vapor compression refrigeration (VCR) systems has great potential to minimize the gap between the energy supply and demand in the cold storage system, especially during power outages or blackouts [7]. PCM acts as a thermal backup by changing its phase to solidify during charging and liquefy during discharging while ensuring that the desired temperature is maintained inside the cold storage by absorbing any possible internal heat generation as well as heat influx from surroundings [8].
Studies have been conducted to provide insight into the incorporation of the phase change material into the VCR system either on the condenser side or the evaporator side [9,10,11,12]. Application of PCM on the evaporator side prolongs the compressor’s OFF time, which reduces the overall energy consumption while also preventing the destructive effect of frequent ON/OFF cycles [7]. Other advantages include improvement in Coefficient of Performance (COP) [8,12], slower cold room temperature changes [13], along with better stability against thermal load variations [14,15,16]. However, it was also found that the immersion of the evaporator inside PCM degraded the system’s performance and lowered the food quality [7]. In a study conducted by Liu et al. [9], it was observed that the PCM (demineralized water) was placed in front of the evaporator and fan by modifying the air duct passage, which resulted in a reduction in energy consumption of the refrigerator prototype with PCM by 18.6% and the compressor ON-time ratio reduction by 13.6% compared with that of the refrigerator prototype without PCM. Another study [17] investigated the integration of PCM (water) into a beverage cooler by studying the effect of varying PCM slab thickness on the compressor ON-time ratio by placing it on the rare side of the evaporator. It was found that during the compressor OFF-time, sudden temperature rise was limited. A reference [18] carried out a study using tap water as PCM in racks below bare tubes of evaporator, and it was noticed that the product temperature fluctuations were reduced; however, a significant difference was noted in the PCM utilization between the bottom and the top of the refrigerator, indicating that the position of PCM placement was also important. The investigation was also carried out using organic paraffin as PCM [11], where it was found that when PCM was integrated with the evaporator, a 12% reduction was observed in the power consumption, while it reduced by 17% when PCM integration was on both evaporator as well as condenser side. Additionally, this study was conducted with the PCM-inserted heat exchanger, and the experimental results showed the potential of water as PCM to maintain the temperature of air and product even during compressor off-time up to 2 h [19]. Reference [20] assessed the airflow and the temperature distribution inside a cold chamber by CFD analysis, where solar power was used coupled with cooling pads (brine) to obtain 70% grid dependency. Further, study was carried out experimentally and numerically by placing PCM (ice/water) on the wall of the cold room; the results were validated, and the payback period was found to be 4.1 years [21]. Numerical simulation integrating latent heat cold storage for the refrigerated warehouse was implemented for 16 h a day by developing a model in ANSYS where liquid fraction contours were recorded for PCM plates placed on its roof and floor [22]. Although the incorporation of PCM into cold storage is undertaken through various means, as observed from the above studies, the method of its inclusion in terms of placement and orientation remains insufficiently explored.
Proper placement and selection of encapsulation material of the PCM in a cold storage unit is vital before detailed heat exchanger design and PCM sizing are taken up. The practical implementation of a prototype with optimal placement and encapsulation selection can accrue valuable energy savings to marginal farmers for storing their produce for a longer duration without compromising the quality and nutritional value and also experiencing relief from the pressure of selling their products on a day-to-day basis at available prices. The capital cost of existing grid-powered micro-cold stores is in the range of 2.5 × 10⁵ INR/TR (3227.3 USD/TR), which is unaffordable to marginal farmers [23]. The inclusion of PCM into such cold storage is a promising technology that can bring down the capital as well as the running cost [12], which would then reduce the economic stress on low-income farmers.
This study investigates the impact of integrating phase change material with micro-cold storage running on a vapor compression refrigeration (VCR) cycle with respect to its placement inside the storage, the selection of material to contain the PCM (PCM heat exchanger), and the temperature distribution profile inside the cold room. A strategy for optimal placement and design of the thermal energy storage unit for a micro cold storage unit with a storage capacity of 500 kg is the major contribution of this study. A numerical analysis has been carried out, and the same has been experimentally validated to adjudge the appropriate position of the PCM heat exchanger. The results of the work emphasize the selection of the PCM and its encapsulation material based on the product to be stored (fruits and vegetables). The results highlight that a temperature difference ranging from 5 to 7 °C is recommended between the phase change temperature of PCM and the optimal storage temperature advised for the stored product, depending on the material and configuration of the encapsulation containing the PCM. This outcome is important from a horticulture storage perspective owing to the perishable nature of farm produce being stored.

2. System Description

Cold storage running on a VCR cycle essentially requires a power supply that is reliable and consistent. The cold storage unit, with specifications listed in Table 1, was designed using a vapor compression refrigeration system running on grid electricity. The vapor compression system comprises four major components, namely, the evaporator, compressor, condenser, and expansion device. Of these, the evaporator and expansion device, which is the capillary tube, are placed inside the cold room, while the compressor and the condensing unit are situated on the outer side. A humidifier is also placed outside, which generates steam through an electric heater arrangement in order to maintain the humidity within the range in the cold room, which is essential for the preservation of perishable food items.
Figure 1a,b displays the two views (front and side) of the 3.4 m3 cold storage setup used for this experimental study. The setup comprises the VCR system, the humidifier, and its control panel. The cold room door for product loading/unloading is also shown. The different tests, namely, the no-load test, the water sample test, and the PCM sample test, were conducted on this setup.
The section that follows explains the methodology involving the detailed procedure undertaken to carry out the current study.

3. Materials and Methods

The current investigation was taken up through numerical analysis and experimentation, which is elaborated further.

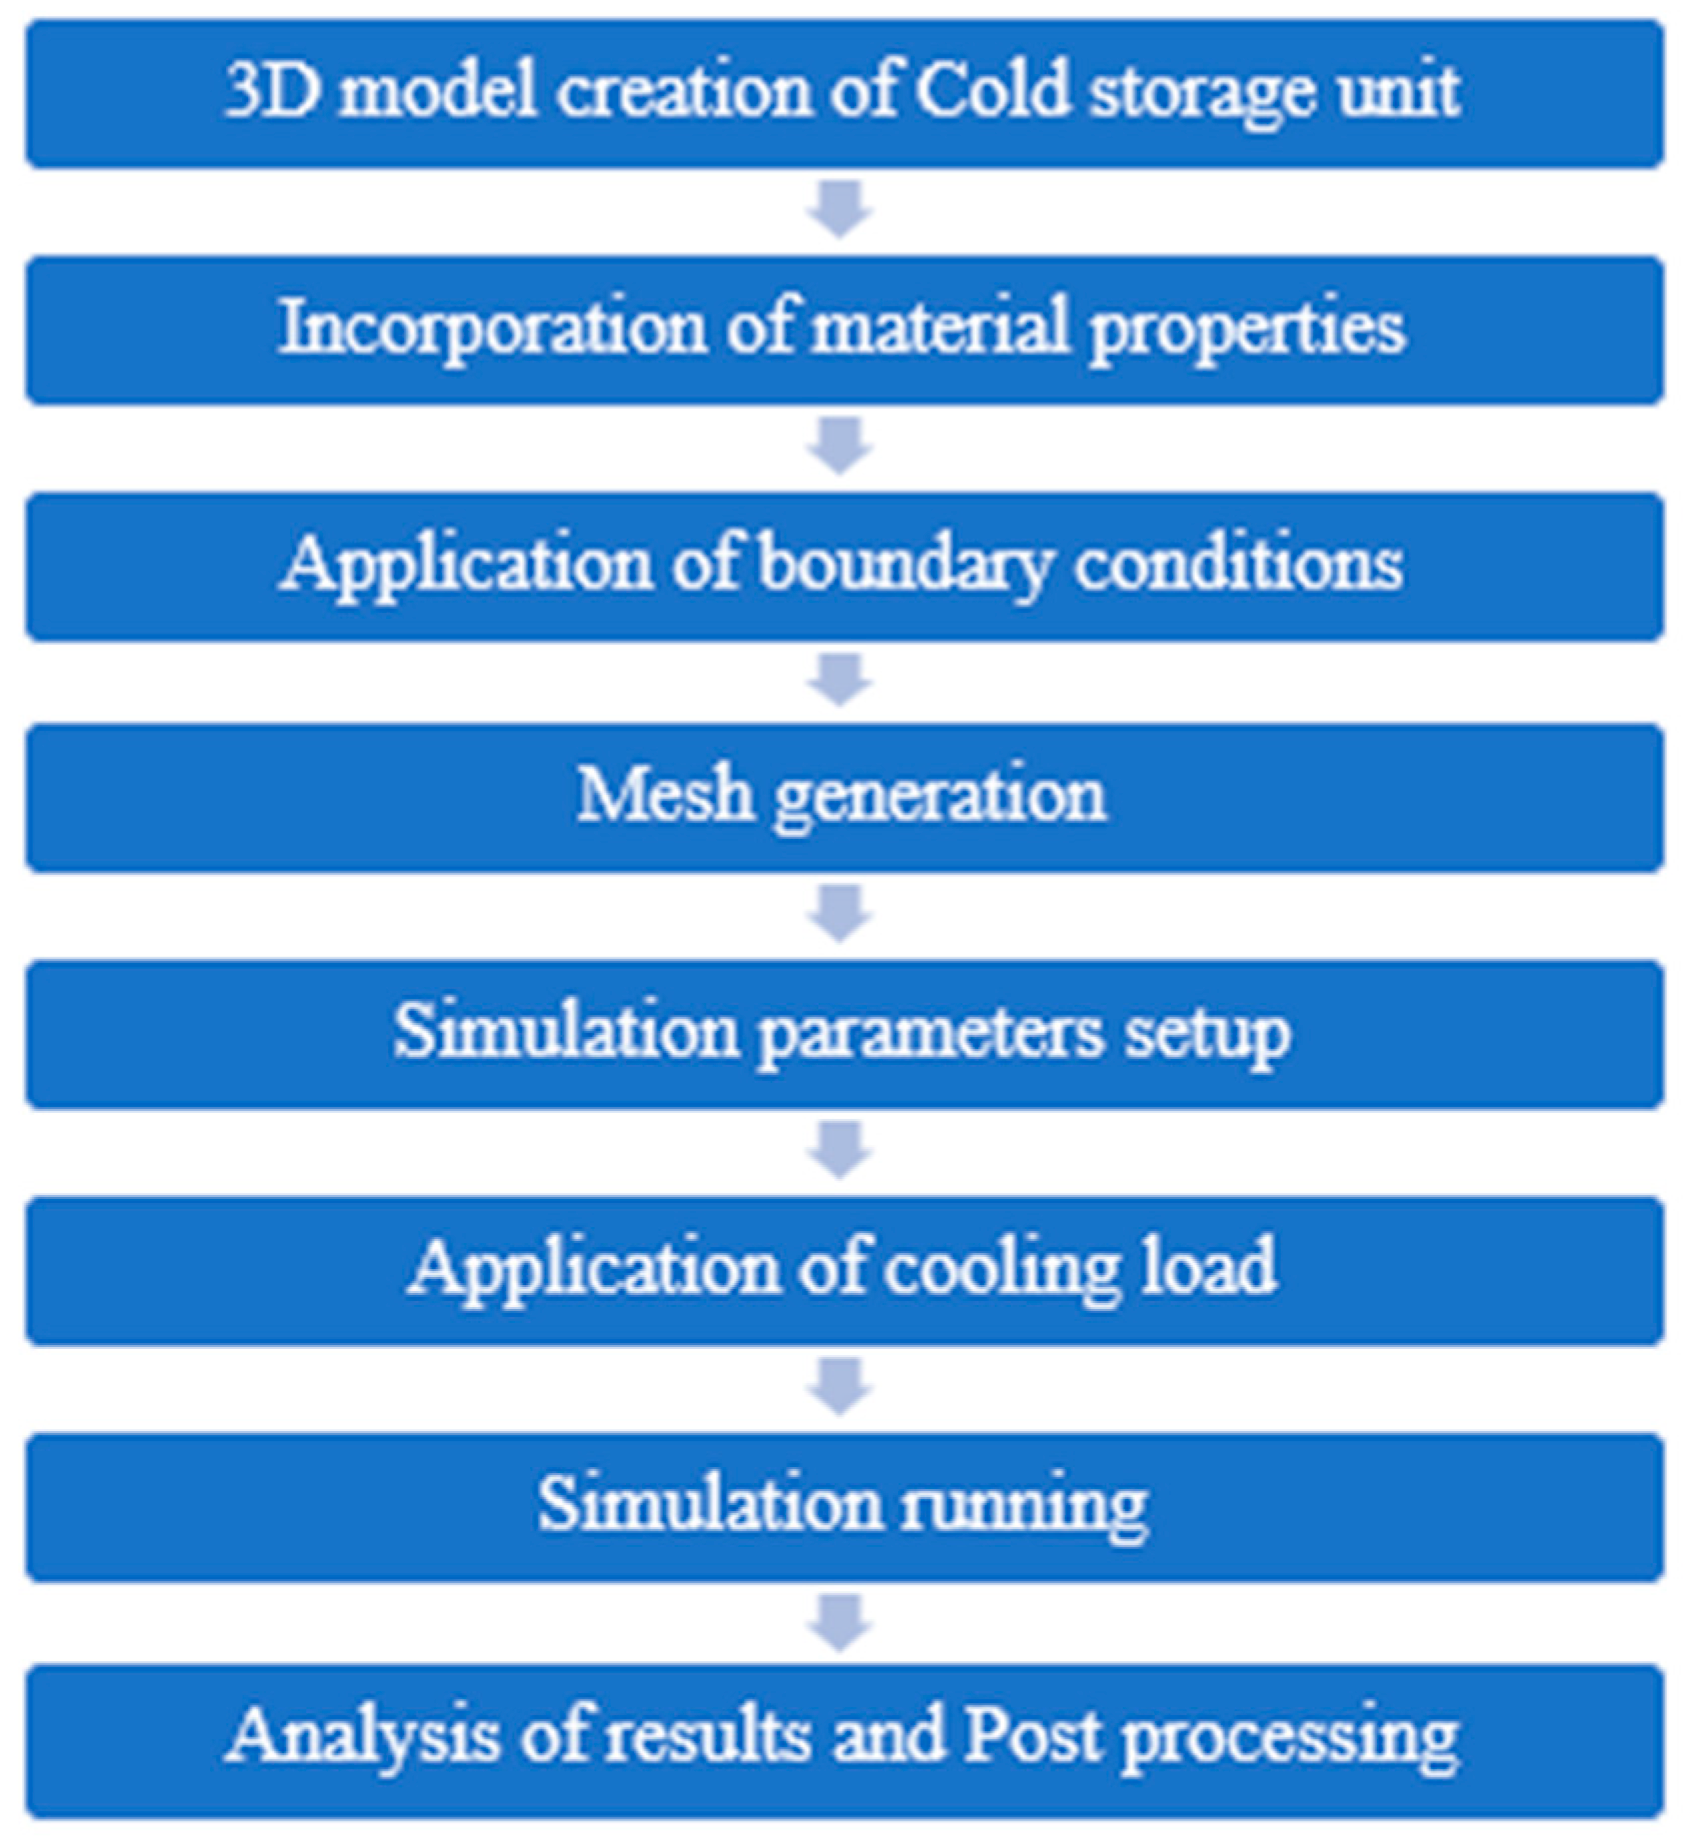
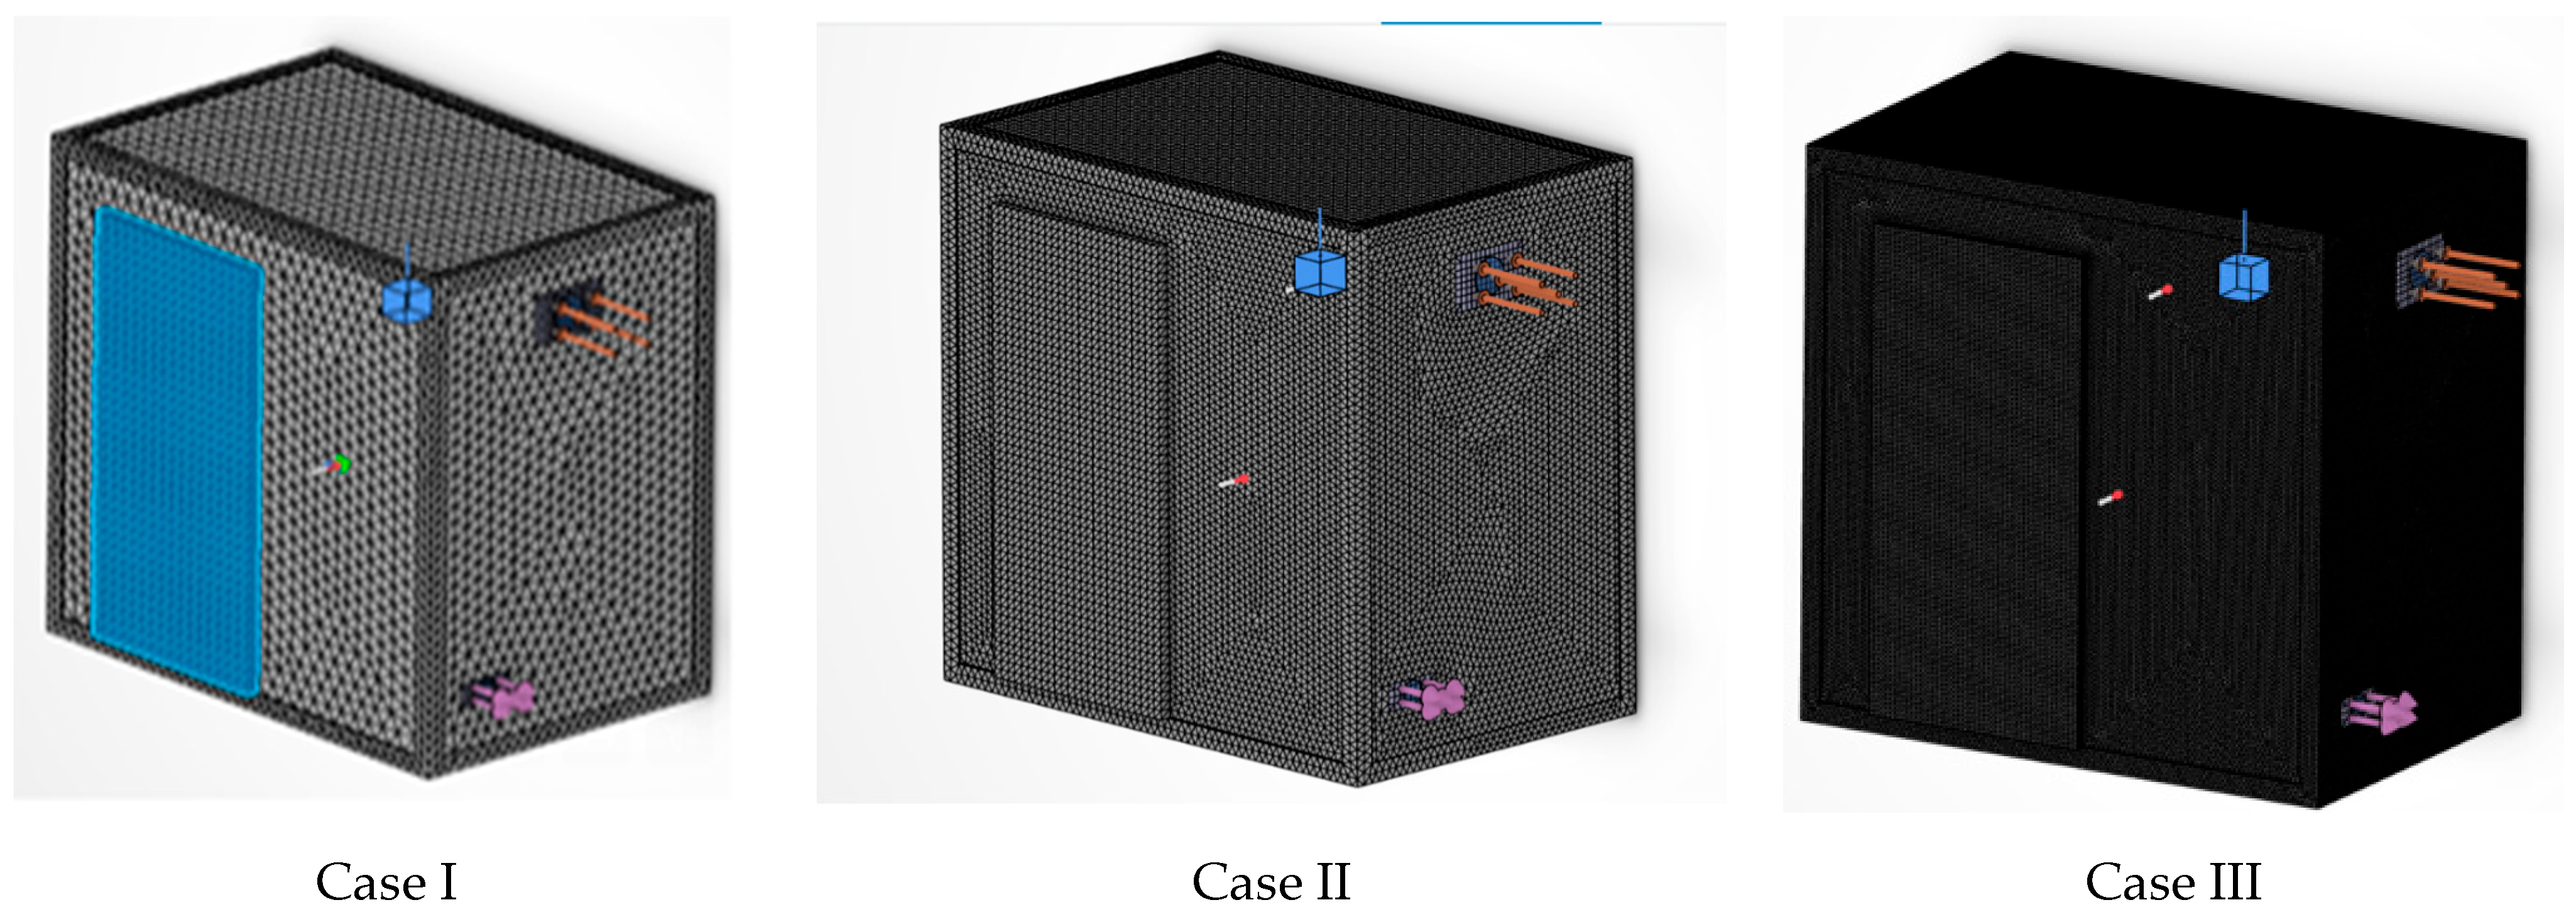
3.1. Numerical Analysis

A numerical simulation of the cold storage was taken up by employing a 3D Experience simulation software (version: 2024x.D31.R426rel.202403212040) to analyze its thermal behavior. A general outline of the process undertaken is displayed in Figure 2.
Using 3D Experience software, a 3D cold storage unit model was created as the first step for initialization, with all the essential elements such as a storage space, external PUF insulation, VCR system, and stainless steel rack incorporated. Figure 3 illustrates the CAD model of the cold storage unit. The cooling effect provided by the evaporator is displayed as an inlet in the model to allow for air flow inside the cold storage for simulation purposes, with the provision of an outlet opening below the evaporator slot to ensure proper air circulation.
Low-temperature air (inlet condition), stainless steel (SS), and copper material properties were assigned, as specified in Table 2, and the system’s initial conditions, as well as external factors that affected the simulation, such as ambient temperature or heat sources, were defined along with boundary conditions for steady state with 3 m/s inlet velocity.
Further, the geometry is discretized for accurate simulation to generate fine mesh. A mesh-independent study was undertaken by carrying out simulations by changing the mesh size. The maximum mesh sizing refers to the largest allowable element size in the generated mesh, thus controlling its coarseness and enabling the capture of the necessary details of the model with adequate resolution. A larger maximum mesh size will reduce the computational time at the cost of accuracy, and the converse is the outcome in the case of a smaller maximum mesh size. Absolute sag is another important parameter that controls the allowable deviation of the mesh elements from the true geometry of the model. Higher values permit greater deviation, which would simplify the mesh and reduce the simulation time, but again, accuracy is compromised. Table 3 details the variation in these parameters of maximum mesh size and absolute sag through three different meshing solutions along with the required simulation time, while Figure 4 represents the images generated for this meshing. It has been observed that changing the mesh sizes impacted the simulation by affecting the display resolution with negligible change in temperature; however, the time taken for the simulation was almost 1.5 times with a higher mesh count. The simulation was carried out with Case I as the optimum mesh design through 3D Experience software, striking a balance between computational time and consistency of results.
The simulation parameters, such as time step, simulation duration, and solver settings, were configured, and the cooling system within the unit was modeled, with temperature, flow rates, and control mechanisms taken into account. The initial temperature of the cold room was set to 26 °C, which was in line with the internal cold room temperature during the experimentation. The simulation was then run with continuous error monitoring, and the results were analyzed using post-processing tools.
Further, the experimental trials undertaken are explained in the subsequent section.

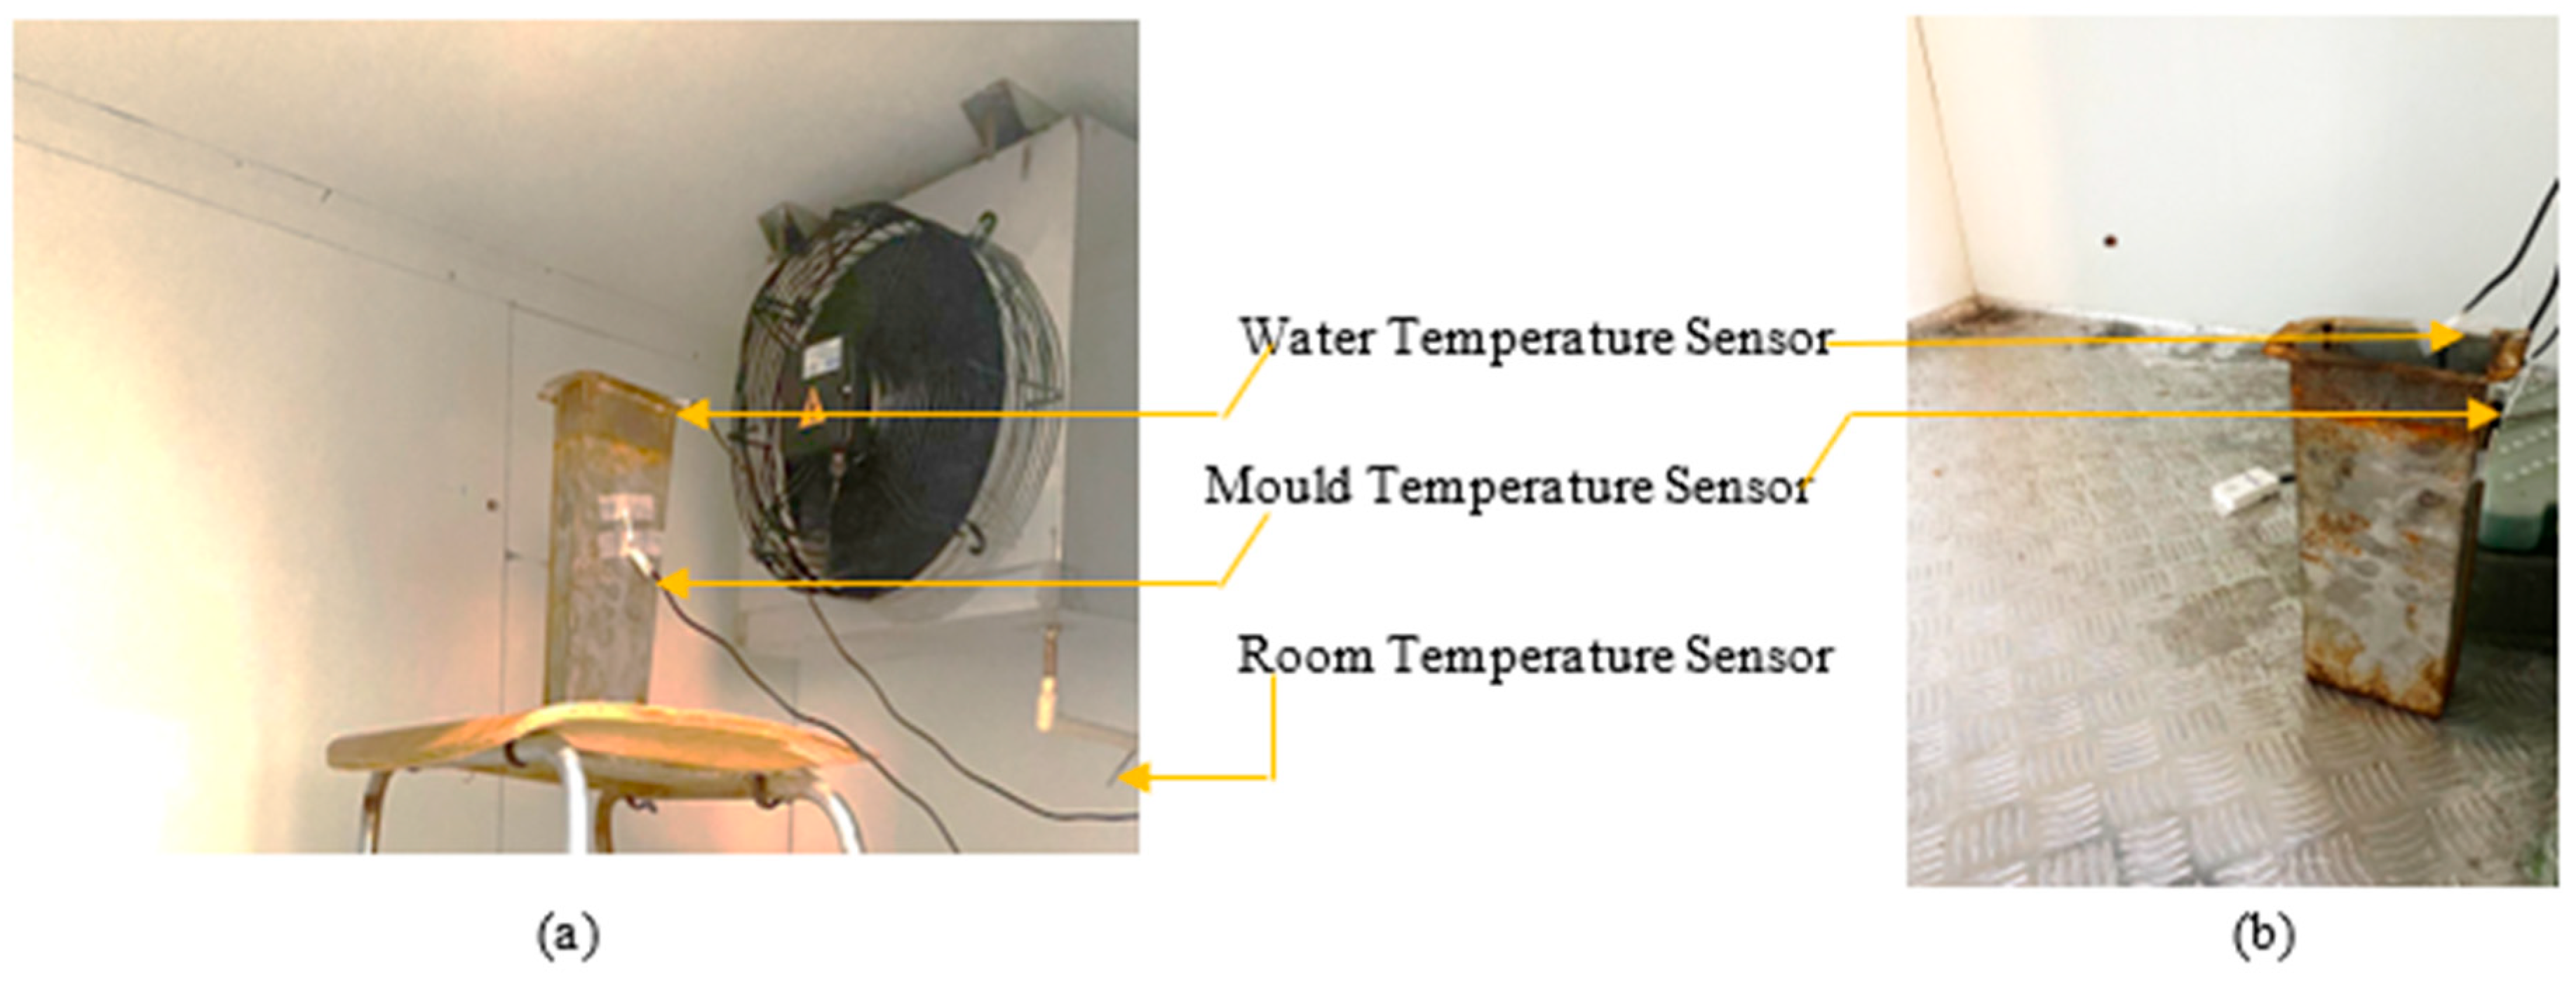
3.2. Experimental Procedure

The experiments were carried out as presented in Figure 5a. The no-load test was initially conducted wherein the cold room temperature was set to −5 °C to record the pull-down time and study the compressor’s on–off cycle, where the compressor cut-off occurred at −5 °C and the cut-in temperature was set to 0 °C.
While the no-load test assumption was that the temperature inside the room was equally distributed, the water sample tests conducted considered variations in the internal temperature profile to determine the suitable location to place the load and the PCM heat exchangers in the storage that would provide the necessary cooling effect. With the intent to study the cooling effect and charging of the PCM at different locations, the space inside the cold room was divided into areas where the cooling effect from the evaporator was anticipated to be maximum and minimum. Numerical simulation results also support the choice of the locations, with position A in front of the evaporator showing maximum cooling effect while position B exhibited minimum cooling. Accordingly, metal molds with 1 liter of water were placed at different locations in the cold room, as shown in Figure 5b, and the water temperature was constantly recorded.
The parameters of the sensors used for measuring the temperatures at various points are reported in Table 4. The actual arrangement of the water sample test setup is displayed in Figure 6, where Figure 6a shows the mold placed in front of the evaporator at location A, and in Figure 6b, another mold is placed at the same time for the test at location B. The simultaneous testing helps determine the region with a higher cooling effect.
Further, PCM sample tests were carried out by placing 250 mL of PCM under similar conditions with only the materials holding the PCM varying, which were stainless steel and copper in front of the evaporator (location A), as seen in Figure 7, to select the appropriate PCM heat exchanger material. Temperature sensors were placed at various points to record the data for analysis.
The thermophysical properties of the PCM used for the sample test are displayed in Table 5.
The experimental outcomes were compared with numerical results that provided a comprehensive understanding of the thermal behavior of the cold storage unit.

4. Results and Discussion

The outcomes of the analysis and tests conducted, as explained in the previous section, are elaborated subsequently.

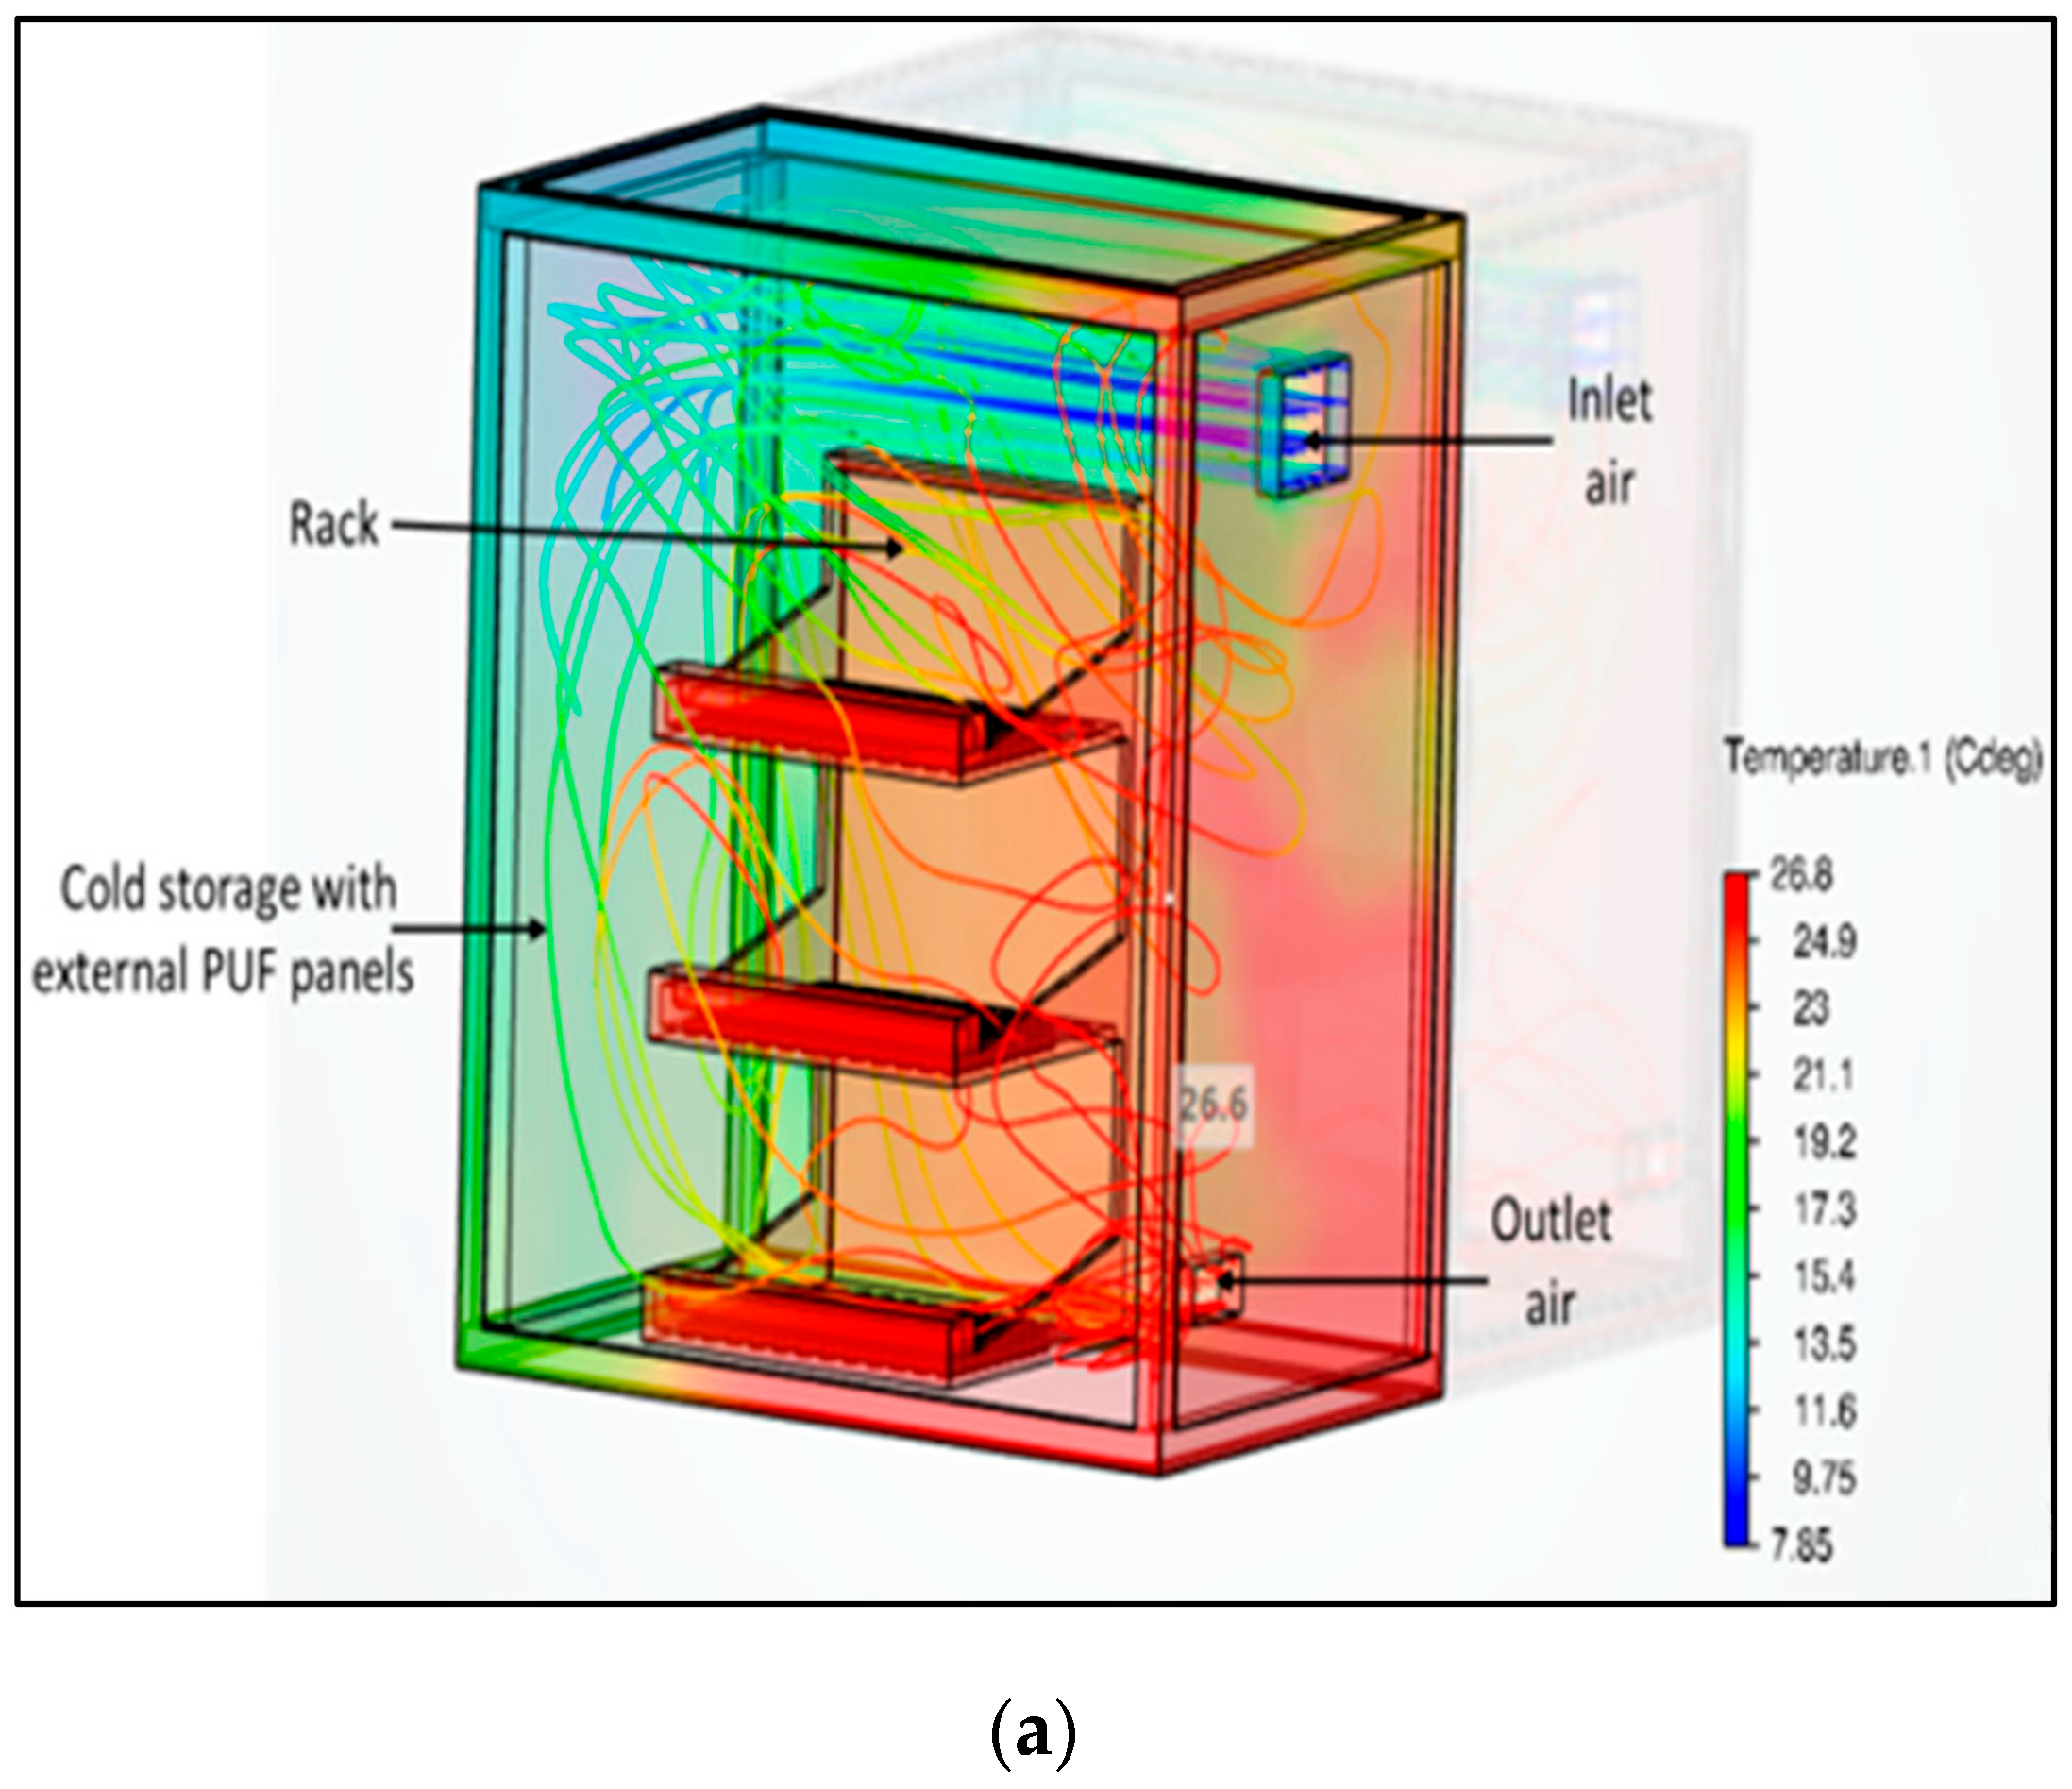
4.1. Numerical Simulation for the Cold Room Temperature Distribution Profile

Numerical analysis was carried out to understand the cooling effect inside the cold room and, hence, obtain the temperature distribution profile. Figure 8a demonstrates the results of the simulation, which indicates dense lines at low temperature in the region in front of the evaporator (position A) till the opposite wall is reached, following which, the temperature rise is observed that continues as the number of passes increases, and, finally, after absorbing the heat in the room, the highest temperature is observed at the corner of the cold room below the evaporator (position B). This confirms further the placement of PCM trays on the walls, opposite and adjacent to it, for further numerical analysis of PCM heat exchanger material. The temperature in the cold room varied in the range from 26.8 to 7.8 °C, which mainly depends on the heat ingress with maximum heat transfer observed in the upper region of the cold room, specifically the region in front of the evaporator.

4.2. Numerical Simulation with Varying PCM Encapsulation Material

Material selection for containing PCM plays an important role in its integration into cold storage. The heat transfer mechanism of charging and discharging is dependent on the heat transfer ability of the encapsulation material. To illustrate this effect, the analysis of a PCM container inside a cold storage unit using 3D Experience software was undertaken, which included two scenarios where heat loads were applied to copper and stainless steel (SS) containers.
Simulations were further performed considering two arrangements. The first case considered the rectangular PCM trays on the opposite and adjacent walls of the cold room, while the second case replicated the experimental setup of the PCM sample test using the tumbler. The simulation according to the first arrangement, which replicated cooling from an evaporator with 3 m/s air velocity, revealed that the PCM container temperature reached a minimum of 7.85 °C from an initial 27 °C in the case of copper, as seen in Figure 8b. Similarly, the minimum temperature reached in the case of SS was 9.75 °C, as shown in Figure 8c. The simulation results thus obtained are indicative of copper’s superior thermal conductivity and temperature stability over SS trays in PCM utilization, demonstrating its ability to handle heat loads effectively to maintain lower temperatures.
In the second arrangement, a model of a copper tumbler was developed to hold 250 mL of PCM, as shown in Figure 9, with the tumbler’s enlarged view exhibited, indicating its area of cross-section.
The result obtained is graphically displayed in Figure 10, wherein the PCM is cooling down from 21 °C to −4 °C, which is the phase change temperature of the PCM. The time taken for the cooling process was approximately 8400 s.

4.3. No-Load Test

In order to check the functionality of the cold storage, the study on time required to bring down the air temperature in the room (pull-down time) to the desired temperature became essential, and a no-load test was, hence, conducted. The result obtained by running the VCR system to maintain the room temperature at −5 °C for a set temperature gradient of 5 °C (between 0 °C and −5 °C) is shown in Figure 11, where the room temperature reaches 0 °C (required for most non-freezing farm products) in less than 20 min from an initial temperature of 25 °C, while −5 °C was obtained in 34 min. The compressor cycle time was also recorded, and it was found that the average compressor ON time was 5.75 min for an average cycle time of 15 min for a total duration of 60 min, without considering the initial pull-down period. During this cycling test, the total energy consumption was recorded to be 1.1 kWh, including the 34 min of pull-down time. Another important observation in this test was the inability of a simple VCR cycle to maintain the set temperature even for a short duration after the compressor went OFF. The instant rise in the cold room temperature is not in favor of perishable food storage and adversely affects their shelf-life. Hence, integrating PCM would ensure temperature maintenance with a gradual rise in inner temperature due to the thermal backup provided.

4.4. Water Sample Test

This test aimed to determine a suitable location inside the cold storage where the maximum cooling effect of the evaporator could be utilized. Accordingly, two metal molds, each containing 1 liter of water, were each placed in positions, as explained in Section 3. Separate temperature sensors were used to measure the room temperature, the metal mold temperature, and the water temperature. The observations can be seen as plotted in Figure 12 for positions (A) and (B), respectively.
When the mold was placed in front of the evaporator (A), it was seen that the freezing point of water was reached at around 71 min, while the same for position B was found to be after 130 min, which clearly indicated the cooling effect variation with change in location within the cold storage. Another vital observation was the temperature difference observed between the room temperature and the mold temperature, while in position A, this was negligible; in position B, a difference of about 7 °C was observed, indicating a reduction in heat transfer toward the corners of the cold room. Having observed that placing the load in front of the evaporator reduces the pull-down time and enables better heat transfer, further experiment was carried out using a PCM sample in position.

4.5. PCM Sample Test

In this test, 250 mL of PCM sample was taken in two different containers, which were made of stainless steel and copper material. The test was carried out to identify the material suitable to hold the PCM to enable better charging and discharging efficiency and, thus, could be recommended as PCM heat exchanger material to have longer thermal backup properties. Various temperature sensors were placed to monitor the room temperature, the surface temperatures of copper and stainless steel, along with the temperature of PCM in both these containers. Figure 13 displays the observation that shows that the temperature difference between the metal and the PCM it contains is only 3 °C in the case of copper container in comparison to stainless steel, which is 7 °C. This complements the results obtained by numerical simulation that gives a clear indication that since copper has higher thermal conductivity (398 W/mK) than stainless steel (15 W/mK), it aids heat transfer across it when used as PCM heat exchanger material for improved charging and discharging effectiveness. Another significant outcome of the PCM sample test is that it helps understand that a temperature difference exists between the phase change temperature of the PCM and the effective cold room temperature, which is in the range of 5–7 °C. This acts as an important parameter in selecting the appropriate PCM for a given storage application, especially in the food industry, where maintaining a particular recommended temperature is essential to increase the shelf life of the product and maintain its nutritional value.

4.6. Comparison between Numerical and Experimental Results

The validation of the current work is carried out by comparing the results obtained through numerical method with the experimental results. One-dimensional transient heat transfer modeling was undertaken to study the cooling-down profile of the PCM in a copper tumbler from the initial ambient temperature to the phase change temperature of the PCM. As the cool air flows over the tumbler, the heat is absorbed through convection while the temperature inside the PCM drops due to the conduction phenomenon, considering the homogeneous properties of the PCM. The governing equation for heat transfer affecting the change in the PCM temperature is given by Equation (1).
α 2 T   x 2 + h ρ a i r C p   a i r ( T a i r T p c m ) = T t ,
where α = k p ρ p   c p is the thermal diffusivity of PCM, and k, ρ, and cp are the thermal conductivity, density, and specific heat of the PCM. Also, h, T, and t are the conductive heat transfer coefficient, temperature, and time, respectively. After discretizing Equation (1) using the explicit method into five nodes along the length of the rectangular cross-section of the tumbler, the node temperatures are calculated as follows:
T i , j + 1 = T i , j +   t x 2   [ T i + 1 , j 2 T i , j + T i 1 , j ] + h ρ a i r C p   a i r ( T a i r T p c m ) ,
where Δx and Δt are the nodal distance and time step considered during the simulation [24]. The numerical modeling was undertaken using computational code developed in Python (version 3.7). Figure 14 shows the numerical and experimental values of the temperature at the center of the test container with variation in time, and it can be concluded that the numerical data are consistent with the experimental values obtained during the PCM sample testing.

5. Conclusions

An on-farm micro-cold storage unit is an emerging technology in cold-chain supply management. Its utility in terms of shelf-life extension and preservation of the nutritional value of the produce is beneficial to marginal farmers. However, a grid-operated cold storage unit is energy-intensive, the burden of which directly affects low-income farmers. Hence, the incorporation of phase change material is undertaken to utilize its energy-saving potential. The inclusion of thermal energy storage enhances system performance; however, the effect of its placement and selection of its encapsulation material must specifically be taken into consideration. Hence, the VCR-operated micro-cold storage unit was analyzed through numerical simulation, and the results were validated experimentally for the possible benefits of PCM integration. The following are the outcomes of this study:
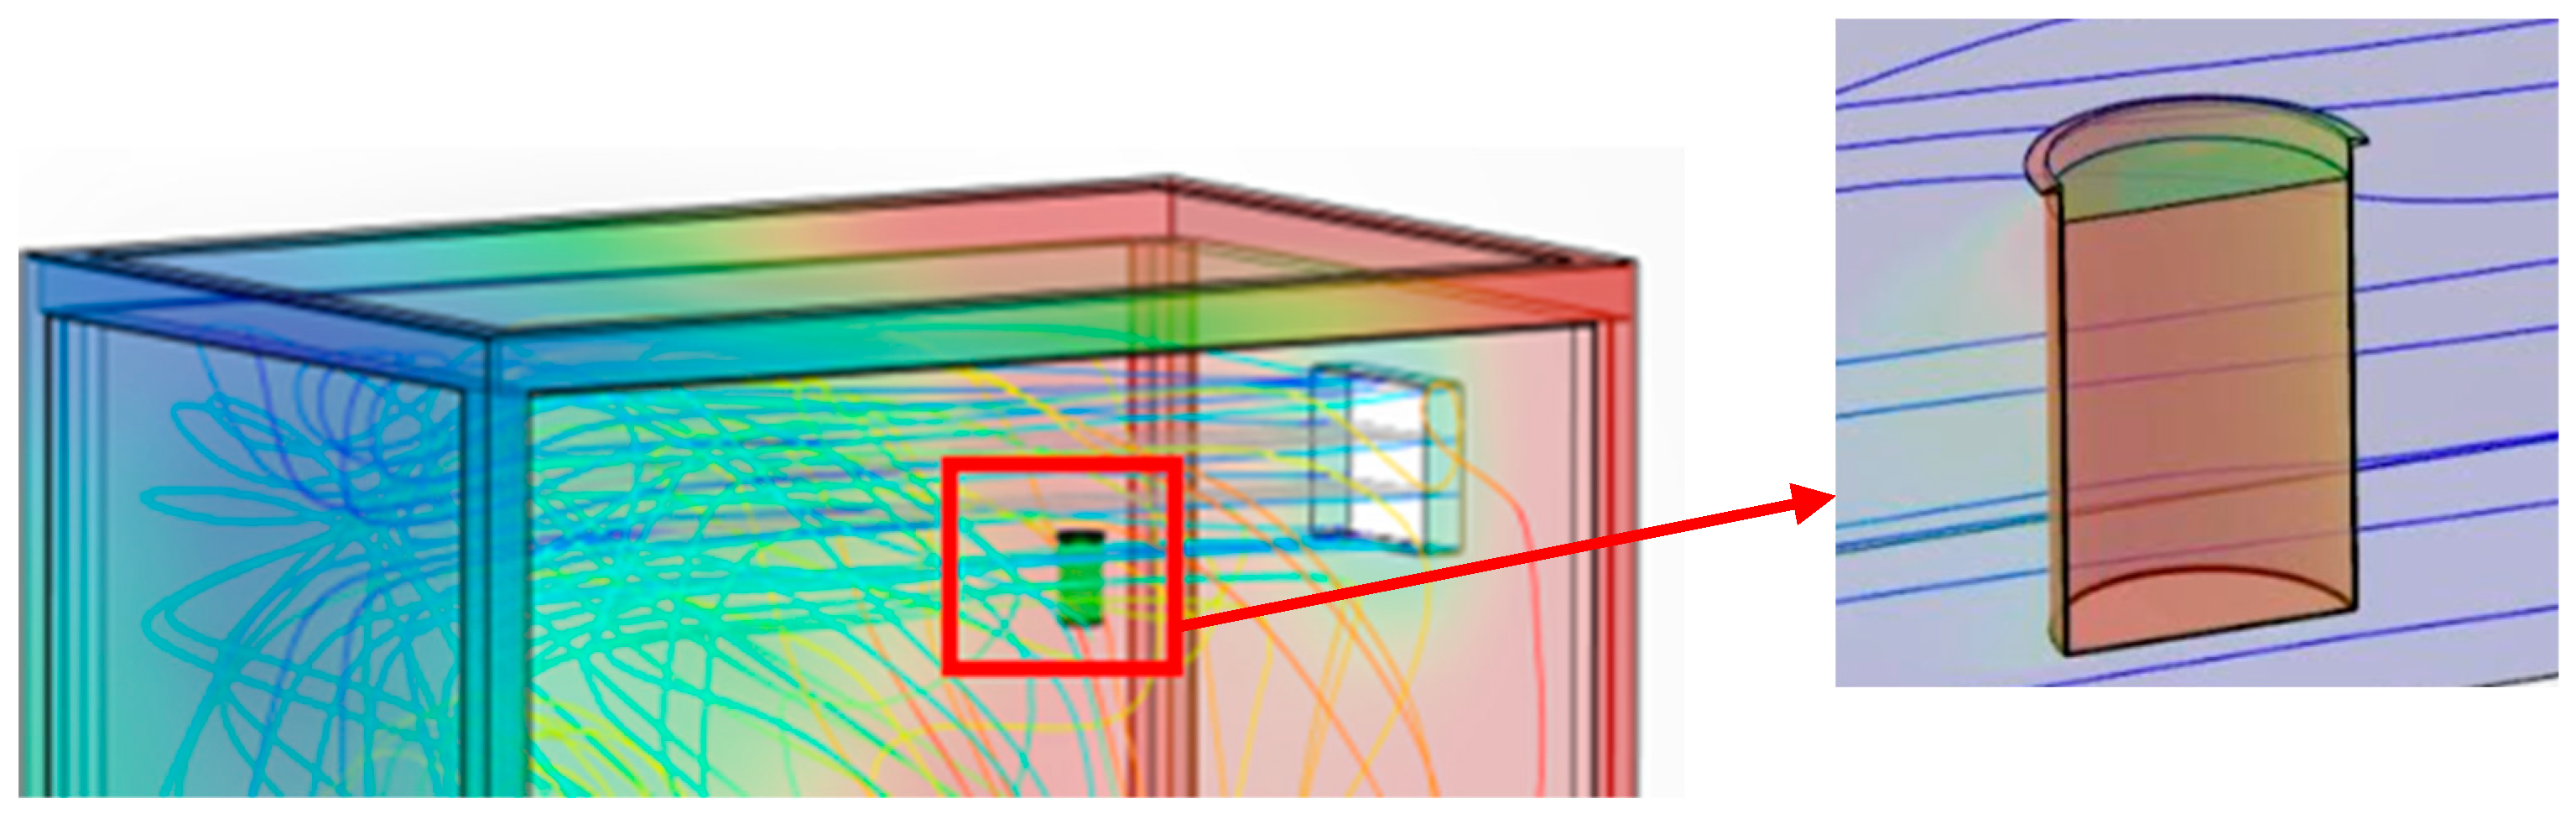
  • Numerical simulation carried out using 3D experience highlighted that the temperature distribution inside the cold room varied from 26.8 °C to 7.8 °C at the beginning of the storage cycle, and the maximum heat transfer was observed in the upper zone of the cold room where the evaporator cooling effect was seen to be maximum. The mesh independence study was carried out, and it was observed that changing the mesh sizes impacted the simulation by affecting the display resolution with negligible change in temperature profile; however, the time taken for the simulation was almost 1.5 times with a higher mesh count;
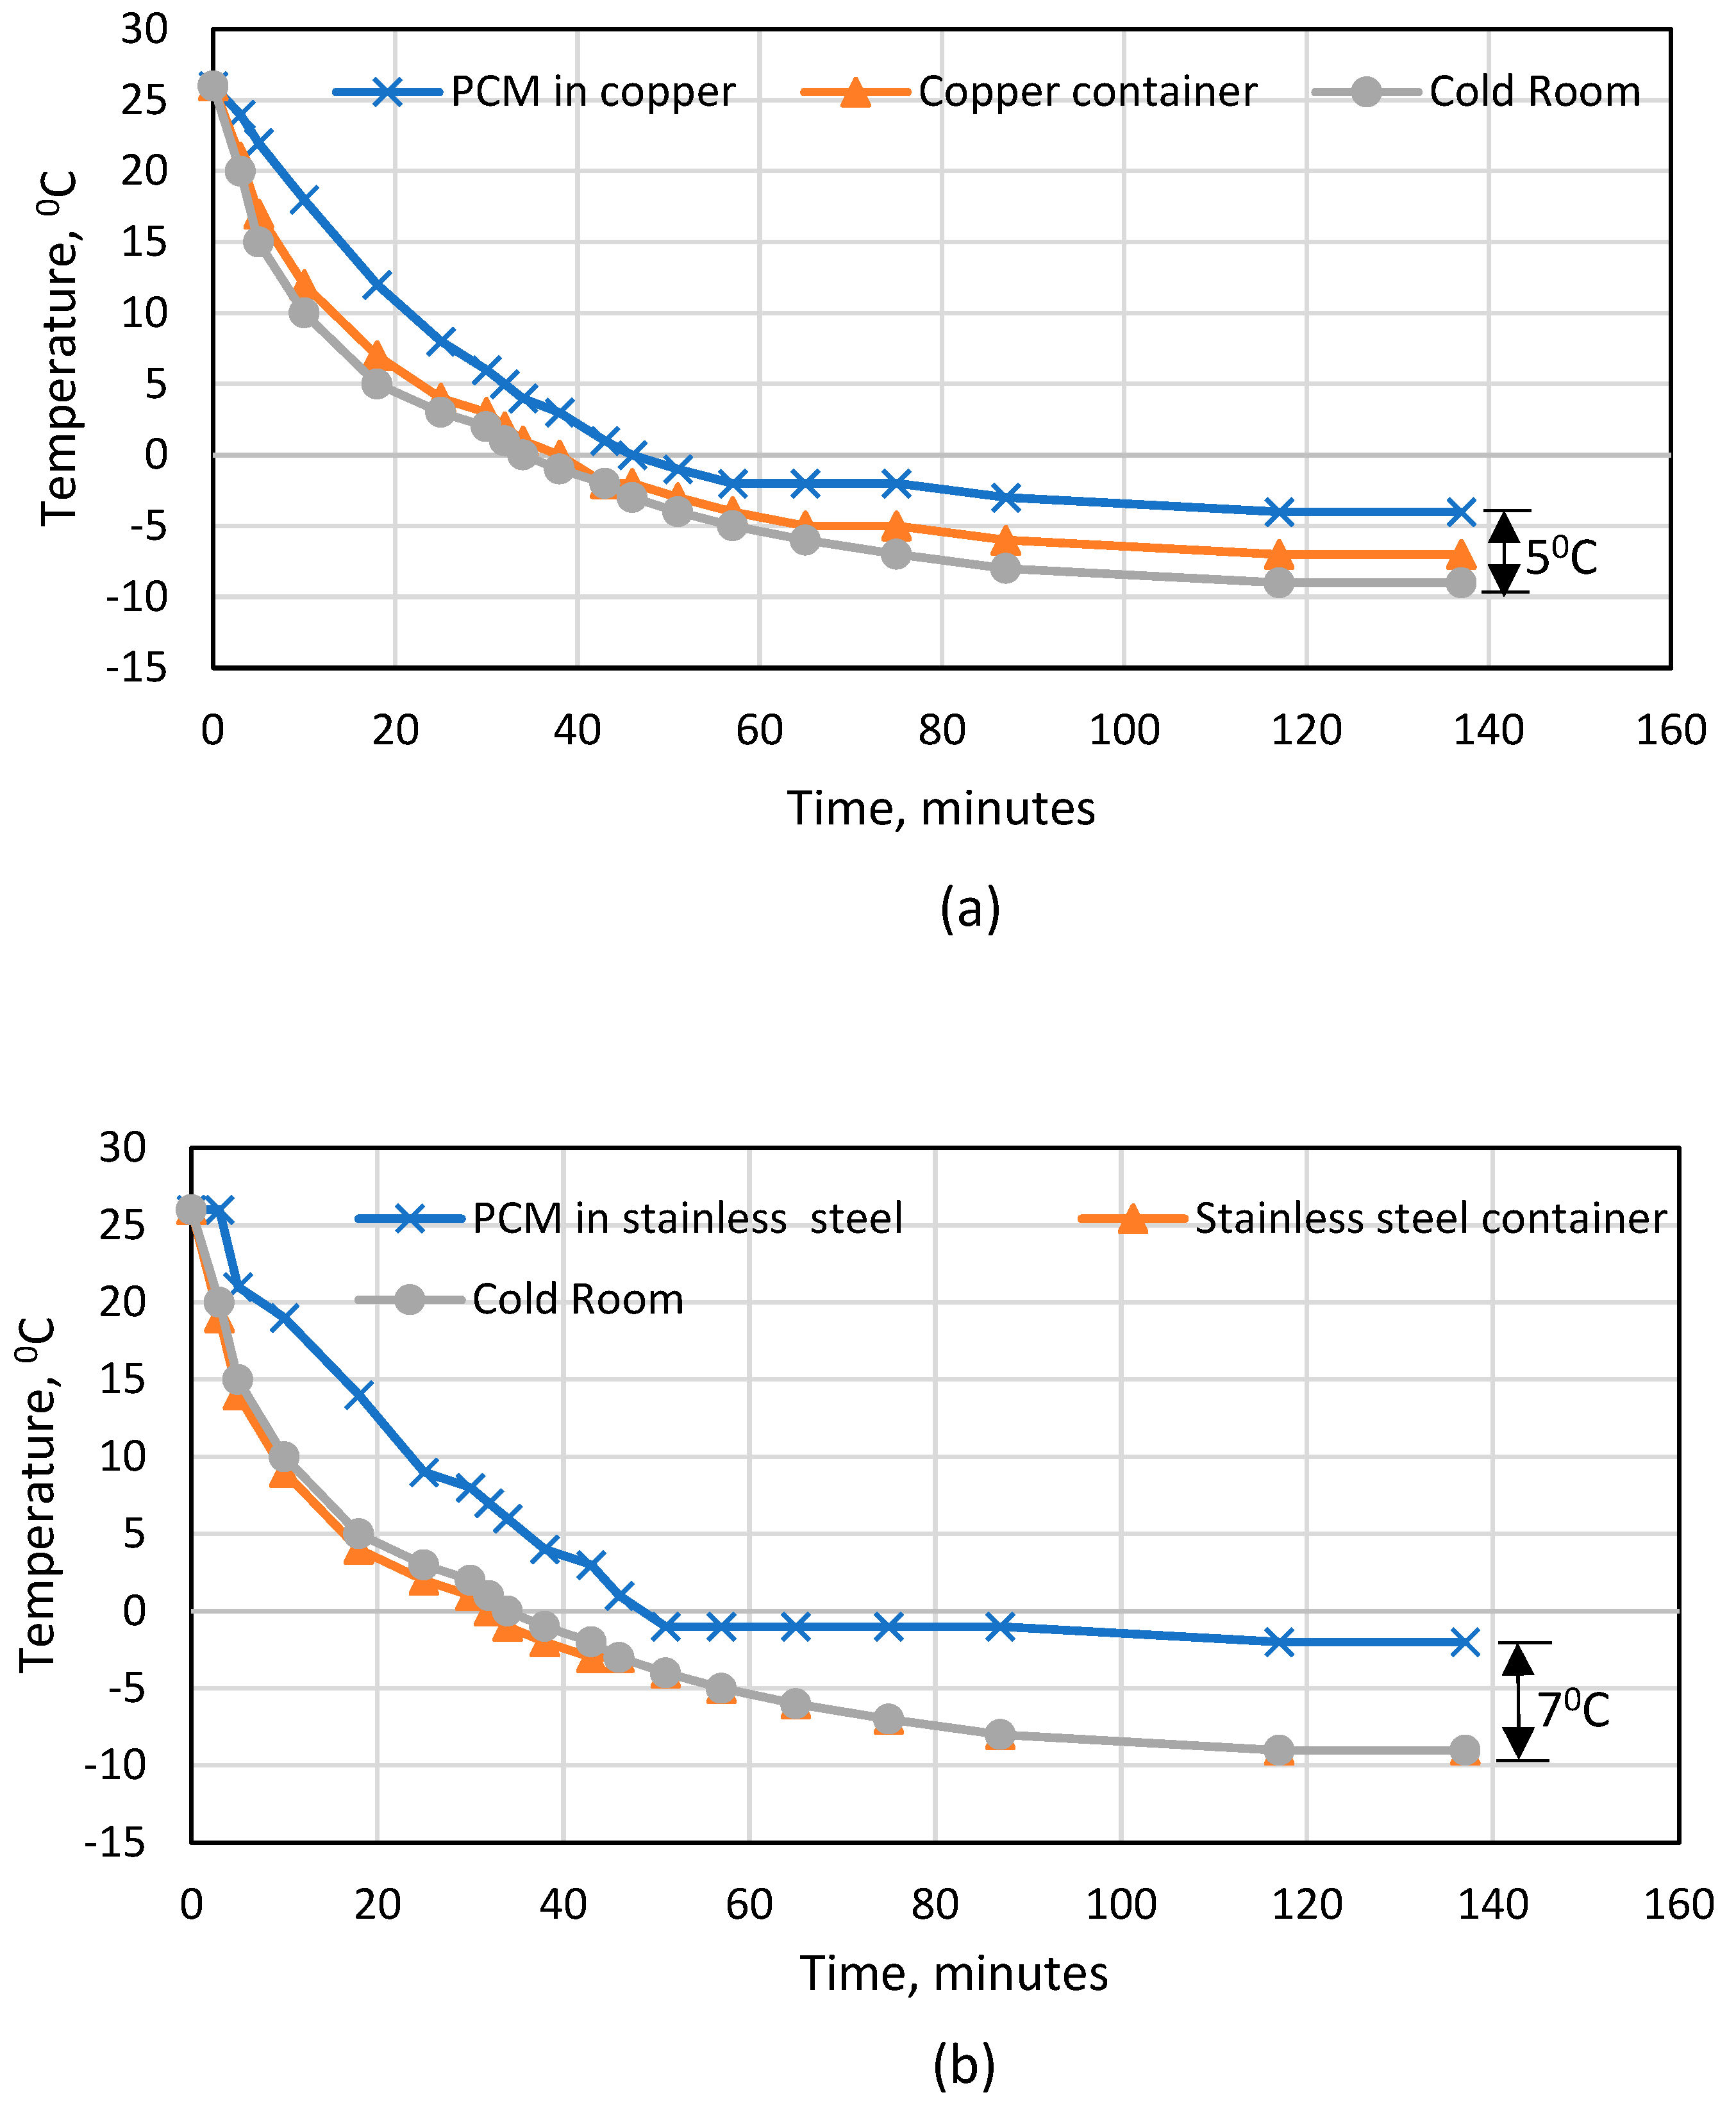
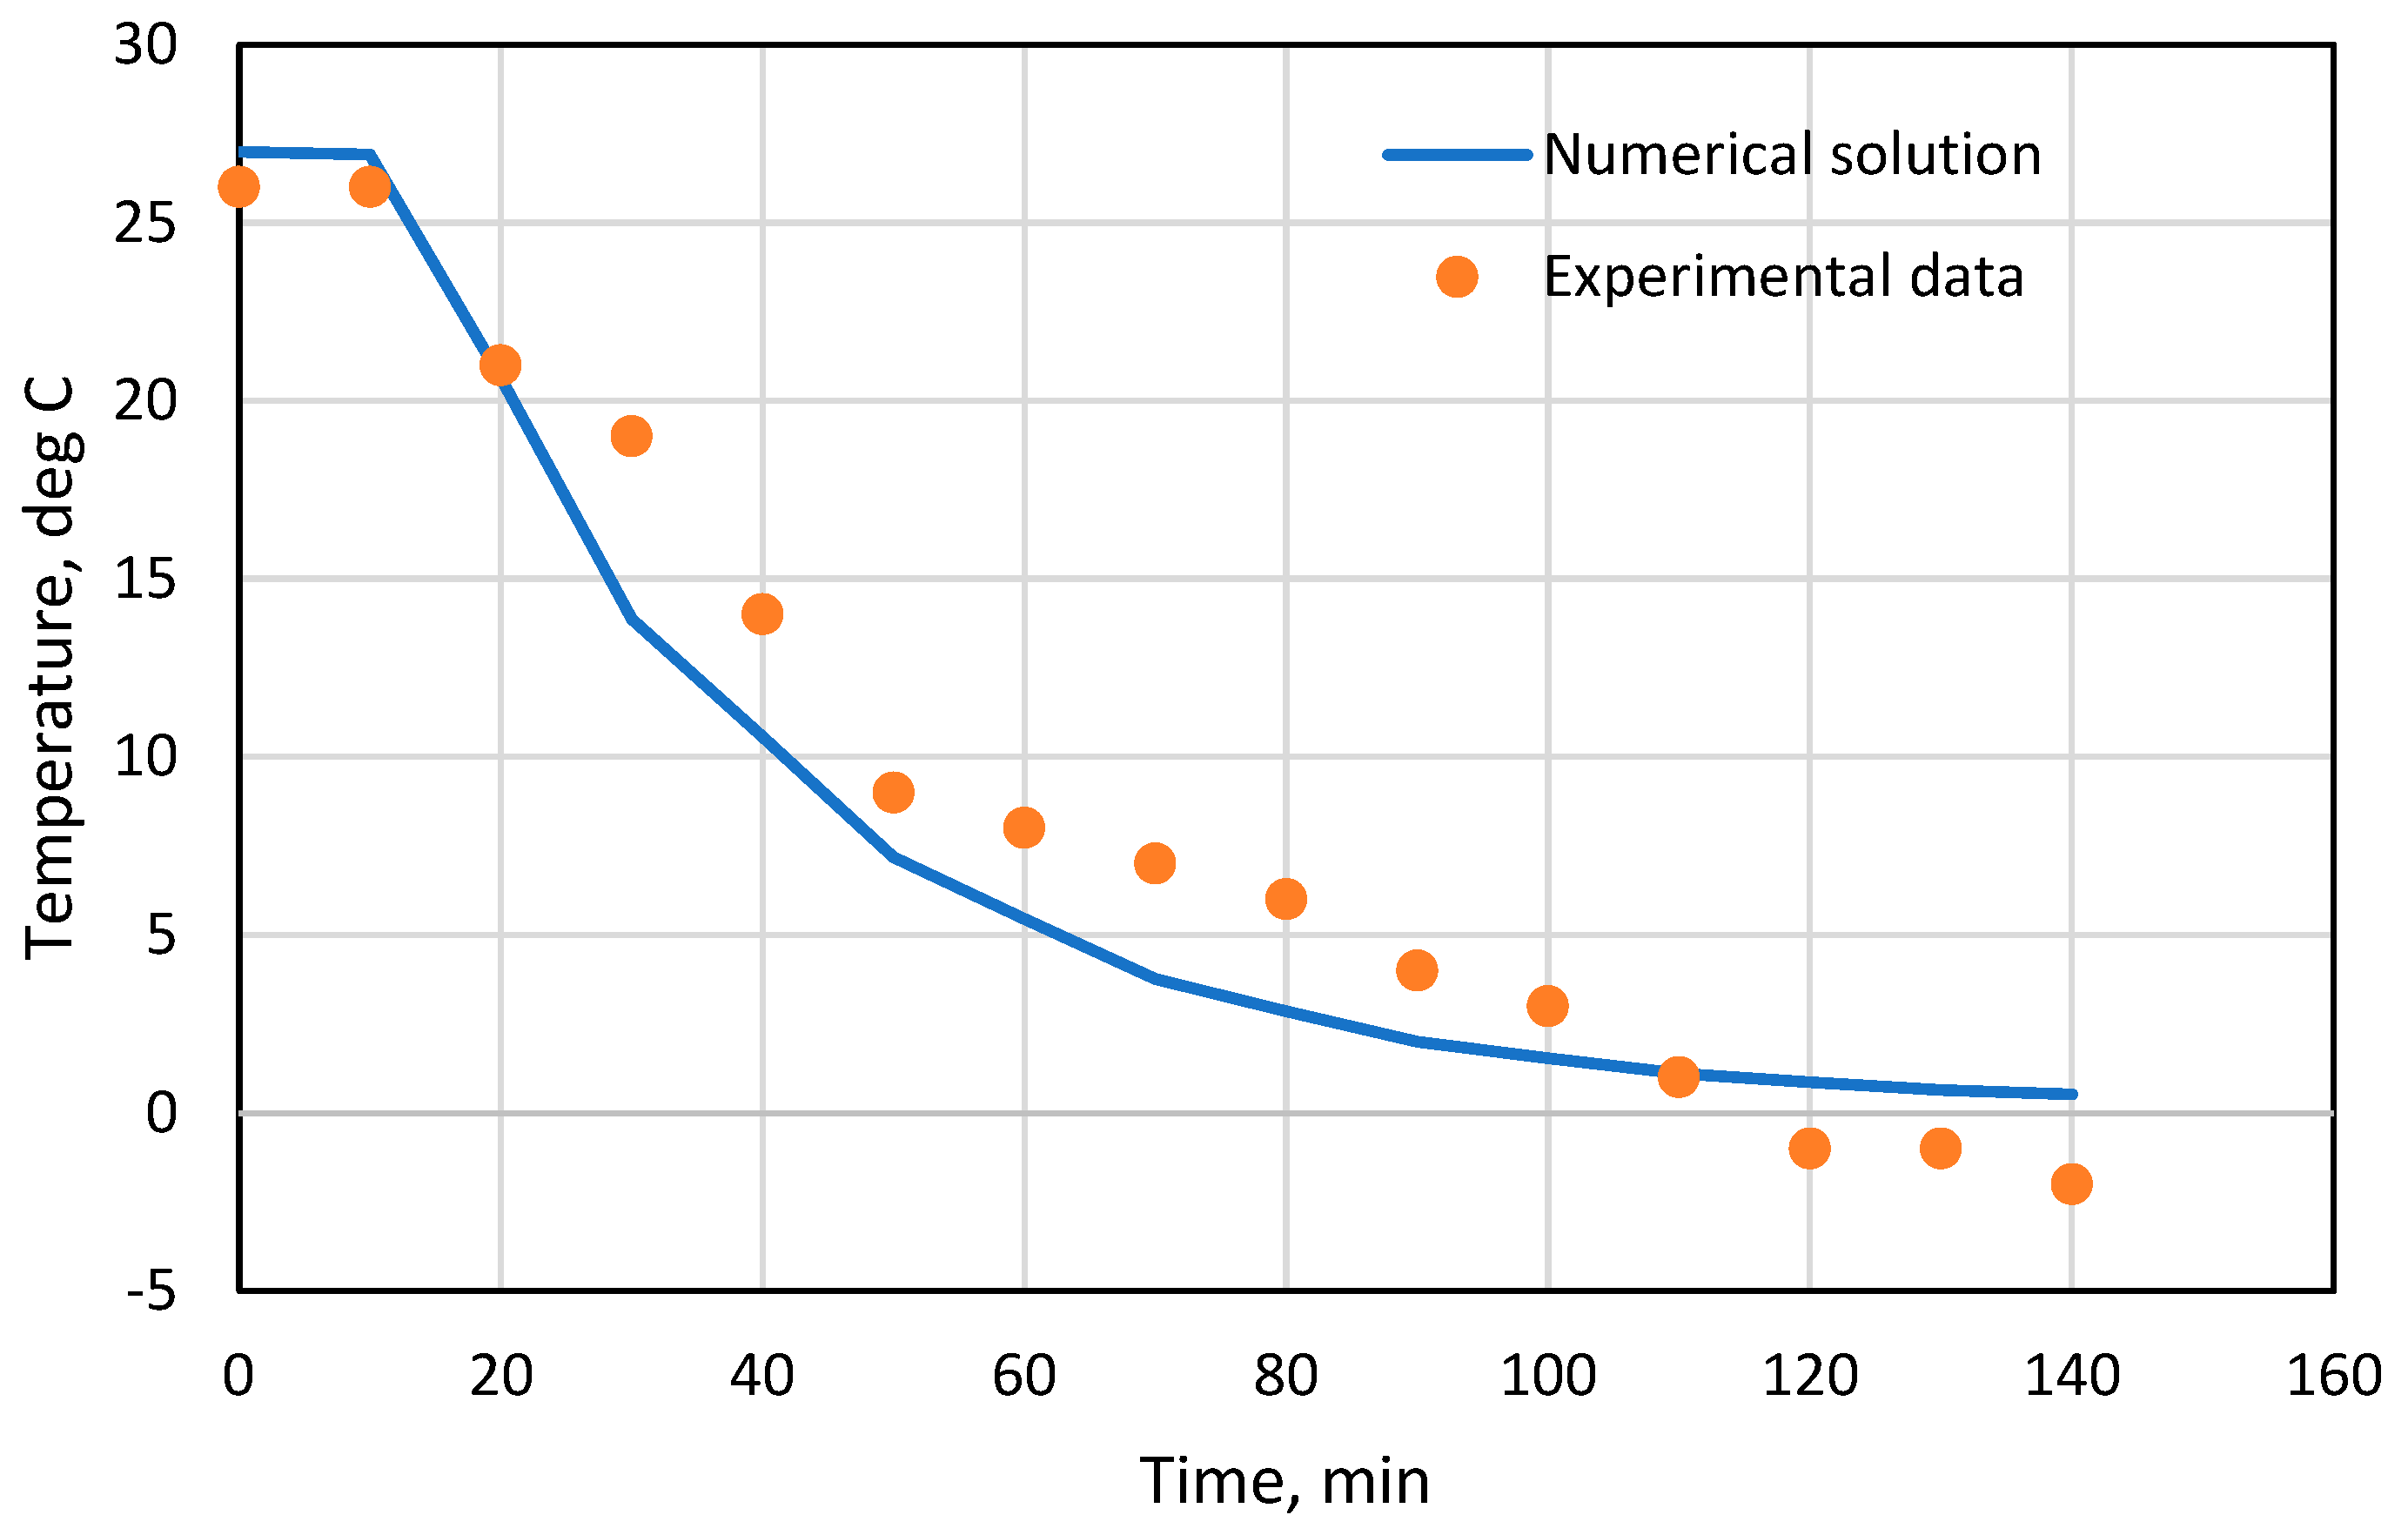
  • This study was also undertaken to select the appropriate encapsulation material for PCM, where copper and stainless steel were compared both numerically and experimentally. The experimental results indicated that SS offered an excess thermal resistance of 4 °C in comparison to copper, inferring improved cooling effect penetration into the copper heat exchanger. Numerical simulations, as well as analytical computations, were found to be in conformity with the experimental results. The maximum cooling effect was obtained when copper containers as PCM encapsulations were positioned on the wall opposite the evaporator and its adjacent wall, providing the necessary thermal backup;
  • The total energy consumption was found to be 1.1 kWh, where the maximum compressor cycle recorded was 17 min with 7 min of compressor ON-time. A steep rise in temperature was observed as soon as the compressor was stopped, highlighting the inability of a simple VCR cycle to maintain the set temperature even for a short duration of compressor OFF-time, which could be overcome by appropriate selection of PCM, its encapsulation material, and its mounting location;
  • A temperature difference ranging from 5 to 7 °C is observed between the phase change temperature of PCM and the optimal storage temperature. This observation is important from the point of view of appropriate PCM selection.
Future research is focused on examining various combinations of PCM with appropriate encapsulation material to achieve an ideal combination for desired thermal back for applications as well as sizing and optimization of the PCM heat exchanger.

Author Contributions

Conceptualization, S.A. and A.R.; methodology, S.A. and A.R.; software, R.J.B.; validation, S.A. and A.R.; formal analysis, S.A. and R.J.B.; investigation, S.A., P.N., P.P., P.E. and V.K.; resources, A.R. and S.L.; data curation, S.A., R.J.B. and A.R.; writing—original draft preparation, S.A.; writing—review and editing, A.R.; supervision, A.R. and S.L.; project administration, A.R.; funding acquisition, A.R. All authors have read and agreed to the published version of the manuscript.

Funding

This work is supported by Symbiosis International (Deemed) University under SIU/SCRI/MJRP/Approval/2023/1753 and Indian Society of Heating, Refrigerating, and Air Conditioning Engineers (ISHRAE) under SRPG PG 2022-23.

Institutional Review Board Statement

Not applicable.

Informed Consent Statement

Not applicable.

Data Availability Statement

Data presented in this study is available in this article.

Conflicts of Interest

The authors declare no conflicts of interest. The funders had no role in the design of this study, in the collection, analyses, or interpretation of data, in the writing of this manuscript, or in the decision to publish the results.

References

  1. Natarajan, B.; Kathiresan, A.C.; Subramanium, S.K. Development and performance evaluation of a hybrid portable solar cold storage system for the preservation of vegetables and fruits in remote areas. J. Energy Storage 2023, 72, 108292. [Google Scholar] [CrossRef]
  2. Parida, S.; Roy, A.; Anjankar, P. Design and experimental study of prototype cold storage for various vegetables stored. In Techno-Societal 2018: Proceedings of the 2nd International Conference on Advanced Technologies for Societal Applications; Springer International Publishing: Berlin/Heidelberg, Germany, 2020; Volume 1, pp. 447–455. [Google Scholar] [CrossRef]
  3. Ministry of Commerce and Industry. Fresh Fruits and Vegetables FFV @ apeda.gov.in. Agricultural and Processed Food Products Export Development. 2023. Available online: https://apeda.gov.in/apedawebsite/six_head_product/FFV.htm (accessed on 10 June 2024).
  4. Ministry of Agriculture & Farmers Welfare. Cold Storage Facilities in the Country, PressReleasePage @ pib.gov.in. Ministry of Agriculture & Farmers Welfare, GoI. 2020. Available online: https://pib.gov.in/PressReleasePage.aspx?PRID=1606341 (accessed on 10 June 2024).
  5. Amjad, W.; Munir, A.; Akram, F.; Parmar, A.; Precoppe, M.; Asghar, F.; Mahmood, F. Decentralized solar-powered cooling systems for fresh fruit and vegetables to reduce post-harvest losses in developing regions: A review. Clean Energy 2023, 7, 635–653. [Google Scholar] [CrossRef]
  6. Tachajapong, W.; Wiratkasem, K.; Kammuang-lue, N.; Pattana, S. Preliminary study on specific energy consumption of cold storage room in Thailand’s cold chain. Energy Rep. 2022, 8, 336–341. [Google Scholar] [CrossRef]
  7. Joybari, M.M.; Haghighat, F.; Moffat, J.; Sra, P. Heat and cold storage using phase change materials in domestic refrigeration systems: The state-of-the-art review. Energy Build. 2015, 106, 111–124. [Google Scholar] [CrossRef]
  8. Talukdar, S.; Afroz, H.M.M.; Hossain, M.A.; Aziz, M.A.; Hossain, M.M. Heat transfer enhancement of charging and discharging of phase change materials and size optimization of a latent thermal energy storage system for solar cold storage application. J. Energy Storage 2019, 24, 100797. [Google Scholar] [CrossRef]
  9. Liu, Z.; Zhao, D.; Wang, Q.; Chi, Y.; Zhang, L. Étude Sur La Performance D’Un Réfrigérateur Domestique Refroidi Par Air Utilisant Des Matériaux À Changement De Phase Pour L’Entreposage Frigorifique. Int. J. Refrig. 2017, 79, 130–142. [Google Scholar] [CrossRef]
  10. Pirdavari, P.; Hossainpour, S. Numerical study of a Phase Change Material (PCM) embedded solar thermal energy operated cool store: A feasibility study. Int. J. Refrig. 2020, 117, 114–123. [Google Scholar] [CrossRef]
  11. Sonnenrein, G.; Baumhögger, E.; Elsner, A.; Fieback, K.; Morbach, A.; Paul, A.; Vrabec, J. Copolymer-bound phase change materials for household refrigerating appliances: Experimental investigation of power consumption, temperature distribution and demand side management potential. Int. J. Refrig. 2015, 60, 166–173. [Google Scholar] [CrossRef]
  12. Roy, A.; Kale, S.; Lingayat, A.B.; Sur, A.; Arun, S.; Sengar, D.; Gawade, S.; Wavhal, A. Evaluating energy-saving potential in micro-cold storage units integrated with phase change material. J. Braz. Soc. Mech. Sci. Eng. 2023, 45, 514. [Google Scholar] [CrossRef]
  13. Oró, E.; Miró, L.; Farid, M.M.; Cabeza, L.F. Improving thermal performance of freezers using phase change materials. Int. J. Refrig. 2012, 35, 984–991. [Google Scholar] [CrossRef]
  14. Azzouz, K.; Leducq, D.; Gobin, D. Enhancing the performance of household refrigerators with latent heat storage: An experimental investigation. Int. J. Refrig. 2009, 32, 1634–1644. [Google Scholar] [CrossRef]
  15. Azzouz, K.; Leducq, D.; Gobin, D. Performance enhancement of a household refrigerator by addition of latent heat storage. Int. J. Refrig. 2008, 31, 892–901. [Google Scholar] [CrossRef]
  16. Khan, M.I.H.; Afroz, H.M. Afroz experimental investigation of performance improvement of household refrigerator using phase change material. Int. J. Air-Cond. Refrig. 2013, 21, 1350029. [Google Scholar] [CrossRef]
  17. Ezan, M.A.; Doganay, E.O.; Yavuz, F.E.; Tavman, I.H. A numerical study on the usage of phase change material (PCM) to prolong compressor off period in a beverage cooler. Energy Convers. Manag. 2017, 142, 95–106. [Google Scholar] [CrossRef]
  18. Maiorino, A.; Del Duca, M.G.; Mota-Babiloni, A.; Greco, A.; Aprea, C. The thermal performances of a refrigerator incorporating a phase change material. Int. J. Refrig. 2019, 100, 255–264. [Google Scholar] [CrossRef]
  19. Ben-Abdallah, R.; Leducq, D.; Hoang, H.M.; Fournaison, L.; Pateau, O.; Ballot-Miguet, B.; Delahaye, A. Experimental investigation of the use of PCM in an open display cabinet for energy management purposes. Energy Convers. Manag. 2019, 198, 111909. [Google Scholar] [CrossRef]
  20. Munir, A.; Ashraf, T.; Amjad, W.; Ghafoor, A.; Rehman, S.; Malik, A.U.; Hensel, O.; Sultan, M.; Morosuk, T. Solar-hybrid cold energy storage system coupled with cooling pads backup: A step towards decentralized storage of perishables. Energies 2021, 14, 7633. [Google Scholar] [CrossRef]
  21. Wang, C.; He, Z.; Li, H.; Wennerstern, R.; Sun, Q. Evaluation on Performance of a Phase Change Material Based Cold Storage House. Energy Procedia 2017, 105, 3947–3952. [Google Scholar] [CrossRef]
  22. Yang, T.; Wang, C.; Sun, Q.; Wennersten, R. Study on the application of latent heat cold storage in a refrigerated warehouse. Energy Procedia 2017, 142, 3546–3552. [Google Scholar] [CrossRef]
  23. Tiwari, A.; Harischander, H.; Rane, M.V. Cold Storage in India for Small Farmers—Current Status and Challenges. In Proceedings of the International Refrigeration and Air Conditioning Conference, West Lafayette, IN, USA, 10–14 July 2022; p. 2472. [Google Scholar]
  24. Rostamizadeh, M.; Khanlarkhani, M.; Sadrameli, S.M. Simulation of energy storage system with phase change material (PCM). Energy Build. 2012, 49, 419–422. [Google Scholar] [CrossRef]
Figure 1. Experimental setup (a) front view (b) side view.
Applsci 14 05166 g001
Figure 2. Procedure undertaken for numerical simulation.
Applsci 14 05166 g002
Figure 3. 3D Model of the cold storage system.
Applsci 14 05166 g003
Figure 4. Three cases of mesh generation for mesh independence study.
Applsci 14 05166 g004
Figure 5. (a) Experimental Procedure. (b) Locations (A) and (B).
Applsci 14 05166 g005
Figure 6. Test set up of two locations (a) in front of the evaporator, (b) corner of cold room below evaporator.
Applsci 14 05166 g006
Figure 7. Test set up for PCM sample testing.
Applsci 14 05166 g007
Figure 8. Simulation of temperature distribution profile inside cold room (a) without PCM container, (b) using copper PCM tray and (c) using SS PCM tray.
Applsci 14 05166 g008aApplsci 14 05166 g008b
Figure 9. Simulation of tumbler model with enlarged view of the central plane cross-section.
Applsci 14 05166 g009
Figure 10. Temperature profile of PCM in copper tumbler model simulated through 3D experience.
Applsci 14 05166 g010
Figure 11. No-load test for minimum temperature of −5 °C.
Applsci 14 05166 g011
Figure 12. Water sample test: (a) Position (A)—in front of evaporator; (b) Position (B)—corner of cold room below evaporator.
Applsci 14 05166 g012
Figure 13. PCM sample test (placed in front of evaporator). (a) Copper container. (b) Stainless steel container.
Applsci 14 05166 g013
Figure 14. Comparative study of numerical and experimental methods for PCM cooling in tumbler.
Applsci 14 05166 g014
Table 1. Specifications of the cold storage unit.
ParametersSpecifications
Dimensions1.83 m × 1.22 m × 1.83 m
(6 feet × 4 feet × 6 feet)
Storage volume3.4 m3 (122 ft3)
Storage capacity0.5 MT
Temperature range−15 °C to 10 °C
Humidity range80–95%
Cooling capacity0.63 TR
Refrigerant usedR134a
Compressor typeHermetically sealed rotary-type
Compressor rating1.5 kW
Table 2. Material properties assigned.
PropertiesUnitsAir (Inlet)Stainless SteelCopper
Density (ρ)kg/m31.17680008196
Specific Heat (Cp)J/kgK1005500385
Thermal Conductivity (k)W/mK0.027519400
Thermal Expansion
Coefficient (β)
/°C0.0036716 × 10−617 × 10−6
Dynamic Viscosity (μ)Pa.s18.4 × 10−6--
Kinematic Viscosity (ν)m2/s15.7 × 10−6--
Table 3. Mesh generation details.
Cold Storage PartsMesh TypeCaseMaximum Mesh Size (mm)Absolute Sag (mm)Simulation Time
(min)
PUF External PanelsTetrahedron MeshI59.20611.84179
II30593
III152.5115
Cold storage frameTetrahedron MeshI44.4038.88179
II30593
III152.5115
PCM SS containerTetrahedron MeshI32.6075.23179
II32.6075.23193
III12.51.5115
PCM copper containerTetrahedron MeshI62.81412.56379
II32.6075.23193
III27.42.5115
Cold room inside cool airHEX MeshI74.857.4479
II54.85593
III27.42.5115
Table 4. Specifications of temperature sensors.
ParametersValue
MakeMultitech
Measurement Range−50 °C to 150 °C
Measuring accuracy±1% FSA
Resolution0.1 °C
ConfigurationPT 100 3 Wire
Response time<10 s
Probe type304-SS, 6 mm diameter
Table 5. Properties of phase change material.
PropertiesValue
Melting temperature −2 °C
Freezing temperature −3 °C
Latent heat329 kJ/kg
Solid density 1060 kg/m3
Liquid density985 kg/m3
Solid thermal conductivity2.2 W/mK
Liquid thermal conductivity0.35 W/mK
Thermal stability~1000 cycles
Disclaimer/Publisher’s Note: The statements, opinions and data contained in all publications are solely those of the individual author(s) and contributor(s) and not of MDPI and/or the editor(s). MDPI and/or the editor(s) disclaim responsibility for any injury to people or property resulting from any ideas, methods, instructions or products referred to in the content.

