Article

Mechanical and Failure Characteristics of Grouting Cemented Coal under Different Degrees of Early Damage

1
School of Civil and Resources Engineering, University of Science and Technology Beijing, Beijing 100083, China
2
Shanxi Jinmei Group Technology Research Institute Co., Ltd., Jincheng 048007, China
*
Author to whom correspondence should be addressed.
Appl. Sci. 2024, 14(12), 5178; https://doi.org/10.3390/app14125178
Submission received: 7 May 2024 / Revised: 1 June 2024 / Accepted: 4 June 2024 / Published: 14 June 2024
(This article belongs to the Special Issue Technologies and Methods for Exploitation of Geological Resources)

Abstract

:
Pre-grouting is an effective method to reinforce fractured coal in front of working faces. The mining of adjacent working faces after grouting can cause early damage to the grouting cemented coal. To explore the mechanical properties of grouting cemented coal with different degrees of early damage, we designed and built a grouting equipment that was used on fractured coal to produce grouting cemented coal. In total, 0%, 20%, 40%, and 60% of the uniaxial compressive strength of complete coal were applied to the grouting cemented coal to produce early damage. The uniaxial compressive test, digital image correlation technology (DIC), acoustic emission (AE), and scan electron microscopy (SEM) were used to explore the changes in the mechanical properties of the grouting cemented coal with different early disturbance, and the surface and internal failure modes of the samples were investigated. The results show that with an increase in the early damage degree from 0% to 60%, the strength of the grouting cemented coal samples first increased and then decreased. Moreover, when the damage degree was 40%, the strength of the grouting cemented coal reached a maximum, which increased by 24.38% compared to that of the grouting cemented coal without damage. Under the low degree of damage, the samples exhibited tensile failure. As the damage degree increases, the samples’ failure mode changes to shear and mixed failure mode, and the breakdown speed increases. Internal crack propagation mostly occurred during the failure stage. As the damage degree increased, the failure stage increased, and the grouting cemented coal exhibited plastic characteristics. However, when the early damage degree increased to 60%, the samples exhibited typical brittle failure characteristics. The microstructure results show that the low degree of early damage for the samples is conducive to the infiltration of the slurry in coal, improving the grouting reinforcement effect. A large degree of early damage can lead to internal structural damage and strength degradation in grouting cemented coal.

1. Introduction

During the process of mining and tunnel excavation in coal mines, structures and fractured zones are often encountered in front of the working face. If no protective measures are taken, there are safety risks. Advance pressure grouting fills cracks in coal and rock masses, generates a bonding force, and enhances the strength of the coal and rock. Moreover, advanced pressure grouting has the advantages of flexible construction and a greater distance. It is widely used in coal mines for advanced reinforcement to enhance the stability of the working face in fractured coal and rock areas, ensuring mining safety. Owing to the relatively long solidification time of grout and its effect on production efficacy and construction progress, the adjacent working face or the working face is often advanced without waiting for the grout to fully solidify during actual production processes. Thus, the advanced grouting area is subject to varying degrees of early disturbance, leading to initial damage to the coal–cement grout that affects the mechanical properties of the final-set coal–cement grout. Therefore, to better determine the timing for the recovery of near-working surfaces after pre-grouting, it is necessary to study the effects of different early damages on the physiomechanical properties of coal–cement grout.
To explore the effects of early damage on the original coal and concrete mechanical properties, Chen et al. [1] performed a cyclic loading and unloading test on a coal–rock mass to produce varying degrees of early damage and analyzed both the dynamic mechanical characteristics and the damage and fracture mechanism of the coal in the early stages of interference. The results showed that early interference in the coal sample produced more new cracks, which expanded as the degree of damage increased, leading to a gradual weakening of the mechanical properties of the coal. Huang et al. [2,3] applied varying degrees of early stress to coal samples and analyzed the effects of early interference on the strength characteristics and creep failure regularity. The results suggest that the steady creep rate increases gradually with an increase in the degree of early damage, establishing a relationship between early damage and rupture damage based on creep rules and improving the creep model at the acceleration stage. When the static load at different early damages affects concrete, concrete exhibits stronger damage and strain-rate effects, and the extent of damage after exceeding a certain limit value has a significant impact on the dynamic compressive strength of concrete [4]. Li et al. [5] prepared experimental cube concrete with various initial defects and performed uniaxial compression tests using the acoustic emission (AE) technique. The results indicated that the test block strength significantly decreased and early damage increased, indicating that the AE counts can reflect the failure law during each stage. Yu et al. [6] studied the law of strength in different-sized concrete samples in various early damage situations. Their results showed that with an increase in the degree of early damage, both the static and dynamic compressive strengths decreased, and early damage had a more significant effect on dynamic compressive strength than on the static compressive strength.
In terms of the mechanical properties and failure mechanism of grout-reinforced bodies, Wang et al. [7] performed orthogonal tests on fractured coal with variable sizes and cement paste with different water–cement ratios. The mechanical properties of the injections and crack destruction characteristics were analyzed using an effect–evaluation test machine for grouting reinforcement. By varying the rubber particle content and admixture in an orthogonal design experiment, Zhang et al. [8] studied the influence of grouting materials on the mechanical properties, permeability, and microstructure of grout-reinforced bodies. Li et al. [9] used a self-designed grouting test system to carry out digital quantitative analysis of the three-dimensional crack morphology and structure of coal samples subjected to load damage before and after grouting. Using a video meter, Zong et al. [10] analyzed the changes in the microstructure and mechanical properties of the rock samples before and after grouting after uniaxial compression tests. Zhang et al. [11] compared and analyzed the strength characteristics of samples simulated by similar materials with and without grout-filled cracks. Li et al. [12] discovered through SEM and X-ray diffraction experiments that the microstructure of the bonding reinforcement is crucial for affecting the macro-mechanical properties. Liu et al. [13] found that grouting reinforcement can significantly change the normal and tangential mechanical properties of fracture surfaces in a rock mass, and the strength and stability of the rock mass are enhanced by increasing the tangential shear strength with normal stress.
Currently, the internal structure and damage behavior of samples are investigated mainly by AE, digital image correlation (DIC) technology, and scanning electron microscopy (SEM) technology. Based on AE positioning technology, Huang et al. [14] analyzed the influence of the position, angle, and size of coal–rock fractures and developed principles concerning the injection of grout into a bulk rock mass. Wang et al. [15] used DIC technology and other methods to study the fracturing properties of cross-joint samples in the loaded destruction process. Gao et al. [16] combined the macro- and fine-destruction characteristics of samples according to the cross-sectional morphologies characterized by SEM, the results of which suggested that the graphene oxide in the slurry can promote the hydration reaction and improve the perforation structure of the injection slurry. Zhang et al. [17] carried out three-point bending tests on high-temperature treated granite; the AE location and DIC technology were used to analyze the link between the rock crevice extensional regularity and the pattern of destruction. Using AE location and DIC technology, Miao et al. [18] analyzed the effects of different factors on rock damage and rupture evolutionary laws. Ashraf and Rucka [19] conducted AE signaling and DIC surface position observations for concrete prepared from two additives and reported on the evolution of concrete fractures in three-point bending trials.
In summary, domestic and foreign scholars have performed a large number of studies by applying various experimental methods to determine the mechanical properties of initial coal and concrete damage and grout-reinforced rock-body mechanical characteristics, among others. However, investigating the effect of its mechanical properties following early interference of the coal–cement grout after the reinforcement of the coal–rock mass has significant engineering value and theoretical significance. Thus, this article reports the use of grouting equipment designed and built in our laboratory to inject fractured raw coal. Uniaxial compression was applied to the injected samples to examine the early damage to the coal–grout rock body after the initial setting. After the final setting, uniaxial compression tests were conducted, combining DIC and AE technologies to analyze the location, evolution characteristics, and failure mode of cracks during the loading and failure processes of the rock body. The microstructure of the compression fracture surface of the rock body was scanned by SEM to analyze the combined characteristics of grouting materials and raw coal, ultimately obtaining changes in the mechanical properties and fracture mechanisms of coal–cement grout with variable early damage.

2. Samples and Experimental Procedure

2.1. Sample Preparation

The fractured coal samples were taken from the same working surface and prepared as square columns of 50 × 50 × 100 mm, as shown in Figure 1a. The processing error met the international standards for rock mechanical samples. Because the coal samples were intensely fractured, to reduce the effect of sample heterogeneity on the test results, the tested samples were selected from coal that was similar to both the epigenetic fissure shape and the weight and ultrasonic wavelength [20,21,22]. Wave-speed measurements were performed using a ZBL-U510 nonmetallic ultrasound detector, as shown in Figure 1b. Table 1 shows the results for the quality and wave velocity of the pre-spray cracked coal, where samples (S) are denoted by the extent of early damage (e.g., 0%) followed by the sample number (e.g., “1” for the first sample). The average wave velocity for all the coal samples was 2082.63 m/s, and the average quality was 306.53 g.
After the original coal sample selection was completed, it was sprayed using equipment developed in our laboratory. The spraying device consists mainly of a pressure pump, air bottle, pressure meter, and connection tube. Liquid cement, consisting of 52.5-ultrafine cement and a 0.7:1 water–ash ratio, was added to the sprayer. The grouting pressure was controlled to not exceed one-tenth of the compressive strength by pressurizing the gas cylinder with a pressure pump [23]. This test was set at 0.7 MPa, and the pressure maintained for 10 min after stabilizing at 0.7 MPa. The original coal injection process is shown in Figure 1c, and the injection effect is shown in Figure 1d.
After the injection, to further minimize the differences between the coal and cluster, weighing and ultrasound testing of the sample revealed an average quality of 334.69 g (quality difference within 10 g) and an average wave velocity of 2127.28 m/s. This eliminated the larger differences, and 12 clusters were finally selected for the subsequent test link [24]. The results of the coal–grout samples and wave rate are listed in Table 1.
After the initial consolidation of the coal–cement grout, a pressure test machine was applied at 0%, 20%, 40%, and 60% single-axis loads of the pressure resistance measured for the fractured coal rock, which produced different early damages in the coal–cement grout. Each group of three samples was stored for 28 days at constant temperature and humidity in a standard preservation box. Subsequently, the surface of the sample was ground smoothly using a grinding machine.

2.2. Experimental System and Testing Method

To study the mechanical characteristics and fracture mechanisms of different early disturbance samples under uniaxial compression conditions, uniaxial compression tests were conducted on the coal–cement grouts that exhibit different early disturbances after grouting reinforcement. AE and DIC techniques were combined to investigate the surface and internal crack development patterns and macroscopic fracture modes of the samples. Additionally, the fracture surface of the sample after uniaxial compression was scanned using SEM, which further clarified the mechanical properties of the coal–cement grout that influence the early disturbance.

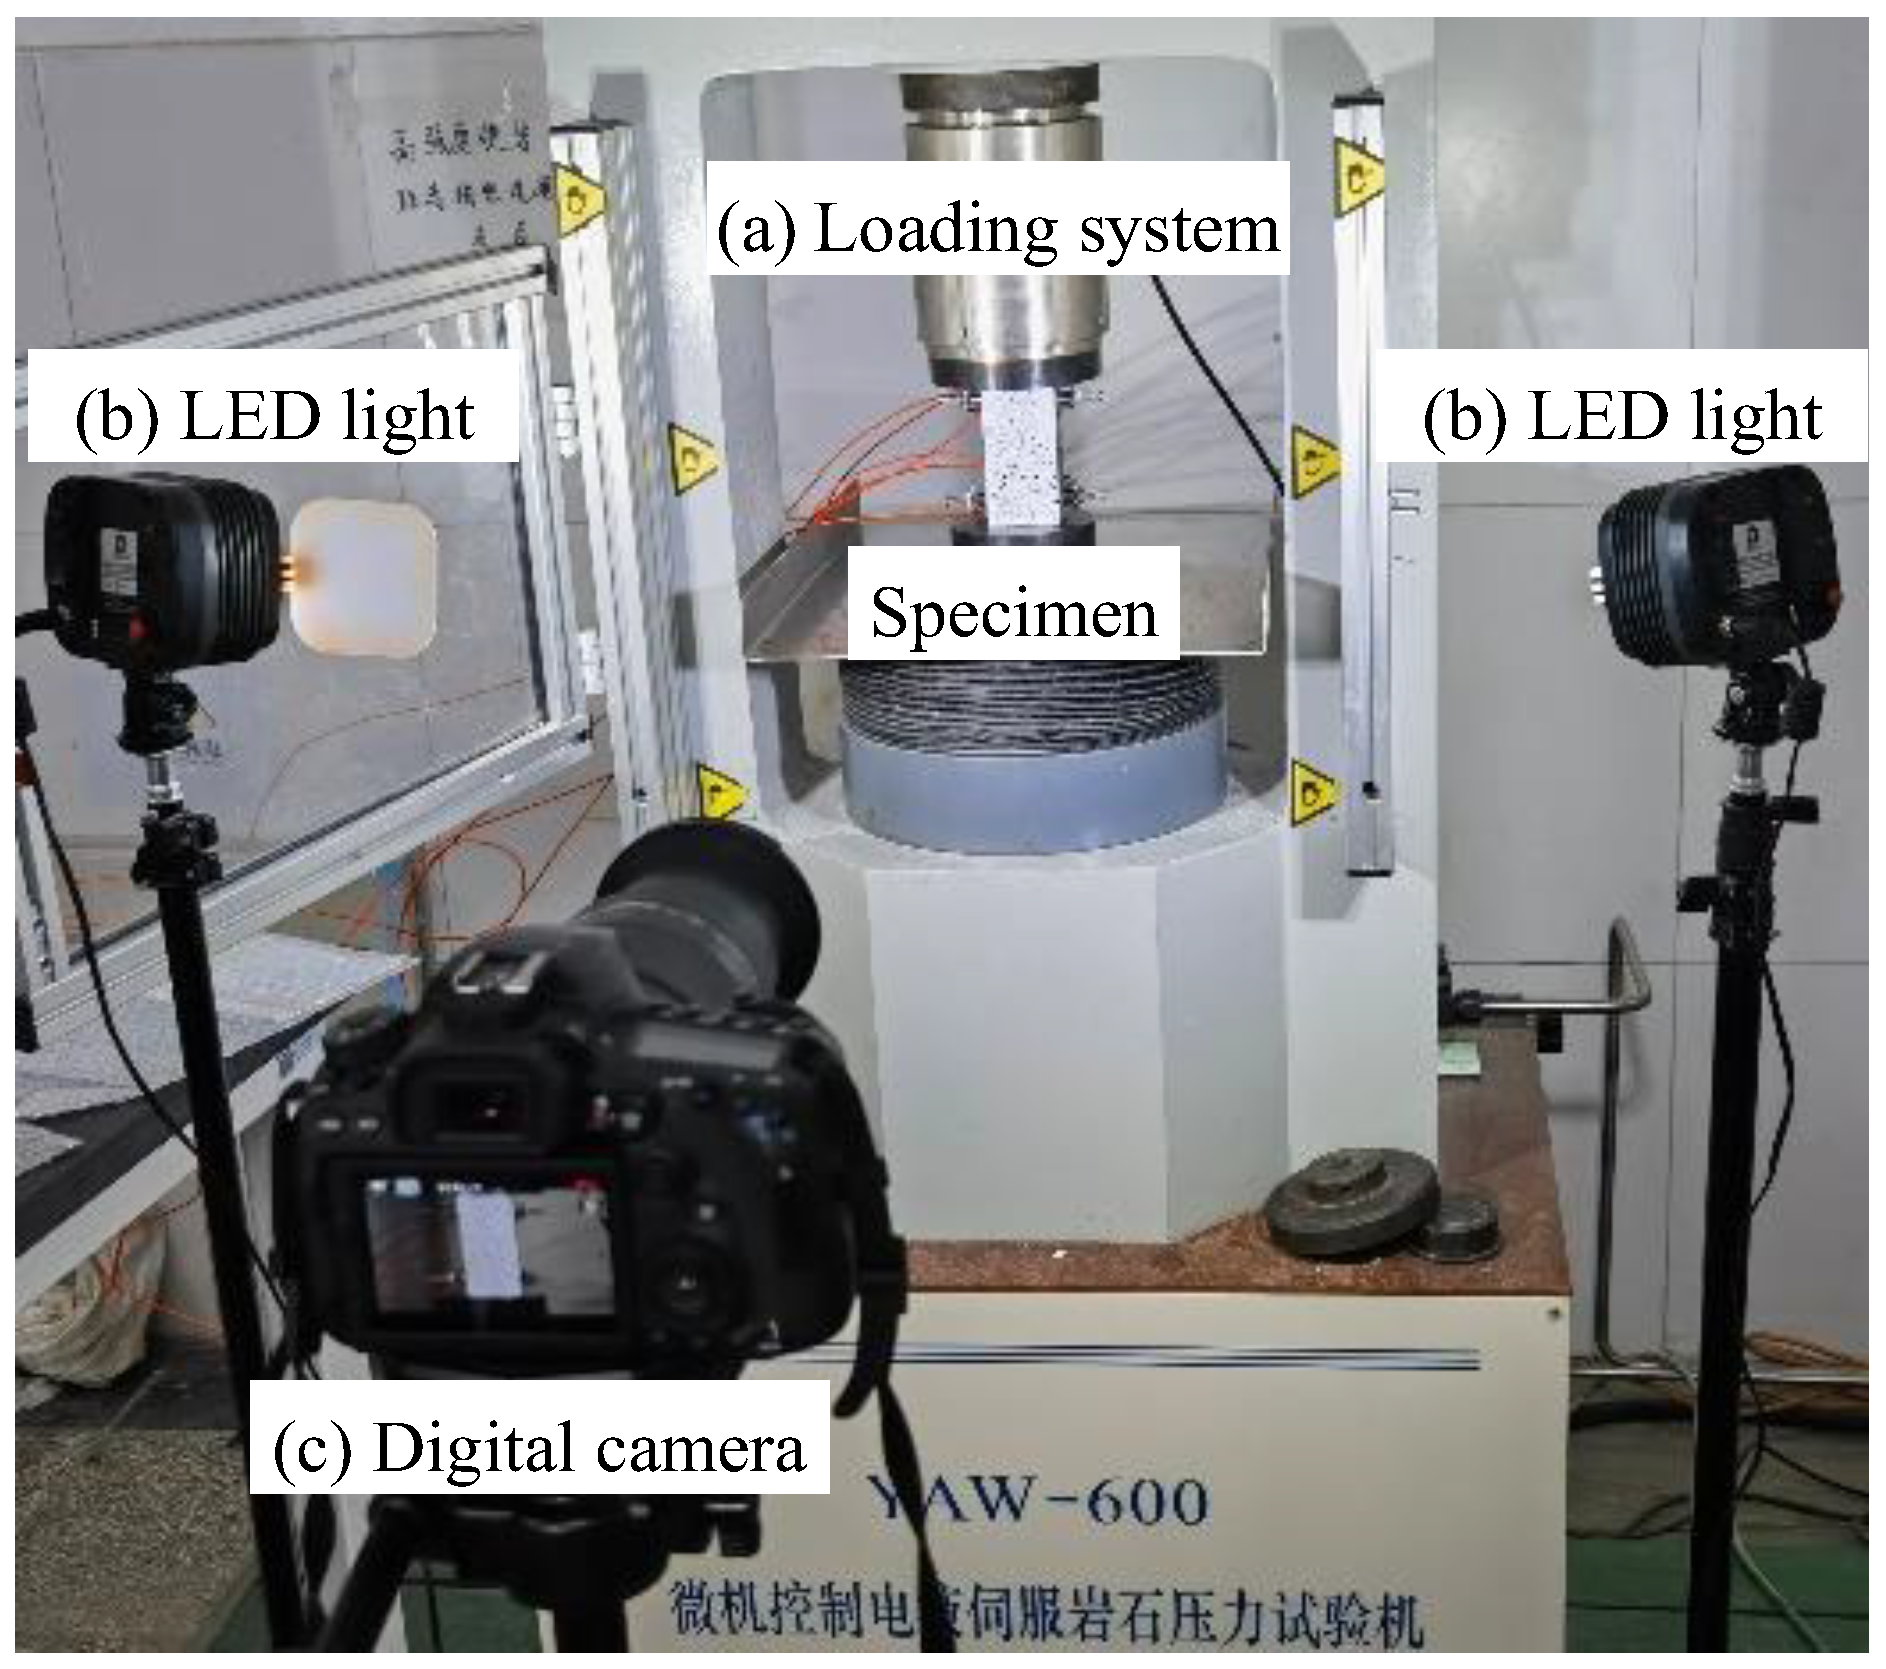
2.2.1. Loading Systems

A single-axis compression trial was conducted using a Yaw-600 micromotor-controlled electric liquid servo rock test machine, as shown in the image of the loading system (Figure 2 (a)). This loading process used position control, and the loading speed was set to 0.002 mm/s. To ensure the integrity of the loaded contact surface, a small amount of lubricant (butter) was applied to the upper and lower surfaces of the coal–grout rock sample, reducing the effect of friction during the load.

2.2.2. DIC Monitoring

As a powerful noncontact optical measurement approach, the digital image correlation (DIC) method was used to determine the displacement and strain fields by comparing the images of the sample surface [25,26,27]. In recent years, surface all-field stress analysis has gradually become widely used in the field of rock mechanics. The DIC test system consists of an observation and analysis system comprising a set of lighting and imaging equipment, which provides a stable light source during the test (Figure 2 (b)) to capture real-time images revealing the evolution of sample fissures during loading. The camera was located 1 m in front of the sample and acquired 25 images per second at a resolution of 1920 × 1080 pixels (Figure 2 (c)).
The test steps were as follows: ① White coating was sprayed on the surface of the sample, allowing the coating to dry, and then black coating was sprayed randomly to make a splash in advance. ② The imaging equipment was arranged according to the test environment and requirements by adjusting the position of the equipment, focal distance, and lighting equipment. ③ When the sample was ready to be loaded, the imaging equipment recorded the speckle image and ended the test when the sample fracture reached 50%. ④ The acquired speckle images were analyzed and processed using VIC-2D.

2.2.3. AE Monitoring

AE tests were performed on the AE system of Physical Acoustics Beijing Office (China) using a threshold value of 40 dB. The main amplifier was set to 40 dB, and the sampling frequency was 1 MHz. The frequency range of the sound-emission probe was 20–400 kHz. Six Nano30 sensors were uniformly fixed on both sides of the sample, apart from the DIC observation front and back, and an appropriate amount of couplant was applied between the sensor and sample to enhance the sample’s adhesiveness and reduce the material’s AE signal depletion of the material.
The AE and high-definition cameras were synchronized during the sample single-axis compression process, ensuring that the digital images, mechanical parameters, and sound-emission-related parameters were recorded simultaneously in real time (Figure 3).

2.2.4. SEM Test

We selected 300×, 500×, and 1000× magnification multipliers to observe the variation in the early damage of the coal-blue rock rupture surface microstructure. From the results, the shape of the sample and the distribution of the cracks were analyzed to characterize the mechanical properties of the rock.

3. Results and Discussion

3.1. Single-Axis Pressure Resistance and Elastic Modulus

The uniaxial resistance strength and elasticity modulus for different degrees of early damage (0–60%) are listed in Table 2. With increasing early damage, the uniaxial compressive strength of coal–cement grout exhibited first an increasing trend (0–40%) and then a decreasing trend (40–60%) from 8.57 MPa at 0% early damage to 10.03 MPa at 20% early damage, an increase of 17.04%. A further increase of 10.66 MPa was observed at 40% early damage, an increase of 24.38% compared to 0% early damage, accompanied by a marked increase in strength. The early damage continued to increase to 60%, and its intensity dropped to 8.16 MPa, a decrease of 4.78% compared to that at 0%. Comparing the intensities of various early damaged coal–cement grout samples with the strength of the original coal, the intensities of different earlier disturbances after coal grouting were shown to be greater than the intensity of the raw coal. For early disturbed coal–cement grout samples, early damage at 40% had a significantly larger elasticity modulus than other early disturbed degrees, with 0%, 20%, 40%, and 60% early disturbed samples having elasticity moduli of 1.41, 1.55, 1.92, and 1.45 GPa, respectively.

3.2. Surface Damage Characteristics

The DIC technique can provide full-field real-time monitoring of the test surface stress field [28]. Through surface DIC observation of different early damages of coal–cement grout in the single-axis compression process, the pressure field and position changes for the entire compression process can be obtained. This section describes the damage pattern, crack expansion, and rupture evolution during the analysis of different early damages in the surface interference characteristics.

3.2.1. Effects of Early Damage on Destruction Patterns

The strain concentration belt during loading reflects the expansion of cracks, and the effects of different early damages on the macrodestruction pattern of the sample can be analyzed by observing the main strain and position cloud maps of the surface [29]. Figure 4 indicates that as the early damage increases, the destruction pattern on the sample surface exhibits a change in the trend of the pull-cut mixed destruction. For 0% (Figure 4a,b) and 20% early damage (Figure 4c,d), the sample surface damage is a multidirectional parallel-loading expansion, indicated by the distortion pattern shown. With increasing early disruption, 40% early damage (Figure 4e,f) extends in a certain perpendicular angle with the load direction, and the destruction pattern turns to cutting destruction, and 60% early damage (Figure 4g,h) turns into cutting mixed destruction.

3.2.2. Fissure Expansion and Fissure Evolution Processes

The pattern of developing surface cracks in the sample can be analyzed by combining the stress–strain curve and the principal strain field. The horizontal displacement cloud graph clearly shows the crack propagation during the failure process of the sample. Sample S-20%-3 was used as an example for the analysis. Figure 5 shows the main strain cloud chart for the stress–strain curve in combination with sample destruction, and the corresponding time points (t1–t6) are marked on the stress–strain curve.
In Figure 5, t1 = 0 represents the starting time of the compaction stage, corresponding to the strain field at 0% Fp, as a reference for subsequent DIC processing. In the compression phase, the curve appeared to be abrupt; with an increase in stress, the increase in pressure gradually decreased, indicating that the sample was compressed. At t2, the sample entered the elastic phase, where the stress level corresponded to 25% of the maximum stress, and the stress–stress curve was approximated as a straight line. At the bottom and end of the main stress field of the sample, there was a local zone of changing stress, at which time the deformation was very small. Subsequently, the sample continued to be under pressure, and microcracks developed steadily until the end of the elastic phase at time t4. At that moment, the stress is 7.53 MPa, reaching 75% of the peak stress. Furthermore, at time t4, there was a marked concentration of stress at both ends of the sample, as shown on the left, and the sample began to crack. When subjected to continuous loading, the crack expanded rapidly at both ends, and the contact surface of the coal sample and the slurry stretched rapidly along the back of the cluster, resulting in a rupture when the maximum bearing force was reached. During continued loading, the tip of the crack rapidly expanded and consolidated, extending along the contact surface between the coal and the slurry. When the rock body reaches its ultimate bearing capacity, it ruptures, causing a decrease in axial stress. With a continuous increase in stress, the cracks between the coal sample and the slurry contact surface were closed, the sample was again compacted, and the bearing capacity increased again. At t5, the peak stress of the sample was reached; although the cracks expanded to the upper and lower ends of the sample, their appearance suggests that the sample remained basically intact.
Figure 6 shows the process of evolution between the level shift of the sample and the macrodestruction at six different loading levels, including 0%, 25%, 50%, 75%, and 100% of the failure load (Fp) and the post-peak stage. The horizontal shift is set from left to right and negative. During the phase below 75% peak stress, the horizontal displacement of sample S-20%-3 along the stress load direction gradually increases, and there is noticeable layering in the ladder, but the shift value gap is small. In this process, the small holes are compressed, but there are no noticeable cracks. At 75–100% peak stress, the cracks split from the upper end of the sample and develop rapidly along the direction of the maximum main stress, with the maximum shift region gradually changing from the top left corner to the bottom. The shift cloud chart shows the marked deformation area. After the peak of the destruction phase (Figure 6e), the cracks quickly passed through the sample, the damage was more severe, and the lower left corner of the sample appeared as a small separate piece. The fissure width increased significantly.
During the evolution of the displacement field, the variation in the difference (relative displacement) between the maximum and minimum global displacements at each time point can reflect the change in the fracture propagation speed in the sample [30]. The maximum relative displacements of the rock body under different early damages are shown in Figure 7. The relative displacement expanded rapidly after reaching 75% peak stress, and the rate of sample rupture was significantly accelerated compared to the increase up to 75% peak stress. Furthermore, as the early damage increased from 0% to 40%, the strength of the sample gradually increased, and the impact point of the stress increased; that is, the speed of its rupture increased and became greater with the early disruption. For the 60% early damage sample, the pressure in the sample is higher under greater stress, and the initial relative shift of the load is less, so that the degree of rupture and the speed of the rupture increase faster in the stable disruption and post-peak phases but remain less than 40% in the early damage sample.

3.3. Analysis of Internal Crack Characteristics

During the compression process, the audio emission signal and positioning information for the coal–cement grouts were collected at different times, and various characteristics of the internal cracks were analyzed using different types of audio emission data.

3.3.1. Evolutionary Characteristics of Ringtone Counting

The positioning of the sound-emission data point can be comprehensively analyzed based on the location of the cracks within the cluster, rate of expansion, direction of the expansion, and process of fissure evolution. The clock count with the compression time-evolution rule can reflect the distribution of fissures at different stages, reflecting the appearance and expansion of microcracks. As shown in Figure 8, AE ringtone counting can be divided into four phases: compaction phase (Ⅰ), elastic phase (Ⅱ), unstable failure phase (Ⅲ), and post-peak phase (Ⅳ). In combination with the localized characteristics of sound discharge events inside the sample, the clock count can be used to further analyze the rupture proliferation rule for the test. Figure 8 provides information on the relationship between the early damage of coal–cement stress and clock counts and the corresponding stage of the stress level.
The clock-counting statistics for different early damages of coal–cement show that most acoustic releases occur within a short time prior to the breakup of the sample, resulting in a surge in acoustical releases when the peak intensity is reached. However, as the early damage increased from 0% to 40%, the time phase of the sound discharge began to evolve to the elastic phase, while the interference pressure was greater for the 60% condition, so that the cluster was compressed in the previous phase and had fewer new cracks.
There are consistent patterns in the location of internal AE events in coal–grout rock samples: (1) During the initial compression deformation stage of coal–grout rock, the pores contained in the raw coal inside the rock bodies are compressed, resulting in a few new cracks and AE events, which are scattered within the rock samples. (2) During the elastic deformation stage, the rock body was subjected to compressive stress and produced small cracks. At this time, only a few AE events are generated, and their distribution is influenced by the uniformity of the coal body, and thus randomly distributed in the rock body sample. (3) After entering the elastic–plastic deformation stage, the coal–grout rock body yielded under high stress, generating more new cracks, which gradually expanded and connected with the original cracks, resulting in an increase in AE events. (4) When the stress exceeds the peak intensity, the AE activity of the rock body becomes abnormally active after entering the failure stage, and the concentration of cracks increases further. The slurry inside the rock body was also affected, producing a large number of cracks and accelerating rock fractures.

3.3.2. Internal Fissure Distribution Characteristics

The RA–AF value in the sound-emission signal qualitatively characterizes the distribution of the different types of cracks propagating during the rock damage process [31]. The values were then used to analyze the main pattern when the test sample failed. RA = rise time/amplitude, AF = Ring counts/duration time.The cutting cracks corresponded to a small RA and a large AF for the sound-emission signal, and cracks transecting the cutting cracks led to a large RA value and a small AF value [32,33,34]. The corresponding boundary values currently do not have a uniform criterion and are usually determined based on the load time and the ratio of the AF and RA maximum values. Based on this description, we selected φ0 = AF/RA = 60 as the criterion for determining the stretch and cutting cracks. Next, we calculated the RA–AF values for the sample under different early damages and then constructed the RA–AF diagram, as shown in Figure 9. The split ratios of the different phases of each sample during the destruction process are listed in Table 3. In the compression and elastic phases during sample destruction, stretch cracks dominate, and in the nearest stage of instability, the percentage of cuts increases significantly.
As shown in Figure 9, when the initial disturbance was 0%, the main failure mode of the samples was tensile failure, with tensile cracks accounting for 60.71%. With an increase in early damage, the proportion of shear cracks increased significantly; the proportion of tensile cracks recorded for 20% and 40% early damage decreased to 47.38% and 39.35%, respectively. When the test sample was characterized mainly by tensile cracks, the strength of the samples decreased. In contrast, the strength increased when shear cracks dominated, which was consistent with the change in the uniaxial compressive strength of the coal–cement grout. When the early damage increased to 60%, the sample was dominated by tensile failure; the proportion of tensile events increased significantly, whereas the proportion of shear events decreased. The strength of the samples reduced under these damage conditions. This occurred because new cracks developed during the compaction stage for the samples with 60% early damage, and the new cracks gradually expanded and extended after being subjected to uniaxial compression. This process results in tensile stress that affects the interior of the rock body and generates more tensile cracks.

3.4. Microstructure Analysis

To accurately analyze the influencing mechanism of early damage on the physiomechanical properties of coal–grout rock, we scanned sample fracture surfaces using SEM. Examples of the microstructures are shown in Figure 10.
Coal is a typical heterogeneous medium with numerous structural defects, such as micropores and cracks. As shown in Figure 10, microscale groove-like structural fractures and black coal particles are present on the surface of the coal, while the slurry penetrates the sheet structure. At 0% early damage, the slurry did not fully penetrate into the microcrack, and the crack expanded along the original microcrack of the coal body under pressure stress. For 20% early damage, the crack width in the raw coal was 24 μm. The slurry enters the fissure along the crack on the surface of raw coal, and the hydration reaction produces C-S-H gel; thus, the cracks on the surface of the coal are filled. When 40% early damage occurred, early interference pressure stress promoted slurry penetration expansion, more C-S-H gel filled the cracks, the microcrack width decreased to approximately 20 μm, sampling density improved, and the rupture surface integrity recovered, and the resistance of the rock body to deformation was enhanced. When 60% of the early disturbance occurred, the electron microscope scanning results revealed cracks inside the slurry. Because the strength of cement slurry is much greater than that of raw coal, fracturing in the rock body under pressure after curing should occur at the coal–slurry interface or inside the coal body. The reason for the occurrence of internal cracks in the slurry is that during the early disturbance process, the slurry did not fully solidify, and its strength was low. The cracks ultimately led to the strength degradation of the coal–slurry rock body after being subjected to significant early disturbance. An internal crack in the grout was caused because the slurry had not yet completely solidified during early interference. This results in low strength and the formation of cracks, which ultimately enhances the early damage in the intensity of the coal–cement grout.

4. Conclusions

In this study, the rules governing the mechanical properties of coal–cement grouts with different degrees of early damage under uniaxial compression were investigated. Using DIC and AE technology, the deformation and fracture characteristics of the samples were revealed from both internal and external perspectives. Furthermore, the microstructure of the fracture surfaces of the coal–cement grouts was investigated using SEM tests. Our conclusions can be summarized as follows:
(1)
The resistance to pressure and elasticity of cluster modules with the increase in early damage has a decreasing trend, with the 40% highest resistance of early cluster coal–cement at 10.66 MPa, an increase of 24.38% compared to the resistance without clustering, while the strength of the cluster decreases to 8.16 MPa when the rise in early clustering is 60%. Therefore, early damage near the work surface to the strength of the coal–cement sample not only has a deteriorating effect; a certain extent of early disruption can increase the strength.
(2)
In the case of minor early damage, the surface rupture of the rock body is dominated by the damage of the strap, which increases with disruption, and the surface damage gradually turns to cutting and mixing destruction. The elastic phase microcracks begin to expand, and the cracks quickly expand on both ends after reaching the cracking stress, failing at an extreme load. The speed of the test partition increased with the early damage.
(3)
Internal fissure expansion mainly occurs in the sample destruction stage. As the disturbance increases the extension of the destruction phase, the cluster exhibits certain plastic characteristics, and a typical fragile destruction pattern occurs when the early damage increases to 60%.
(4)
The microstructure of the fissure surface shows that the early small disturbance is conducive to the penetration of slurry into the cracks of the coal, enhancing the effect of the grout reinforcement. The early major damage (60%) destroys the primary cluster, ultimately destroying the internal structure of the coal–grout rock, which leads to the deterioration of strength.
The results indicate that in coal mine surface injection, the choice of appropriate injection time and adjacent work surface extraction speed can not only shorten the construction period and improve the efficiency of work but may also increase the strength of coal–burial rock in the pre-injection area, which is conducive to safer extraction.

Author Contributions

Conceptualization, A.J.; methodology, H.D.; software, Y.Z.; validation, Z.W.; formal analysis, H.L.; investigation, H.L.; resources, H.D.; data curation, Y.Z.; writing—original draft preparation, A.J.; writing—review and editing, H.D.; visualization, Y.Z.; supervision, Z.W. All authors have read and agreed to the published version of the manuscript.

Funding

This research was funded by [National Nature Science Foundation of China] grant number [52174106]. And [National Key Research and Development Program] grant number [2022YFC2905102].

Institutional Review Board Statement

Not applicable.

Informed Consent Statement

Not applicable.

Data Availability Statement

Data is contained within the article.

Conflicts of Interest

Author Hailong Du was employed by Shanxi Jinmei Group Technology Research Institute Co., Ltd. The remaining authors declare that the research was conducted in the absence of any commercial or financial relationships that could be construed as a potential conflict of interest.

References

  1. Chen, Y.L.; Li, M.; Pu, H.; Ju, F.; Zhang, K.; Wu, H.S. Experimental study on dynamic mechanical characteristics of coal specimens considering initial damage effect of cyclic loading. J. China Coal Soc. 2023, 48, 2123–2137. [Google Scholar]
  2. Huang, P.; Zhang, J.X.; Spearing, A.S.; Chai, J.; Dong, C.W. Experimental study of the creep properties of coal considering initial damage. Int. J. Rock Mech. Min. Sci. 2021, 139, 104629. [Google Scholar] [CrossRef]
  3. Huang, P.; Zhang, J.X.; Damascene, N.J.; Dong, C.W.; Wang, Z.J. A fractional order viscoelastic-plastic creep model for coal sample considering initial damage accumulation. Alex. Eng. J. 2021, 60, 3921–3930. [Google Scholar] [CrossRef]
  4. Li, S.L.; Chen, Y.R.; Zhang, M.Y.; Xu, P.J.; Hao, J.G. Research on the Dynamic Compressive Performance of Concrete due to the Damage Static Load History. Trans. Beijing Inst. Technol. 2023, 43, 470–477. [Google Scholar]
  5. Li, J.T.; Yu, J.; Qin, Y.J.; Song, Z.W. Experimental study on acoustic emission characteristics of concrete materials with different initial defects under uniaxial compression. Concrete 2020, 363, 7–10+14. [Google Scholar]
  6. Yu, W.X.; Jin, L.; Du, X.L.; Deng, X.F. Effect of initial damage state on static and dynamic fracture of concrete with different sizes, An experimental study. Eng. Fract. Mech. 2020, 274, 108797. [Google Scholar] [CrossRef]
  7. Wang, Q.; Wang, L.; Liu, B.H.; Jiang, B.; Zhang, H.J.; Xu, S. Study of void characteristics and mechanical properties of fractured surrounding rock grout. J. China Univ. Min. Technol. 2019, 48, 1197–1205. [Google Scholar]
  8. Zhang, W.Q.; Zhu, X.X.; Li, S.; Liu, Y.; Wu, X.; Chen, B. Experimental study on the performance of rubber-fly ash-based mine floor fissure grouting material. Coal Sci. Technol. 2023, 51, 1–10. [Google Scholar]
  9. Li, Y.; Li, B.; Yao, S.; Yao, B.H. Quantitative study on grouting plugging effect of loaded fractured coal sample based on CT scanning. J. Mine Autom. 2022, 48, 53–59. [Google Scholar]
  10. Zong, Y.J.; Han, L.J.; Han, G.L. Mechanical characteristics of confined grouting reinforcement for cracked rock mass. J. Min. Saf. Eng. 2013, 30, 483–489. [Google Scholar]
  11. Zhang, B.; Li, S.C.; Zhang, D.F.; Li, M.T.; Shao, D.L. Uniaxial compression mechanical property test; fracture and damage analysis of similar material of jointed rock mass with filled cracks. Saf. Coal Mines 2012, 33, 1647–1652. [Google Scholar]
  12. Li, Z.F.; Li, S.C.; Liu, R.T.; Jiang, Y.J.; Sha, F. Grouting reinforcement experiment for water-rich broken rock mass. Chin. J. Rock Mech. Eng. 2017, 36, 198–207. [Google Scholar]
  13. Liu, Q.S.; Lei, G.F.; Lu, C.B.; Peng, X.X.; Zhang, J.; Wang, J.T. Experimental study of grouting reinforcement influence on mechanical properties of rock fracture. Chin. J. Rock Mech. Eng. 2017, 36, 3140–3147. [Google Scholar]
  14. Huang, X.S.; Zhang, C.; Cheng, C.; Zhao, Y.J. Research on extension law of grouting induced splitting fractures in materials similar to coal rocks containing different prefabricated fractures. Saf. Coal Mines 2021, 52, 43–48. [Google Scholar]
  15. Wang, B.X.; Jin, A.B.; Wang, S.L.; Sun, H. Mechanical characteristics and fracture mechanism of 3D printed rock samples with cross joints. Rock Soil Mech. 2021, 42, 439–450. [Google Scholar]
  16. Gao, Y.; Jing, H.W.; Yu, Z.X.; Wu, J.Y.; Yin, Q.; Fu, G.P. Experimental study on the mechanical properties of crushed stone cemented by graphene oxide and cement-based composite grouting materials. Chin. J. Rock Mech. Eng. 2022, 41, 1898–1909. [Google Scholar]
  17. Zhang, X.; Li, Z.H.; Wang, X.R.; Wang, H.; Li, B.L.; Niu, Y. Thermal effect on the fracture behavior of granite using acoustic emission and digital image correlation, An experimental investigation. Theor. Appl. Fract. Mech. 2022, 121, 103540. [Google Scholar] [CrossRef]
  18. Shuting, M.; Pan, P.Z.; Konicek, P.; Yu, P.Y.; Liu, K.L. Rock damage and fracturing induced by high static stress and slightly dynamic disturbance with acoustic emission and digital image correlation techniques. J. Rock Mech. Geotech. Eng. 2021, 13, 1002–1019. [Google Scholar]
  19. Ashraf, S.; Rucka, M. Microcrack monitoring and fracture evolution of polyolefin and steel fibre concrete beams using integrated acoustic emission and digital image correlation techniques. Constr. Build. Mater. 2023, 395, 132306. [Google Scholar] [CrossRef]
  20. Lei, G.R.; Li, C.Y.; Qi, Q.X.; Wang, J.M.; Du, W.S.; Li, X.S.; He, T. Ultrasonic and CT scanning analysis of coal-rock mass under the primary bedding structure. Coal Sci. Technol. 2024, 52, 74–86. [Google Scholar]
  21. Lu, J.; Yu, H.; Ning, Z.X.; Xu, Q.Y. Influence of different immersion time on coal and rock characteristics based on meso-structure. Coal Eng. 2018, 50, 118–122. [Google Scholar]
  22. Jin, A.B.; Lu, T.; Wang, B.X.; Sun, H.; Zhao, Y.Q.; Chen, S.J. Study on the threshold of key joint trace length in rock mass based on mechanical equivalence. Chin. J. Rock Mech. Eng. 2022, 41, 904–915. [Google Scholar]
  23. Zhang, N. Theory and Practice of Controlling Surrounding Rock with Delayed Grouting in Tunnels; China University of Mining and Technology Press: Xuzhou, China, 2004; pp. 74–75. [Google Scholar]
  24. Yang, K.; Zhang, Z.N.; Hua, X.Z.; Liu, W.J.; Chi, X.L.; Lv, X.; Wang, Y. Microscopic mechanism of loading rate of saturated coal sample mechanics and damage characteristics. Coal Sci. Technol. 2023, 51, 130–142. [Google Scholar]
  25. Wang, Y.; Gao, S.H.; Li, C.H.; Han, J.Q. Investigation on fracture behaviors and damage evolution modeling of freeze-thawed marble subjected to increasing-amplitude cyclic loads. Theor. Appl. Fract. Mech. 2020, 109, 102679. [Google Scholar] [CrossRef]
  26. Yang, S.Q.; Yin, P.F.; Li, B.; Yang, D.S. Behavior of transversely isotropic shale observed in triaxial tests and Brazilian disc tests. J. Rock Mech. Min. Sci. 2020, 133, 104435. [Google Scholar] [CrossRef]
  27. Shuting, M.; Zeinab, A.; Faham, T.; Shen, L.M. A comparative study on the crack development in rock-like specimens containing unfilled and filled flaws. Eng. Fract. Mech. 2021, 241, 107405. [Google Scholar]
  28. Xu, F. Quantitative characterization of deformation and damage process by digital volume correlation, A review. Theor. Appl. Mech. Lett. 2018, 8, 83–96. [Google Scholar] [CrossRef]
  29. Shuting, M.; Pan, P.Z.; Li, S.J.; Chen, J.C.; Konicek, P. Quantitative fracture analysis of hard rock containing double infilling flaws with a novel DIC-based method. Eng. Fract. Mech. 2021, 252, 107846. [Google Scholar]
  30. Jin, A.B.; Wang, S.L.; Wang, B.X.; Sun, H.; Chen, S.J.; Zhu, D.F. Fracture mechanism of specimens with 3D printing cross joint based on DIC technology. Rock Soil Mech. 2020, 41, 3862–3872. [Google Scholar]
  31. Gu, X.B.; Guo, W.Y.; Zhang, C.G.; Zhang, X.F.; Guo, C.Q.; Wang, C. Effect of interfacial angle on the mechanical behaviour and acoustic emission characteristics of coal-rock composite specimens. J. Mater. Res. Technol. 2022, 21, 1933–1943. [Google Scholar] [CrossRef]
  32. Ohtsu, M.; Isoda, T.; Tomoda, Y. Acoustic emission techniques standardized for concrete structures. J. Acoust. Emiss. 2007, 25, 21–32. [Google Scholar]
  33. Wang, Y.F.; Liu, X.; Wang, L.P.; Li, Z.C.; Chen, Y.; Rong, T.L. Coupling effect of loading rate and saturated water on mechanical behavior and micro damage property of sandstone. J. Min. Saf. Eng. 2022, 39, 421–428. [Google Scholar]
  34. He, A.; Wang, L.; Cheng, H.Y.; Yang, S.Y. Study on triaxial creep and acoustic emission characteristics of surrounding rock under high-stress condition. Chin. J. Rock Mech. Eng. 2023, 42, 3367–3376. [Google Scholar]
Figure 1. Sample preparation flow chart.
Applsci 14 05178 g001
Figure 2. Labeled image of the loading system and DIC.
Applsci 14 05178 g002
Figure 3. Diagram of the test system.
Applsci 14 05178 g003
Figure 4. Cloud chart showing principal strain and horizontal displacement of the sample during failure.
Applsci 14 05178 g004
Figure 5. Stress–strain curve for the specimen under 20% early damage.
Applsci 14 05178 g005
Figure 6. Evolution of macroscopic failure and horizontal displacement field on the surface of the sample.
Applsci 14 05178 g006
Figure 7. Maximum relative displacement variation in the sample.
Applsci 14 05178 g007
Figure 8. Acoustic emission and stress characteristics of coal–slurry rock body under different early damage.
Applsci 14 05178 g008
Figure 9. Statistical characteristics of internal cracks in samples under different early damage.
Applsci 14 05178 g009
Figure 10. SEM images of disturbed samples under different degrees of damage.
Applsci 14 05178 g010
Table 1. Sample mass and wave velocity.
Sample No.Before GroutingAfter Grouting
Quality/gWave Velocity/m·s−1Quality/gWave Velocity/m·s−1
S-0%-1305.782142.70339.012173.92
S-0%-2305.001929.01331.601979.02
S-0%-3303.542011.59336.372070.04
S-20%-1306.412094.36337.712104.37
S-20%-2302.802145.68329.162163.03
S-20%-3308.271914.36341.031997.16
S-40%-1307.741997.60339.782042.33
S-40%-2309.802145.68331.472160.47
S-40%-3304.622206.24324.082218.89
S-60%-1310.542345.18334.222367.74
S-60%-2306.212049.16331.152103.20
S-60%-3307.632009.98340.682147.21
Average306.53 2082.63 334.69 2127.28
Table 2. Mechanical properties of the prepared samples.
Degree of Early DamageUCS (MPa)Em (GPa)
Coal8.041.46
0%8.571.41
20%10.031.55
40%10.661.92
60%8.161.45
Table 3. Percentage of tensile cracks in samples at four stages under different early damages.
Initial DamageCompression Phase (%)Elastic Phase (%)Failure Phase (%)Post-Peak Phase (%)
0%73.3761.2852.9422.73
20%53.0963.6451.6743.82
40%80.1565.8936.2724.53
60%73.6884.0047.0439.03
Disclaimer/Publisher’s Note: The statements, opinions and data contained in all publications are solely those of the individual author(s) and contributor(s) and not of MDPI and/or the editor(s). MDPI and/or the editor(s) disclaim responsibility for any injury to people or property resulting from any ideas, methods, instructions or products referred to in the content.

