Article

InSAR-CTPIM-Based 3D Deformation Prediction in Coal Mining Areas of the Baisha Reservoir, China

by
Minchao Lei
1,
Tengfei Zhang
2,*,
Jiancun Shi
1,* and
Jing Yu
3
1
School of Traffic and Transportation Engineering, Changsha University of Science & Technology, Changsha 410114, China
2
School of Resource and Environmental Sciences, Wuhan University, Wuhan 430079, China
3
Hunan Zhongkan Beidou Research Institute Co., Ltd., Changsha 410205, China
*
Authors to whom correspondence should be addressed.
Appl. Sci. 2024, 14(12), 5199; https://doi.org/10.3390/app14125199
Submission received: 8 May 2024 / Revised: 5 June 2024 / Accepted: 7 June 2024 / Published: 14 June 2024
(This article belongs to the Special Issue Remote Sensing Technology in Landslide and Land Subsidence)

Abstract

:
Time series dynamic prediction of surface deformation in mining areas can provide reference data for coal mine safety and production, which has important impacts. The combination of interferometric synthetic aperture radar (InSAR) technology and the probability integral method (PIM) is commonly used for predicting deformation. However, most surface subsidence prediction in mining areas is based on the static PIM parameters, failing to achieve the three-dimensional (3D) dynamic deformation prediction. This paper proposed a 3D deformation dynamic prediction model (InSAR-3D-CTPIM) between InSAR deformation observations and dynamic coordinate-time PIM (CTPIM) parameters, which can realize the prediction of east–west, north–south, and vertical series deformation caused by mining. The method has been validated by simulation experiments and real experiments in the mining area of Jiansheng Coal Mine in Baisha Reservoir, Henan Province, China. The results showed that the modeling accuracy was improved by 34.3% compared to the traditional multi-rate model, and the accuracy was improved by 28.5% compared to the vertical deformation obtained by the traditional static PIM method. The InSAR-3D-CTPIM model can be used to predict the evolutionary history of basin-wide surface deformation dynamics in coal mining areas, and provide a reference for the early warning and prediction of geological hazards in coal mining areas.

1. Introduction

China is rich in coal resources, with proven coal reserves of 207.885 billion tons, ranking fourth in the world [1]. The coal mines around the Baisha Reservoir in the Henan region are densely distributed, and mining activities are frequent. Due to the proximity of the reservoir and the abundance of underground water, long-term coal mining activities tend to disrupt the stress balance of the rocks near the coal body, causing the collapse of the mining area and even the occurrence of mine water intrusion accidents, seriously affecting the safety of people’s lives and property around the mining area [2]. Therefore, long-term dynamic three-dimensional (3D) deformation prediction for the mining basin in the coal mining area in this region is of great significance for the production safety of the mining area and the prevention of mining-related geological disasters.
The traditional methods of deformation prediction in coal mining areas can be divided into two categories [3]: the empirical prediction method [4] and the influence function method [5], both of which require a large number of accurate surface deformation measurement samples to construct a reliable prediction model and then carry out displacement orthotropic predictions. For the acquisition of surface deformations, traditional geodetic methods, such as levelling and global positioning system (GPS) measurements and other techniques, have low point density, limited monitoring range and poor spatial and time series resolution, making it difficult to use these techniques to obtain sparse point measurements to characterize the dynamic evolution of the entire subsidence cone. It is difficult to use these techniques to obtain sparse point measurements to describe the dynamic evolution of the whole sedimentation funnel, and they require significant manpower, material and financial resources [6]. The interferometric synthetic aperture radar (InSAR) technique can be used to obtain a large amount of surface deformation observation data in mining areas under all-weather, non-contact conditions [7,8], so it has been widely used to monitor surface deformation in coal mining areas [9,10,11,12,13]. The basic idea is to use the radar line-of-sight (LOS) time series deformation obtained by InSAR as the input value of the time series prediction model, estimate the prediction model parameters, and then realize the prediction of surface deformation in the mining subsidence area. For example, Fan et al. [14] and Plattner et al. [15] projected the LOS deformation generated by InSAR in the vertical direction and then used the resulting vertical displacement as an input value to estimate the parameters of the probability integral method (PIM) to predict the vertical deformation of the surface caused by mining. However, the PIM method is a static model that cannot predict the dynamic changes in mine subsidence over time. If the SAR image is missing, the deformation results for the time period outside the image cannot be obtained. Therefore, Zhang et al. [16] proposed the InSAR deformation model based on the coordinate-time PIM (CT-PIM) [17] and realized the prediction of the vertical deformation of a mine caused by drilling and water-soluble mining in Xinhua, Hunan Province, China. However, the above study neglected the effect of horizontal movement and could only provide a one-dimensional prediction of mine subsidence, but could not realize the prediction of 3D surface displacement caused by mining activities. To address this problem, Yang et al. comprehensively considered the influence of horizontal displacement and proposed combining the probabilistic integral method (PIM) with the Knothe time function to realize the prediction of three-dimensional displacement induced by full-scale mining in the vertical, east–west, and north–south directions [18,19]. However, the prediction of vertical displacement uses a static PIM model, which is used to multiply the Knothe time function to obtain a dynamic prediction along the vertical direction. Vertical displacement is the main indicator of 3D displacement in a mining area, and the Knothe time function is an empirical function fitted along the time series; the physical meaning is not clear enough, the model effect is not ideal, and the accuracy of predicting the vertical displacement is still debatable.
Based on this, a 3D deformation dynamic prediction model (InSAR-3D-CTPIM) between InSAR deformation observations and coordinate-time PIM (CT-PIM) parameters has been proposed in this paper. Based on the literature [19], this model replaces the union of the static PIM and the Knothe function with a more theoretical coordinate-time function that can directly solve the PIM parameters by using the InSAR phase observations and fully reflect the mining geological conditions in the prediction of vertically oriented deformation, with higher modeling accuracy. Based on the literature [16], the one-dimensional vertical deformation prediction was extended to 3D deformation prediction, which can realize the deformation prediction in the three directions of vertical, east–west and north–south. Then, the historical deformation of the Jiansheng Coal Mining Area, which may have collapsed southwest of the Baisha Reservoir of Henan Province during the period of 2015–2017, was reconstructed. The research results can more comprehensively decipher the developmental history of basin-wide deformation dynamics of the surface in this mining area, providing a reference for the subsequent early warning and prediction of geological hazards in this area.

2. Methods

2.1. SBAS-Based Estimation of Line-of-Sight Deformation

Firstly, the small baseline subset (SBAS) technique was used to obtain the LOS deformation of the mine surface. This technique is used to invert the LOS deformation of the area by solving the deformation of a large number of dense, high-coherence points in the area. Assuming that N + 1 SAR images of the study area are acquired and M differential interferograms are generated [20,21], the phase of the i-th pixel on the m-th (1 ≤ m < M) differential interferogram can be expressed as follows [22]:
δ φ m i = δ φ d e f i + δ φ t o p o i + δ φ o r b i t i + δ φ a t m i + δ φ n o i s e i + δ φ N o n i 4 π λ Δ d i + 4 π B i λ R sin θ Δ H i + δ φ r e s i
where δ φ d e f i denotes the deformation phase, λ denotes the radar wavelength, Δd(i) is the deformation component of the m-th differential interferogram, which is called the Low Pass (LP) deformation component, δ φ t o p o i denotes the terrain phase δ φ t o p o i = ( 4 π B i / λ R sin θ ) Δ H i , where Bi denotes the length of the vertical baseline, R is the distance between the target and the radar satellite location, θ denotes the radar incidence angle, and ΔHi denotes the elevation correction value, which is regarded as an unknown parameter, δ φ o r b i t i denotes the orbital error phase, and δ φ r e s i denotes the residual phase, including atmospheric delay phase δ φ a t m i , noise phase δ φ n o i s e i , and High Pass (HP) deformation component δ φ N o n i , where Δ d i = d ( t B i ) d ( t A i ) , d ( t B i ) and d ( t A i ) denote the deformation (tB > tA) components of the point relative to the start time t0 (i.e., d (t0) = 0) at the image acquisition moments tB and tA, respectively, which can be expressed as below [23,24,25]:
Δ d i = t A i + 1 t B i v k t k t k 1
where vk is the linear deformation rate at each interference epoch, k is the number of interference pairs, and Equation (1) can be written as follows:
δ φ m i = B v k
The process of solving (3) is a least squares problem, where N linear velocities v and elevation corrections ΔHi need to be estimated according to Equations (1) and (2). Since the matrix B is a rank-loss matrix, the singular value decomposition algorithm [26] can solve the minimum van solution for the unknown parameters vk and ΔHi in Equation (1), and then the deformation rate is integrated over each period, and the low-frequency deformation sequence can be calculated by substituting into Equation (3) [27]. The atmospheric delay phase component is a high-frequency signal in the time dimension and a low-frequency signal in the spatial dimension, and the nonlinear deformation is a low-frequency signal in the time dimension. Therefore, the time-dimensional high-pass filtering and spatial-dimensional low-pass filtering are used to obtain the high-frequency nonlinear deformation (HP) component, which is then accumulated with the low-frequency linear deformation (LP) component, and the total deformation volume of the point can be estimated. The principle of the SBAS-InSAR technique is shown in Figure 1.

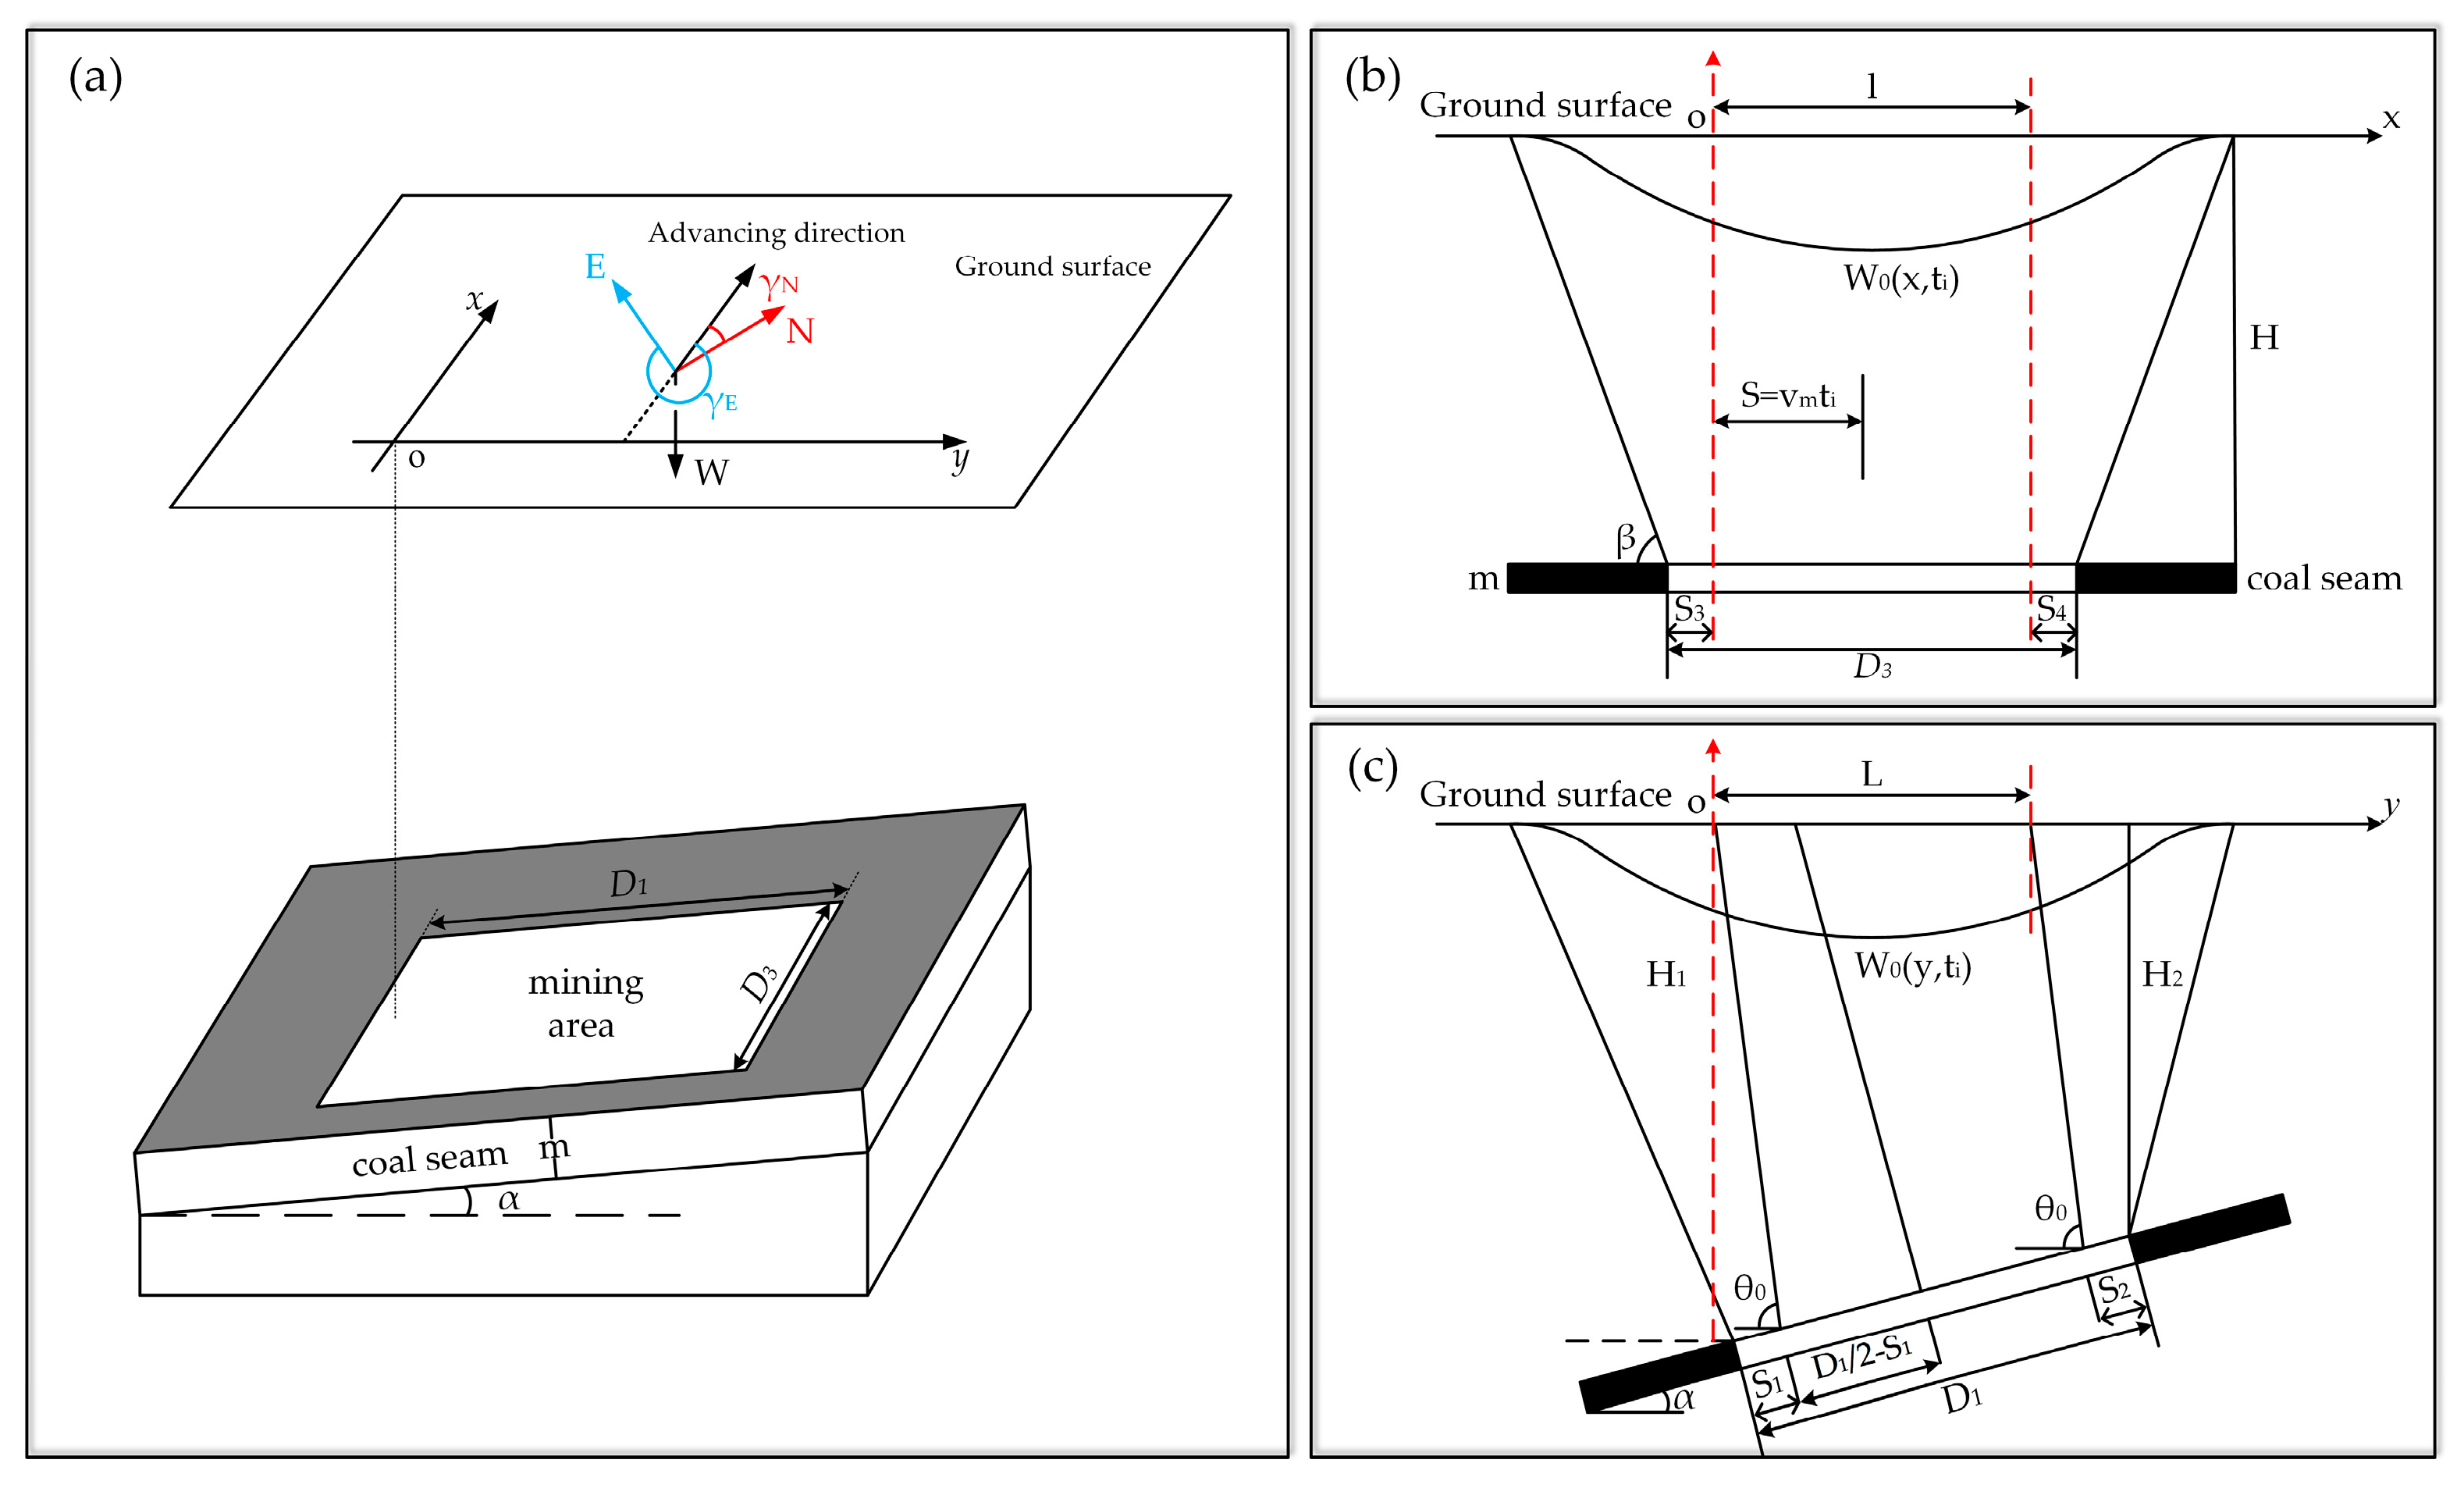
2.2. Three-Dimensional CTPIM Modeling Based on Coordinate-Time Functions

A three-dimensional deformation prediction model (3D-CTPIM) between dynamic surface subsidence and horizontal displacement with probabilistic integral parameters is constructed as follows [28]:
W ( x , y , t i ) = W 0 ( x , t i ) W 0 ( y , t i ) w 0
U ( x , y , γ , t i ) = U 0 ( x , t i ) W 0 ( y , t i ) cos γ w 0 + U 0 ( y , t i ) W 0 ( x , t i ) sin γ w 0
where W ( x , y , t i ) and U ( x , y , γ , t i ) are the subsidence and horizontal displacement of any point on the surface of the mining area at the moment of workface advancement ti, w0 is the maximum settlement under mining conditions, w0 = mqcosα, where m indicates the mining thickness, q indicates the subsidence coefficient, and α indicates the inclination angle of the mining area; γ indicates the angle between the advancing direction of the workface and a given direction, and the north–south displacement UN can be obtained when the input value of the angle γ is γN in Equation (5), and the east–west displacement UE (see Figure 2a) can be obtained when the input value of γ is γE. W0(x, ti), W0(y, ti) and U0(x, ti), U0(y, ti) can be expressed as follows under different mining conditions:
  • When the mining tendency of the mine is fully mined and the strike is not fully mined, the W 0 ( x , t i ) in Equation (4) can be expressed as follows [16]:
W 0 ( x , t i ) = = w ( x ) 2 e r f ( π ) + e r f π v m t i n H r r ,   x n H w ( x ) 2 e r f π e r f ( π ) + v m t i r x + H a + b x H ( a + b x ) 3 r ,   n H x 1.3 r = w 0 2 e r f π r + e r f π v m t i + H / tan ω 2 x r ,   1.3 r x
where x denotes the horizontal coordinate of any high-coherence point in the mining area, w(x) is the static subsidence, which can be expressed as w ( x ) = w 0 2 e r f π x r + 1 ; erf is the probability integral function, which can be expressed as e r f π r x = 2 π 0 π r x e u 2 d u , where u is the integral parameter; r = H tan β is the main influence radius, where H is the mining depth, and tanβ is the tangent value of the main influence angle; nH is the start-up distance, n is the start-up coefficient, ω is the overshooting static influence angle, vm is the constant speed under uniform mining conditions, and the coefficients a and b can be expressed as a = 117 r ω n H 1.3 r + n H , b = ω 90 ° 1.3 r + n H , respectively. U 0 ( x , t i ) in Equation (5) can be expressed as follows:
U 0 ( x , t i ) = 0 i σ t i t k U 1 x j = 0 k v j · t j U 1 x j = 1 k + 1 v j · t j
σ t j = 1 exp c t j
where U 1 ( x ) = d   w 0   exp π x 2 r 2 , d is the horizontal displacement constant, tj is the mining time, and vj is the average propulsion velocity. The σ t j in Equation (8) is the time function, where c is a time parameter that characterizes the change in horizontal movement with time.
2.
When the mining strike is fully mined and the tendency is not fully mined, W0(y, ti) in Equation (4) and U0(y, ti) in Equation (5) can be expressed as follows:
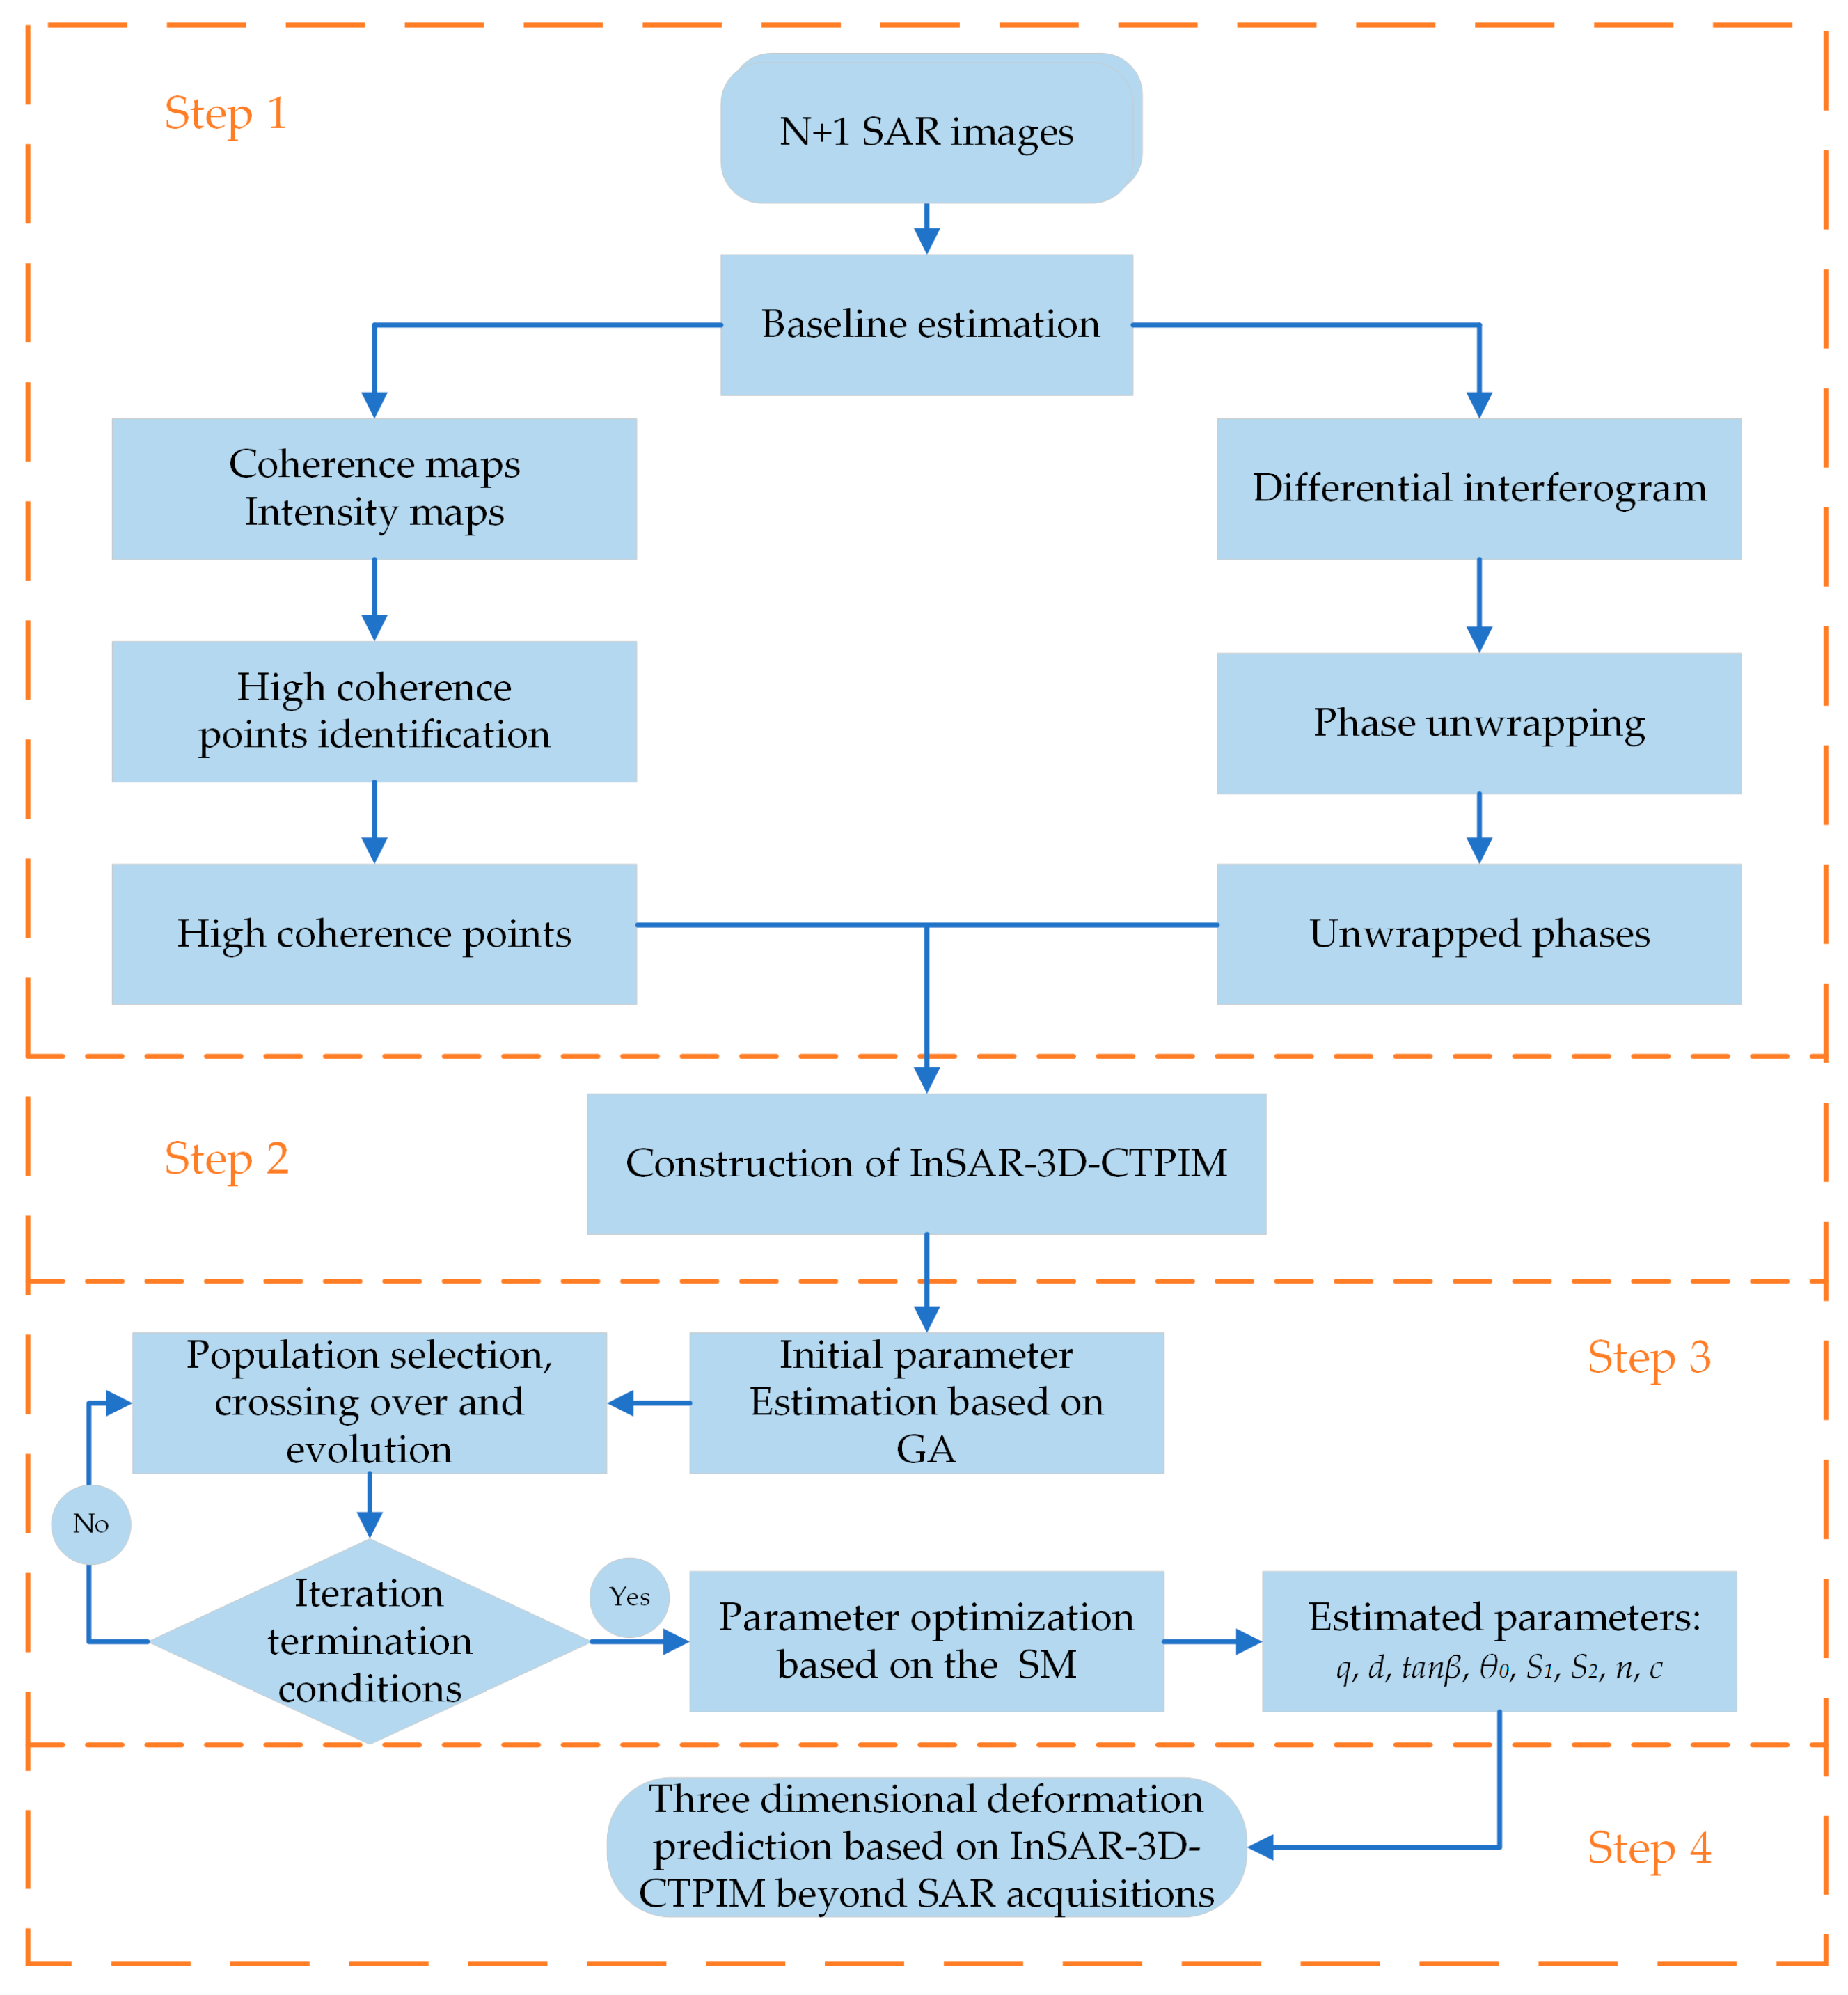
W 0 ( y , t i ) = w 0 2 e r f π y r 1 e r f π y L r 2
U 0 y , t i = U 1 y U 1 y L + W 0 y , t i cot θ 0
where y indicates the longitudinal coordinates of any high-coherence point in the mining area, r 1 = H 1 tan β 1 , r 2 = H 2 tan β 2 respectively, for the upper and lower radius of influence; H1, and H2, respectively, for the mining depth of the upper and lower mountain, which can be calculated according to the formula H 1 = H D 1 2 sin α , and H 2 = H + D 1 2 sin α ; L = ( D 1 S 1 S 2 ) sin ( θ 0 α ) sin θ 0 for the length of the inclined working face, D1 for the inclined slanting length of the working face, S1, S2 for the offset distance of the lower and upper inflexion points, respectively, and θ0 for the angle of propagation of the mining influence.

2.3. InSAR-3D-CTPIM

Based on Section 2.2, the time series function model between the InSAR LOS-oriented deformation and the 3D coordinate-time function 3D-CTPIM is constructed, and the InSAR LOS-oriented deformation can be expressed as follows [29]:
Δ d ( t i ) = d ( t B ) d ( t A )
d ( t i ) = W cos θ sin θ U N cos α h 3 π / 2 + U E sin ( α h 3 π / 2 )
In Equation (11), d(tB) and d(tA) are the LOS-direction deformation components at moments t B and t A , respectively, and the LOS-direction deformation component at ti moments can be expressed as Equation (12), where θ is the radar incidence angle, and αh is the satellite heading angle, and it is known from Equations (4) and (5) that W , U E and U N denote the vertical, east–west and north–south direction deformation components. At this time, the surface three-dimensional displacement can be expressed as follows:
W ( x , y , t i ) = f W U ( x , y , γ N , t i ) = f U n U ( x , y , γ E , t i ) = f U e
where f W , f U n , and f U e denote the mapping functions of vertical and horizontal displacements containing unknown parameters, respectively. According to the geometric relationship of the mining area, γ N and γ E , respectively, are the counterclockwise angles between the underground mining direction and the north direction and the east direction, which can be obtained by bringing into Equations (14) and (15):
f w = W 0 ( x , t i ) W 0 ( y , t i ) w 0
f U n = U 0 ( x , t i ) W 0 ( y , t i ) cos γ N w 0 + U 0 ( y , t i ) W 0 ( x , t i ) sin γ N w 0
f U e = U 0 ( x , t i ) W 0 ( y , t i ) cos γ E w 0 + U 0 ( y , t i ) W 0 ( x , t i ) sin γ E w 0
Substituting Equation (13) into Equation (12) to construct the functional relationship between the InSAR LOS deformation and the parameters of the probabilistic integral model, the LOS deformation component at the moment ti can be expressed as follows:
d ( t i ) = cos θ sin θ cos α h 3 π / 2 sin θ sin α h 3 π / 2 T f W f U n f U e
Substituting Equation (17) into Equation (1), the function between the InSAR differential interferometric phase and the PIM parameters can be expressed as below:
δ φ m ( x , r ) = δ φ B ( x , r ) δ φ A ( x , r ) 4 π λ [ d ( t B ) d ( t A ) ] + 4 π B ^ λ R sin θ Δ H ( x , r ) + δ φ r e s m ( x , r )
The above equation describes the time series functional relationship between the InSAR temporal phase and the 3D-CTPIM predicted parameters, incorporating the temporal parameters, which can be used directly to estimate the model predicted parameters using the InSAR phase values. Among them, the mine geological parameters G1 = [m, H1, H2, α, ω , D1, D3, vm] can be determined based on the information of the mine geological conditions, which are considered as known parameters. The PIM parameters G2 = [q, tanβ, d, θ0, S1, S2, n] and the time parameter c. The dynamic prediction of the three-dimensional movement of the mine surface can be realized by substituting the obtained unknown parameters into Equations (4) and (5).

2.4. InSAR-3D-CTPIM Parameter Estimation by GA-SM

In this paper, a genetic algorithm (GA) is used to estimate the unknown parameters G2 and c of the model in parallel with the simplex method (SM). For each high-coherence point (x, y) on the generated M differential interferograms, M equations can be listed, and the number of InSAR observations of more than eight views can be obtained from the unknown parameters. And the InSAR phase observations are used as inputs to estimate the model parameters [30]. The fitness function of the genetic algorithm can be expressed as follows:
f = min   δ φ δ φ m  
where δ φ denotes the differential interferometric phase obtained from InSAR measurements; δ φ m is the differential interferometric phase calculated from the unknown parameters obtained by the GA algorithm according to Equation (18). When using the GA search, the geological parameters G1 = [m, H1, H2, α, ω , D1, D3, vm ] can be determined according to the geological data of the mine area [31], which are regarded as known parameters, and the range of values of the model parameters G2 are shown in Table 1.
The search for unknown parameters using the GA method is more dependent on the initial range of the population, and the optimal evaluation of the unknown parameters obtained may not reach the optimal value within a limited number of iterations, which may therefore lead to poor accuracy or even an incorrect output solution. The accuracy of model parameter estimation can be improved by using SM for secondary search [32]. The flow of the GA-SM algorithm is (1) GA search to obtain the initial solution of unknown parameters as the initial value of SM and construct an initial simplex form with nine solutions; (2) Calculate the value of the fitness function to determine the worst, second worst, and optimal solutions; and (3) Expand, compress, and worst-compress operations using the reflection point until the search for a solution better than the worst solution stops; perform multiple superpositions to find the optimal solution as the final evaluation of G2. The process of 3D-CTPIM to predict the three-dimensional deformation of the mine is shown in Figure 3.

3. Simulation Experiment

A simulation experiment was carried out in this paper to verify the feasibility and reliability of the method. The satellite parameters used in the simulation experiment are set based on the Sentinel-1A satellite SAR image parameters in the real experiment (see Section 4), with the geological parameter G1 = [2 m, 612 m, 588 m, 7°, 82°, 200 m, 500 m, 0.52 m/d], the PIM parameter-simulated value G2 = [0.711, 1.251, 0.326, 83.29, 7.71 m, 11.22 m, 0.167] and the time function model parameter c of 8.261; the 3D deformation field is generated as the real deformation according to Equations (4) and (5), respectively, as shown in Figure 4, from which 300-pixel points of 3D deformation values are extracted to be analyzed in quantitative comparison with the 3D deformation-calculated values generated by InSAR-3D-CTPIM.
Figure 5 shows the comparison between the simulated and predicted vertical deformation values of pixels for four time periods; as can be seen from the figure, the simulated actual values and the predicted values of deformation are in good agreement, and statistically, the pixels with the error values distributed between [–2, 2] mm account for 100%, 99%, 94.67%, and 91% of the total number of pixels, respectively, where the maximum errors are 0.8 mm, 1.2 mm, 3.2 mm, 4.8 mm, respectively. Meanwhile, the root mean square errors (RMSE) of the model parameters were calculated to quantitatively verify the simulated and actual values of the model parameters. As shown in Table 2, the relative errors of the eight model parameters are less than 7%; the RMSE between the simulated actual values of vertical deformation and the predicted values of deformation generated by the InSAR-3D-CTPIM model is 2.2 mm, which confirms the reliability of the model and parameter estimation methods in this paper.

4. Real Experiments

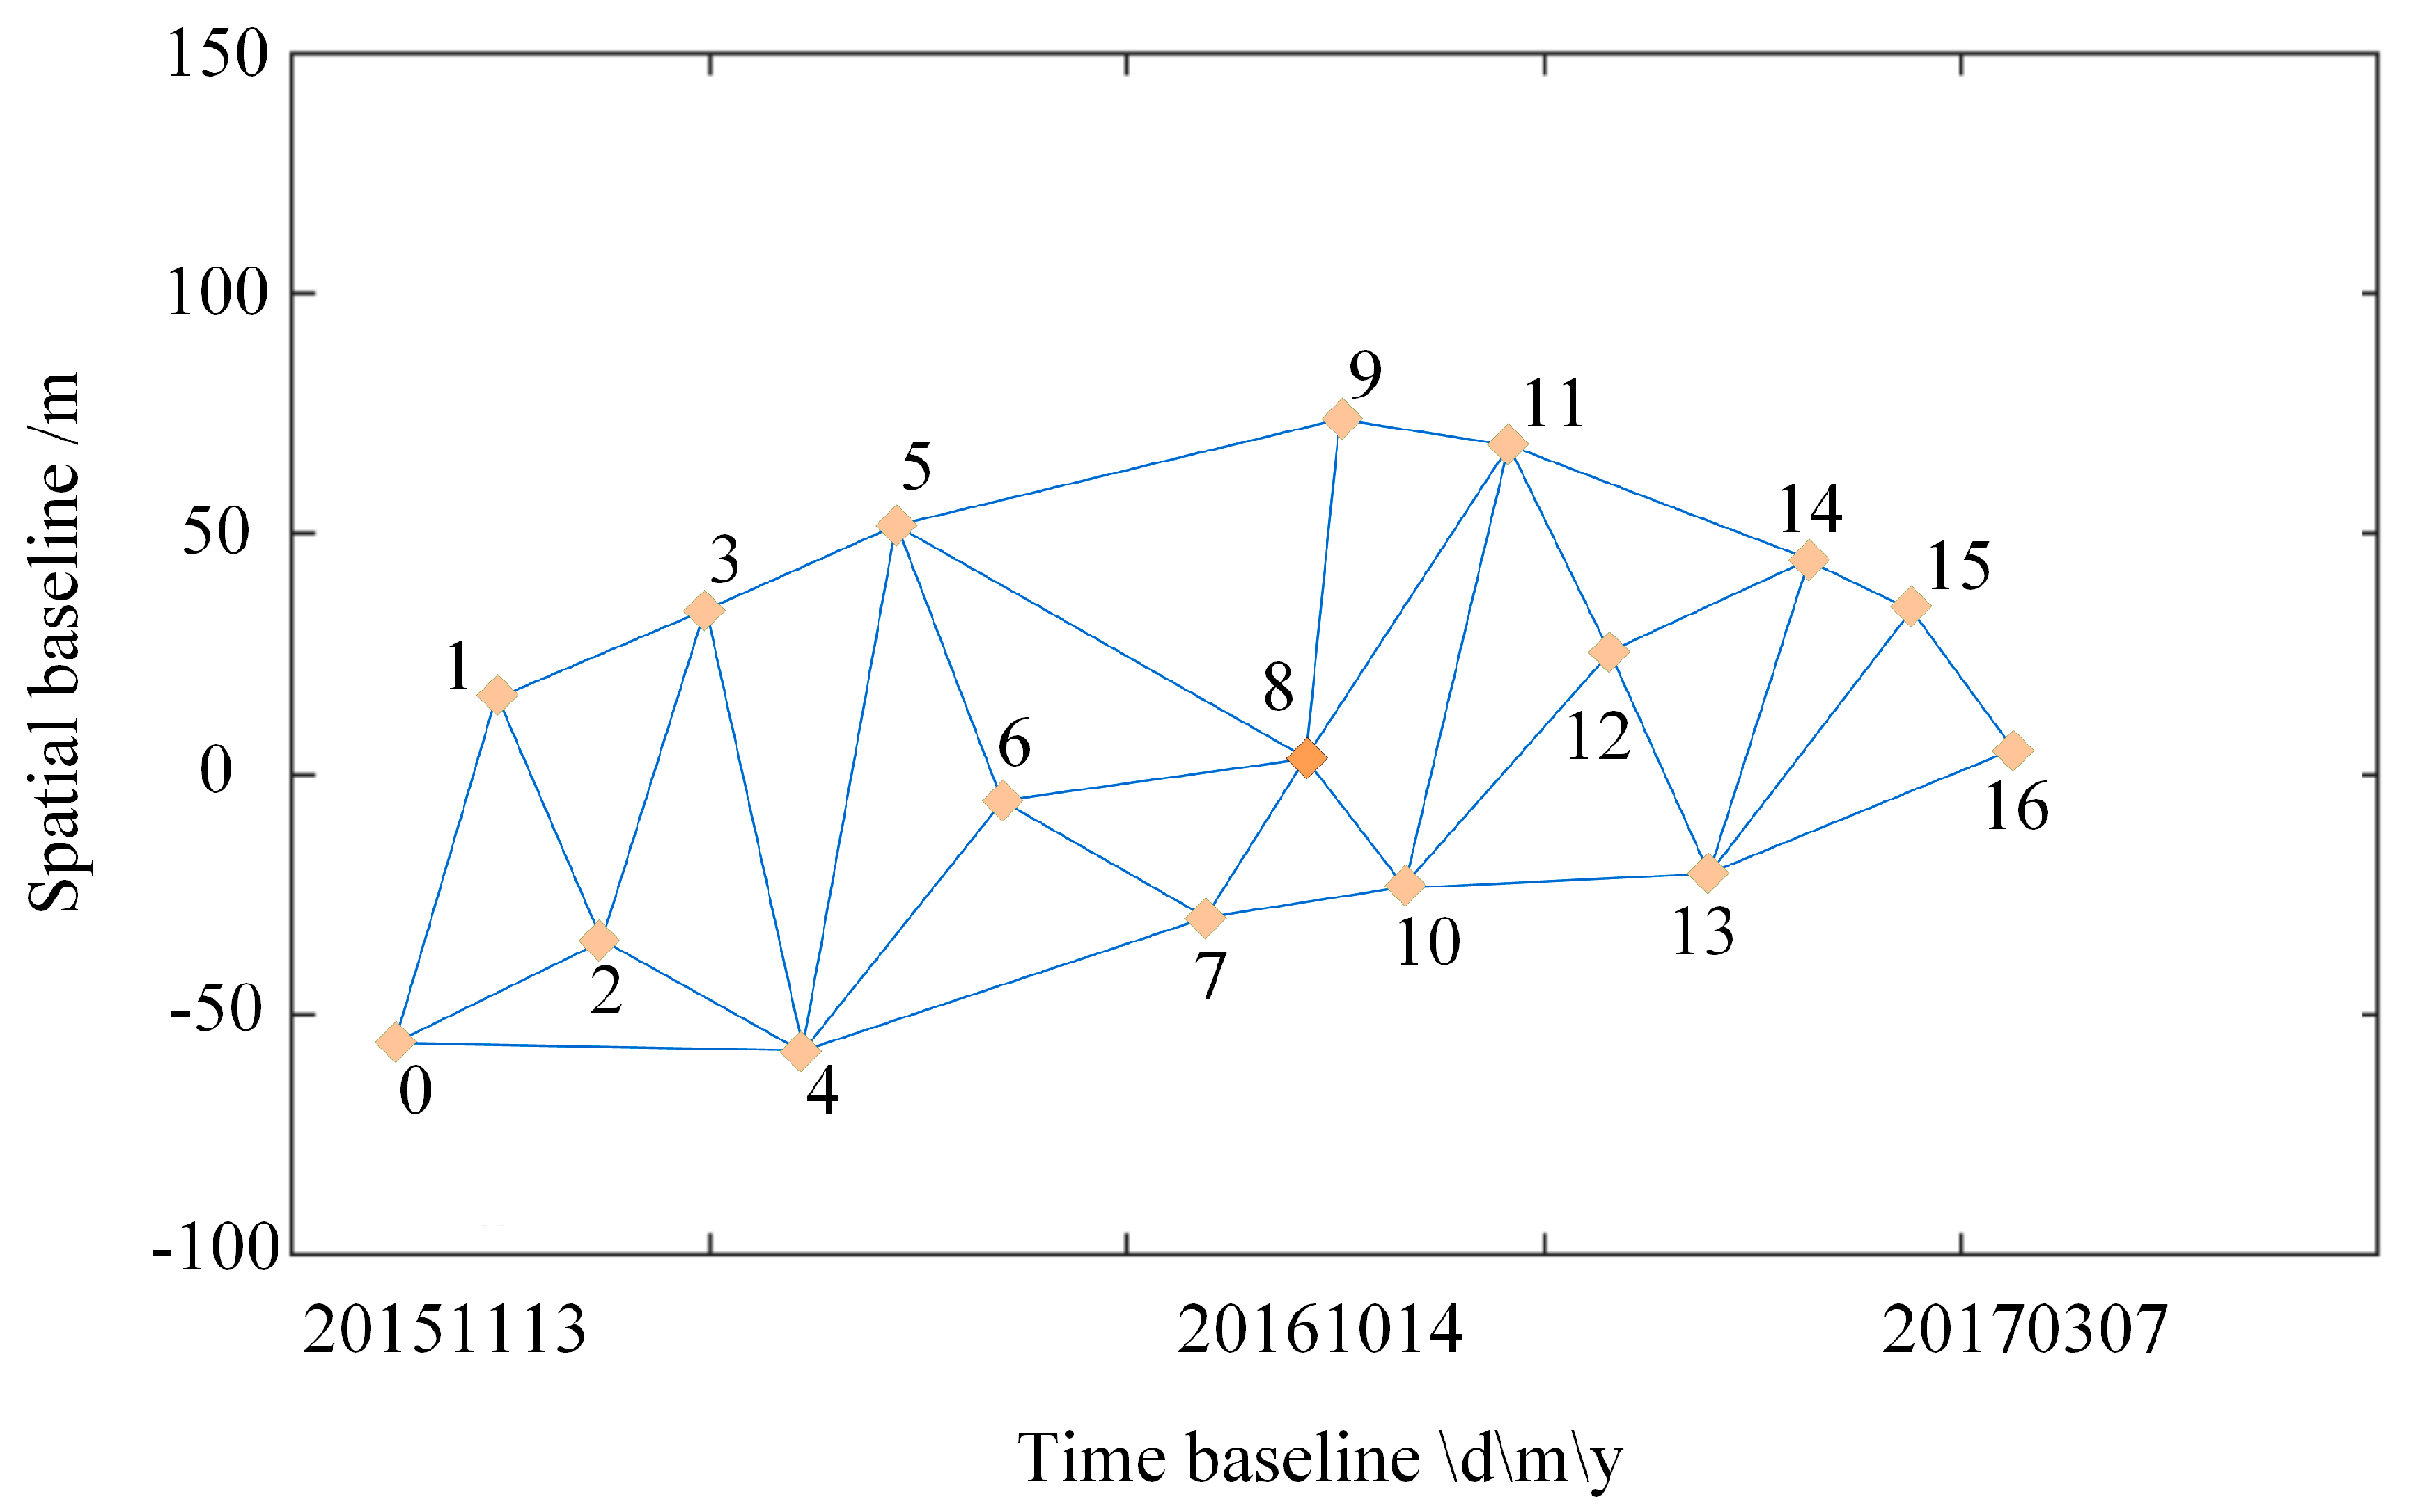
4.1. Experimental Area and Experimental Data

Jiansheng Coal Mine is located southwest of Bisha Reservoir in Dengfeng City, Henan Province, and its geographical location is shown in Figure 6b; the red box in Figure 6a is the Sentinel-1A up-orbiting satellite image coverage, and the blue rectangular box in Figure 6c is the study area of this paper, which covers an area of 16.4 km2. The distribution of mineral resources around the study area is extremely dense, mainly dominated by coal mines; due to the close proximity to the reservoir, the underground water content around the mining area is relatively rich, coupled with long-term mining activities, resulting in exposed rock strata and sparse vegetation in the area, and the long-term cumulative deformation has made the area highly susceptible to accidents, such as surface cave-ins and mine water penetration.
In this paper, the SAR data are processed using the SBAS-InSAR technique, and 12 views of Sentinel-1A up-orbit SAR images covering the study area from 13 November 2015 to 19 November 2016 are processed with pre-differential interferometric processing as observation data, and the cumulative deformations from 13 November 2015 to 1 December 2016, 18 January 2017, 23 February 2017, and 7 March 2017 are taken as the validation data to verify the reliability of the proposed method. The basic information of the SAR image is shown in Table 3. The spatio-temporal baseline distribution is shown in Figure 7; in addition, the geological parameters of the survey area are G1 = [0.66 m, 620 m, 580 m, 4.5°, 84°, 300 m, 750 m, and 2 m/d].

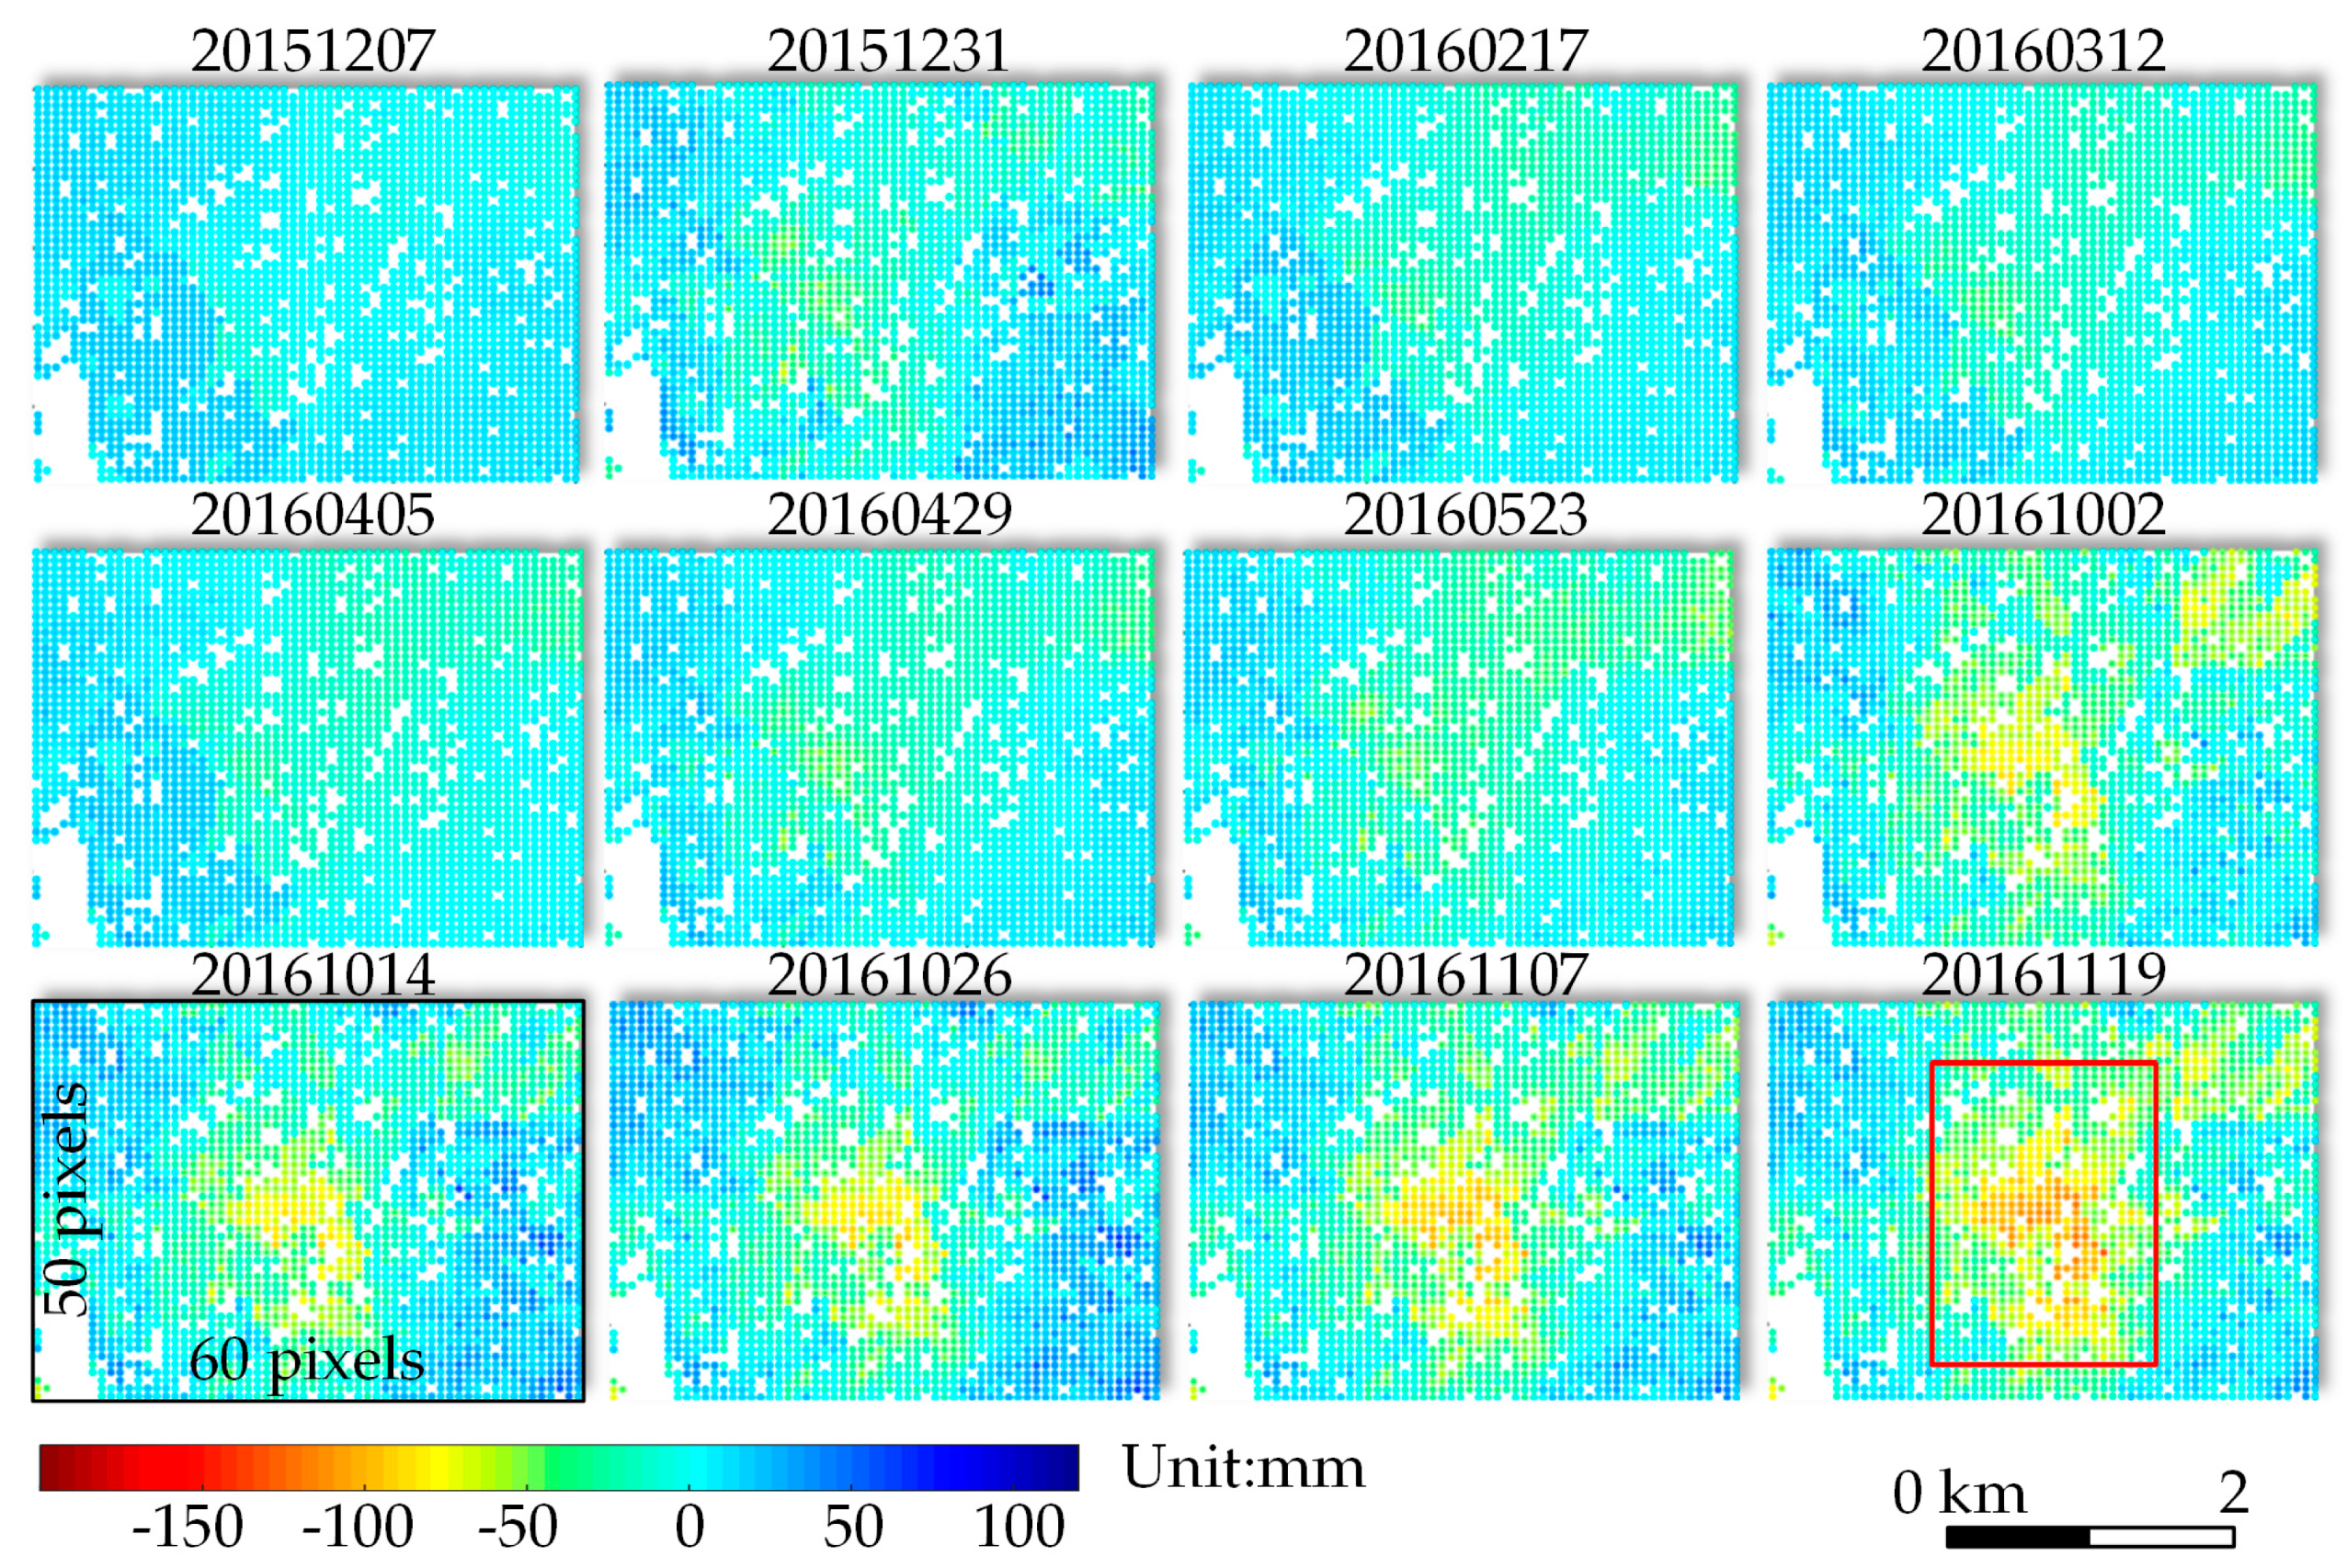
4.2. Time Series Deformation Monitoring Based on SBAS-InSAR Technique

In this paper, one-dimensional deformation monitoring was first carried out using SBAS-InSAR technology, with spatiotemporal baseline thresholds set to 180 days and 140 m, respectively. Through baseline estimation, pre-differential interferometric processing, phase unwrapping, deformation rate estimation in the LOS direction, and spatial-temporal filtering, the interferograms with poor unwrapping effect were removed, and 25 unwrapped differential interferograms were acquired, and the 12 LOS time series deformation results were finally obtained for the period of 13 November 2015 to 19 November 2016; the time series deformation results are shown in Figure 8. During the period from 31 December 2015 to 2 October 2016, the whole mine area was from blue to light yellow, with a general trend of slow subsidence, and with the continuous advancement of mining, the mining area was intensified from light yellow and gradually changed to red; as of 19 November 2016, the LOS direction time series maximum deformation value reached 147 mm.

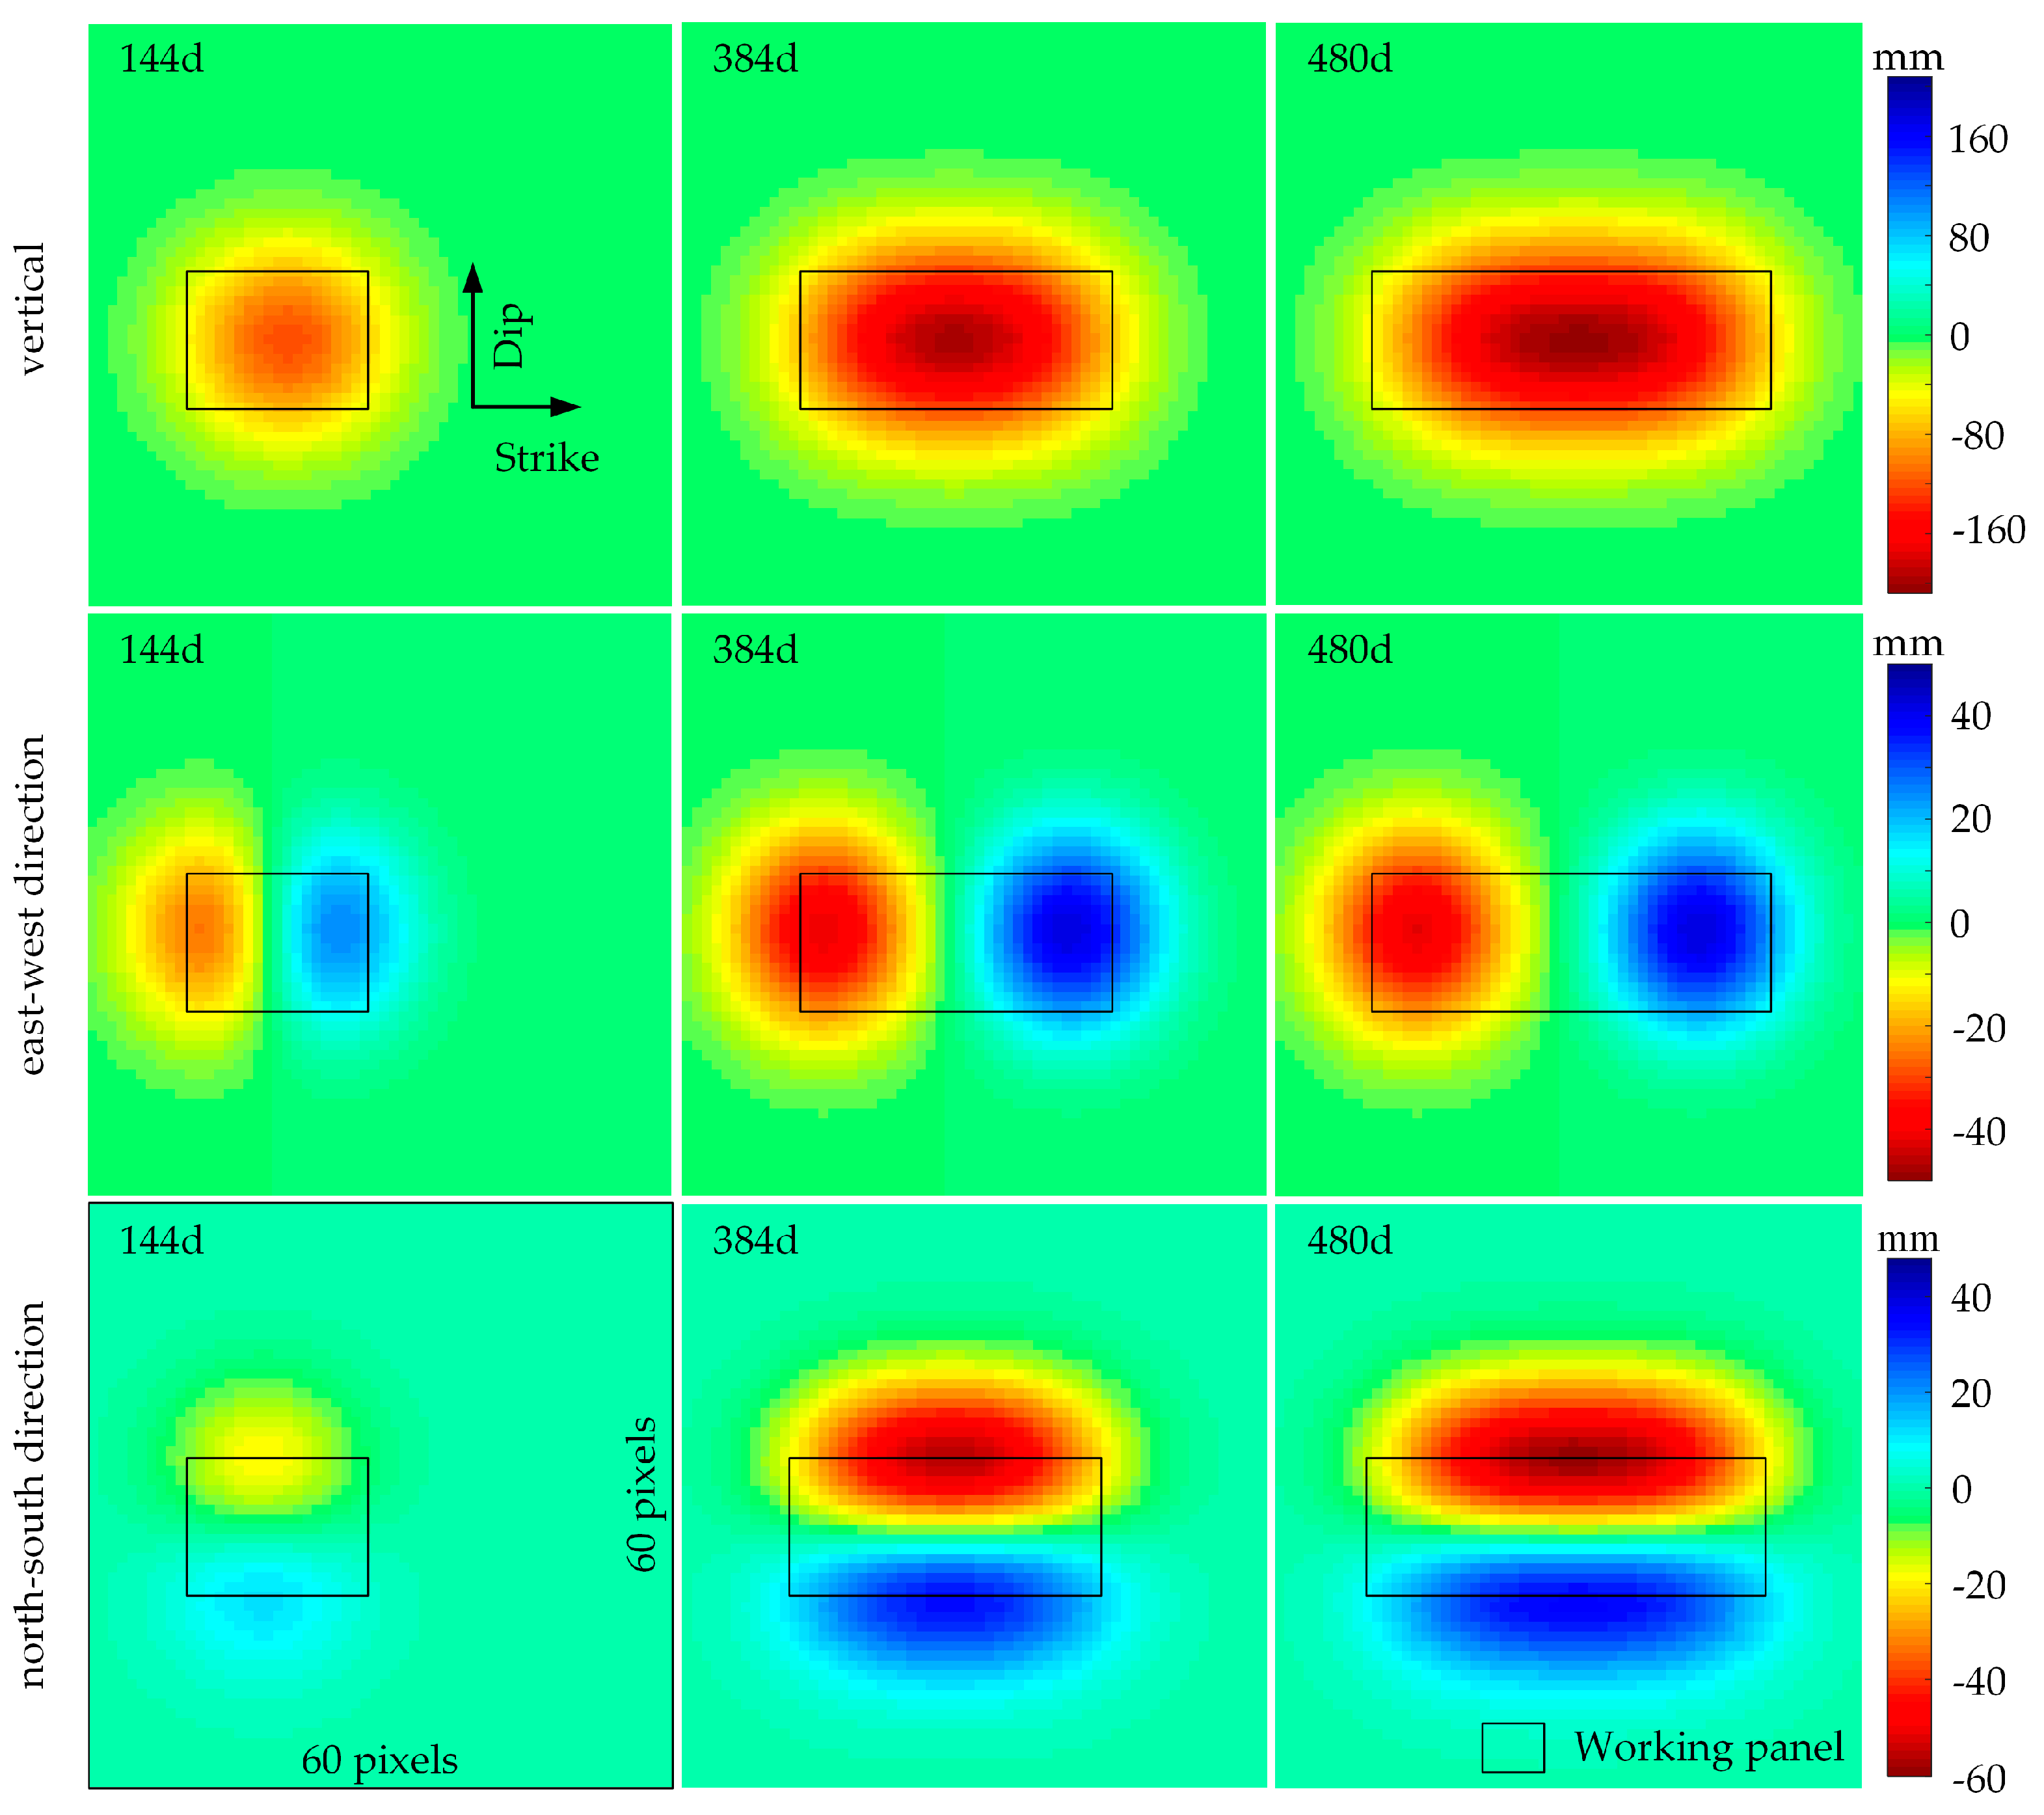
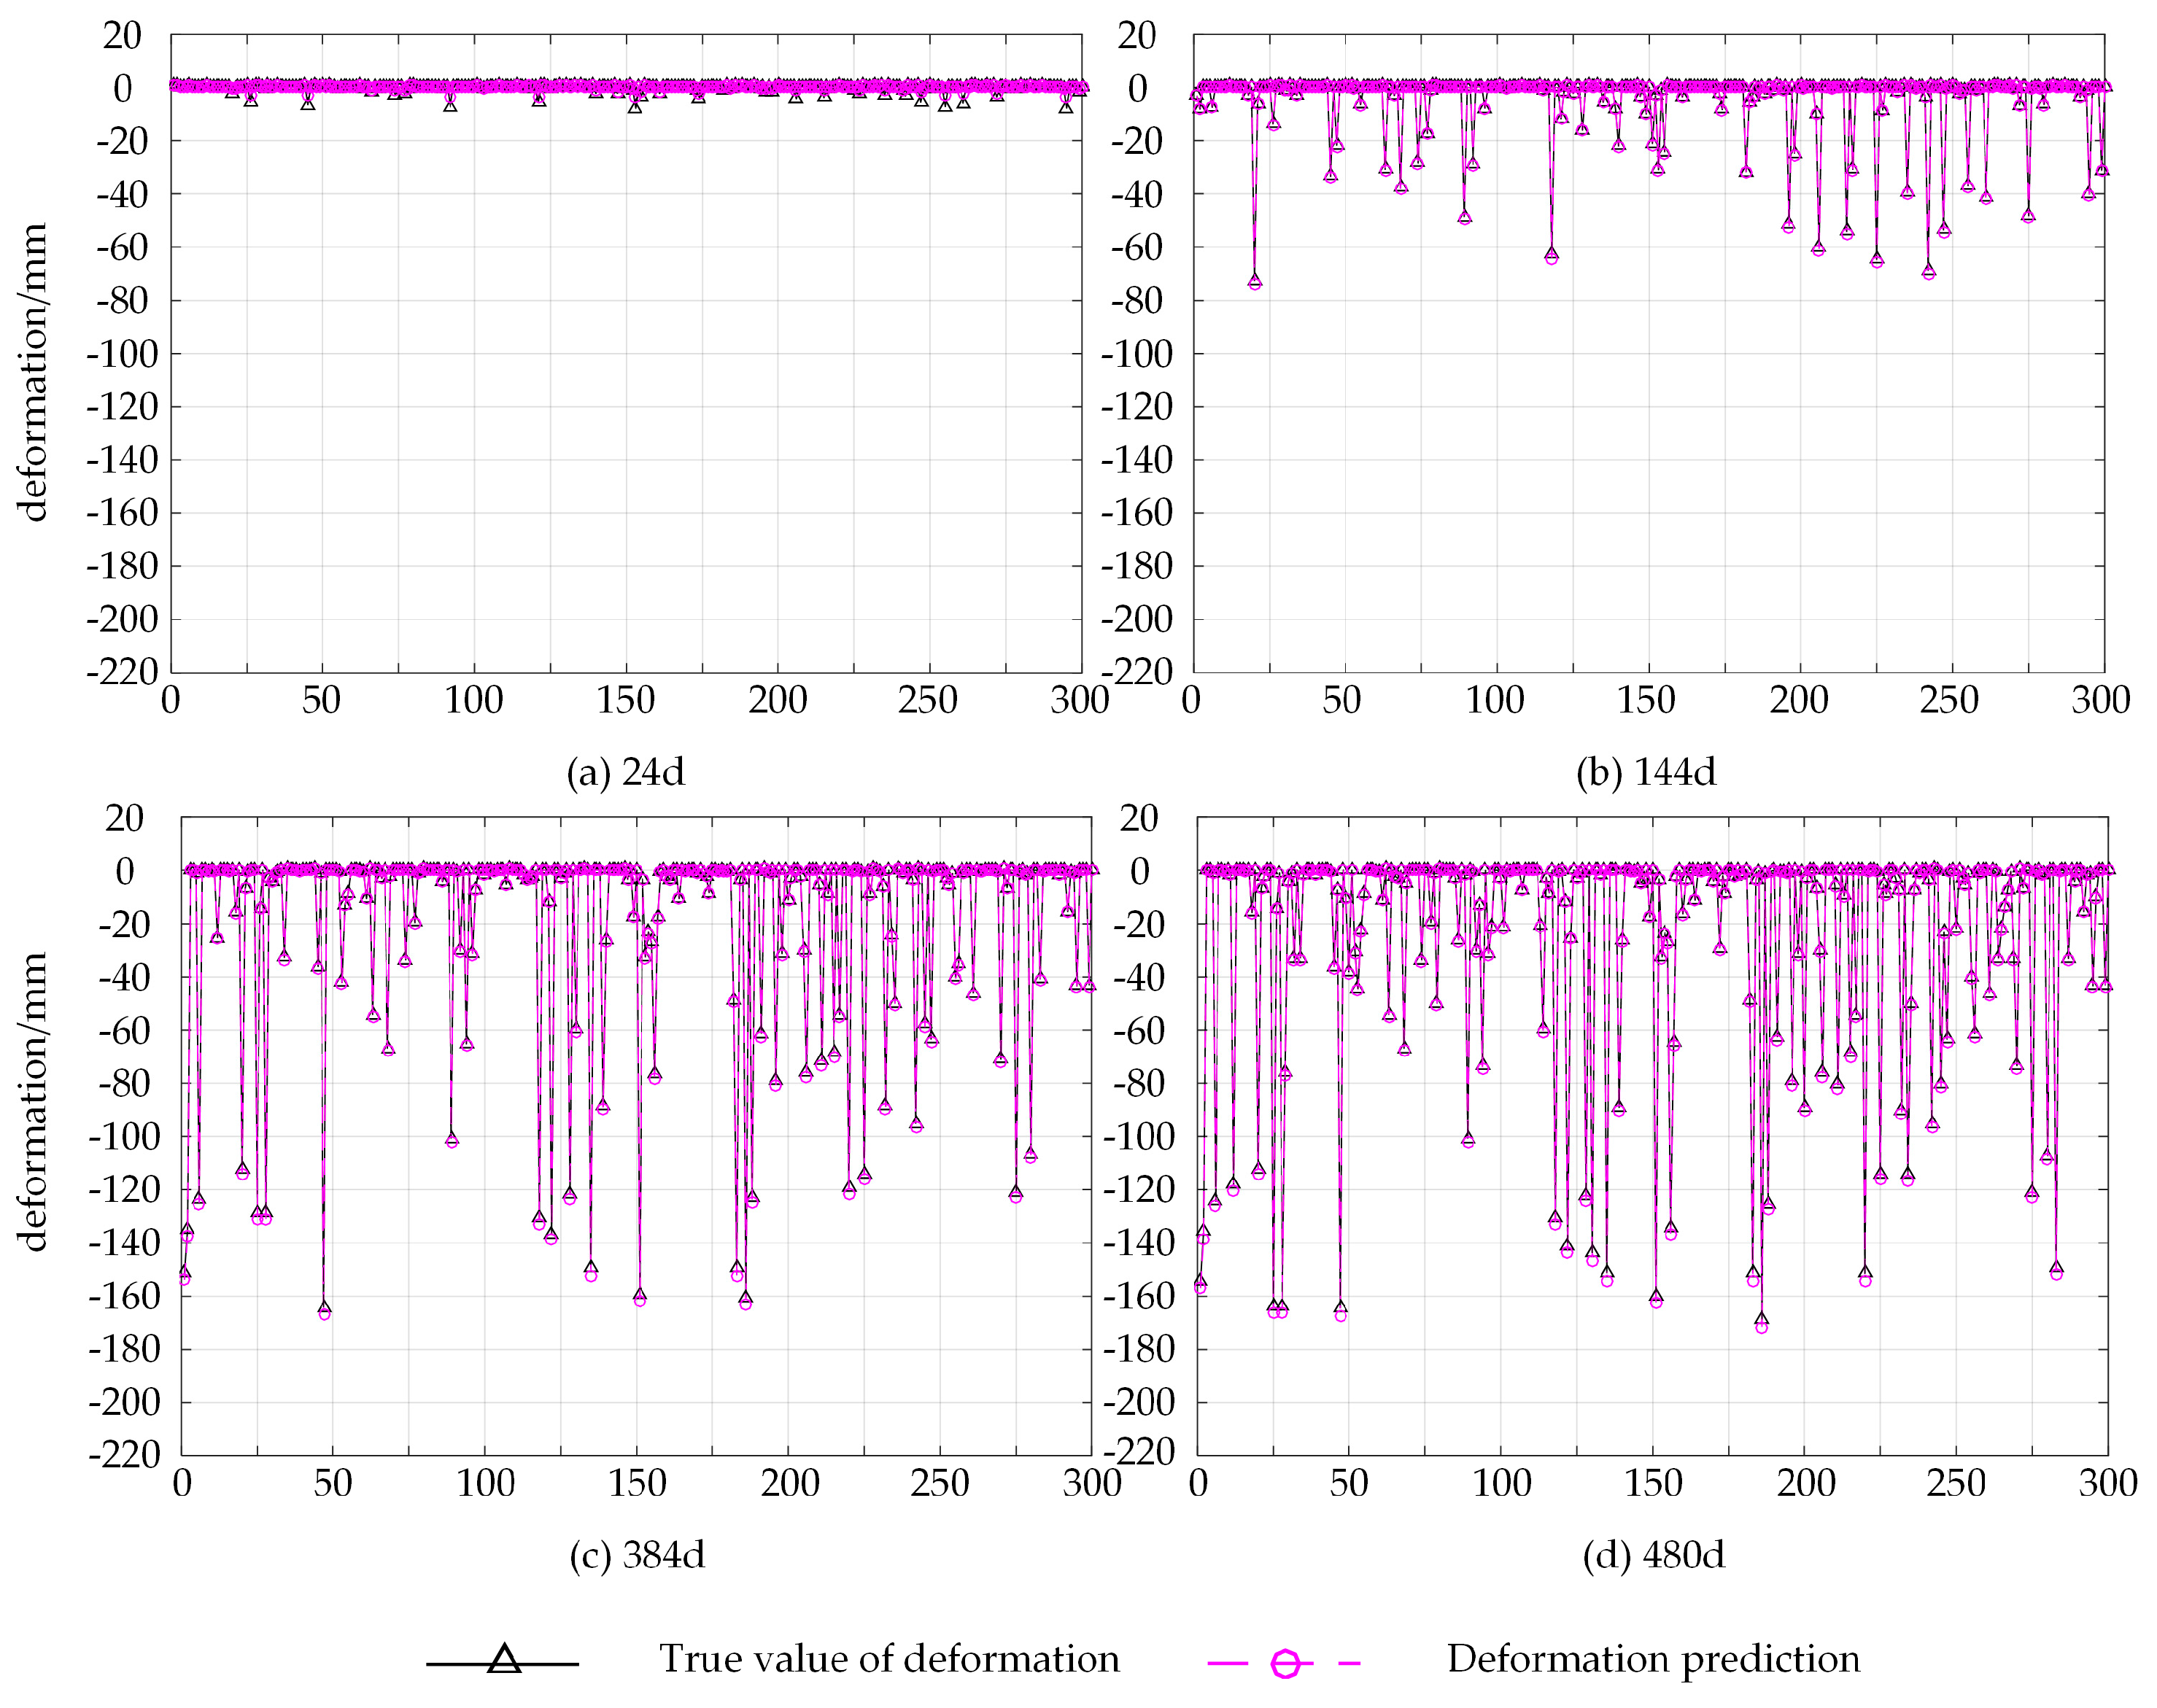
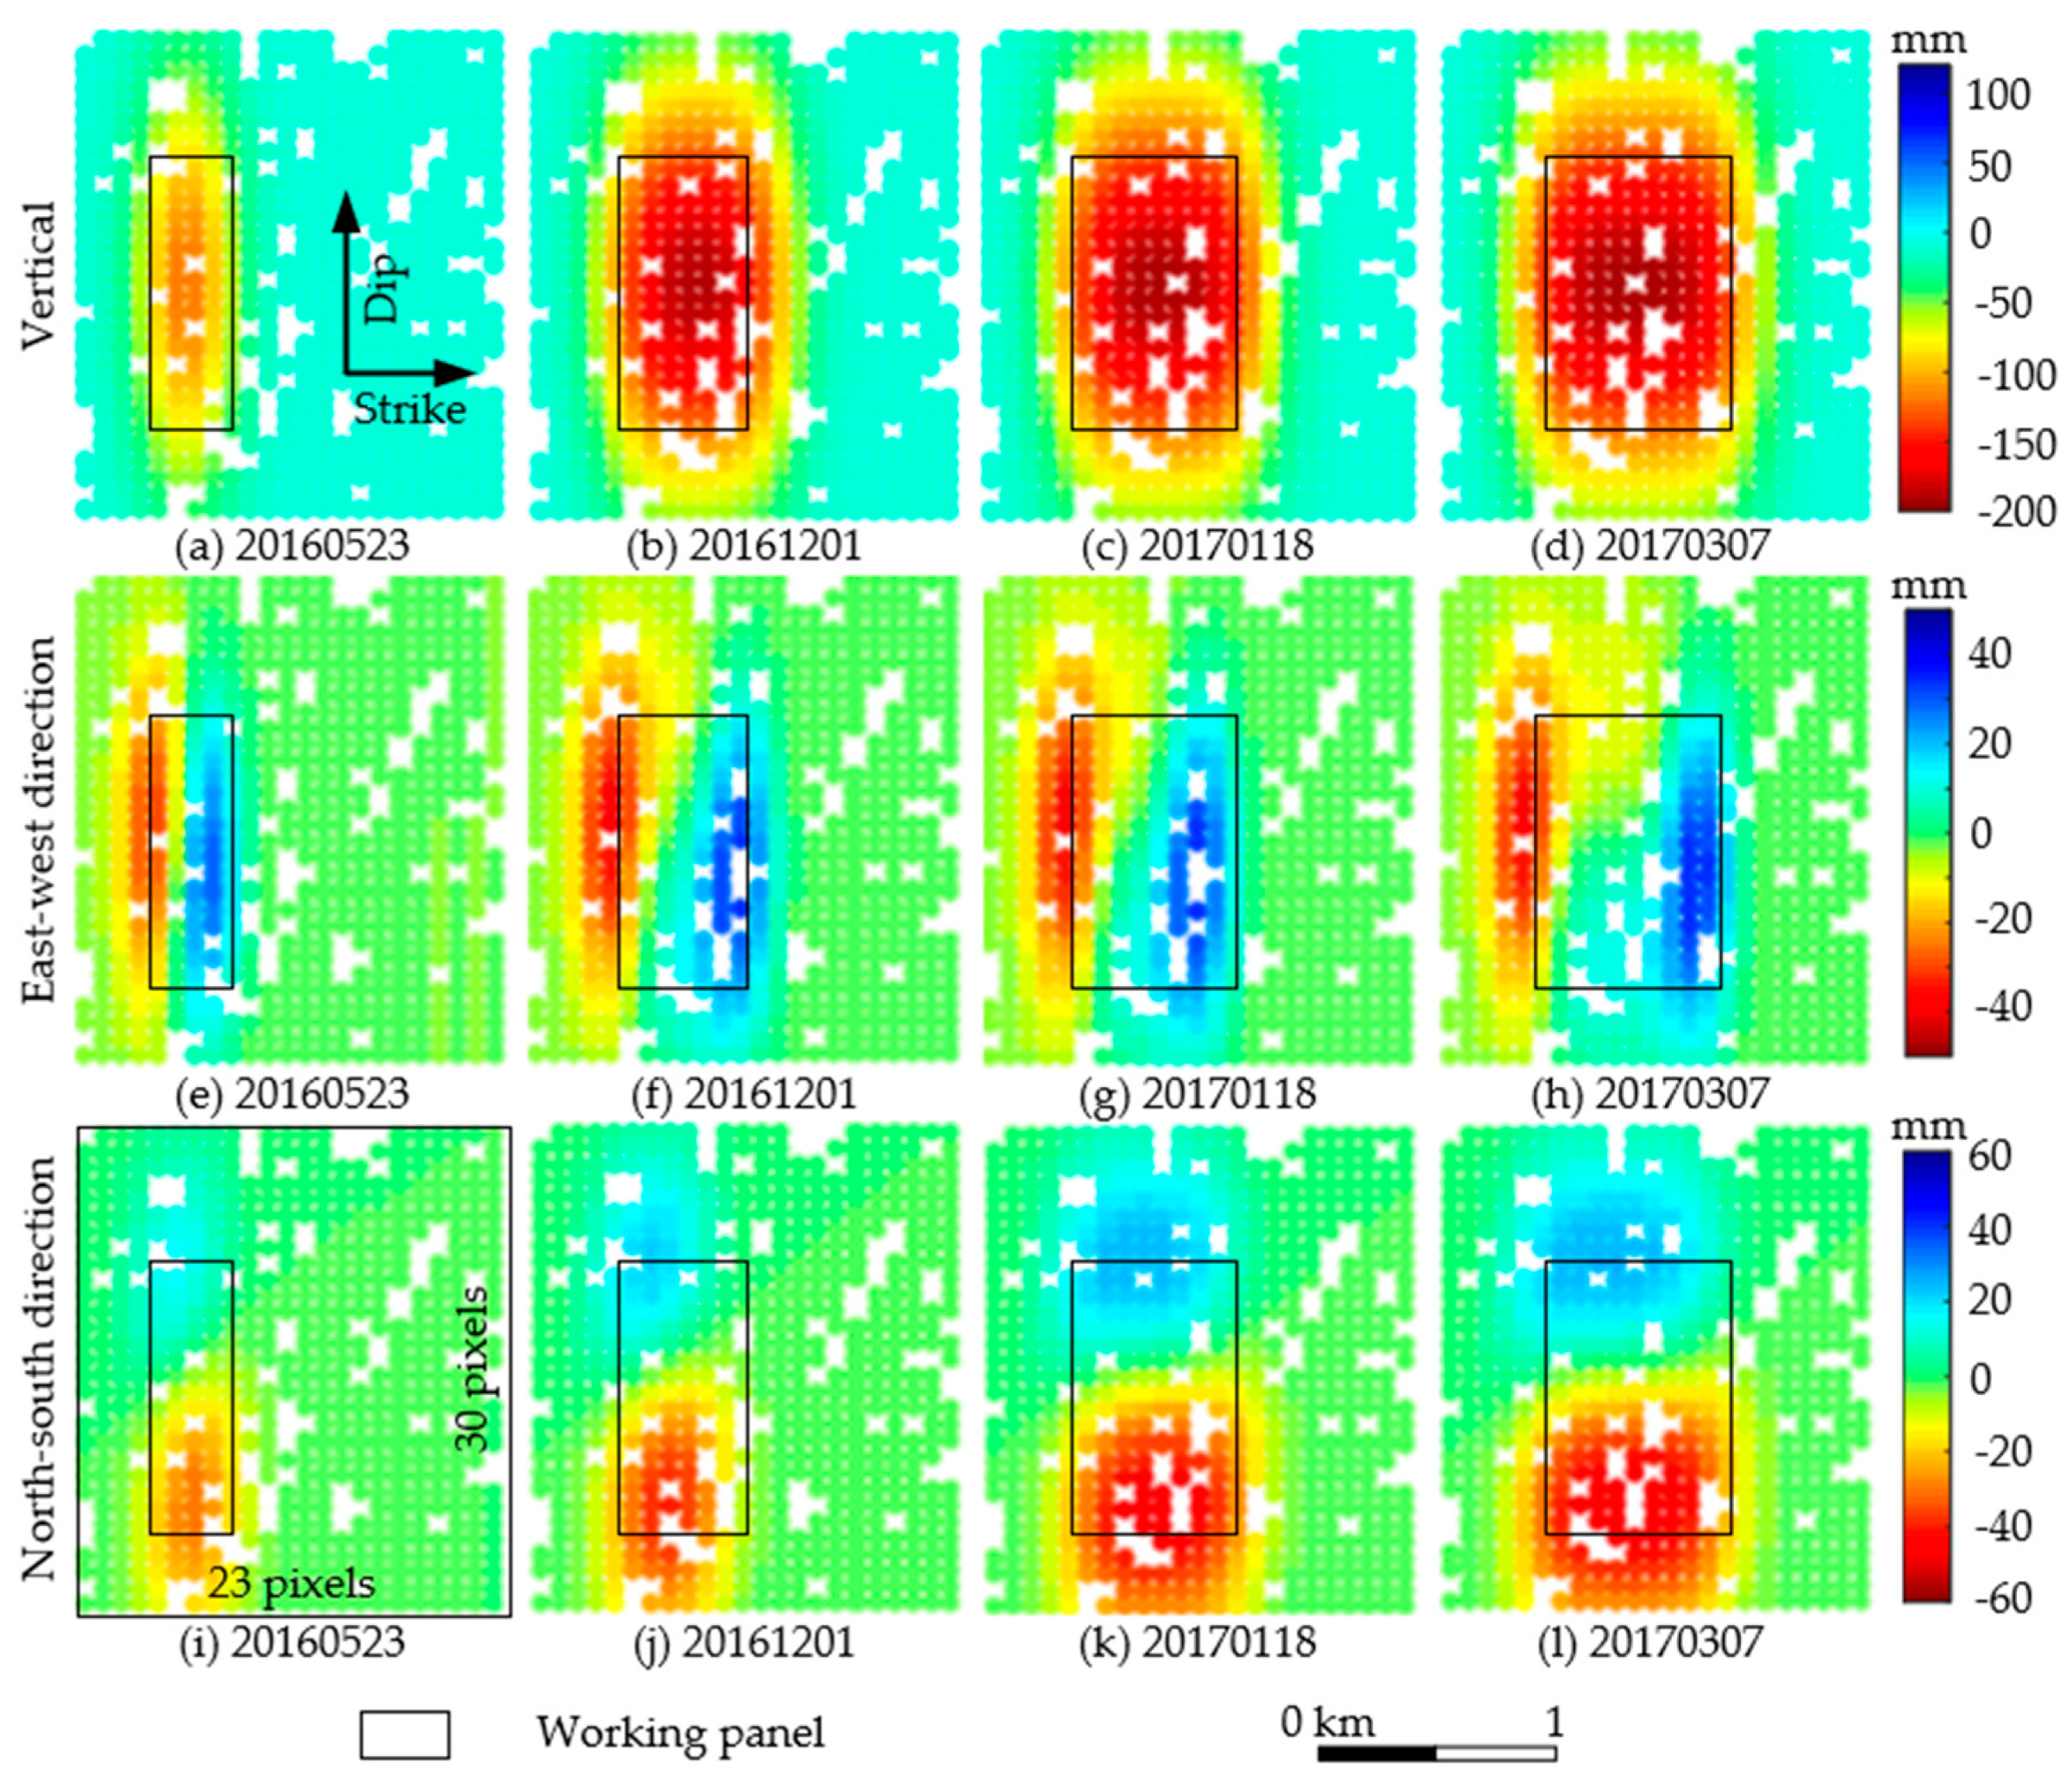
4.3. Analysis of 3D-CTPIM Deformation Prediction Results

According to the method described in Section 2.1, high-coherence points from 12 periods of time-series deformation monitoring results from 13 November 2015 to 19 November 2016 for the same settling funnel in the red rectangular box were used as the observations data to solve the InSAR-3D-CTPIM prediction parameters, and the results were q = 0.74, d = 0.43, tanβ = 1.08, θ 0 = 81.57 ° , S1 = 15.68 m, S2 = 16.82 m, n = 0.21, and c = 7.36; after obtaining the unknown parameters of the InSAR-3D-CTPIM model, the vertical, east–west and north–south deformation of the mine can be predicted according to Equations (4) and (5), respectively. Figure 9 shows the four-phase 3D time-series deformation prediction results on 23 May, 1 December 2016, 18 January, 7 March 2017, respectively (the prediction area is shown in the red rectangular box in Figure 8). It can be seen from Figure 9 that the cumulative deformation of the area shows a gradual increase over time to stabilization, which is in line with the mining deformation evolution law of the mine; the maximum displacements in the vertical direction, east–west direction and north–south direction are 181 mm, 46 mm and 40 mm, respectively. Figure 10a–d shows the InSAR deformation monitoring results for the periods of 1 December 2016, 18 January, 23 February, and 7 March 2017, and 300 high-coherence points are selected for comparing the deformation predicted by the InSAR-3D-CTPIM model with that monitored by SBAS-InSAR. The differences in the predicted deformation of the InSAR-3D-CTPIM model and the SBAS-InSAR monitoring results are compared, and the bars of the differences are shown in Figure 10e–h, which show that most of the differences in the deformation are centered at [−20, 20] mm, and that the predicted deformation is basically in agreement with that of the InSAR monitoring results.

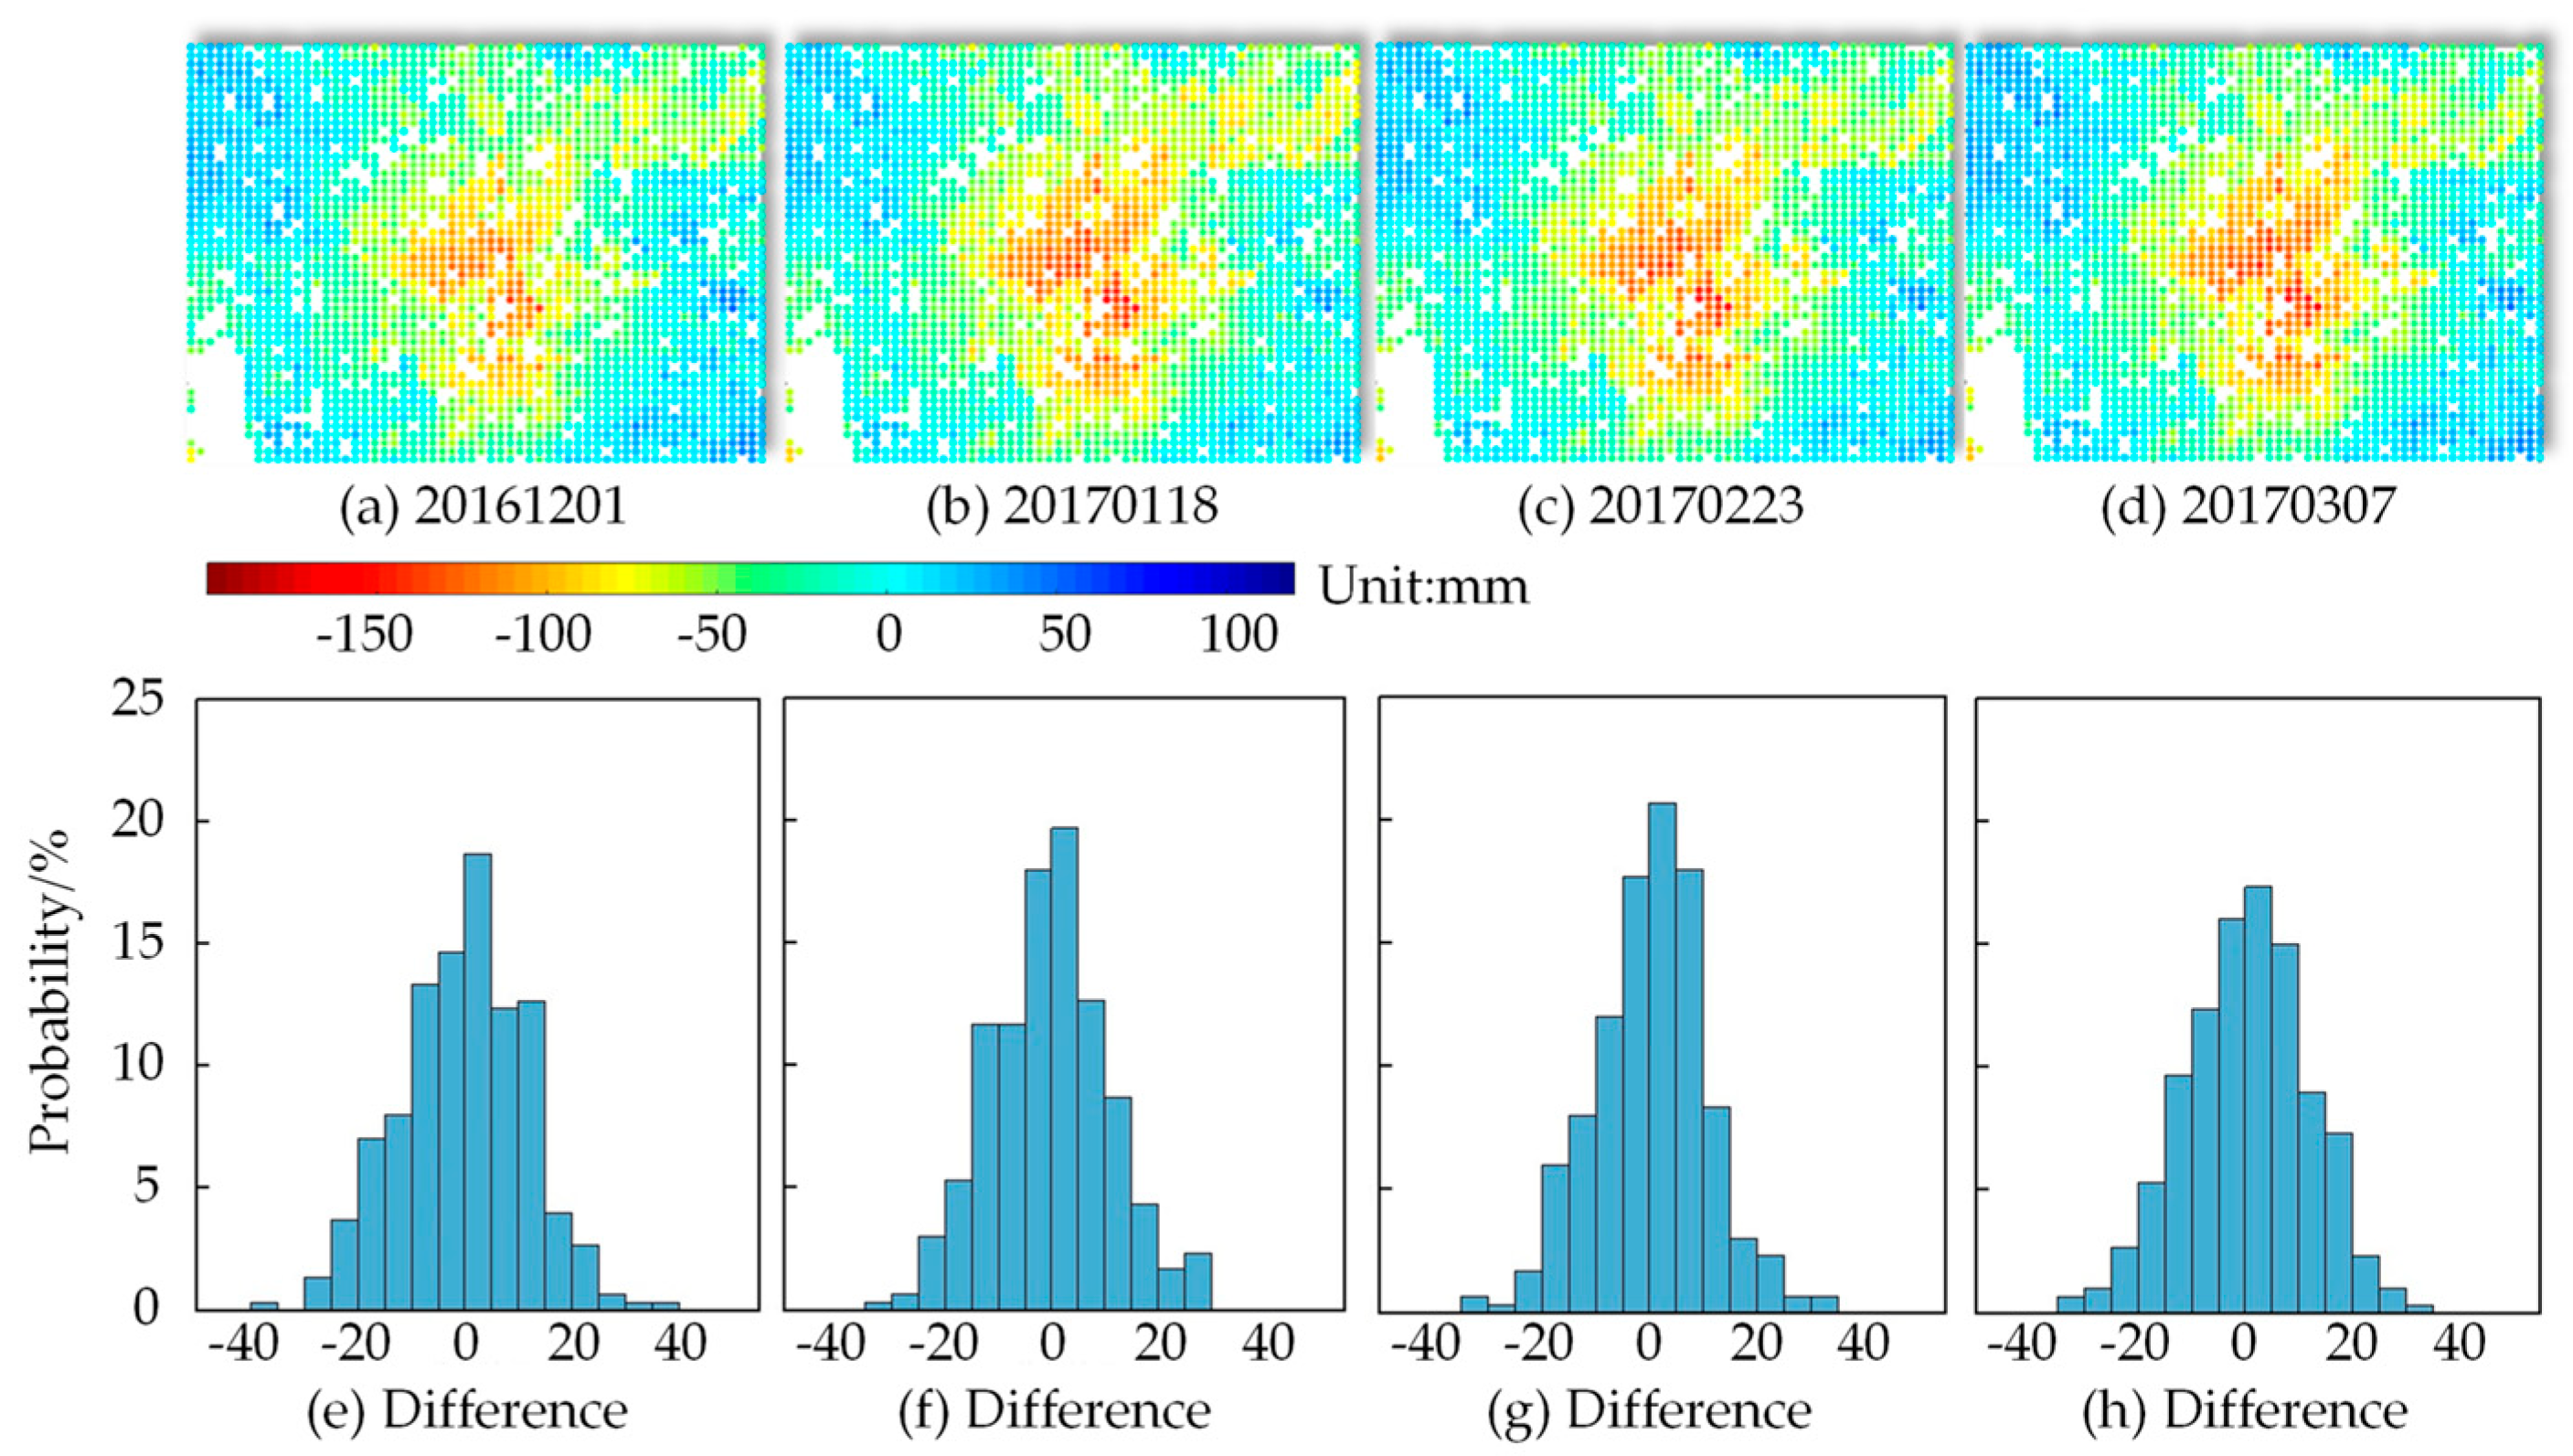
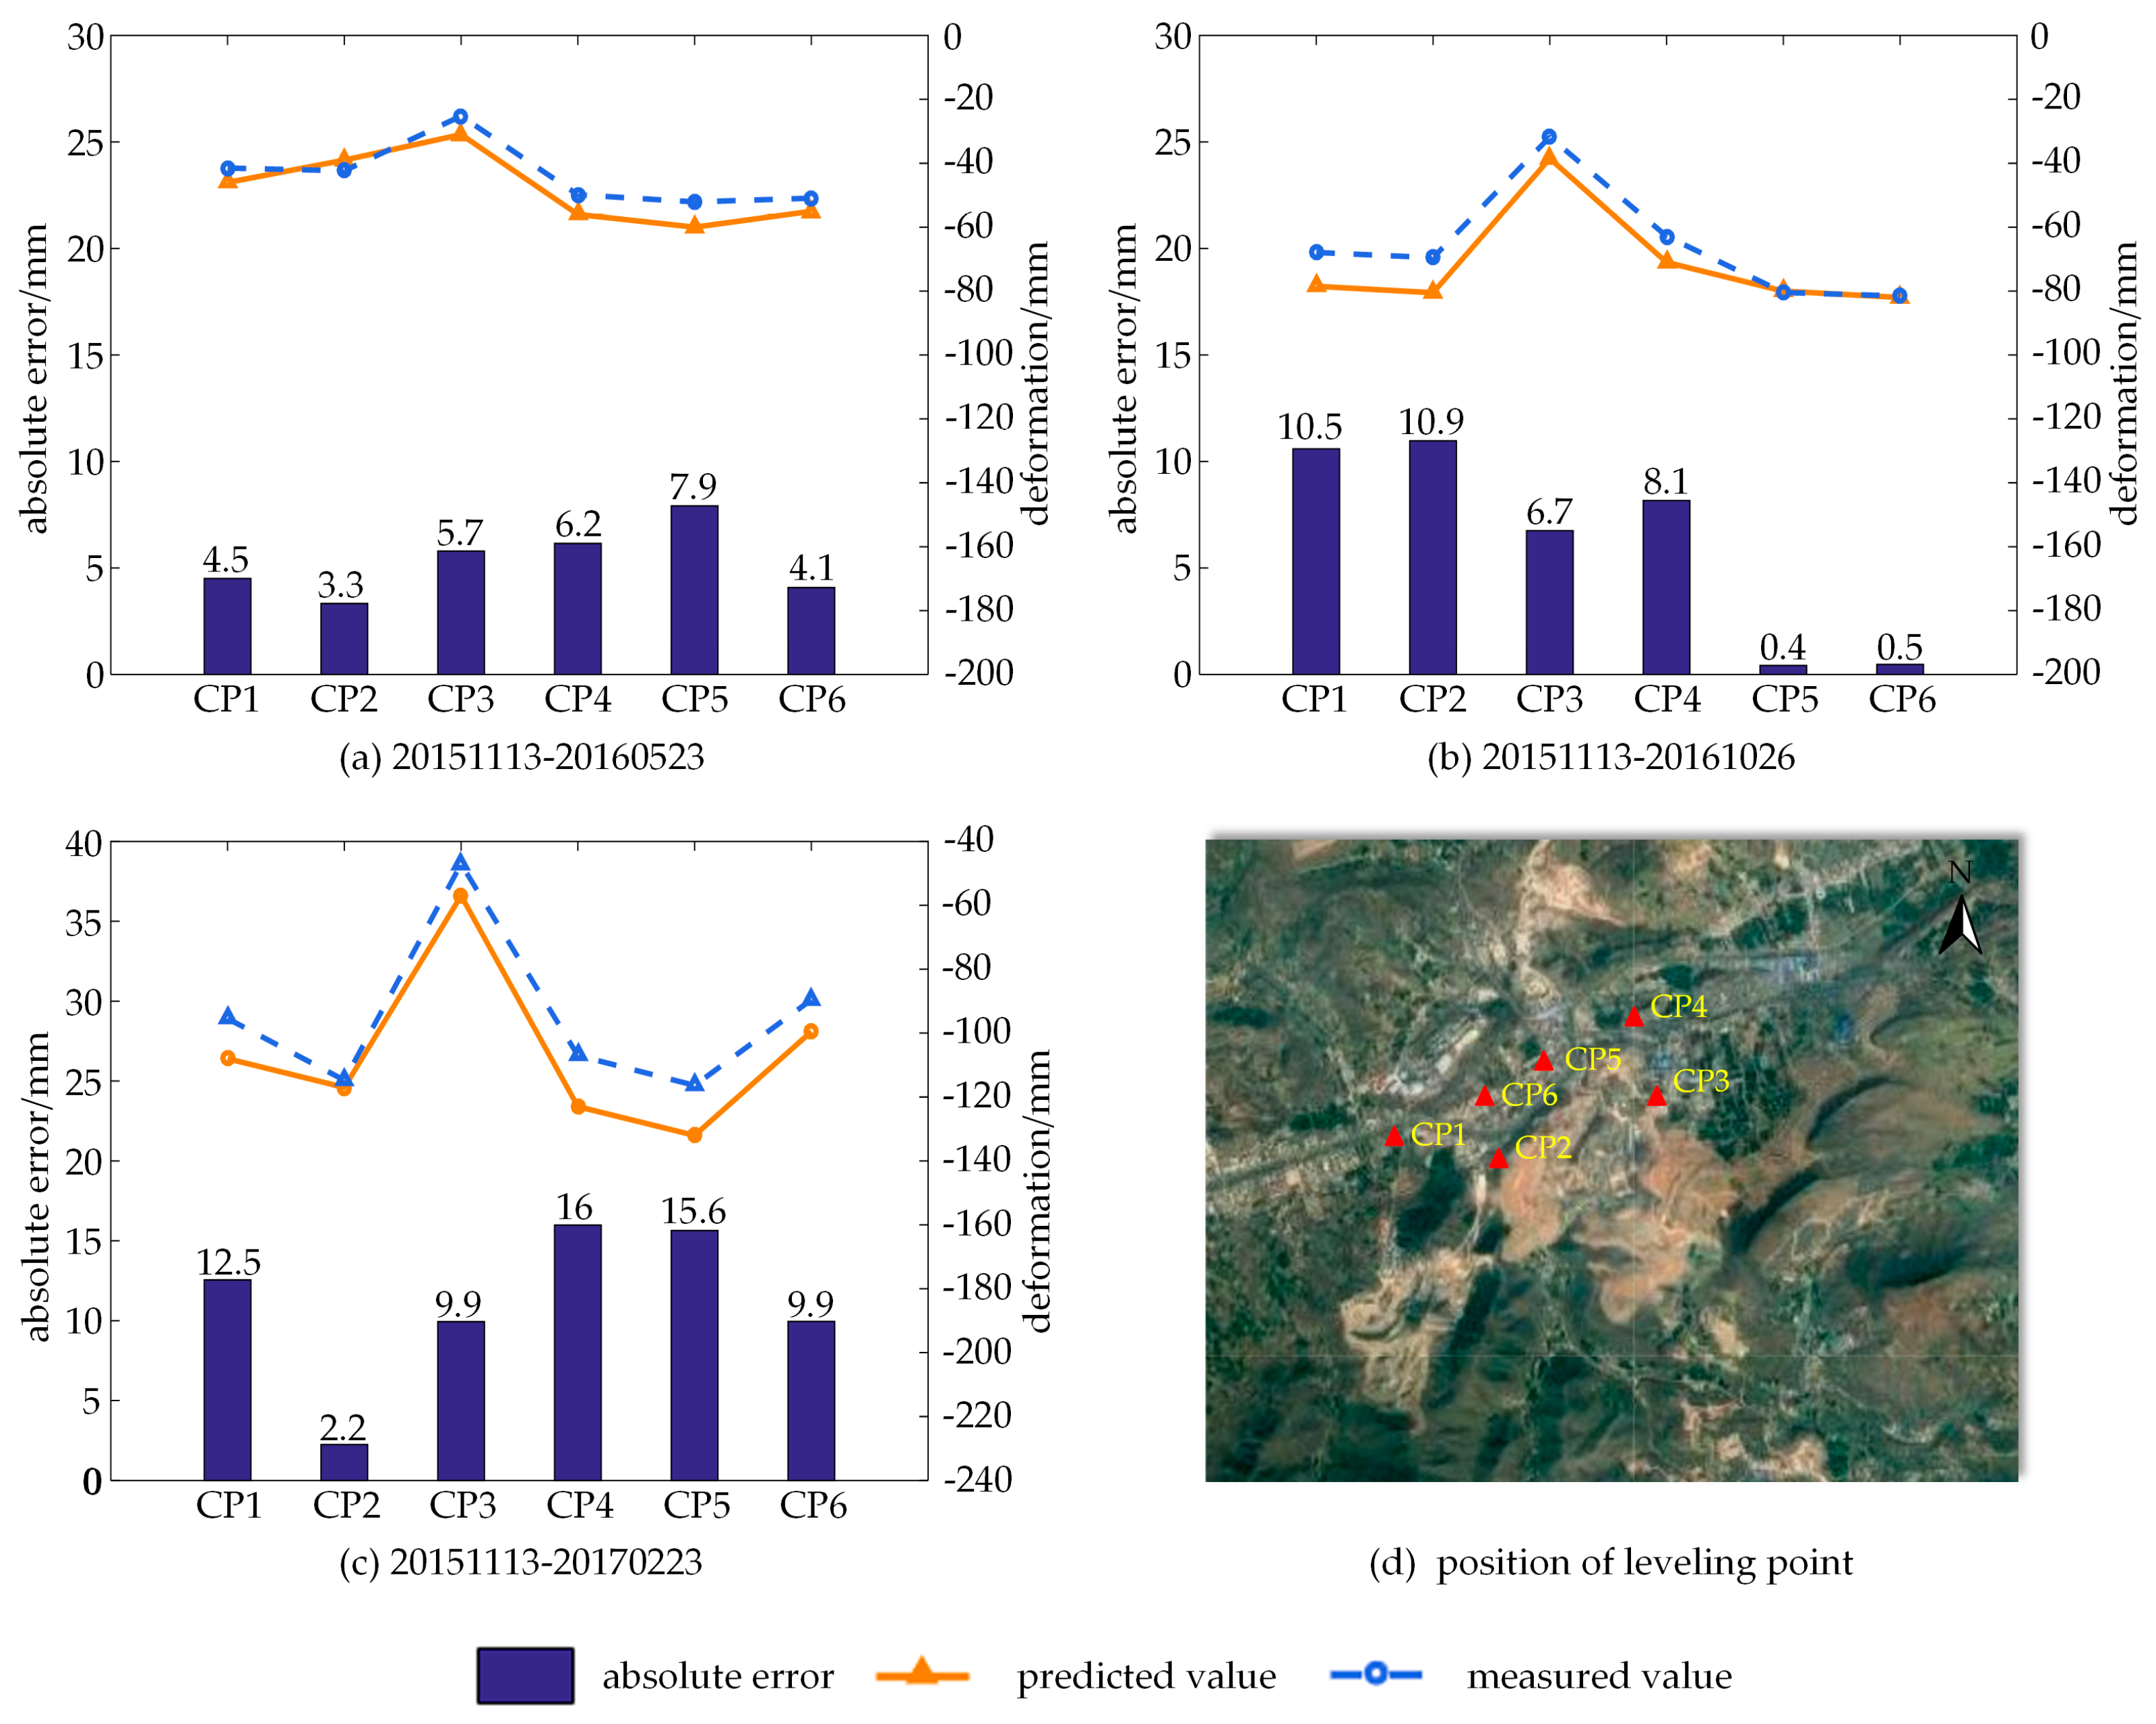
5. Accuracy Validation

5.1. Deformation Monitoring Accuracy

To verify the reliability of the predictions in this paper, external levelling data were collected in the study area; the actual implementation times of the leveling survey were 13 November 2015, 23 May 2016, 26 October 2016, and 23 February 2017, and the locations of the leveling points are shown as red triangles in Figure 11d [33]. The measured values were obtained by leveling and the accuracy met the requirements of fourth-order leveling. Figure 11a–c show the results of the comparison between the vertically oriented deformations predicted and back extrapolated by the InSAR-3D-CTPIM model for the periods of 13 November 2015 to 23 May 2016, 26 October 2016, and 23 February 2017, and the level measurements.
As can be seen from the line graphs and difference bar graphs in Figure 11, the vertical deformation results predicted by the InSAR-3D-CTPIM model are in good agreement with the leveling data. The RMSEs of the vertical deformation predicted by the InSAR-3D-CTPIM model and the leveling measurement results in these three periods were ±1.6 mm, ±4.3 mm, and ±4.5 mm, respectively, showing that the InSAR-3D-CTPIM model can reasonably predict the dynamic three-dimensional deformation of the mine surface.

5.2. Deformation Modeling Accuracy

According to the literature [34], the magnitude of the residual phase can be used as an effective indicator of the degree of fit between the InSAR modeling monitoring results and the real deformation, which in turn reflects the modeling accuracy of the model. When the residual phase in the interferometric pair is smaller, the modeling accuracy is higher. The residual phase can be calculated from the difference between the differential interferometric phase and the phase component of the low-pass deformation, as shown in Equation (18). Here, the residual phases of the InSAR-3D-CTPIM model constructed in this paper and the linear model in SBAS-InSAR were counted and compared, and Figure 11 shows the corresponding residual phase values in the interferograms obtained by the two methods. As can be seen from Figure 12, the residual phases of both models were less than 0.7 rad, and the residual phases of InSAR-3D-CTPIM were less than 0.5 rad. By counting the STD of the residual phases of the two models corresponding to the high-coherence points, it can be concluded that the RMSE of the traditional linear model was 0.13 rad and that of the STD of InSAR-3D-CTPIM was 0.08 rad. In comparison, the modeling accuracy of InSAR-3D-CTPIM was improved by 34.3% compared with that of the traditional linear model, which indicates that InSAR-3D-CTPIM has higher accuracy in modeling the deformation process of the coal mine.

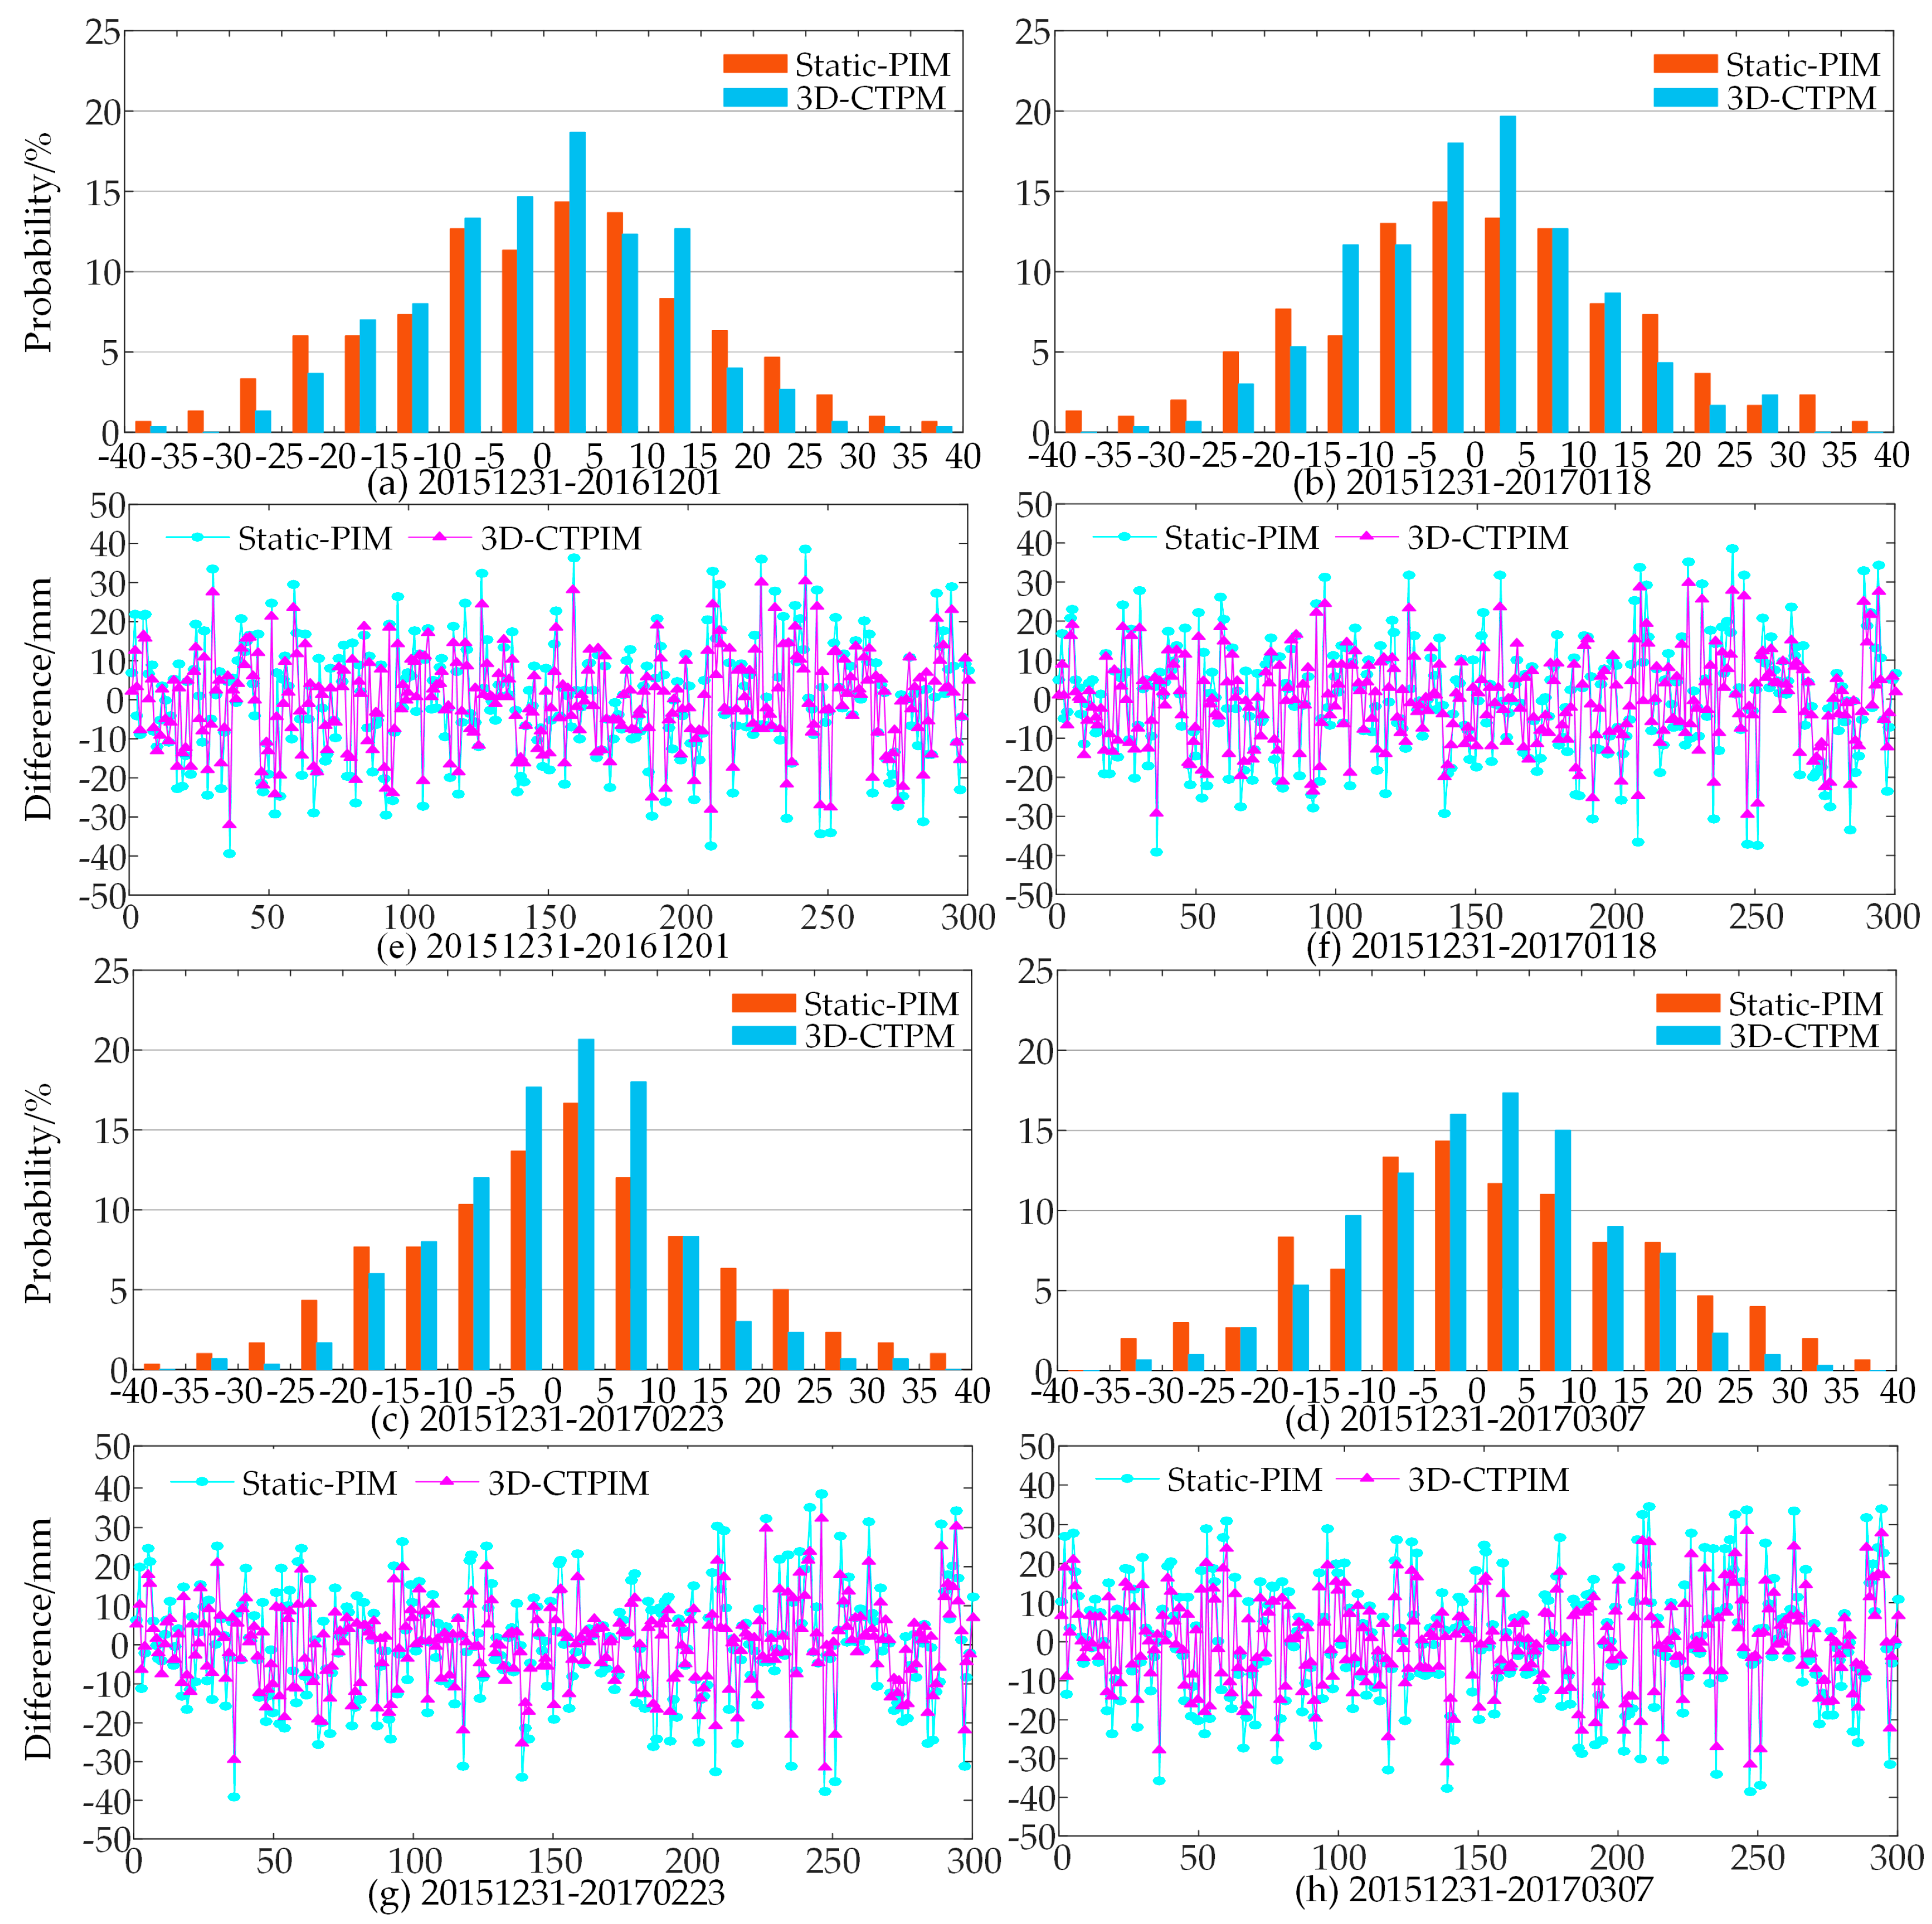
5.3. Comparison of Accuracy with Static PIM Prediction Methods

In order to verify the advantages of the InSAR-3D-CTPIM method proposed in this paper over the traditional methods, vertical deformation prediction experiments are carried out here using the method of the literature [18], and the results were compared with the results of the method in this paper, respectively, and a total of 300 high-coherence points were extracted for the deformation prediction results of the four periods (from 31 December 2015 to 1 December 2016, 18 January 2017, 23 February 2017, and 7 March 2017, respectively). Due to the small number of external level points, in order to comprehensively analyze the comparison of the accuracy of the prediction results of the two methods, the SBAS-InSAR monitoring results were used as the real values, and compared with the deformation prediction results generated by the two methods, respectively, to measure the accuracy of the prediction results of the two methods. As shown in Figure 13e–h, the deviation distribution of InSAR-3D-CTPIM was more concentrated, and the deviation of the deformation prediction results was smaller than that of the static-PIM deformation prediction results in all four statistical periods; from the statistical data (e.g., Figure 13a–d), most of the deviation values of the deformation prediction results for InSAR-3D-CTPIM were distributed between [−20, 20] mm, while most of the deviation values of the deformation prediction results for Static-PIM were distributed between [−30, 30] mm. The total standard deviation (STD) of the InSAR-3D-CTPIM was calculated to be ±9.6 mm, while the total STD of Static-PIM was calculated to be ±13.4 mm. The total standard deviation of the deformation prediction results for the InSAR-3D-CTPIM model was calculated to be ±3.4 mm, and the total standard deviation of the InSAR-3D-CTPIM model was ±4.4 mm. The prediction accuracy of the CTPIM model deformation prediction results, compared to the traditional Static-PIM model deformation prediction results, increased by 28.5%, which indicates that InSAR-3D-CTPIM using the CT-PIM model more accurately reflects the mine in the vertical deformation time-sequence characteristics of the mine, the modeling accuracy is higher, and the vertical deformation prediction is more accurate.

6. Discussion and Analysis

6.1. Analysis of the Causes of Deformation

Based on the time series results shown in Figure 8 and the deformation prediction data in Figure 9, combined with the historical data of precipitation and climate change in Figure 14 [35], and the conclusions of previous studies, an in-depth causal analysis of the temporal and spatial distribution characteristics of the deformation in the study area was as follows:
(1)
Long-term coal mining activities in the Jiansheng coal mine area have formed obvious voids; due to the existence of these voids within the rock body, the overlying rock layer has deformed after being subjected to its own gravity and the role of the overlying rock layer. This deformation further affects the state of stress distribution in the surrounding rock mass [36]. When the mining activity reaches a certain level, the surface will show obvious signs of deformation, such as geological phenomena like collapses and cracks.
(2)
Considering that the Jiansheng coal mine is located on the southwest side of the Baisha Reservoir, and that the underground aquifers in the area of the Henan Jiansheng coal mine are relatively rich in water content, continuous coal mining activities have damaged the original geological stability, resulting in a gradual lowering of the groundwater level. As the groundwater level drops, the pressure on the rock and soil layers gradually increases. Particularly in the hydrophobic area, the increase in pressure has caused the overlying layers of rock and soil to subside, eventually triggering the phenomenon of land subsidence.
(3)
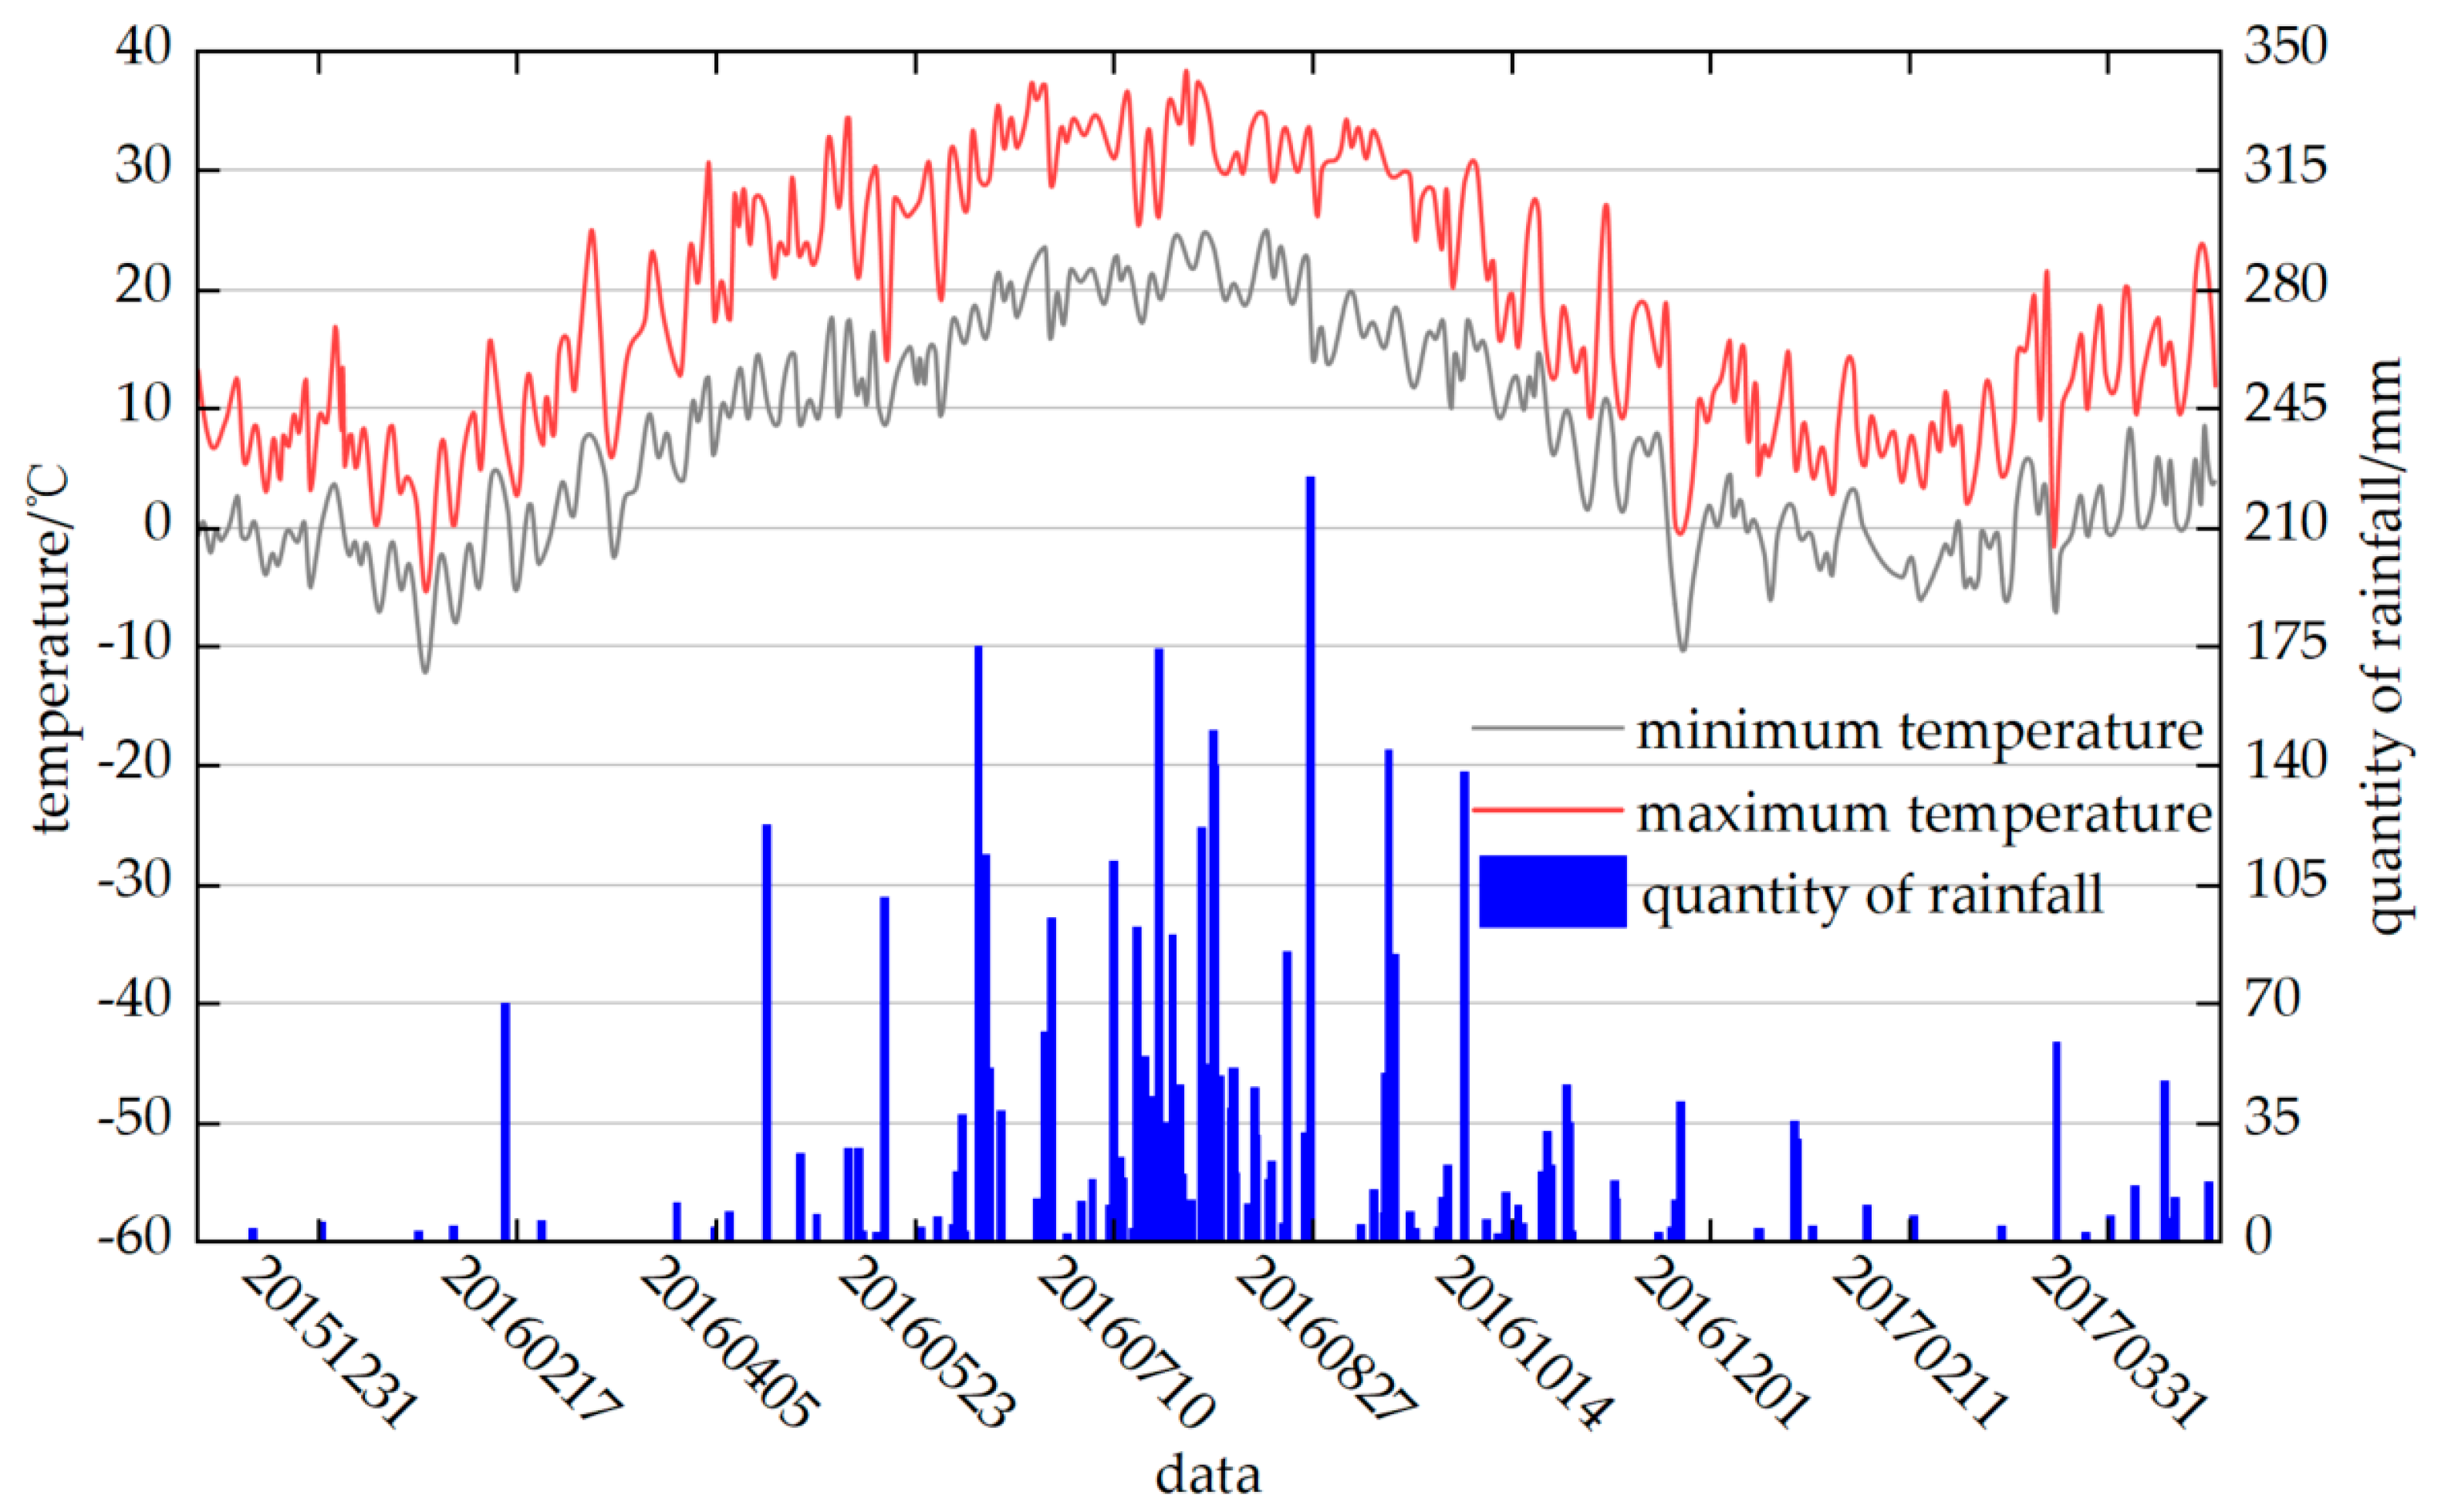
The study area is located at the northern end of the Qinling–Huaihe line in China, with a typical temperate monsoon climate. The climate is cold and dry in winter, and hot and rainy in summer. Especially during the hot and rainy season, the shallow aquifer is effectively recharged, which is the main reason for the small rise in the ground surface level between 2 October and 14 October 2016 [37].
(4)
During the annual Spring Festival, a large number of miners choose to return home due to the cold weather, resulting in a significant reduction in mining activity in the coal mines. The reduction in mining activity also effectively slows down the rate of deformation of the mine surface. This is also an important reason why the overall deformation of the mine surface remained relatively stable during the period from December 2015 to March 2016.

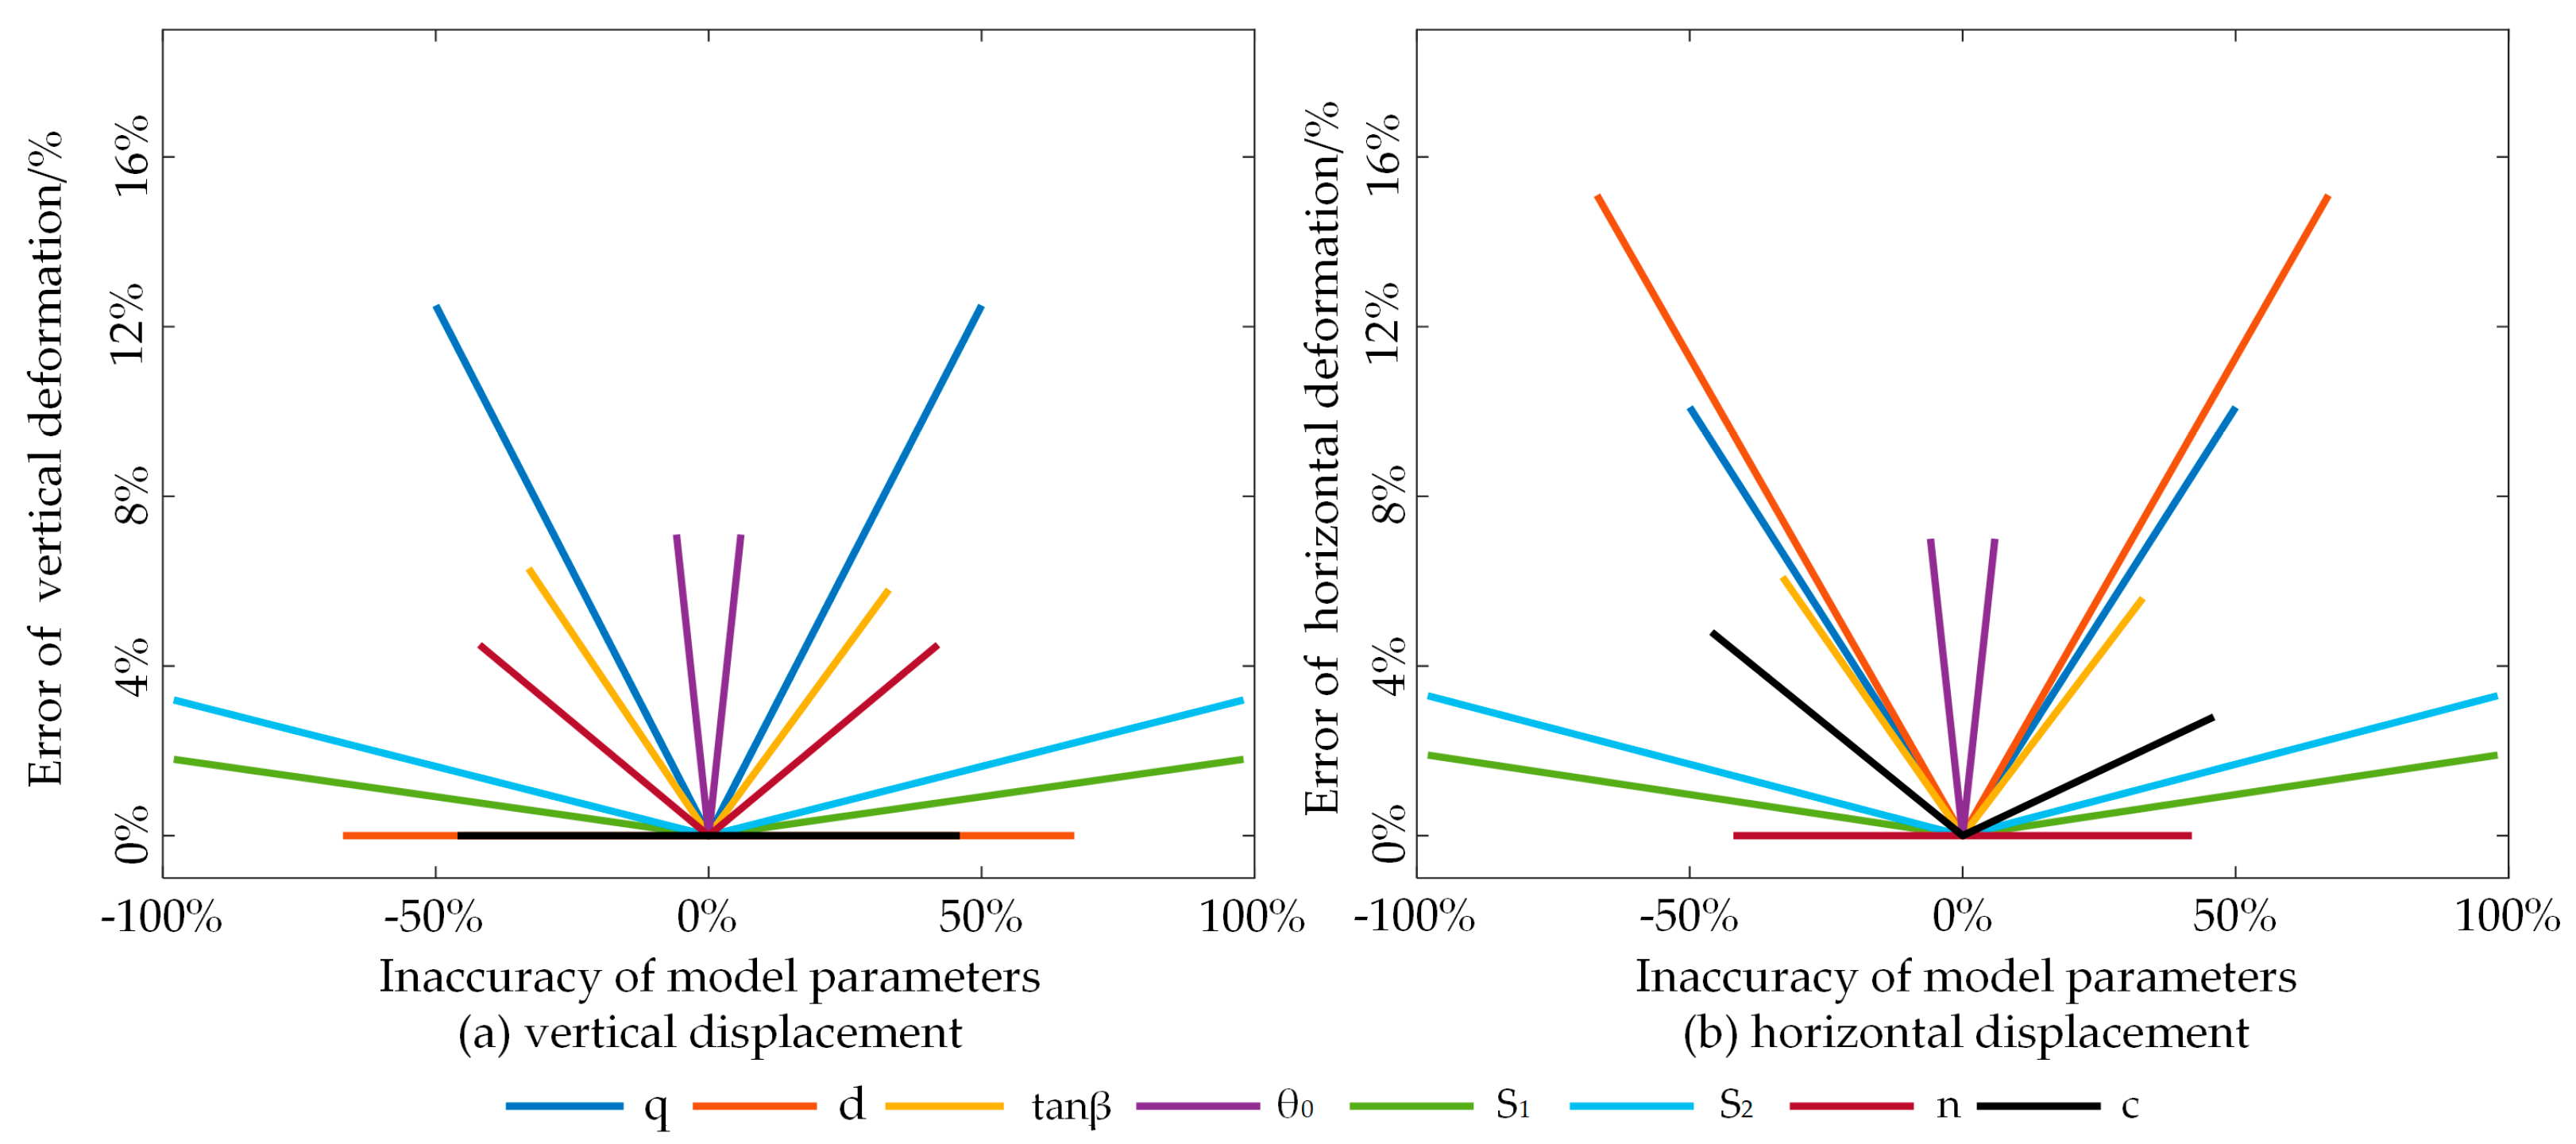
6.2. Sensitivity Analysis of Model Parameters

According to existing studies, the accuracy of deformation prediction depends to some extent on the estimation accuracy of model parameters, and sensitivity analysis refers to the uncertainty analysis of the degree of influence on the final results when the relevant influencing factors are changed. In this paper, it was used to study the change in the model parameters corresponding to the change in the size of the error of the deformation prediction results: i.e., for the more-sensitive parameters, even a small change in the parameter estimation value will lead to a large error in the deformation prediction results. Conversely, if the parameter is not sensitive, the parameter estimate will have a limited effect on the deformation prediction results [19]. Therefore, this paper investigated the influence of InSAR-3D-CTPIM model parameters on deformation prediction results using simulated data. Firstly, the simulated values of eight model parameters of a mining area were assumed, as shown in Table 4, and they were used as input data substituted into Equations (4) and (5) to obtain the vertical and horizontal deformation values as the initial values to carry out the experiments. Table 4 lists the range corresponding to the error of each parameter, and the parameter uncertainty of the model is defined according to the equation [ U P 2 U P 1 U P 1 100 % ].
Figure 15a,b show the errors in the vertical and horizontal deformations with respect to the corresponding maximum value of the simulated deformations due to variations in each model parameter, respectively. Taking the vertical deformation as an example, it can be defined as W / w 0 , where w0 is the maximum vertical settlement. As can be seen from Figure 15, for the prediction results of the vertical and horizontal deformation, the subsidence coefficient q, the tangent of the main influence angle tanβ and the propagation angle of mining influence θ0 are model parameters with higher sensitivity, in addition to the higher sensitivity of the parameter of the horizontal displacement constant d, which has a greater impact on the prediction results of the horizontal displacement. To summarize, the model parameters have a greater effect on the deformation and are mainly focused on q, tanβ, θ0 and d. Therefore, accurate estimation of the subsidence coefficient q, the main influence angle tangent tanβ, the mining influence propagation angle θ0 and the horizontal displacement constant d is the key to accurately predicting the three-dimensional deformation of the coal mine area.

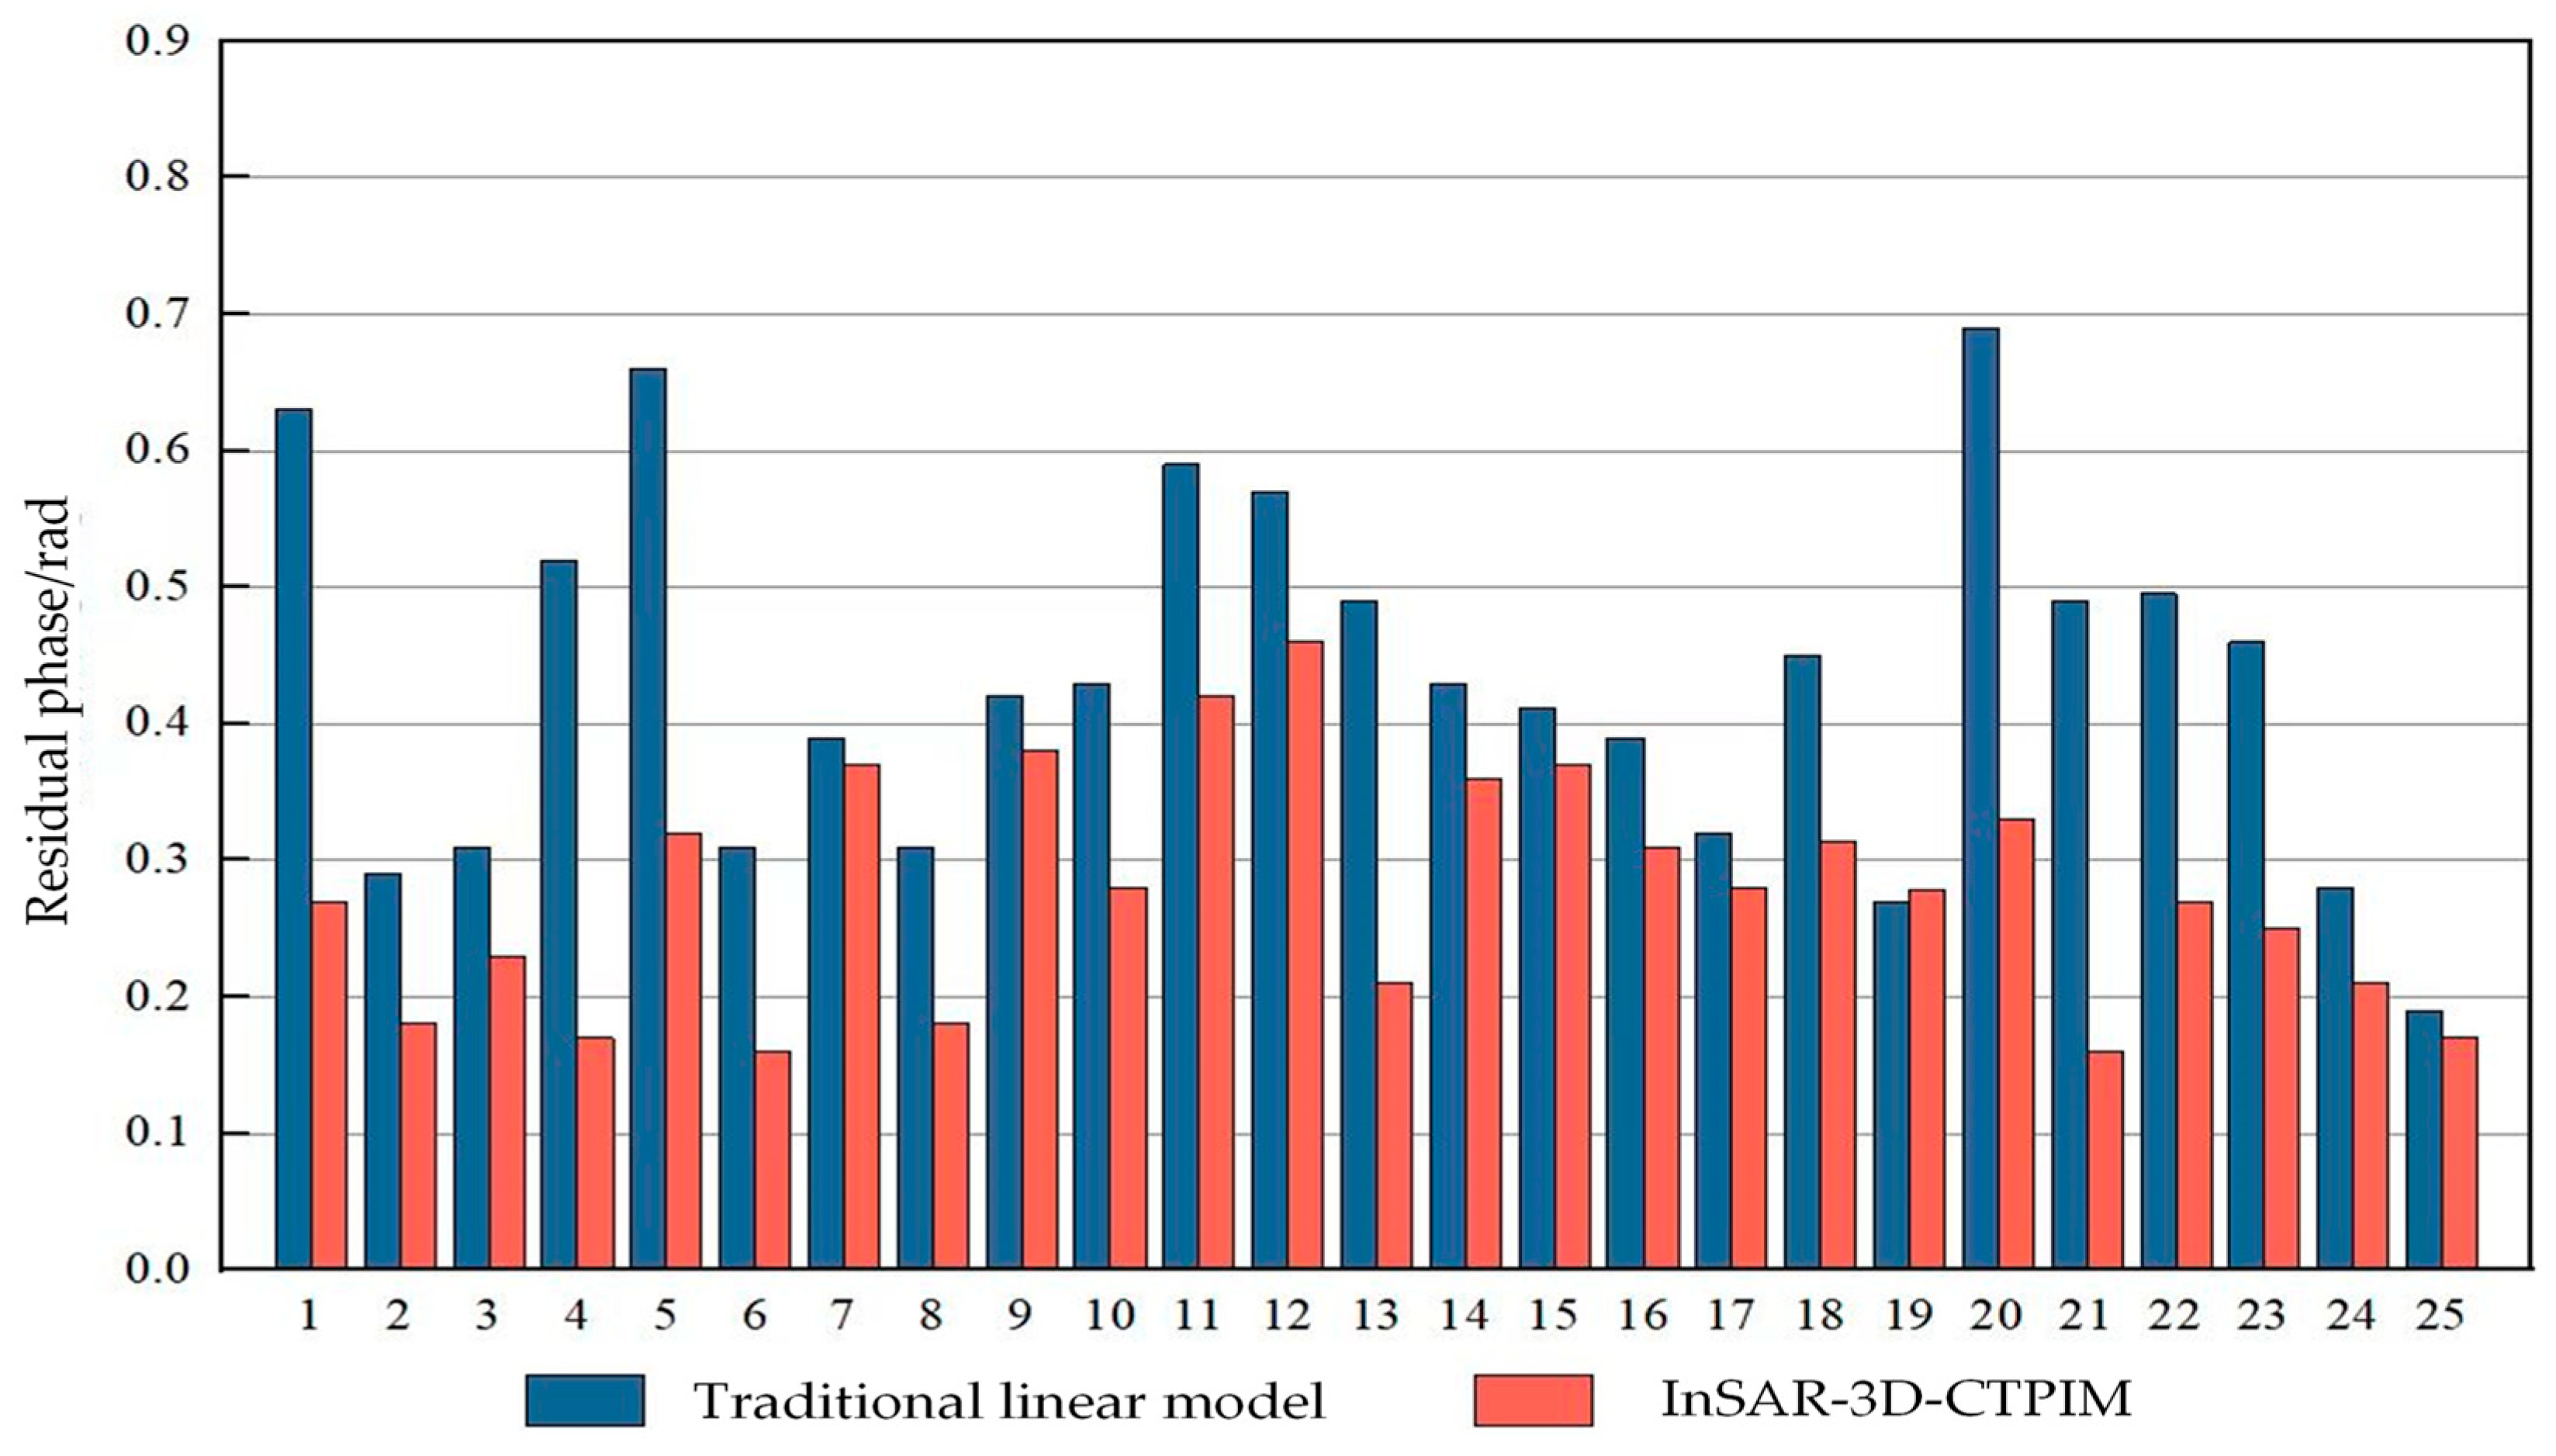
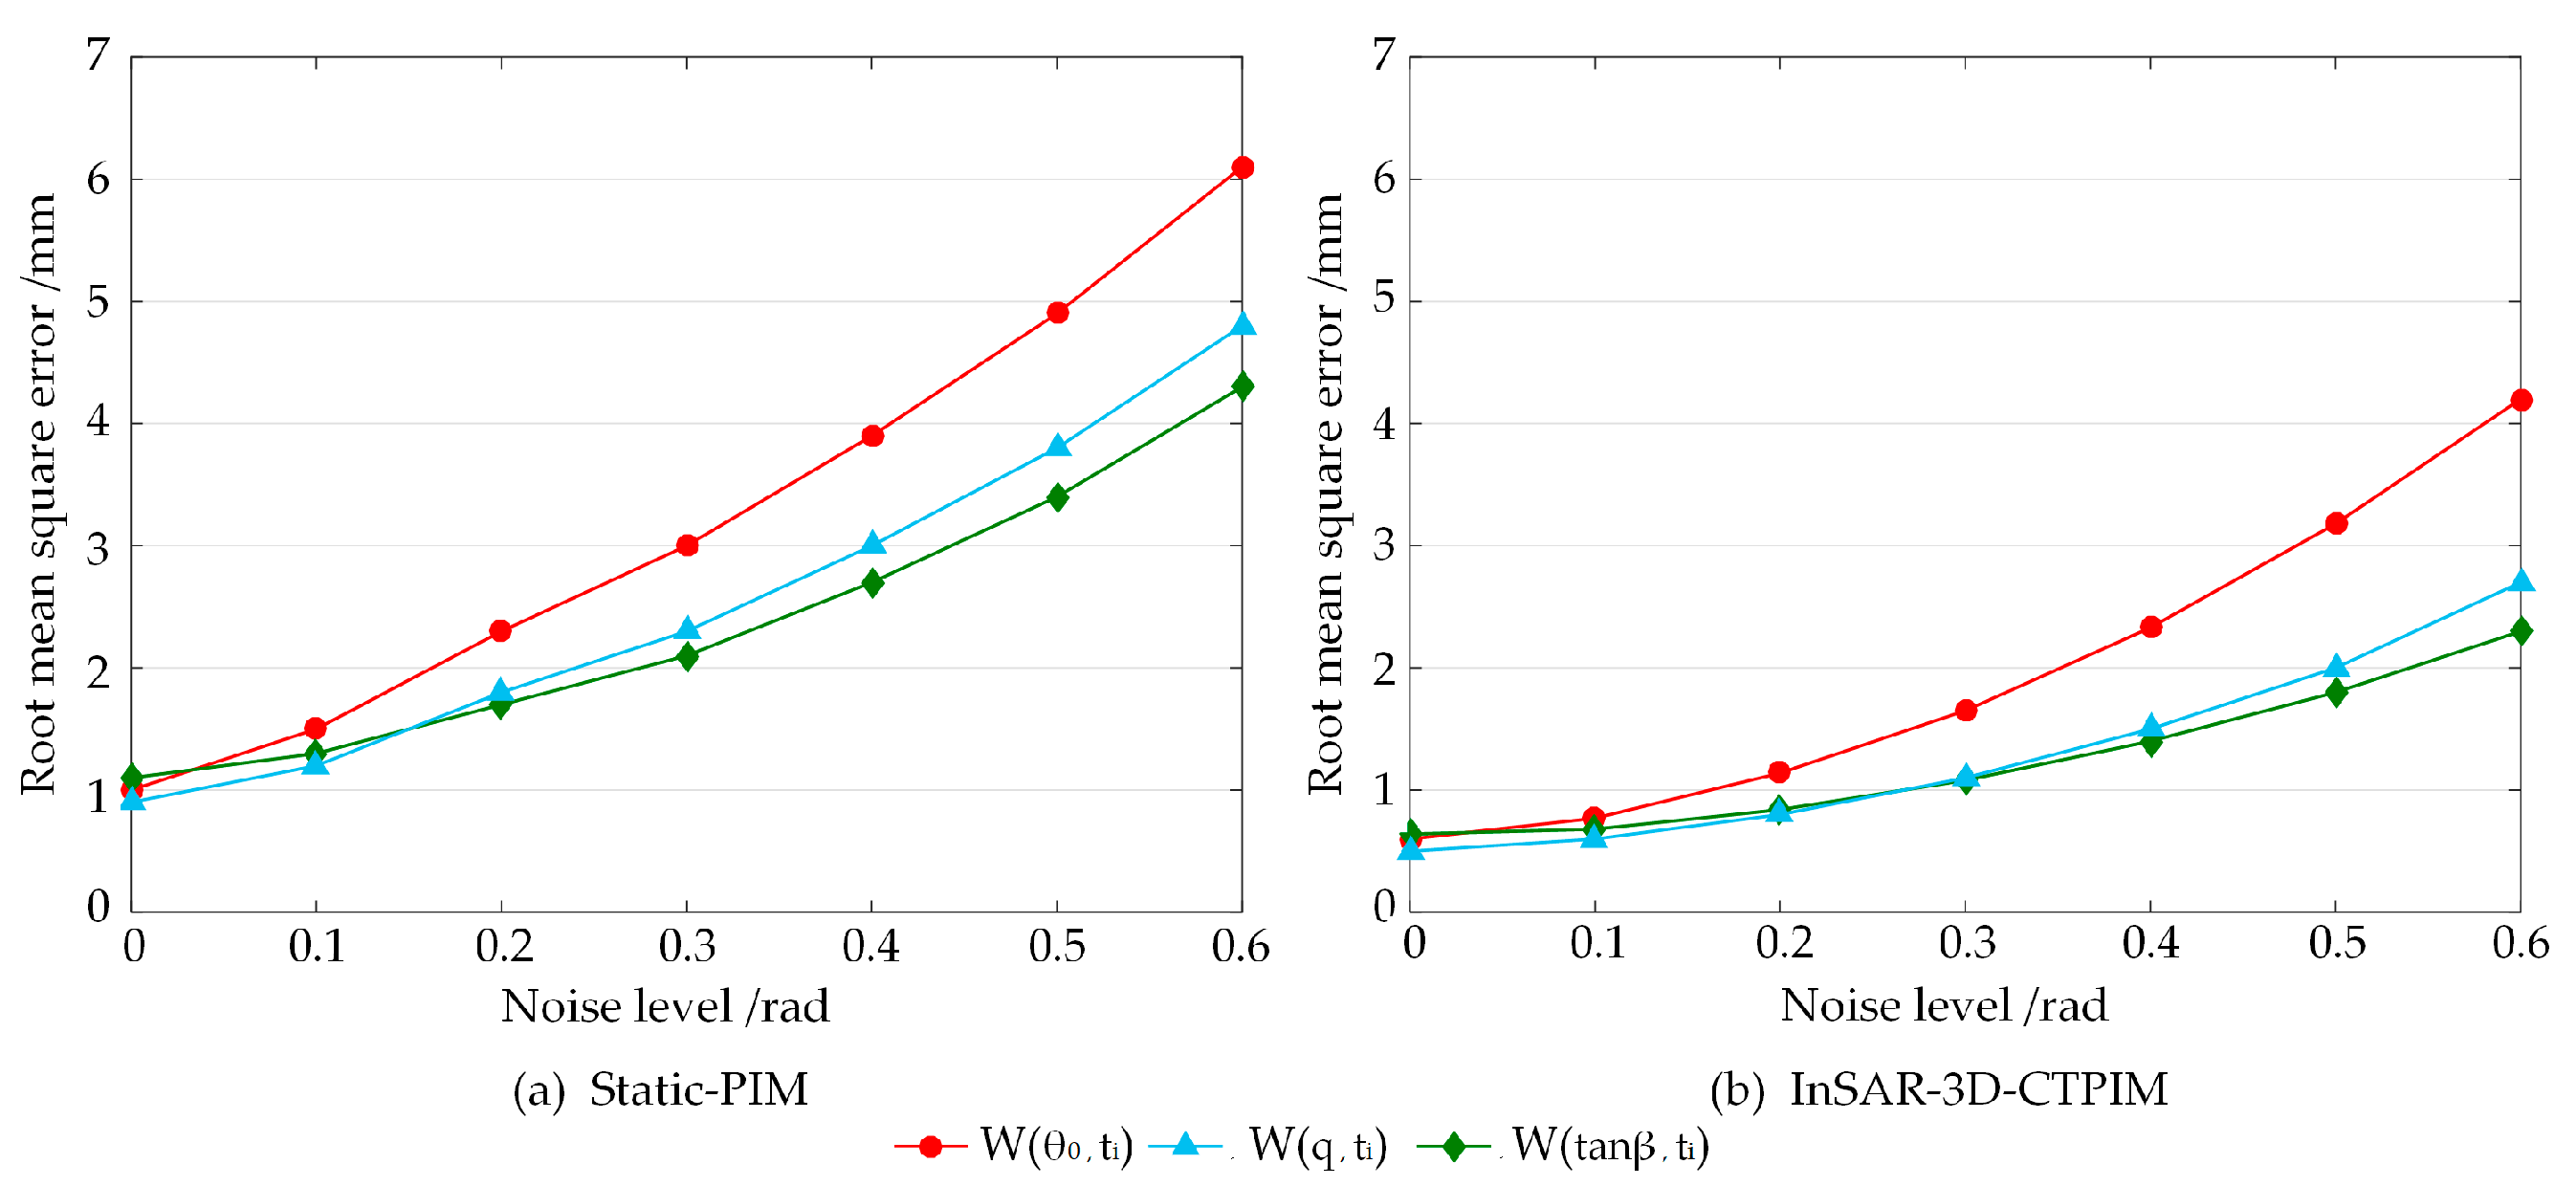
6.3. Effect of Phase Error on Deformation Prediction Results

Although a number of operations such as filtering, multi-viewing, deleveling, etc., have been performed on the SAR images, there is still unavoidable residual noise when the observed phase values are obtained by using the InSAR technique. In order to verify the influence of the differential interferometric phase error on the prediction results of the settlement deformation of the mining area, and to further analyze the error transfer characteristics of the method in this paper, two groups of error transfer simulation experiments were respectively carried out: (1) Using Equation (18) introduced in Section 2.3, noise phases with 0.1~0.6 rad intervals of 0.1 rad are added to the differential interferometric phases on the left side of the equal sign, and the GA-SM algorithm is used to solve for each set of model parameters with different errors added to the differential interferometric phases, and the corresponding vertical displacements are generated according to Equation (4) and analyzed; (2) Using the differential interference phases with different horizontal noise phases added to generate the corresponding time series deformation by using the SBAS method to generate the corresponding time series deformation results, and using the requested time series deformation results to solve the unknown parameters of the static PIM, and analyzing the corresponding generated vertical deformation prediction result errors. From the results of the parameter sensitivity analysis in Section 6.2, it can be seen that the subsidence coefficient q, the tangent of the main influence angle tanβ and the mining influence propagation angle θ0 are the parameters that have a greater influence on the vertical displacement. Therefore, the experiments were conducted to explore the effects of the initial errors of deformation on the deformation prediction results by adding different levels of noise phases. Figure 16a,b show the RMSE of the vertically oriented predicted deformations caused by q, tanβ, and θ0 errors obtained from the InSAR-3D-CTPIM model and static-PIM, respectively, under the influence of the noise phases at different levels. As can be seen from Figure 16, the deformation errors due to the parameters q, tanβ, and θ0 all increase gradually with the increase in the noise phase, where the total vertical prediction deformation errors of the InSAR-3D-CTPIM model are smaller than those of the static probability integral model. At the added noise phase of 0.6 rad, the RMSEs of the real and predicted deformations of the InSAR-3D-CTPIM model due to the errors of the unknown parameters are less than 4.2 mm, while the static-PIM leads to a maximum RMSE of 3.9 mm in the predicted deformation results with a small change (0.4 rad phase noise level), and a maximum RMSE error of 6.1 mm in the deformation prediction results with the effect of a 0.6 rad noise level, and all three parameter errors lead to a larger RMSE errors of deformation prediction than the InSAR-3D-CTPIM.
The experimental results show that compared with the traditional static PIM prediction method, the method in this paper directly uses the InSAR temporal differential interferometric phase to estimate the prediction model parameters, and then calculates the three-direction temporal deformation prediction results, which can effectively avoid the secondary transmission of error under the influence of the same phase error, and significantly improve the prediction accuracy of the deformation prediction.

7. Conclusions

In this paper, a three-dimensional time series deformation prediction method, InSAR-3D-CTPIM, based on InSAR differential interferometric phasing, was proposed and applied to the prediction of time series deformation on the surface of the Jiansheng coal mining area southwest of the Baisha Reservoir in Henan Province, China. A combination of simulation and real experiments was used to verify the reliability of the method. The results of the simulation experiment showed that the RMSE of the model was ±2.2 mm vertically upwards. In the real experiment, the InSAR-3D-CTPIM prediction parameters were solved using the 13-scene images during the period from 13 November 2015 to 19 November 2016 as the observation, and then the prediction model was used to obtain the prediction parameters of the mining area for the period from 1 December 2016 to 7 March 2017, in the vertical, east–west and north–south directions. The prediction results of vertical, east–west and north–south deformations were obtained for the period from 1 December 2016 to 7 March 2017, using the prediction model. The predicted results showed that the maximum subsidence in the vertical, east–west and north–south directions of the mine area reached 181 mm, 46 mm and 40 mm, respectively. The deformation of the mine area showed an overall non-linear subsidence trend in the time series, and the level data were consistent with the values predicted by the method used in this study.
Moreover, compared with the traditional linear model and the traditional static probability integral model prediction method, the modeling accuracy of this method was improved by 34.3%, and the deformation prediction accuracy was enhanced by 28.5%. Under the influence of the high noise of 0.6 rad, the RMSE of deformations caused by InSAR-3D-CTPIM was less than 4.2 mm, while the RSME caused by the traditional static PIM method was 6.1 mm, indicating that the method in this paper can effectively avoid the secondary transmission of errors and improve the deformation prediction accuracy. However, this method does not take into account the spatial correlation of the highly coherent points in the mining basin and the spatial correlation of different points in the InSAR-three-dimensional time series modeling.

Author Contributions

Conceptualization, M.L.; methodology, T.Z. and J.S.; software, M.L.; validation, J.Y. and T.Z.; formal analysis, M.L. and J.S.; investigation, M.L. and J.Y.; resources, M.L. and J.Y.; data curation, J.S.; writing—original draft preparation, M.L. and T Z; writing—review and editing, J.S.; visualization, T.Z.; supervision, J.S. and T.Z.; project administration, M.L.; funding acquisition, J.S. All authors have read and agreed to the published version of the manuscript.

Funding

This research was funded by the National Natural Science Foundation of China [grant numbers 42074033], the Provincial Natural Science Foundation of Hunan [grant numbers 2022JJ30589], Science and Technology Innovation Project of Hunan Provincial Department of Transportation (2022-11) [grant numbers 20230118CH], and Science and Technology Program Project of Hunan Provincial Department of Natural Resources [grant numbers kq2209011].

Institutional Review Board Statement

Not applicable.

Informed Consent Statement

Not applicable.

Data Availability Statement

Data are contained within the article.

Acknowledgments

Thanks to Guanfeng Zheng and Jingjian Long from Changsha University of Science & Technology for helping with data curation and visualization for this study.

Conflicts of Interest

Author Jing Yu was employed by the company Hunan Zhongkan Beidou Research Institute Co. The remaining authors declare that the research was conducted in the absence of any commercial or financial relationships that could be construed as a potential conflict of interest.

References

  1. Ministry of Natural Resources, PRC. China Mineral Resources Report; Geology Press: Beijing, China, 2023; pp. 2–6. [Google Scholar]
  2. Zhu, J.; Yang, Z.; Hu, J. Recent progress in retrieving and predicting mining induced 3D displacements using InSAR. Acta Geod. Cartogr. Sin. 2019, 48, 135–144. [Google Scholar] [CrossRef]
  3. Whittaker, B.; Reddish, D. Subsidence: Occurrence, Prediction and Control; Elsevier: Amsterdam, The Netherlands, 1989; pp. 51–82. [Google Scholar]
  4. Kratzsch, I. Mining subsidence engineering. Environ. Geol. Water Sci. 1986, 8, 133–136. [Google Scholar] [CrossRef]
  5. State Ministry of Coal Industry, PRC. Regulations on Coal Pillar Retention and Coal Pressure Mining in Buildings, Water Bodies, Railroads and Major Shafts; Coal Industry Press: Beijing, China, 2000; pp. 33–45. [Google Scholar]
  6. Li, Y.; Ren, Y.; Peng, S.S.; Cheng, H.; Wang, N.; Luo, J. Measurement of overburden failure zones in close-multiple coal seams mining. Int. J. Min. Sci. Technol. 2021, 31, 43–50. [Google Scholar] [CrossRef]
  7. Li, Z.; Xu, W.; Hu, J.; Feng, G.; Yang, Z.; Li, J.; Zhang, H.; Chen, Q.; Zhu, J.; Wang, Q.; et al. Partial geoscience parameters inversion from InSAR observation. Acta Geod. Cartogr. Sin. 2022, 51, 1458–1475. [Google Scholar]
  8. Chen, L.; Zhao, X. Recent advances of large gradient deformation monitoring in the mining area combined with InSAR. Bull. Surv. Mapp. 2018, 7, 18–23. [Google Scholar]
  9. Chen, R.; Wang, H.; Diao, X.; Zhang, B. Application of InSAR deformation monitoring in mining subsidence damage identification and stability evaluation. Bull. Surv. Mapp. 2023, 12, 106–111. [Google Scholar]
  10. Zhou, S.; Wang, H.; Shan, C.; Liu, H.; Li, Y.; Li, G.; Yang, F.; Kang, H.; Xie, G. Dynamic Monitoring and Analysis of Mining Land Subsidence in Multiple Coal Seams in the Ehuobulake Coal Mine Based on FLAC3D and SBAS-InSAR Technology. Appl. Sci. 2023, 13, 8804. [Google Scholar] [CrossRef]
  11. Li, D.; Deng, K.; Gao, X.; Niu, H. Monitoring and analysis of surface subsidence in mining area based on SBAS-InSAR. Geomat. Inf. Sci. Wuhan Univ. 2018, 43, 1531–1537. [Google Scholar]
  12. Schaefer, L.N.; Di Traglia, F.; Chaussard, E.; Lu, Z.; Nolesini, T.; Casagli, N. Monitoring volcano slope instability with synthetic aperture radar: A review and new data from Pacaya (Guatemala) and Stromboli (Italy) volcanoes. Earth-Sci. Rev. 2019, 192, 236–257. [Google Scholar] [CrossRef]
  13. He, P.; Wen, Y.; Xu, C.; Chen, Y. Complete Three-dimensional Near-field surface displacements from imaging geodesy techniques applied to the 2016 Kumamoto Earthquake. Remote Sens. Environ. 2019, 232, 111321. [Google Scholar] [CrossRef]
  14. Fan, H.D.; Cheng, D.; Deng, K.Z.; Chen, B.Q.; Zhu, C.G. Subsidence monitoring using D-InSAR and probability integral prediction modelling in deep mining areas. Surv. Rev. 2015, 47, 438–455. [Google Scholar] [CrossRef]
  15. Plattner, C.; Wdowinski, S.; Dixon, T.H.; Biggs, J. Surface subsidence induced by the Crandall Canyon Mine(Utah) collapse: InSAR observations and elasto-pastic modelling. Geophys. J. Int. 2010, 3, 1089–1096. [Google Scholar] [CrossRef]
  16. Zhang, T.; Xing, X.; Peng, W.; Zhu, J.; Liu, X.; Ge, J.; Lei, M. Time series InSAR deformation prediction for salt mining area based on coordinate-time function (CT-PIM)—A case study of Huaian Salt mine. Natl. Remote Sens. Bull. 2022, 1–16. [Google Scholar] [CrossRef]
  17. Zhu, G.; Shen, H.; Wang, L. Study of dynamic prediction function of surface movement and de-formation. Chin. J. Rock Mech. Eng. 2011, 30, 1889–1895. [Google Scholar]
  18. Yang, Z.F.; Li, Z.W.; Zhu, J.J.; Hu, J.; Wang, Y.J.; Chen, G.L. InSAR-based model parameter estimation of probability integral method and its application for predicting mining-induced horizontal and vertical displacements. IEEE Trans. Geosci. Remote Sens. 2016, 54, 4818–4832. [Google Scholar] [CrossRef]
  19. Yang, Z.; Li, Z.; Zhu, J.; Preusse, A.; Hu, J.; Feng, G.; Wang, Y.; Papst, M. An InSAR-based temporal probability integral method and its application for predicting mining-induced dynamic deformations and assessing progressive damage to surface buildings. IEEE J. Sel. Top. Appl. Earth Obs. Remote Sens. 2018, 11, 472–484. [Google Scholar] [CrossRef]
  20. Xing, X.; Zhu, Y.; Xu, W.; Peng, W.; Yuan, Z. Measuring subsidence over soft clay highways using a novel time-series InSAR deformation model with an emphasis on rheological properties and environmental factors (NREM). IEEE Trans. Geosci. Remote Sens. 2022, 60, 4601319. [Google Scholar] [CrossRef]
  21. Xing, X.; Zhang, T.; Chen, L.; Yang, Z.; Liu, X.; Peng, W.; Yuan, Z. InSAR modeling and deformation prediction for salt solution mining using a novel CT-PIM function. Remote Sens. 2022, 14, 842. [Google Scholar] [CrossRef]
  22. Berardino, P.; Fornaro, G.; Lanari, R.; Sansosti, E. A new algorithm for surface deformation monitoring based on small baseline differential SAR interferograms. IEEE Trans. Geosci. Remote Sens. 2002, 40, 2375–2383. [Google Scholar] [CrossRef]
  23. Furst, S.L.; Doucet, S.; Vernant, P.; Champollion, C.; Carme, J.-L. Monitoring surface deformation of deep salt mining in vauvert(france), combining InSAR and leveling data for multi-source inversion. Solid Earth. 2021, 12, 15–34. [Google Scholar] [CrossRef]
  24. Zheng, M.; Deng, K.; Fan, H.; Du, S. Monitoring and analysis of surface deformation in mining area based on InSAR and GRACE. Remote Sens. 2018, 10, 1392. [Google Scholar] [CrossRef]
  25. Chen, Y.; Tong, Y.; Tan, K. Coal mining deformation monitoring using SBAS-InSAR and offset tracking: A case study of Yu County, China. IEEE J. Sel. Top. Appl. Earth Obs. Remote Sens. 2020, 13, 6077–6087. [Google Scholar] [CrossRef]
  26. Fan, H. Monitoring and Solving Method of Synthetic Aperture Radar Interferometry for Surface Mining Subsidence in Mining Area. China Patent 103,091,676, 15 May 2013. [Google Scholar]
  27. Yang, Z.; Li, Z.; Zhu, J.; Yi, H.; Hu, J.; Feng, G. Deriving dynamic subsidence of coal mining areas using InSAR and logistic model. Remote Sens. 2017, 9, 125. [Google Scholar] [CrossRef]
  28. Liu, B.; Liao, G. Basic Law of Surface Movement of Coal Mine; Industry Press: Beijing, China, 1965; pp. 50–56. (In Chinese) [Google Scholar]
  29. Hooper, A.; Bekaert, D.; Spaans, K.; Arıkan, M. Recent advances in SAR interferometry time series analysis for measuring crustal deformation. Tectonophysics 2012, 514–517, 1–13. [Google Scholar] [CrossRef]
  30. Liu, X.; Xing, X.; Wen, D.; Chen, L.; Yuan, Z.; Liu, B.; Tan, J. Mining-induced time-series deformation investigation based on SBAS-InSAR technique: A case study of drilling water solution rock salt mine. Sensors 2019, 19, 5511–5527. [Google Scholar] [CrossRef] [PubMed]
  31. Zhu, M.; Yu, X.; Tan, H.; Xie, S.; Yang, X.; Han, Y. Prediction Parameters for Mining Subsidence Based on Interferometric Synthetic Aperture Radar and Unmanned Aerial Vehicle Collaborative Monitoring. Appl. Sci. 2023, 13, 11128. [Google Scholar] [CrossRef]
  32. Xiao, H.; Tan, G. Study on fusing simplex search into genetic algorithm. Comput. Eng. Appl. 2008, 44, 30–33. [Google Scholar]
  33. Xing, X.; Yang, D.; Liu, X.; Huang, L. Deformation monitoring using MT-InSAR for Baisha reservoir coal mine area in Henan Province. J. Chang. Univ. Sci. Technol. 2023, 20, 1–10. [Google Scholar]
  34. Zhao, R.; Li, Z.-W.; Feng, G.-C.; Wang, Q.-J.; Hu, J. Monitoring surface deformation over permafrost with an improved SBAS-InSAR algorithm: With emphasis on climatic factors modeling. Remote Sens. Environ. 2016, 184, 276–287. [Google Scholar] [CrossRef]
  35. Fomelis, M.; Papageorgiou, E.; Stamatopoulos, C. Episodic ground deformation signals in Thessaly Plain (Greece) revealed by data mining of SAR interferometry time series. Int. J. Remote Sens. 2016, 37, 3696–3711. [Google Scholar] [CrossRef]
  36. Pawluszek-filipak, K.; Borkowski, A. Integration of DInSAR and SBAS techniques to determine mining-related deformations using sentinel-1 data: The case study of rydultowy mine in Poland. Remote Sens. 2020, 12, 242. [Google Scholar] [CrossRef]
  37. Xu, F.; Hu, H.; Lin, H.; Xie, L. Bedding Slope Destabilization under Rainfall: A Case Study of Zhuquedong Slope in Hunan Province, China. Appl. Sci. 2024, 14, 1394. [Google Scholar] [CrossRef]
Figure 1. SBAS-InSAR technique to acquire one-dimensional time series deformation principle in coal mine area.
Applsci 14 05199 g001
Figure 2. (a) Spatial coordinate system of 3D-CTPIM model; (b) mine strike limited mining; (c) mine inclination limited mining.
Applsci 14 05199 g002
Figure 3. Flow of 3D deformation prediction based on InSAR-3D-CTPIM.
Applsci 14 05199 g003
Figure 4. Partially simulated three-dimensional time-ordered deformation field.
Applsci 14 05199 g004
Figure 5. Comparison between the true value of deformation and the value predicted by the InSAR-3D-CTPIM model.
Applsci 14 05199 g005
Figure 6. Map of the study area and SAR image coverage.
Applsci 14 05199 g006
Figure 7. Spatio-temporal baseline.
Applsci 14 05199 g007
Figure 8. LOS direction time series deformation (reference time: 13 November 2015).
Applsci 14 05199 g008
Figure 9. Three-dimensional deformation prediction results obtained from InSAR-3D-CTPIM model (reference time: 13 November 2015).
Applsci 14 05199 g009
Figure 10. (ad): SBAS-InSAR late image monitoring results; (eh): difference between predicted deformation and SBAS-InSAR monitoring deformation.
Applsci 14 05199 g010
Figure 11. Comparison of level positions and InSAR-3D-CTPIM predicted values with measured values (reference time: 13 November 2015).
Applsci 14 05199 g011
Figure 12. Comparison of residual phases in the Jiansheng coal mine area based on two different models.
Applsci 14 05199 g012
Figure 13. Comparison of InSAR-3D-CTPIM and Static-PIM vertical deformation results.
Applsci 14 05199 g013
Figure 14. Baisha Reservoir Coal Mine area temperature and precipitation data (December 2015 to March 2017).
Applsci 14 05199 g014
Figure 15. Results of sensitivity analysis of model parameters.
Applsci 14 05199 g015
Figure 16. Root-mean-square error of deformation prediction results for different noise levels.
Applsci 14 05199 g016
Table 1. Range of model parameter values.
ParametersRange of Values
q0–1
d0.1–0.5
tanβ1–3.8
θ080–90
S1 (m)5–30
S2 (m)5–30
n1/7–1/2
c6–17
Table 2. Model parameter by InSAR-3D-CTPIM.
ParametersAnalog ValueReal ValueInaccuraciesRelative Error
q0.7110.7220.0111.5%
d0.3260.3350.0090.9%
tanβ1.2511.2390.0122.7%
θ083.2981.142.152.5%
S1(m)7.718.040.334.2%
S2(m)11.2211.850.635.6%
n0.1670.1750.0084.8%
c8.2618.4430.1822.2%
Table 3. SAR image parameters.
Serial
Number
Acquisition
Time
Orbital DirectionPolarization ModeAbsolute
Orbit
02015/11/13AscendingVV8585
12015/12/07AscendingVV8935
22015/12/31AscendingVV9285
32016/02/17AscendingVV9985
42016/03/12AscendingVV10,335
52016/04/05AscendingVV10,685
62016/04/29AscendingVV11,035
72016/05/23AscendingVV11,385
82016/10/02AscendingVV13,310
92016/10/14AscendingVV13,485
102016/10/26AscendingVV13,660
112016/11/07AscendingVV13,835
122016/11/19AscendingVV14,010
132016/12/01AscendingVV14,185
142017/01/18AscendingVV14,885
152017/02/23AscendingVV15,410
162017/03/07AscendingVV15,585
Table 4. Uncertainty of InSAR-3D-CTPIM parameters.
ParametersParameter Analog Values (UP 1)Tolerance Range (UP 2)Parametric Uncertainty
q0.50.25~0.75−50~50%
d0.30.1~0.5−67~67%
tanβ1.51~2−33~33%
θ08580~90−5.9~5.9%
S1200~40−100~100%
S2200~40−100~100%
n0.350.2~0.5−42~42%
c11.56~17−46~46%
Disclaimer/Publisher’s Note: The statements, opinions and data contained in all publications are solely those of the individual author(s) and contributor(s) and not of MDPI and/or the editor(s). MDPI and/or the editor(s) disclaim responsibility for any injury to people or property resulting from any ideas, methods, instructions or products referred to in the content.

