Article

The Stiffness Change in Pre-Stressed Concrete T-Beams during Their Life-Cycle Based on a Full-Scale Destructive Test

1
China Construction Seventh Engineering Bureau Co., Ltd., Zhengzhou 450003, China
2
School of Water Conservancy and Transportation, Zhengzhou University, Zhengzhou 450001, China
*
Author to whom correspondence should be addressed.
Appl. Sci. 2024, 14(12), 5200; https://doi.org/10.3390/app14125200
Submission received: 10 May 2024 / Revised: 4 June 2024 / Accepted: 7 June 2024 / Published: 14 June 2024
(This article belongs to the Section Civil Engineering)

Abstract

:
In order to study the stiffness degradation of pre-stressed concrete T-beams throughout their entire service life, full-scale destructive tests were conducted on newly constructed T-beams. The test process characterized the relationship between load and deflection at different load levels. Meanwhile, the equivalent stiffness and short-term stiffness of the T-beams at different load levels were calculated based on formulas from the code, and a segmental stiffness back-calculation method for pre-stressed concrete T-beam bridges was proposed based on system identification theory. The results show that, during the destructive test process, the T-beams experienced complete, partial linear, and non-linear stages. By using the equivalent stiffness and short-term stiffness to predict the stiffness changes during the overall failure process of the T-beams, it was found that, when cracks appeared, the stiffness of the T-beams decreased by 31% compared to the initial value, and the stiffness continued to decrease as the cracks extended further. The segmental stiffness system identification back-calculation method more accurately described the destructive test process of each section of the T-beams. This method can help to evaluate the extent of damage in each section of the beams during the overall destructive test process and further assess the overall structural integrity of the beams.

1. Introduction

Pre-stressed concrete T-beams have become a preferred option for bridge construction due to their advantages, such as low cost, large span, and high bearing capacity. However, as the bridge is used over time, the pre-stress in the beam gradually decreases, leading to reduced bending and shear resistance performance. This can result in cracks, deflection, and other structural issues that pose significant risks to traffic safety [1]. Therefore, it is crucial to investigate changes in stiffness during the service life of pre-stressed concrete T-beams and develop accurate calculation methods to assess the bridge’s technical conditions during operation.
There are some theoretical methods to calculate the short-term stiffness of bridges after cracking, such as the straight double line method, effective moment of inertia method, stiffness analysis method, curvature integration method, etc. [2]. Based on the above calculation theory, many countries have developed their own stiffness calculation methods for their relevant specifications [3,4,5,6]. Many scholars have studied the changes in the flexural stiffness of beams after cracking. Hu et al. [7] conducted cracking tests on model test beams and compared the mid-span deflection and flexural stiffness changes in bonded and unbonded pre-stress beams under monotonic and repeated loading methods. He also corrected the flexural stiffness calculation formula by introducing a mid-span bending moment correction coefficient. Ismail et al. [8] performed a finite element simulation of the decrease in the flexural stiffness of reinforced concrete simply supported beams during cracking process using a model modification method and verified the accuracy of this method through actual scale model loading tests. Ye et al. [9] used a stratiform model to simulate pre-stressed concrete structures based on CB shell elements and proposed a degradation coefficient and degradation model for flexural stiffness using non-linear finite element analysis. Afterwards, Xu et al. [10] used this model to simulate the distribution characteristics of bending stiffness damage after box girder cracking. Du et al. [11] analyzed the effect of unbonded pre-stress on the moment of inertia of the cracked section, established a relevant equation for the neutral axis height of the cracked section of pre-stressed concrete T-beams using the effective moment of inertia method, and obtained a formula for calculating the deflection of the cracked section. Zhang et al. [12] established a simplified calculation formula for the flexural stiffness of reinforced concrete beams under short-term loads by establishing a cracked section equilibrium equation and obtained the effective moment of inertia of the section. He also compared the theoretical derivation calculation value with the current standard calculation value. With the continuous deepening of research, many scholars have also conducted relevant research on special environmental conditions, new material types, and the calculation methods of bridge bending stiffness after reinforcement [13,14,15].
In the study of bending stiffness based on full-scale tests, Wang et al. [16] established a graphical representation and simplified formula to calculate the bending bearing capacity of steel UHPFRC composite-reinforced concrete T-beams based on the bending failure morphology of full-scale tests. Yu et al. [17] analyzed the bearing capacity and stiffness changes of 30 m pre-stressed concrete box beams through destructive tests and proposed a formula for calculating the remaining bearing capacity based on the bending stiffness reduction coefficient. Wang et al. [18] studied the failure behavior, mechanical properties, and ultimate bearing capacity of a 20 m pre-stressed concrete T-beam through destructive testing and finite element analysis. They also analyzed the relationship between the stiffness degradation of the T-beam, the position of the neutral axis of the section, steel yield, and concrete cracking. They proposed a method to predict the remaining bearing capacity of the bridge based on the distribution position of section strain and the changes in the neutral axis of the section. Their work provides a theoretical basis for the detection of flexural stiffness and evaluation of the bearing capacity of pre-stressed concrete beams.
Prefabricated assembly technology has many advantages in bridge construction, such as specialized construction, environmental friendliness, shortened construction period, cost reduction, and improved safety and quality. Currently, the length of prefabricated beams has increased from 10 m, 13 m, 16 m, 20 m to 50 m, becoming a development trend in bridge construction both domestically and internationally. The 50 m T-beam is the largest span assembly prefabricated beam in highway bridges [19], with a universal applicability in the testing methods of pre-stressed bridges. Although the 50 m T-beam is common in highway bridge engineering, there is limited related literature, making it a bottleneck in the development of prefabricated highway bridges. Therefore, this study conducted a full-scale destructive test on a 50 m span T-beam bridge and characterized the relationship between load and deflection at different load levels. Additionally, the equivalent stiffness and short-term stiffness of the T-beam under different load levels were calculated based on formulas in the specifications, and a segmented stiffness inversion method was proposed using system identification theory to analyze the degradation law of stiffness of each segment section of a newly constructed prefabricated concrete T-beam bridge under sustained loads until failure. The segmented stiffness-based system identification inversion method proposed in this study can more accurately describe the failure test process of each section of the T-beam, providing valuable reference for future load tests and assisting in the evaluation of the load-bearing capacity of such bridges.

2. Experimental Program
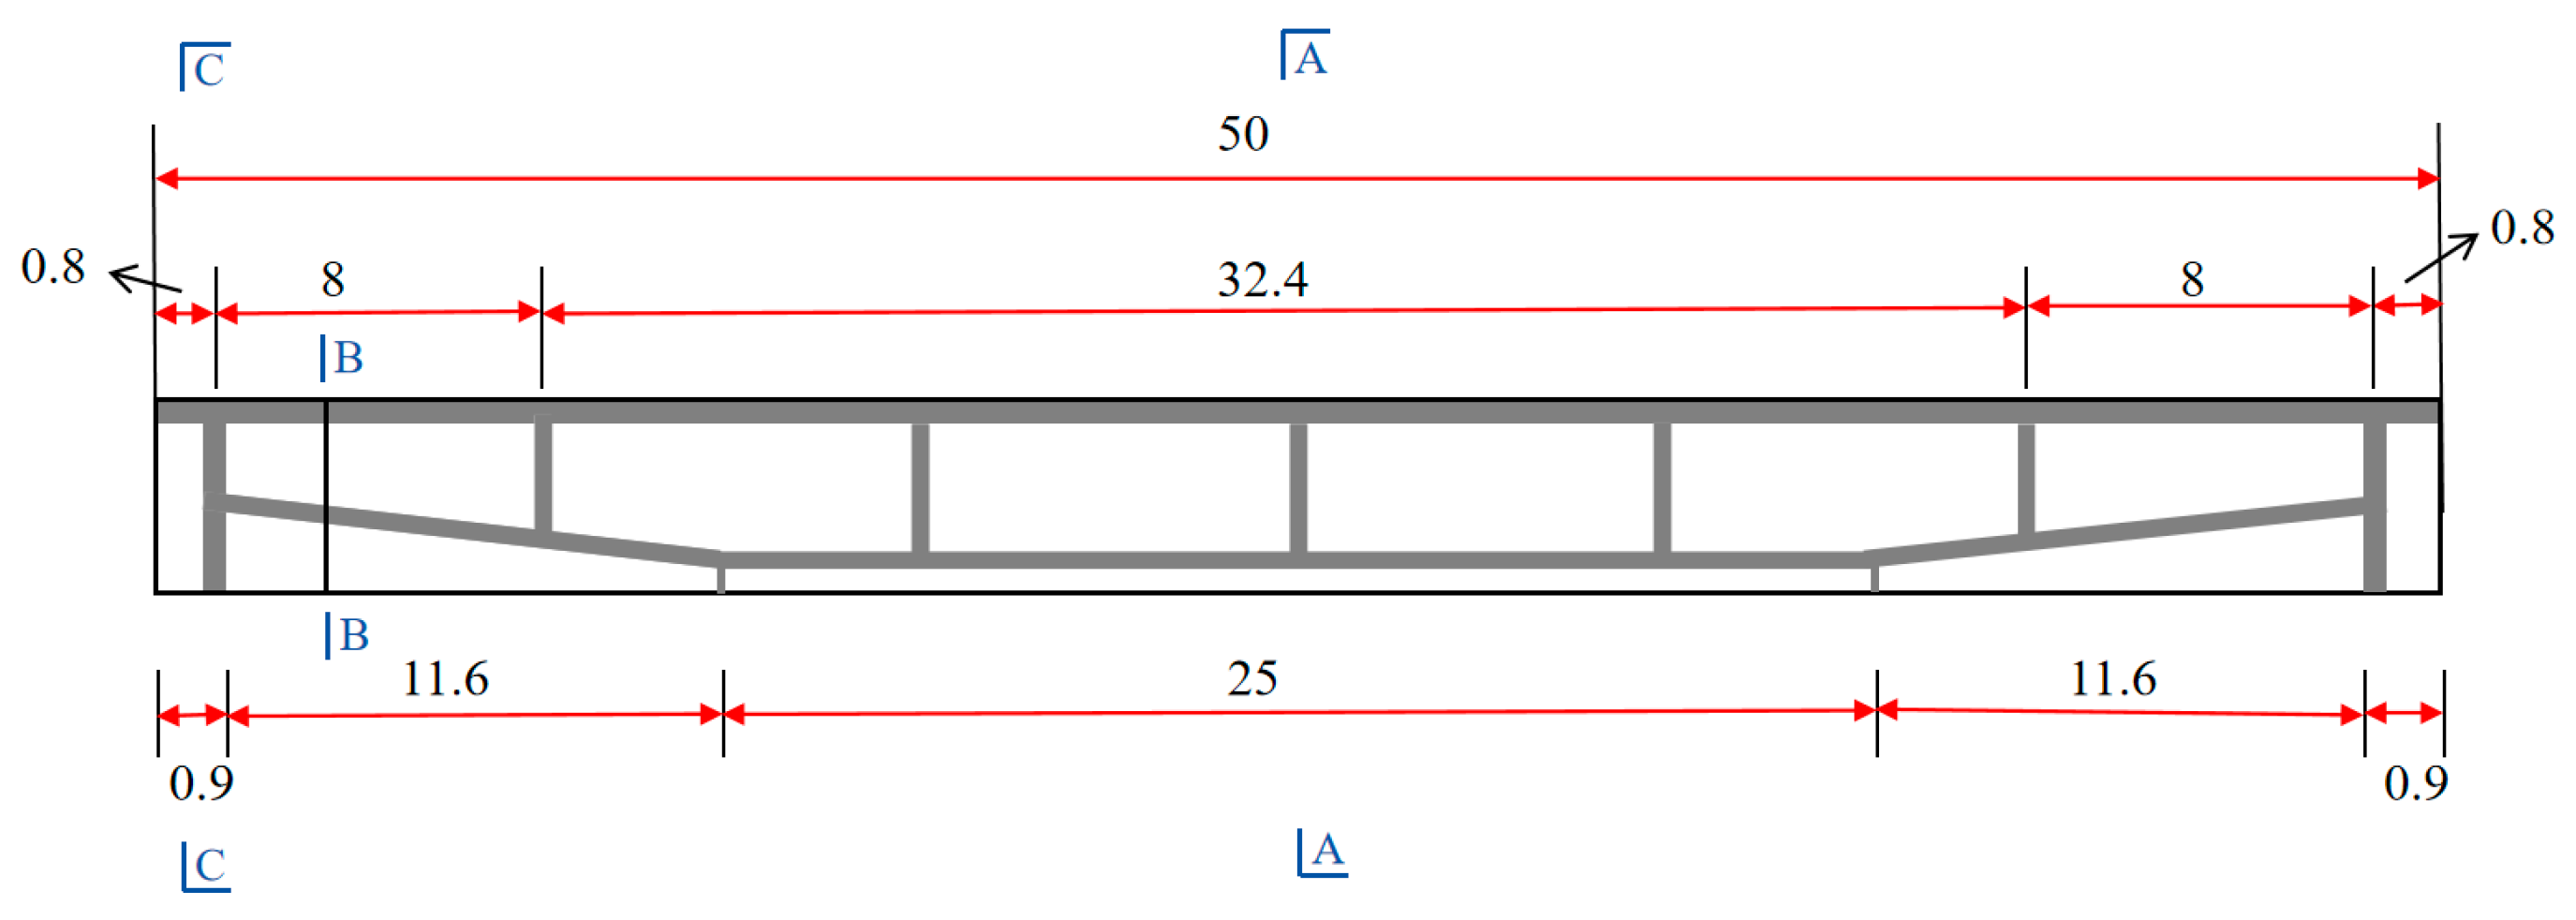
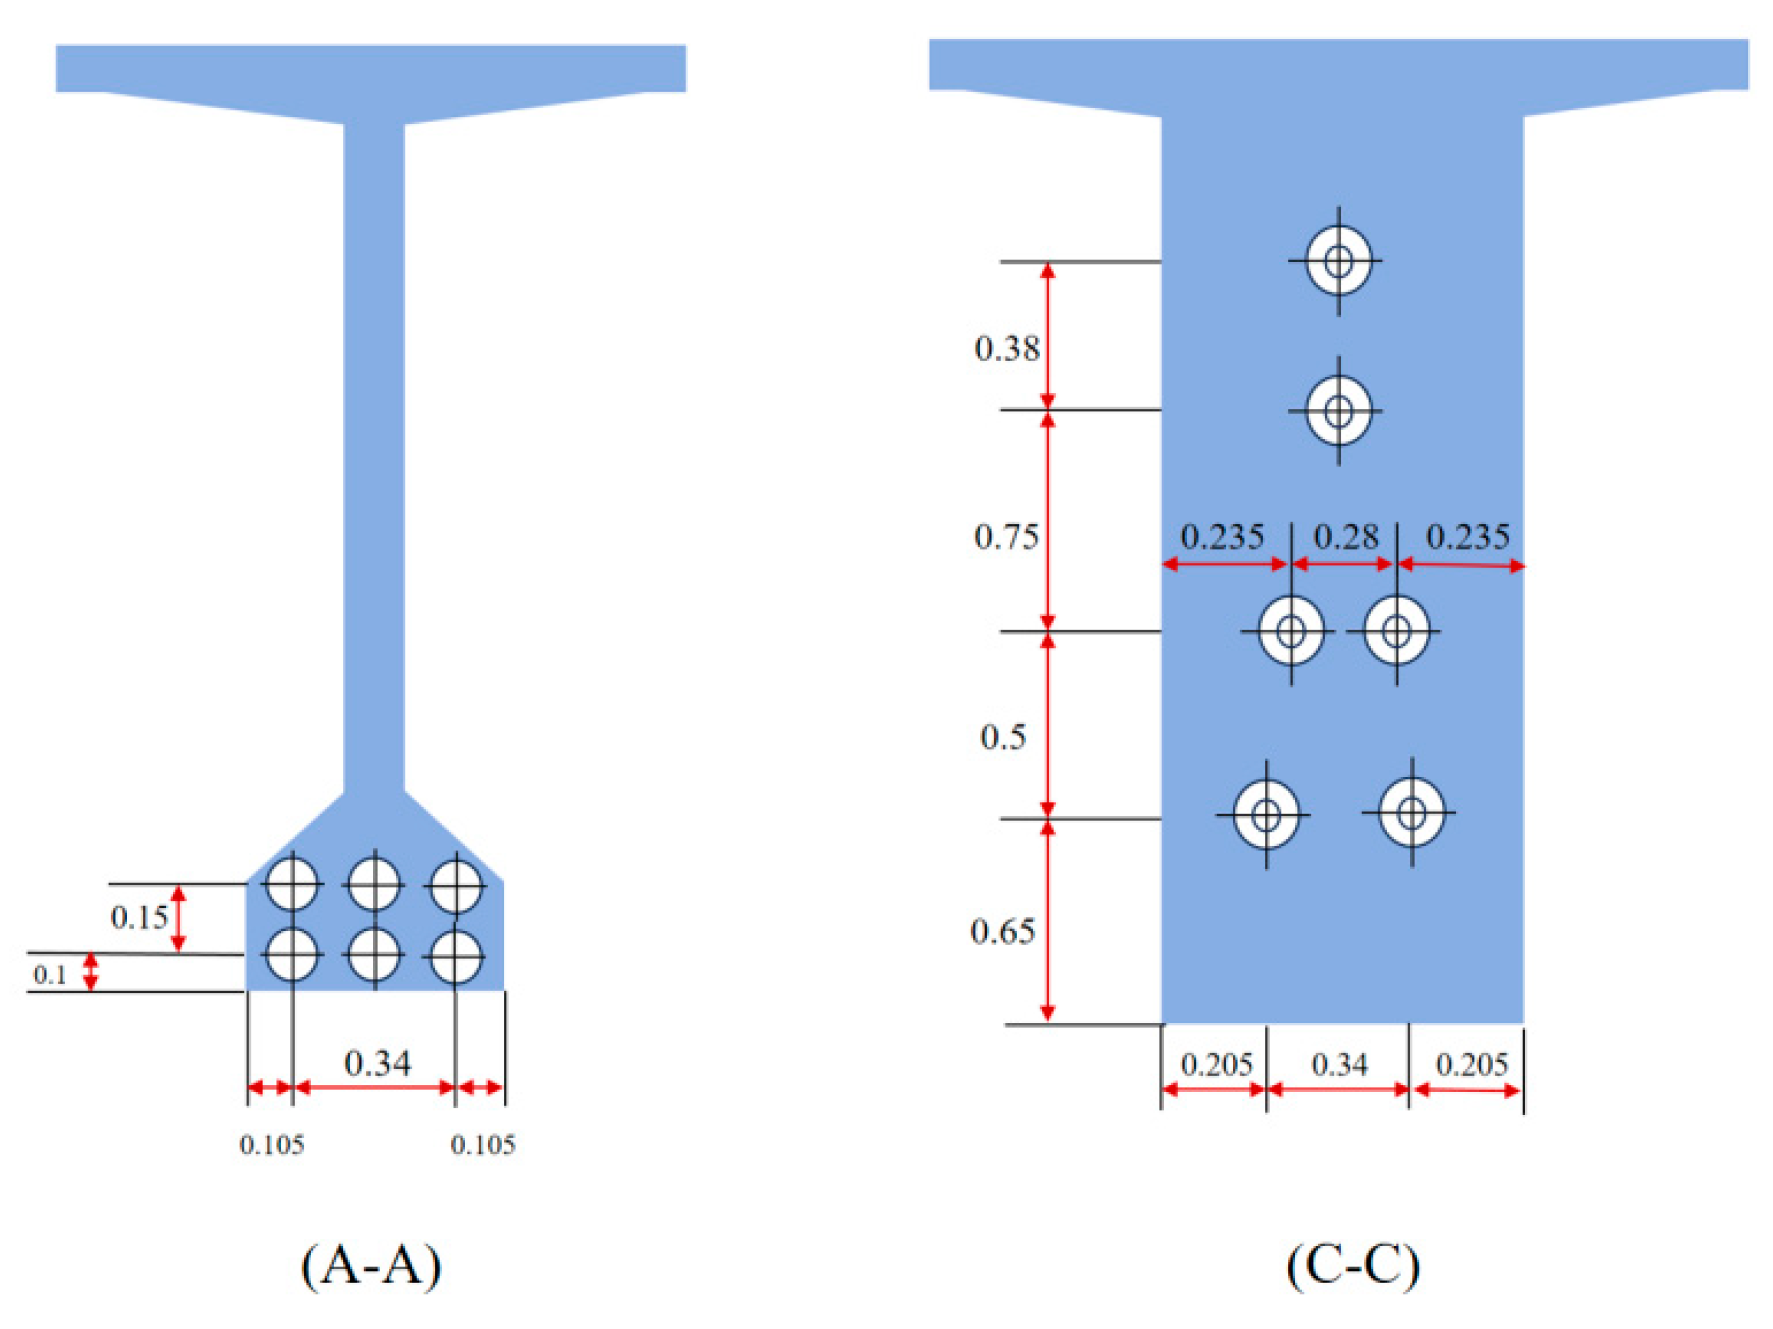
2.1. Test Beam

The T-beam used in this study was selected from the Yellow River Super Large Bridge Project on the Puyang to Hubei Yangxin Expressway. It has a total length of 50 m, with a calculated span of 48.8 m. The dimensions of the beam can be seen in Figure 1 and Figure 2. The beam was constructed using the post-tensioning method, and the concrete used had a strength of C55. Low-relaxation and high-strength pre-stressed steel strands were used as the pre-stressed reinforcement, with a standard tensile strength value of 1860 MPa. The tension stress of the pre-stress was controlled at 1395 Mpa. The relaxation coefficient of the pre-stress steel strands was 0.3. The pre-stressed steel duct was formed using embedded corrugated pipes. The longitudinal load-bearing steel reinforcement specification was HRB400. The height of the beam was 2.9 m, with the width of the top plate being 1.8 m, the width of the lower edge being 55 cm, and the height of the horseshoe edge being 28 cm. The arrangement of the pre-stressed steel strands can be seen in Figure 3, Figure 2 and Figure 3 are both cross-sectional views corresponding to the position indicated in Figure 1.

2.2. Loading Device and Measurement Point Layout

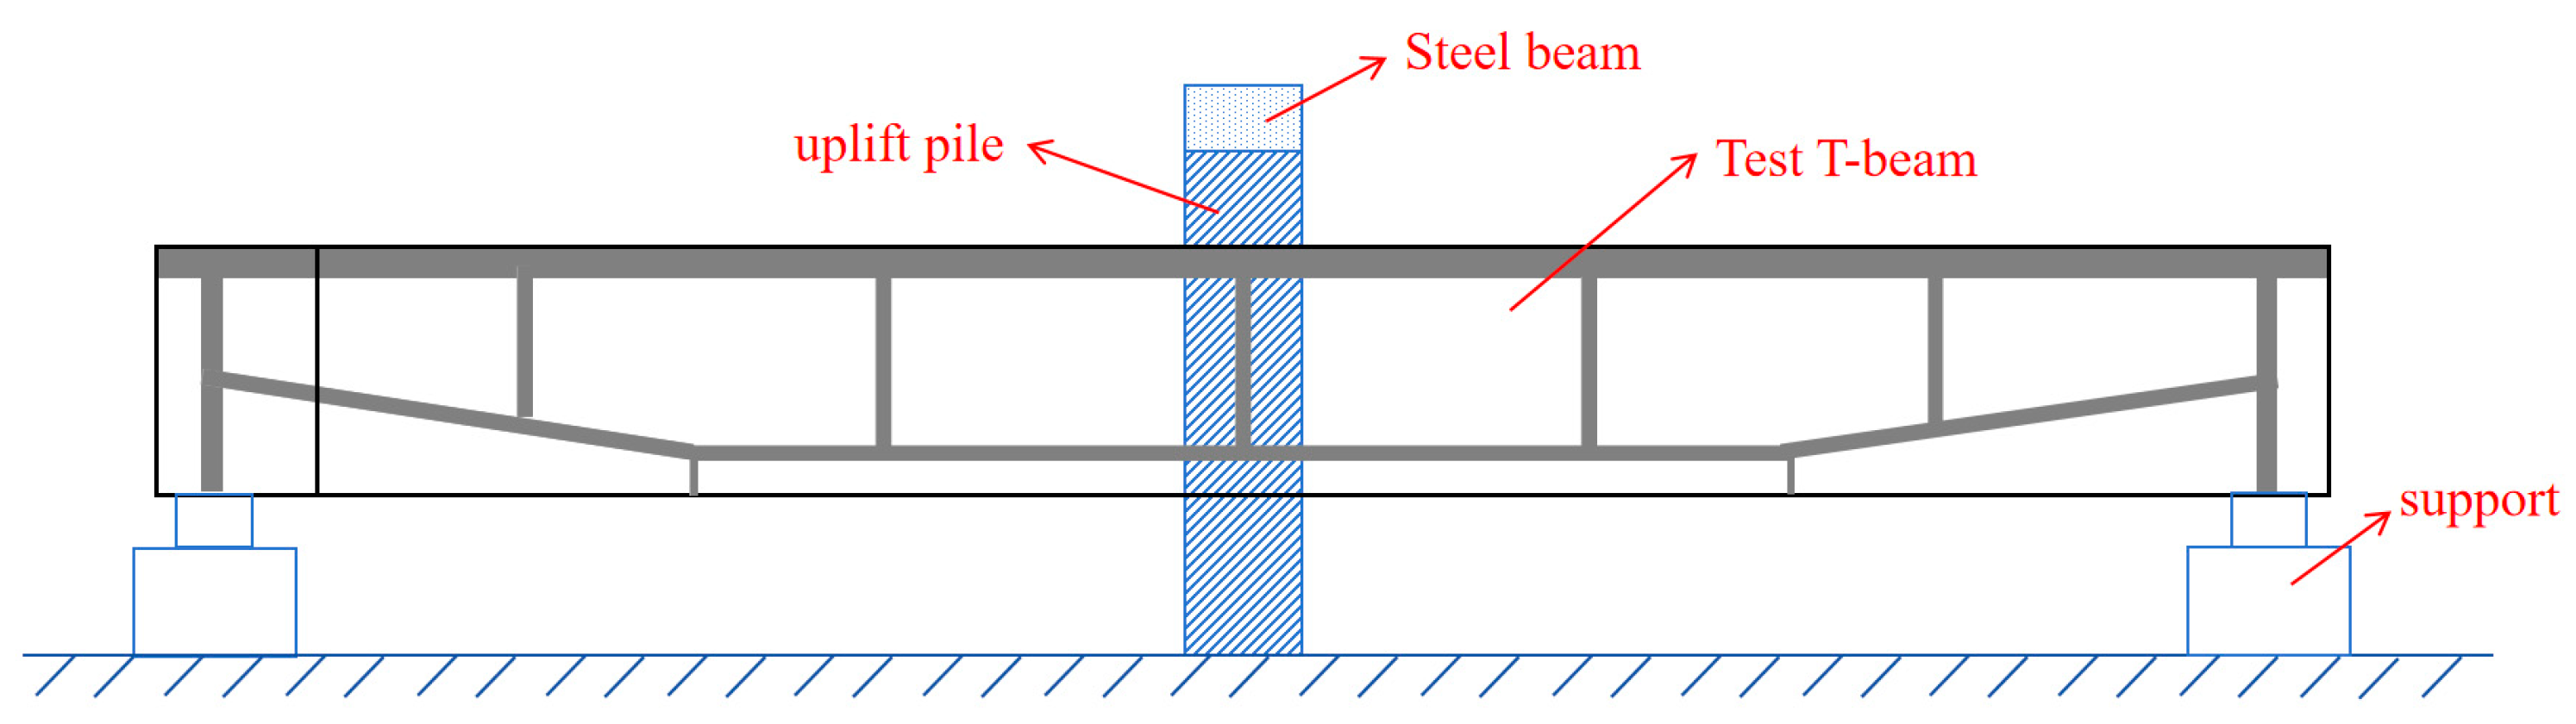
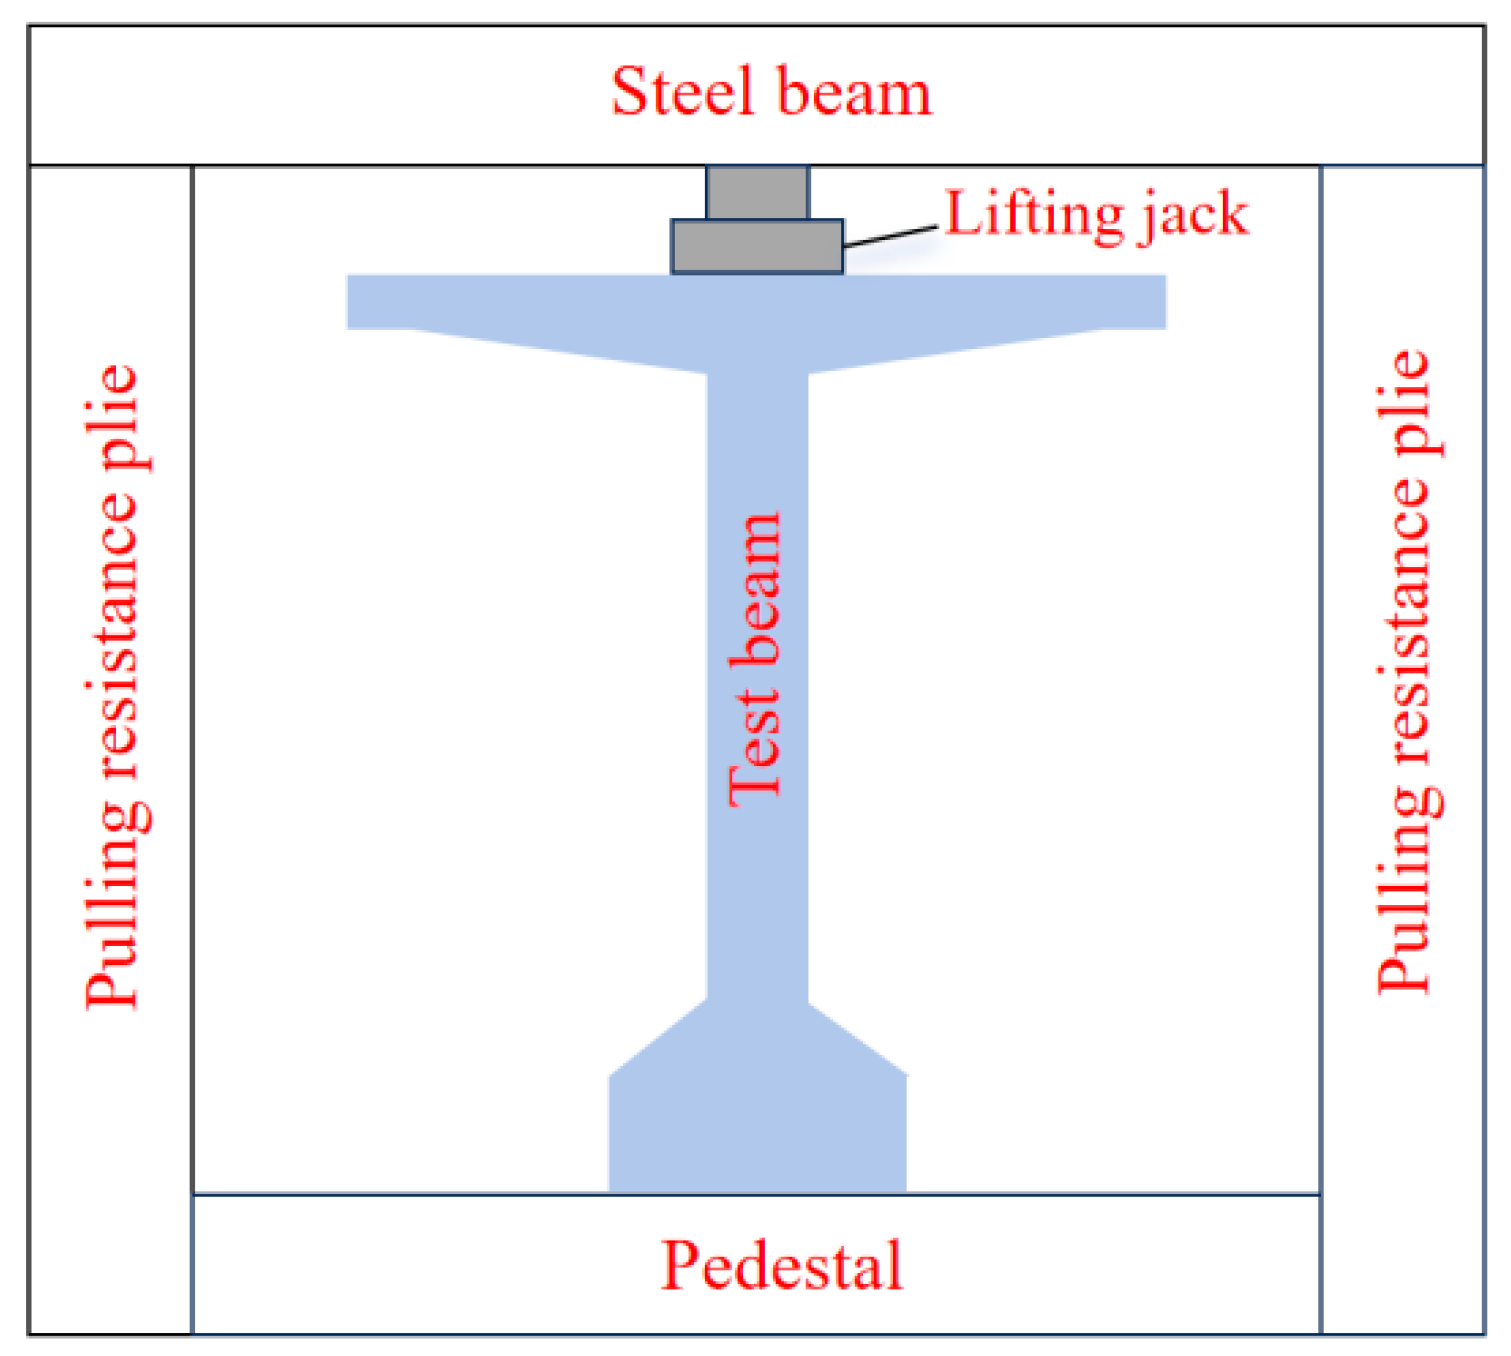
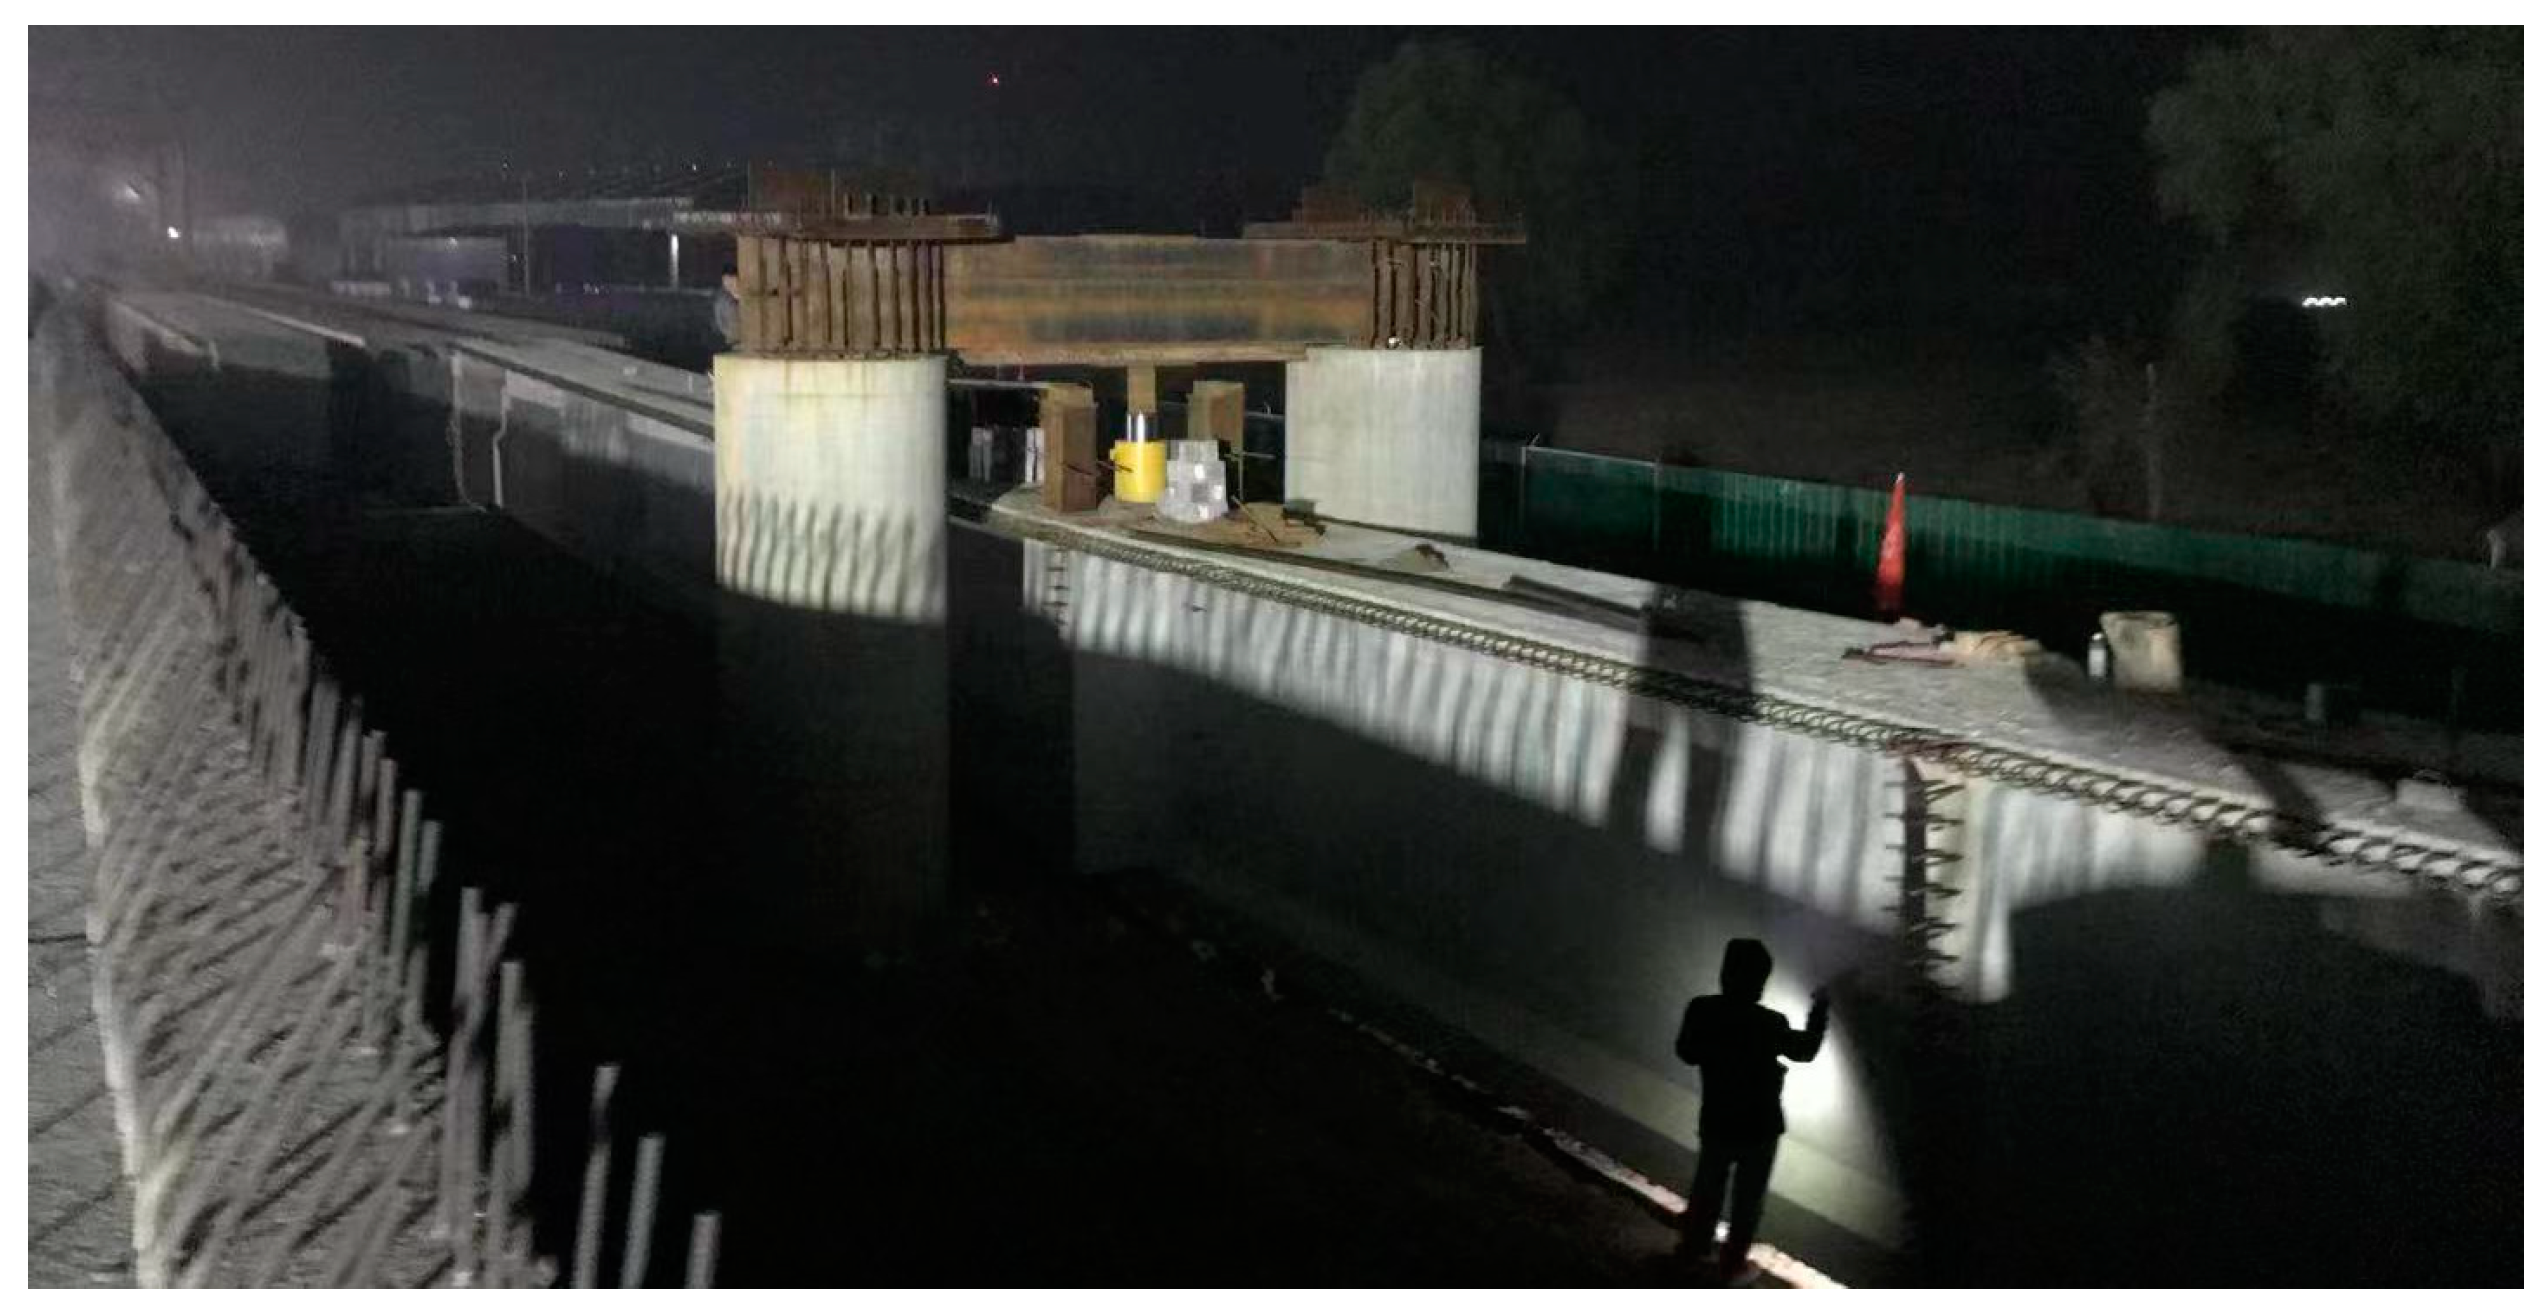
2.2.1. Loading Device

The test employed a single-point loading method to apply the load. The loading position was chosen to be the most critical section of the structure, where it experiences the highest positive bending moment, which is at the mid-span of the beam. The loading device used in the test is shown in Figure 4 and Figure 5. The test T-beam was placed on a support pedestal, and the loading jack was positioned between the test T-beam and the counter-force rack. The counter-force rack was constructed using a steel beam and two concrete pulling resistance plies. The ends of the steel beam were connected to piles. As the jack was pressurized, the steel beam bore the upward pressure, and the resulting reaction force was used as the loading for the T-beam test.

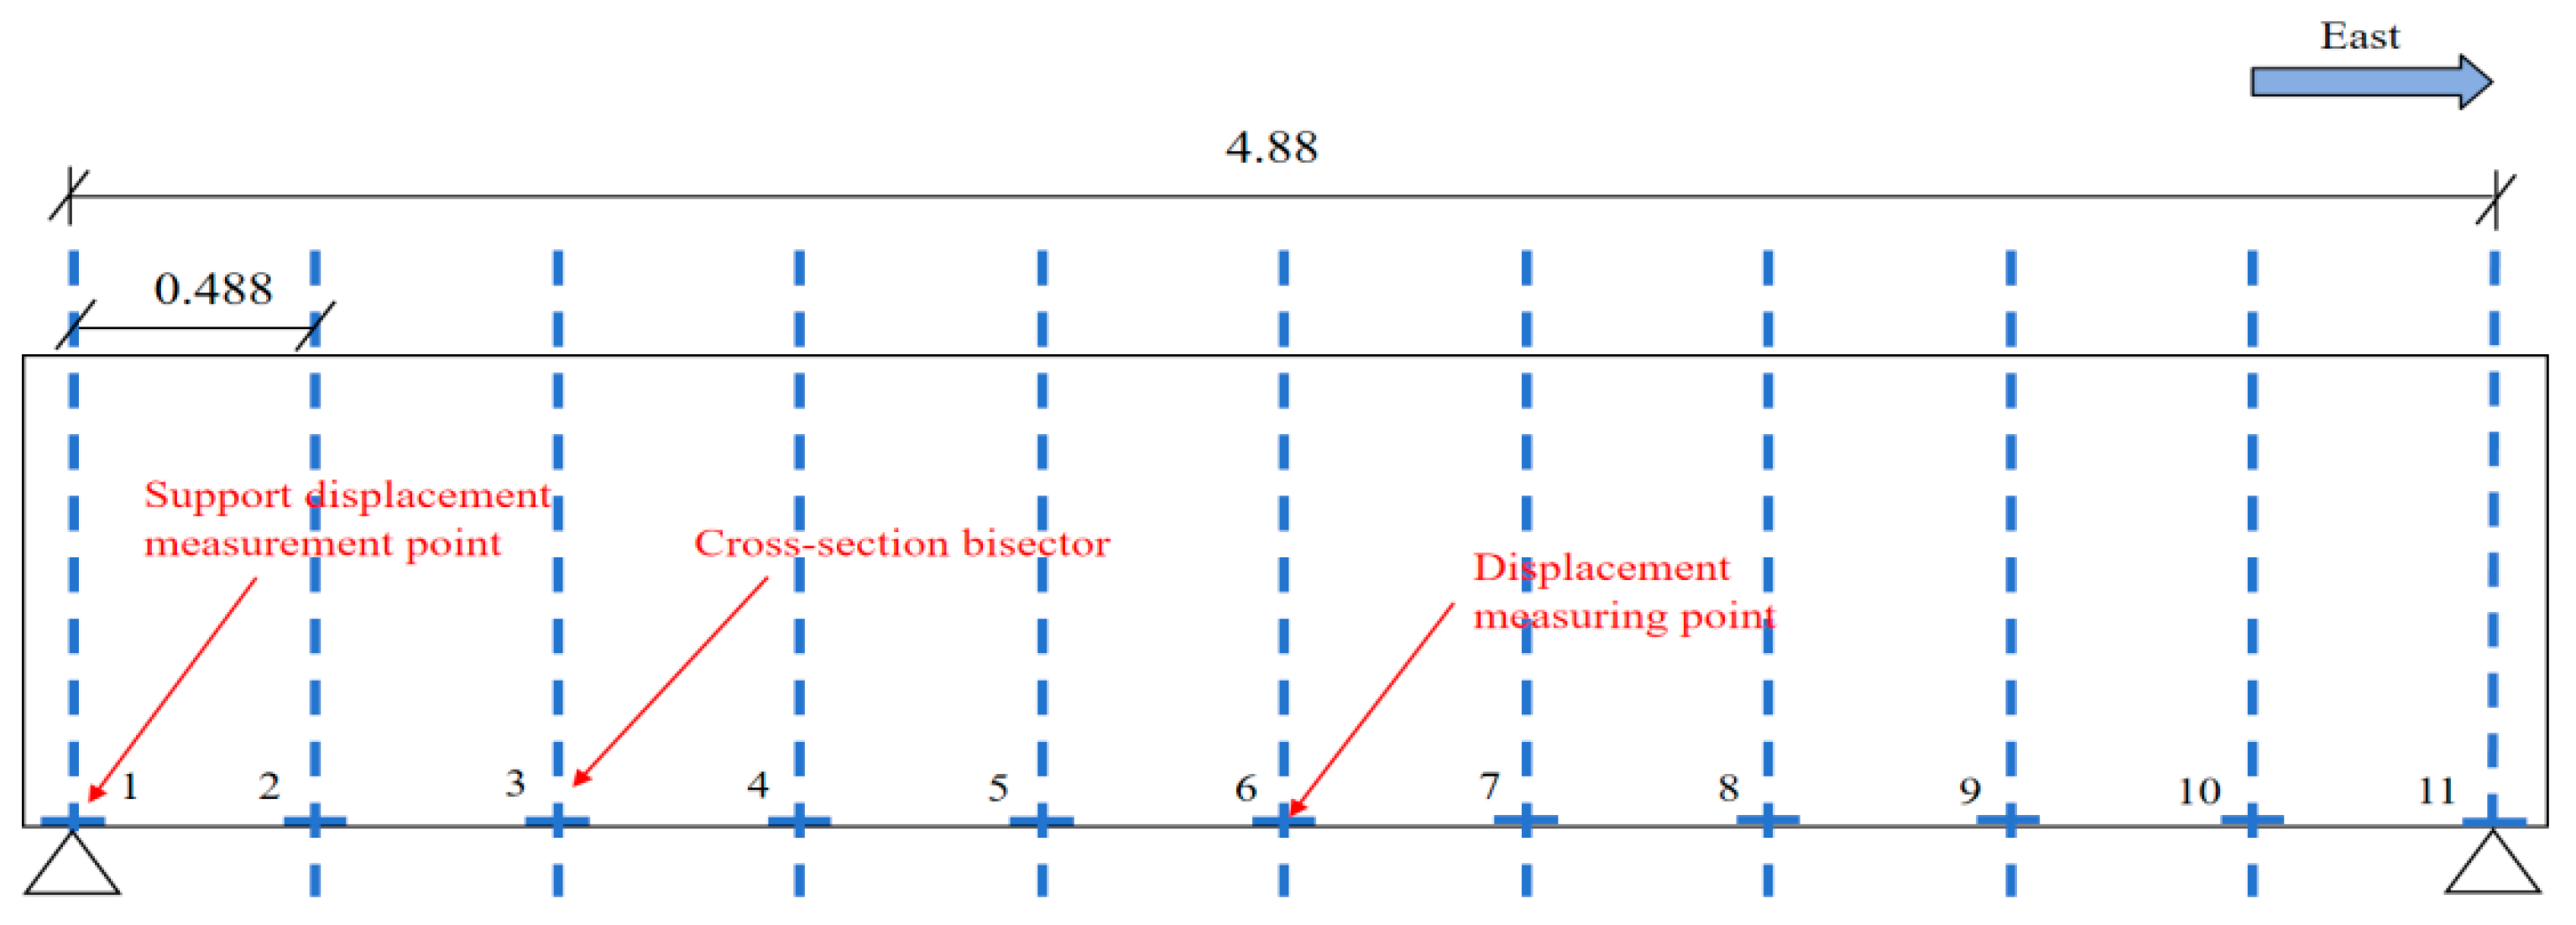
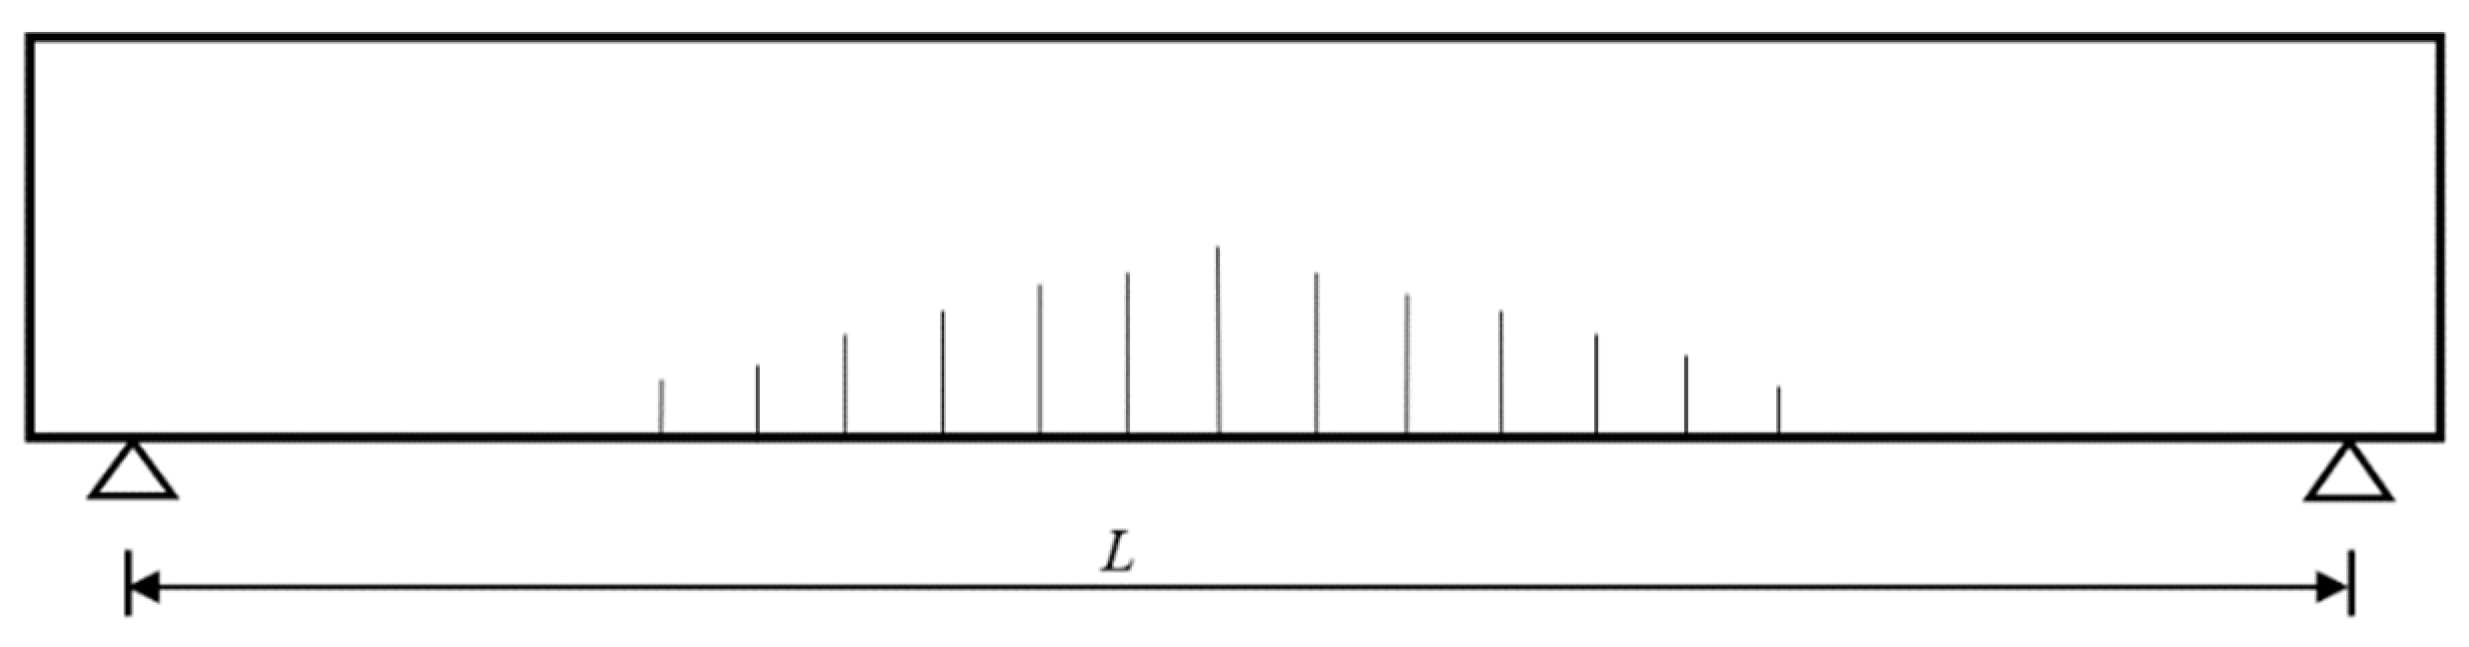
2.2.2. Layout of Deflection Measurements
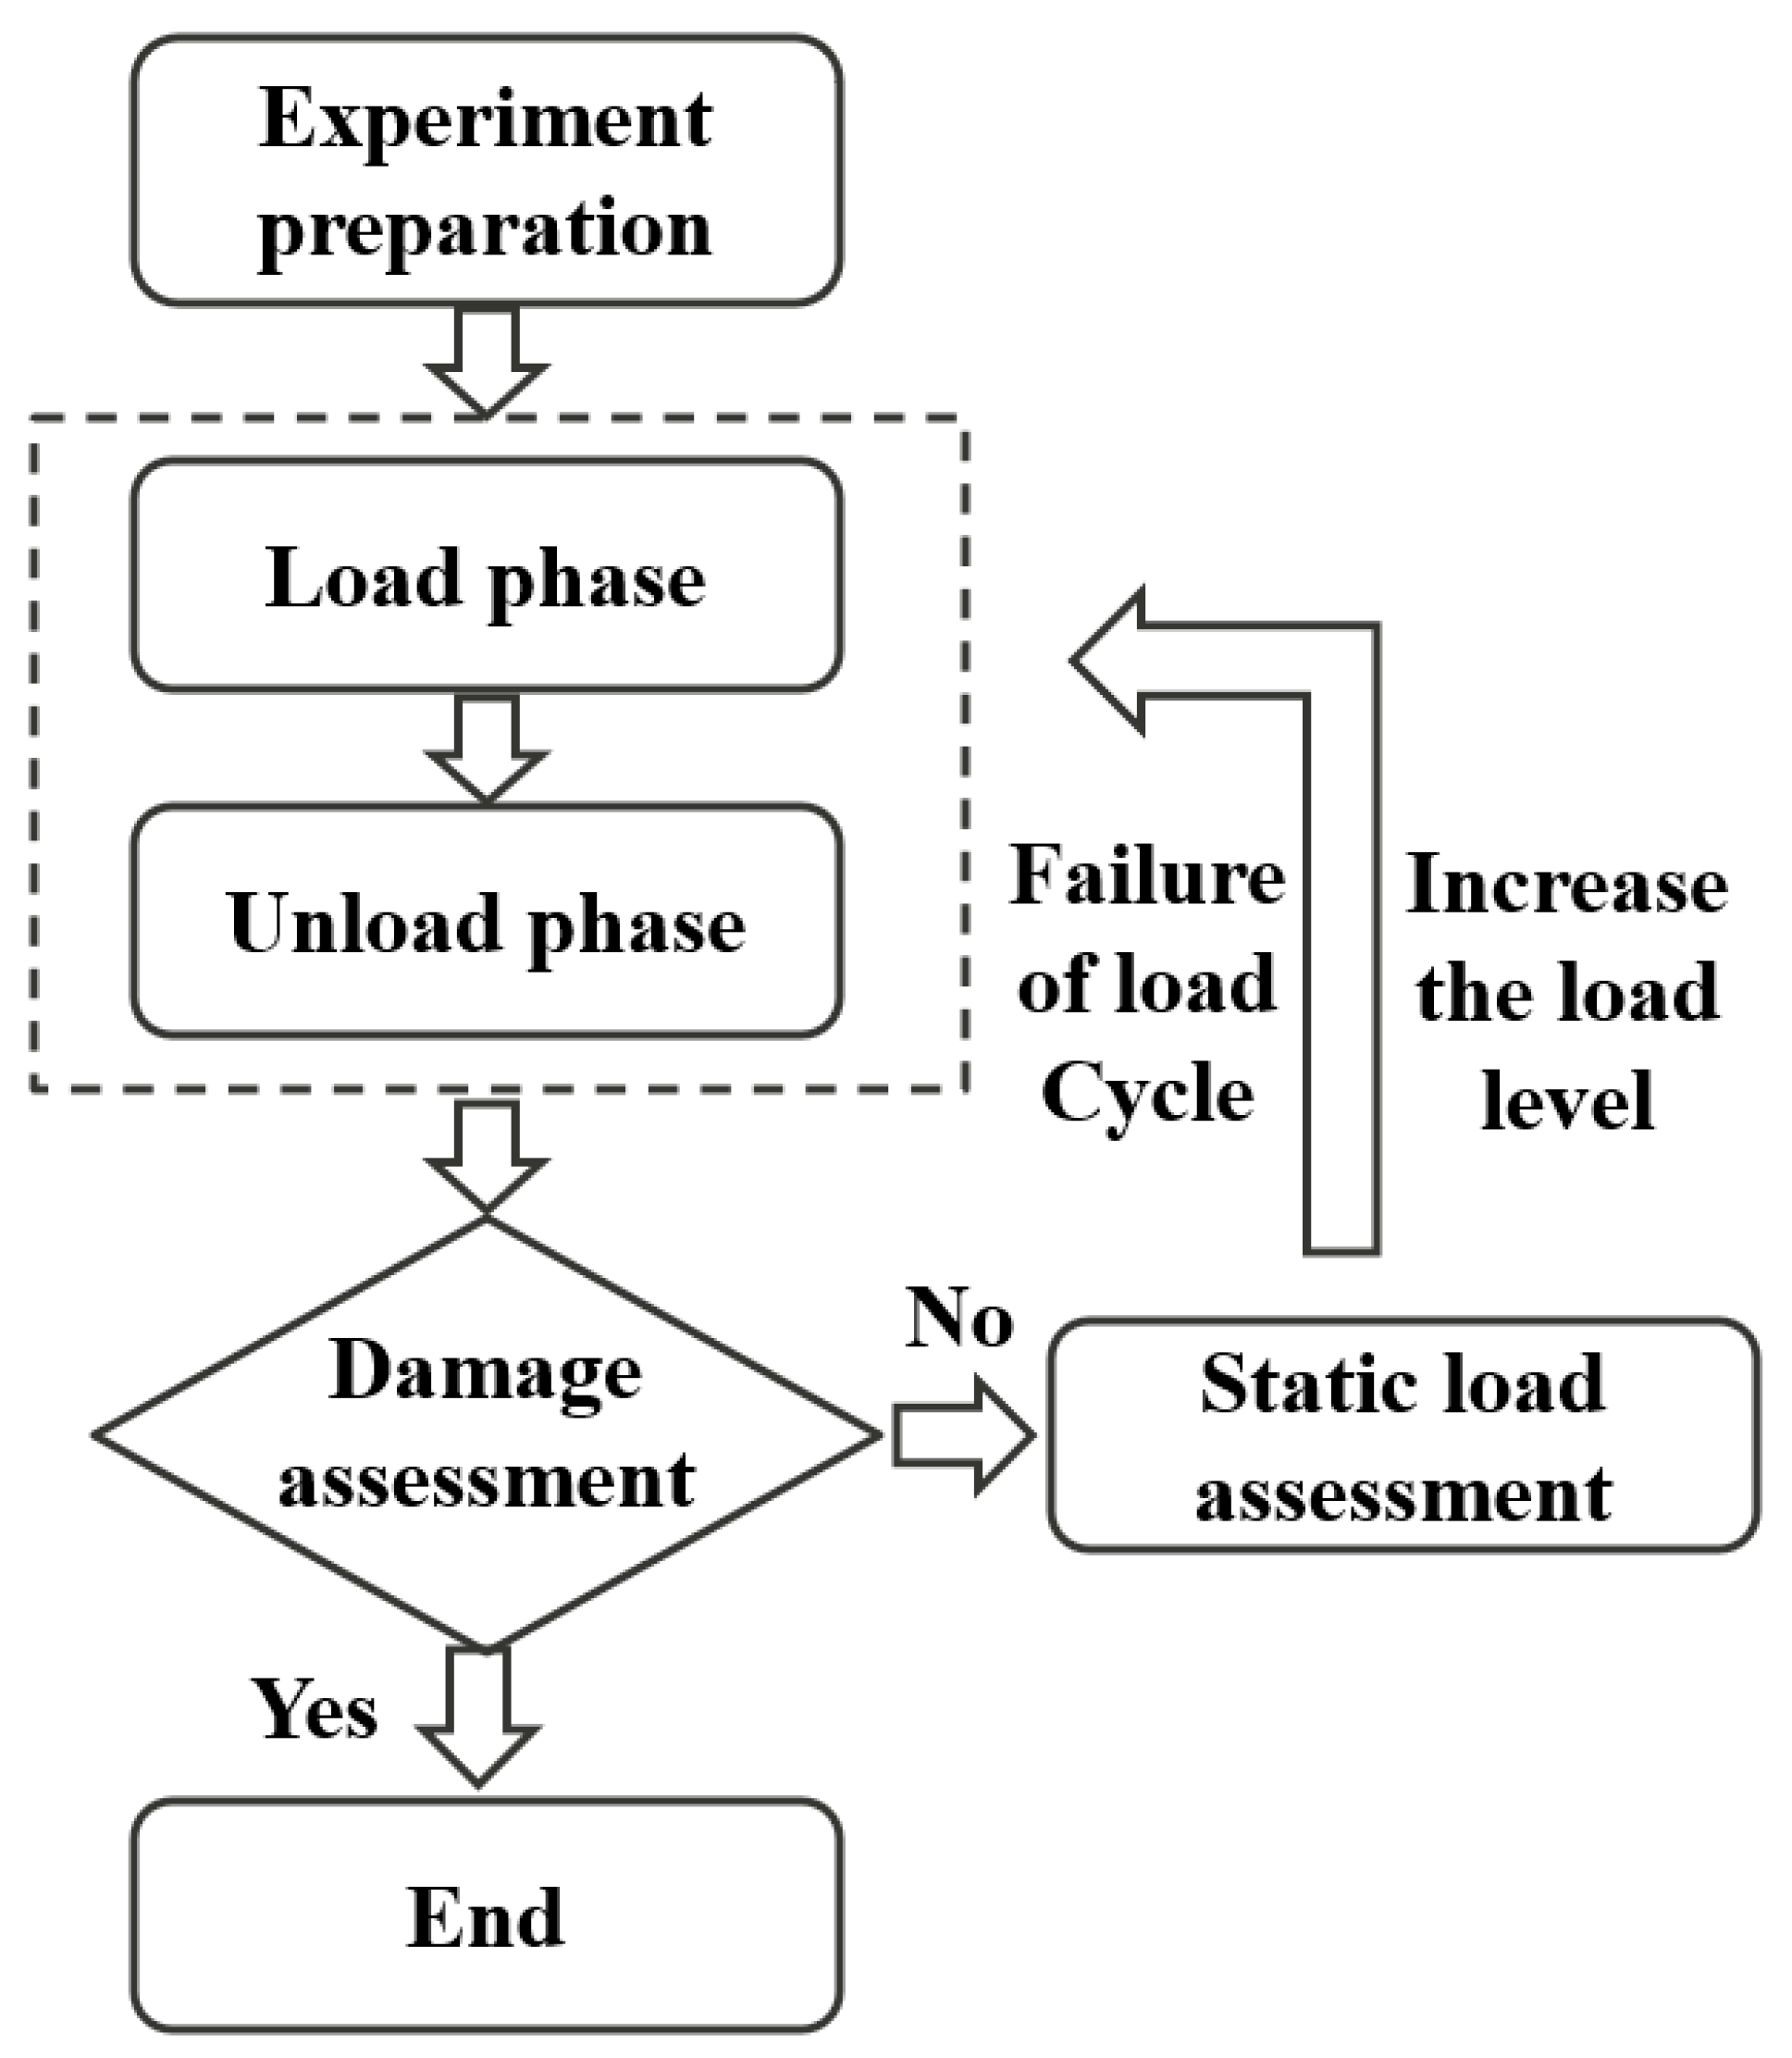
According to the main content and purpose of this experiment, the arrangement of the deflection measurement points for the test T-beam is shown in Figure 6.

2.3. Load Program

2.3.1. Load Level

In order to further understand the actual mechanical properties of the test T-beam at different stages of damage, we considered the most unfavorable loading condition of the T-beam in the test, combining the load values according to the “General Design Code for Highway Bridges and Culverts” [20] to determine the equivalent loading value for the static load test process. The transverse distribution coefficient of the middle beam was calculated using the rigid beam method, and the vehicle load was applied according to the Highway Class I load standard [21]. After each loading level during the T-beam destructive test process, unloading was carried out until the reading of deflection from mid-span was stable. The load circle consisted of loading and unloading. The 14 loading circles corresponded to the 14 loading level. The loading levels were set as 315, 630, 1030, 1110, 1190, 1300, 1500, 1580, 1700, 1900, 2100, 2220, 2500, and 2540 kN. At the same time, according to the code requirements, each loading level was loaded step by step. The specific loading description is shown in Table 1.

2.3.2. Dynamic and Static Load Test Loading Efficiency

During the process of conducting the current T-beam failure test, unloading was carried out after each level of load was applied, followed by dynamic and static load tests. The concentrated force of each loading was approximately 630 kN, with the loading efficiency being shown in Table 2.
Following each cycle, a static bearing capacity test was conducted on the beam, with a concentrated force of 630 kN applied. The bearing capacity was evaluated based on the data obtained from the static load test. The loading scene diagram of the T-beam is shown in Figure 7. The overall destructive loading process is as follows. First, conduct test preparation and then perform the load circle. If the structure is not damaged, conduct a static load test and then return to the load circle. If the structure is damaged, end the process. The specific experimental procedure is shown in Figure 8.

3. Experimental Results and Analysis

3.1. Experimental Results

During the loading process, cracks gradually appeared and continuously developed in the beam, as shown in Figure 9. When the load reached 1030 kN, cracks began to appear at the lower mid-span of the beam. The cracks were distributed within a range of 2.5 m near the mid-span of the beam, with an oblique direction. The average width of the cracks was about 0.08 mm, and the largest crack width was 0.12 mm, corresponding to the initiation of cracking load. With the continuous increase in the load, the height, number, and range of cracks in the beam began to increase rapidly, and the crack width also increased with the load. After the load increased to a certain extent (1790 kN), the number of cracks in the beam tended to stabilize, but the crack width began to increase rapidly with the increase in the load. When the load reached 2540 kN, the beam entered a state of complete failure, with multiple cracks of large widths appearing in the beam, and the maximum crack width reached 4.7 mm.

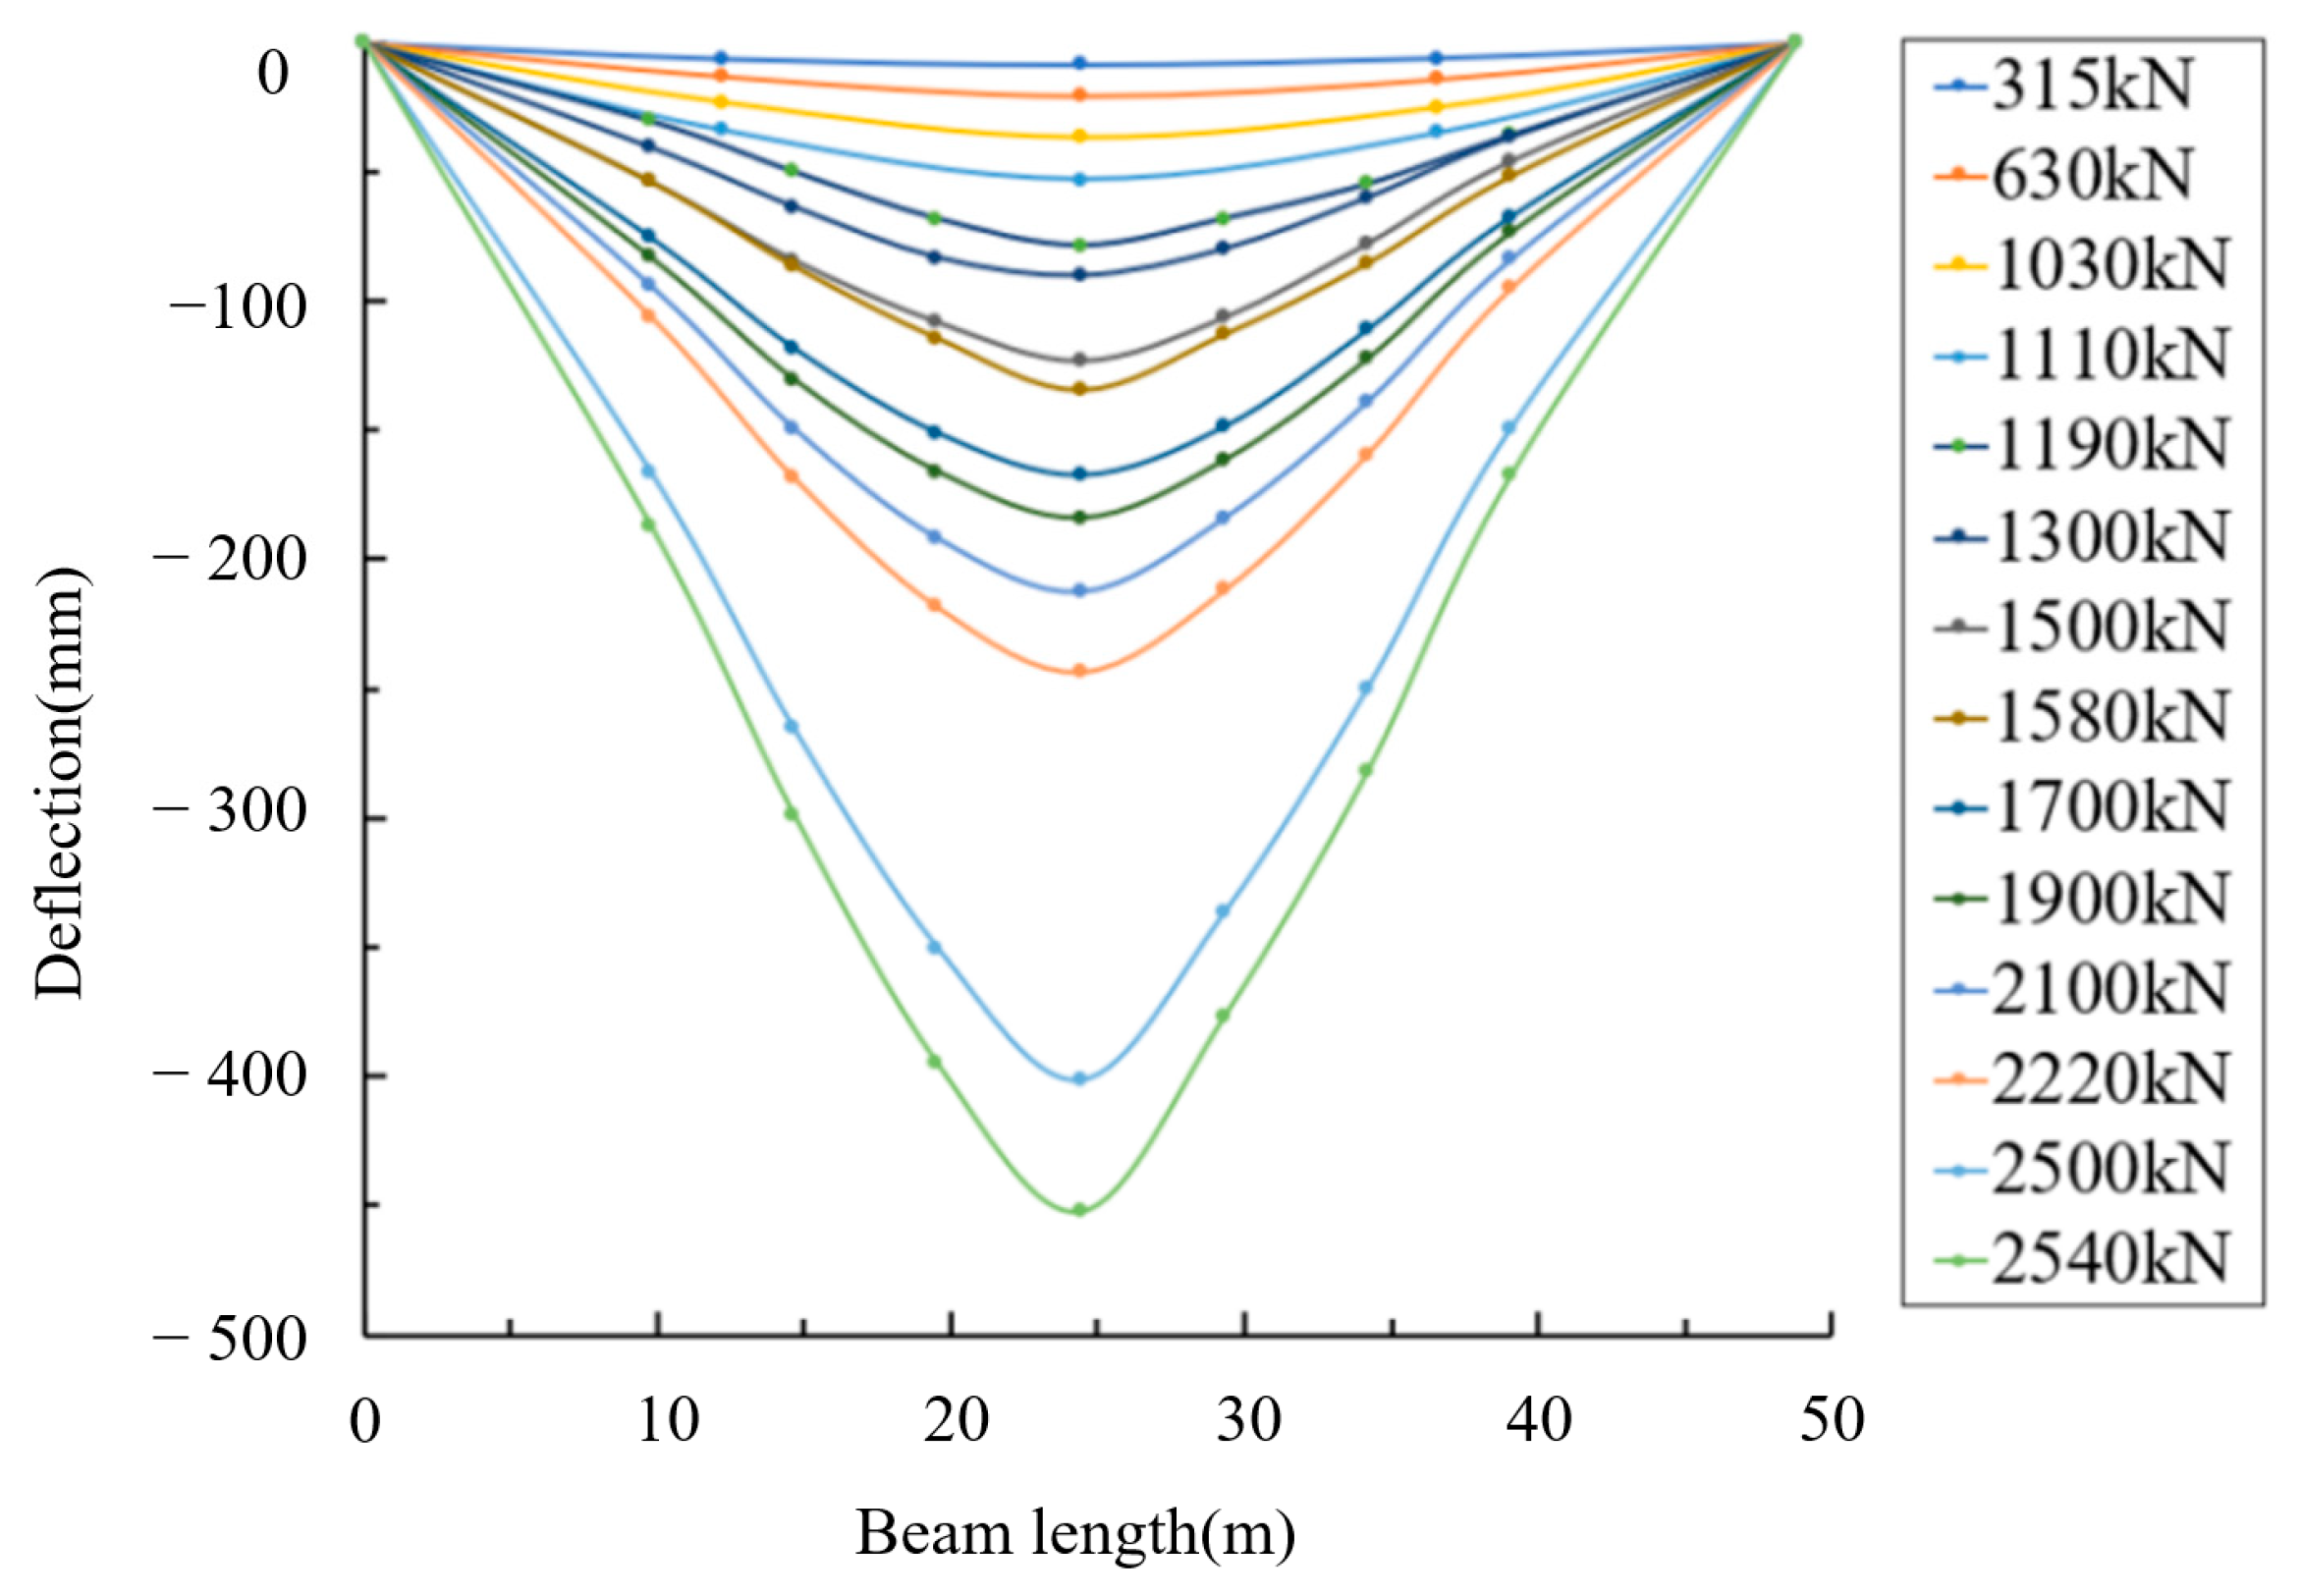
3.2. Load–Deflection Analysis

The deflections were measured as negative values after subtracting the vertical displacements from both ends of the support pedestal. The deflections along the beam were recorded at each loading cycle. The load–deflection curves are shown in Figure 10. To provide a clearer representation of the deflection changes with respect to the applied load, the deflections at the mid-span position for each loading level were extracted separately, as shown in Figure 11.
During the loading process, the stiffness of the T-beam gradually decrease as its deflection increases, thus affecting the carrying capacity and normal service performance of the bridge components. Figure 10 shows the load–deflection curves at the mid-span position of the experimental results, and the slope of the curve can reflect the change in the stiffness of the components in different stages. It can be observed in the Figure 11 that there are two distinct inflection points, corresponding to the initiation of cracking in the component and the onset of full plastic stage. By using these two inflection points, the mechanical behavior of the T-beam during the destructive test can be classified into three stages: complete linear stage, incomplete linear stage, and non-linear plastic stage, which is consistent with the observed results in the article [18]. The specific analysis results are as follows:
(1)
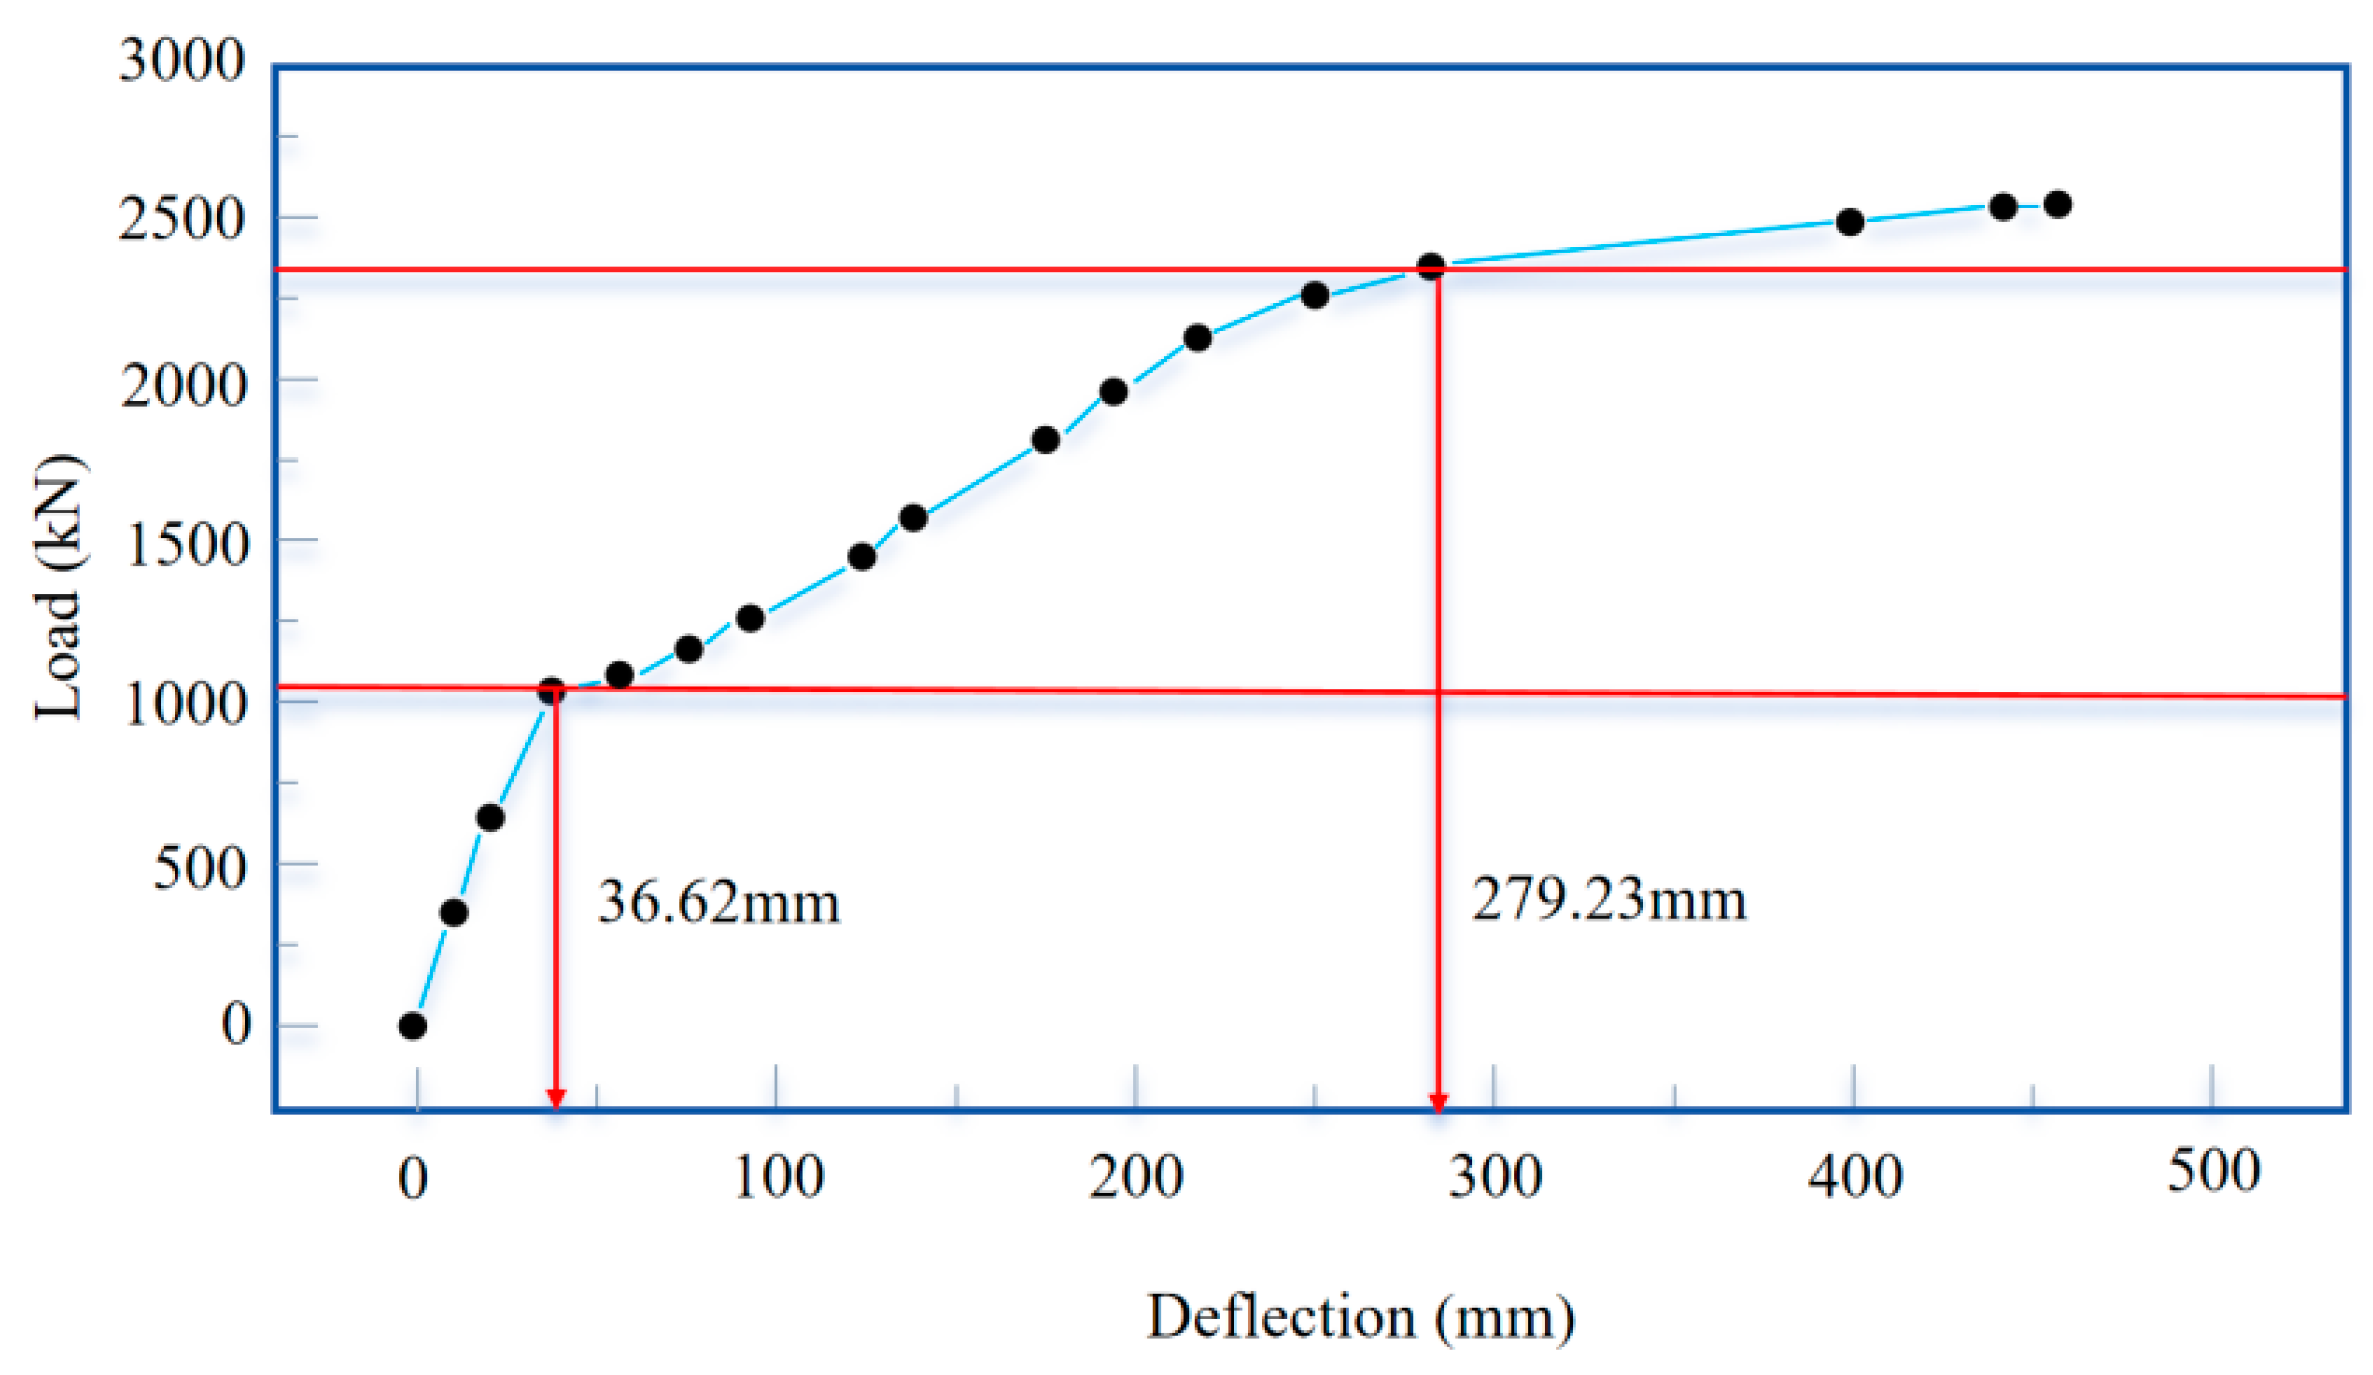
Complete linear stage: During the initial stage of loading, when the load value is small, the deflection of the beam increases gradually. The load–deflection curve shows a linear relationship between the deflections and the applied load. The slope of the load–deflection curve is the highest during this stage. No cracks are observed, and the stiffness of the T-beam remains essentially unchanged. The material in the T-beam does not reach the yield state.
(2)
Incomplete linear stage: With the increase in the cyclic loads, the structural carrying capacity gradually decreases. In this process, the deflection verification factor shows an exponential growth trend as the cyclic load value increases. This indicates that, under the criterion of deflection verification factor assessment, the structural carrying capacity fails to meet the requirements for normal use. When the load reached 1030 kN, the deflection at the mid-span section of the beam reached 36.62 mm, marking the occurrence of the first inflection point on the load–deflection curve. At this point, the test beam emitted a continuous sound, and cracks began to appear at the bottom of the beam’s mid-span section. Crack dispersion was observed predominantly within the 2.5 m vicinity of the mid-span of the beam, exhibiting a skewed orientation. The average crack width was approximately 0.08 mm, with the maximum crack width measuring 0.12 mm, which corresponded to the cracking load. This cracking load of 1030 kN was almost equal to the predicted cracking load. After the first inflection point, the deflection continued to change linearly with the load, but the slope of the load–deflection curve decreased, indicating a decrease in stiffness. The cracks gradually propagated towards the two ends of the beam as the load increased during this stage.
(3)
Non-linear stage: As the load further increased to 2380 kN, the deflection at the mid-span section of the beam reached 279.32 mm, marking the occurrence of the second inflection point on the load–deflection curve. The rate of deflection growth accelerated, indicating that the beam has entered the plastic stage. At a load of 2550 kN, the deflection at the mid-span section reached 473.28 mm. At this point, the crack height at the mid-span section is close to the top of the beam, and the maximum crack width was measured at 4.7 mm. A sound was heard from the pre-stress breaking, and the tensile steel bars in the beam began to yield. The test was concluded at this stage.

4. The Predicted Stiffness

4.1. Equivalent Stiffness

Based on the mid-span deflection of the T-beam during the destructive test process, the equivalent stiffness calculated from Formula (1) under concentrated force is derived using the material mechanics formula. The bending stiffness reduction coefficient is calculated by Formula (2). The measured equivalent stiffness on a cross section is finally calculated as shown in Table 1.
B S = F b x 6 ω L ( L 2 x 2 b 2 )
where Bs is the equivalent stiffness of a simply supported beam, F is external concentrated force loading value, L is the calculation span of simply supported beams, ω is the deflection, x is the distance from the stiffness calculation position to the fulcrum, and b is the distance from the loading position to the fulcrum.
The stiffness reduction coefficient is defined as follows.
β = B i / B 0 i = 1 , 2 , 3 ,
Where β is the stiffness reduction coefficient, Bi is the stiffness on a cross-section after damage, and B0 is the initial stiffness on a cross-section.
Referring to the data in Table 3, it can be seen that the beam is in a complete linear elastic state during the initial loading stage, and the equivalent stiffness is relatively large. The equivalent stiffness hardly changes with the increase in the cyclic load level. After the third cyclic loading (1030 kN), the equivalent stiffness begins to decrease, while cracks begin to be formed at the bottom of the beam. When the cyclic load reaches 1110 kN, the equivalent stiffness of the T-beam decreases by 31% compared to the initial value. It decreases sharply during a load between 1110 kN and 1300 kN. After the cyclic load is increased to 1300 kN, the decreasing rate of the equivalent stiffness relatively slows down. The equivalent stiffness will continuously decrease as the load increases.

4.2. Short-Term Stiffness

According to four different specifications from the literature [3,4,5,6] regarding the short-term stiffness calculation formulas for flexural components, the short-term stiffness values of the test T-beam were calculated combined with the cross-sectional information and material parameters. The calculation results of the short-term stiffness at the mid-span position based on different references, i.e., Chinese concrete regulation [3], Chinese bridge regulation [4], US regulation [5], and European regulation [6], were obtained, as shown in Table 4.

4.3. Comparison of the Results

The stiffness and their reduction coefficient at the mid-span position from different methods are compared in Figure 12 and Figure 13, respectively.
In Figure 12, it can be observed that the stiffness of the pre-stressed concrete T-beams remains nearly constant in the completely linear stage, as the beam body does not crack. However, the equivalent bending stiffness was higher than what was calculated using short-term formulas. As the beam entered the incomplete stage, the equivalent bending stiffness decreased rapidly due to gradual damage and continuous crack propagation. Equation (1) considers the entire beam as having a constant stiffness and replaces the actual stiffness with the average stiffness of the cracked beam. This leads to a calculated stiffness at the mid-span position that is higher than the actual value, as the stiffness of the entire beam is replaced by the stiffness at the mid-span position. This method fails to reflect the situation at the cracking section. In contrast, the short-term calculation method specific for damaged and cracked sections calculates the stiffness at the section where cracks occur. This approach accurately reflects the presence of cracks at specific sections. Therefore, compared to the equivalent stiffness method, the short-term calculation method is more reasonable for evaluating damaged and cracked sections.
Therefore, the calculation of short-term stiffness provides a more accurate evaluation of the stiffness value for a cracked beam. As the beam transitions into the non-linear stage, the stiffness decreases at a faster rate. To accurately predict the stiffness of the beam throughout the destructive process, including the complete, incomplete linear, and non-linear stages, a new method is proposed. The piecewise stiffness, back-calculated by system identification, is suggested as follows.

5. Back-Calculation of Piecewise Stiffness

5.1. System Identification Method

To accurately calculate the stiffness during the destructive process, the system identification method was utilized [22]. Based on this method, a beam piecewise stiffness back-calculation method, which relies on deflection values, was developed.
The basic procedure is shown in Figure 14. Specifically, it can be divided into the following steps:
(1)
Apply the load to the actual beam, and measure the deflections of the beam with known load values.
(2)
Establish a mechanical model of the beam, for which the finite element model was adopted. Input the piecewise seed moduli and the load in step (1), and the calculated deflections can be obtained at the same position as the measured deflections.
(3)
According to the parameter adjustment algorithm, the input moduli of the model will be gradually adjusted, aimed at matching the calculated deflection to the measured deflection. The adjusted moduli will be accepted until the errors between the calculated deflections and measured deflections reach an acceptable range.
The moduli adjustment algorithm is a sensitivity analysis method, expressed as follows:
[ F ] { Δ E } = { e }
F = W 1 E 1 W 1 E 2 W 1 E n W 2 E 1 W 2 F 2 W 2 E n W m E 1 W m E 2 W m E n
where W is the calculated deflection, E is the modulus of each section, m is the number of deflection observation points (it is 11 in this case), and n is the number of segments in the beam (it is 1 in Case 1, it is 2 in Case 2, and it is 3 in Case 3).

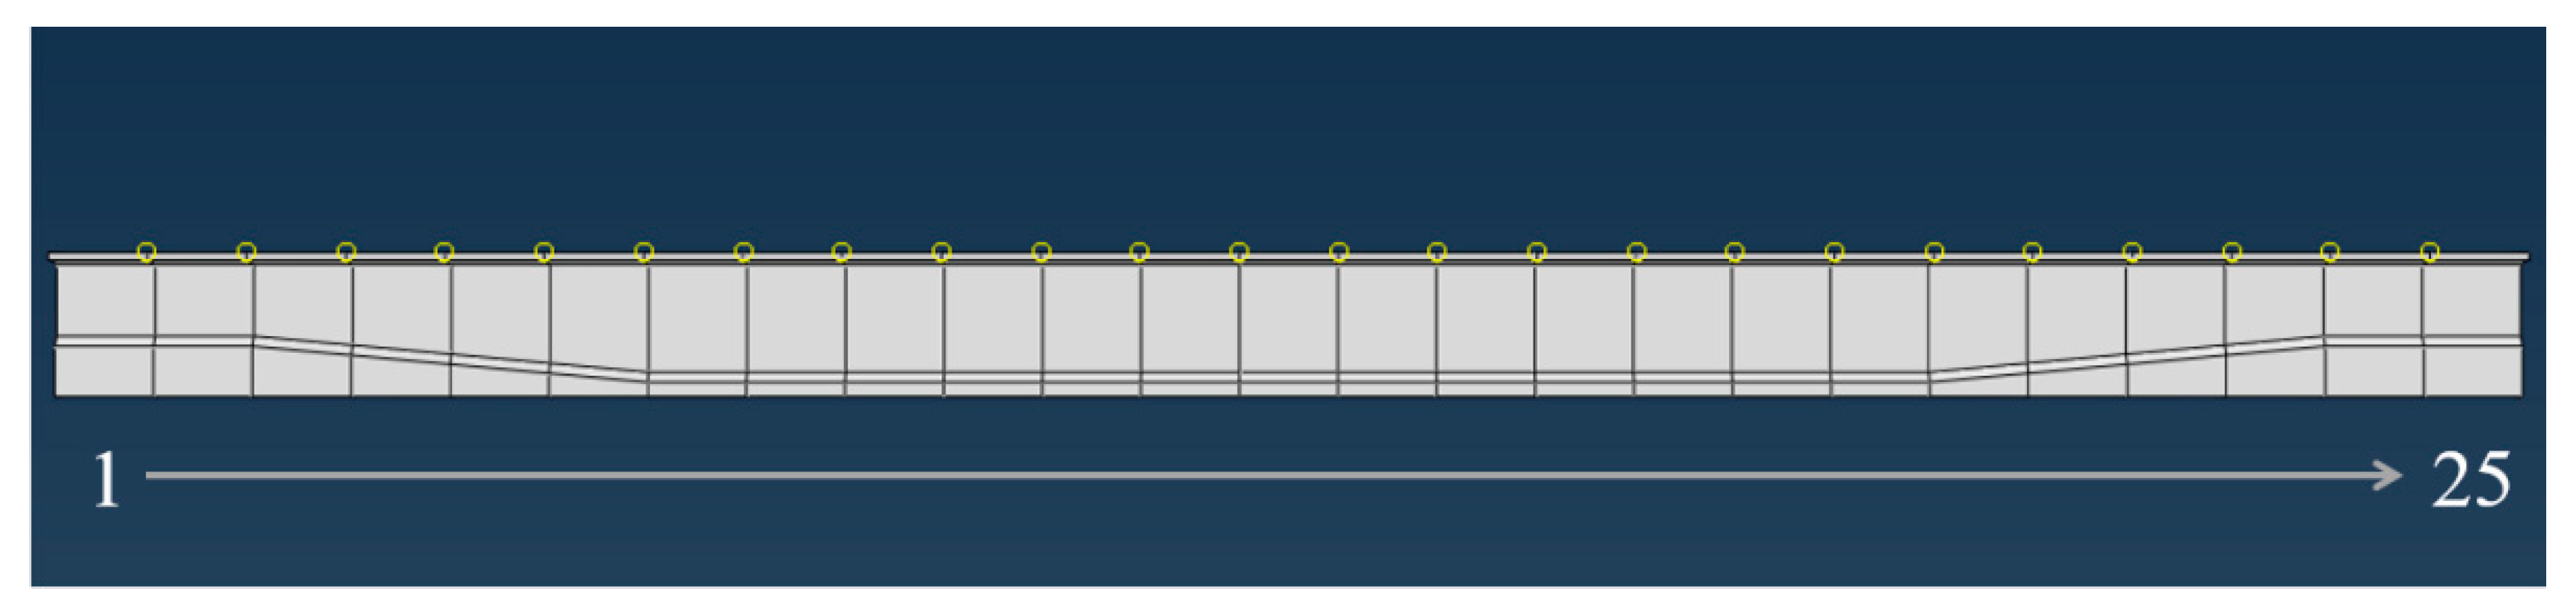
5.2. Segmented Stiffness Inverse Calculation Method

During the process of the bridge bearing external loads, as the load value increases, cracks will first appear in the tension zone of the midsection of the beam. With the continuous increase in the load value, the cracks will continue to develop towards both sides and the top of the beam, showing a situation where the midsection of the beam cracks more severely than the weaker sides, as shown in Figure 15. At the locations where cracks occur, the flexural stiffness of the beam will weaken to a certain extent, and the degree of weakening tends to be positively correlated with the cracking situation of the beam [23]. For ease of calculating the structural deflection after cracking, the degree of reduction in the flexural stiffness of the beam within the cracked region is divided into segments based on the extent of crack propagation, resulting in a stepped distribution of flexural stiffness along the longitudinal direction of the beam, as shown in Figure 16.
For the deflection analysis of a beam with variable stiffness, the deflection formula for each segment can be obtained through combining the segmented integration deflection formula with system identification theory to reverse the segmented flexural stiffness of the beam, resulting in the variation in stiffness values along the longitudinal direction of the beam. For example, dividing the beam into five segments based on Figure 16, the deflection formula can be obtained through the segmented integration method, as shown in Equations (5)–(7).
w ( x ) = 0 x 0 x M ( x ) B 0 d x d x 0 < x < l
w ( x ) = 0 l 0 l M ( x ) B 0 d x d x + 1 x 1 x M ( x ) B c r 1 d x d x l < x < 2 l
w ( x ) = 0 l 0 l M ( x ) B 0 d x d x + l 2 l l 2 l M ( x ) B c r 1 d x d x + 2 l x 2 l x M ( x ) B c r 2 d x d x 2 l < x < 3 l
The finite element forward model with beam elements was used. The beam was divided into 25 elements, as shown in Figure 17. Three working conditions are shown in Table 5.

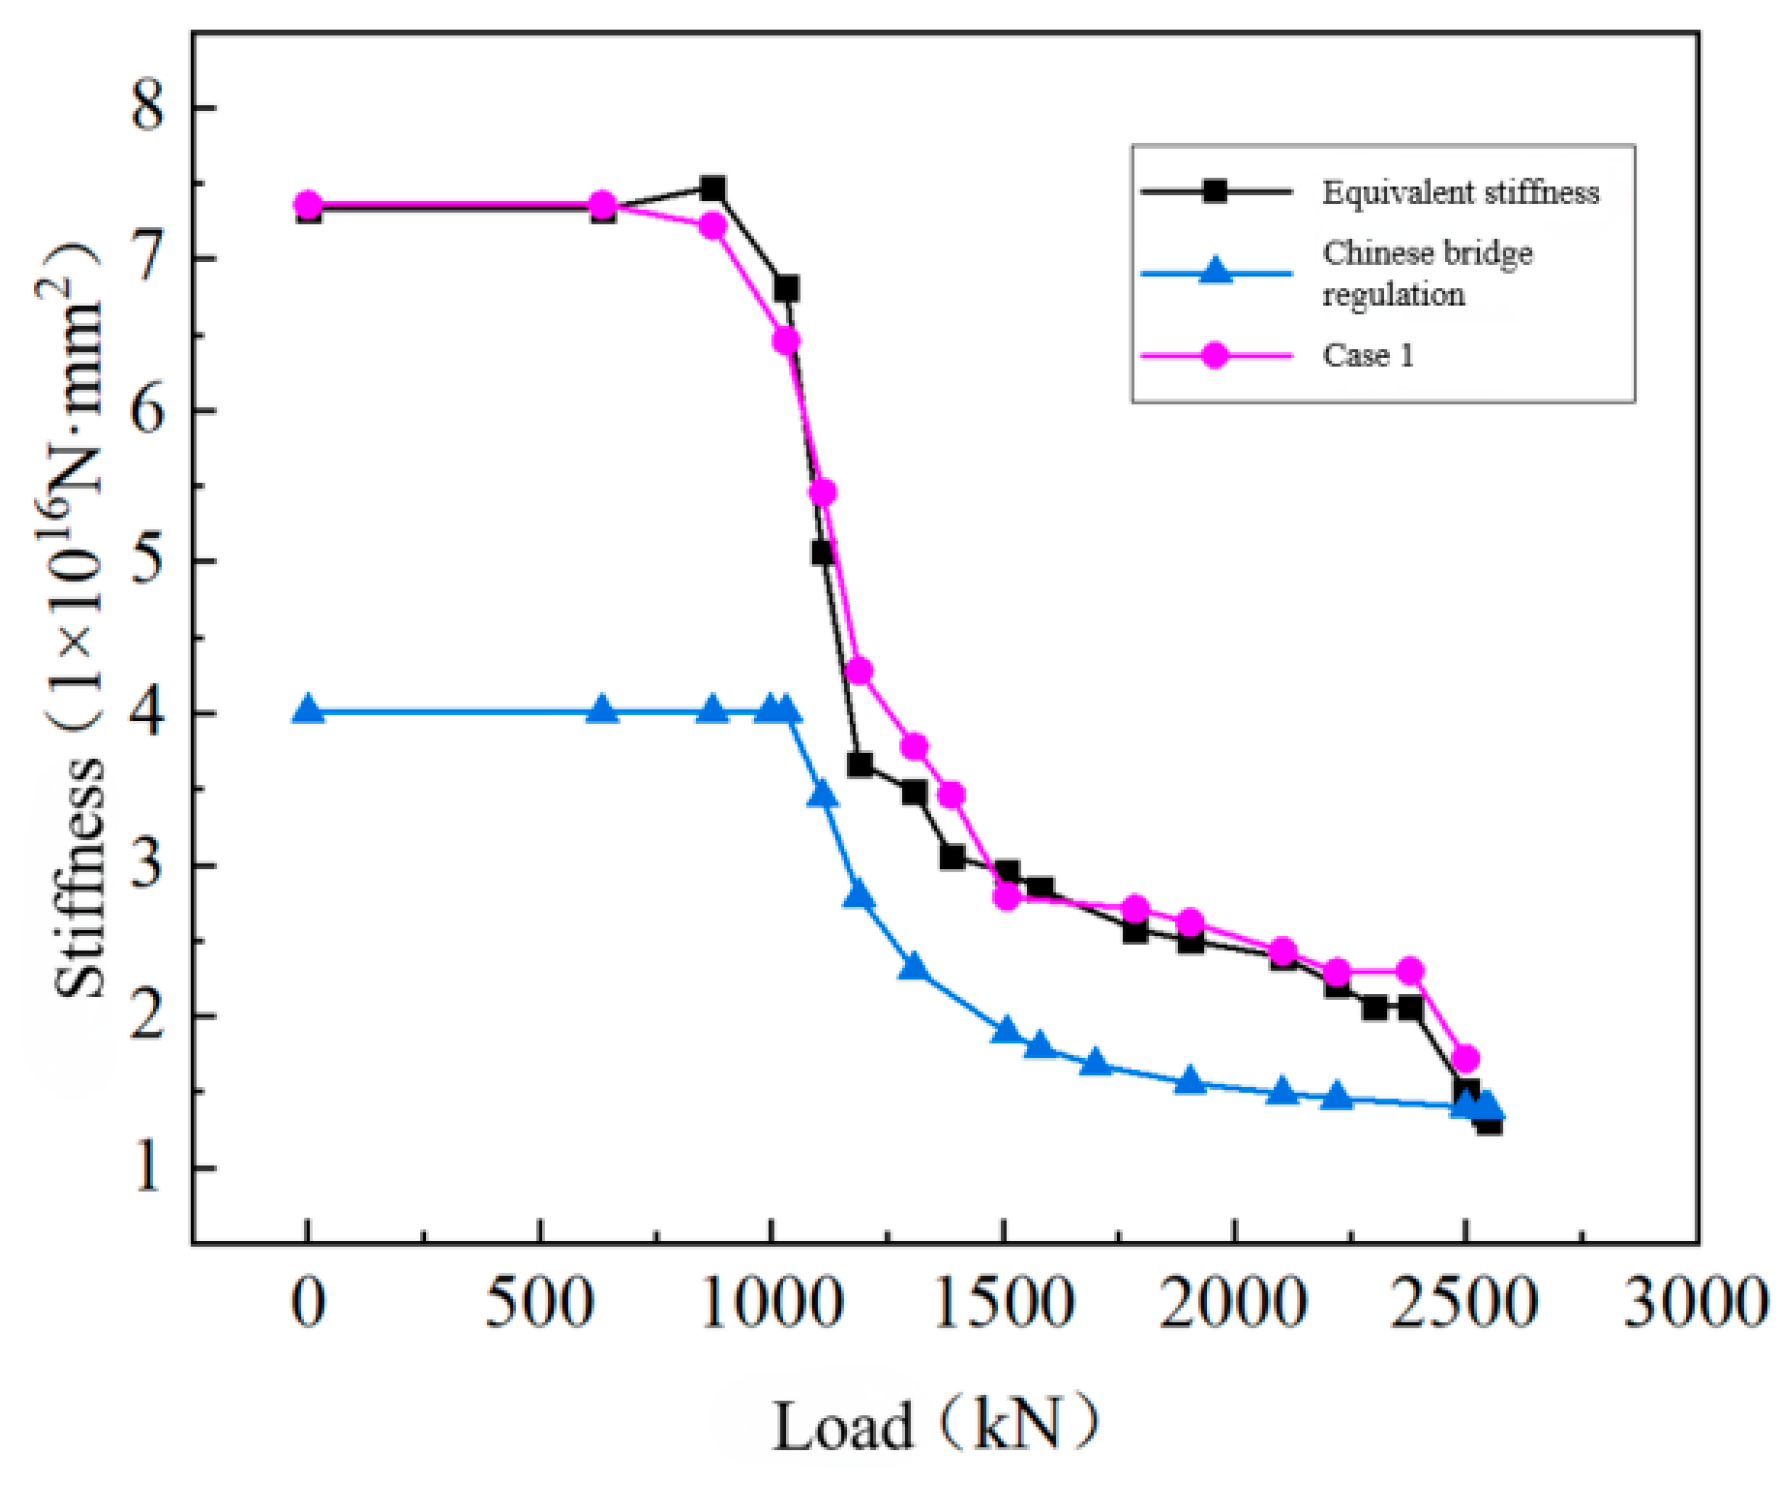
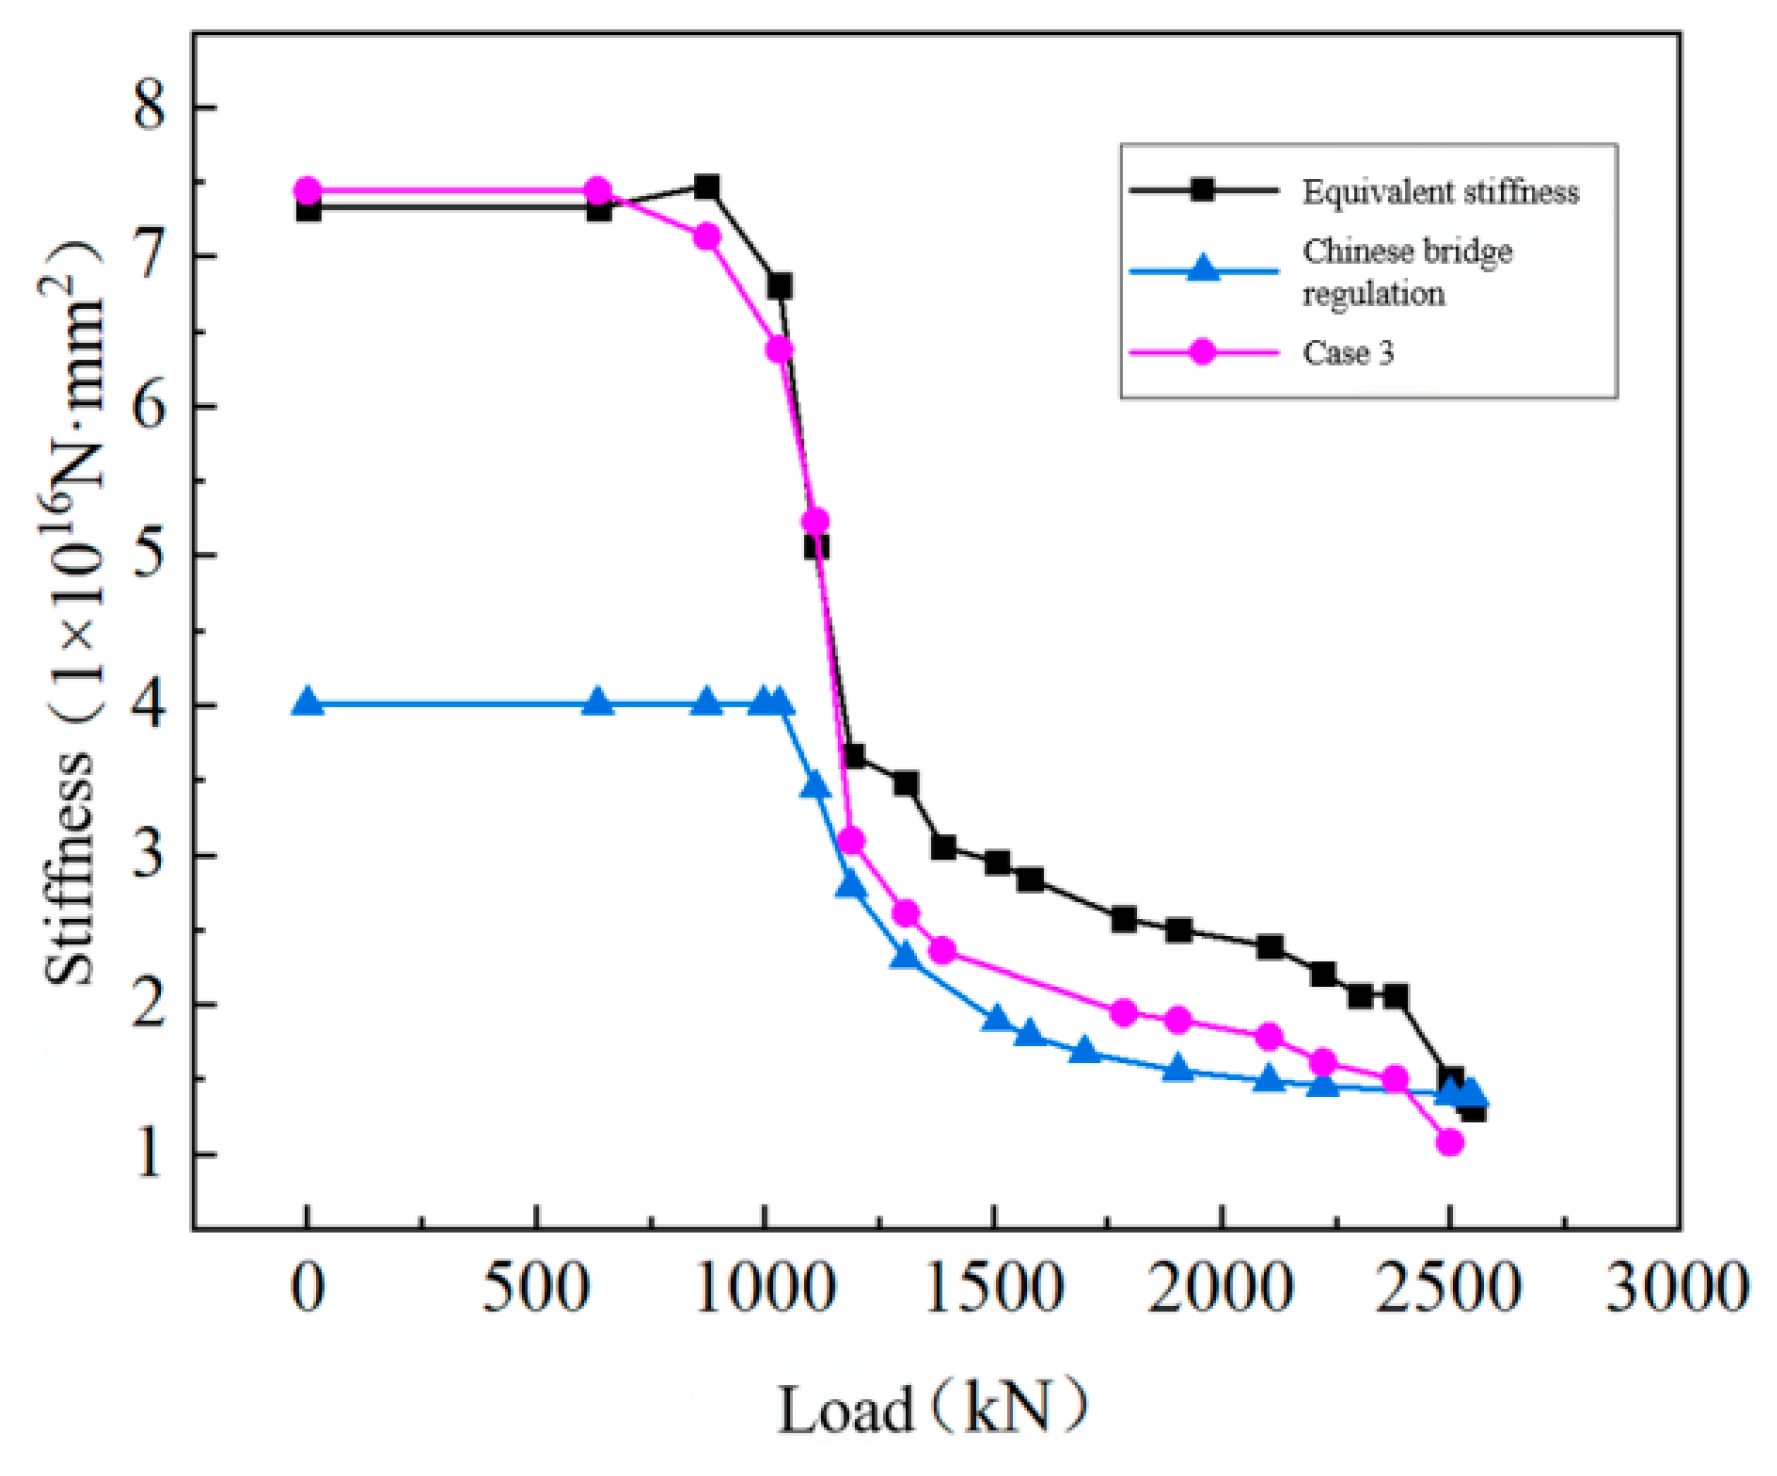
5.3. Comparison of the Calculation Results

Once the modulus of a section has been back-calculated, the bending stiffness of each element can be determined by combining the inertia moment and dimension at mid-span. This allows for the calculation of the back-calculated bending stiffness in the mid-span position under various load levels and three different working condition cases. The bending stiffness obtained from these three cases iswas compared to the equivalent values and those calculated using Chinese bridge regulations, as shown in Figure 18, Figure 19 and Figure 20.
According to Figure 17, it can be observed that the back-calculation results in Case 1 are highly consistent with the equivalent values, with the average percentage error between the two numerical curves being 3.67%. This is because the entire bridge is considered as a single modulus for back-calculation. The equivalent stiffness method only uses mid-span deflection to calculate the stiffness, while the system identification method uses multiple point deflections to back-calculate the stiffness. These two methods are essentially similar. In Case 2, the entire beam is divided into two sections, and the results shown in Figure 18 are only for the first section, which includes the mid-span position. According to Figure 18, the back-calculated results are also very close to the equivalent values, with the average percentage error between the two numerical curves being 2.44%. The principle behind this approach is similar to that used in Case 1.
The back-calculated results shown in Figure 19 are for the second section, which includes the mid-span position. As illustrated in Figure 19, it can be observed that the back-calculation results are close to the equivalent values in the complete linear stage. However, when the load level reaches 1030 kN (crack initiation), as the load level increases, the back-calculation value appears to be lower than the equivalent value, and gradually approaches the value calculated from short-term stiffness. As the beam enters the non-linear stage, the back-calculation program can more accurately simulate the decrease in stiffness after yielding when compared to the short-term values.
In Case 3, the back-calculated results are for the second section, which includes the mid-span position. However, the length of the second section defined in Case 3 is not adjusted as the cracks develop towards the two ends of the beam. During the early stages of crack development, the actual length of the damaged section is smaller than that defined in Case 3. As the load increases, the cracks continue to expand towards the beam ends, and the actual length of the damaged section gradually approaches the defined value.
Based on the above analysis, we can conclude that, using a system identification-based segmented stiffness reverse calculation method, the segment length corresponding to the stiffness inversion area is set as the actual length of crack propagation, which can more accurately depict the changes in the stiffness of each segment section of the 50 m T-beam during the entire failure process.

6. Conclusions

After analyzing the changes in stiffness during a destructive test based on three methods, including equivalent stiffness, short-term stiffness, and the back-calculated piecewise stiffness from system identification, some conclusions can be drawn, which are as follows:
  • Before crack initiation, the stiffness remains constant. However, during the early stage of crack extension, the stiffness of the T-beam in the crack region decreases significantly. At this point, the stiffness of this area decreased by 31% compared to the initial value. As the crack continues to extend, the stiffness will gradually decrease until the beam ultimately fails or the steel undergoes tensile yielding.
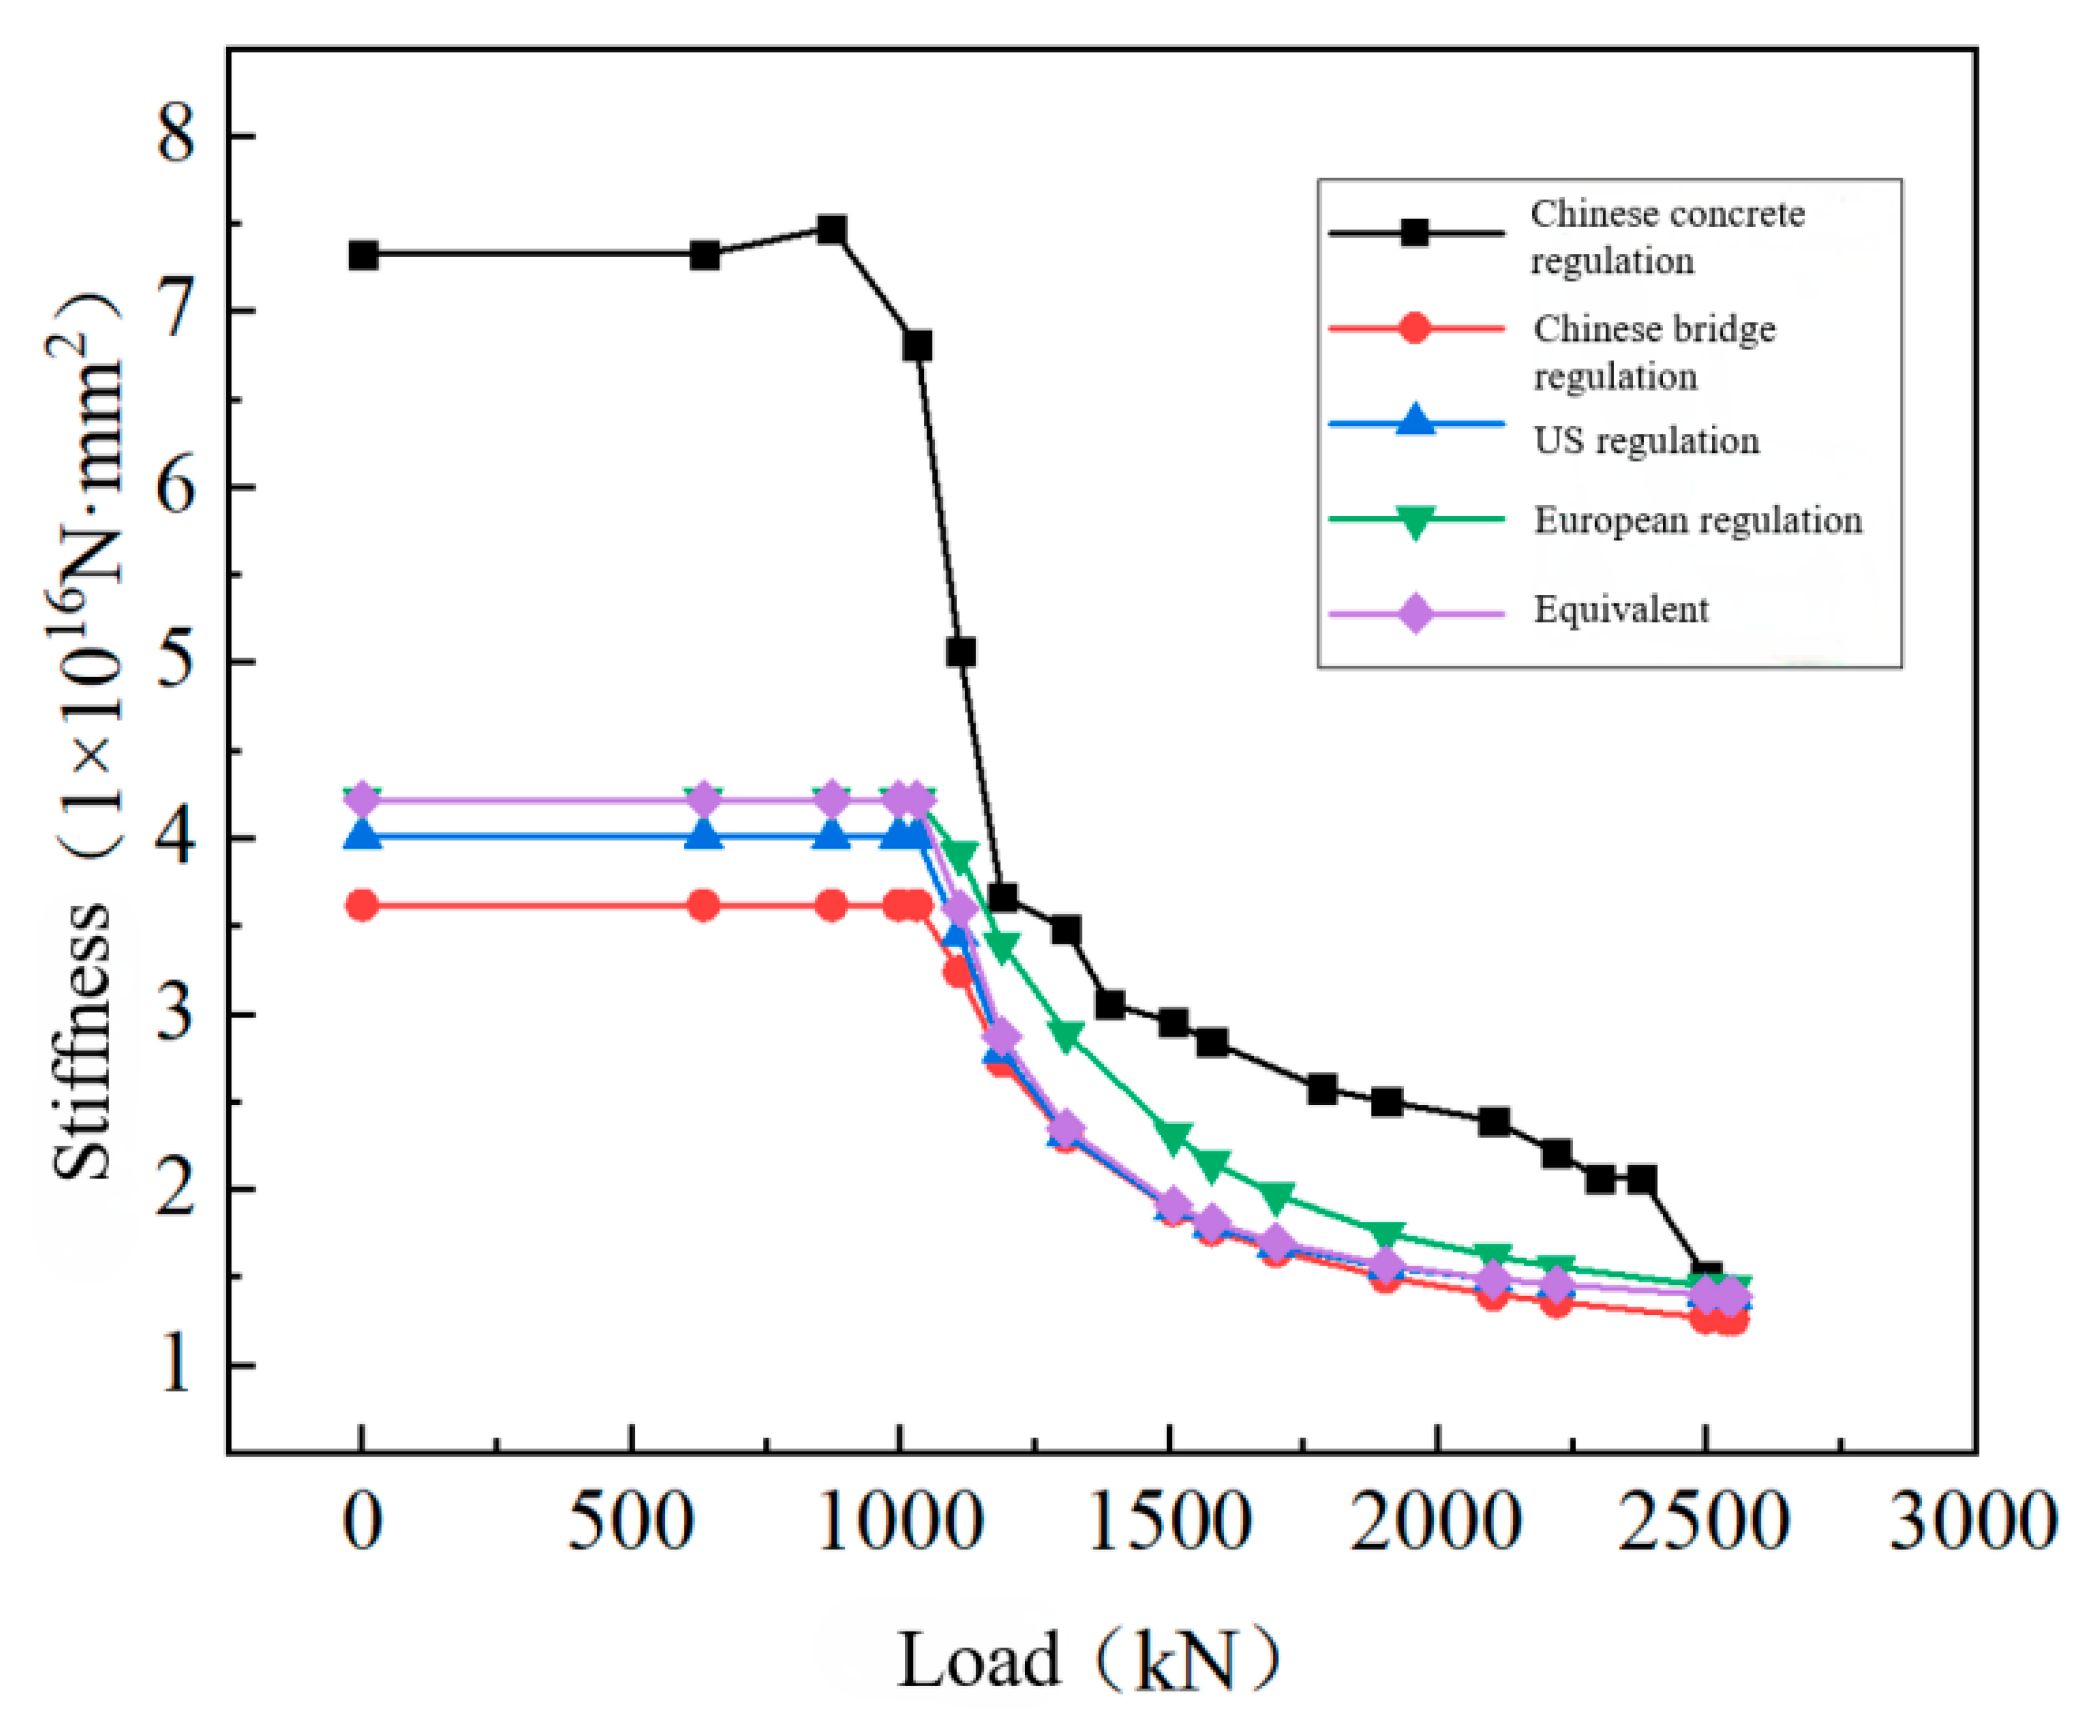
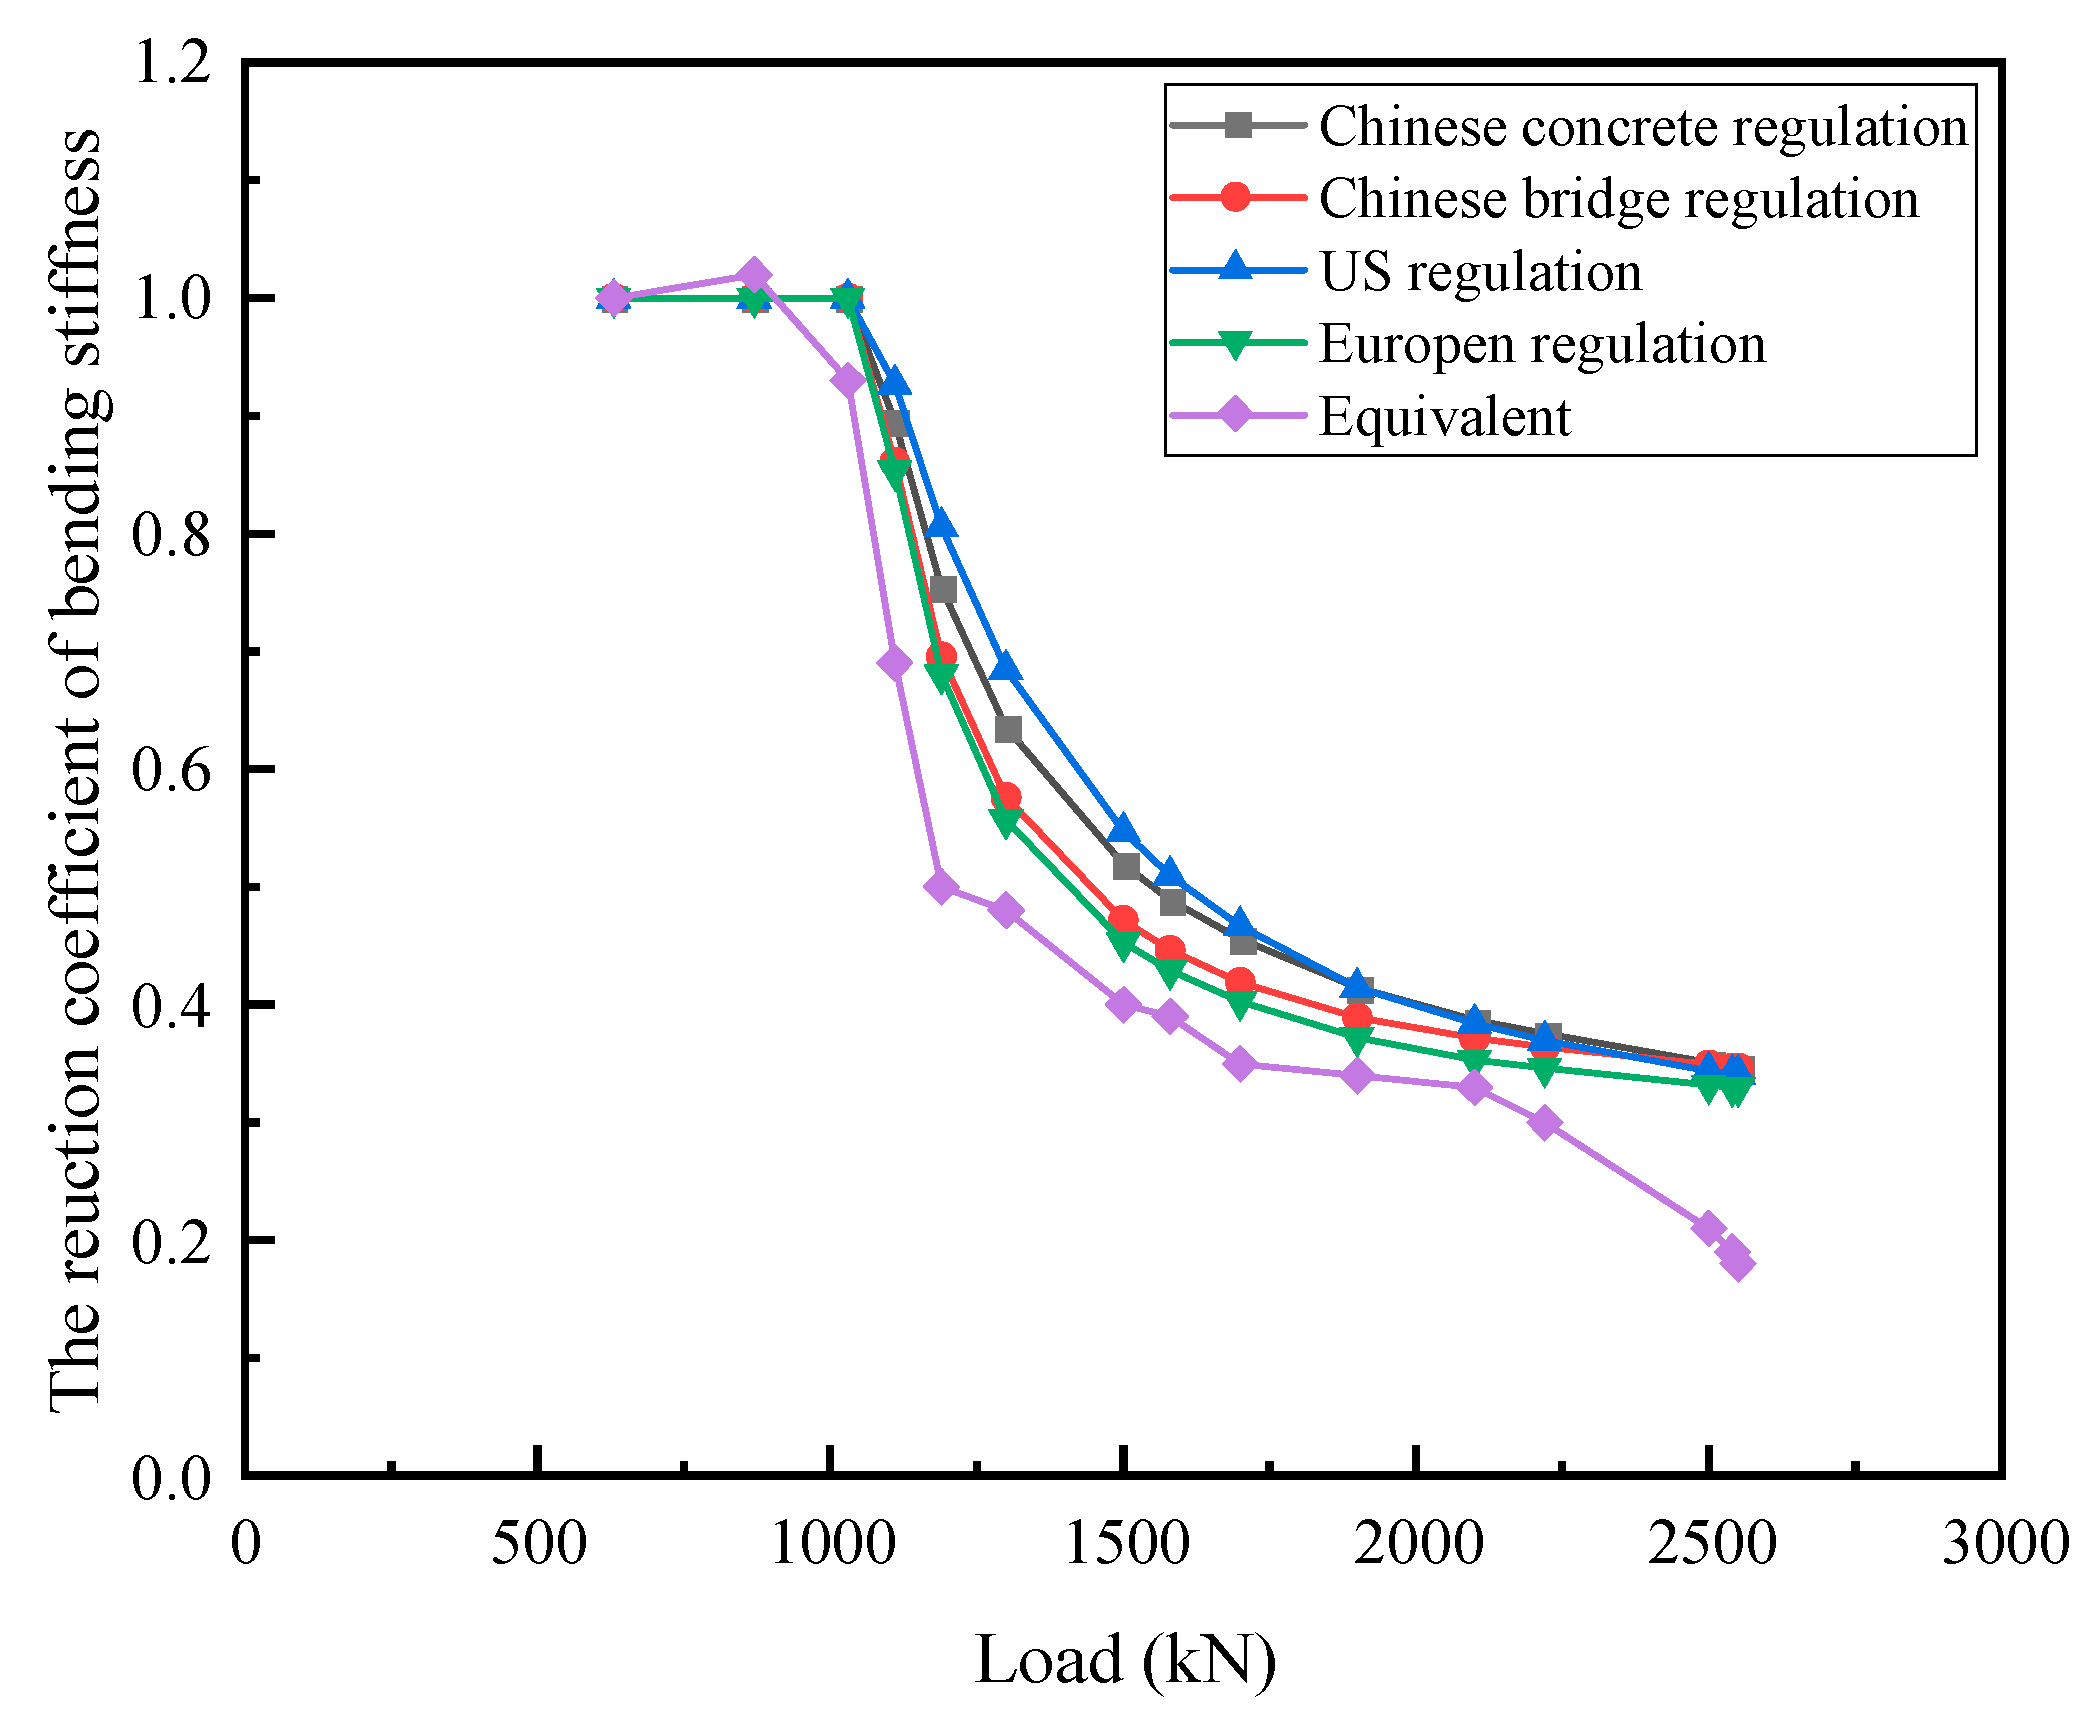
  • By comparing different standards and experimental data, we identified the applicable scope of different methods. When considering the beam as a whole, it is reasonable to use the equivalent stiffness as its overall stiffness before cracks form in the prefabricated concrete T-beam. Calculating the short-term stiffness of the mid-span section according to the specific code can effectively reflect the damage situation of the cracked section and is more suitable for the non-linear stage.
  • The segmented stiffness prediction method based on system identification predicts the stiffness of T-beams by using multipoint deflection back-calculation. The stiffness obtained by segmented reverse prediction can effectively reflect the damage state of each segmented section throughout the entire failure test process. This method provides valuable insights into the extent of damage in each segment and helps to evaluate the overall structural integrity of the beam.

Author Contributions

Writing—original draft, B.H. (Bin Hu); Writing—review & editing, W.W. and B.H. (Baixue He); Supervision, H.L.; Project administration, Y.C. All authors have read and agreed to the published version of the manuscript.

Funding

This research received no external funding.

Data Availability Statement

The data that support the findings of this study are available from the corresponding author upon reasonable request.

Conflicts of Interest

Authors Bin Hu was employed by the company China Construction Seventh Engineering Bureau Co., Ltd. The other authors declare that they have no known competing financial interests or personal relationships that could have appeared to influence the work reported in this paper.

References

  1. He, S.H.; Zhao, X.M.; Ma, J.; Zhao, Y.; Qi, X.Z. Review of highway bridge inspection and condition assessment. China J. Highw. Transp. 2017, 30, 63. [Google Scholar]
  2. Guo, Z.; Shi, X. Principles and Analysis of Reinforced Concrete; Tsinghua University Press Co., Ltd.: Beijing, China, 2003. [Google Scholar]
  3. GB 50010Ministry of Housing and Urban Rural Development of the People’s Republic of China—2010 Code for Design of Concrete Structures, China Construction Industry Press: Beijing, China, 2011.
  4. JTG G 3362; Ministry of Communications of the PRC—2018 Design Code for Reinforced Concrete and Prestressed Concrete Bridges and Culverts on Highways. People’s Communications Publishing House: Beijing, China, 2018.
  5. Institute A C. ACI 318-11; Building Code Requirements for Structural Concrete and Commentary. ACI Committee Institute: Farmington Hills, MI, USA, 2011.
  6. Standardization E C F. EN 1992-1-1:2004 Eurocode 2; Design of Concrete Structures-Part 1-1: General Rules and Rules for Buildings. European Committee for Standardization: Brussels, Belgium, 2004.
  7. Hu, Z.; Wang, Y.; Hu, Z.; Liu, C.; Dai, T. Test Study of Flexural Stiffness of Prestressed Concrete Beams with Cracks. Bridge Constr. 2012, 42, 37–43. [Google Scholar]
  8. Ismail, Z.; Kuan, K.K.; Yee, K.S.; Chao, O.Z. Examining the trend in loss of flexural stiffness of simply supported RC beams with various crack severity using model updating. Measurement 2014, 50, 43–49. [Google Scholar] [CrossRef]
  9. Ye, J.; Zhang, F. Stiffness degeneration model of prestressed concrete continuous box girder after cracking. China J. Highw. Transp. 2007, 20, 67. [Google Scholar]
  10. Xu, X.; Zhang, F.; Wei, C. Stiffness damage assement of prestressed concrete box-girder after cracking. Eng. Mech. 2015, 32, 95–102. [Google Scholar]
  11. Du, J.; Liu, X. Calculation of deflection and crack width in unbonded partially prestressed concrete beams. China J. Highw. Transp. 2000, 13, 70. [Google Scholar]
  12. Zhang, Z.; Gu, S. Calculation of effective stiffness after cracking of reinforced concrete beams. Tianjin Constr. Sci. Technol. 2022, 32, 25–30. [Google Scholar]
  13. Du, J.; Wang, J.; Wei, J.; Li, Y.; Niu, H. Methods for calculating cracking moment and flexural stiffness of recycled concrete beams. China J. Highw. Transp. 2019, 32, 93. [Google Scholar]
  14. Du, M.; Su, X. Stiffness unity of concrete beams considering tensile strain lagging of prestressing tendons. J. Huazhong Univ. Sci. Technol. (Nat. Sci. Ed.) 2017, 45, 45–50. [Google Scholar]
  15. Zhou, Y.; Wang, Y.Y. Calculation Method on Flexural Stiffness of Reinforced Concrete Short Beam Strengthened by CFRP. China Civ. Eng. J. 2020, 53, 9–20. [Google Scholar]
  16. Wang, C.; Wang, S.; Zhao, T.; Duan, L.; Wang, X. Flexural behavior tests of full-scale concrete T girders with steel-UHPFRC composite strengthening. J. Chang. Univ. (Nat. Sci. Ed.) 2018, 38, 117–126. [Google Scholar]
  17. Yu, Z.; He, S.; Ren, L.; Liu, D. Research on Residual Bearing Capacity Calculation Method and Changing Law of Damaged Prestressed Concrete Box Girder. China J. Highw. Transp. 2021, 34, 242. [Google Scholar]
  18. Wang, C.; Shen, Y.; Zou, Y.; Li, T.; Feng, X. Stiffness degradation characteristics destructive testing and finite-element analysis of prestressed concrete t-beam. Comput. Model. Eng. Sci. 2018, 114, 75–93. [Google Scholar]
  19. A Review of Academic Research on Bridge Engineering in China, 2021. J. China Highw. 2021, 34, 1–97.
  20. JTG D60-2004; General Specifications for Design of Highway Bridges and Culverts. Ministry of Transport of the People’s Republic of China: Beijing, China, 2015.
  21. CJJ 11-2011; Code for Design of Urban Bridges. Ministry of Housing and Urban Rural Development of the People’s Republic of China: Beijing, China, 2012.
  22. Deng, M.; Xu, J.; Zhao, B. System identification method for reinforced concrete beam structure status. J. Zhengzhou Univ. Light Ind. 2004, 2, 34–36. [Google Scholar]
  23. Yao, H. Analysis of the Full-Scale Static and Dynamic Stiffness Test Process of Precast Prestressed Concrete Box Girders. Ph.D. Thesis, Chang’an University, Changan, China, 2020. [Google Scholar]
Figure 1. Beam elevation view (m).
Applsci 14 05200 g001
Figure 2. Cross-sectional view of different positions of the beam body (m).
Applsci 14 05200 g002
Figure 3. Layout of pre-stress bundles at different sections (m).
Applsci 14 05200 g003
Figure 4. Elevation view of the loading device.
Applsci 14 05200 g004
Figure 5. Cross-section view of the loading device.
Applsci 14 05200 g005
Figure 6. Cross-section layout of the T-beam deflection measurement points (m).
Applsci 14 05200 g006
Figure 7. The loading scene diagram of the T-beam.
Applsci 14 05200 g007
Figure 8. Loading flow chart of the T-beam destructive test.
Applsci 14 05200 g008
Figure 9. Experimental site beam crack diagram.
Applsci 14 05200 g009
Figure 10. Load–deflection curves along the length of the beam.
Applsci 14 05200 g010
Figure 11. Load-deflection curve at the mid-span position of the T-beam.
Applsci 14 05200 g011
Figure 12. Comparison of the stiffness values at the mid-span position using different methods.
Applsci 14 05200 g012
Figure 13. The reduction coefficient of the stiffness at the mid-span position using different methods.
Applsci 14 05200 g013
Figure 14. Basic procedure of the system identification method.
Applsci 14 05200 g014
Figure 15. Diagram of a beam crack.
Applsci 14 05200 g015
Figure 16. Schematic diagram of the stepped flexural stiffness after beam cracking.
Applsci 14 05200 g016
Figure 17. Beam elements’ division diagram.
Applsci 14 05200 g017
Figure 18. Comparison of stiffness in Case 1.
Applsci 14 05200 g018
Figure 19. Comparison of stiffness from the first section in Case 2.
Applsci 14 05200 g019
Figure 20. Comparison of stiffness from the second section in Case 3.
Applsci 14 05200 g020
Table 1. Loading process table for the T-beams.
Loading StepsNumber of Loading CyclesValue at the End of Each Loading (kN)Loading Description
1/0Self-weight
2/315Preloading in three stages
316300–315: Single loading; 315–630: About 100 kN per stage
5210300–630: About 300 kN per stage; 630–800: About 100 kN per stage;
800–Cracking: About 800 kN per stage
6311100–630: About 300 kN per stage; 630–1110: About 100 kN per stage
7411900–630: About 300 kN per stage; 630–1190: About 100 kN per stage
8513000–917: About 300 kN per stage; 917–1300: About 100 kN per stage
10515000–917: About 300 kN per stage; 917–1500: About 100 kN per stage
11715800–1190: About 300 kN per stage; 1190–1580: About 100 kN per stage
12817000–1500: About 300 kN per stage; 1508–1700: About 100 kN per stage
14919000–1780: About 300 kN per stage; 1780–1900: About 100 kN per stage
161021000–1780: About 300 kN per stage; 1780–2100: About 100 kN per stage
171122200–2100: About 300 kN per stage; 2100–2220: About 100 kN per stage
201225000–2100: About 300 kN per stage; 2100-Steel reinforcement yield: About 80 kN per stage;
Steel reinforcement yield–2500: About 40 kN per stage
211325400–2100: About 300 kN per stage; 2100–2300: About 100 kN per stage;
2300–2500: About 80 kN per stage; 2500–2540: About 40 kN per stage
221425500–2100: About 300 kN per stage; 2100–2300: About 100 kN per stage;
2300–2500: About 80 kN per stage; 2500–2540: About 40 kN per stage;
2550–Failure of T-beam
Table 2. Loading efficiency.
Design Bending Moment (kN·m)Experimental Bending Moment (kN·m)Loading Efficiency
Experimental T-beam7594.57746.41.02
Table 3. The equivalent stiffness and its reduction coefficient at the mid-span position.
Load (kN)Deflection (mm)Stiffness
(1 × 10¹⁶ N·mm2)
Reduction Coefficient
630−20.827.331.00
870−28.187.471.02
1030−36.626.810.93
1110−53.035.070.69
1190−78.523.670.50
1300−90.293.490.48
1500−122.952.950.40
1580−134.632.840.39
1700−167.242.580.35
1900−183.852.500.34
2100−212.542.390.33
2220−243.472.210.30
2300−269.442.070.28
2500−401.331.510.21
2540−452.241.360.19
2550−473.281.300.18
Table 4. The short-term stiffness and their reduction coefficients at the mid-span position.
Load
(kN)
Short-Term Bending Stiffness (1016 N·mm2)Reduction Coefficients
Ref. [3]Ref. [4]Ref. [5]Ref. [6]Ref. [3]Ref. [4]Ref. [5]Ref. [6]
6303.624.014.224.221.001.001.001.00
8703.624.014.224.221.001.001.001.00
10303.624.014.224.221.001.001.001.00
11103.243.453.913.600.900.860.930.85
11902.732.793.402.870.750.700.810.68
13002.302.312.892.350.640.580.680.56
15001.881.892.311.910.520.470.550.45
15801.771.792.151.810.490.450.510.43
17001.651.681.971.700.460.420.470.40
19001.501.561.751.570.410.390.410.37
21001.401.491.621.490.390.370.380.35
22201.361.461.561.460.380.360.370.35
25001.271.401.451.400.350.350.340.33
25401.261.391.441.390.350.350.340.33
25501.261.391.441.390.350.350.340.33
Table 5. Calculation conditions.
Condition CategoryDescription
Case1Considering the beam as a whole, the entire beam has the same modulus.
Case2Divide the beam into two sections, with units 1–13 as the first section including mid-span and elements 14–25 as the second section. During the back-calculation, output two moduli of each section separately.
Case3Divide the beam into three sections, with elements 1–8 as the first section, elements 9–17 as the second section, and elements 18–25 as the third one. During the back-calculation, output three moduli of each section separately.
Disclaimer/Publisher’s Note: The statements, opinions and data contained in all publications are solely those of the individual author(s) and contributor(s) and not of MDPI and/or the editor(s). MDPI and/or the editor(s) disclaim responsibility for any injury to people or property resulting from any ideas, methods, instructions or products referred to in the content.

