Article

Research on a Multi-Dimensional Indicator Assessment Model for Evaluating Landslide Risk near Large Alpine Reservoirs

by
Hanyin Hu
1,
Hu Ke
1,
Xinyao Zhang
2 and
Jianbo Yi
2,*
1
Dadu River Basin Reservoirs and Dams Management Center of China National Energy, Chengdu 610095, China
2
School of Mechanical and Electrical Engineering, University of Electronic Science and Technology of China, Chengdu 611731, China
*
Author to whom correspondence should be addressed.
Appl. Sci. 2024, 14(12), 5201; https://doi.org/10.3390/app14125201
Submission received: 29 April 2024 / Revised: 5 June 2024 / Accepted: 14 June 2024 / Published: 14 June 2024

Abstract

:
Geological disasters in large alpine reservoirs primarily take the form of landslide occurrences and are predominantly induced by slope instability. Presently, risk monitoring and assessment strategies tend to prioritize sudden alerts overlooking progressive trajectories from the onset of creeping deformations within the slope to its critical state preceding landslides. Hence, analyzing landslide safety risks over time demonstrates a significant degree of hysteresis, highlighting the necessity for a comprehensive approach to risk assessment that encompasses both gradual and sudden precursors to landslide events. This study analyzes the factors affecting slope stability and establishes a slope evaluation indicator system that includes terrain morphology, meteorological conditions, the ecological environment, soil conditions, human activity, and external manifestation. It proposes a quantitative model for slope landslide risk assessment based on a fuzzy broad learning system, aiming to accurately assess slopes with different risk levels. The overall assessment accuracy rate reaches 92.08%. This multi-dimensional risk assessment model provides long-term monitoring of slope conditions and scientific guidance on landslide risk management and disaster prevention and mitigation on a long time scale for risky slopes in reservoir areas.

1. Introduction

Over the past two decades, China has witnessed a significant surge in hydropower development, marked by a relentless expansion in both the scale and installed capacity of hydropower projects. Concurrently, the sites designated for hydropower stations have increasingly shifted to precarious terrain, characterized by intricate topographies and heightened geological complexities. Consequently, an imperative has arisen for the continuous enhancement of landslide prevention and geohazard management protocols within the watersheds associated with hydropower installations. The slopes of the large alpine reservoir area in the Dadu River Basin, as discussed in this paper, are situated in the transition zone from the southeastern edge of the Qinghai–Tibet Plateau to the western edge of the Sichuan Basin. This region is characterized by complex topography, crisscrossing canyons, steep terrain, and harsh, variable weather conditions. These factors contribute to a fragile slope ecology and the presence of numerous factors detrimental to slope stability, leading to frequent landslide disasters. In October 2020, the Zhengjiaping landslide at the Dagangshan Hydropower Station in the upper middle reaches of the Dadu River caused a 2000-cubic-meter landslide, resulting in significant economic losses at the station. A landslide event occurred in September 2022 on the Bay East River of the Dadu River Basin, severely impacting two villages and four hydropower plants downstream.
Landslide disasters seriously affect the stable operation and power generation benefits of hydropower stations and increase the safety hazards for staff in reservoir areas and nearby residents. Therefore, an accurate assessment of landslide risk in reservoir areas is crucial for maintaining the safety and efficiency of hydropower plants.
The authors of [1] adopted a GPS high-precision positioning system to construct a real-time online dynamic slope monitoring system, with timely and accurate slope status monitoring and reliable data support for dynamic slope management. The authors of [2] applied a small baseline subset interferometric synthetic aperture radar to analyze slope deformation in the reservoir area of the Wudongde Hydropower Station. Their study correlated soil water content and reservoir water levels to understand slope stability, providing a valuable reference for slope stability analysis in a hydropower station’s reservoir area. The authors of [3] employed multiple statistical indicators and interferometric synthetic aperture radar to conduct an accurate landslide risk assessment in Shenzhen. Their results provided technical and data support for landslide disaster prevention in this region. The authors of [4] proposed a landslide deformation monitoring method fusing terrestrial laser scanning and unmanned aerial vehicle photogrammetry, suitable for complex terrain conditions with access restrictions and blind areas.
The above risk assessments of landslides have primarily focused on sudden changes caused by slope instability, but there are still deficiencies in monitoring the gradual and progressive processes of slopes, from creeping deformation to the critical state of landslides. This leads to a lag in analyzing the safety risk changes of landslide hazards and fails to provide long-term or effective support for landslide risk management decision making.
The authors of [5] used the XGBoost algorithm to analyze 24 landslide impact factors and identified distance to roads, slope length, and lithology as the primary causative factors in urban areas, all of which increase the probability of landslide occurrence by about 10% compared with a single impact variable. The authors of [6] selected nine factors to predict the sensitivity of slope landslides and combined them with ArcGIS technology to make a dynamic risk assessment of the monitoring area. The authors of [7] evaluated landslide danger and susceptibility using twelve hazard factors and nine vulnerable evaluation factors.
The above literature lacks a selection of landslide impact factors for hydropower station reservoir slopes based on multiple indicators; therefore, this study will construct a multi-dimensional slope landslide assessment indicator system in a reservoir area, comprehensively capturing overall dynamic changes in slopes; establishing a more accurate quantitative model for slope landslide risk assessment; and providing scientific guidance for long-term slope risk management.
According to the Landslide Hazard and Risk Assessment document published by the United Nations Office for Disaster Risk Reduction in 2017, slopes are categorized into four risk levels: attention, warning, alert, and alarm. Reservoir slopes at the attention risk level are currently in a stable condition and are not expected to experience landslides for an extended period. The warning level indicates that slopes are likely to experience landslides within a few months and need to be emphasized and monitored more intensively. The alert level indicates a high probability of landslides occurring within a few days or months; warning messages need to be issued periodically to remind staff in the reservoir area and nearby residents to prepare for early evacuation. The alarm level indicates that a landslide is imminent, with the slope likely to slide in a few hours or days; it is necessary to issue a warning message to alert relevant individuals to take immediate measures to avoid danger. This study will determine key evaluation indicators for slope risk according to the above risk levels.
The succeeding sections will (i) construct a multi-dimensional evaluation indicator system; (ii) train a Fuzzy-BLS slope landslide risk assessment model; and (iii) apply this model to actual engineering cases to verify the accuracy of its risk assessments.

2. Modeling of a Multi-Dimensional Evaluation Indicator System

2.1. Basis and Selection of Evaluation Indicators

The authors of [8,9,10,11,12] demonstrated that terrain morphology, meteorological conditions, the ecological environment, and slope deformation indicators are key factors that must be considered in landslide risk assessment. Terrain morphology is the basic condition for landslides and determines the stability and bearing capacity of slopes [13]. It mainly includes the aspect, slope, curvature, and elevation, which are interrelated and interact with each other. Together, they determine the stability of slopes and the potential risk of landslides. At the same time, terrain morphology also affects the distribution of rainfall and the formation of surface runoff, which, in turn, has an impact on the stability of the slope.
Meteorological conditions are one of the key factors that induce landslides; according to statistics, up to 90% of landslide events are triggered by climatic factors, mainly through rainfall infiltration changing the physical and mechanical properties of the soil body and thus affecting the stability of the slope [14].
Precipitation that accumulates from 00:00 to 24:00 on the day of a landslide is considered daily precipitation. We selected precipitation statistics recorded on the dates of seven landslides (Figure 1a) and precipitation statistics recorded nine days before these events (Figure 1b) published by the China Meteorological Administration Library in 2021.
Figure 1a shows that half of the landslide disasters occurred when the daily precipitation was greater than 150 mm, demonstrating the significant effect of precipitation on landslide induction. When daily precipitation is in the range of 0–100 mm, the number of landslide disasters is positively correlated with daily precipitation. Figure 1b indicates continuous rainfall in the days preceding these landslides. For instance, in the case of the Cheongchi Dam landslide, the rainfall on the day of the occurrence was lower than that three days before the landslide event. This phenomenon can be attributed to the lag effect of rainfall on soil moisture content. Over time, continuous rainfall gradually softens the slope soil, reducing both soil shear strength and the angle of internal soil friction until they reach the landslide threshold. This process takes a certain amount of time, leading to landslides occurring because of the cumulative effect of rainfall over several preceding days.
Therefore, landslides often occur as a result of cumulative precipitation over the previous few days. According to the cumulative precipitation model proposed by Crozier, the correlation between three consecutive days of cumulative precipitation and landslide risk increases most rapidly, while the correlation between five consecutive days of cumulative precipitation and landslide risk peaks.
The meteorological condition of the slope is also an important aspect of stability. The root system of plants can reinforce the soil, and plants consume a lot of water through transpiration, reducing the scouring effect of groundwater on the soil. Therefore, the better the plant growth condition of the slope and the higher the vegetation coverage, the better the stability of the slope. The Normalized Difference Vegetation Index (NDVI) reflects the growth density and health of plants, with higher NDVI values indicating lusher plant growth and more developed root systems, which provide better soil anchoring. The Normalized Difference Water Index (NDWI) reflects the presence of a surface water body, with higher NDWI values implying a greater landslide risk on the slope.
The authors of [15,16] demonstrated that continuously monitoring soil moisture can significantly improve the accuracy of landslide risk assessment and the lead time for early warnings. In this study, we mainly focused on the in-depth monitoring of soil moisture through six indicators: soil bulk density, the angle of internal soil friction, soil shear strength, soil moisture content, the porosity ratio, and the Topographic Wetness Index.
The authors of [17,18] showed that human activities play a significant role in the risk assessment of slope landslides in large mountainous hydropower station reservoir areas, mainly reflected in the effect of reservoir water levels on slopes. The kinetic effects caused by cyclical changes in water levels in a reservoir area will concentrate soil shear strength within the soil body and reduce the porosity ratio and soil shear strength. This will cause the slope body to deform continuously and increase the potential risk of slope instability.
Slope deformation is a direct reflection of changes in the internal geologic stress state of the slope, and landslide hazards can be visualized through surface deformation. When the degree of slope deformation progressively increases, the geological stresses in the slope will continuously adjust, causing the shear strength to decrease. Landslides occur when the stress required for sliding exceeds the ultimate shear strength of the soil.
In summary, this study systematically analyzed various factors affecting slope stability across multiple temporal scales and geospatial dimensions. Consequently, a comprehensive slope landslide risk evaluation indicator system comprising 20 influencing factors, as delineated in Table 1, was developed. This table also presents empirical correlation coefficients between each indicator and landslide occurrences, providing a robust foundation for assessing slope stability and associated risks.
Our slope landslide risk evaluation indicator system covers six aspects and multiple dimensions: types of terrain morphology, meteorological conditions, the ecological environment, soil conditions, human activity, and external manifestations. With rich data types and strong logical correlation and through the real-time monitoring of these indicators, this system can comprehensively grasp slope landslide risk dynamics from various perspectives over a long period. This enables a more scientific and accurate assessment of slope landslide risk and advances the lead time for early warnings, providing long-term guidance for the prevention and control of landslides.

2.2. Methodology for Screening Key Evaluation Indicators

A landslide is a very complex nonlinear process. Owing to the multitude of indicators influencing slope stability and the presence of certain correlations among these indicators, if they are directly substituted into the model for risk assessment, they may lead to issues, such as model complexity, a slowed model running rate, model overfitting, and other problems, which would negatively impact the assessment results [19].
Therefore, it is necessary to analyze the evaluation indicator system and eliminate evaluation indicators with high redundancy, small differentiation, and low influence on slope landslides. Instead, select indicators with strong generalization, high information content, and significant influence on slope stability are used as key landslide risk assessment evaluation indicators. Since S1-S19 are the “causes” of landslides and S20 is the “result” of landslides, which is the direct criterion for whether a landslide occurs, S20 is not involved in the analysis and screening process. Instead, it is directly used as one of the final key evaluation indicators.
To enhance the universality and professionalism of subsequent slope landslide risk assessment work, we obtained 1200 sets of hydropower station reservoir area slope assessment indicator system data from the Melbourne Kaggle (https://www.kaggle.com/, accessed on 28 April 2024) data-mining website, including 300 sets each for attention level, warning level, alert level, and alarm level slope data.
Firstly, we employed the Pearson correlation coefficient method to measure the degree of correlation between two different indicators, SX and SY; the formula is as follows:
ρ S X , S Y = c o v ( S X , S Y ) σ S X σ S Y = E ( S X S Y ) E ( S X ) E ( S Y ) E ( S X 2 ) E 2 ( S X ) E ( S Y 2 ) E 2 ( S Y )
According to the correlation judgment rule proposed in [19], when the absolute value of Pearson’s correlation coefficient is less than 0.2, it indicates no obvious correlation between the two indicators. When the absolute value is more than 0.7, it indicates a strong correlation between the indicators.
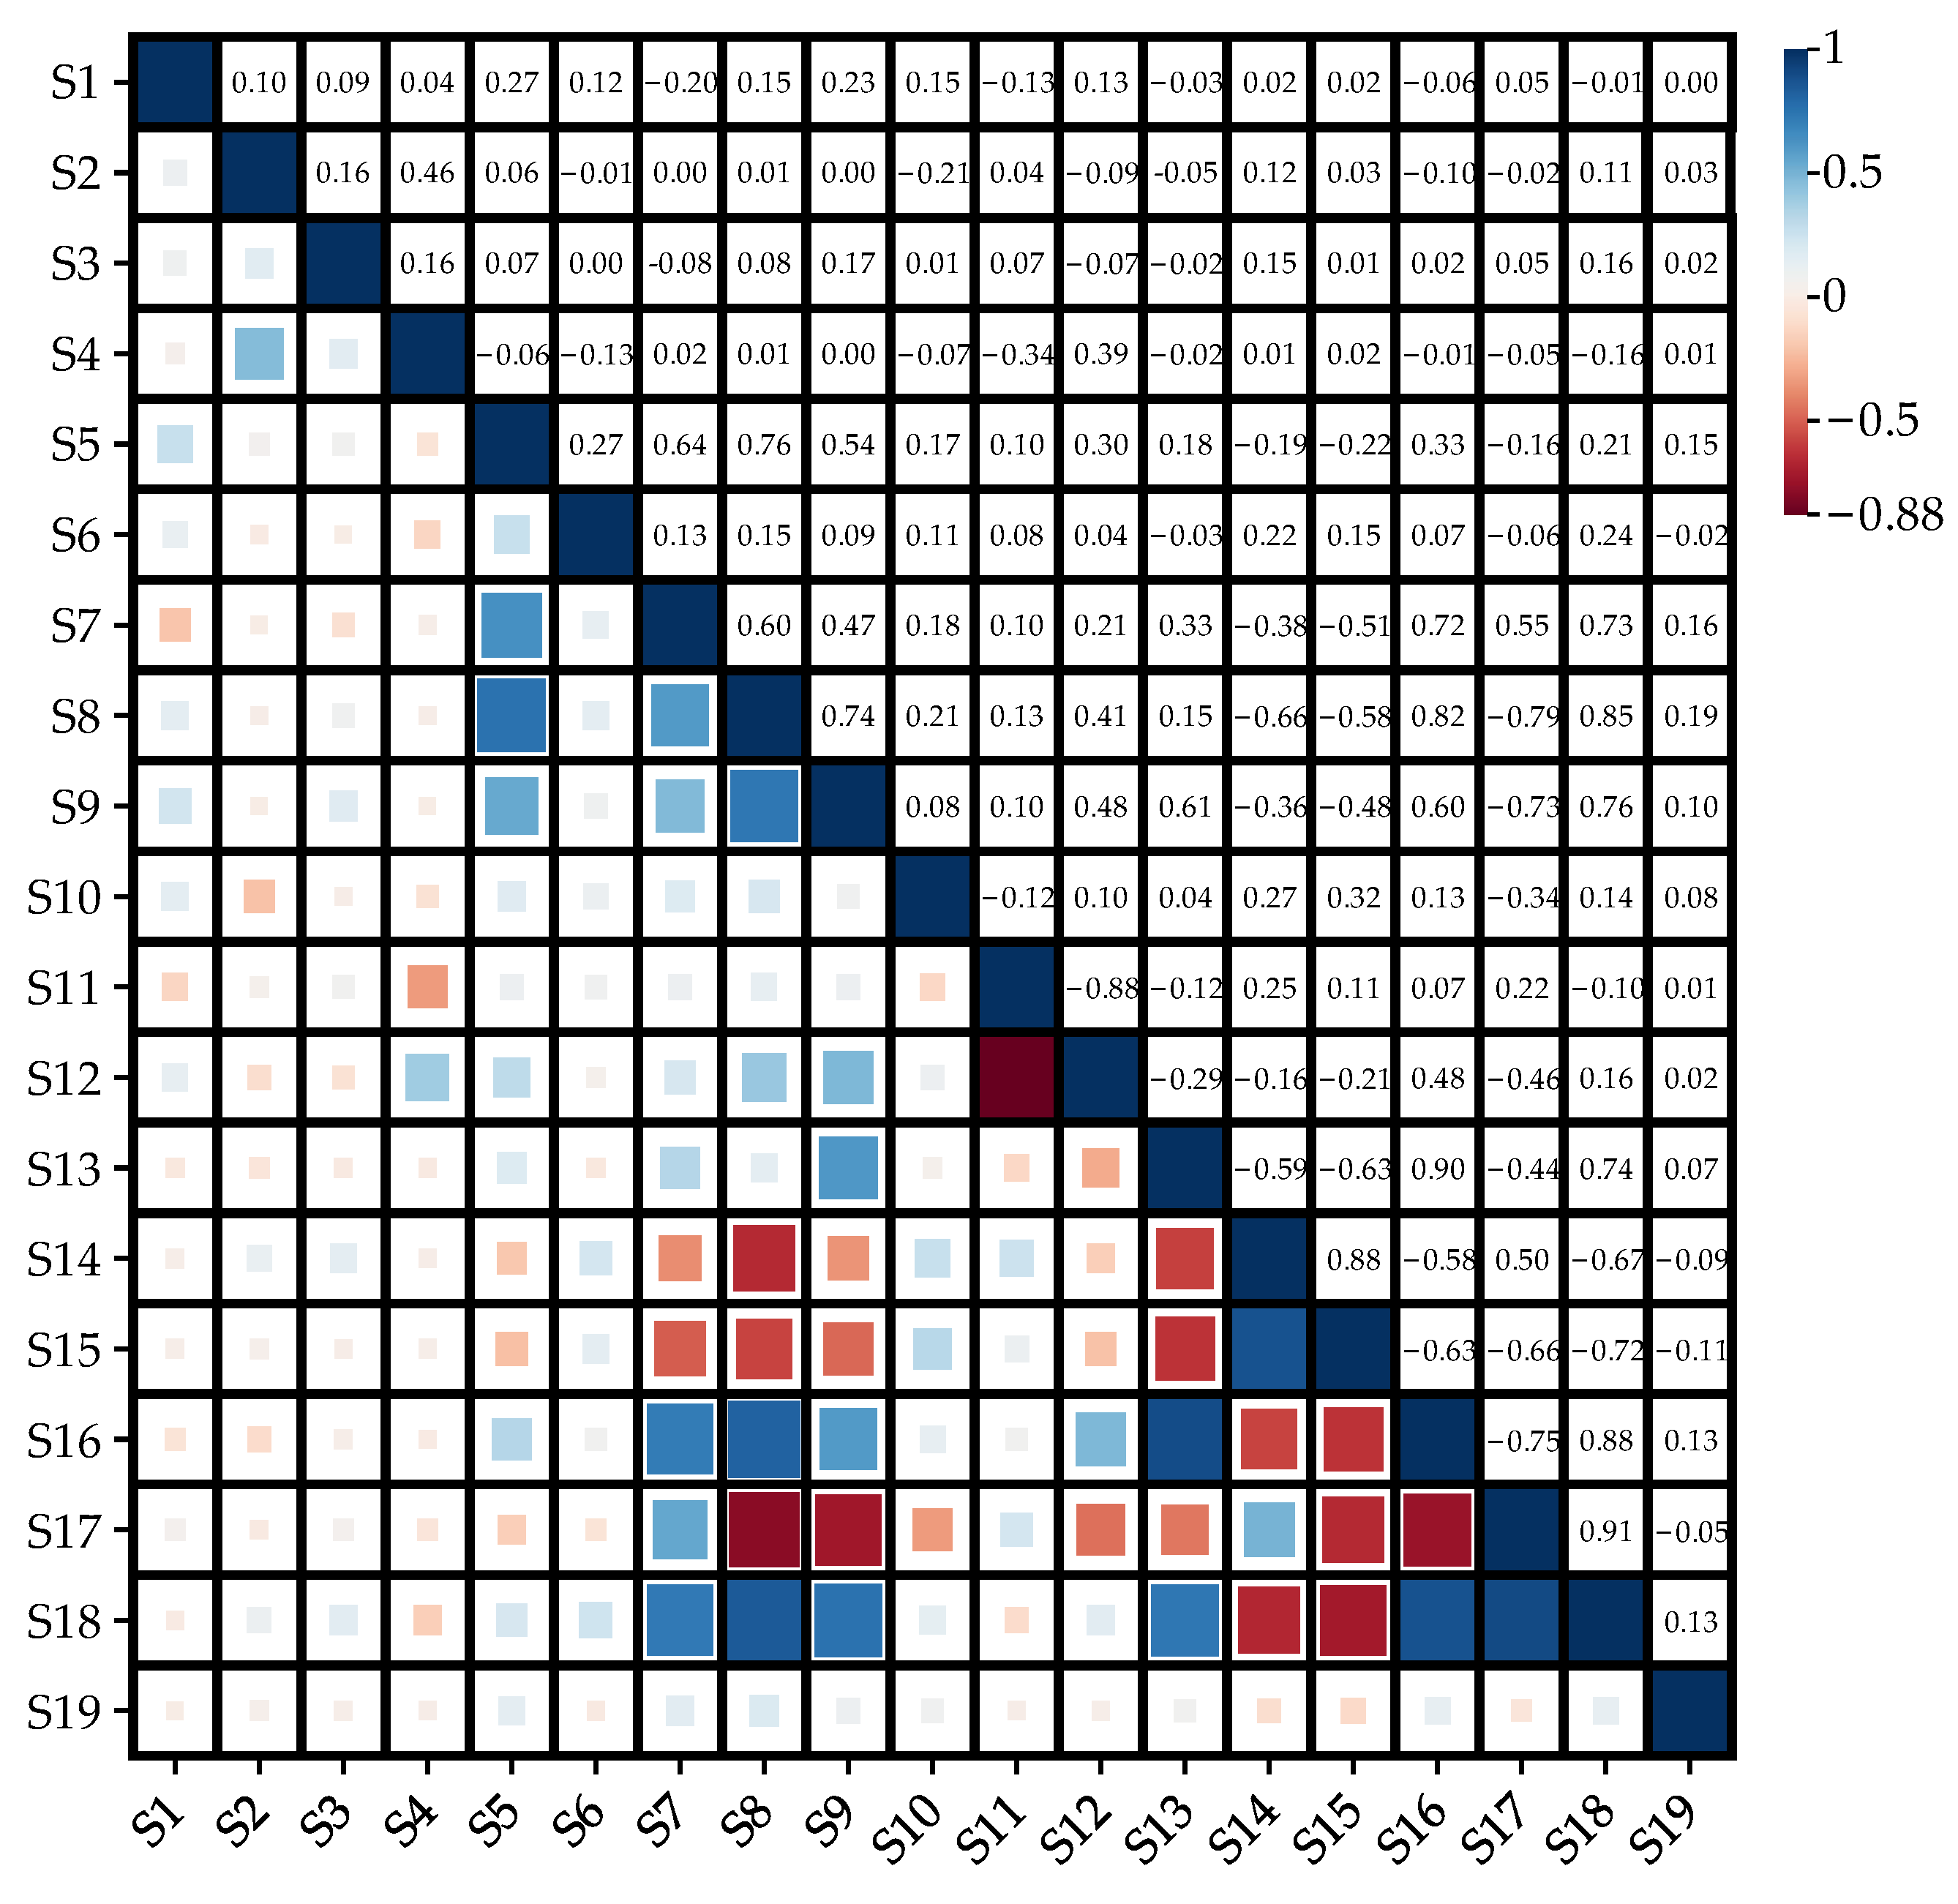
The final evaluation indicator correlation coefficient is calculated to obtain the results shown in Figure 2, where blue represents positive correlation and red represents negative correlation. The larger the color block, the higher the correlation coefficient.
The graphical results show that the correlation coefficients between the terrain morphology indicators, reservoir water levels, and other indicators are generally low. The correlation coefficient between the slope, S2, and elevation, S4, is 0.46, indicating some relevance. The correlation coefficient between humidity (S5) and S7, S8, and S9 in the meteorological category of indicators is greater than 0.5, showing a moderate degree of correlation. Three-day cumulative precipitation S8 is strongly correlated with S9, S14, S16, S17, and S18, and five-day cumulative precipitation, S9, is strongly correlated with S8, S13, S16, S17, and S18. The correlation coefficient between the NDVI, S11, and the NDWI, S12, in the ecological environment category is 0.88, showing a strong correlation, while the correlation coefficients between S9, S12, S16, S17, and S18 are close to 0.5. The correlation coefficients of soil bulk density, S13, and soil moisture content, S16; the angle of internal soil friction, S14, and soil shear strength, S15; the Topographic Wetness Index, S18; and S16 and S17 in the soil condition category are close to 0.9, which is a very strong correlation.
To determine the indicators that have a greater impact on landslide occurrences on slopes, the gray relational analysis (GRA) was used to determine the impact weight of each assessed indicator on landslides on slopes [20]. To avoid the problem of there being too large of a difference between the scale of each evaluation indicator and the data scale standard, the data were first normalized via dimensionless normalization. The data matrix was established using 1200 sets of sample indicator datasets, constituting a matrix of dimensions 1200 × 19 (S1–S19), as shown in Equation (2).
S ˜ = a 1 S 1 a 1 S 2 a 1 S 19 a 2 S 1 a 2 S 2 a 2 S 19 a i S 1 a i j a i S 19 a 1200 S 1 a 1200 S 2 a 1200 S 19
a ¯ = i = 1 1200 a i j 1200
b i j = a i j a ¯ j
Matrix B after dimensionless normalization is shown in Equation (5).
B = b 1 S 1 b 1 S 2 b 1 S 19 b 2 S 1 b 2 S 2 b 2 S 19 b 1200 S 1 b 1200 S 2 b 1200 S 19
For the 1200 sample datasets categorized by risk level, the output label, di, is denoted as 1 for slopes at the alarm level and 0 for slopes at other levels. The corresponding Boolean result matrix is represented as D, as illustrated in Equation (6).
D = [ d 1 d 2 d 1200 ]
We can determine the gray relation coefficients between each evaluation indicator and landslides based on matrix B and matrix D, as shown in Equation (7).
ξ i j = min 1 i 1200 1 j 19 d j b i j + ρ max 1 i 1200 1 j 19 d j b i j d j b i j + ρ max 1 i 1200 1 j 19 d j b i j
where ρ is the resolution coefficient. The smaller ρ is, the greater the resolution, and 0 < ρ < 1 ; in this study, 0.5 was taken as the value.
Thus, the gray relation coefficient, ri, is shown in Equation (8).
r i = 1 1200 i = 1 1200 ξ i j
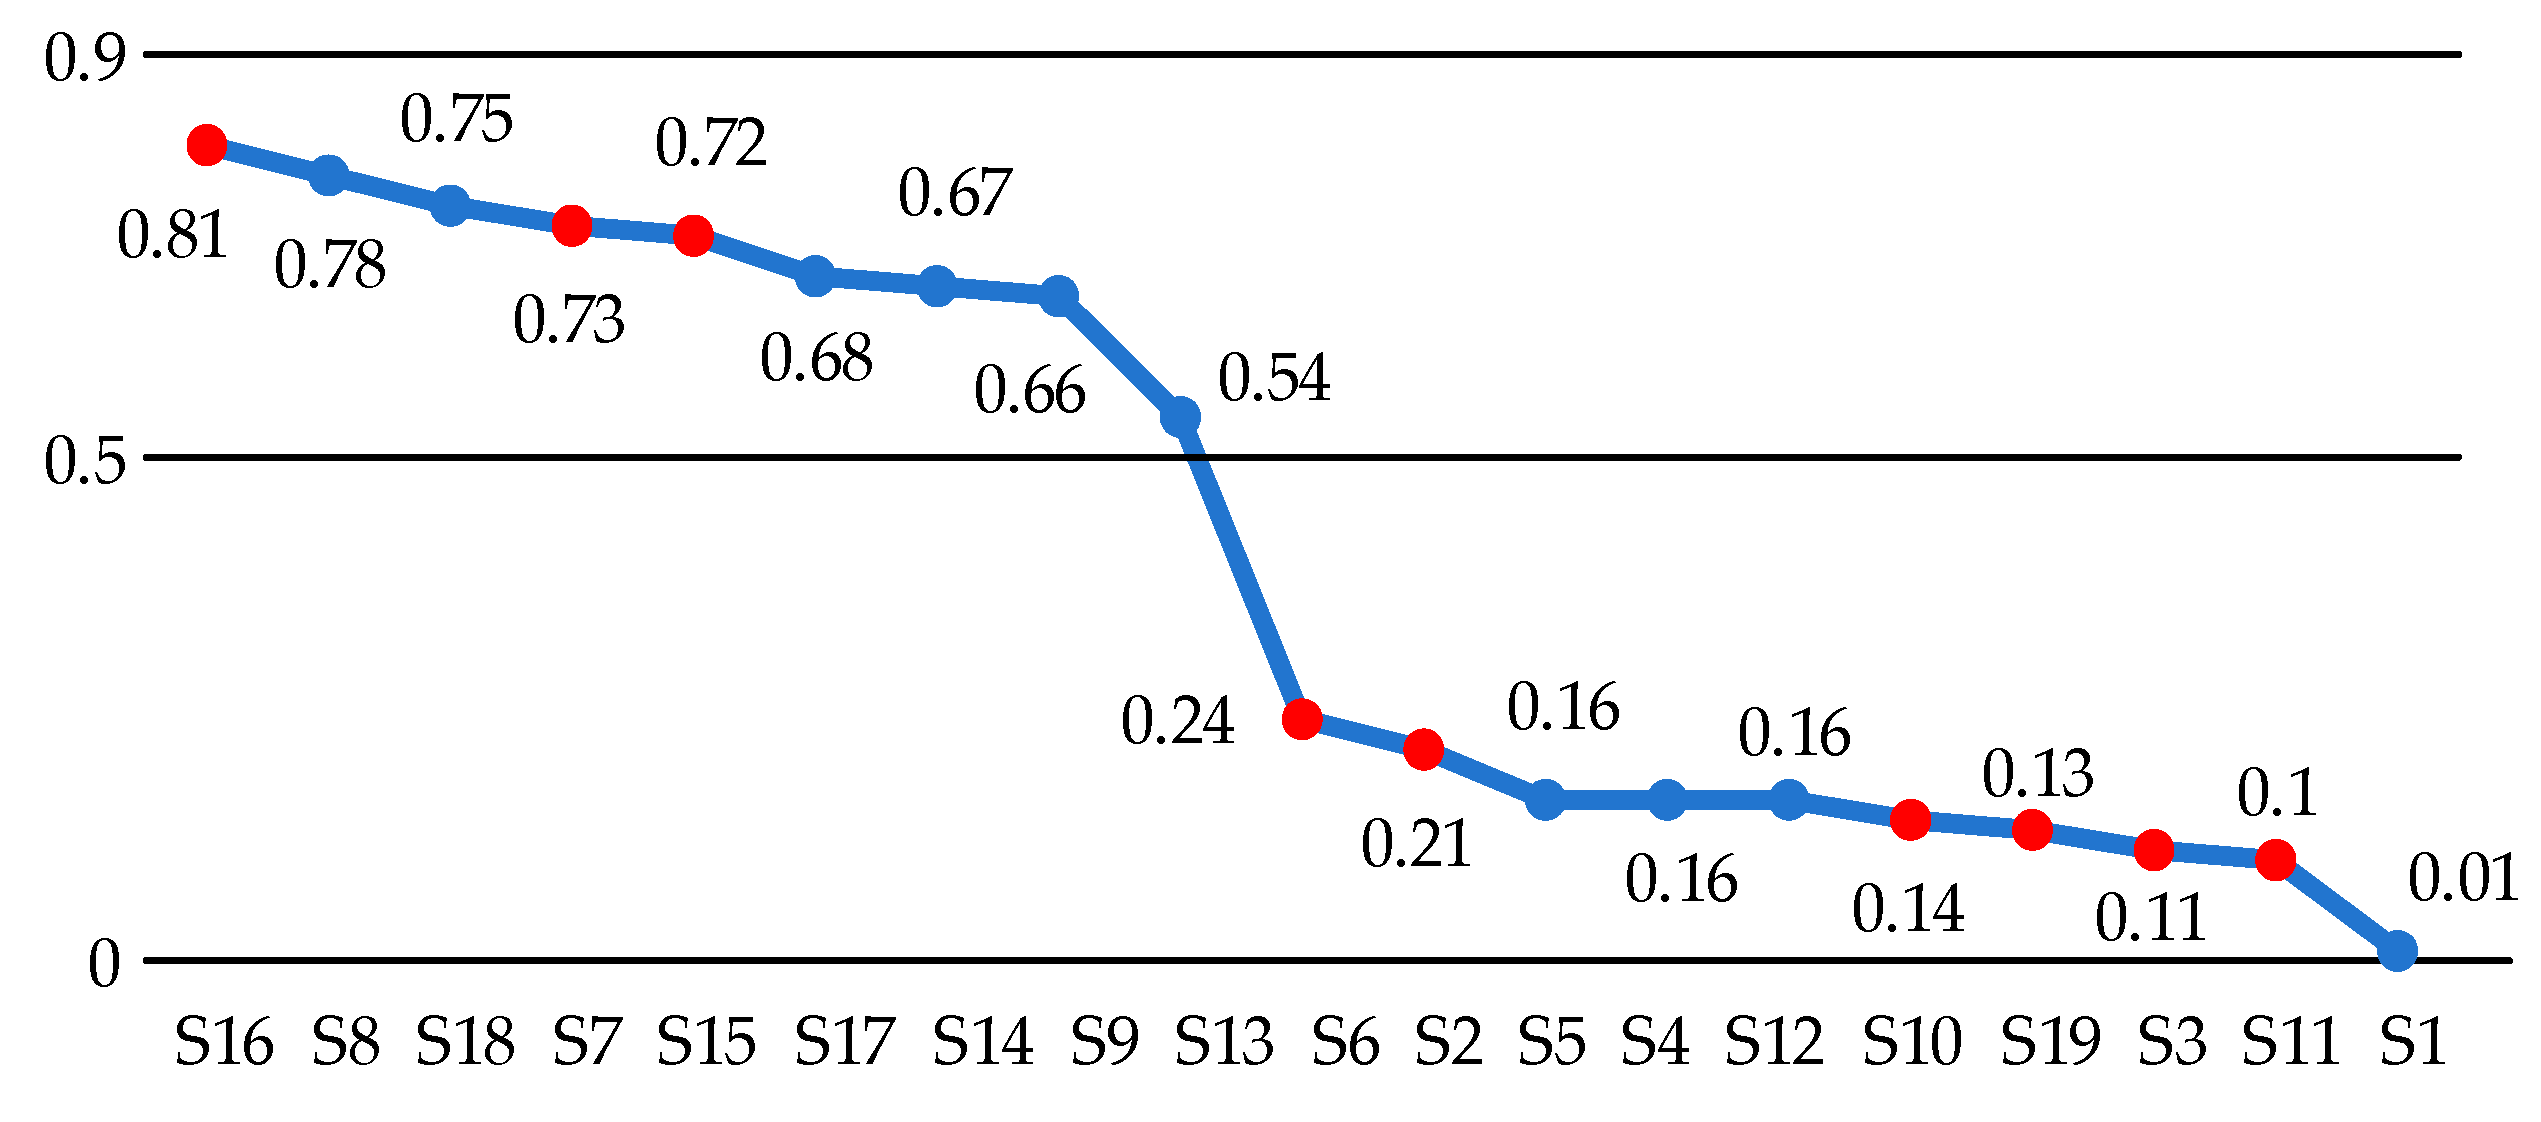
The calculated weights of each indicator in relation to the impact of landslides are shown in descending order in Figure 3. Larger values represent a higher impact of the indicator on landslides.
Figure 3 shows that the precipitation and soil moisture condition indicators have a greater weight on the influence of slope stability, and there is a clear disconnect from the other indicators. Combined with the results of Pearson correlation coefficient analysis, the S1, S4, S5, S8, S9, S12, S13, S14, S17, and S18 indicators were excluded, and 10 indicators (slope, curvature, temperature, daily precipitation, vegetation coverage, NDVI, soil shear strength, soil moisture content, reservoir water level, and slope deformation) were finally identified as the key indicators for slope risk assessment, which were renumbered F1~F10 for the convenience of the subsequent analysis, as shown in Table 1.

3. Fuzzy-BLS Model for Slope Risk Assessment

3.1. Fuzzy-BLS Risk Assessment Model Structure

A fuzzy broad learning system (Fuzzy-BLS) is a fuzzy neural network model proposed by Feng and Chen [21] in 2018, combining the advantages of fuzzy logic and a generalized learning system to deal with uncertainty and ambiguity. As landslides are characterized by multifactorial effects, nonlinearities, variable features, and large time lags, slope risk assessment faces strong uncertainties.
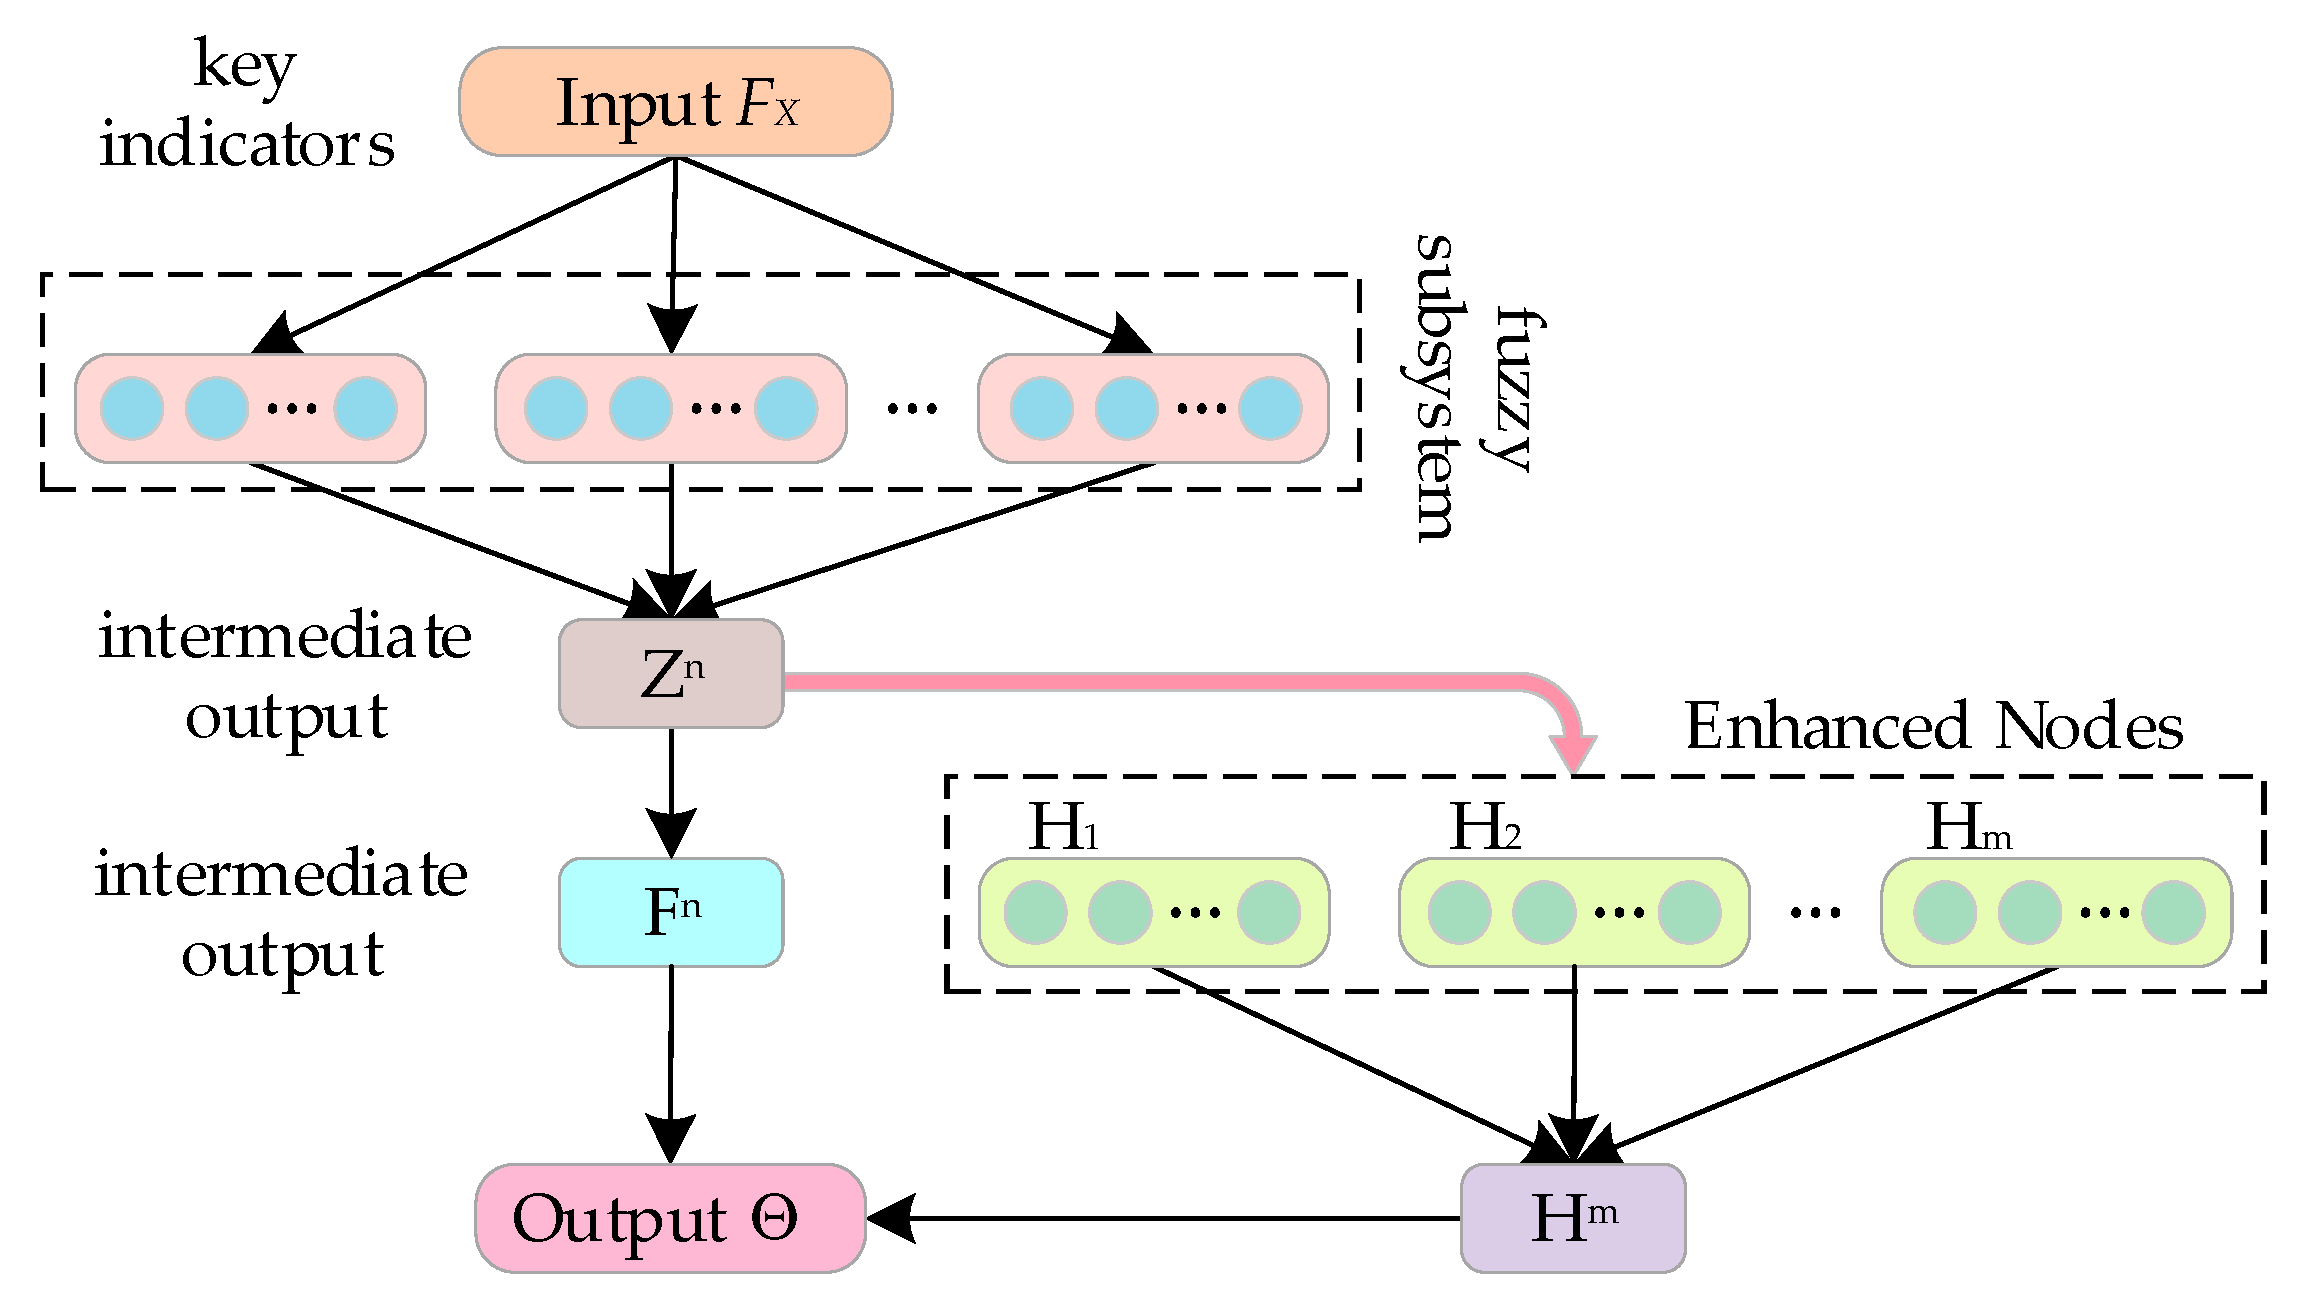
Our Fuzzy-BLS was obtained by replacing the feature layer of a broad learning system with a Takagi–Sugeno–Kang fuzzy subsystem. Unlike traditional neural networks with a multilayer structure, a Fuzzy-BLS has a flat structure consisting only of a fuzzy subsystem layer and an augmentation layer. It employs the k-means algorithm to cluster the input data to reduce computational complexity. This allows the network to be computed quickly, and it can be arranged in parallel in the network without imposing a large computational burden. The structure of our Fuzzy-BLS is shown in Figure 4 and consists of four main parts: inputs, fuzzy subsystems, enhanced nodes, and outputs.
Slopes of different risk classes differ in key assessment metrics, and a Fuzzy-BLS aims to extract these differences and translate them into differences in the output of a neural network to assess slope risk classes.
In the slope landslide risk evaluation dataset, { F , Θ } , F represents the input F1–F10 key evaluation indicators of the Fuzzy-BLS model, and Θ is the output of the Fuzzy-BLS model. Θ is an M × 4 matrix, which can be expressed in Equation (9) as follows:
Θ = Θ 1 Θ 2 Θ f Θ g = θ 1 A θ 1 B θ 1 C θ 1 D θ 2 A θ 2 B θ 2 C θ 2 D θ f A θ f B θ f C θ f D θ g A θ g B θ g C θ g D
where θ i A , θ i B , θ i C , and θ i D are values between 0 and 1, representing the probability that the slope is at one of the four risk levels, attention, warning, alert, and alarm, and satisfies θ i A + θ i B + θ i C + θ i D = 1 .
If there are n fuzzy subsystems in the network, the intermediate output, z p k i , of the k-th subsystem of the x p t training data sample can be expressed in Equation (10) as follows:
z p k i = i = 1 M α k t i x p t
where α k t i is a parameter whose value is initialized by a uniform distribution between [0, 1].
The activation strength of the k-th fuzzy rule in the i-th fuzzy subsystem can be expressed as follows:
τ p k i = t = 1 M μ k t i ( x p t )
where μ k t i ( x p t ) is the Gaussian affiliation function corresponding to x p t .
u k t i ( x p t ) = e ( x p t c k t i δ k t i ) 2
where c k t i and δ k t i denote the width and center of the Gaussian affiliation function, respectively, and are obtained by initializing the clustering center.
Therefore, the weighted activation strength of each fuzzy rule is calculated as shown in Equation (13).
ω s k i = τ s k i k = 1 K i τ s k i
Thus, the output vector of the i-th fuzzy subsystem is Z p i = ( ω p 1 i z p 1 i , ω p 2 i z p 2 i , , ω p K i i z p K i i ) . Then, the intermediate output matrix of all fuzzy subsystems is Z n = ( Z 1 , Z 2 , , Z n ) .
The intermediate output matrix, Zn, is input in the augmentation node for nonlinear transformation, which can effectively deal with nonlinear characteristics in the data.
Assuming that the number of enhanced nodes is m, the output matrix of the enhanced layer can be expressed as follows:
H m = ( H 1 , H 2 , , H m )
where H j = ξ j ( Z n W h j + β h j ) ; Whj and βhj are the weights and biases, respectively, and their values are randomly generated from [0, 1].
Thus, the defuzzified output vector of the i-th fuzzy system can be expressed as follows:
F p i = k = 1 K i ω p k i i = 1 M δ k 1 i α k t i x p t k = 1 K i ω p k i t = 1 M δ k C i α k t i x p t
where C is the dimension of the output vector, which is equal to four in the risk assessment experiments in this study.
Thus, for all training samples, F, the output of all fuzzy subsystems is shown in Equation (16).
F n = i = 1 n d i a g t = 1 M α k t i x 1 t , , t = 1 M α k t i x N t ω 11 i ω 1 K i i ω N 1 i ω N K i i δ 11 i δ 1 C i δ K i 1 i δ K i C i
Therefore, the final output of the Fuzzy-BLS is determined as follows:
Θ = F n + H m W e
where We is the parameter matrix of the Fuzzy-BLS network.
Based on the output, Θ , corresponding to Equation (9), the slopes are classified into the corresponding classes according to the following equation:
L = max θ i X = θ i A θ i B θ i C θ i D , , , , A l a r m A l a r t W a r n i n g A t t e n t i o n

3.2. Risk Assessment Model Training

The evaluation metric used for this training is accuracy, which is used to measure the performance of the slope risk assessment model.
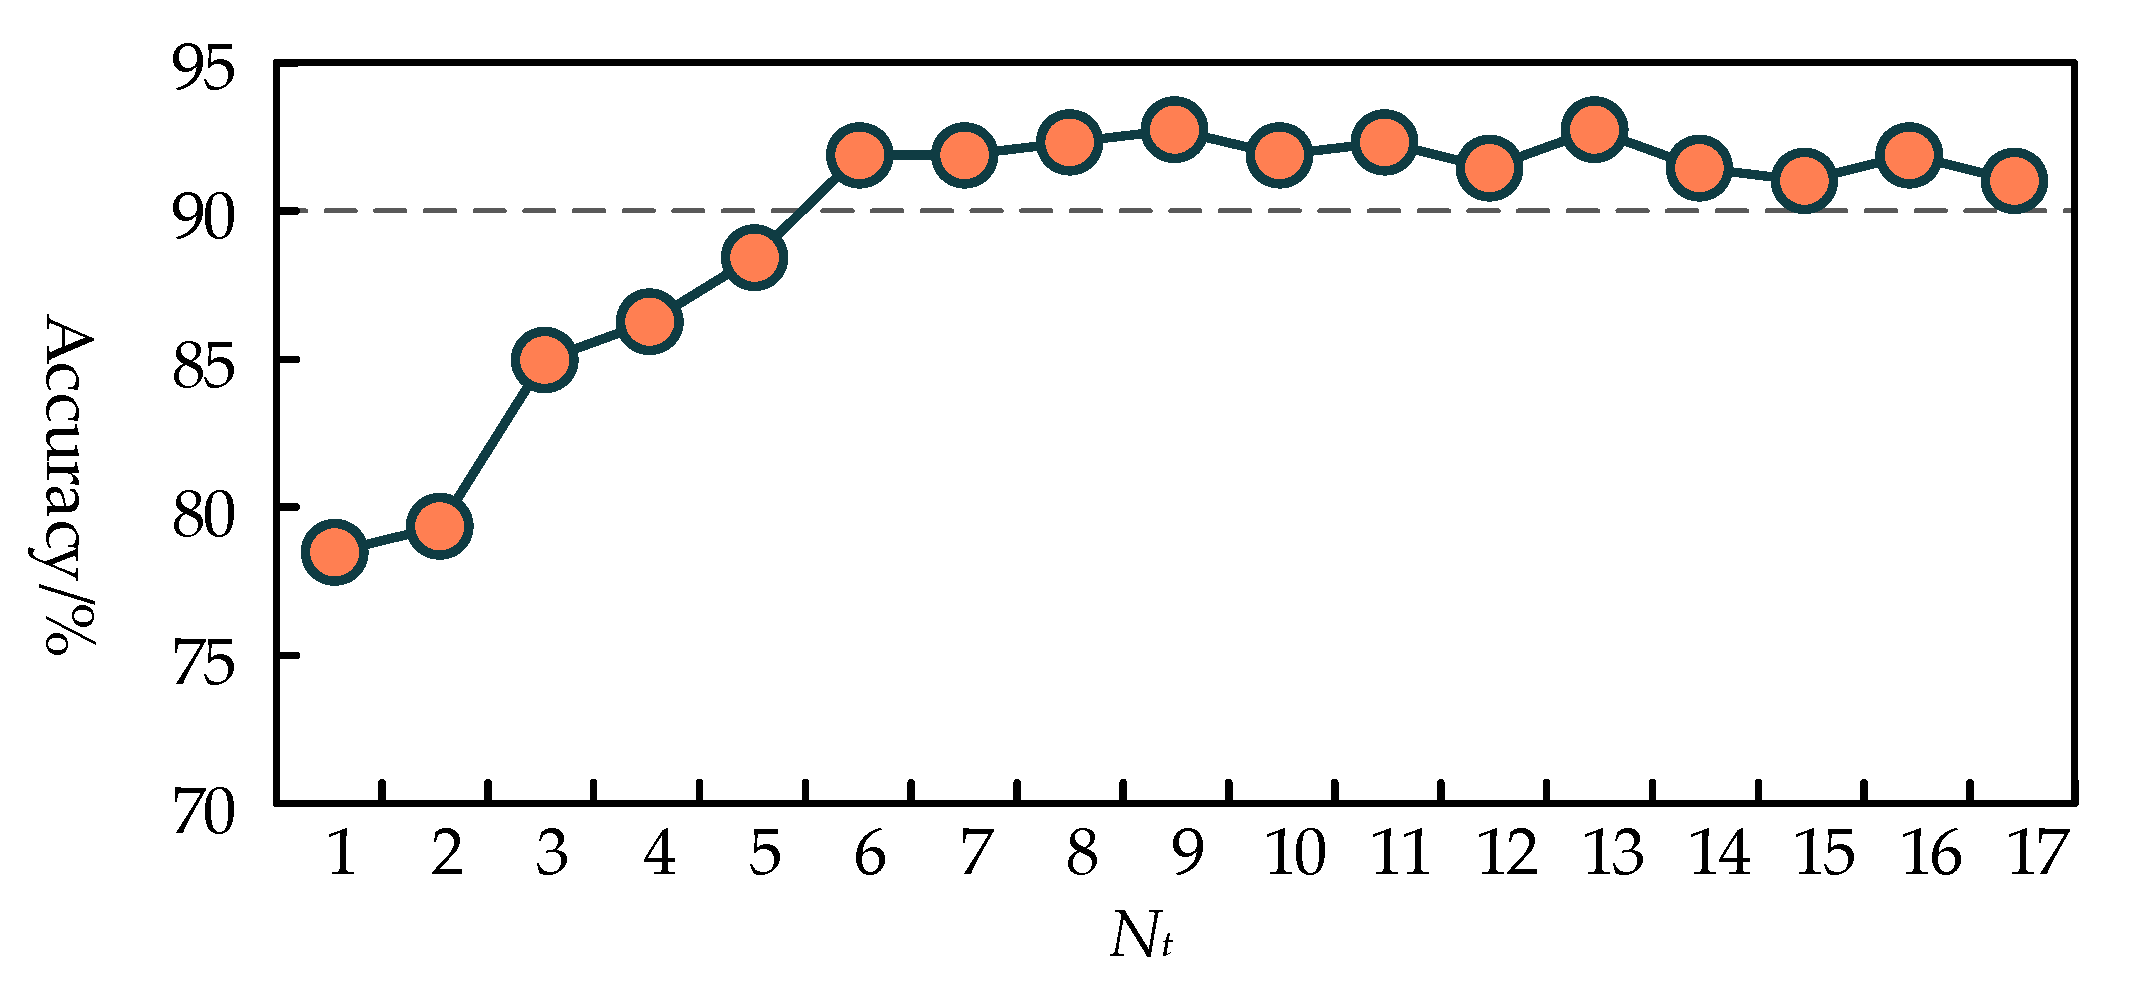
The risk assessment effect of the Fuzzy-BLS model is most affected by the number of fuzzy subsystems. In this paper, we set the search range of fuzzy rules of each fuzzy subsystem Nr = 2 and the number of augmentation nodes Ne = 20 and conducted multiple trainings to explore the optimal number of fuzzy subsystems Nt of the Fuzzy-BLS model, and the experimental results are shown in Figure 5.
The figure shows that when the number of fuzzy subsystems reaches six, the accuracy rate reaches 90% and above and remains stable with the increased number, and the accuracy rate reaches a maximum of 92.08% when Nt = 9. Therefore, we chose to set the number of fuzzy subsystems of the final risk assessment model to nine.
We set the search range of fuzzy rules for each fuzzy subsystem of the Fuzzy-BLS model Nr = 2, the number of augmentation nodes Ne = 20, and the number of fuzzy subsystems Nt = 9. During the experimental process, we found that the number of training samples has an impact on the performance of the Fuzzy-BLS model, so the training set and the test set (the same situation for each risk level) were divided into 6:4, 7:3, 8:2, 9:1, and 19:1, five ratios used to train the model, and the test performance is shown in Table 2.
Given the data analysis in the table above, the test accuracy of the Fuzzy-BLS model is low when the training samples are lower than 80%, and it increases significantly with an increase in the training samples, until the training samples are more than 80%, reaching more than 90%. Training accuracy is the highest when the number of training samples is 8:2. When the number of samples increases, the training accuracy begins to decrease, and the test accuracy shows a gradual improvement trend, but this improvement is small. At the same time, the training time becomes longer and longer, and there are large fluctuations in the accuracy of different risk levels.
Therefore, the 8:2 dataset ratio is finally selected as the optimal scheme for network training. This ratio ensures that the model maintains stable and high accuracy in all levels of risk assessment, while also controlling the training time to a certain extent.
With a dataset ratio of 8:2, this study selected BLS, eXtreme Gradient Boosting (XGBoost), and Support Vector Machine (SVM) to conduct comparative experiments on the effect of introducing fuzzy subsystems. The aim was to verify the superiority of the proposed FBLS model in landslide risk assessment. The experimental results of different models are presented in Table 3.
The data analysis in the table shows that the Fuzzy-BLS model is significantly superior to other models in the risk assessment of slope landslides in hydropower station reservoir areas. This superiority mainly stems from the problem of periodic differences in the collection of key indicator data for slope landslide assessment, which may affect the accurate understanding of the input parameters by other risk assessment models. This leads to the inability of the model to fully take into account the temporal nature of the data, which, in turn, makes it difficult to learn the effective features of the input data. Owing to the introduction of the fuzzy subsystem module, Fuzzy-BLS can automatically extract the nonlinear features and hidden patterns in the data; deal with nonlinearity, uncertainty, and ambiguity; and improve the flexibility of the model. Thus, it performs well with the problem of slope risk level assessment.

4. Application Testing and Analysis

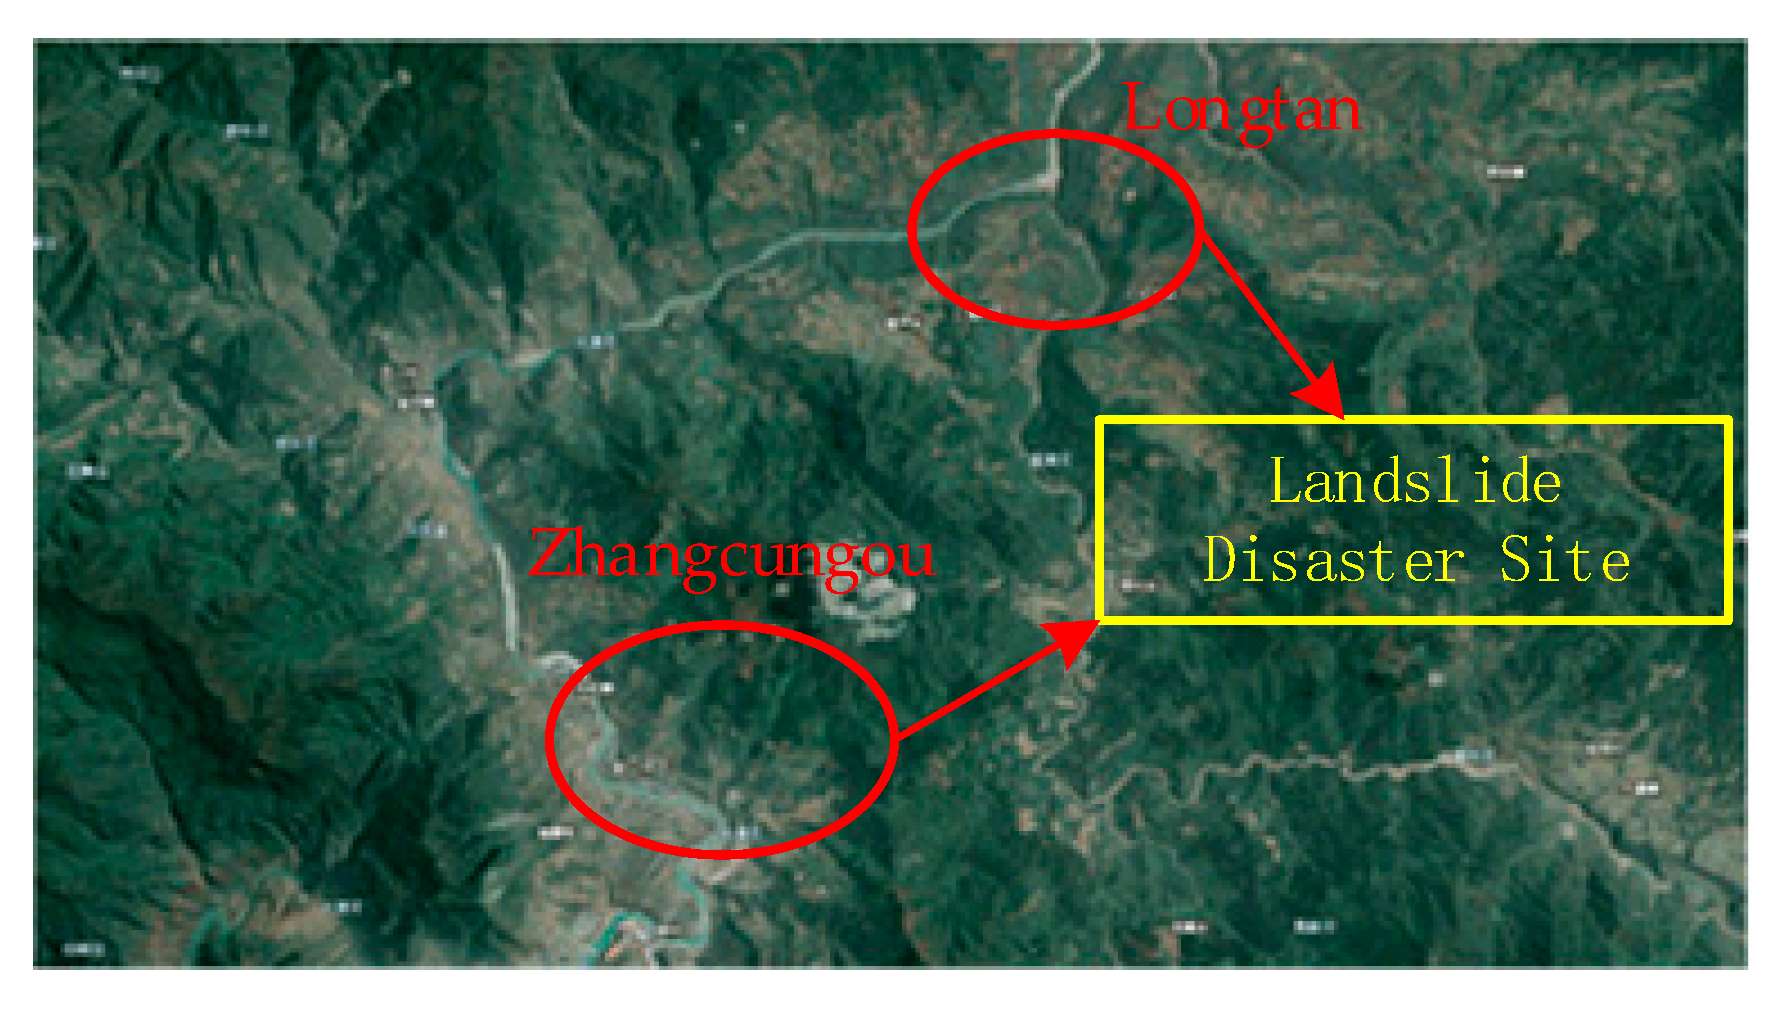
Two geohazard risk locations—the Zhangcungou slope of the Pillow Head Dam First-Level Hydropower Station and the Longtan slope of the Shaping Second-Level Hydropower Station in the Dadu River Basin—were selected for landslide risk assessment example validation, as shown in Figure 6.
The Zhangcungou slope is located outside the camp of the Pillow Head Dam Grade 1 Hydropower Station. Landslides originate from the gully of the mountain behind the camp. The length of the upper and lower mountain gully is about 3100 m, and the difference in elevation between the upper and lower mountains is about 1200 m. A landslide disaster occurred in the rainy season of September 2022, blocking the culvert of Zhangcungou. The current mudslide silt may impact the interior of the camp, resulting in damage to the facilities and equipment.
The Longtan landslide body is located upstream of Shaping Dam, approximately 12.5 km from the dam site. The foot of the slope is approximately 569 m above the surface elevation of provincial road S306. The gully serves as the boundary, with a width of about 180 m along the direction of the highway and a length of about 250 m along the slope. The average thickness of the cover layer is about 17.0 m, with a total cubic volume of approximately 65 to 90,000 m3. In the rainy season of 2017, the slope experienced creeping and slipping, resulting in surface cracks and some damage to houses. Currently, the original cracks show no signs of expansion.
On 27 August 2023, after on-site investigation and analysis, the slopes in Zhangcungou were classified as the warning level, while the slopes in Longtan were classified as the attention level. These classifications were made by integrating various factors such as geological structure, monitoring data, and potential risks.

4.1. Access to Evaluation Indicators

Terrain morphology and ecological environment category indicators for the two side slopes were obtained for September 2023 using the Geospatial Data Cloud (https://www.gscloud.cn/, accessed on 28 April 2024). For Zhangcungou, the metrics were as follows: slope, F1, was 18.9%; curvature, F2, was 0.0024 rad/m; vegetation coverage, F5, was 45.55%; and the NDVI, F6, was 0.62. For Longtan, the metrics were as follows: F1 was 22.3%, F2 was 0.0029 rad/m, F5 was 56.31%, and F6 was 0.83.
For meteorological conditions, soil moisture conditions, reservoir water levels, and slope deformation types requiring real-time monitoring, sensor sites were deployed in the potential landslide area of the slope by installing sensors at different monitoring points and different depths; the installation scheme is shown in Figure 7. Three surface monitoring areas were divided along the landslide body area in the downslope direction based on different elevations, with one to three measurement points distributed in each monitoring area, equipped with a variety of sensors to provide a comprehensive setup for capturing critical data.
The real-time monitoring of the slopes and data collection for the multi-dimensional risk assessment indicators were accomplished through sensors that monitor changes in various slope parameters in real time and provide important data support for assessing slope landslide risk. To ensure timely notification to nearby residents and power station staff in the event of a landslide, wireless loudspeakers were installed in the village at the foot of the slope and on top of the power station. These wireless speakers can be automatically triggered in the event of a landslide, emitting early warning signals and playing relevant emergency alerts to minimize human casualties and economic losses.
Data for key indicators (F1–F10) for the Zhangcungou and Longtan slopes, collected from 1 September to 30 September 2023, at 12:00, are presented in Figure 8. These data highlight the variations over the monitoring period, illustrating the impact of environmental factors on slope stability.
The figure shows that there was continuous rainfall on 10, 11, and 12 September, resulting in a significant increase in soil moisture. This increase may have implications for slope stability and could alter the risk level of the slopes. Subsequently, heavy rainfall on 20 September washed away surface soil layers, further compromising slope stability. However, as temperatures rise and plant transpiration resumes, soil moisture content is expected to return to its normal range, thereby contributing to the rebound of slope stability.

4.2. Example Assessment Results

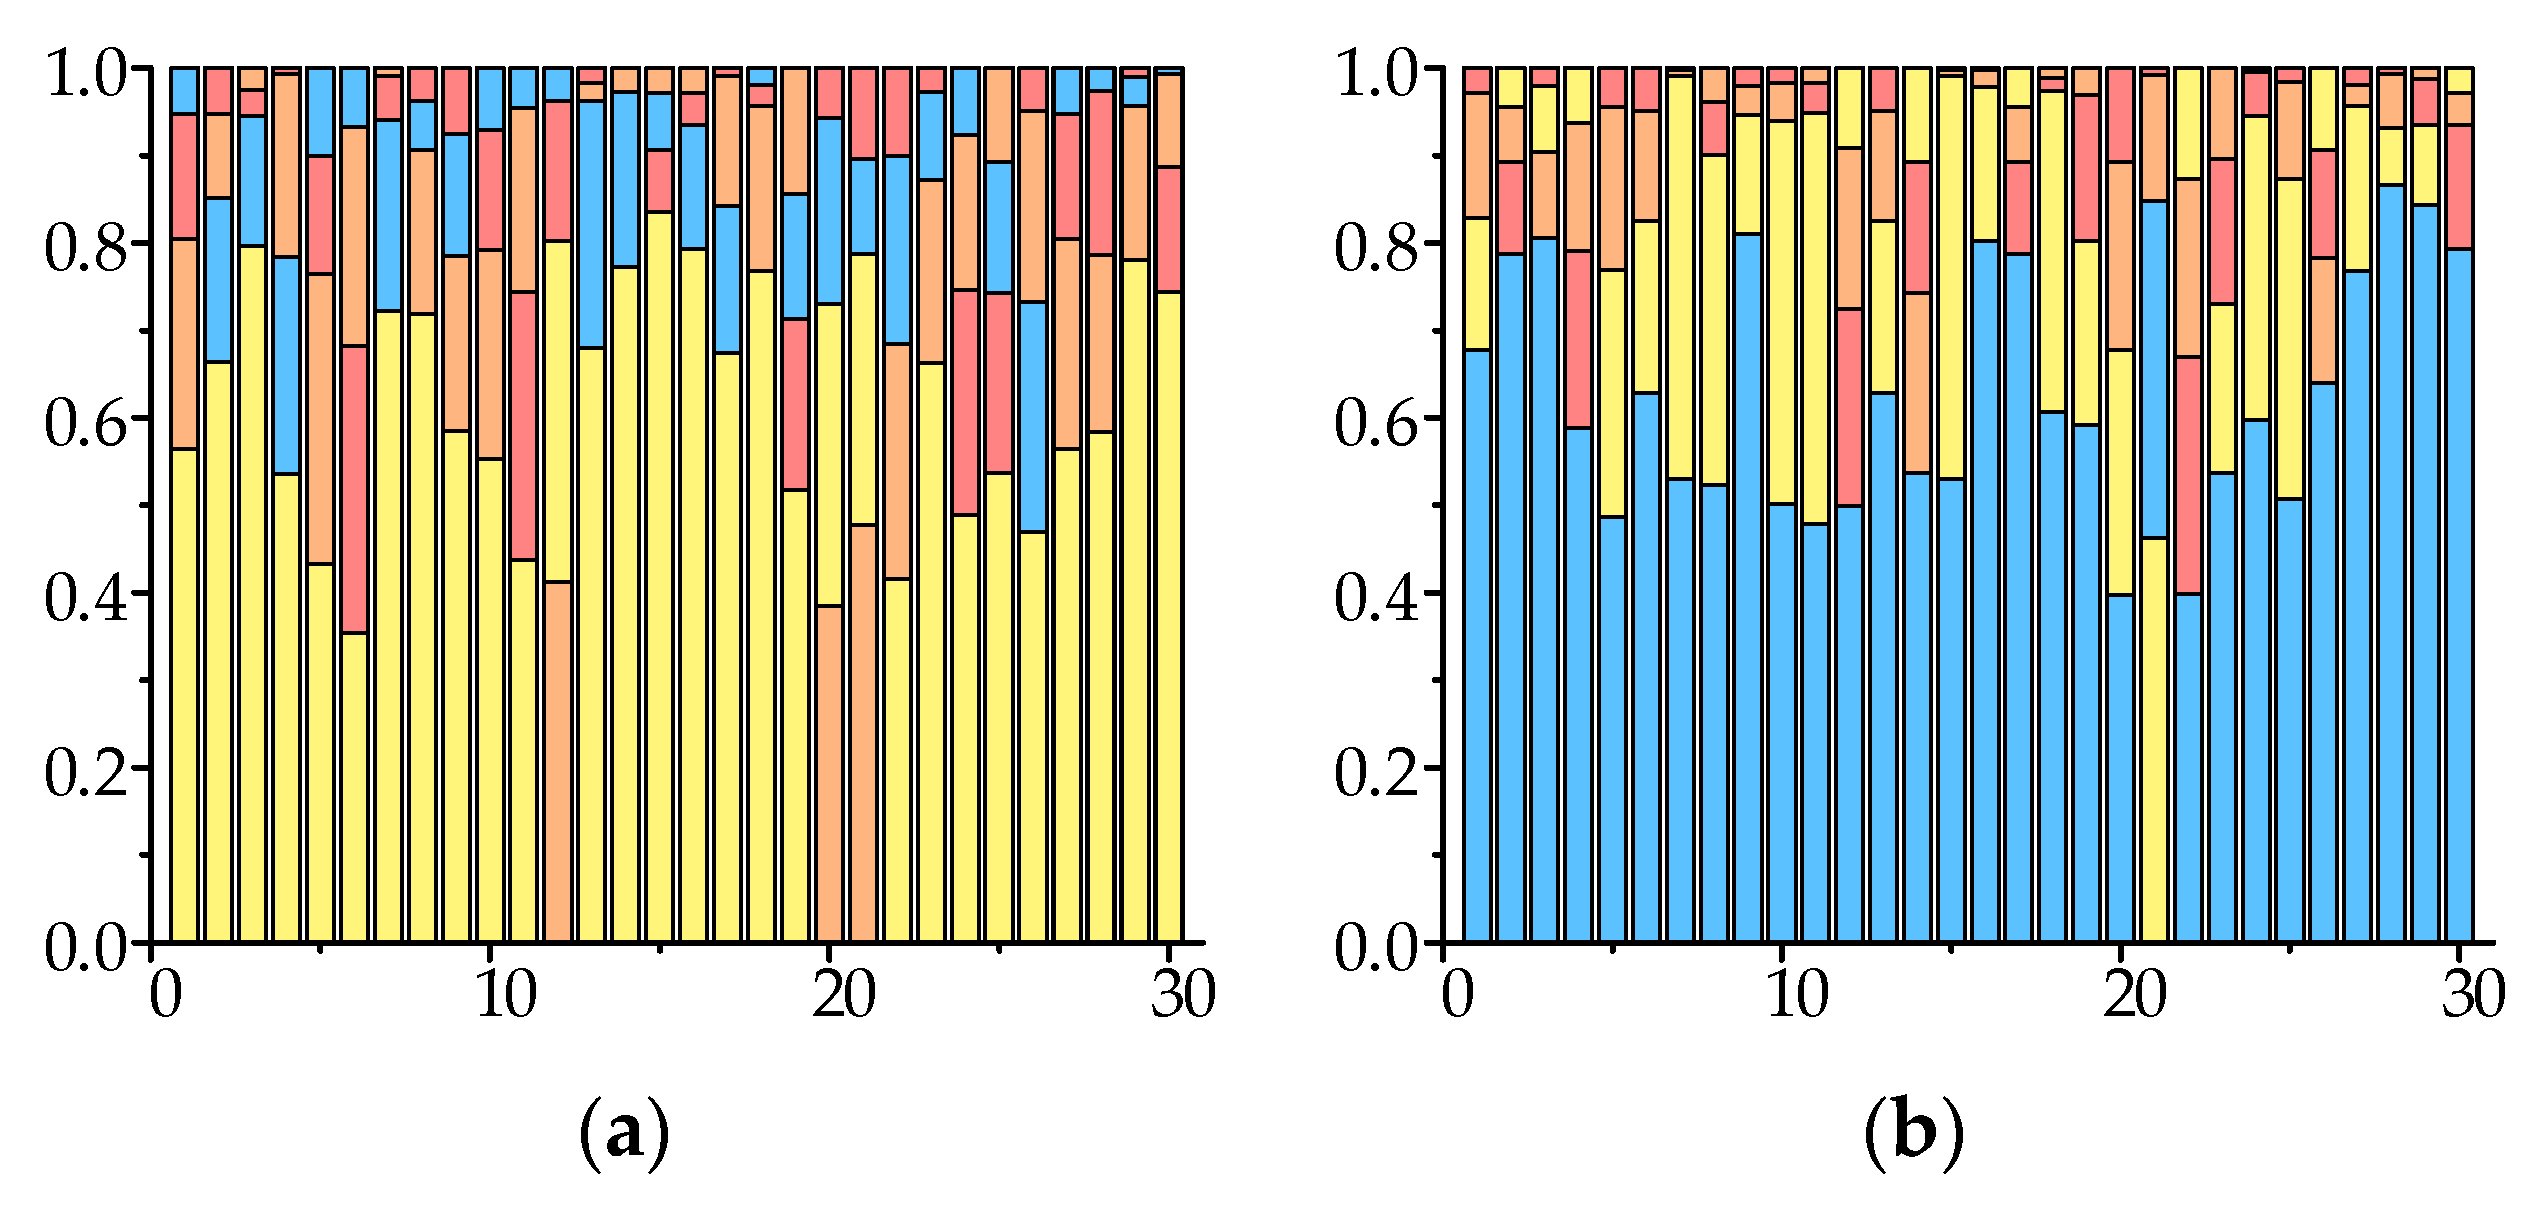
The key indicator data for the Zhangcungou and Longtan slopes were input into the trained risk assessment model. Figure 9 displays the assessment results, demonstrating the model’s capability to evaluate slope stability under varying conditions.
In the figure, red represents the value of output result θ i A ; orange represents the value of output result θ i B ; yellow represents the value of output result θ i C ; blue represents the value of output result θ i D ; and the color bar at the bottom represents the risk level of the slope.
The figure shows that the Zhangcungou slope was at the alert level on 12 September, which was attributed to continuous rainfall on the 10th and 11th days, leading to increased soil moisture content, decreased soil shear strength, and reduced slope stability. Heavy rainfall on 20 September further decreased stability in both the Zhangcungou and Longtan slopes. Consequently, both slopes were upgraded by one risk level on the 21st, owing to the lagged nature of the process of rainfall infiltration altering soil moisture content.
The experimental results confirmed the validity and reliability of the hydropower station reservoir area slope landslide risk assessment model. Its risk assessment results were highly consistent with the actual situation, providing a long-term progressive change trend in geologic hazards for the safety management of hydropower station reservoir area slopes. This timely guidance on disaster prevention and mitigation is crucial for power station operations.

5. Conclusions

This study delved into the long-term creep and deformation of landslides, exploring factors affecting slope stability. It established an indicator system for landslide risk assessment, encompassing terrain morphology, meteorological conditions, the ecological environment, soil moisture conditions, human activity, and external manifestation in multiple dimensions. Key indicators for landslide risk assessment were selected based on their strong generalization, high information content, and significant impact on slope stability, identified through correlation and GRA. Given the complex and uncertain nature of slope landslide systems, a Fuzzy-BLS model was employed to assess slope risk, and the accuracy of this model was as high as 92.08%. Applying this model to the slopes of Zhangcungou and Longtan in the Dadu River Basin validated its ability to accurately assess slope landslide risk levels. This landslide risk assessment system has been embedded into the real-time monitoring and assessment system of the Dadu River Basin, which provides support to the hydropower station geohazard supervisors for slope risk management and prevention on a long time scale.
Despite the high accuracy achieved in slope risk level assessment using the Fuzzy-BLS model, in view of the complexity and uncertainty of the landslide hazard occurrence mechanism, stability influencing factors, and potential risks, subsequent studies need to be devoted to the development of better decision support to further improve the accuracy of risk assessment.

Author Contributions

Conceptualization, H.H. and X.Z.; methodology, H.K.; validation, J.Y.; writing—original draft preparation, H.H.; writing—review and editing, J.Y.; visualization, X.Z.; supervision, H.H.; project administration, H.K.; funding acquisition, J.Y. All authors have read and agreed to the published version of the manuscript.

Funding

This research was funded by the Key R&D Program of the Sichuan Provincial Department of Science and Technology, grant number 2022YFG0120.

Institutional Review Board Statement

Not applicable.

Informed Consent Statement

Not applicable.

Data Availability Statement

The data presented in this study are available upon request from the corresponding authors. The data are not publicly available owing to privacy.

Acknowledgments

The authors would like to thank the Dadu River Basin Reservoirs and Dams Management Center of China National Energy for their project support.

Conflicts of Interest

The authors declare no conflicts of interest.

References

  1. Li, A.; Chi, E.; Ma, J.; Zhong, D. Application of GPS real-time monitoring system in open slope deformation monitoring. Min. Technol. 2020, 20, 140–144. [Google Scholar] [CrossRef]
  2. Wu, M.; Fang, Y.; Shen, Y.; Dai, K.; Yao, Y.; Chen, J.; Feng, W. Fast Dynamic ldentification of Landslide Hazards in Baihetan Reservoir area based on Short Baseline DInSAR Interferometry. Remote Sens. Technol. Appl. 2023, 38, 1054–1061. [Google Scholar]
  3. Bi, Z.; Li, S.; Yuan, L.; Lin, Y. Monitoring and analysis of slope deformation in Wudongde Hydropower Station reservoir area based on InSAR. Yangtze River 2024, 55, 143–150. [Google Scholar]
  4. Gao, B.; He, Y.; Chen, X.; Zheng, X.; Zhang, L.; Zhang, Q.; Lu, J. Landslide risk evaluation in Shenzhen based on stacking ensemble learning and InSAR. IEEE J. Sel. Top. Appl. Earth Obs. Remote Sens. 2023, 16, 1–18. [Google Scholar] [CrossRef]
  5. He, K.; Chen, X.; Yu, X.; Dong, C.; Zhao, D. Evaluation and prediction of compound geohazards in highly urbanized regions across China’s Greater Bay Area. J. Clean. Prod. 2024, 449, 141641. [Google Scholar] [CrossRef]
  6. Shan, Y.; Xu, Z.; Zhou, S.; Lu, H.; Yu, W.; Li, Z.; Cao, X.; Li, P.; Li, W. Landslide Hazard Assessment Combined with InSAR Deformation: A Case Study in the Zagunao River Basin, Sichuan Province, Southwestern China. Remote Sens. 2024, 16, 99. [Google Scholar] [CrossRef]
  7. Gao, Z.; Ding, M.; Huang, T.; Liu, X.; Hao, Z.; Hu, X.; Xi, C. Landslide risk assessment of high-mountain settlements using Gaussian process classification combined with improved weight-based generalized objective function. Int. J. Disaster Risk Reduct. 2022, 67, 102662. [Google Scholar] [CrossRef]
  8. Chen, C.; Fang, Z. Research on an effective rainfall model for geological disaster early warning in Fujian Province, China. J. Geomech. 2023, 29, 99–110. [Google Scholar] [CrossRef]
  9. Fan, W.; Wei, X.; Cao, Y.; Zheng, B. Landslide susceptibility assessment using the certainty factor and analytic hierarchy process. J. Mt. Sci. 2017, 14, 906–925. [Google Scholar] [CrossRef]
  10. Zhang, H.; Zhang, G.; Jia, Q. Integration of analytical hierarchy process and landslide susceptibility index based landslide susceptibility assessment of the Pearl river delta area, China. IEEE J. Sel. Top. Appl. Earth Obs. Remote Sens. 2019, 12, 4239–4251. [Google Scholar] [CrossRef]
  11. Yang, Y.; Guo, Y.; Chen, H.; Tang, H.; Li, M.; Sun, A.; Bian, Y. Application of a Hybrid Model in Landslide Susceptibility Evaluation of the Western Tibet Plateau. Appl. Sci. 2024, 14, 485. [Google Scholar] [CrossRef]
  12. Li, X.; Cheng, J.; Yu, D. Research on landslide risk assessment based on convolutional neural network. IEEE Geosci. Remote Sens. Lett. 2022, 19, 2505705. [Google Scholar] [CrossRef]
  13. Geng, W.; Song, Z.; He, C.; Wang, H.; Dong, X. The Impact of Fine-Layering of Tailings Dam on the Variation Pattern of Infiltration Lines. Appl. Sci. 2024, 14, 950. [Google Scholar] [CrossRef]
  14. Jiang, N.; Li, H.; Li, C.; Xiao, H.; Zhou, J. A fusion method using terrestrial laser scanning and unmanned aerial vehicle photogrammetry for landslide deformation monitoring under complex terrain conditions. IEEE Trans. Geosci. Remote Sens. 2022, 60, 4707214. [Google Scholar] [CrossRef]
  15. Gao, F.; Gao, X.; Yang, C.; Li, J. Research on the Evolution Network Model of the Landslide Disaster Chain: A Case Study of the Baige Landslide. Appl. Sci. 2024, 14, 499. [Google Scholar] [CrossRef]
  16. Glueer, F.; Mreyen, A.-S.; Cauchie, L.; Havenith, H.-B.; Bergamo, P.; Halló, M.; Fäh, D. Integrating Seismic Methods for Characterizing and Monitoring Landslides: A Case Study of the Heinzenberg Deep-Seated Gravitational Slope Deformation (Switzerland). Geosciences 2024, 14, 28. [Google Scholar] [CrossRef]
  17. Li, Q.; Sun, Y.; Wang, S.; Wang, B.; Deng, G.; Zhang, C. Deformation characteristics of active landslides in Xiluodu reservoir area based on InSAR technology. Miner. Explor. 2024, 15, 311–319. [Google Scholar] [CrossRef]
  18. Wang, R.; Wan, J.; Cheng, R.; Wang, Y.; Wang, Z. Physical and Numerical Simulation of the Mechanism Underpinning Accumulation Layer Deformation, Instability, and Movement Caused by Changing Reservoir Water Levels. Water 2023, 15, 1289. [Google Scholar] [CrossRef]
  19. Bao, X.; Jiang, Y.; Zhang, L.; Liu, B.; Chen, L.; Zhang, W.; Xie, L.; Liu, X.; Qu, F.; Wu, R. Accurate Prediction of Dissolved Oxygen in Perch Aquaculture Water by DE-GWO-SVR Hybrid Optimization Model. Appl. Sci. 2024, 14, 856. [Google Scholar] [CrossRef]
  20. Tan, R.; Zhang, W.; Chen, S. Decision-making method based on grey relation analysis and trapezoidal fuzzy neutrosophic numbers under double incomplete information and its application in typhoon disaster assessment. IEEE Access 2019, 8, 3606–3628. [Google Scholar] [CrossRef]
  21. Feng, S.; Chen, C.L.P. Fuzzy broad learning system: A novel neuro-fuzzy model for regression and classification. IEEE Trans. Cybern. 2018, 50, 414–424. [Google Scholar] [CrossRef] [PubMed]
Figure 1. Landslides and precipitation. (a) Precipitation statistics on the day of a landslide; (b) nine days of precipitation before seven landslides.
Applsci 14 05201 g001
Figure 2. Heat map of the correlation coefficients.
Applsci 14 05201 g002
Figure 3. Ranking of indicator weights.
Applsci 14 05201 g003
Figure 4. Fuzzy-BLS structure diagram.
Applsci 14 05201 g004
Figure 5. Accuracy of models with a different number of fuzzy subsystems.
Applsci 14 05201 g005
Figure 6. Geographic location of the study area.
Applsci 14 05201 g006
Figure 7. Layout of the monitoring sensor network. (a) Zhangcungou layout; (b) Longtan layout.
Applsci 14 05201 g007
Figure 8. Key indicator data from 1 September to 30 September. (a) Zhangcungou data; (b) Longtan data.
Applsci 14 05201 g008
Figure 9. Results of risk level assessment from 1 September to 30 September. (a) Zhangcungou assessment results; (b) Longtan assessment results.
Applsci 14 05201 g009
Table 1. Evaluation indicator system.
Type of IndicatorNumberIndicatorMathematical UnitEmpirical
Terrain morphologyS1Aspect%0.05–0.1
S2Slope (F1)%0.15–0.25
S3Curvature (F2)rad/m0.1–0.2
S4Elevationm0.05–0.1
Meteorological conditionS5Humidity%0.4–0.5
S6Temperature (F3)°C0.25–0.4
S7Daily precipitation (F4)mm0.7–0.8
S8Three-day cumulative precipitationmm0.75–0.85
S9Five-day cumulative precipitationmm0.65–0.8
Ecological environmentS10Vegetation coverage (F5)%0.3–0.4
S11Normalized Difference Vegetation Index (F6)/0.2–0.3
S12Normalized Difference Water Index/0.25–0.35
Soil moisture conditionS13Soil bulk densityN/m30.4–0.6
S14Angle of internal soil frictionN/m20.55–0.65
S15Soil shear strength (F7)kPa0.6–0.7
S16Soil moisture content (F8)%0.8–0.9
S17Porosity ratio%0.65–0.7
S18Topographic Wetness Index/0.75–0.85
Human activityS19Reservoir water level (F9)m0.15–0.25
External manifestationS20Slope deformation (F10)mm0.9–0.95
Table 2. Effect of model training with different sample ratios.
PerformanceTraining Time/sTraining AccuracyTesting Accuracy
Proportion BlanketAttention LevelWarning LevelAlert LevelAlarm Level
6:45.020768.75%78.75%85%71.67%74.17%84.17%
7:36.722176.67%83.61%90%81.11%74.44%88.89%
8:27.487988.13%92.08%91.67%88.33%93.33%95%
9:110.205782.22%93.33%96.67%86.67%93.33%96.67%
19:112.038482.46%93.33%100%80%93.33%100%
Table 3. Effect of model training with different different models.
Risk Assessment ModelsTesting Accuracy
BlanketAttention LevelWarning LevelAlert LevelAlarm Level
Fuzzy-BLS92.08%91.67%88.33%93.33%95%
BLS90.83%95%86.67%90%91.67%
XGBoost88.33%88.33%88.33%85%91.67%
SVM79.17%78.33%73.33%81.67%83.33%
Disclaimer/Publisher’s Note: The statements, opinions and data contained in all publications are solely those of the individual author(s) and contributor(s) and not of MDPI and/or the editor(s). MDPI and/or the editor(s) disclaim responsibility for any injury to people or property resulting from any ideas, methods, instructions or products referred to in the content.