Article

The Prediction of Incremental Damage on Optics from the Final Optic Assembly in an ICF High-Power Laser Facility

Laser Fusion Research Center, China Academy of Engineering Physics, Mianyang 621900, China
*
Author to whom correspondence should be addressed.
Appl. Sci. 2024, 14(12), 5226; https://doi.org/10.3390/app14125226
Submission received: 8 April 2024 / Revised: 6 June 2024 / Accepted: 11 June 2024 / Published: 17 June 2024
(This article belongs to the Special Issue AI-Based Image Processing: 2nd Edition)

Abstract

:
High-power laser facilities necessitate predicting incremental damage to final optics to identify evolving damage trends. In this study, we propose a surface damage detection method utilizing image segmentation employing ResNet-18 and a damage area estimation network employing U-Net++. Paired sets of online and offline images of optics obtained from a large laser facility are used to train the network. The trends of varying damage could be identified by incorporating additional experimental parameters. A key advantage of the proposed method is that the network can be trained end to end on small samples, eliminating the need for manual labeling or feature extraction. The software developed based on these models can facilitate the daily inspection and maintenance of optics in large laser facilities. By effectively applying deep learning techniques, we successfully addressed the challenges faced by traditional methods in handling complex environments, achieving the accurate identification and prediction of damages on optics.

1. Introduction

The final end of the inertial confinement fusion (ICF) [1,2,3,4,5] system, known as the final optic assembly (FOA) [6,7,8,9], is subjected to the highest laser power load within the entire optical system. The damage-bearing capacity of optics in the FOA is severely limited by the nonlinear effects of high-power laser radiation, material defects, and other forms of contamination.
The load capacity of optics, often referred to as their damage-bearing capacity, is closely linked to the output laser power and energy stability of high-power laser facilities. For these new and qualified optics, initial damage to optics spans from dozens of micrometers to several millimeters [10,11,12,13,14]. The earlier we detect and analyze such minor damage, the more likely we are to restore or replace the affected elements promptly, thereby effectively extending the longevity of the optics. Conversely, if the accumulating damage spirals out of control, it could result in significant economic losses and even induce laser beam modulation, leading to a catastrophic disaster for the entire facility [15,16,17,18].
The traditional method of detection involves the use of microscopes; this method consumes a significant amount of time and manual labor, and its reliability is often unsatisfactory. Additionally, it is limited by environmental conditions, presenting significant drawbacks that are incompatible with the experimental requirements of high-power laser facilities. Consequently, we have turned to using imaging devices such as CCD [19], optical coherence tomography (OCT) [20], photoluminescence (PL) [21], etc., to capture optic images. Subsequently, image processing technology has been integrated with computer vision, specifically machine vision, to develop a more effective detection method.
The image processing algorithm based on the morphology of graphics has found wide applications across various fields. However, it faces challenges when dealing with environments filled with unpredictable noise, leading to inefficiencies and inaccuracies in damage detection. Currently, a novel image processing algorithm based on deep learning is emerging as a promising alternative. Deep learning enables a closer approximation between complex input and output functions due to its self-learning capabilities and hierarchical structure. In comparison to morphology-based methods, deep learning has the potential to significantly enhance the algorithm for target detection [22].
In 2008, Adra Carr from Lawrence Livermore National Laboratory (LLNL) was among the first to introduce machine learning technology into damage classification, focusing on the identification and characterization of damage occurrences [23]. Two years later, Ghaleb M. Abdulla, also from LLNL, applied a similar algorithm to recognize false damage caused by hardware reflections [24]. In 2014, Lu Li and her team from Zhejiang University utilized a classic machine learning algorithm, a support vector machine, for offline detection in the surface defects evaluating system (SDES), successfully distinguishing microscale damage and dust [25]. Subsequently, in 2019, Fupeng Wei from Harbin Institute of Technology conducted research on an intelligent inspection method for detecting weak feature damage in large aperture final optics using the kernel-based extreme learning machine (K-ELM) algorithm [26,27]. However, it is worth noting that the damage samples used in both the training and test sets were sourced from a single picture, indicating a need to enhance the generalizability of the research.
This study outlines a predictive approach to incremental damage on optics. Initially, we introduce our proposed solution to the challenging engineering issues related to damage detection. Subsequently, we employ suitable algorithms to develop mathematical models for this purpose. Finally, we conclude by detailing the research progress and achievements in the field of predictive technology for damage prediction on optics. Compared to traditional methods, this approach offers higher accuracy, applicability, and practicality, enabling the real-time monitoring and prediction of optic damage to enhance operational efficiency and longevity in large laser facilities.

2. Methods

High-power laser irradiation on the FOA can cause complex physical and mechanical effects. When these effects accumulate to a certain extent, damage occurs, known as laser-induced damage (LID). The causes of damage are divided into four types: damage induced by inherent material defects, processing defects, surface contamination, and laser damage to optical thin films. In order to monitor damages on optics online, a final optic damage inspection (FODI) [28] system was designed for imaging the overall aperture of optics using side illumination, which is shown in Figure 1. The FODI system uses dark field split-time independent side illumination technology to achieve online optic imaging, capable of detecting damages larger than 100 μm. However, the presence of stray light and other downstream optics can lead to the generation of false damage, which needs to be filtered out in the images. Figure 1 illustrates four main types of false damage: (1) damage reflection image, (2) hardware reflection, (3) damage from downstream optics, and (4) light spots. Hardware reflections, categorized as (2), are often observed at upstream optics such as continuous-contour phase plates (CPPs) and frequency conversion crystals (11 mm type-I KDP doubling crystals and 9 mm type-II deuterated KDP tripling crystals). Given the diverse formation mechanisms of false damage, it becomes challenging to physically distinguish authentic damage from false ones.
To address this challenge, we adopted an offline approach instead of an online inspection to meet practical demands during weekly maintenance of the facility. Before installation or after removal, optics were placed into a dark box and subjected to side illumination to obtain offline dark-field images [29]. This procedure helped to eliminate the influence of background light or downstream optics. Consequently, any white dots observed in the offline image could be confidently identified as authentic damage, as shown in Figure 2.
Given the constraints of maintenance time and labor costs, the availability of offline images for analysis is limited. Recently, fewer than 10 offline images have been directly related to their online counterparts, a quantity insufficient for traditional machine learning applications. Furthermore, the scheduling of optics maintenance in routine operations is restrictive, limiting the opportunities to acquire new offline images. To address this, optics owning more than 1000 damages were prioritized for offline high-definition imaging, maximizing the collection of valuable damage samples within the constraints.
To overcome the challenge of limited data availability, we employed data augmentation [30] techniques. Data augmentation involves altering a limited dataset in various ways to create new, synthetic data points. This can include transformations such as rotation, scaling, and changes in lighting conditions, which help in simulating different scenarios that could lead to damage. By generating these new data points, we enhanced the robustness and generalization capabilities of our machine learning models. This approach allows for more effective training of models to identify and classify damage, improving their accuracy and reliability in real-world applications despite the initial scarcity of offline images.
Braille marks [31] representing the last four digits of element numbers were engraved at the four corners of every optic, as depicted in Figure 3. These Braille marks served as reference points for orientation during the processing of FODI images. By aligning the FODI image with these marked corners, we ensured that each image was standardized to have the same detection coordinates.
When referencing the offline image area, we located the corresponding damage points on the matching online image and then calculated their coordinates. However, due to differences in position, light intensity, and contrast ratio between images taken at different times, adjustments were necessary. To achieve accurate adjustments, we utilized the information from the four corner images and the various Braille marks present on the optics. These references helped to calibrate the position, intensity, and contrast of the images, ensuring the precise detection and measurement of damages.
Utilizing a deep neural network is indeed a promising approach for estimating the damage area. By training the network on a dataset containing various trends of damage areas, it can learn to make predictions for specific damage areas occurring at different experiment times. This enables the network to perform three key functions: statistical analysis, tracing the origins of damage, and making predictions for future damage occurrences.
Additionally, by incorporating the time dimension into damage detection, we defined the regularity of the variation in both individual damage points and total damage area over time. This allowed for the systematic management of damage, enabling us to track changes in damage patterns, identify potential causes, and implement preventive measures accordingly. By leveraging the capabilities of deep learning and time-series analysis, we can enhance our understanding of damage dynamics and improve our ability to manage and mitigate its impact effectively.

3. Implementation

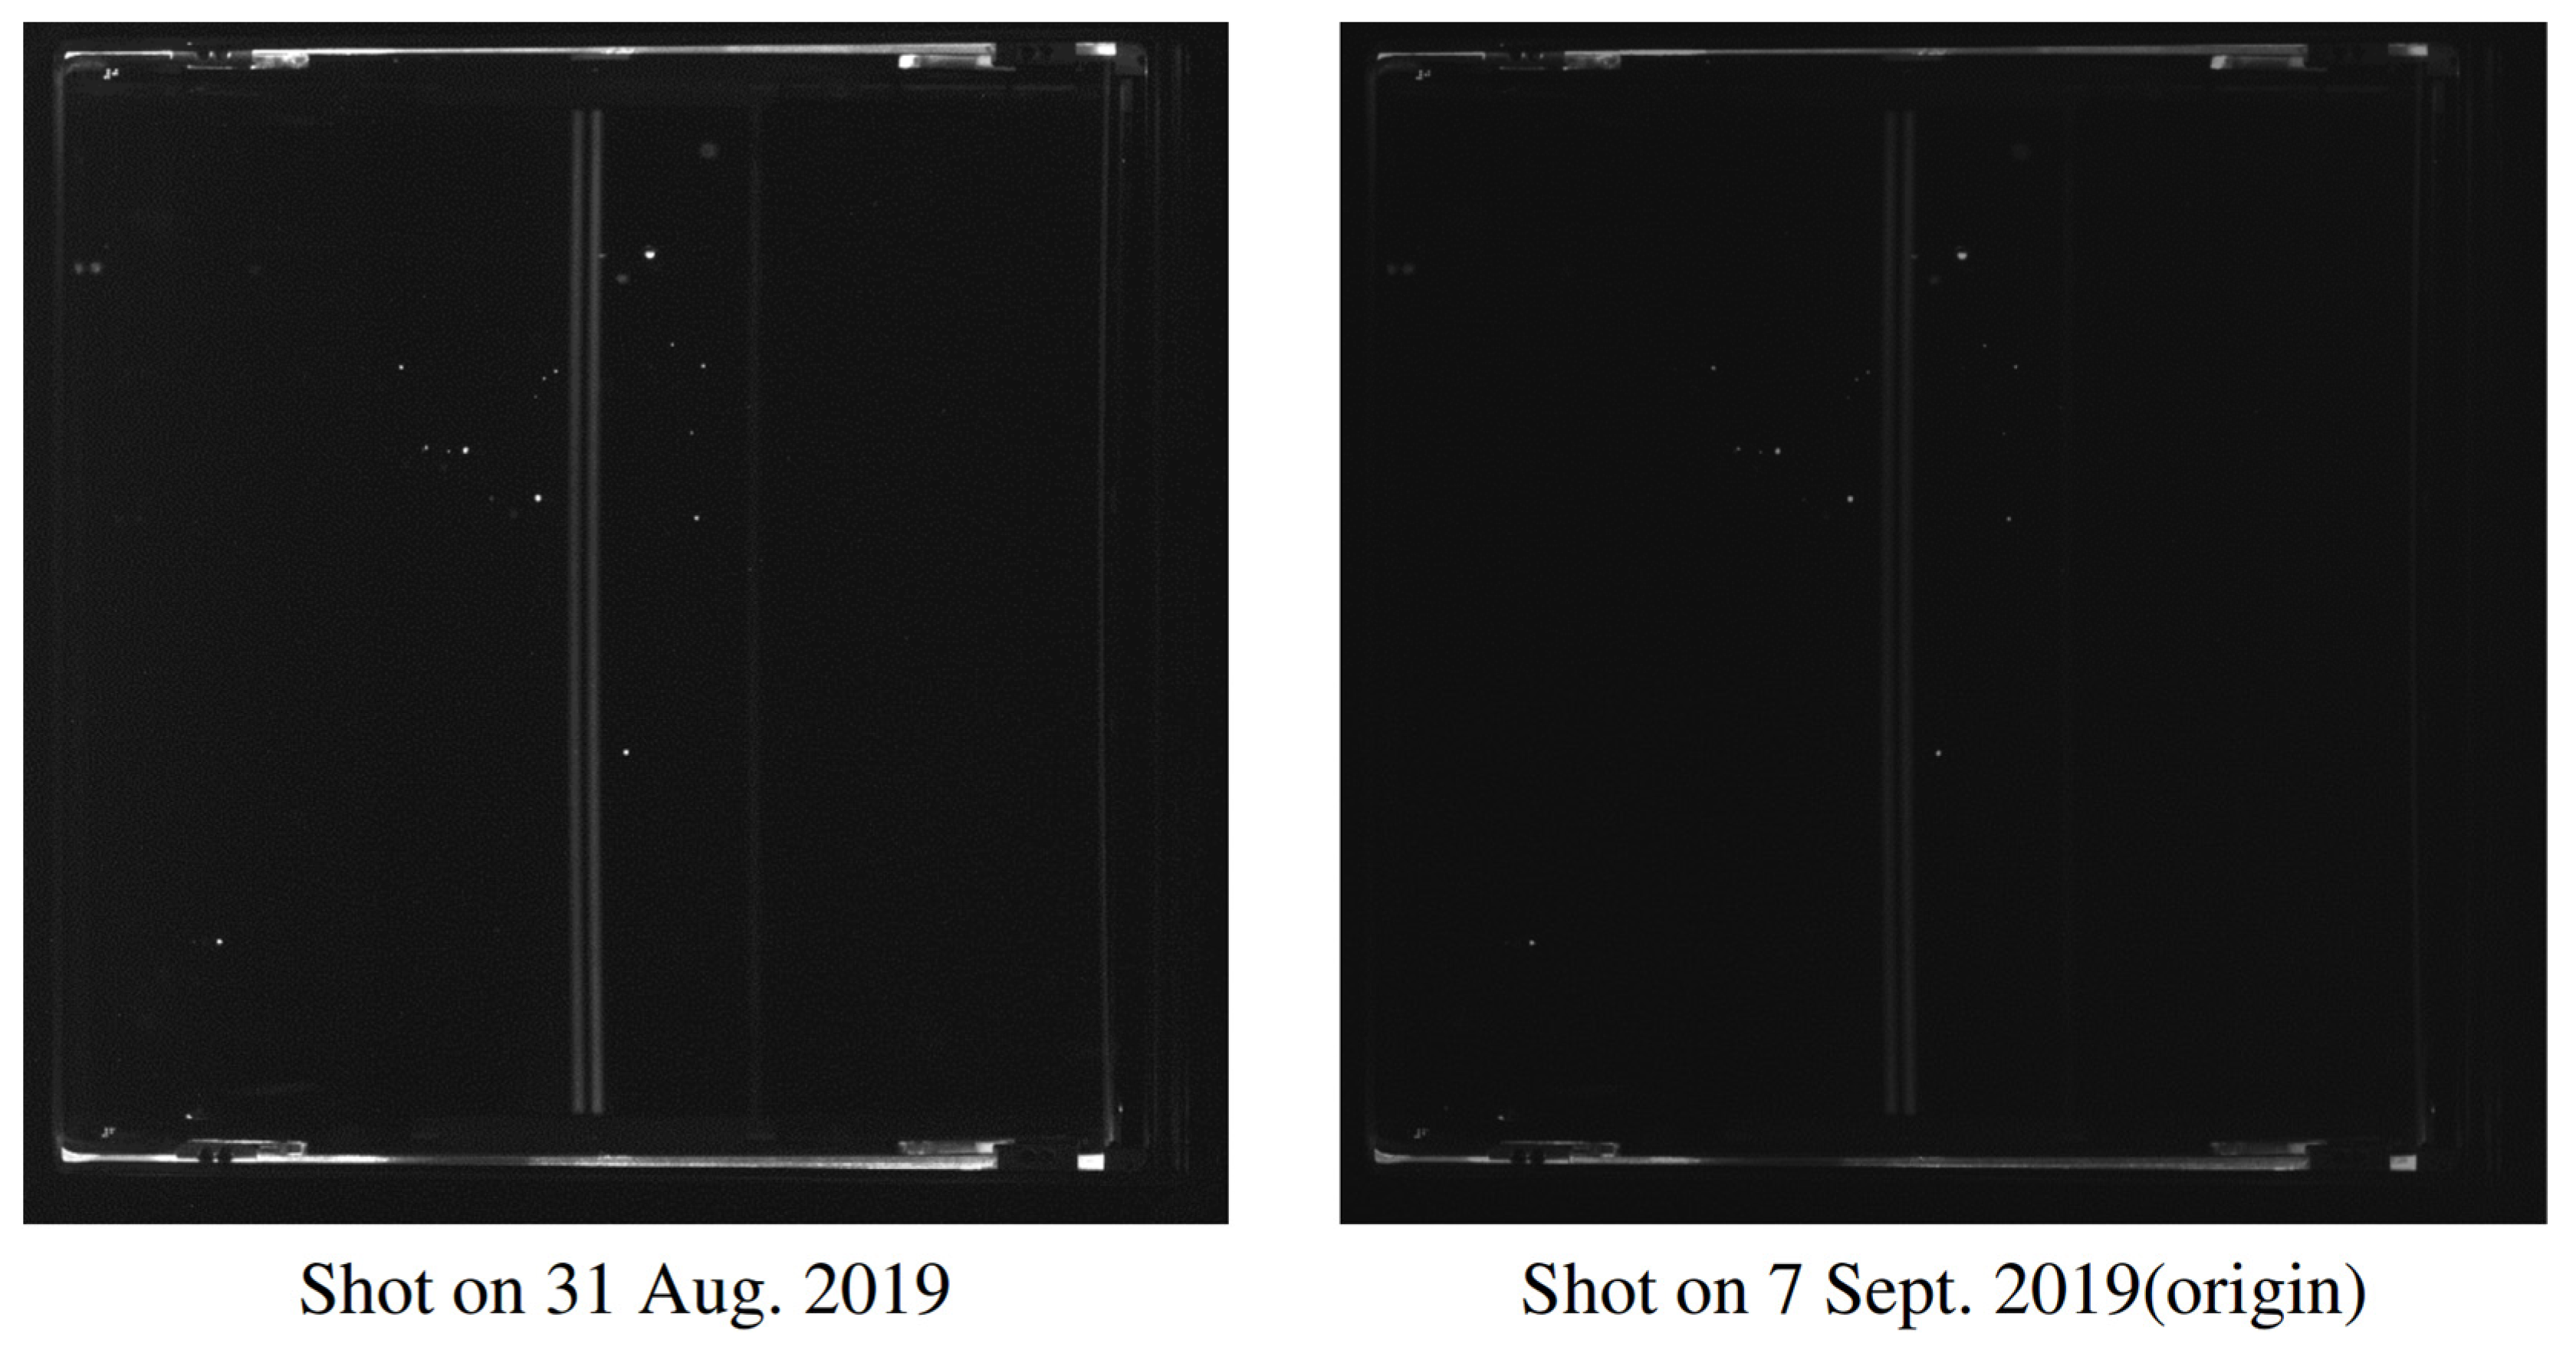
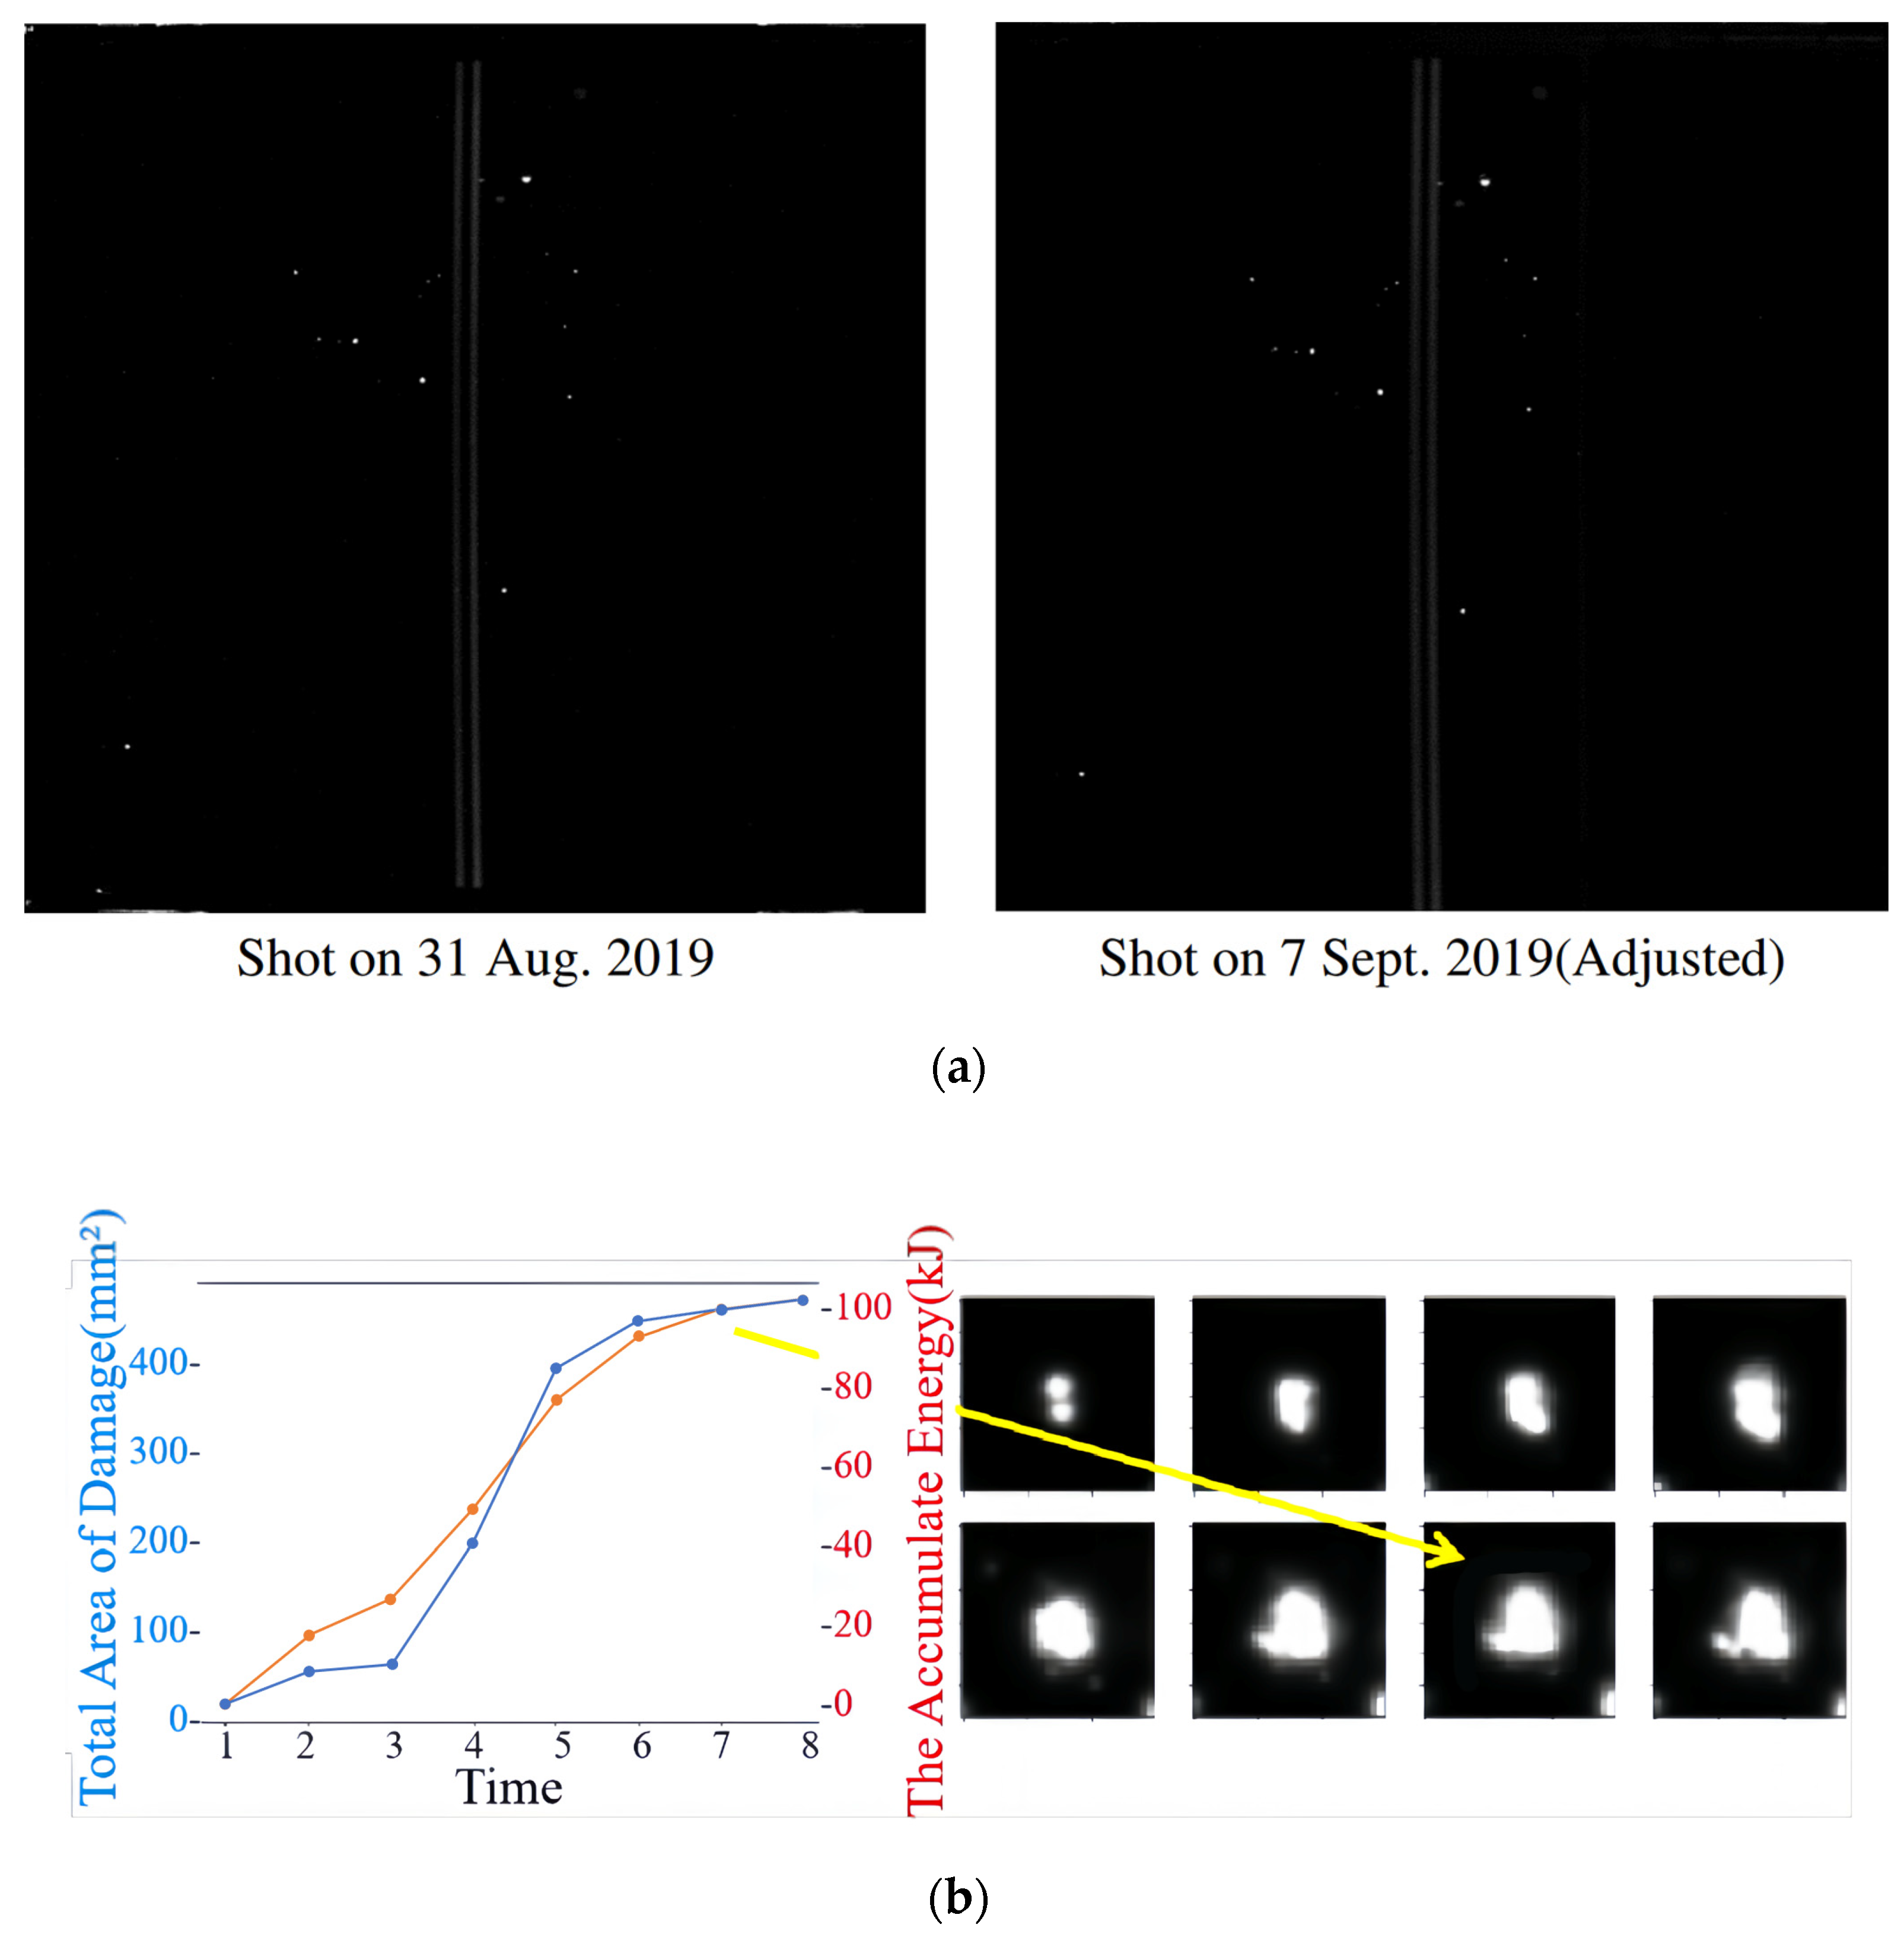
3.1. Data Preprocessing

Taking FODI images once a week for maintenance purposes introduces variability in environmental conditions, leading to differences in light intensity and contrast ratio between images. This variation can indeed affect the accuracy of damage area calculations. Figure 4 illustrates a single damage point captured over different time intervals, showcasing the variability in damage appearance.
Furthermore, as depicted in the seventh picture of Figure 5 (taken on 7 September 2019), inconsistencies in light intensity and contrast ratio can result in discrepancies in pixel values for incremental damage. This deviation from the expected pattern contradicts the principle that incremental damage should not be irreversible.
By incorporating these strategies, we can enhance the accuracy and reliability of damage area calculations in FODI images, enabling more effective maintenance and management of structural integrity.
In order to solve the problem mentioned above, we have tried several algorithms, but no one worked well. Finally, we adopted the method of adjusting the light intensity coefficient of the entire image based on the Braille markers as a reference. The adopted solution involves using braille marks as references to adjust light intensity coefficients for entire images, with the following steps:
(a)
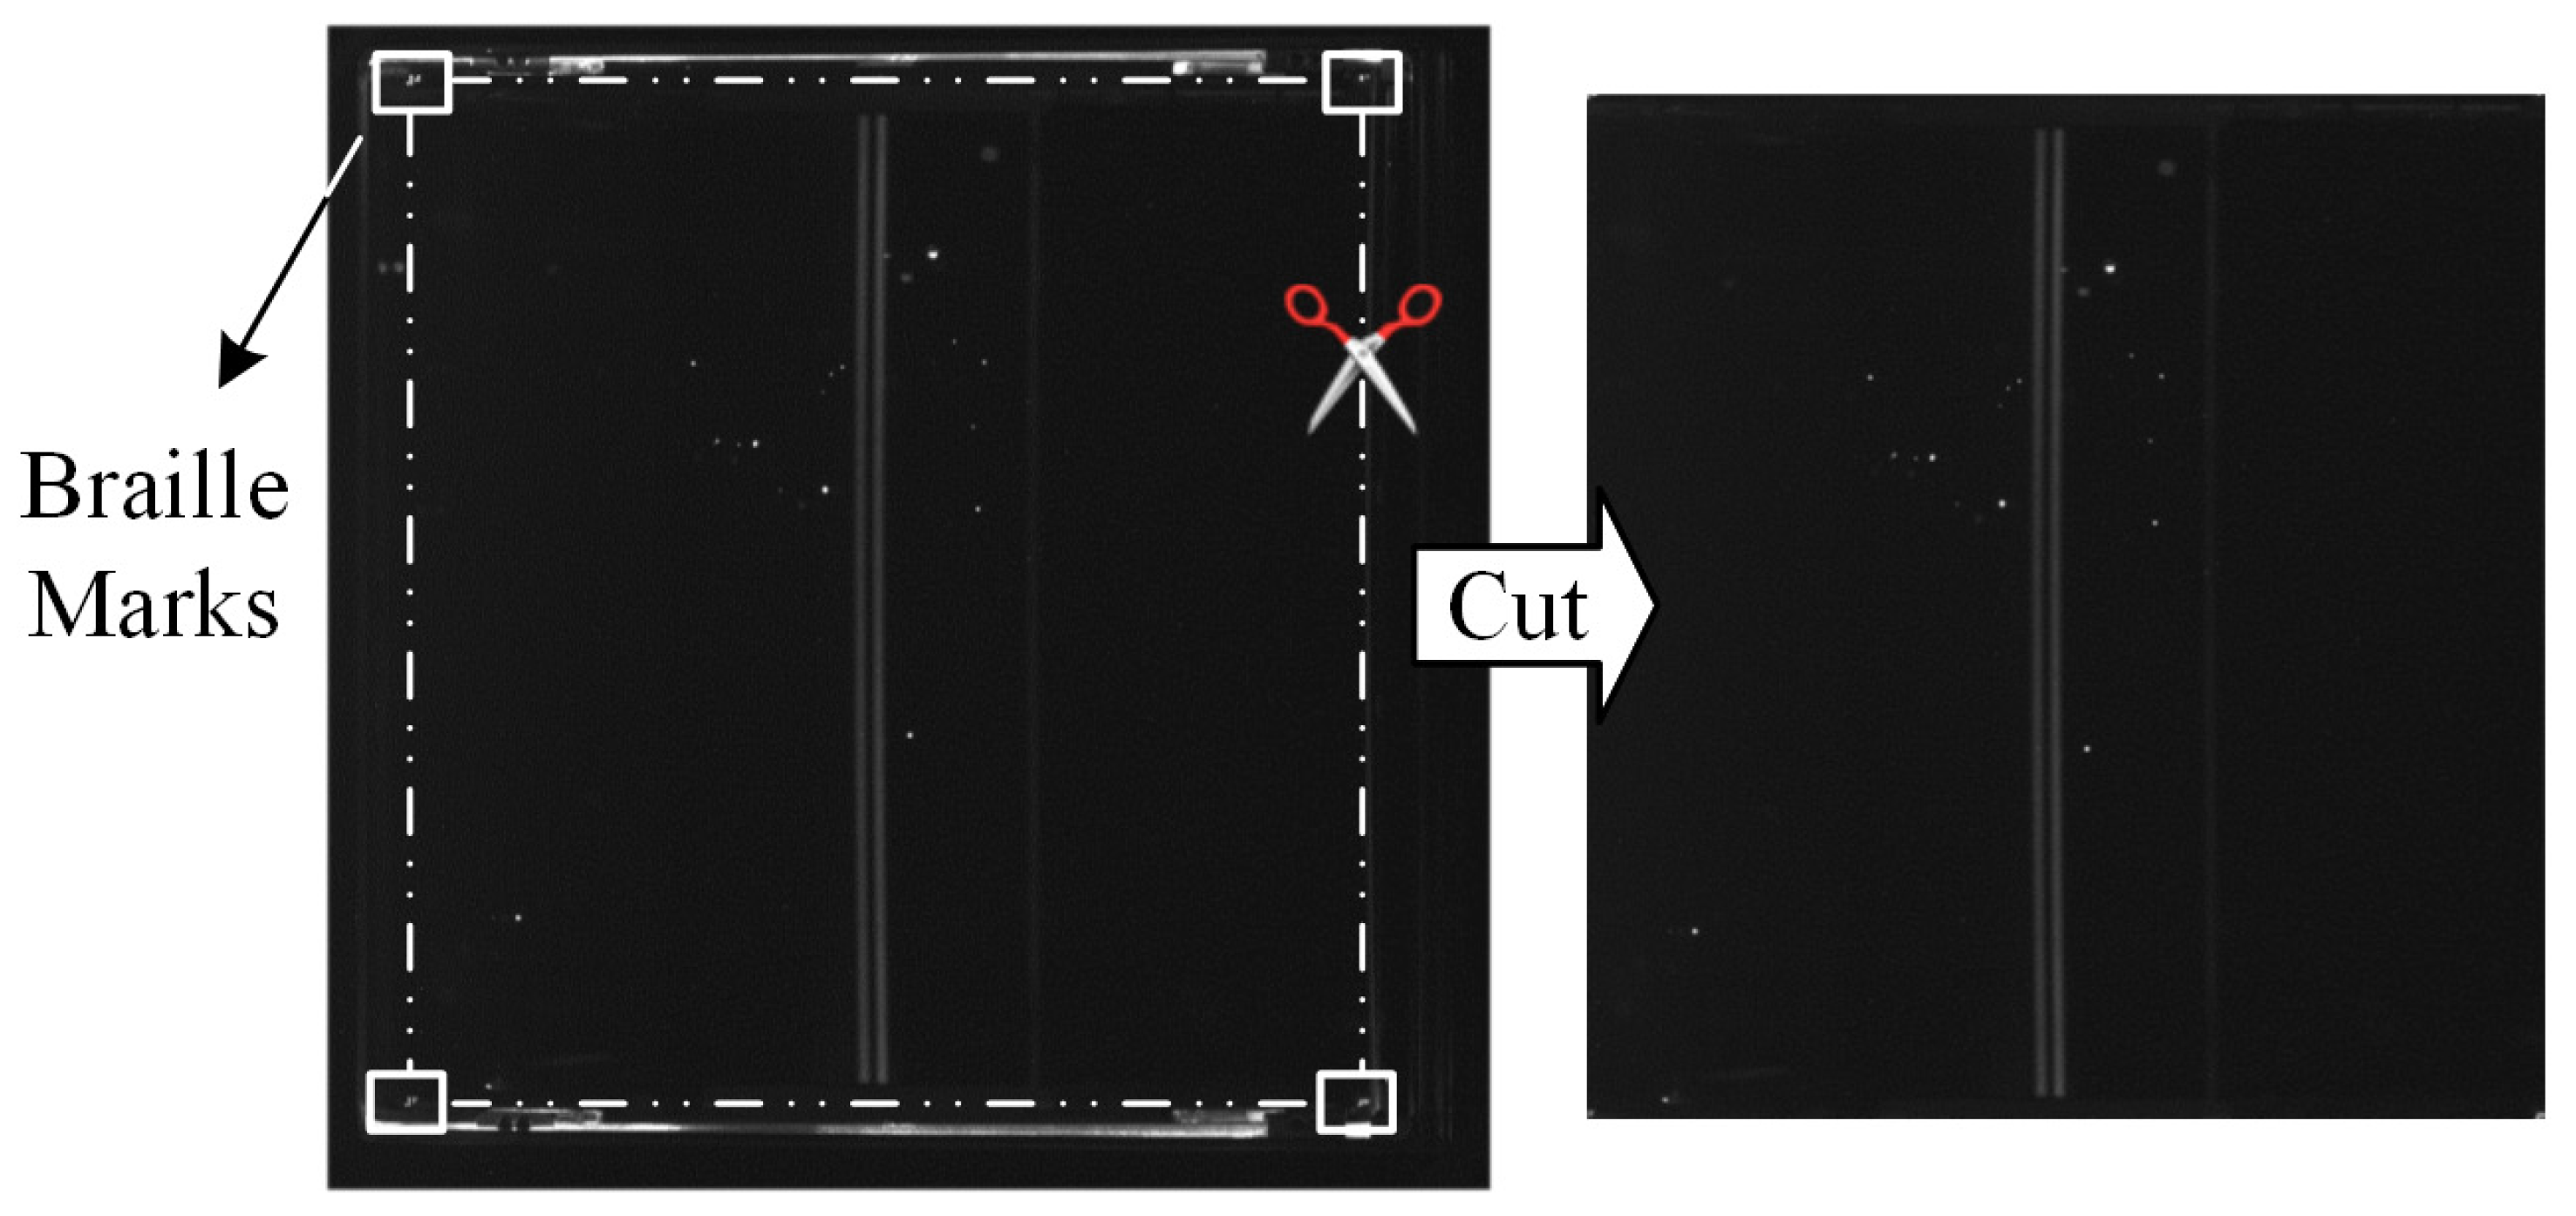
Image Preprocessing: identical areas marked by braille marks were extracted from all images;
(b)
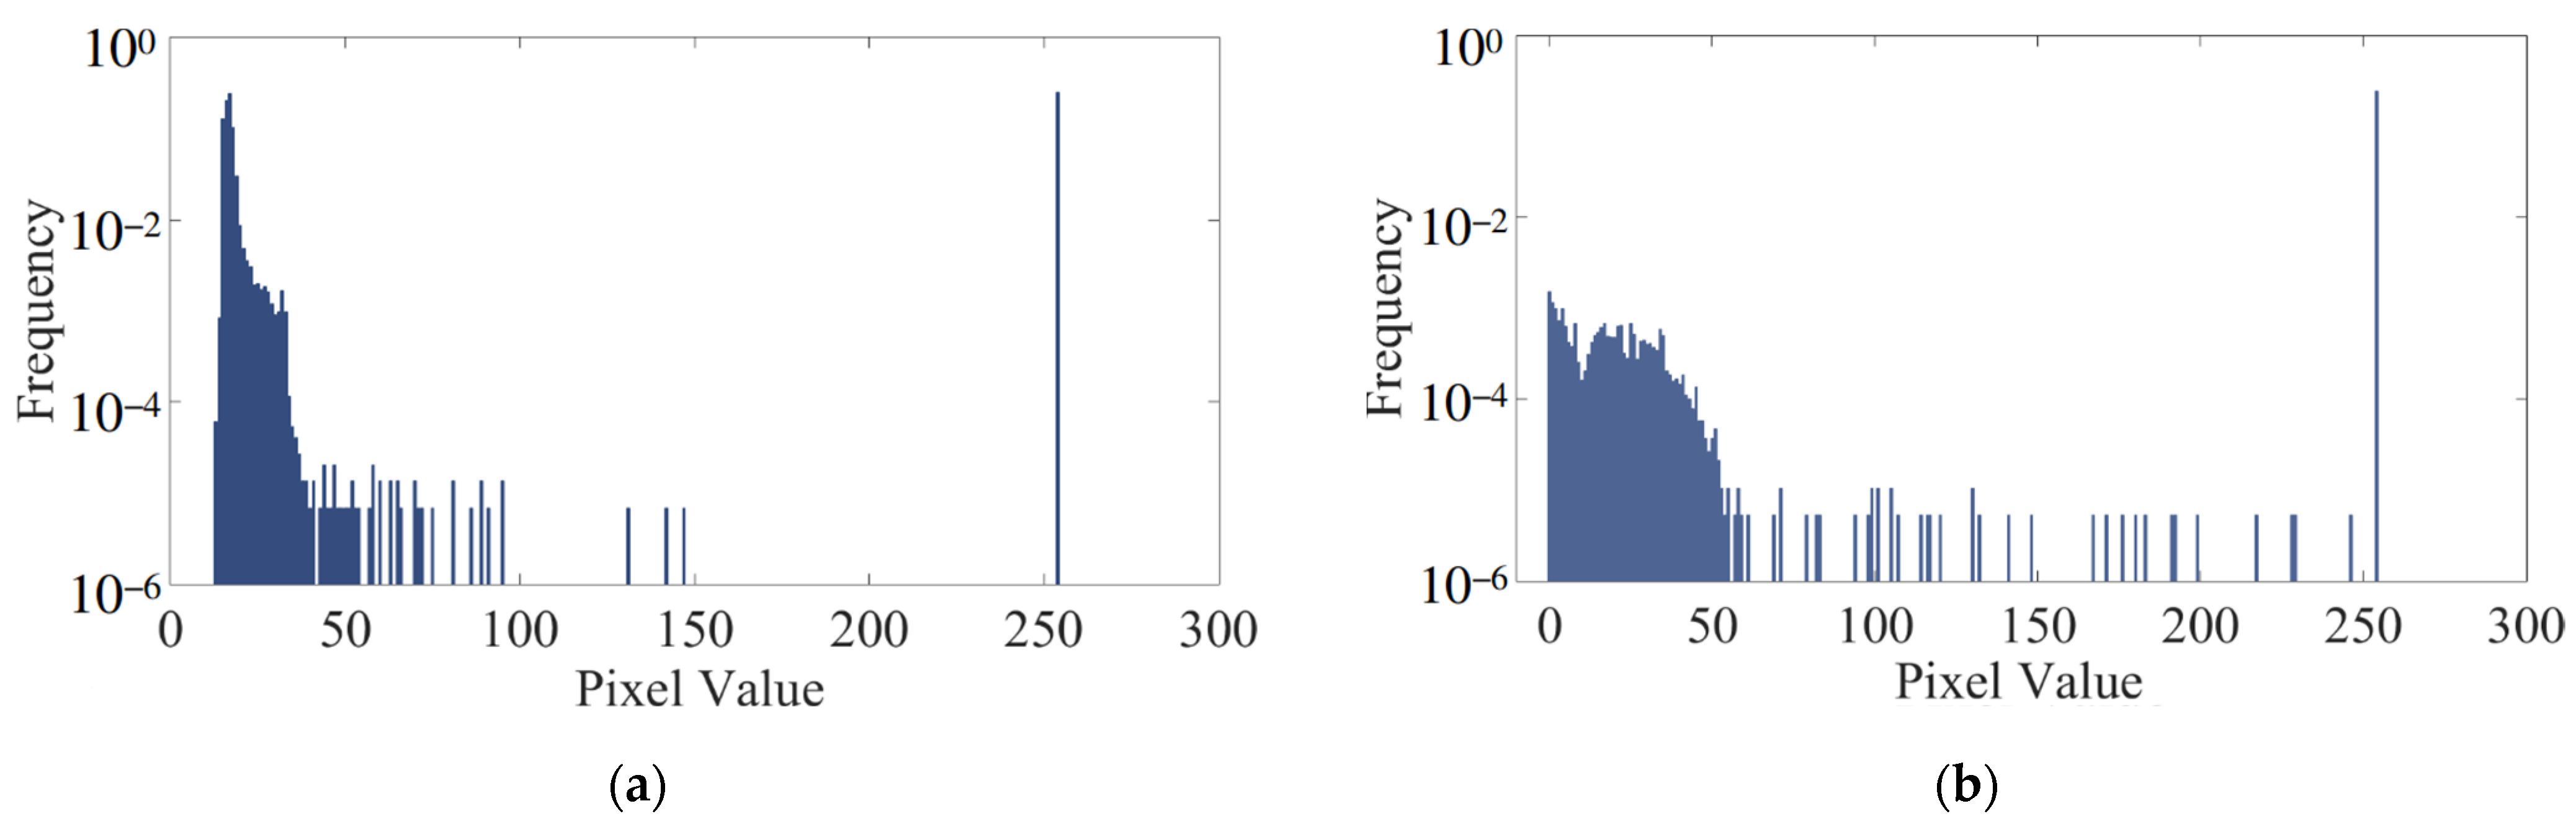
Grayscale Normalization: grayscale distributions within these areas were normalized to ensure consistency across images;
(c)
Criterion Selection: the image with the maximum grayscale value (piupper) was selected as the criterion;
(d)
Grayscale Adjustment: grayscale intervals of other images were adjusted to match the criterion image;
(e)
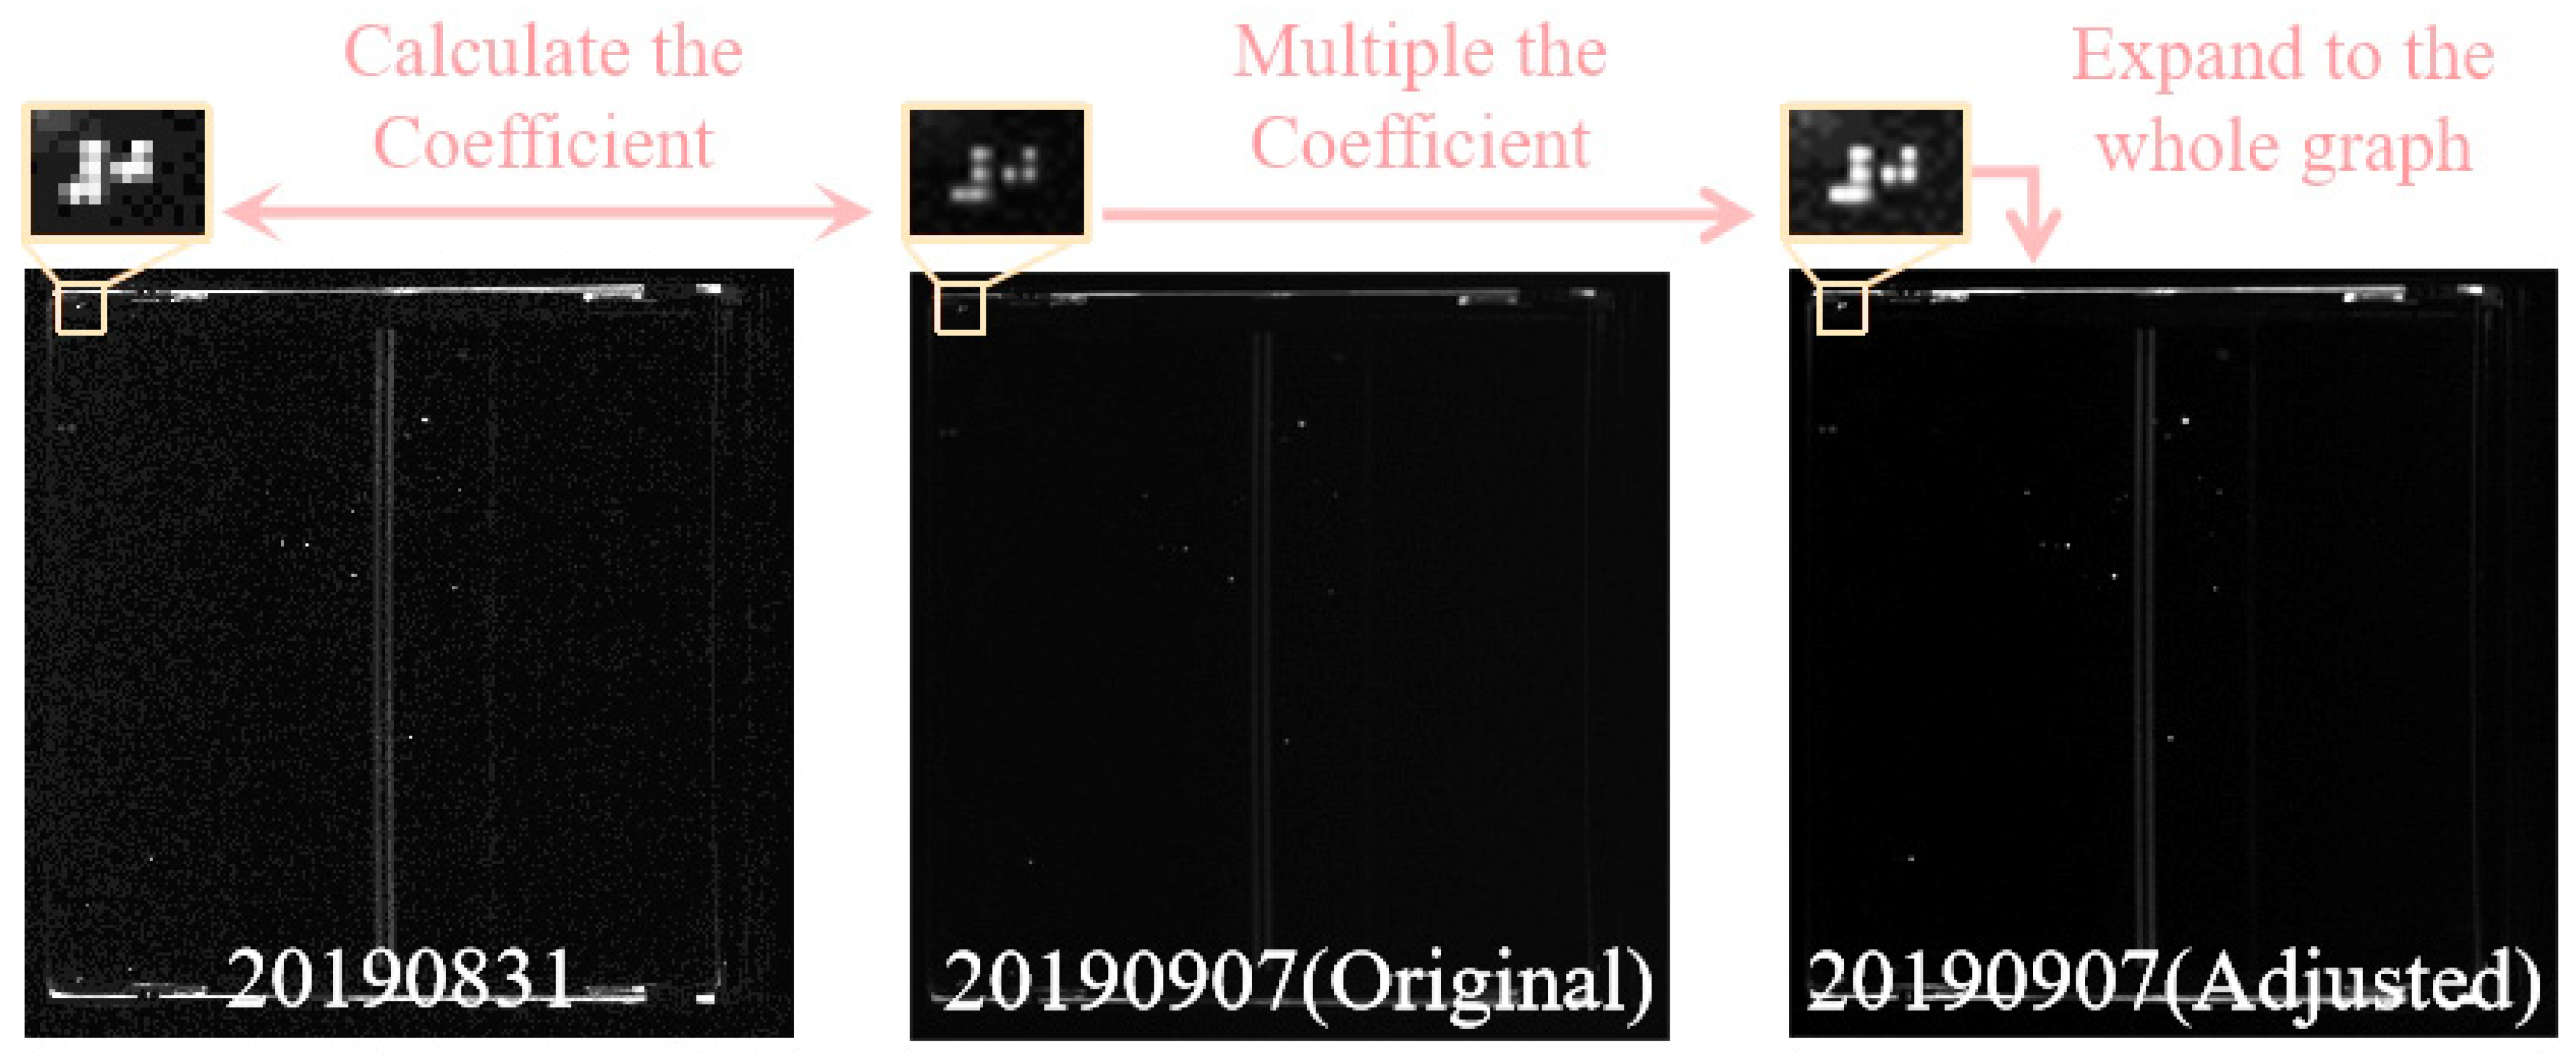
Coefficient Calculation: each image was assigned its adjustment coefficient (co(i)), likely based on its grayscale values relative to the criterion image;
(f)
Adjustment Application: the pixel values of each image were multiplied by their respective adjustment coefficients to achieve uniform brightness values across the image set.
Figure 6 and Equation (1) illustrate the process of cutting identical areas marked by Braille marks from all images, obtaining the normalized distribution of pixel grayscale in these areas. Subsequently, the image with the maximum grayscale value was selected as a criterion, denoted as piupper. The grayscale intervals of other images were adjusted to match this criterion, and their adjustment coefficients, denoted as co(i), were calculated accordingly. Ultimately, the pixel values of the remaining complete images were multiplied by their corresponding adjustment coefficients to achieve a uniform set of brightness values across all images. Equation (1) defines the variables used in the adjustment process, where n represents the number of pictures, piadj denotes the pixel value after adjustment, piori represents the pixel value before adjustment, and piori signifies the total number of pixels in the i-th picture.
piupper(0) = max{piupper(1), piupper(2), piupper(3),…, piupper(n)}
co(i) = piupper(i)/piupper(0)                 (i∈[1,n])
piadj(i)(j) = piori(i)(jco(i)               (j∈[1,mi])
Next, we proceeded to adjust the contrast of the image. While achieving complete uniformity in contrast values may not be feasible, our objective was to equalize the low-contrast areas to bring them closer in value. Figure 7a depicts the gray distribution histogram of the FODI image captured on 7 September. Noticeably, pixels with values close to 0 constitute a relatively high proportion and are densely distributed, suggesting that the image is generally dark and exhibits low contrast. Subsequently, we equalized the histogram of the image, resulting in the histogram displayed in Figure 7b. Upon examination, it is evident that the gray distribution after processing is more uniform, signifying an enhancement in image contrast.
To prevent issues such as abnormal damage area calculation arising from significant contrast differences, it is crucial to ensure that the contrast values between each image are similar. The contrast is computed using Formula (2) as follows:
c = ∑r(i, j)·r(i, j)·p(i, j)
r(i, j) = |i − j|
The contrast value c is determined by the upper formula, where r(i,j) represents the gray difference between adjacent pixels, and p(i,j) denotes the pixel distribution probability of r for the gray difference between adjacent pixels.
The contrast values before and after the aforementioned image processing are c7ori = 117.99 and c7adj = 214.63, respectively. A comparison between the processed image and the previous one is depicted in Figure 8. It is obvious that the progression of the damages becomes normal compared with Figure 4.
Each Braille mark can be conceptualized as a unique combination of a group of small circular points. Therefore, we employed a feature extraction technique for detecting circles, namely the Circle Hough Transform (CHT) [32]. This method was combined with the standard Braille pattern corresponding to the last four digits of its component number to identify and locate Braille marks. Figure 9 illustrates the Braille target pixel area detected before and after adjusting the brightness and contrast of the eight pictures. It is evident that the adjusted Braille target area values are similar, indicating that the eight pictures essentially achieve normalization in terms of brightness and contrast.
To establish the mapping between online and offline images, we utilized Braille positioning to standardize their coordinate systems. Upon obtaining the coordinates of the four corner Braille marks, the original image was cropped to extract training set samples, as depicted in Figure 10.

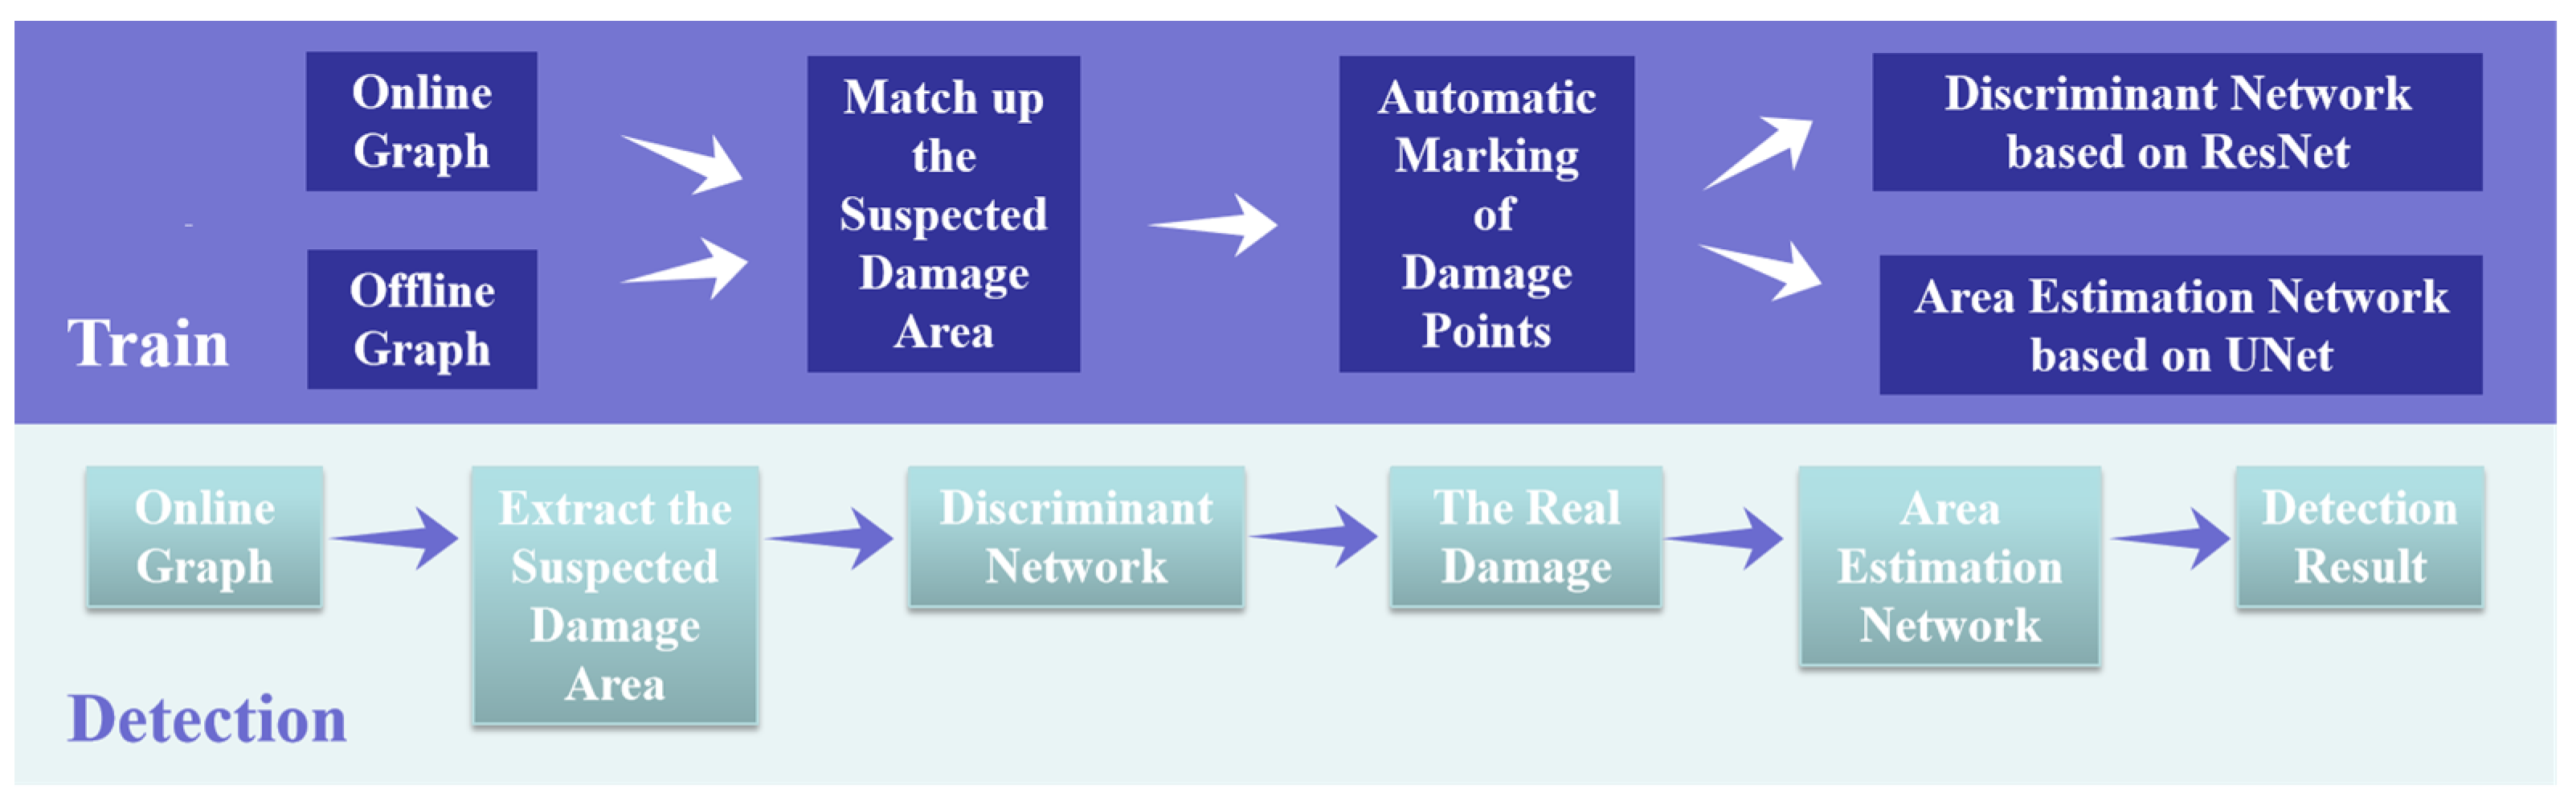
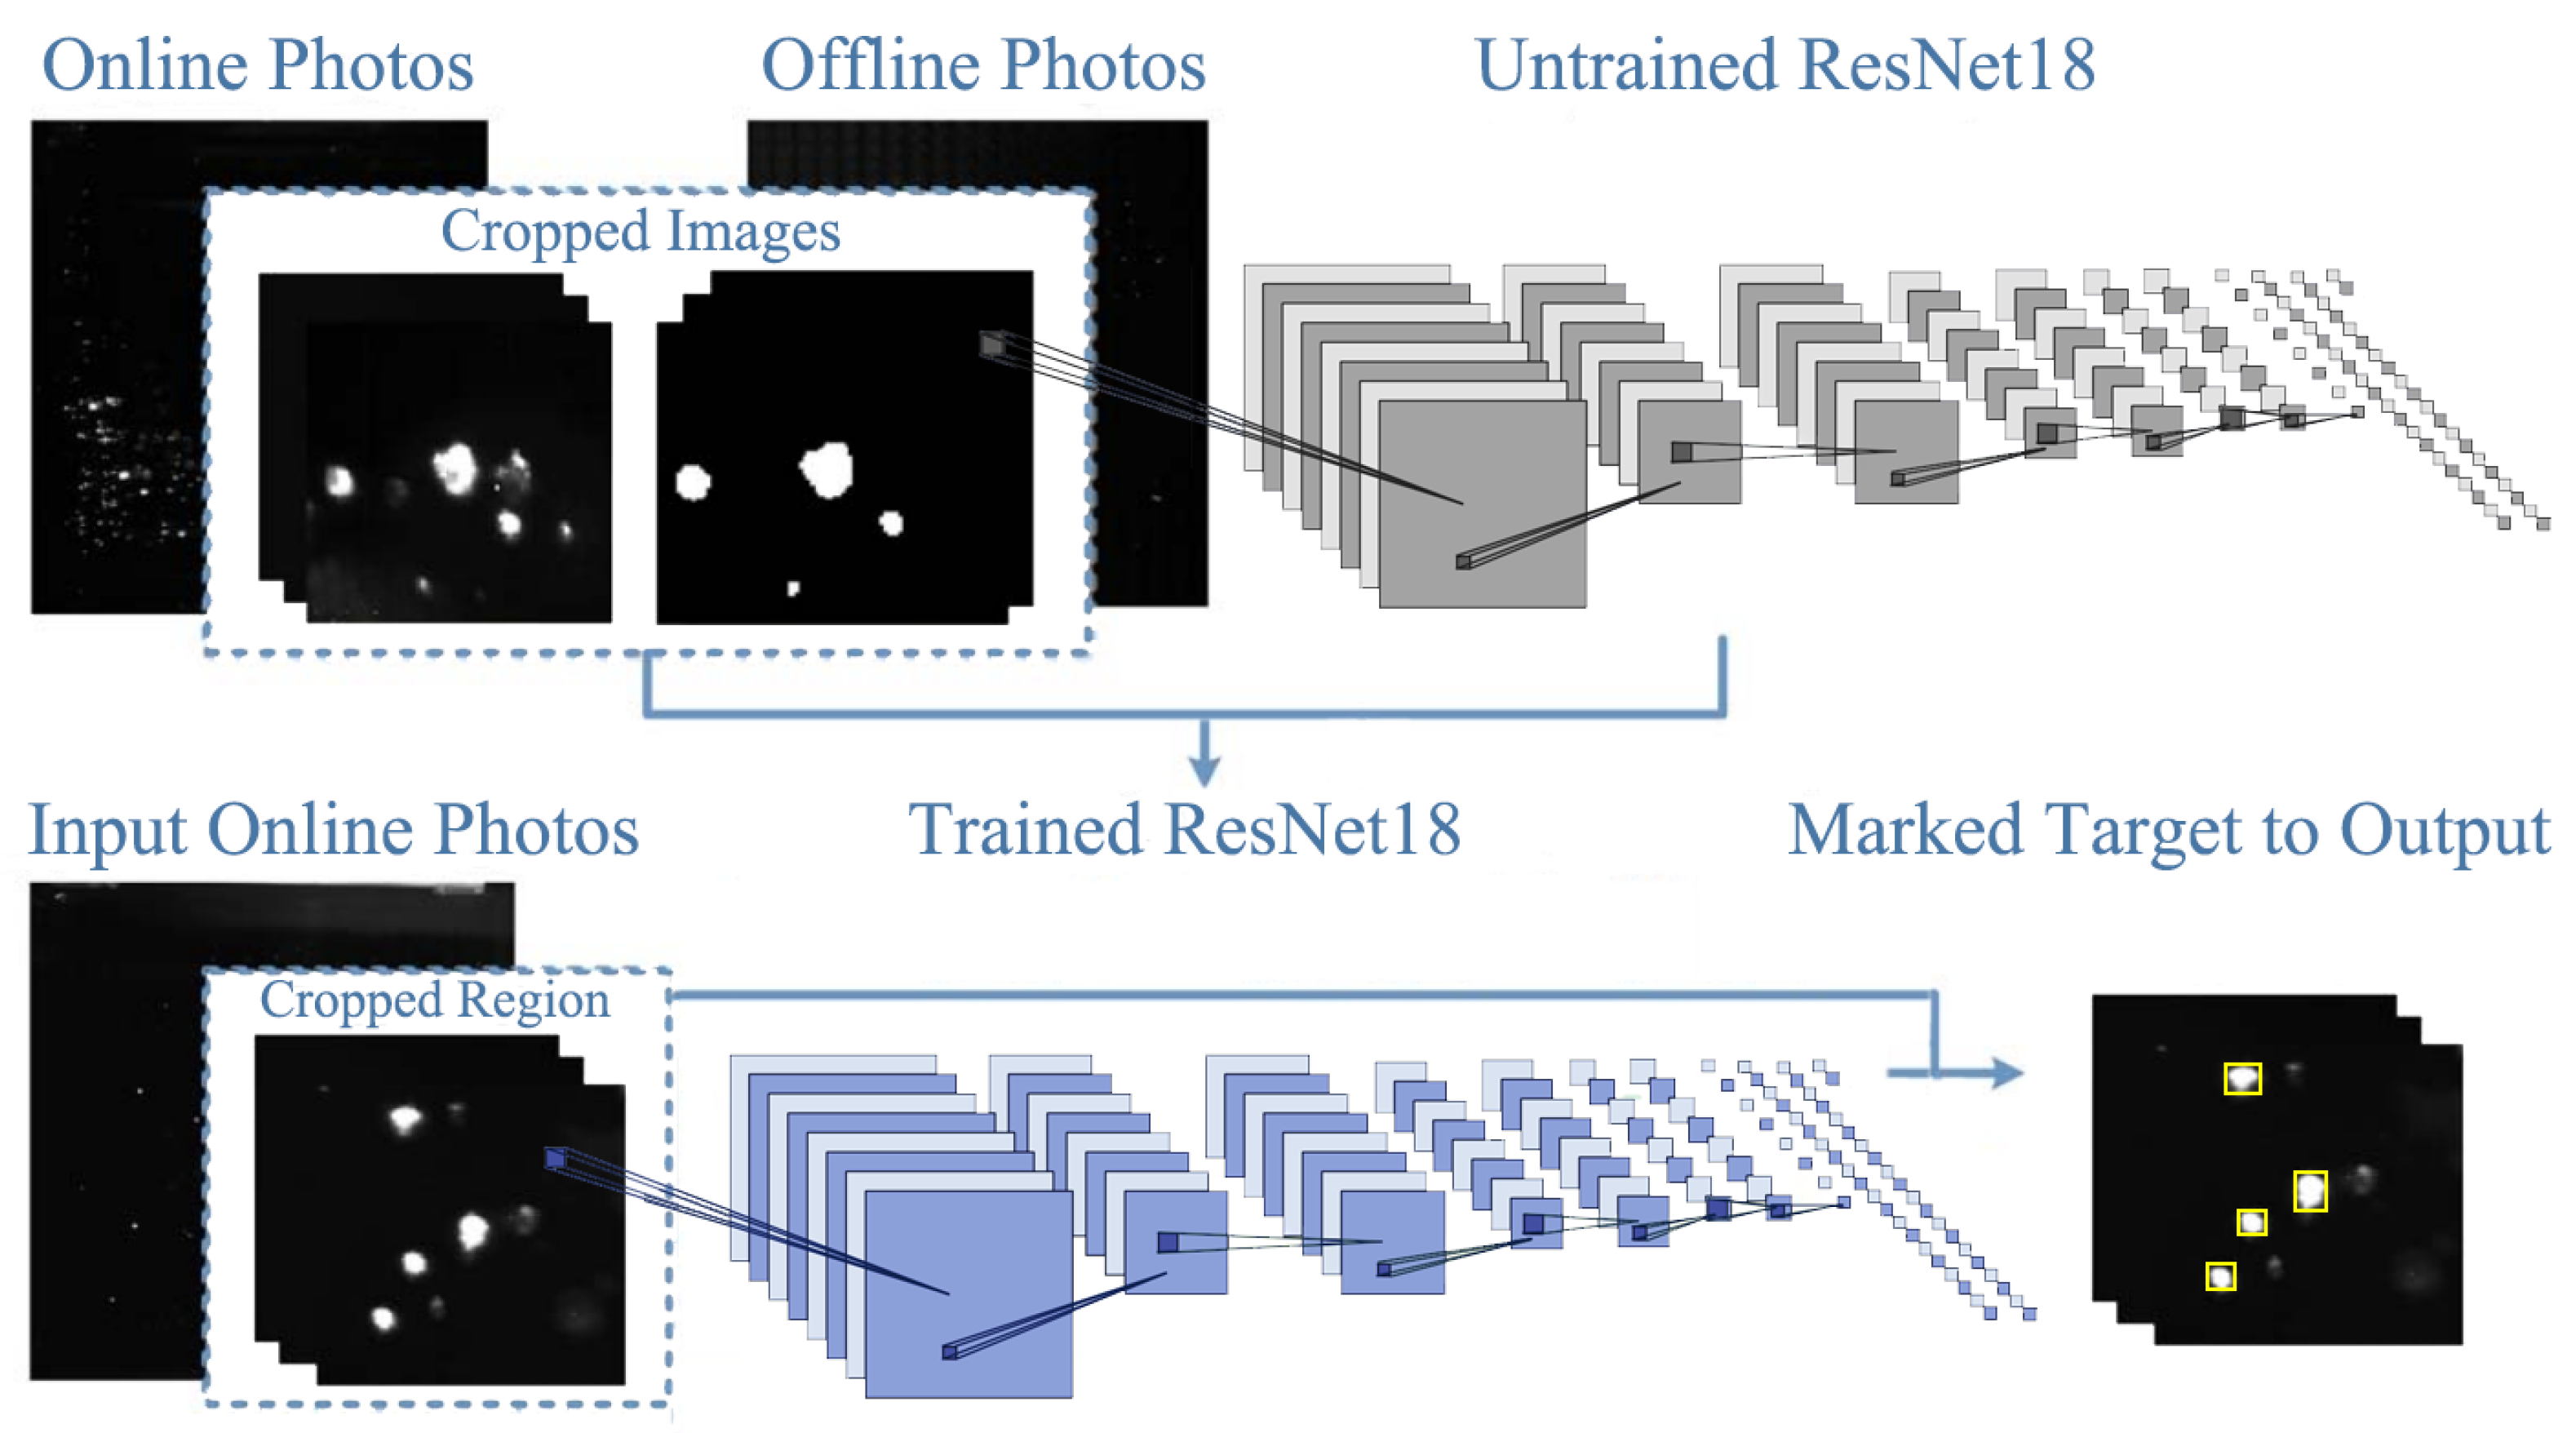
3.2. Algorithm and Model Training

To achieve more accurate discrimination between true and false damage, it is essential to replace cumbersome feature engineering with the nonlinear operations of deep neural networks. This allows for capturing richer target patterns and features, addressing classification challenges that may be difficult to discern at the surface level. However, excessively deep networks may lead to a degradation problem [33], where the accuracy of the training set plateaus or even deteriorates. Residual networks (ResNets) [34,35] offer a solution to this issue through their unique identity mapping structure, effectively avoiding degradation. ResNet-18 [36,37] was chosen for its more lightweight architecture, more efficient performance, faster training and inference speeds, better generalization ability, and easier training and tuning compared to other versions of ResNet. It is a high-performing model suitable for resource-constrained environments, which is suitable to tackle the problem of recognizing real damage targets.
Once real damage was identified, we employed a method to estimate the number of pixel grids, enabling the quick and convenient determination of the area for each damage point. In scenarios with limited samples, the advanced U-Net++ algorithm [38,39,40], based on the U-shaped architecture of fully convolutional networks, was selected. It can capture features at various levels and integrate them through feature concatenation, resulting in higher accuracy in image segmentation. U-Net++ eliminates the need for manual feature extraction and efficiently utilizes limited training samples.
The idea framework is shown in Figure 11.
In this study, transfer learning and the feature pyramid network [41,42] were employed to pinpoint the real damage of elements. The deep learning model was pretrained using a public dataset containing similar scenes, while the last several layers of the pretrained model were fine-tuned using online–offline image sample data of elements after data augmentation. The deep learning model adopted a feature pyramid network structure based on ResNet-18, which had 18 main layers, with 16 convolutional layers and 2 fully connected layers, as illustrated in Figure 12.
The resolution of the online and converted offline images, approximately 3000 × 3000, exceeded the neural network’s input capacity. Consequently, the images were resized into smaller patches with a resolution of 32 × 32 pixels for inputting into the network. Subsequently, the LASNR [43] algorithm was employed to identify highlight positions and determine their full extent on the offline image. These marked points on the offline image represented actual damage instances and served as input labels for training the network, as illustrated in Figure 13. We used the Adam optimizer [44] to train the network. The initial learning rate was 10−3, which allowed the network to converge quickly. The network was iteratively trained with a mini-batch of size 50 until the loss of verified samples was not reduced. For each iteration, we took randomly enhanced samples as input to the network. We then changed the learning rate to 10−4 and iterated the above process to fine-tune the model, until the network converged.
Following the filtration of images with a pure dark background, the dataset comprised 1650 paired images utilized for training the network, each with a resolution of 32 × 32 pixels for both online and offline samples. Subsequently, the dataset was randomly divided into training and validation sets at a ratio of 4:1, yielding 1320 samples for training and 330 samples for validation. The trained model was designed to identify and locate actual damage within the input online images. Upon acquiring the pixel coordinates of actual damage points, a deep neural network utilizing U-Net++ architecture estimated the size of each damage point. The structure of U-Net++ consisted of encoder and decoder modules, with each module containing multiple convolutional layers, pooling layers (in the encoder), or upsampling layers (in the decoder), along with skip connections to preserve and integrate feature information from different levels. The FODI image was grayscale, with pixel values ranging from 0 to 255. Next, the number of pixels with values ≥ 128 was counted within the 32 × 32 resolution offline image, with the additional criterion that the pixel values at the four corners were >0 (to mitigate noise), thereby estimating the area of damaged pixels. This area value served as the label for the corresponding damage point in the online image and was incorporated into the training set of the U-Net++ neural network to derive the area estimation model, as illustrated in Figure 14. Thus, the pixel area of each damage point could be determined by inputting the online image annotated with actual damage into the model.
To detect multiple online images collected at different times after the same element was put online, we created a file for each damage point and associated each damage point with the time dimension. This allowed us to track the development of the damage area for each specific damage point over time, as illustrated in Figure 15.
To obtain the specific physical location and size of each damage, we utilized affine transformation to convert the detection result data (pixel coordinates) into physical coordinates. This allowed us to determine the precise physical location and size of each damage. Figure 16a illustrates this process, where the damage area is represented on the ordinate axis, and the accumulated energy value from the experiment is represented on the abscissa axis, establishing a coordinate system. According to the numerical fitting results, the growth pattern of tiny damages from the initial stage approximates linearity over a period of time.
We then performed a numerical fit on the damage situation and plotted the damage development curve. By summing the areas of all damage points within the same element, we examined the correlation between the overall damage development of the optic and the experimental parameters (experimental energy). This analysis provided valuable insights into the relationship between damage accumulation and experimental energy.
With this information, we read the parameters of future experimental plans and input the corresponding energy value to predict the damage area of the optics during that specific time period. This predictive capability is depicted in Figure 16b.
By establishing different damage thresholds for each optic, we could determine the latest shelf removal date. This approach effectively prevents irreparable serious damage caused by overload, ensuring the integrity and safety of the optics.
To assess the accuracy of the predicted damage area, we selected five components and predicted their total damage areas for the upcoming period at each time node. Subsequently, we compared these predicted areas with the actual damage areas observed after completing the experiments in the next period, which spanned over a month. The results of this comparison are presented in Table 1 and Figure 17.
In Table 1, there are predicted values and actual values on different dates for each object (Optics A, B, C, D, and E). The mean relative error (MRE) was calculated using Formula (3) as follows:
ε M R = 1 n ( | P r e d i c t e d   V a l u e A c t u a l   V a l u e A c t u a l   V a l u e | ) × 100 %
where ɛMR is the MRE, and n is the total number of samples. Based on Formula (3), we calculated that ɛMRA ≈ 2.99%, ɛMRB ≈ 5.80%, ɛMRC ≈ 0.55%, ɛMRD ≈ 1.84%, ɛMRE ≈ 7.50%.
We set the tolerance to 10%; thus, any data whose error within this range can be regarded as a valid prediction. Based on the above calculation results, it can be concluded that the accuracy of the area prediction exceeds 90%.
In Figure 16, the gray dotted lines represent the historical daily output energy, while the blue lines depict the planned daily output energy. The fold lines depict the changes in the overall damage area of the optic over time. These lines connect the damage areas at each time point, clearly showing the trend of damage area variation. By observing these trends, we can understand the accumulation of damage and whether the rate of damage development is within acceptable limits. By defining a critical point for the damage area, we can determine the latest maintenance date by identifying the intersection point between the fold line and the corresponding energy output point. This approach enables us to establish a proactive maintenance schedule based on critical damage thresholds and energy output levels, ensuring optimal operational efficiency and component longevity.

4. Results

The proposed method successfully achieved online damage detection on the optics of the FOA based on ResNet, with a success ratio exceeding 95% and a failure ratio less than 5%. In order to further characterize the performance of the trained ResNet-18 model, we calculated the accuracy (P) and recall rate (R) at the object level, and the numbers of true positives (TP), false positives (FP), false negatives (FN), and F1 score were determined using Formula (4) as follows:
P = TP/(TP + FP)
R = TP/(TP + FN)
F1 = 2PR/(P + R)
In this case, TP corresponds to true damages correctly labeled by the model, and FP/FN corresponds to false/real damages incorrectly labeled by the model as real/false damage. After training, the recall rate of ResNet-18 on the test set is 95.7%, the accuracy rate is 92.5%, and the F1 score is 0.94. FP/FN mainly results from tiny damages whose size of pixels is at the same level as the background noise of images. As depicted in Figure 18, the predicted damage for each element is highlighted and circled in red. Furthermore, this technology has been seamlessly integrated into a proprietary optics management software in our central control room and has been applied in practical settings for several years. This integration has undoubtedly enhanced the efficiency and effectiveness of damage detection and maintenance processes within the FOA system.
The examination reveals that the prediction of each incremental damage trend, and the overall growth of damage areas on optics can be visually represented. Moreover, this technology was successfully implemented in the high-power laser facility of CAEP. It allows for the examination of multiple online images of a single element captured at various times. By selecting any damage point in Figure 18, the software displays the evolving trend of that specific damage, as illustrated in Figure 19.
Figure 19b presents similar content to Figure 16b, depicting the prediction for overall damage trend variations. By combining future experiment plans and relevant experimental parameters with predictions, the system can effectively manage all elements in optimal conditions. When the damage area approaches a critical point, maintenance warnings are issued to prevent catastrophic damage. Experimental results demonstrate an accurate prediction ratio for damage area, exceeding 90%. This robust predictive capability ensures proactive maintenance and enhances the overall operational efficiency and safety of the system.

5. Conclusions

This study proposes a vision-based approach for detecting and predicting damage on optics using image segmentation. The deep learning system accurately identifies laser-induced damages on optics in real time and predicts their area based on future experiment parameters. To overcome the challenge of limited samples, a method combining ResNet and U-Net algorithms, along with data augmentation and image processing techniques, achieves precise damage detection. Normalizing sample brightness and contrast and using Braille markers for localization ensure consistency in studying area growth and accurate damage detection across samples.
Unlike typical classification models that assign a single label to an entire image, the ResNet model employed in this approach assigns a class label to each pixel, enabling better localization of damages. Moreover, this detection model can be trained end to end with small samples without the need for manual labeling or feature extraction. This method also exhibits advantages over other detection methods when dealing with samples containing multiple adjacent objects. It effectively identifies false damages caused by reflections through spatial and intensity information, which improves efficiency and accuracy compared to previous studies using typical classification models.
The proposed method demonstrates high effectiveness, with over 97% success rate in damage detection and less than 7% failure rate, mostly due to pixel loss. We can predicted the damage areas with less than 10% average relative error, making it suitable for online detection and maintenance in large laser facilities with limited samples. While promising for improving optic efficiency and longevity, the system’s predictive ability relies on imaging system quality, and failure to detect Braille marks may affect accuracy. Moreover, it does not effectively utilize successive weekly images to discern tiny defects from backgrounds, suggesting potential enhancement through deep learning techniques for tracking and predicting damage growth. Optimizing the hardware conditions of the lighting system to ensure clear visibility of the four Braille markings and improving the current experimental process by utilizing idle time slots to capture online FODI images could further enhance the capabilities and reliability of the online optics damage detection system.
This approach offers a new perspective for addressing the longstanding challenge of real-time laser optical damage prediction, advancing the field, and providing new solutions for the daily operation and maintenance practices of large-scale laser facilities. While our method requires further refinement, it holds the potential to enhance the reliability, efficiency, and lifespan of optics, thus promoting the widespread application of high-power laser technology in scientific and industrial domains. Future research can focus on improving the robustness of the algorithm and integrating continuous online images into the analysis pipeline to further enhance the performance and reliability of optics.

Author Contributions

Conceptualization, X.H. (Xueyan Hu) and Z.C.; methodology, W.Z. (Wei Zhou); software, H.G.; validation, W.Z. (Wei Zhou); formal analysis, Z.C.; investigation, W.Z. (Wei Zhong); resources, B.Z.; data curation, B.Z.; writing—original draft preparation, X.H. (Xueyan Hu); writing—review and editing, Z.C.; visualization, W.Z. (Wei Zhou); supervision, Q.Z.; project administration, Q.Z.; funding acquisition, X.H. (Xiaoxia Huang); formal analysis, X.H. (Xueyan Hu) and Z.C. All authors have read and agreed to the published version of the manuscript.

Funding

This research was funded by the NATURAL NATIONAL SCIENCE FOUNDATION OF CHINA (grant: 62105310).

Data Availability Statement

Data available on request due to restrictions (confidential experimental data). The data presented in this study are available on request from the corresponding author.

Acknowledgments

The authors would like to gratefully acknowledge the auspices of colleagues in the Laser Engineering Division of the Laser Fusion Research Center.

Conflicts of Interest

The authors declare no conflicts of interest.

References

  1. Wang, G. Overview of the latest progress in laser inertial confinement fusion (ICF). Nucl. Sci. Eng. 1997, 017, 266–269. [Google Scholar]
  2. Howard Lowdermilk, W. Inertial Confinement Fusion Program at Lawrence Livermore National Laboratory: The National Ignition Facility, Inertial Fusion Energy, 100–1000 TW Lasers, and the Fast Igniter Concept. J. Nonlinear Opt. Phys. Mater. 1997, 06, 507–533. [Google Scholar] [CrossRef]
  3. Tabak, M.; Hammer, J.; Glinsky, M.E.; Kruer, W.L.; Wilks, S.C.; Woodworth, J.; Campbell, E.M.; Perry, M.D.; Mason, R.J. Ignition and high gain with ultrapowerful lasers. Phys. Plasmas 1998, 1, 1626–1634. [Google Scholar] [CrossRef]
  4. Hirsch, R.L. Inertial-Electrostatic Confinement of Ionized Fusion Gases. J. Appl. Phys. 1967, 38, 4522–4534. [Google Scholar] [CrossRef]
  5. Zhu, Q.; Zheng, W.; Wei, X.; Jing, F.; Hu, D.; Zhou, W.; Feng, B.; Wang, J.; Peng, Z.; Liu, L.; et al. Research and construction progress of the SG III laser facility. In Proceedings of the SPIE/SIOM Pacific Rim Laser Damage: Optical Materials for High-Power Lasers, Shanghai, China, 19 May 2013. [Google Scholar]
  6. Wegner, P.J.; Auerbach, J.M.; Biesiada, T.; Dixit, S.N.; Lawson, J.K.; Menapace, J.A.; Parham, T.G.; Swift, D.W.; Whitman, P.K.; Williams, W.H. NIF final optics system: Frequency conversion and beam conditioning. In Optical Engineering at the Lawrence Livermore National Laboratory II: The National Ignition Facility; SPIE: Bellingham, WA, USA, 2004. [Google Scholar] [CrossRef]
  7. Spaeth, M.L.; Wegner, P.J.; Suratwala, T.I.; Nostrand, M.C.; Bude, J.D.; Conder, A.D.; Folta, J.A.; Heebner, J.E.; Kegelmeyer, L.M.; MacGowan, B.J.; et al. Optics Recycle Loop Strategy for NIF Operations Above UV Laser-Induced Damage Threshold. Fusion Sci. Technol. 2016, 69, 265–294. [Google Scholar] [CrossRef]
  8. Baisden, P.A.; Atherton, L.J.; Hawley, R.A.; Land, T.A.; Menapace, J.A.; Miller, P.E.; Runkel, M.J.; Spaeth, M.L.; Stolz, C.J.; Suratwala, T.I.; et al. Large Optics for the National Ignition Facility. Fusion Sci. Technol. 2016, 69, 614–620. [Google Scholar] [CrossRef]
  9. Liao, Z.M.; Nostrand, M.; Whitman, P.; Bude, J. Analysis of Optics Damage Growth at the National Ignition Facility; SPIE Laser Damage: Boulder, CO, USA, 2015. [Google Scholar]
  10. Norton, M.A.; Donohue, E.E.; Hollingsworth, W.G.; Feit, M.D.; Rubenchik, A.M.; Hackel, R.P. Growth of laser initiated damage in fused silica at 1053 nm. In Boulder Damage Symposium XXXVI; Proc. SPIE: Boulder, CO, USA, 2005; Volume 5647, pp. 197–205. [Google Scholar]
  11. Norton, M.A.; Donohue, E.E.; Hollingsworth, W.G.; McElroy, J.N.; Hackel, R.P. Growth of laser-initiated damage in fused silica at 527 nm. In Laser-Induced Damage in Optical Materials; Proc. SPIE: Boulder, CO, USA, 2004; Volume 5273, pp. 236–243. [Google Scholar]
  12. Norton, M.A.; Hrubesh, L.W.; Wu, Z.; Donohue, E.E.; Feit, M.D.; Kozlowski, M.R.; Milam, D.; Neeb, K.P.; Molander, W.A.; Rubenchik, A.M.; et al. Growth of laser-initiated damage in fused silica at 351 nm. Opt. Eng. 2001, 5273, 468. [Google Scholar]
  13. Schwartz, S.; Feit, M.D.; Kozlowski, M.R.; Mouser, R.P. Current 3-ω large optic test procedures and data analysis for the quality assurance of national ignition facility optics. In Laser-Induced Damage in Optical Materials; Proc. SPIE—The International Society for Optical Engineering: Boulder, CO, USA, 1999; Volume 3578. [Google Scholar] [CrossRef]
  14. Sheehan, L.M.; Hendrix, J.L.; Battersby, C.L.; Oberhelman, S. National Ignition Facility small optics laser-induced damage and photometry measurements program. In Spies International Symposium on Optical Science; International Society for Optics and Photonics: Boulder, CO, USA, 1999. [Google Scholar] [CrossRef]
  15. Nalwa, H.S. Organometallic materials for nonlinear optics. Appl. Organomet. Chem. 1991, 5, 349–377. [Google Scholar] [CrossRef]
  16. Miller, C.; Kegelmeyer, L.; Nostrand, M.; Raman, R.; Cross, D.; LIao, Z.; Garcha, R.; Carr, W. Method to Characterize Small Damage Sites to Increase the Lifetime of NIF Fused Silica Optics; Lawrence Livermore National Laboratory: Livermore, CA, USA, 2018. Available online: https://www.osti.gov/servlets/purl/1476215 (accessed on 25 August 2022).
  17. Nostrand, M.C.; Cerjan, C.J.; Johnson, M.A.; Suratwala, T.I.; Weiland, T.L.; Sell, W.D.; Vickers, J.L.; Luthi, R.L.; Stanley, J.R.; Parham, T.G.; et al. Correlation of laser-induced damage to phase objects in bulk fused silica. In Boulder Damage Symposium XXXVI; Proc. SPIE: Boulder, CO, USA, 2005; Volume 5647, pp. 233–246. [Google Scholar]
  18. Guss, G.M.; Bass, I.L.; Hackel, R.P.; Mailhiot, C.; Demos, S.G. In situ monitoring of surface postprocessing in large-aperture fused silica optics with optical coherence tomography. Appl. Opt. 2008, 47, 4569–4573. [Google Scholar] [CrossRef]
  19. Raman, R.N.; Matthews, M.J.; Adams, J.J.; Demos, S.G. Monitoring annealing via CO2 laser heating of defect populations on fused silica surfaces using photoluminescence microscopy. Opt. Express 2010, 18, 15207–15215. [Google Scholar] [CrossRef]
  20. Wu, X.; Sahoo, D.; Hoi, S.C.H. Recent Advances in Deep Learning for Object Detection. Neurocomputing 2020, 396, 39–64. [Google Scholar] [CrossRef]
  21. Zheng, W. Load Capacity of High Power Laser Device and Related Physical Problems; Science Press: Beijing, China, 2014. [Google Scholar]
  22. Sasaki, T.; Yokotani, A. Growth of large KDP crystals for laser fusion experiments. J. Cryst. Growth 1990, 99 Pt 2, 820–826. [Google Scholar] [CrossRef]
  23. Carr, A.; Kegelmeyer, L.; Liao, Z.M.; Abdulla, G.; Cross, D.; Kegelmeyer, W.P.; Ravizza, F.; Carr, C.W. Defect Classification Using Machine Learning; SPIE—The International Society for Optical Engineeringaser: Boulder, CO, USA, 2008. [Google Scholar]
  24. Abdulla, G.M.; Kegelmeyer, L.M.; Liao, Z.M.; Carr, W. Effective and efficient optics inspection approach using machine learning algorithms. In Laser Damage Symposium XLII: Annual Symposium; SPIE: Boulder, CO, USA, 2010. [Google Scholar]
  25. Li, L.; Liu, D.; Cao, P.; Xie, S.; Li, Y.; Chen, Y.; Yang, Y. Automated discrimination between digs and dust particles on optical surfaces with dark-field scattering microscopy. Appl. Opt. 2014, 53, 5131–5140. [Google Scholar] [CrossRef] [PubMed]
  26. Wei, F. Research on Intelligent Detection Method of Weak Feature Damage of Large Aperture Optics. Ph.D. Thesis, Harbin Institute of Technology, Harbin, China, 2019. [Google Scholar]
  27. Cheng, Y.; Zhao, D.; Wang, Y.; Pei, G. Multi-label learning of kernel extreme learning machine with non-equilibrium label completion. Acta Electron. Sin. 2019, 178, 1–10. [Google Scholar]
  28. Ongena, J.; Ogawa, Y. Nuclear fusion: Statusreport and future prospects. Energy Policy 2016, 96, 770–778. [Google Scholar] [CrossRef]
  29. Pryatel, J.A.; Gourdin, W.H. Clean assembly practices to prevent contamination and damage to optics. In Proceedings of the Boulder Damage Symposium XXXVII: Annual Symposium on Optical Materials for High Power Lasers, Boulder, CO, USA, 19 September 2006. [Google Scholar]
  30. Medel-Vera, C.; Vidal-Estévez, P.; Mädler, T. A convolutional neural network approach to classifying urban spaces using generative tools for data augmentation. Int. J. Archit. Comput. 2024. [Google Scholar] [CrossRef]
  31. Mennens, J.; Van Tichelen, L.; Francois, G.; Engelen, J.J. Optical recognition of Braille writing using standard equipment. IEEE Trans. Rehabil. Eng. 1994, 2, 207–212. [Google Scholar] [CrossRef]
  32. Ballard, D.H. Generalizing the hough transform to detect arbitrary shapes. Pattern Recognit. 1981, 13, 111–122. [Google Scholar] [CrossRef]
  33. Ruder, S. An overview of gradient descent optimization algorithms. arXiv 2016, arXiv:1609.04747. [Google Scholar] [CrossRef]
  34. He, K.; Zhang, X.; Ren, S.; Sun, J. Deep Residual Learning for Image Recognition. In Proceedings of the 2016 IEEE Conference on Computer Vision and Pattern Recognition (CVPR), Las Vegas, NV, USA, 27–30 June 2016; IEEE: Piscataway, NJ, USA, 2016. [Google Scholar] [CrossRef]
  35. Bhargavi, K.; Babu, B.S. Application of Convoluted Neural Network and Its Architectures for Fungal Plant Disease Detection; IGI Global: Hershey, PA, USA, 2021. [Google Scholar]
  36. Bello, I.; Fedus, W.; Du, X.; Cubuk, E.D.; Srinivas, A.; Lin, T.Y.; Shlens, J.; Zoph, B. Revisiting ResNets: Improved Training and Scaling Strategies. Adv. Neural Inf. Process. Syst. 2021, 34, 22614–22627. [Google Scholar] [CrossRef]
  37. Wang, R.; Zhou, X.; Liu, Y.; Liu, D.; Lu, Y.; Su, M. Identification of the Surface Cracks of Concrete Based on ResNet-18 Depth Residual Network. Appl. Sci. 2024, 14, 3142. [Google Scholar] [CrossRef]
  38. Khan, B.A.; Jung, J.-W. Semantic Segmentation of Aerial Imagery Using U-Net with Self-Attention and Separable Convolutions. Appl. Sci. 2024, 14, 3712. [Google Scholar] [CrossRef]
  39. Falk, T.; Mai, D.; Bensch, R.; Cicek, O.; Abdulkadir, A.; Marrakchi, Y.; Bohm, A.; Deubner, J.; Jackel, Z.; Seiwald, K.; et al. U-net: Deep learning for cell counting, detection, and morphometry. Nat. Methods 2018, 16, 67–70. [Google Scholar] [CrossRef] [PubMed]
  40. Zhou, Z.W.; Rahman Siddiquee, M.M.; Tajbakhsh, N.; Liang, J.M. UNet++: A Nested U-Net Architecture for Medical Image Segmentation. In Deep Learning in Medical Image Analysis and Multimodal Learning for Clinical Decision Support; Springer International Publishing: Cham, Switzerland, 2018; Volume 11045. [Google Scholar] [CrossRef]
  41. Lin, T.Y.; Dollar, P.; Girshick, R.; He, K.; Hariharan, B.; Belongie, S. Feature Pyramid Networks for Object Detection. In Proceedings of the 2017 IEEE Conference on Computer Vision and Pattern Recognition (CVPR), Honolulu, HI, USA, 21–26 July 2017. [Google Scholar] [CrossRef]
  42. Park, C.; Lee, S.; Han, H. Efficient Shot Detector: Lightweight Network Based on Deep Learning Using Feature Pyramid. Appl. Sci. 2021, 11, 8692. [Google Scholar] [CrossRef]
  43. Kegelmeyer, L.; Fong, P.; Glenn, S.; Liebman, J.A. Local Area Signal-to-Noise Ratio (LASNR) Algorithm for Image Segmentation; Proc. SPIE—The International Society for Optical Engineering: Boulder, CO, USA, 2007; Volume 6696. [Google Scholar] [CrossRef]
  44. Kingma, D.P.; Ba, J. Adam: A method for stochastic optimization. In Proceedings of the International Conference on Learning Representations (ICLR), San Diego, CA, USA, 7–9 May 2015; Available online: https://arxiv.org/abs/1412.6980 (accessed on 6 September 2022).
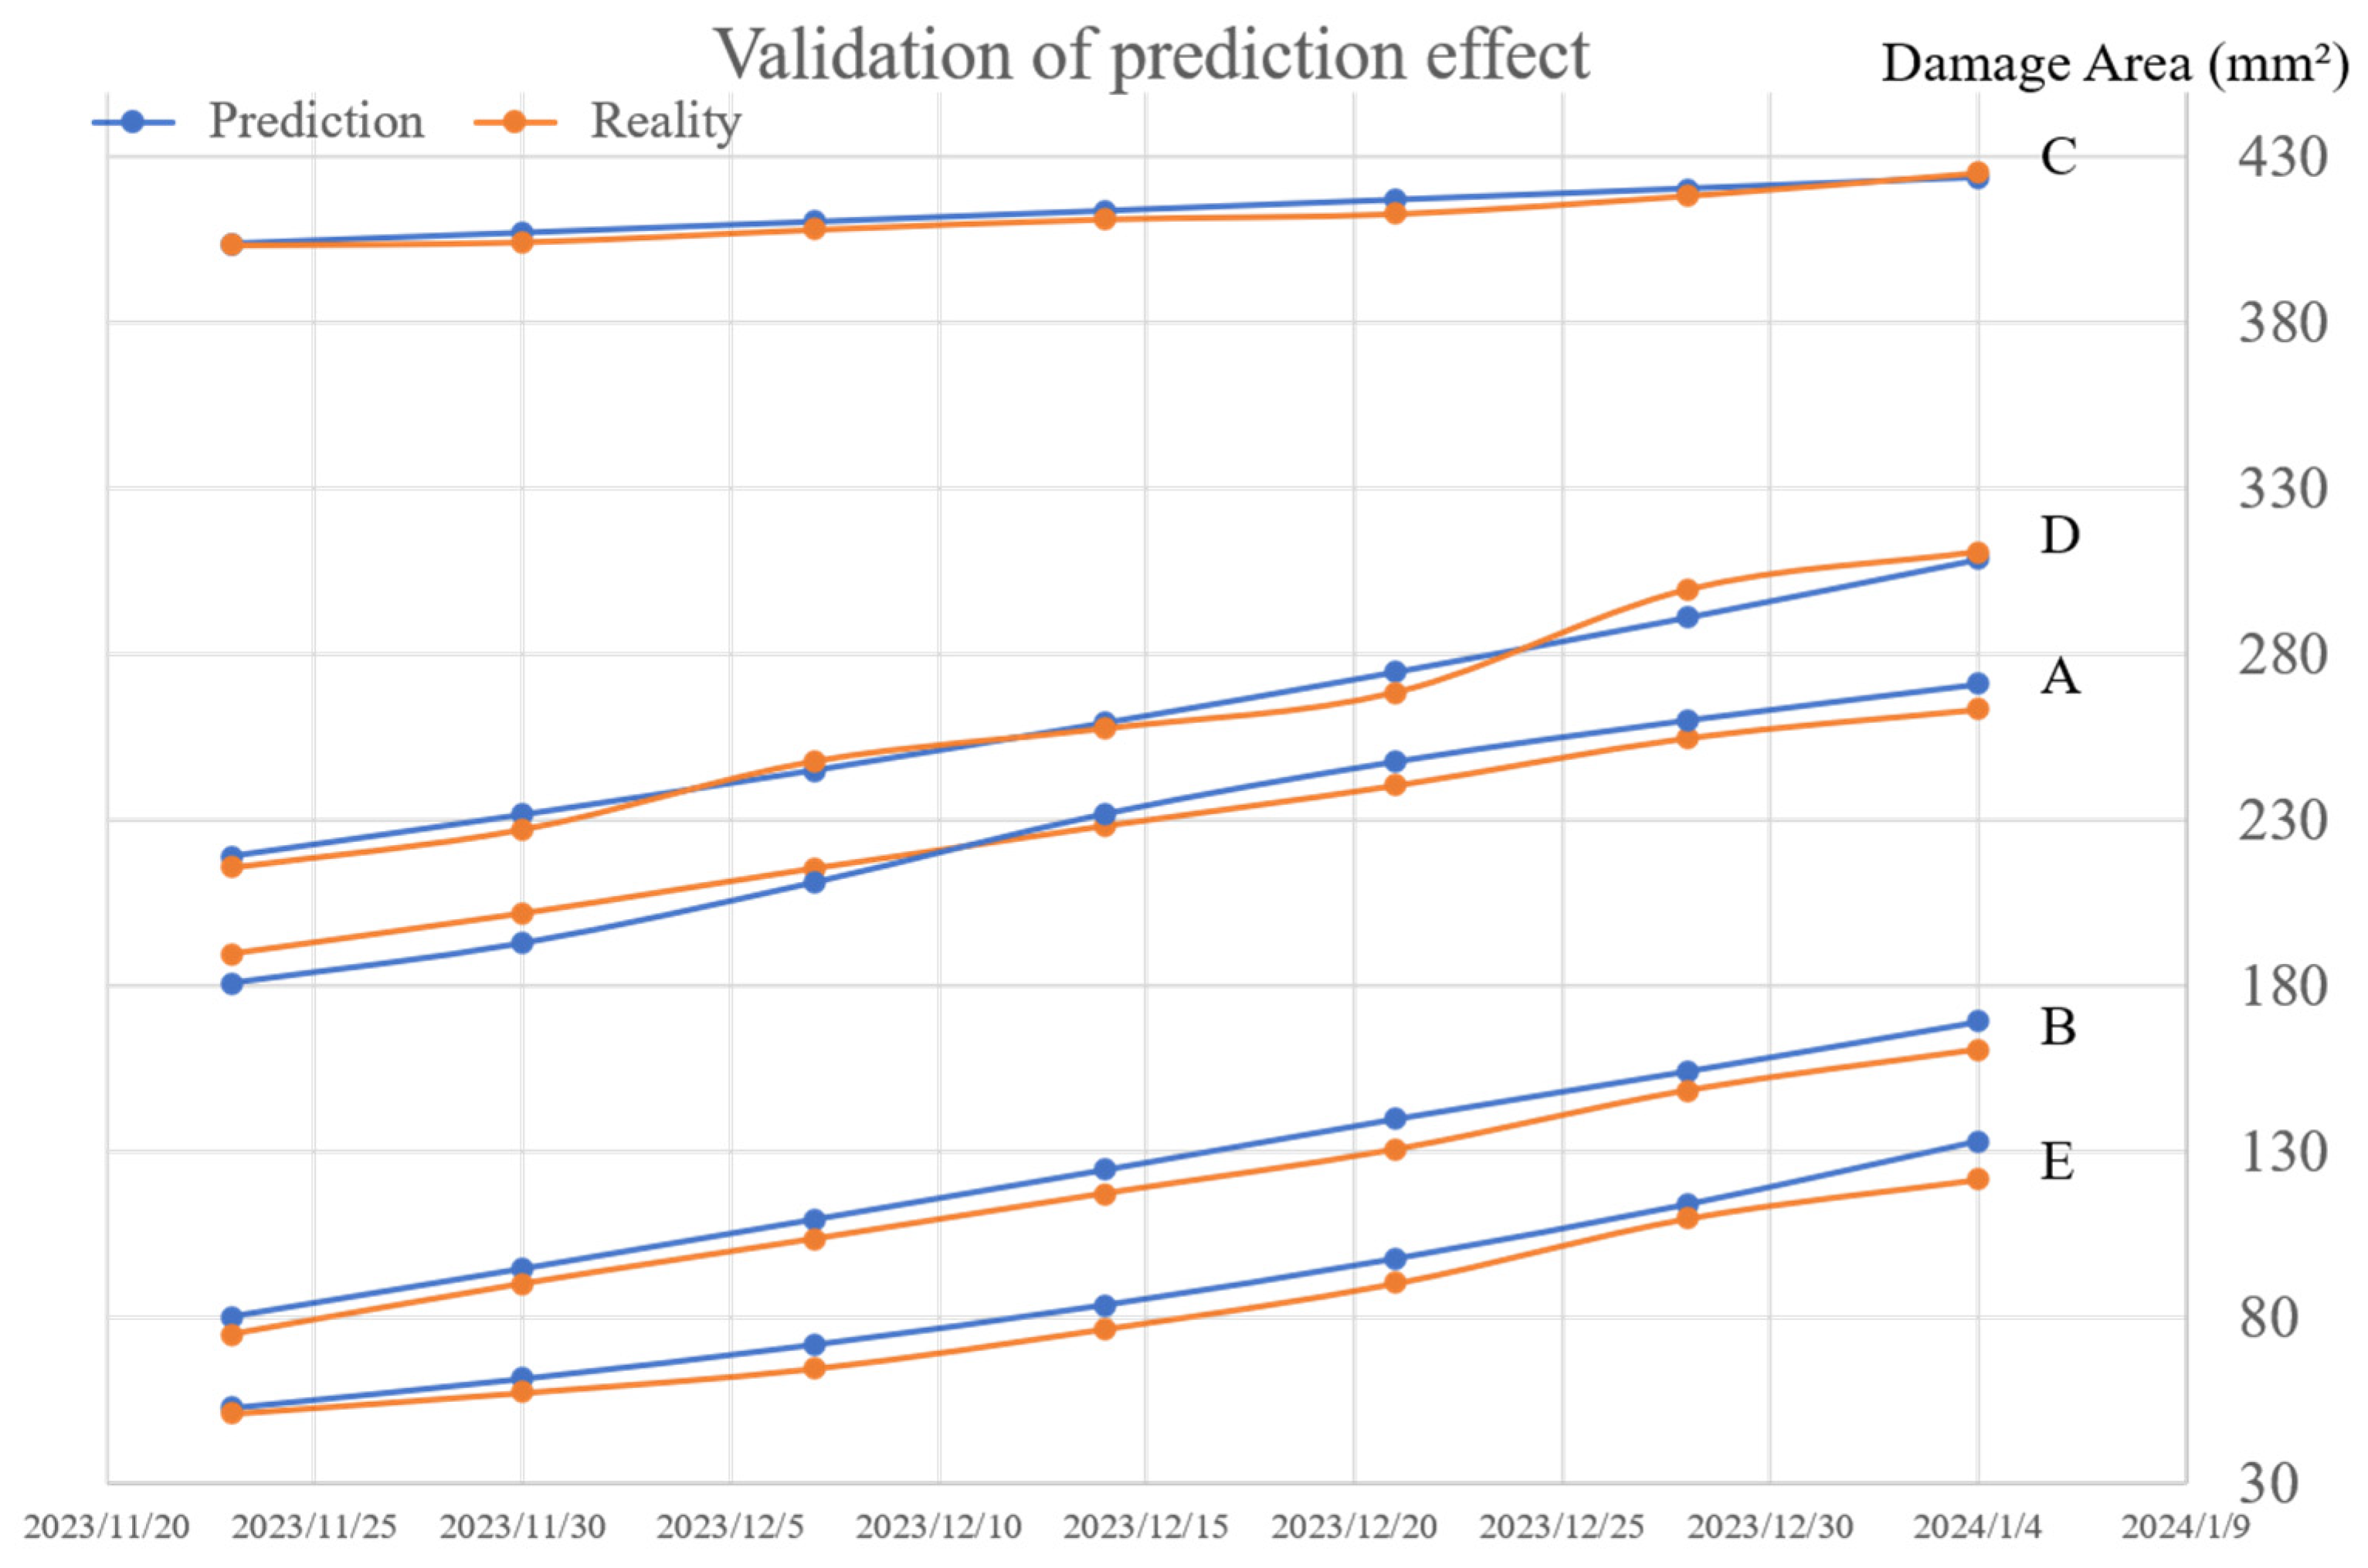
Figure 1. The schematic of the FODI system and FOA.
Applsci 14 05226 g001
Figure 2. Different types of false damage in online FODI images: (a) an offline image; all the damage can be regarded as real damage; (b) an online image.
Applsci 14 05226 g002
Figure 3. Braille marks representing the last four digits of element numbers were carved at four corners of every optical element.
Applsci 14 05226 g003
Figure 4. The lack of conformity of brightness and contrast between photographs taken on different dates.
Applsci 14 05226 g004
Figure 5. The abnormal growth of the damage area caused by the inconsistency of image brightness and contrast.
Applsci 14 05226 g005
Figure 6. The coefficient adjustment flowchart: Choose an image as the standard, unify the brightness and contrast of other Braille markers, calculate the adjustment coefficient, and use it to adjust the entire images.
Applsci 14 05226 g006
Figure 7. Pixel grayscale histogram: (a) before adjustment; (b) after adjustment.
Applsci 14 05226 g007
Figure 8. The effect of revision: (a) the contrast of the adjusted graph with its pre-date graph; (b) the development of the damage area after adjustment.
Applsci 14 05226 g008
Figure 9. Braille pattern detection area before and after adjustment.
Applsci 14 05226 g009
Figure 10. Crop Braille marks after positioning.
Applsci 14 05226 g010
Figure 11. The algorithm framework of damage detection.
Applsci 14 05226 g011
Figure 12. This figure illustrates the ResNet-18-based model proposed for real damage target recognition. These boxes correspond to the multichannel feature map, and the side length of the box represents the pixel resolution.
Applsci 14 05226 g012
Figure 13. The overall architecture to train the model for the detection of optical defects in real time.
Applsci 14 05226 g013
Figure 14. The overall architecture to train the model for estimation of damage area.
Applsci 14 05226 g014
Figure 15. The development law of single damage with the number of experiments.
Applsci 14 05226 g015
Figure 16. (a) Numerical simulation of the relationship between a single damage area and the energy; (b) the development and prediction of total damage areas.
Applsci 14 05226 g016
Figure 17. Comparison between predicted values and actual values of damage areas.
Applsci 14 05226 g017
Figure 18. An example of the results showing the online damage image detection of a shield window.
Applsci 14 05226 g018
Figure 19. (a) Prediction of the growth of a single damage; (b) prediction of the development of the total damages.
Applsci 14 05226 g019aApplsci 14 05226 g019b
Table 1. Comparison between predicted values and actual values of damage areas.
ObjectDate11–2311–3012–0712–1412–2112–2801–04
Area of Optics A (mm2)Predicted Value189.50201.75215.41228.32240.57254.97263.62
Actual Value180.74192.81211.21232.04247.89260.38271.29
Area of Optics B (mm2)Predicted Value80.0794.54109.41124.41139.81154.2169.17
Actual Value74.6389.92103.45117.23130.53148.36160.72
Area of Optics C (mm2)Predicted Value404.07407.31410.57413.85417.17420.51423.87
Actual Value403.54404.46408.22411.38412.98418.44425.34
Area of Optics D (mm2)Predicted Value179.00191.56204.99219.37234.76251.23268.85
Actual Value175.76187.23207.79217.67228.61259.52270.87
Area of Optics E (mm2)Predicted Value52.6461.4371.6983.6797.64113.95132.98
Actual Value50.9757.2764.5376.4990.26109.75121.46
Disclaimer/Publisher’s Note: The statements, opinions and data contained in all publications are solely those of the individual author(s) and contributor(s) and not of MDPI and/or the editor(s). MDPI and/or the editor(s) disclaim responsibility for any injury to people or property resulting from any ideas, methods, instructions or products referred to in the content.

