
Evaluation of the Changes in Dimensions of the Footprint of Agricultural Tires under Various Exploitation Conditions

Abstract
:Featured Application
Abstract
1. Introduction
2. Materials and Methods
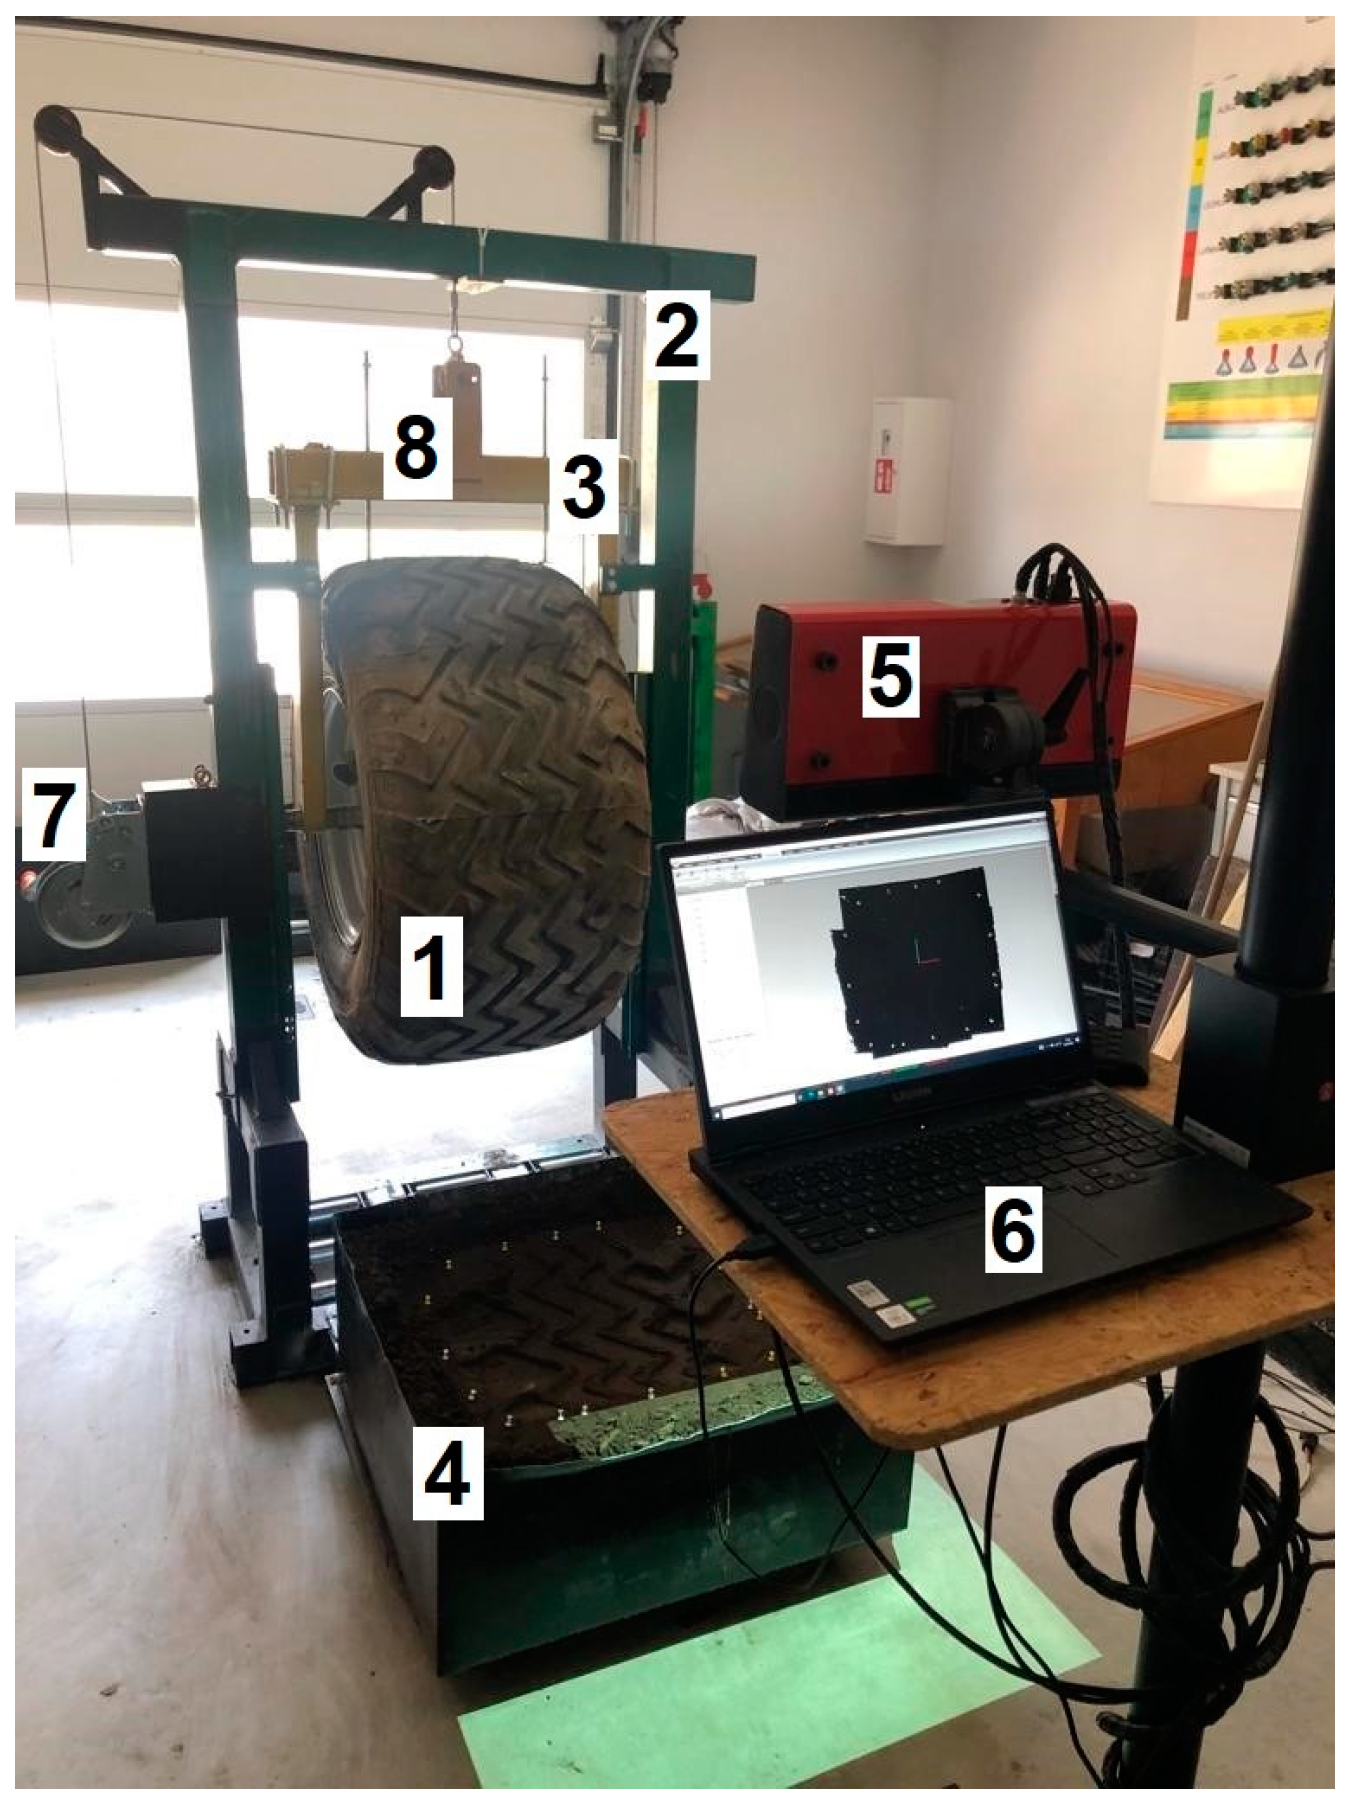
2.1. The Test Bench
2.2. Scanning Process
2.3. Tested Tires
2.4. Statistical Analysis
3. Results
3.1. Results of Statistical Analysis—Bias-Ply Tire
3.2. Statistical Analysis Results—Radial Tire
4. Discussion
5. Conclusions
- A bias-ply tire subjected to changes in operating parameters reacts to a lesser extent to changes in footprint parameters compared to a radial tire. Due to the stiffer structure confirmed through small changes in the cross-section, increasing the inflation pressure and vertical load causes the tire to sink into the ground significantly. The observed large increase in the footprint area after increasing the vertical load and pressure is caused by the large footprint effect—the footprint area also includes its vertical parts that do not carry vertical loads.
- A bias-ply tire is more susceptible to deformations caused by inflation pressure changes. Pressure reduction results in a large increase in the width of the footprint and a slightly smaller increase in its length. Therefore, it is of a different deformation character than in a radial tire. At the same time, as a result of inflation pressure reduction, increases are observed both in the cross-section area of the tire and in the footprint area. This first increase means the greater flexibility of a radial tire compared to a bias-ply one. As for the increase in the footprint area, it was more intense than the increase in depth, which indicated that the tire adapted to the ground better. Increasing the vertical load resulted in an increase in all analyzed parameters except the footprint depth, which confirms the theory that the radial tire adapts better to the ground.
- A correct analysis of the impact of agricultural tires on the soil should take into account not only the footprint area but also changes in parameters such as the width, length, and depth of the rut. Additionally, a parameter related to the tire’s deformability should be taken into account. The analysis of the footprint itself may lead to erroneous conclusions because the surface also includes parts with a more vertical profile that carry loads to a small extent. As a result, with a large footprint area and a simultaneous large depth, the actual surface carrying vertical loads is smaller than the measured footprint area.
Author Contributions
Funding
Institutional Review Board Statement
Informed Consent Statement
Data Availability Statement
Conflicts of Interest
References
- Lyu, X.; Peng, W.; Niu, S.; Qu, Y.; Xin, Z. Evaluation of sustainable intensification of cultivated land use according to farming households’ livelihood type. Ecol. Indic. 2022, 138, 108848. [Google Scholar] [CrossRef]
- Keller, T.; Sandin, M.; Colombi, T.; Horn, R.; Or, D. Historical increase in agricultural machinery weights enhanced soil stress levels and adversely affected soil functioning. Soil Till. Res. 2019, 194, 104293. [Google Scholar] [CrossRef]
- Botta, G.F.; Tolon-Becerra, A.; Lastra-Bravo, X.; Tourn, M. Tillage and traffic effects (planters and tractors) on soil compaction and soybean (Glycine max L.) yields in Argentinean pampas. Soil Till. Res. 2010, 110, 167–174. [Google Scholar] [CrossRef]
- Jasoliya, D.; Untaroiu, A.; Untaroiu, C. A review of soil modeling for numerical simulations of soil-tire/agricultural tools interaction. J. Terramech. 2024, 111, 44–46. [Google Scholar] [CrossRef]
- Sivarajan, S.; Maharlooei, M.; Bajwa, S.G.; Nowatzki, J. Impact of soil compaction due to wheel traffic on corn and soybean growth, development and yield. Soil Till. Res. 2018, 175, 234–243. [Google Scholar] [CrossRef]
- Patel, S.K.; Mani, I.; Sundaram, P.K. Effect of subsoil compaction on rooting behavior and yields of wheat. J. Terramech. 2020, 92, 43–50. [Google Scholar] [CrossRef]
- Kroulík, M.; Kumhála, F.; Hůla, J.; Honzík, I. The evaluation of agricultural machines field trafficking intensity for different soil tillage technologies. Soil Till. Res. 2009, 105, 171–175. [Google Scholar] [CrossRef]
- Ten Damme, L.; Stettler, M.; Pinet, F.; Vervaet, P.; Keller, T.; Munkholm, L.J.; Lamandé, M. Construction of modern wide, low-inflation pressure tyres per se does not affect soil stress. Soil Till. Res. 2020, 204, 104708. [Google Scholar] [CrossRef]
- McPhee, J.E.; Antille, D.L.; Tullberg, J.N.; Doyle, R.B.; Boersma, M. Managing soil compaction—A choice of low-mass autonomous vehicles or controlled traffic? Biosyst. Engine 2020, 195, 227–241. [Google Scholar] [CrossRef]
- Keller, T.; Arvidsson, J. Technical solutions to reduce the risk of subsoil compaction: Effects of dual wheels, tandem wheels and tyre inflation pressure on stress propagation in soil. Soil Till. Res. 2004, 79, 191–205. [Google Scholar] [CrossRef]
- Lamandé, M.; Greve, M.H.; Schjønning, P. Risk assessment of soil compaction in Europe—Rubber tracks or wheels on machinery. CATENA 2018, 167, 353–362. [Google Scholar] [CrossRef]
- Diserens, E.; Défossez, P.; Duboisset, A.; Alaoui, A. Prediction of the contact area of agricultural traction tyres on firm soil. Biosyst. Engine 2011, 110, 73–82. [Google Scholar] [CrossRef]
- Khemis, C.; Abrougui, K.; Ren, L.; Mutuku, E.A.; Chehaibi, S.; Cornelis, W. Effects of tractor loads and tyre pressures on soil compaction in Tunisia under different moisture conditions. In Proceedings of the European Geosciences Union General Assembly, Vienna, Austria, 23–28 April 2017; Volume 19, p. 15218. [Google Scholar]
- Ptak, W.; Czarnecki, J.; Brennensthul, M.; Lejman, K.; Małecka, A. Evaluation of Tire Footprint in Soil Using an Innovative 3D Scanning Method. Agriculture 2023, 13, 514. [Google Scholar] [CrossRef]
- Jakliński, L. Mechanika Układu Pojazd-Teren w Teorii i Badaniach; Oficyna Wydawnicza Politechniki Warszawskiej: Warsaw, Poland, 2006; pp. 30–39. [Google Scholar]
- Taheri, S.; Sandu, C.; Taheri, S.; Pinto, E.; Gorsich, D. A technical survey on Terramechanics models for tire–terrain interaction used in modeling and simulation of wheeled vehicles. J. Terramech. 2015, 57, 1–22. [Google Scholar] [CrossRef]
- Keller, T. A model for the prediction of the contact area and the distribution of vertical stress below agricultural tyres from readily available tyre parameters. Biosyst. Eng. 2005, 92, 85–96. [Google Scholar] [CrossRef]
- Keller, T.; Berli, M.; Ruiz, S.; Lamande, M.; Arvidsson, J.; Schjønning, P.; Selvadurai, A.P.S. Transmission of vertical soil stress under agricultural tyres: Comparing measurements with simulations. Soil Till. Res. 2014, 140, 106–117. [Google Scholar] [CrossRef]
- Grečenko, A. Tyre footprint area on hard ground computed from catalogue values. J. Terramech. 1995, 32, 325–333. [Google Scholar] [CrossRef]
- Alkhalifa, N.; Tekeste, M.Z.; Jjagwe, P.; Way, T.R. Effects of vertical load and inflation pressure on tire-soil interaction on artificial soil. J. Terramech. 2024, 112, 19–34. [Google Scholar] [CrossRef]
- Jjagwe, P.; Tekeste, M.Z.; Alkhalifa, N.; Way, T.R. Modeling tire-soil compression resistance on artificial soil using the scaling law of pressure-soil sinkage relationship. J. Terramech. 2023, 108, 7–19. [Google Scholar] [CrossRef]
- Taghavifar, H.; Mardani, A. Investigating the effect of velocity, inflation pressure, and vertical load on rolling resistance of a radial ply tire. J. Terramech. 2013, 50, 99–106. [Google Scholar] [CrossRef]
- El-Sayegh, Z.; El-Gindy, M.; Johansson, I.; Öijer, F. Improved tire-soil interaction model using FEA-SPH simulation. J. Terramech. 2018, 78, 53–62. [Google Scholar] [CrossRef]
- El-Sayegh, Z.; El-Gindy, M.; Johansson, I.; Öijer, F. Development and validation of off-road tire-gravelly soil interaction using advanced computational techniques. J. Terramech. 2020, 91, 45–51. [Google Scholar] [CrossRef]
- Mohsenimanesh, A.; Ward, S.M. Estimation of a three-dimensional tyre footprint using dynamic soil–tyre contact pressures. J. Terramech. 2010, 47, 415–421. [Google Scholar] [CrossRef]
- Golanbari, B.; Mardani, A. An analytical model for stress estimation at the soil-tire interface using the dynamic contact length. J. Terramech. 2024, 111, 1–7. [Google Scholar] [CrossRef]
- González Cueto, O.; Iglesias Coronel, C.E.; Recarey Morfa, C.A.; Urriolagoitia Sosa, G.; Hernández Gómez, L.H.; Urriolagoitia Calderón, G.; Herrera Suárez, M. Three dimensional finite element model of soil compaction caused by agricultural tire traffic. Comput. Electron. Agric. 2013, 99, 146–152. [Google Scholar] [CrossRef]
- Farhadi, P.; Golmohammadi, A.; Malvajerdi, A.S.; Shahgholi, G. Finite element modeling of the interaction of a treaded tire with clay-loam soil. Comput. Electron. Agric. 2019, 162, 793–806. [Google Scholar] [CrossRef]
- Roth, J.; Darr, M. Data acquisition system for soil–tire interface stress measurement. Comput. Electron. Agric. 2011, 78, 162–166. [Google Scholar] [CrossRef]
- Shahgholi, G.; Abuali, M. Measuring soil compaction and soil behavior under the tractor tire using strain transducer. J. Terramech. 2015, 59, 19–25. [Google Scholar] [CrossRef]
- Schjønning, P.; Lamandé, P.M.; Tøgersen, F.A.; Arvidsson, J.; Keller, T. Modelling effects of tyre inflation pressure on the stress distribution near the soil–tyre interface. Biosyst. Eng. 2008, 99, 133–199. [Google Scholar] [CrossRef]
- Schjønning, P.; Stettler, M.; Keller, T.; Lassen, L.; Lamandé, M. Predicted tyre–soil interface area and vertical stress distribution based on loading characteristics. Soil Tillage Res. 2015, 152, 52–66. [Google Scholar] [CrossRef]
- González Cueto, O.; Iglesias Coronel, C.E.; López Bravo, E.; Recarey Morfa, C.A.; Herrera Suárez, M. Modelling in FEM the soil pressures distribution caused by a tyre on a Rhodic Ferralsol soil. J. Terramech. 2016, 63, 61–67. [Google Scholar] [CrossRef]
- Xia, K. Finite element modeling of tire/terrain interaction: Application to predicting soil compaction and tire mobility. J. Terramech. 2011, 48, 113–123. [Google Scholar] [CrossRef]
- Pue, J.D.; Lamandé, M.; Cornelis, W. DEM simulation of stress transmission under agricultural traffic Part 2: Shear stress at the tyre-soil interface. Soil Till. Res. 2020, 203, 104660. [Google Scholar] [CrossRef]
- Farhadi, P.; Golmohammadi, A.; Sharifi, A.; Shahgholi, G. Potential of three-dimensional footprint mold in investigating the effect of tractor tire contact volume changes on rolling resistance. J. Terramech. 2018, 78, 63–72. [Google Scholar] [CrossRef]
- Kenarsari, A.E.; Vitton, S.J.; Beard, J.E. Creating 3D models of tractor tire footprints using close-range digital photogram-metry. J. Terramech. 2017, 74, 1–11. [Google Scholar] [CrossRef]
- Swamy, V.S.; Pandit, R.; Yerro, A.; Sandu, C.; Rizzo, D.M.; Sebeck, K.; Gorsich, D. Review of modeling and validation techniques for tire-deformable soil interactions. J. Terramech. 2023, 109, 73–92. [Google Scholar] [CrossRef]
- Derafshpour, S.; Valizadeh, M.; Mardani, A.; Saray, M.T. A novel system developed based on image processing techniques for dynamical measurement of tire-surface contact area. Measurement 2019, 139, 270–276. [Google Scholar] [CrossRef]
- Diserens, E. Calculating the contact area of trailer tyres in the field. Soil Tillage Res. 2009, 103, 302–309. [Google Scholar] [CrossRef]
- Schwanghart, H. Measurement of contact area, contact pressure and compaction under tires in soft soil. J. Terramech. 1991, 28, 309–318. [Google Scholar] [CrossRef]
- Botta, G.F.; Rivero, D.; Tourn, M.; Bellora Melcon, F.; Pozzolo, O.; Nardon, G.; Balbuena, R.; Tolon Becerra, A.; Rosatto, H.; Stadler, S. Soil compaction produced by tractor with radial and cross-ply tyres in two tillage regimes. Soil Tillage Res. 2008, 101, 44–51. [Google Scholar] [CrossRef]
- Wulfsohn, D.; Upadhyaya, S.K. Determination of dynamic three-dimensional soil-tire contact profile. J. Terramech. 1992, 29, 433–464. [Google Scholar] [CrossRef]
- PN-EN ISO 14688-1:2006; Oznaczanie i Klasyfikowanie Gruntów—Część 1: Oznaczanie i Opis. ISO: Geneva Switzerland, 2012. (In Polish)
- ASAE S313.3 FEB04; Soil Cone Penetrometer. ASABE (American Society of Agricultural and Biological Engineers): Saint Joseph, MI, USA, 2006; pp. 902–904.
- Misiewicz, P.A.; Richards, T.E.; Blackburn, K.; Godwin, R.J. Comparison of methods for estimating the carcass stiffness of agricultural tyres on hard surfaces. Biosyst. Eng. 2016, 147, 183–192. [Google Scholar] [CrossRef]
- Kumar, S.; Pandey, K.P.; Kumar, R.; Kumar, A. Effect of ballasting on performance characteristics of bias and radial ply tyres with zero sinkage. Measurement 2018, 121, 218–224. [Google Scholar] [CrossRef]
- Coates, W. Comparison of Bias and Radial Tractor Tires on a Soft Soil. Trans. ASAE 1985, 28, 1090–1093. [Google Scholar] [CrossRef]
- Moitzi, G.; Sattler, E.; Wagentristl, H. Effect of cover crop, slurry application with different loads and tire inflation pressures on tire track depth, soil penetration resistance and maize yield. Agriculture 2021, 11, 641. [Google Scholar] [CrossRef]
- Oh, J.; Namb, J.S.; Kim, S.; Park, Y.-J. Influence of tire inflation pressure on the estimation of rating cone index using wheel sinkage. J. Terramechanics 2019, 84, 13–20. [Google Scholar] [CrossRef]
- O’Sullivan, M.; Henshall, J.; Dickson, J. A simplified method for estimating soil compaction. Soil Tillage Res. 1999, 49, 325–335. [Google Scholar] [CrossRef]


| Parameter | Description |
|---|---|
| Scanning technology | White structural light—LED |
| Dimensions (XYZ) of measuring volume (mm) | 400 × 300 × 230 |
| Distance between points (mm) | 0.156 |
| Accuracy (mm) | 0.08 |
| Power consumption during measurement (W) | 200 |
| Total mass (kg) | 4.40 |
| Working temperature (°C) | 20 ± 0.5 |
| Tire/Vertical Load | Regression Equation | Coefficient of Determination | Coefficient of Correlation (r-Pearson) |
|---|---|---|---|
| Bias-ply, 11.8 kN | y = 890.6x2 − 375.5x + 478.2 | 0.98 | 0.99 |
| Radial, 11.8 kN | y = 2631.2x2 −1185.1x + 560.1 | 0.98 | 0.99 |
| Bias-ply 19.6 kN | y = −168.4x + 489.3 | 0.95 | 0.97 |
| Radial, 19.6 kN | y = −81.5x + 487.9 | 0.98 | 0.99 |
| Tire/Vertical Load | Regression Equation | Coefficient of Determination | Coefficient of Correlation (r-Pearson) |
|---|---|---|---|
| Bias-ply, 11.8 kN | y = 979.7x2 − 277.1x + 491.3 | 0.98 | 0.99 |
| Radial, 11.8 kN | y = 2688.3x2 − 1527.3x + 584.8 | 0.98 | 0.99 |
| Bias-ply 19.6 kN | y = 3343.7x2 − 1202.7x + 593.8 | 0.98 | 0.99 |
| Radial, 19.6 kN | y = −260.31x + 537.8 | 0.97 | 0.98 |
| Tire/Vertical Load | Regression Equation | Coefficient of Determination | Coefficient of Correlation (r-Pearson) |
|---|---|---|---|
| Bias-ply, 11.8 kN | y = −1025.0x2 + 443.4x − 15.5 | 0.98 | 0.99 |
| Radial, 11.8 kN | y = −964.1x2 + 377.1x − 14.3 | 0.98 | 0.99 |
| Bias-ply 19.6 kN | y = 145.1x + 7.53 | 0.98 | 0.99 |
| Radial, 19.6 kN | y = 107.8x + 1.62 | 0.98 | 0.99 |
| Tire/Vertical Load | Regression Equation | Coefficient of Determination | Coefficient of Correlation (r-Pearson) |
|---|---|---|---|
| Bias-ply, 11.8 kN | y = −1.26x2 + 0.51x + 0.14 | 0.98 | 0.99 |
| Radial, 11.8 kN | y = 2.83x2 − 1.36x + 0.31 | 0.97 | 0.98 |
| Bias-ply 19.6 kN | y = 3.49x2 − 1.20x +0.30 | 0.98 | 0.99 |
| Radial, 19.6 kN | y = −0.21x + 0.26 | 0.98 | 0.99 |
| Tire/Vertical Load | Regression Equation | Coefficient of Determination | Coefficient of Correlation (r-Pearson) |
|---|---|---|---|
| Bias-ply, 11.8 kN | y = −1.37x2 + 0.70x + 0.15 | 0.98 | 0.99 |
| Radial, 11.8 kN | y = 3.48x2 − 1.62 + 0.36 | 0.98 | 0.99 |
| Bias-ply 19.6 kN | y = 5.24x2 − 1.54x + 0.36 | 0.98 | 0.99 |
| Radial, 19.6 kN | y = −0.17x + 0.28 | 0.96 | 0.98 |
| Footprint Parameter | Factor | Factor Level | Arithmetic Mean | ±SD | p-Value |
|---|---|---|---|---|---|
| Width of the footprint, mm | Vertical load | 11.8 kN | 444.87 A | 7.99 | 0.000001 |
| 19.6 kN | 462.12 B | 12.31 | |||
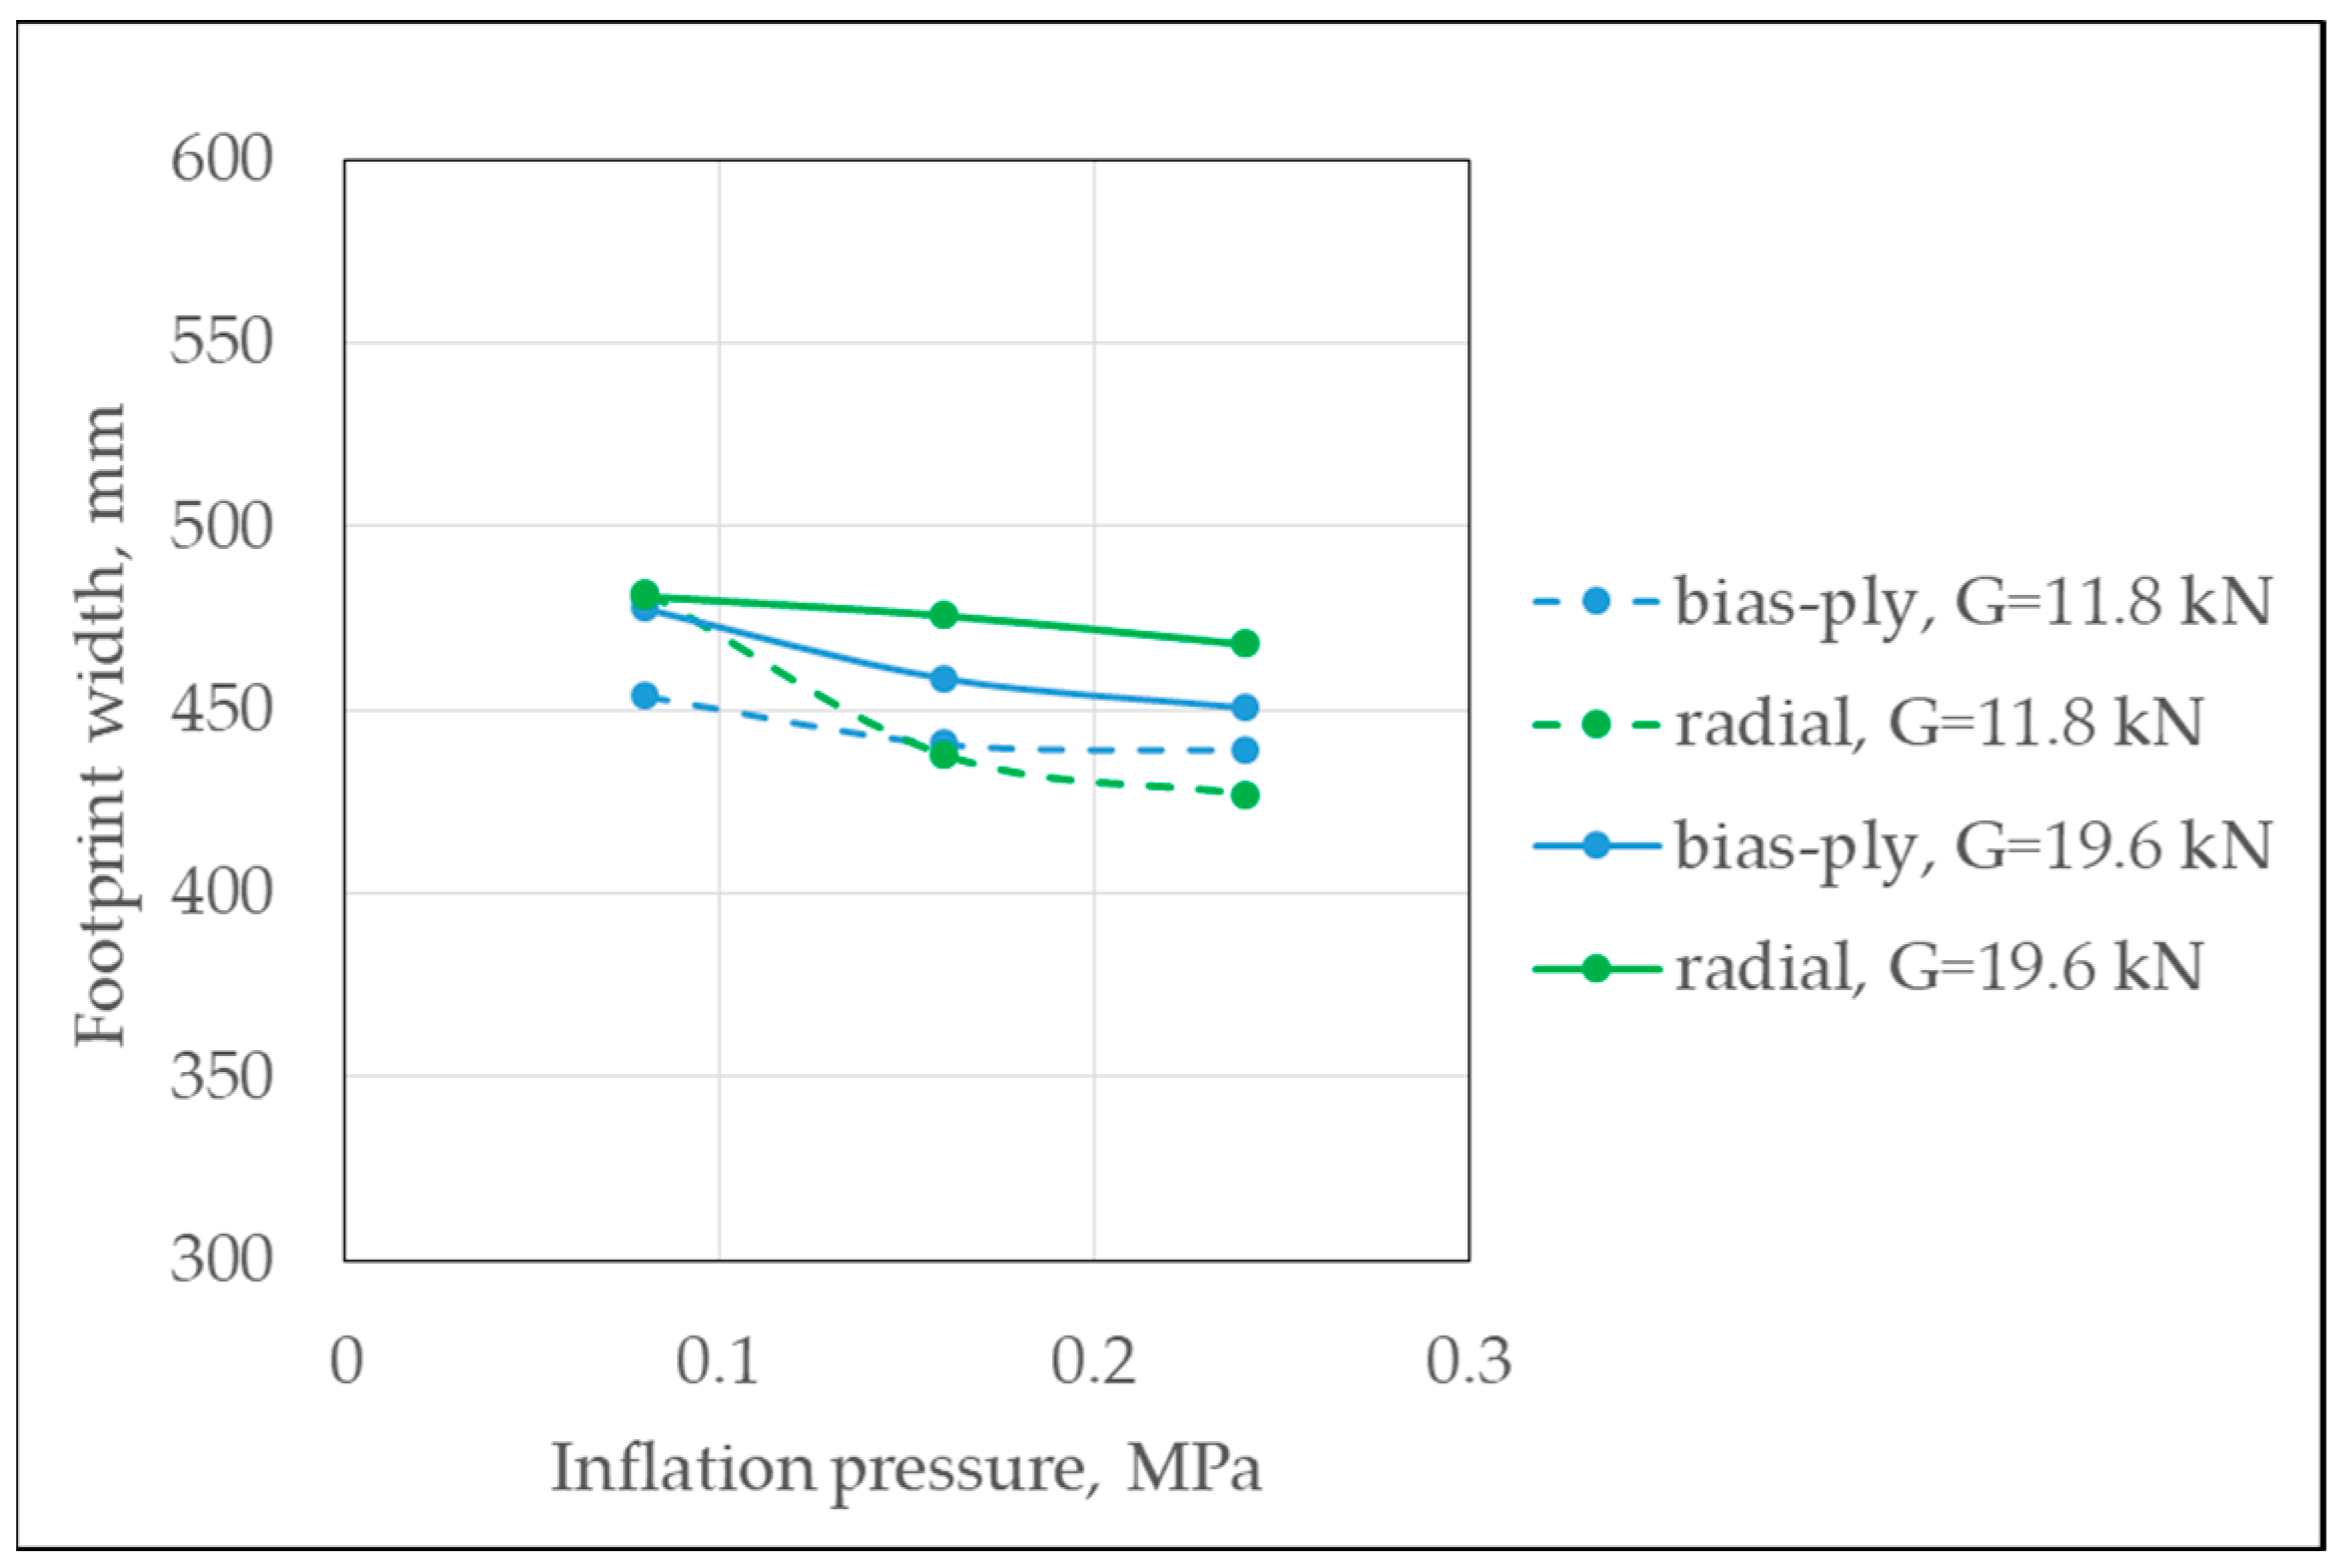
| Inflation pressure | 0.08 MPa | 465.75 A | 13.33 | 0.000004 | |
| 0.16 MPa | 449.69 B | 10.20 | |||
| 0.24 MPa | 444.92 B | 6.86 | |||
| Length of the footprint, mm | Vertical load | 11.8 kN | 476.09 A | 5.33 | 0.000015 |
| 19.6 kN | 500.90 B | 14.52 | |||
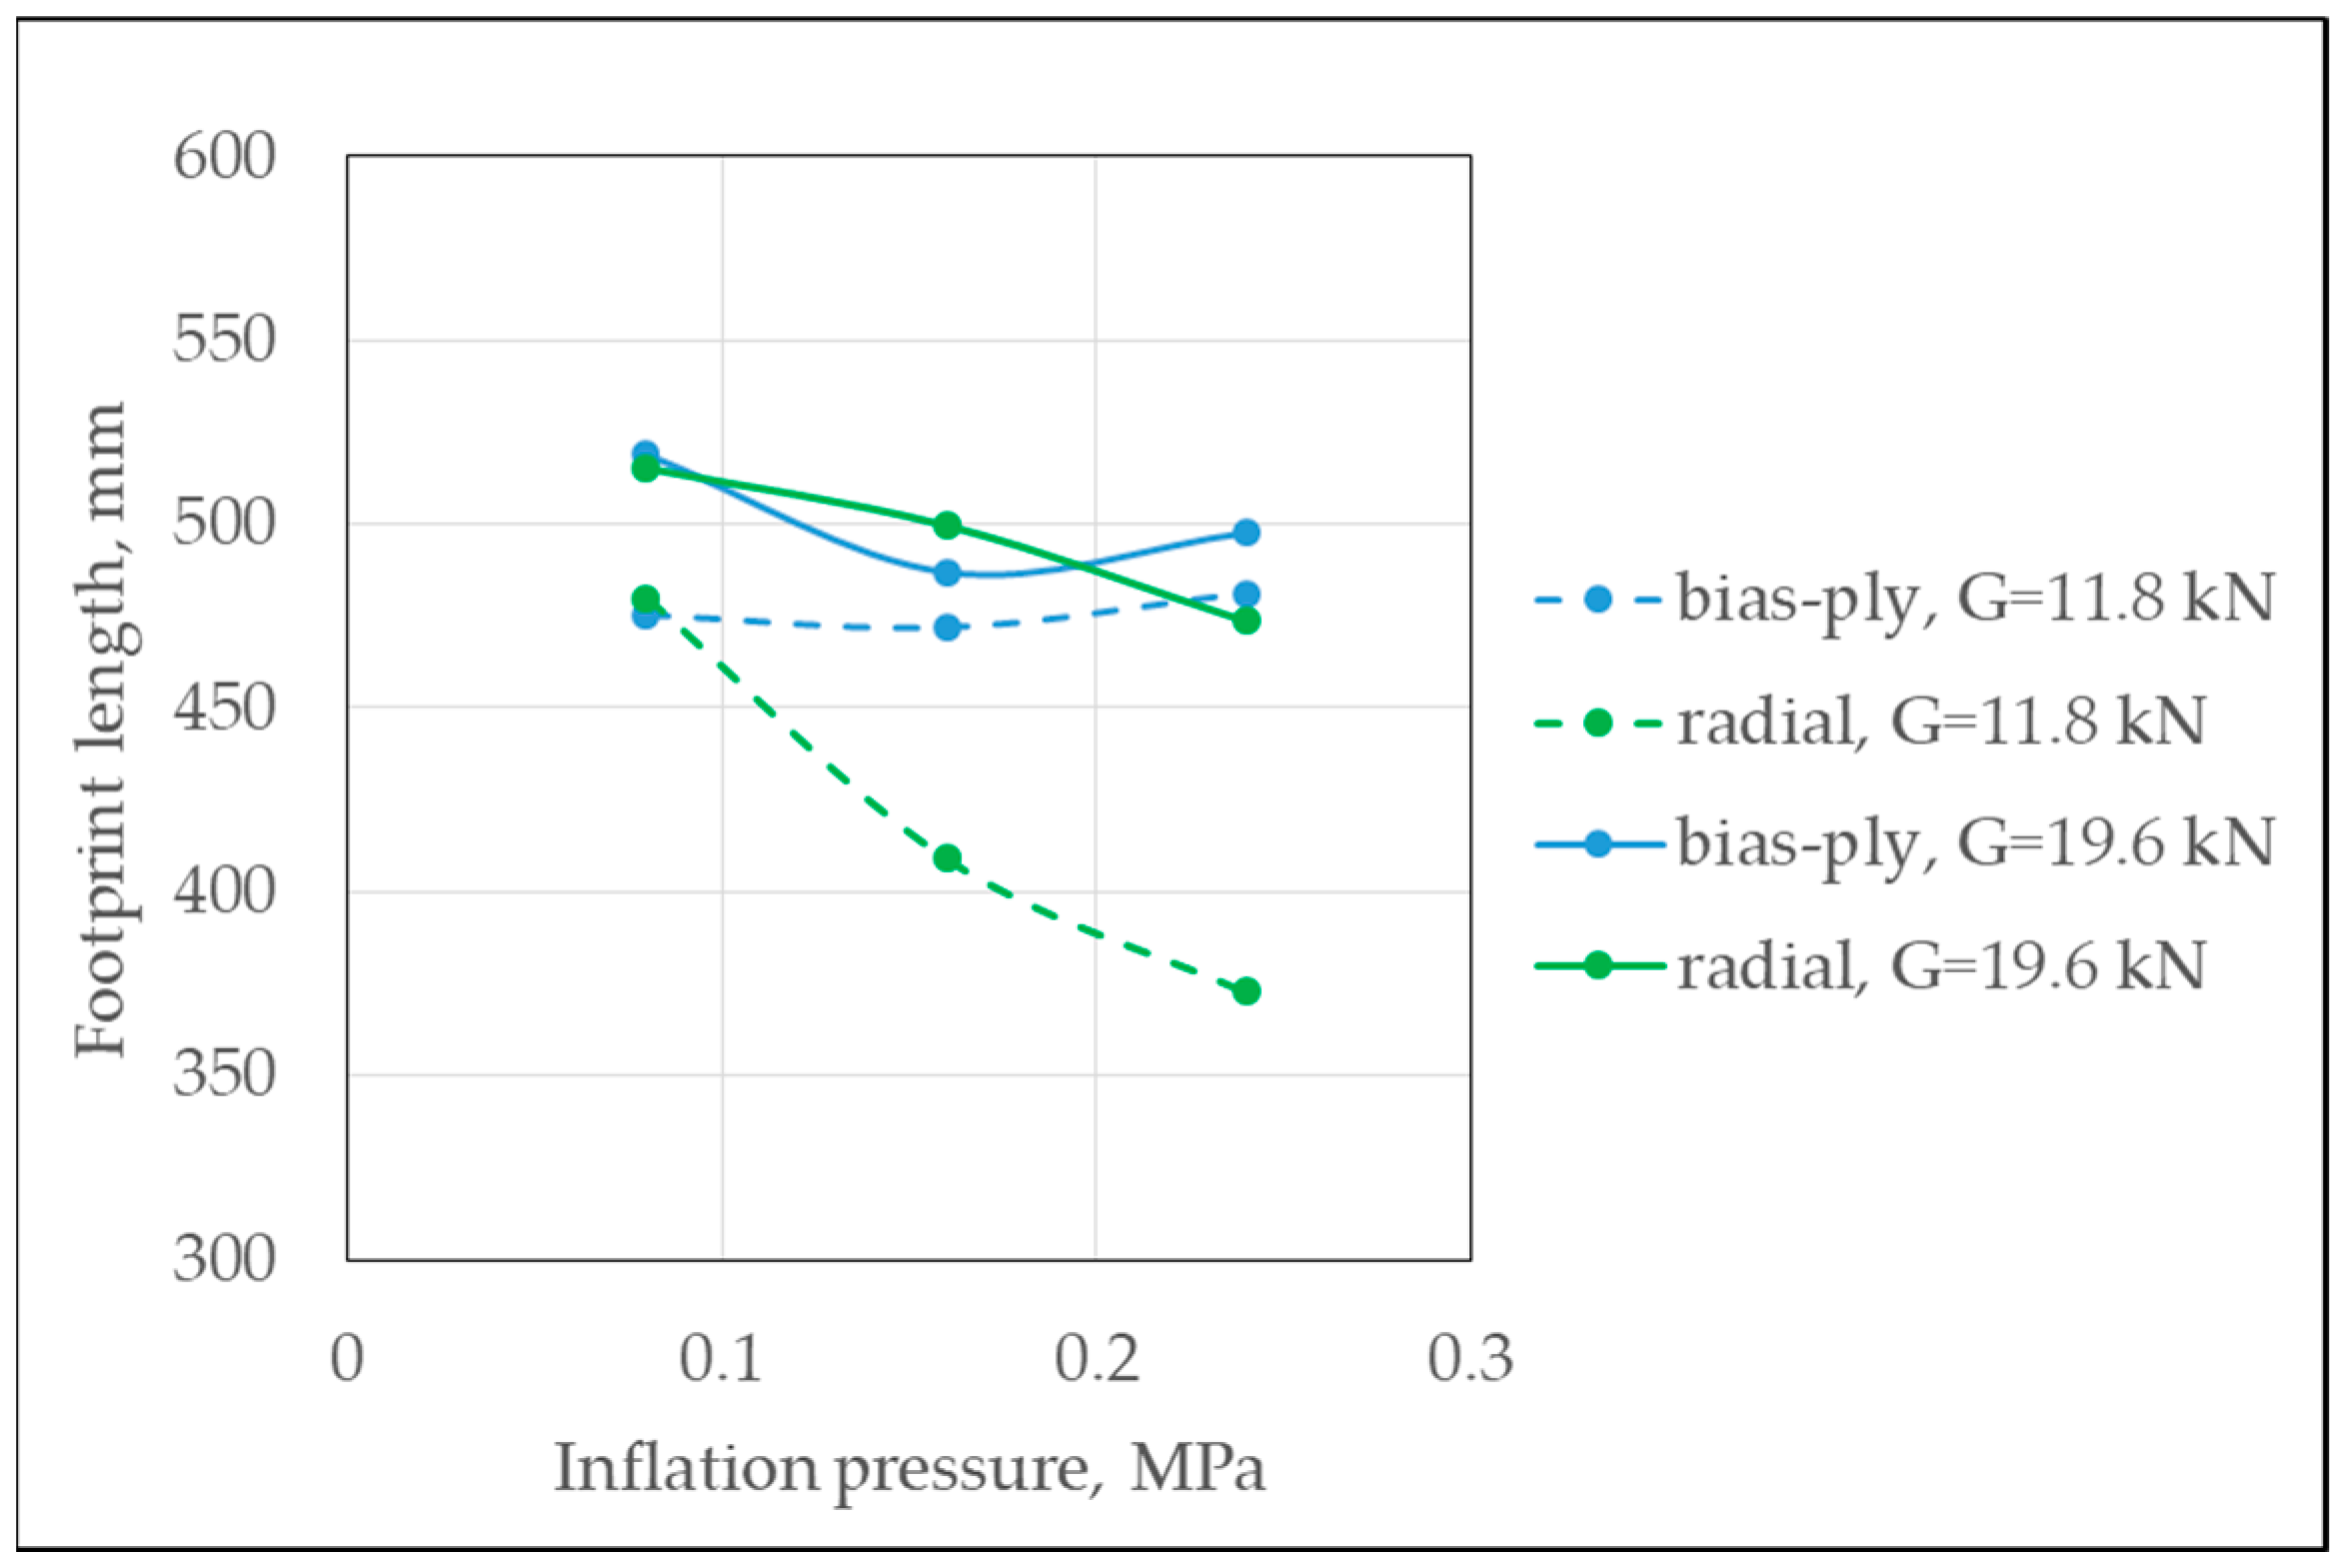
| Inflation pressure | 0.08 MPa | 497.03 A | 14.04 | 0.006526 | |
| 0.16 MPa | 479.02 B | 8.65 | |||
| 0.24 MPa | 489.44 A | 9.37 | |||
| Depth of the footprint, mm | Vertical load | 11.8 kN | 24.80 A | 0.87 | 0.000006 |
| 19.6 kN | 30.72 B | 1.01 | |||
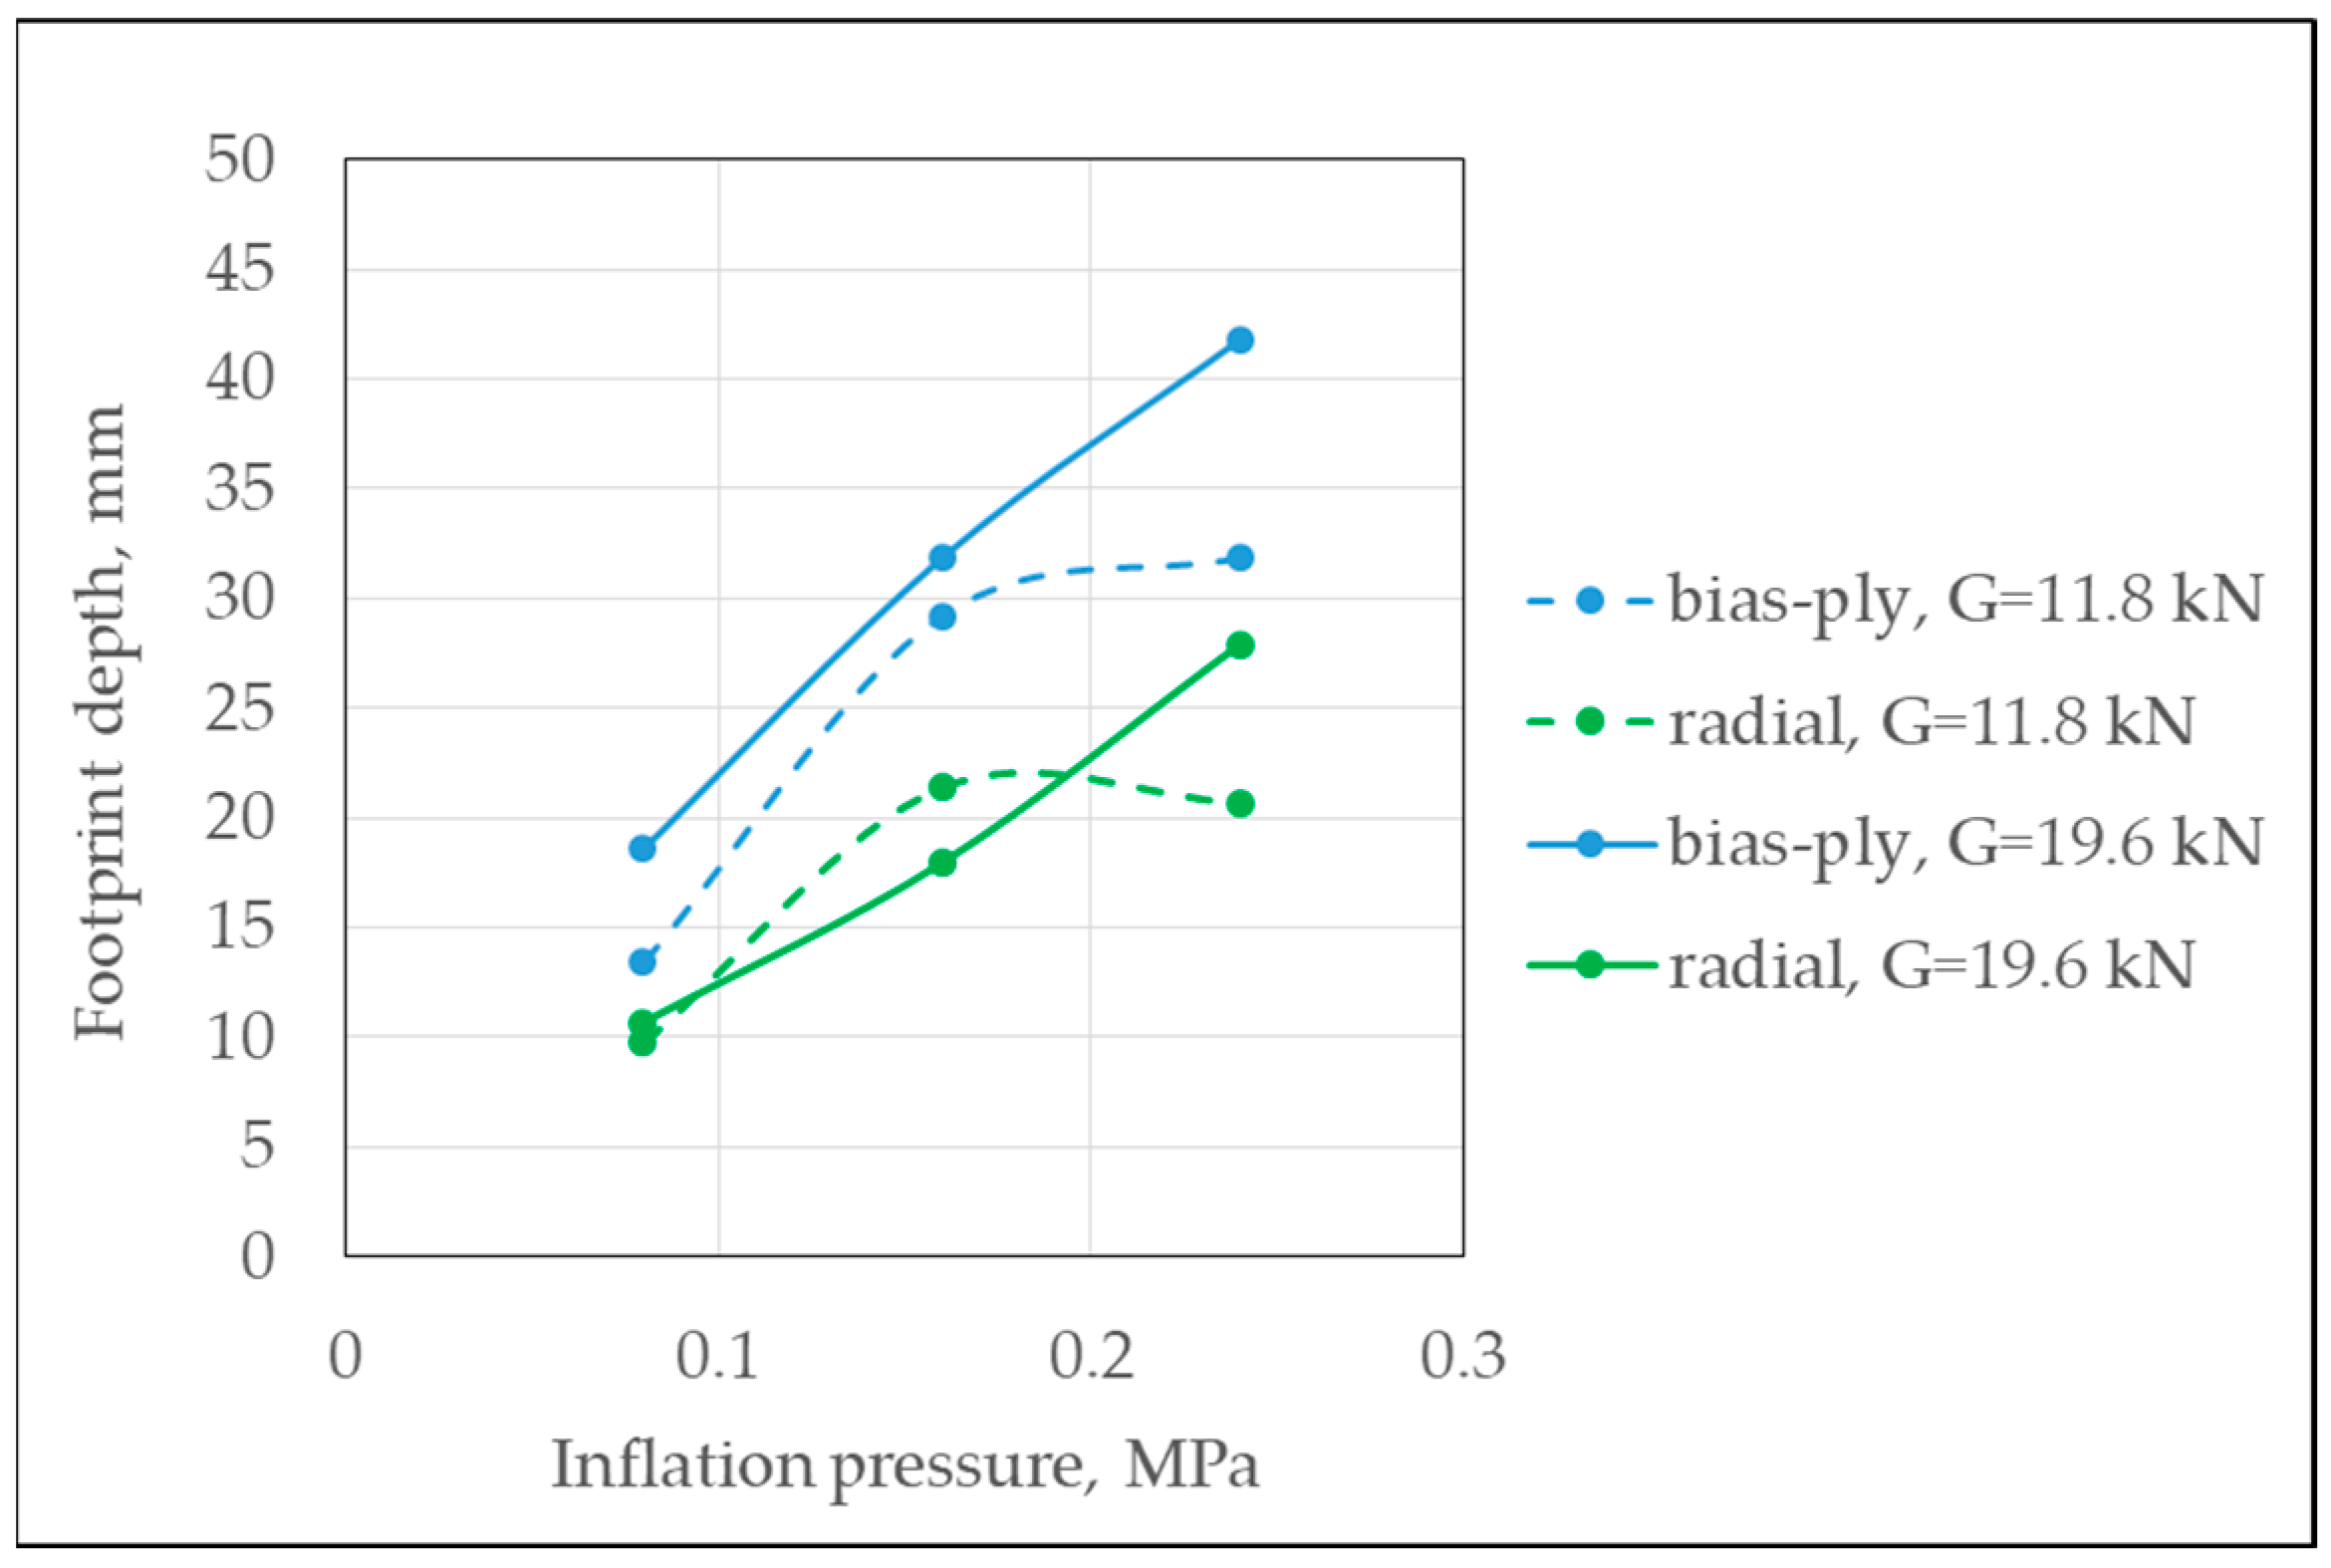
| Inflation pressure | 0.08 MPa | 15.94 A | 2.85 | <0.000001 | |
| 0.16 MPa | 30.51 B | 1.49 | |||
| 0.24 MPa | 36.83 C | 3.48 | |||
| Cross-section area of the tire, m2 | Vertical load | 11.8 kN | 0.179 A | 0.019 | 0.000006 |
| 19.6 kN | 0.217 B | 0.019 | |||
| Inflation pressure | 0.08 MPa | 0.199 A | 0.034 | 0.456757 | |
| 0.16 MPa | 0.194 A | 0.009 | |||
| 0.24 MPa | 0.202 A | 0.017 | |||
| Tire–soil contact area, m2 | Vertical load | 11.8 kN | 0.220 A | 0.018 | 0.000002 |
| 19.6 kN | 0.266 B | 0.019 | |||
| Inflation pressure | 0.08 MPa | 0.232 A | 0.037 | 0.000828 | |
| 0.16 MPa | 0.234 A | 0.010 | |||
| 0.24 MPa | 0.263 B | 0.027 |
| Footprint Parameter | Factor | Factor Level | Arithmetic Mean | ±SD | p-Value |
|---|---|---|---|---|---|
| Width of the footprint, mm | Vertical load | 11.8 kN | 449.15 A | 25.31 | 0.000220 |
| 19.6 kN | 474.76 B | 6.59 | |||
| Inflation pressure | 0.08 MPa | 481.77 A | 12.61 | 0.000275 | |
| 0.16 MPa | 456.57 B | 21.13 | |||
| 0.24 MPa | 447.53 B | 21.83 | |||
| Length of the footprint, mm | Vertical load | 11.8 kN | 420.80 A | 36.87 | <0.000001 |
| 19.6 kN | 496.09 B | 18.31 | |||
| Inflation pressure | 0.08 MPa | 497.41 A | 19.64 | 0.000007 | |
| 0.16 MPa | 454.49 B | 39.36 | |||
| 0.24 MPa | 423.45 C | 34.96 | |||
| Depth of the footprint, mm | Vertical load | 11.8 kN | 17.27 A | 2.65 | 0.198806 |
| 19.6 kN | 18.88 A | 2.56 | |||
| Inflation pressure | 0.08 MPa | 10.21 A | 0.61 | <0.000001 | |
| 0.16 MPa | 19.66 B | 0.89 | |||
| 0.24 MPa | 24.36 C | 2.02 | |||
| Cross-section area of the tire, m2 | Vertical load | 11.8 kN | 0.177 A | 0.032 | <0.000001 |
| 19.6 kN | 0.224 B | 0.014 | |||
| Inflation pressure | 0.08 MPa | 0.229 A | 0.012 | 0.000002 | |
| 0.16 MPa | 0.195 B | 0.033 | |||
| 0.24 MPa | 0.177 C | 0.032 | |||
| Tire–soil contact area, m2 | Vertical load | 11.8 kN | 0.207 A | 0.034 | 0.000002 |
| 19.6 kN | 0.257 B | 0.012 | |||
| Inflation pressure | 0.08 MPa | 0.261 A | 0.011 | 0.000051 | |
| 0.16 MPa | 0.222 B | 0.036 | |||
| 0.24 MPa | 0.212 B | 0.035 |
Disclaimer/Publisher’s Note: The statements, opinions and data contained in all publications are solely those of the individual author(s) and contributor(s) and not of MDPI and/or the editor(s). MDPI and/or the editor(s) disclaim responsibility for any injury to people or property resulting from any ideas, methods, instructions or products referred to in the content. |
© 2024 by the authors. Licensee MDPI, Basel, Switzerland. This article is an open access article distributed under the terms and conditions of the Creative Commons Attribution (CC BY) license (https://creativecommons.org/licenses/by/4.0/).
Share and Cite
Małecka, A.; Brennensthul, M.; Ptak, W.; Czarnecki, J.; Lejman, K. Evaluation of the Changes in Dimensions of the Footprint of Agricultural Tires under Various Exploitation Conditions. Appl. Sci. 2024, 14, 5228. https://doi.org/10.3390/app14125228
Małecka A, Brennensthul M, Ptak W, Czarnecki J, Lejman K. Evaluation of the Changes in Dimensions of the Footprint of Agricultural Tires under Various Exploitation Conditions. Applied Sciences. 2024; 14(12):5228. https://doi.org/10.3390/app14125228
Chicago/Turabian StyleMałecka, Agata, Marek Brennensthul, Weronika Ptak, Jarosław Czarnecki, and Krzysztof Lejman. 2024. "Evaluation of the Changes in Dimensions of the Footprint of Agricultural Tires under Various Exploitation Conditions" Applied Sciences 14, no. 12: 5228. https://doi.org/10.3390/app14125228