Article

Design and Material Optimization of Oil Plant Piping Structure for Mitigating Erosion Wear

by
Jun-Hyuk Ahn
1,*,
Rabea Asif
2,
Heon-Woo Lee
2,
In-Ju Hwang
3 and
Jong-Wan Hu
2,4
1
Korea Construction Standards Center, Korea Institute of Civil Engineering and Building Technology, Goyangdaero 283, Ilsanseo-gu, Goyang-si 10223, Republic of Korea
2
Department of Civil and Environmental Engineering, Incheon National University, Incheon 22012, Republic of Korea
3
Korea Institute of Civil Engineering and Building Technology, Goyangdaero 283, Ilsanseo-gu, Goyang-si 10223, Republic of Korea
4
Incheon Disaster Prevention Research Center, Incheon National University, Incheon 22012, Republic of Korea
*
Author to whom correspondence should be addressed.
Appl. Sci. 2024, 14(12), 5234; https://doi.org/10.3390/app14125234
Submission received: 26 April 2024 / Revised: 6 June 2024 / Accepted: 13 June 2024 / Published: 17 June 2024
(This article belongs to the Special Issue Pipeline Risk Assessment and Risk-Informed Pipeline Maintenance)

Abstract

:

Featured Application

By implementing optimized interventions, erosion wear can be effectively mitigated, ensuring the long-term structural integrity of piping systems in non-conventional oil plants and promoting safe overall plant operation. These interventions represent a significant leap forward in erosion wear management, fostering a culture of continuous improvement and innovation within the realm of oil plant operations.

Abstract

Erosion in piping structures poses a significant challenge for oil industries as the conveyance of solid particles leads to operational malfunctions and structural failures affecting the overall oil plant operation. Conventional oil recovery methods have historically dominated, while in response to the challenges imposed by declining conventional oil production, the global shift towards non-conventional methods necessitates a reevaluation of erosion mitigation strategies due to increased piping infrastructure. Therefore, in this study research has been conducted to reduce erosion and optimize the piping structure. Variables impacting the erosion in piping were investigated from the literature, and simulation cases were made based on the impacted variables. Computational Fluid Dynamics (CFDs) analysis was performed using the Discrete Phase Model (DPM) to determine the erosion wear rate in each simulation case; based on the CFD results, variables with low Turbulent Dissipation Rates (TDRs) and Erosion Rates (ERs) were determined, and the optimized piping structure was designed. As a result, the optimized piping structure showed an 80% reduction in the turbulent dissipation rate and a 99.2% decrease in the erosion wear rate. These findings highlight a substantial improvement in erosion control, ensuring the safety and longevity of piping structures in oil plant operations.

1. Introduction

Conventional crude oil, which can be found underground or on the seabed mainly in Canada, Middle East, Central Asia, and East Asia, has the disadvantage of a high exploration risk [1,2,3]. Therefore, many methods are being developed to extract oil from non-conventional oil rather than pure crude oil. Non-conventional energy resources, including oil, have attracted attention since oil prices started rising in 2003 and are deposited over a larger area than pure conventional crude oil [4,5,6]. Nasr and Ayodele investigated non-conventional oil production methods and concluded that among other methods, Expanding Solvent-Steam Assisted Gravity Drainage (ES-SAGD) is an innovative oil extraction technology, which has a lot of potential for in-situ development of bitumen resources, which is a black, sticky, extra-heavy crude oil and is recovered by injecting steam, as shown in Figure 1 [7]. However, if a defect occurs in the piping that transports bitumen, a major economic and safety problem arises. These defects include cracks, plastic deformations, brittle failure, containment loss, and equipment malfunction and even failure, resulting in an oil leak and other environmental calamities due to fatigue and erosion [8,9,10]. The continuous challenge of erosion in piping is encountered across various industrial sectors whenever solid particles are transported [11,12,13,14]. A non-conventional oil plant, shown in Figure 1, was constructed in Yeoncheon, South Korea for research purposes and the same is taken as a baseline in the current study of erosion in piping structure. The inside of the piping that transports non-conventional oil contains bitumen, which contains a large amount of solid substances such as sand. When solid substances pass inside the piping structure, the solid substances may scratch the surface of the piping, act as abrasive, and cause wear and erosion, which can negatively impact the quality of the final products.
Y. I. Oka defines erosion as the progressive loss of material by repetitive deformation and cutting action [15]. L.L. Parent and D.Y. Li stated that by changing the piping design layout, erosion wear can be minimized [16]. Following an in-depth examination of the existing literature, numerous variables were identified as direct contributors to piping erosion. For this study the focus narrowed down to four key variables: piping material, piping thickness, elbow angle, and fluid velocity. Based on each variable, multiple simulation cases were made to encounter erosion rates by altering each variable. M. Sharma highlighted in his research that CFD based modeling is highly recommended for assessing and solving problems that include fluid flow [17,18,19]. It was employed by many researchers as an erosion prediction tool in oil field piping structures, as CFD can handle complex fluid flows involving turbulence, heat transfer, and chemical reactions. This makes it suitable for studying a wide range of engineering problems, including those of multiphase interactions contains solid particles in fluid. Also, in the present study, for analyzing each case, simulations were performed using CFD-based erosion modeling with the commercial software Ansys Fluent 2022, which was utilized in various past research for investigating fluid flows [20,21,22]. In the present study, CFD-based erosion modeling was employed using the Euler–Lagrange model together with the standard k-ε model and then the Discrete Phase Model (DPM) was utilized [23,24,25]. The primary goal of this research was to make an optimized piping structure. This paper will present the TDRs and ERs in piping structure, which already used in Yeoncheon Oil Plant and will be optimized after performing multiple simulation cases of different variables, which affect the erosion wear.

2. CFD Modeling

In pipes subjected to solid particles, the near-wall regions with high TDRs experience enhanced particle–wall interactions. This is particularly critical in areas where erosion is a concern. High TDR regions lead to increased energy and frequency of particle impacts on the pipe walls, which, in turn, increases the erosion wear rate. Therefore, both the TDRs and ERs were investigated to understand their interdependence and impact on pipe wear. Fluids can be modeled through various approaches, including Eulerian–Eulerian or Euler–Lagrange [26]. The Eulerian–Eulerian method treats all phases as a continuous flow and solves equations for each phase simultaneously, while the Euler–Lagrange method tracks individual particles or droplets within a fluid flow. In this study, to determine TDRs and ERs in the piping structure due to solid particles of bitumen, CFD analysis was conducted utilizing the Euler–Lagrange model because of the particle tracking combined with the k-ε turbulence in the model [27]. The Euler–Lagrange model applies the time-averaged Navier–Stokes equations to solve the governing equations for both the liquid (l) and particle (p) phases [28]. To access the turbulent kinetic energy and turbulence dissipation rate, the standard k-ε turbulence model was utilized, and for the erosion rate prediction, the DPM was employed to monitor the bitumen particles [29]. This approach allowed for a detailed analysis of the fluid–particle interaction and the resulting erosion wear effects, enhancing the accuracy of TDR and ER predictions.

2.1. Modeling of Flow

Flow modeling is the initial step in predicting the erosion wear rate using the Navier–Stokes equation. The general equations of continuity and momentum were employed in Navier–Stokes equations for flow modeling, as follows in Equations (1) and (2) [11,30].
ρ t + ρ u = 0
t p u + . ρ u u = P + . τ ̿ + ρ g + S M
Fluid inside piping contains 99.97% oily water, 0.02% bitumen, and 0.01%. This should be deleted as its carbon dioxide and its formula is CO2. Given that water constitutes the majority of the fluid, it was taken as the flow modeling medium, where ρ is the water density, u is the velocity vector of the water, P is the pressure, τ ̿ is the stress tensor, ρ g is the force acting on the body, and S M is the momentum added due to the discrete phase and the stress tensor is as follows, as in Equation (3) [11,30]:
τ ̿ = μ u + u T 2 3 . u I
where μ is the water viscosity, and I is the unit tensor.

2.2. Turbulence Model

In this study, due to the presence of bitumen particles in the fluid, the flow was inherently turbulent. While many methods exist, for CFD analysis, k-ε and k-ω are the common models. The turbulence epsilon model differs from the k-ω with its focus on predicting the dissipation rate of turbulent kinetic energy through the solution of transport equations and provides a more detailed representation of turbulence. Therefore, the standard k-ε turbulence model was employed to characterize the behavior of the particulate phase throughout the flow domain. The TDR, which denotes the scale of turbulence intensity, was also a focal point of this investigation as it is closely related to erosion wear; higher TDR values signify increased turbulence intensity, consequently augmenting the kinetic energy of particles suspended in the fluid. This elevated kinetic energy results in more vigorous impacts on the pipe walls, leading to escalated erosion wear. To monitor turbulence during the transit of the particle phase, the dissipation rate (ε) and turbulent kinetic energy (k) equations were utilized. The turbulent kinetic energy (K) quantifies the energy within turbulence owing to mean velocity gradients and the effect of buoyancy. The standard k-ε model effectively captures flow conditions, especially in the near-wall region of a particulate-liquid medium, with enhanced accuracy, rendering it an appropriate choice for the DPM in erosion wear prediction. To compute both the TDR and turbulent kinetic energy (k), the following equations, as expressed in Equations (4) and (5), were employed [11,29,31]:
t ρ k + x i p k u i = x j μ + μ t σ k k 2 x j + G k + G b ρ ϵ Y M + S k
t ρ ε + x i p ε u i = x j μ + μ t σ ε ε 2 x j + C 1 ε ε K G k + C 3 ε G b C 2 ε ρ ε 2 k + S ε
In Equation (4), Y M represents the contribution of fluctuating turbulence to the overall dissipation rate, and C 1 ε and C 2 ε are constants, as shown in Equation (6), and are the turbulent Prandtl numbers for k and epsilon, respectively. S k and S are user-defined source terms. The model constants have been calculated to ensure that the model works properly for undisputed flows. The Prandtl numbers σ k and σ ε serve the purpose of linking the diffusivities of turbulence kinetic energy (k) and TDR (ε) to the eddy viscosity (μt), as shown in Equation (7). This connection is essential as it ensures that the impact of eddy viscosity on these turbulent transport processes is appropriately considered in the gradient diffusion term of the turbulence equations. Eddy viscosity are calculated by the equations shown below [11,29,31]:
C 1 ε = 1.44 ,   C 2 ε = 1.92 ,   σ k = 1.0 ,   σ ε   = 1.2
μ t   =   ρ C μ K 2 ε

2.3. Discrete Phase Model

The DPM was used in CFD simulations to track the motion of bitumen and CO2 in a fluid flow. The DPM takes a Lagrangian approach, which means that it tracks the motion of individual particles as they go through the fluid. The particle trajectories were acquired by integrating the motion equation of the particles under Lagrangian coordinates [29,32,33]. The governing equation for linear and angular particle motion is proposed according to Newton’s second law, considering drag force, pressure gradient force, virtual mass force, and buoyancy force, as follows in Equation (8) [11]:
d U p d t = F D + F P + F G + F V M
The drag force, denoted as F D , is the force produced by the contact between the solid particles and adjacent fluid. Among all the forces operating on particles as shown in Equation (9), the drag force F D is the most significant force acting on particles. The equation of F D is shown in Equation (9):
F D = 18 μ ρ p d p 2 C d R e p 24 u u p
where u p signifies the velocity vector of the particle, d p represents the particle diameter,   ρ p is the particles density, and R e p is the Reynolds number of particles, as follows in Equation (10):
R e p = ρ d p u p u μ
Whereas in Equation (9), Cd signifies the drag coefficient, as follows in Equation (11):
C d = a 1 + a 2 R e p + a 3 R e 2 p
where a 1 , a 2 , a n d   a 3 are the particles constants. The particle’s pressure gradient force F P , as follows in Equation (8), measures the pressure changes across the particles, as follows in Equation (12):
  F P = ρ ρ P P
The buoyancy force exerted on a particle, denoted as F G , follows below in Equation (13):
F G = ρ p ρ f ρ p

2.4. Erosion Rate

To determine the erosion rate, the fluid dynamics model in Ansys Fluent takes the following general form to predict erosion rates based on Equation (14) [31]:
E R = P = 1 N t r a j c t m p ˙ C d p   f ( α ) v p n A f a c e
In the above equation, m p ˙ represents the mass flow rate of particles, f α represents the impact angle function, C d p is the particle diameter function, and v p represents the particle impact velocity, while n is the exponent of velocity.

3. Piping Structure Design and Case Formation

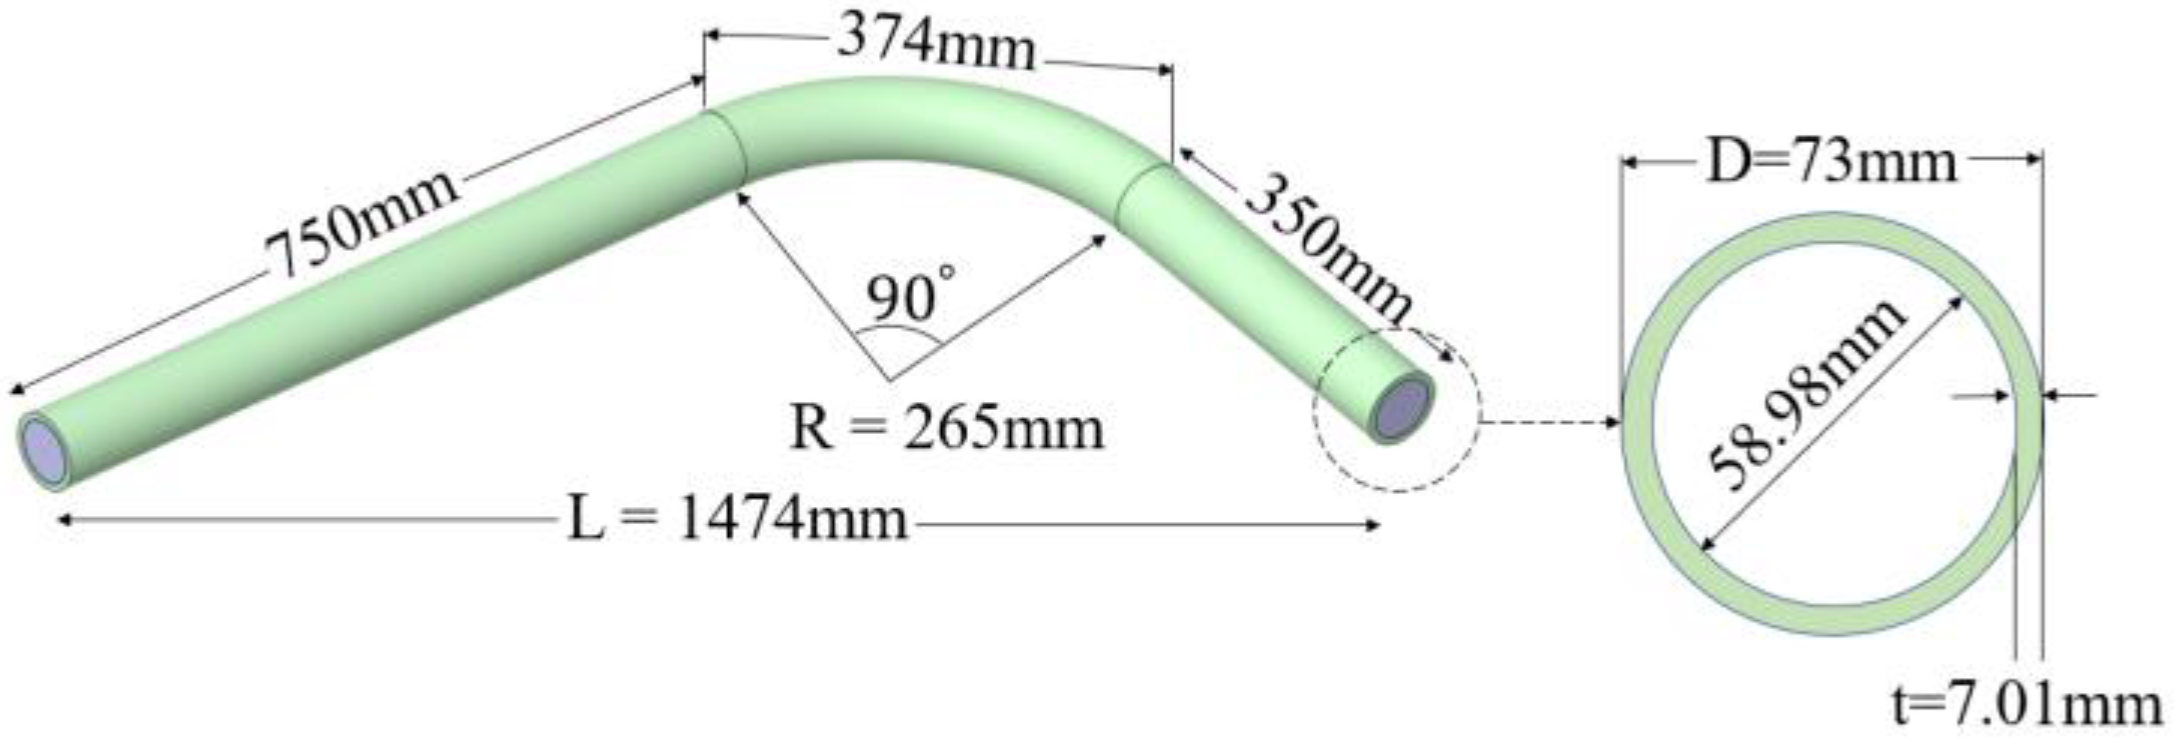
The piping structure sourced from the 300 BPD oil sand onshore facility situated in Yeoncheon, Gyeonggi-do, South Korea is set as the standard piping structure, as depicted in Figure 2. This facility uses pipes composed of carbon steel SCH80. This piping structure employed in bitumen processing transfers a mixture of water, bitumen, and CO2 from the skim tank to the Induced Gas Flotation (IGF). The dimensions of the standard piping structure are as follows: an outer pipe diameter of 73 mm, an inner diameter of 58.98 mm, a piping wall thickness of 7.01 mm, an elbow angle of 90 ° , horizontal pipe length was set as 750 mm, and vertical pipe length as 350 mm, while the radius of curvature was 265 mm. The fluid velocity of 0.688 m/s and pipe material of carbon steel was used. The erosion inside the pipes occurs due to solid particles of bitumen and not due to the impact of pipe weights. Therefore, to see the effect of piping variable on erosion wear, simulation cases were made based on variables such as piping material, piping thickness, elbow angle, and fluid velocity.

3.1. Piping Material

One of the variables that affects the erosion wear rate in piping structures is piping material [34]. To see the effect of material on the erosion wear rate, simulation cases were made by changing the material from carbon steel to two alternative materials: AISI 304 stainless steel and Inconel 617 alloy. Both materials are widely used for manufacturing piping structures in the oil industry due to their excellent mechanical properties and resistance to erosion wear [35]. These cases allowed for an exploration of erosion wear rates in piping under different material conditions. Properties of the materials used in the simulation cases are shown in Table 1.

3.2. Piping Thickness

Piping thickness is another variable which affects the erosion wear rate in piping structures, as erosion directly occurs on the pipe wall and causes degradation [36]. To observe the performance of piping with different thicknesses, simulation cases were made by varying the piping thickness to piping outer diameter (t/D). This variation in piping thickness helped assess the impact of t/D of the piping on erosion wear rates [37]. In these cases, adjustments were made to the piping thickness from 7.01/73 mm to 5.16/69.3 mm and 14.02/87.02 mm, as depicted in Figure 3a,b. The inner diameter was fixed at 58.98 mm because the flow rate may change if the inner diameter changes, while wall thicknesses were taken from ASME B36.10M-2015 [38].

3.3. Elbow Angle

From a literature review, the elbow angle was found to be an another variable that effects the erosion wear in the piping structure [39,40,41]. To investigate elbow angle on the erosion wear rate in piping, the elbow angle was varied from 90 ° to 45 ° and 25 ° , as shown in Figure 4a,b. This variation aimed to evaluate the erosion wear rate under different elbow angles. In the elbow angle cases, the original 90 ° elbow was modified by cutting it down to 45 ° and 25 ° . As a result of these modifications, the overall length of the piping structure was reduced. To maintain equal piping structure lengths for the 45 ° and 25 ° elbows, the lengths of the vertical piping section were increased accordingly to keep the whole piping length the same, as the purpose of this piping was to transfer the fluid from a skim tank to an IGF, so it was necessary to have the same overall length.

3.4. Fluid Velocity

Higher particle velocity leads to more material loss from the surface, as seen in prior erosion wear rate investigations [42]. This is because increased particle velocity directly relates with more kinetic energy, resulting in greater material removal [43]. In the Yeoncheon oil plant, a 0.688 m/s velocity was used as fluid and a particle velocities. To investigate which fluid velocity can reduce the erosion wear rate in piping, simulation cases were made by changing the velocity from 0.688 m/s to 1.38 m/s and 0.344 m/s. These variations allowed for the examination of the erosion wear rate at different fluid velocities.

3.5. Summary of Simulation Cases

The FEA simulation cases for all affecting variables are summarized in Table 2, which illustrates the Case ID and design variable details, according to the piping material, piping thickness, elbow angle, and fluid velocity. The standard piping structure set is Case ID C90. For the Case ID’s, C is the initial of the material, which is carbon steel and 90 means elbow angle. In cases of material variables, AISI 304 stainless steel and Inconel 617 alloy were used instead of carbon steel, and Case IDs are set to A90 and I90 based on the initials of the materials. For the piping thickness variable, piping structures with the thickness/diameter (t/D) of 5.16/69.3 mm, which is thinner than C90, are set to C90-tn, and piping structures with the t/D of 14.02/87.02, which is thicker than C90, are set to C90-tk. For the elbow angle variable, 45 ° and 25 ° , which are less than 90 ° , Case IDs are set as C45 and C25. For the fluid velocity variable, a fluid velocity of 1.38 m/s, which is higher than the velocity of C90, was set as a Case ID of C90-hv, while a fluid velocity of 0.344 m/s, which is lower than the velocity of C90, is set to C90-lv.
Throughout the various simulation case analyses, the overall length of the piping structure, the inner diameter, and the radius of curvature were maintained as constants. Only the factors discussed previously were altered in each case, and each case was analyzed separately.

4. CFD Analysis

For evaluating the TDRs and erosion wear rates, FEA was performed in Ansys Fluent 2022 by employing CFD modeling equations. The following steps were performed in each simulation case analysis.

4.1. Geometry Modeling and Mesh Generation

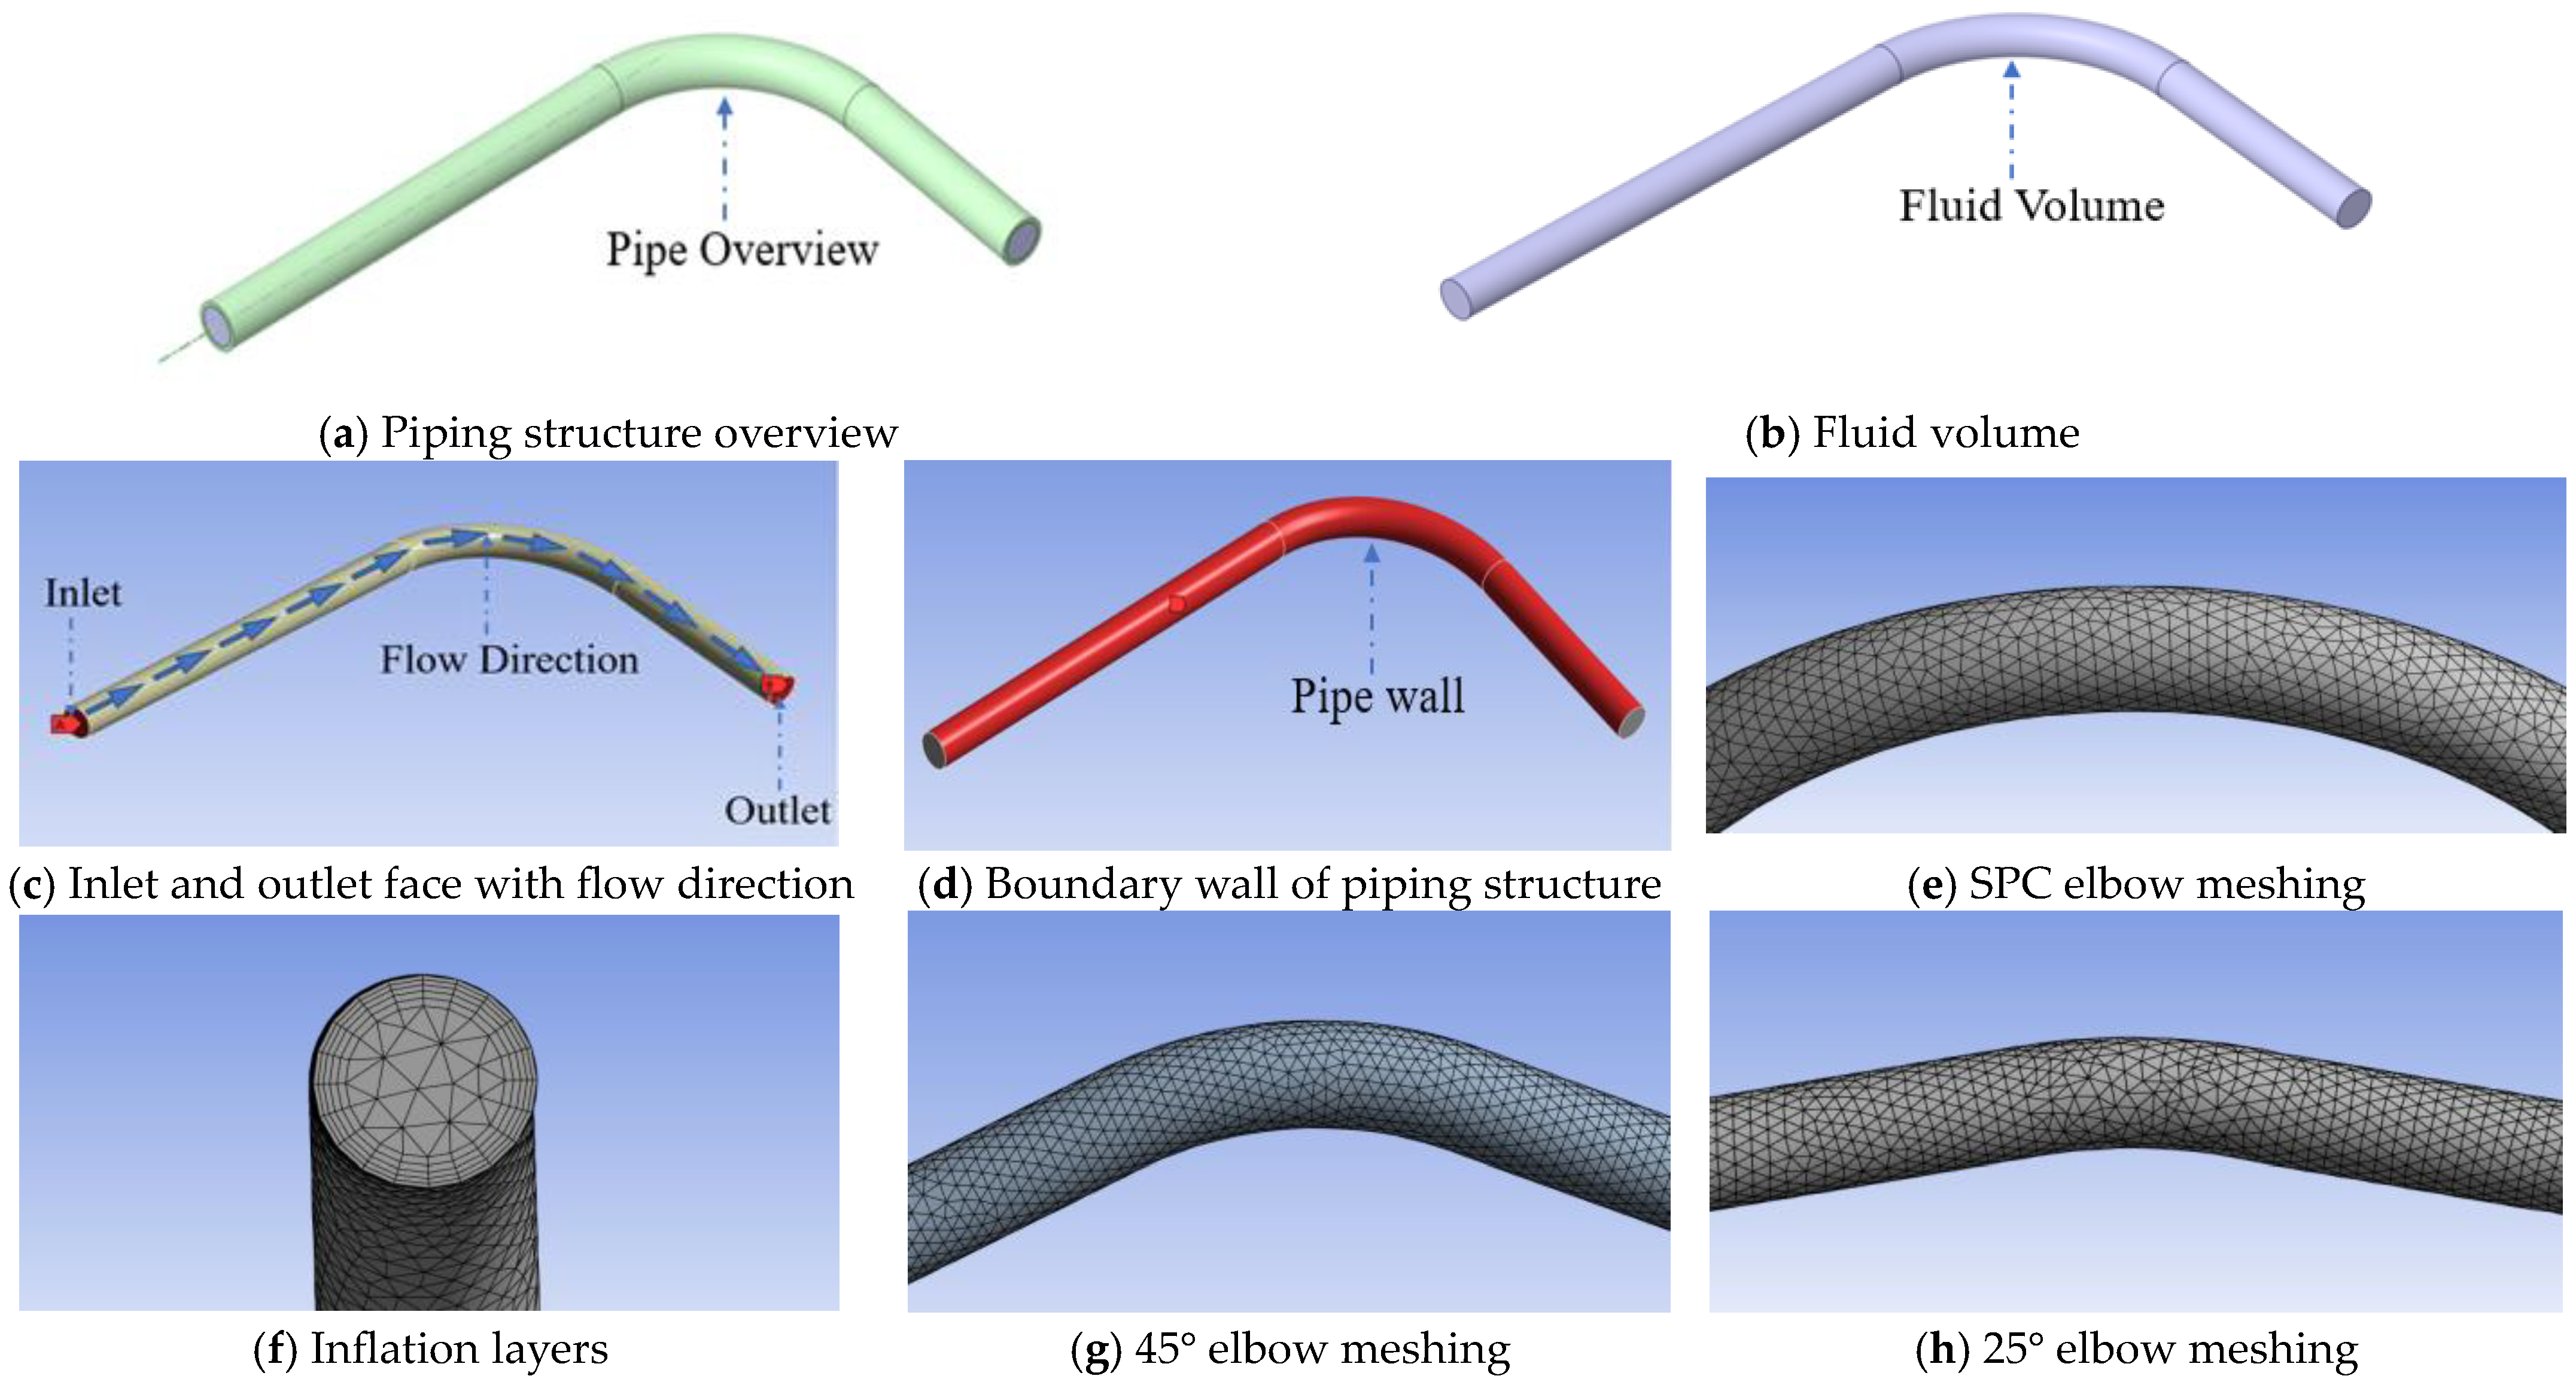
The geometry was modeled using Ansys Workbench 2022, specifically in Ansys Space Claim. After making the geometry, the fluid volume was created inside the piping structure, as shown in Figure 5a. After creating the volume, the inside of the piping, as shown in Figure 5b, was taken for CFD analysis. Named selections were created in which fluid was entering into the skim tank from a longer pipe, so it was named as inlet, as displayed in Figure 5c, while fluid along with solid particles of bitumen and CO2 was transferring to IGF from the shorter pipe, so it was named as the outlet, as shown in Figure 5c, while the wall of the piping was named as pipe wall, as depicted in Figure 5d. After the named selection, inflation meshing was generated with maximum layers of five and an element size of 61.431 mm, as shown in Figure 5e. Inflation was provided to better encounter the erosion wear near the walls, as shown in Figure 5f. Furthermore, the meshing in the elbows is shown in Figure 5g,h, and the meshing details are shown in Table 3, whereas inflation details are shown in Table 4.

4.2. Grid Independency Analysis

To ensure the independence of the mesh, a qualitative grid independence analysis was conducted for the C90 pipe case. In the CFD analysis of C90, the mesh size, mesh nodes, and mesh elements were set as output parameters P1, P2, and P3. Subsequently, in the CFD results the TDRs and ERs were also set as output parameters P4 and P5. To assess the impact of mesh size on the results, design points were established by varying the mesh sizes, and a grid independence analysis was executed. The analysis revealed that the TDRs and ERs remained consistent across different mesh sizes, as shown in Table 5, indicating that the results were mesh independent. This consistency confirms the reliability of the CFD analysis; therefore, the same meshing size was used for all FEA cases.

4.3. Material Properties

After importing the meshing into the Ansys Fluent setup, the material properties were specified. Initially for the C90, piping material properties of carbon steel were provided along with the inert particle properties of bitumen and CO2, while for material cases, carbon steel was replaced by properties of AISI 304 stainless steel and Inconel 617 alloy as shown in Table 1, along with same inert particles properties in all cases, as shown in Table 6.

4.4. Boundary Conditions

In each case, inlet and outlet conditions were specified with velocity and gauge pressure values at the boundary conditions for the moment, as shown in Table 4. When the turbulence intensity was 5%, a turbulent viscosity ratio of 10 and a fluid temperature of 90 °C was set for thermal conditions. The pipe wall conditions were set to a stationary wall with no-slip boundary conditions for shear. A standard roughness model was used with a roughness height of zero and a roughness constant of 0.5. Additionally, thermal conditions were provided in the boundary condition of pipe wall, providing the fluid temperature of 90 °C and the environmental temperature of −10 °C. This environment temperature was considered for assessing the future performance of piping structure under low environmental temperature.

4.5. Injection of Solid Particles Using DPM

Bitumen and CO2 injections were inserted from the inlet, and the injection type was specified as “Surface”, where, “Scale flow rate by face area” and “Inject using face normal direction” options were chosen. The particle characteristics were provided, including diameter, velocity magnitude, temperature, and flow rates for both bitumen and CO2 particles, as detailed in Table 7. Moreover, particle interactions with the continuous water phase were considered in the tracking process. The DPM iteration interval was set to 10, and a maximum of 50,000 steps was used for tracking and the step length factor was set at 5.

4.6. CFD Analysis Setup

The flux report for the mass flow rate at the outlet was generated in the report definition. The report plot was created with frequency of one. Furthermore, the residual convergence criteria were set to be 0.0001. Hybrid initialization was conducted in solution and the number of iterations before running the calculations were set to 210 iterations, with a reporting and profile update interval of one. The simulation solver runs for calculations where the Ansys Fluent used the naiver stokes k-ε turbulence model, DPM model, and erosion rate equations, as each equation was explained before.

5. Results and Discussions

The ER and TDR results were extracted for C90 and each case of pipe material, pipe wall thickness, elbow angle, and velocity. In C90, TDR was found to be 9.29 × 10⁻² m2/s3, as shown in Figure 6a, while the ER came out to be 1.24 × 10 8   k g / m 2 s , as shown in Figure 6b. To see the effect of different factors on TDR and ER results for each case are discussed below and are compared with the standard pipe model.

5.1. Effect of Pipe Material on TDR and ER

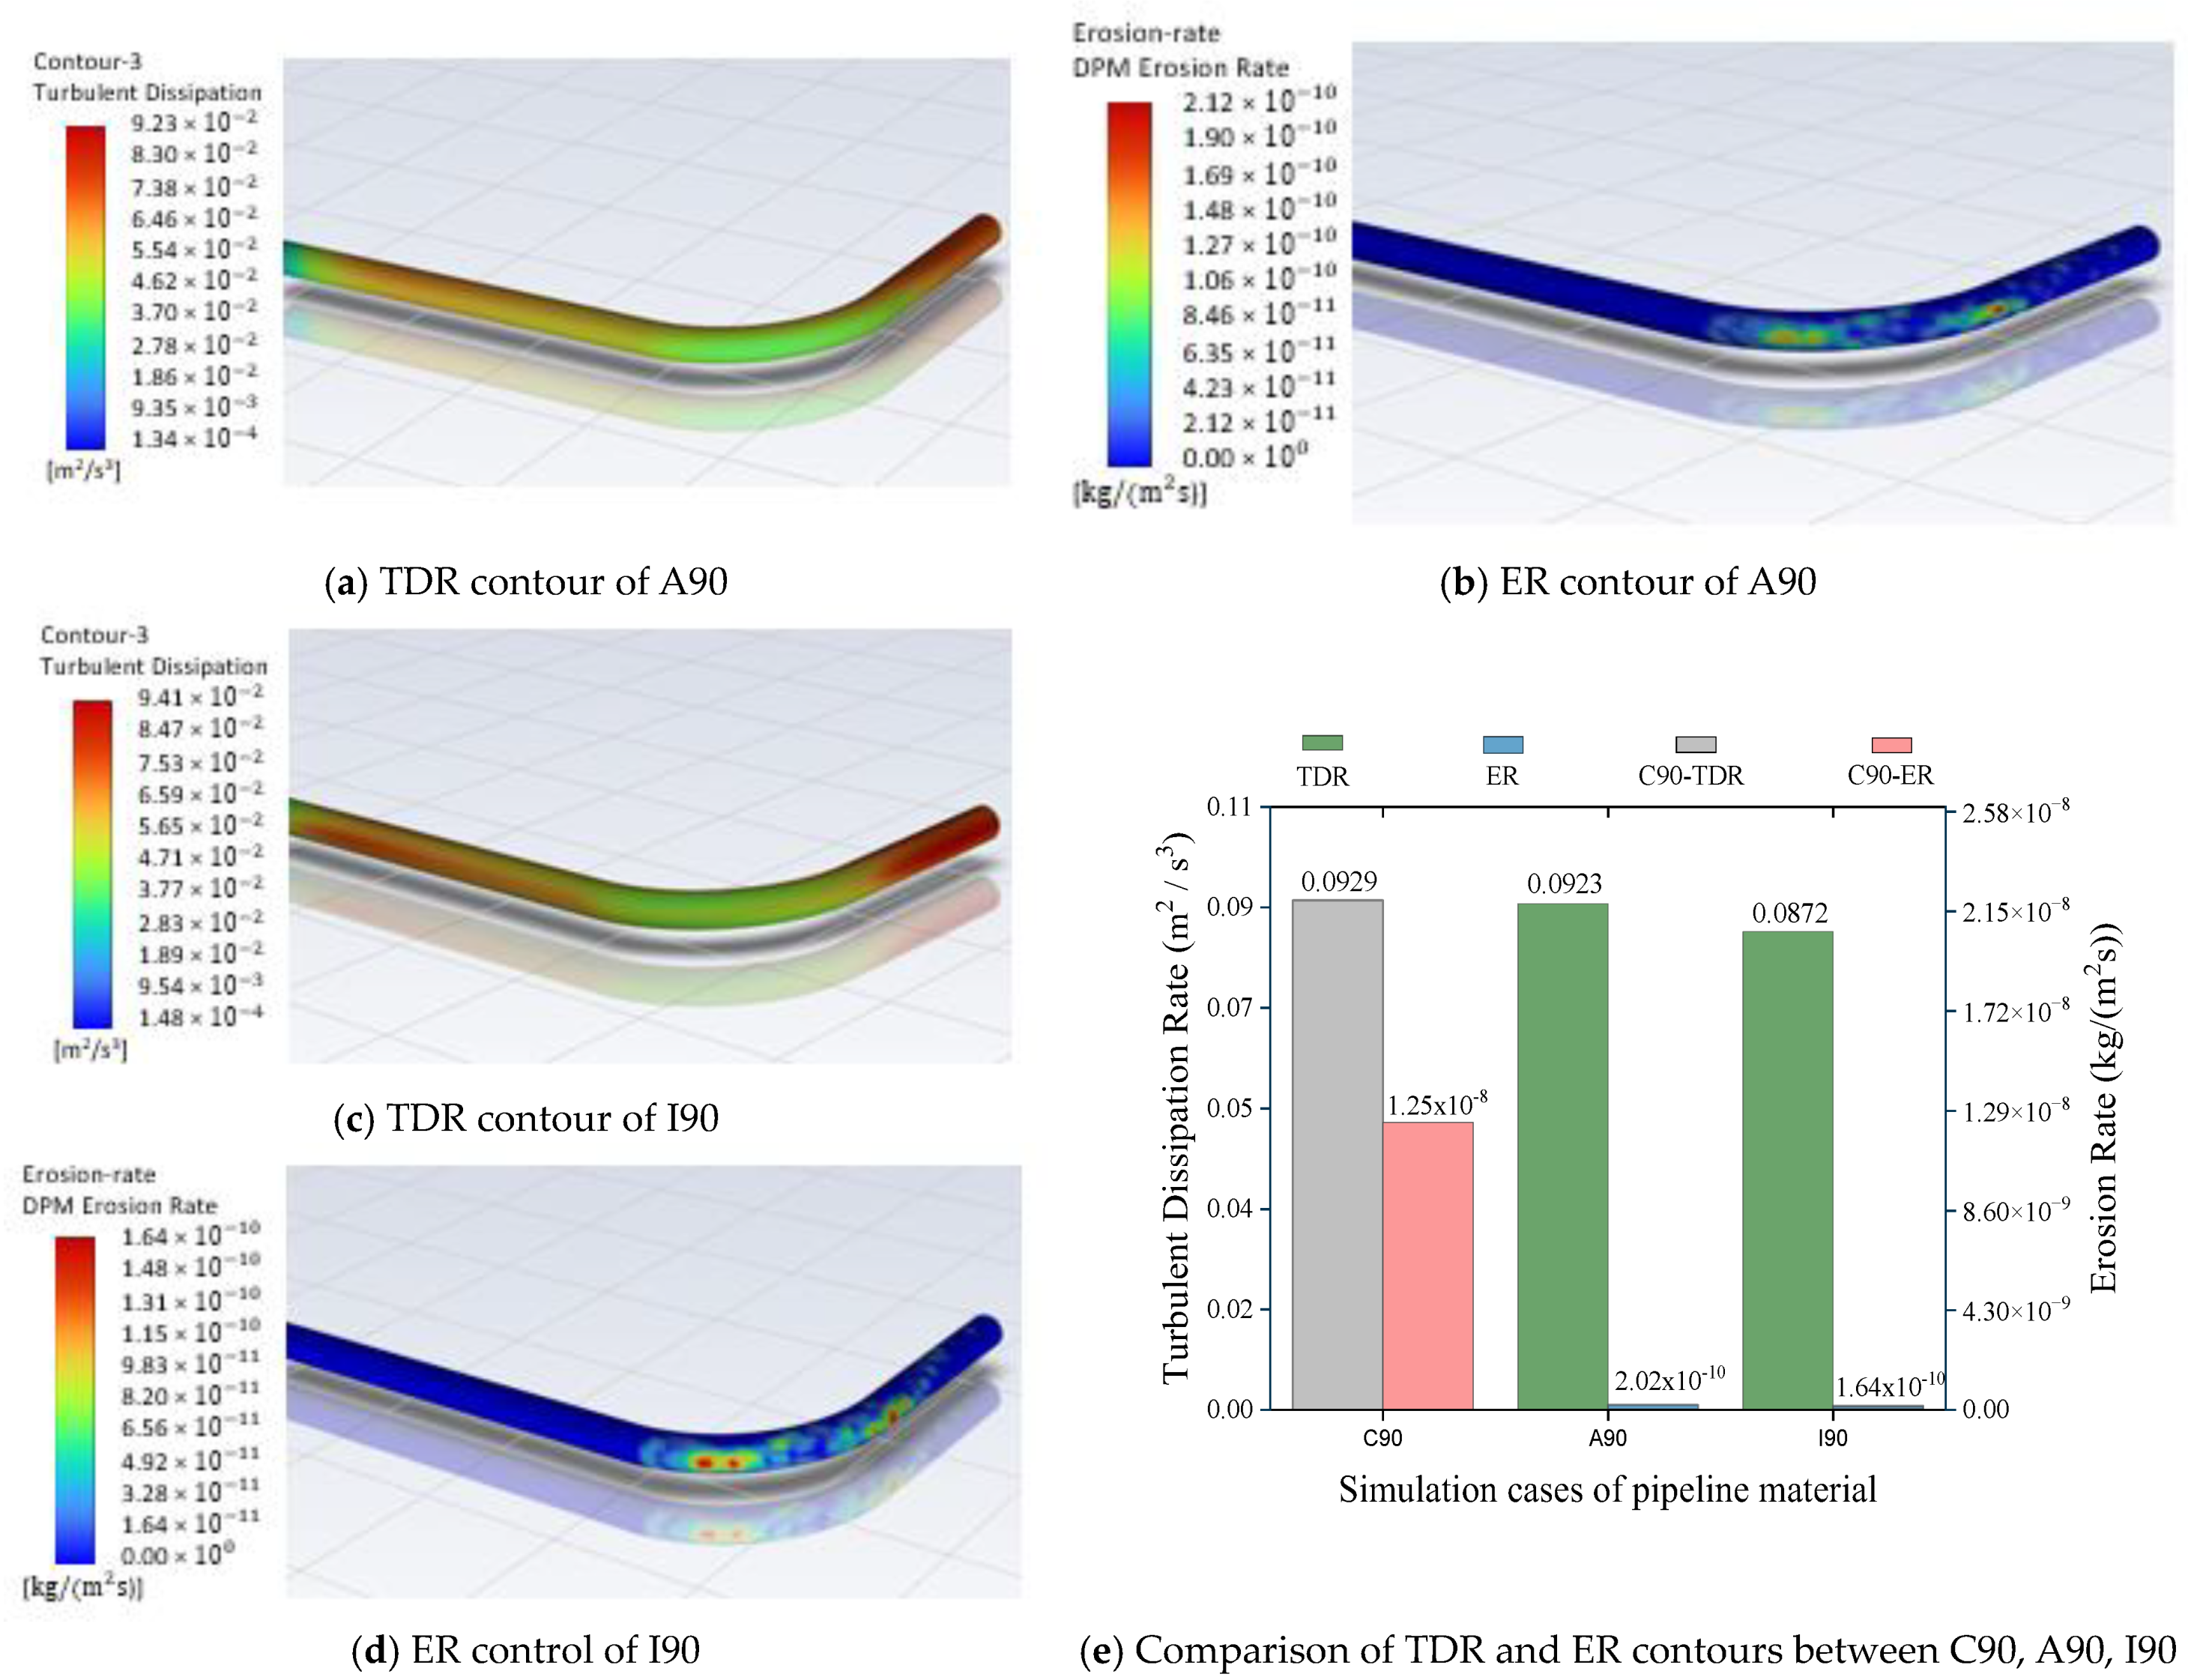
After analyzing the pipe material cases A90 and I90 by changing the pipeline material, the TDR in A90 was observed to be 9.29 × 10⁻² m2/s3, as shown in Figure 7a, and the ER was determined to be 2.12 × 10 10   k g / m 2 s , as depicted in Figure 7b. Both rates were observed to be lower than those of C90. Furthermore, in the case of I90, TDR came out to be 8.72 × 10⁻² m2/s3, as shown by simulation results in Figure 7c, and the ER was observed to be 1.64 × 10 10   k g / m 2 s , as shown in Figure 7d. Upon comparing the results, the TDR and ER in I90 were found to be lower than those in A90 and C90, as shown in Figure 7e.

5.2. Effect of Pipe Thickness on TDR and ER

After performing the CFD analysis of C90-tn and C90-tk cases by altering the pipe thickness (t/D). In C90-tn when the pipe wall thickness was reduced to 5.16 mm and the outer diameter to 69.3 mm, the TDR increased to 9.41 × 10⁻² m2/s3, as shown in Figure 8a and the ER increased to 2.04 × 10 7   k g / m 2 s , as shown in Figure 8b, while in C90-tk when pipeline wall thickness was increased to 14.02 mm and the pipe outer diameter to 87.02 mm, the TDR decreased to 8.71 × 10⁻² m2/s3, as shown in Figure 8c and the ER decreased to 1.87 × 10 10   k g / m 2 s , as shown in Figure 8d. Upon comparing the results, the TDR and ER in C90-tk were found to be lower than those in C90-tn and C90, as shown in Figure 8e.

5.3. Effect of Elbow Angle on TDR and ER

For C45 and C25, the CFD analyses were performed by changing the elbow angles. In C45 when elbow angle was decreased from   90 ° to 45 ° , the TDR decreased to 8.94 × 10⁻² m2/s3, as shown in Figure 9a, and the ER decreased to 1.59 × 10 10   k g / m 2 s , as shown in Figure 9b. In C25 when the elbow angle decreased from 90 ° to 25 ° , the TDR further decreased to 8.27 × 10⁻² m2/s3, as shown in Figure 9c and the ER decreased to 1.17 × 10 10   k g / m 2 s , as shown in Figure 9d. After comparing the simulation results, the TDR and ER in C25 were found to be lower than those in C45 and C90, as shown in Figure 9e.

5.4. Effect of Velocity on TDR and ER

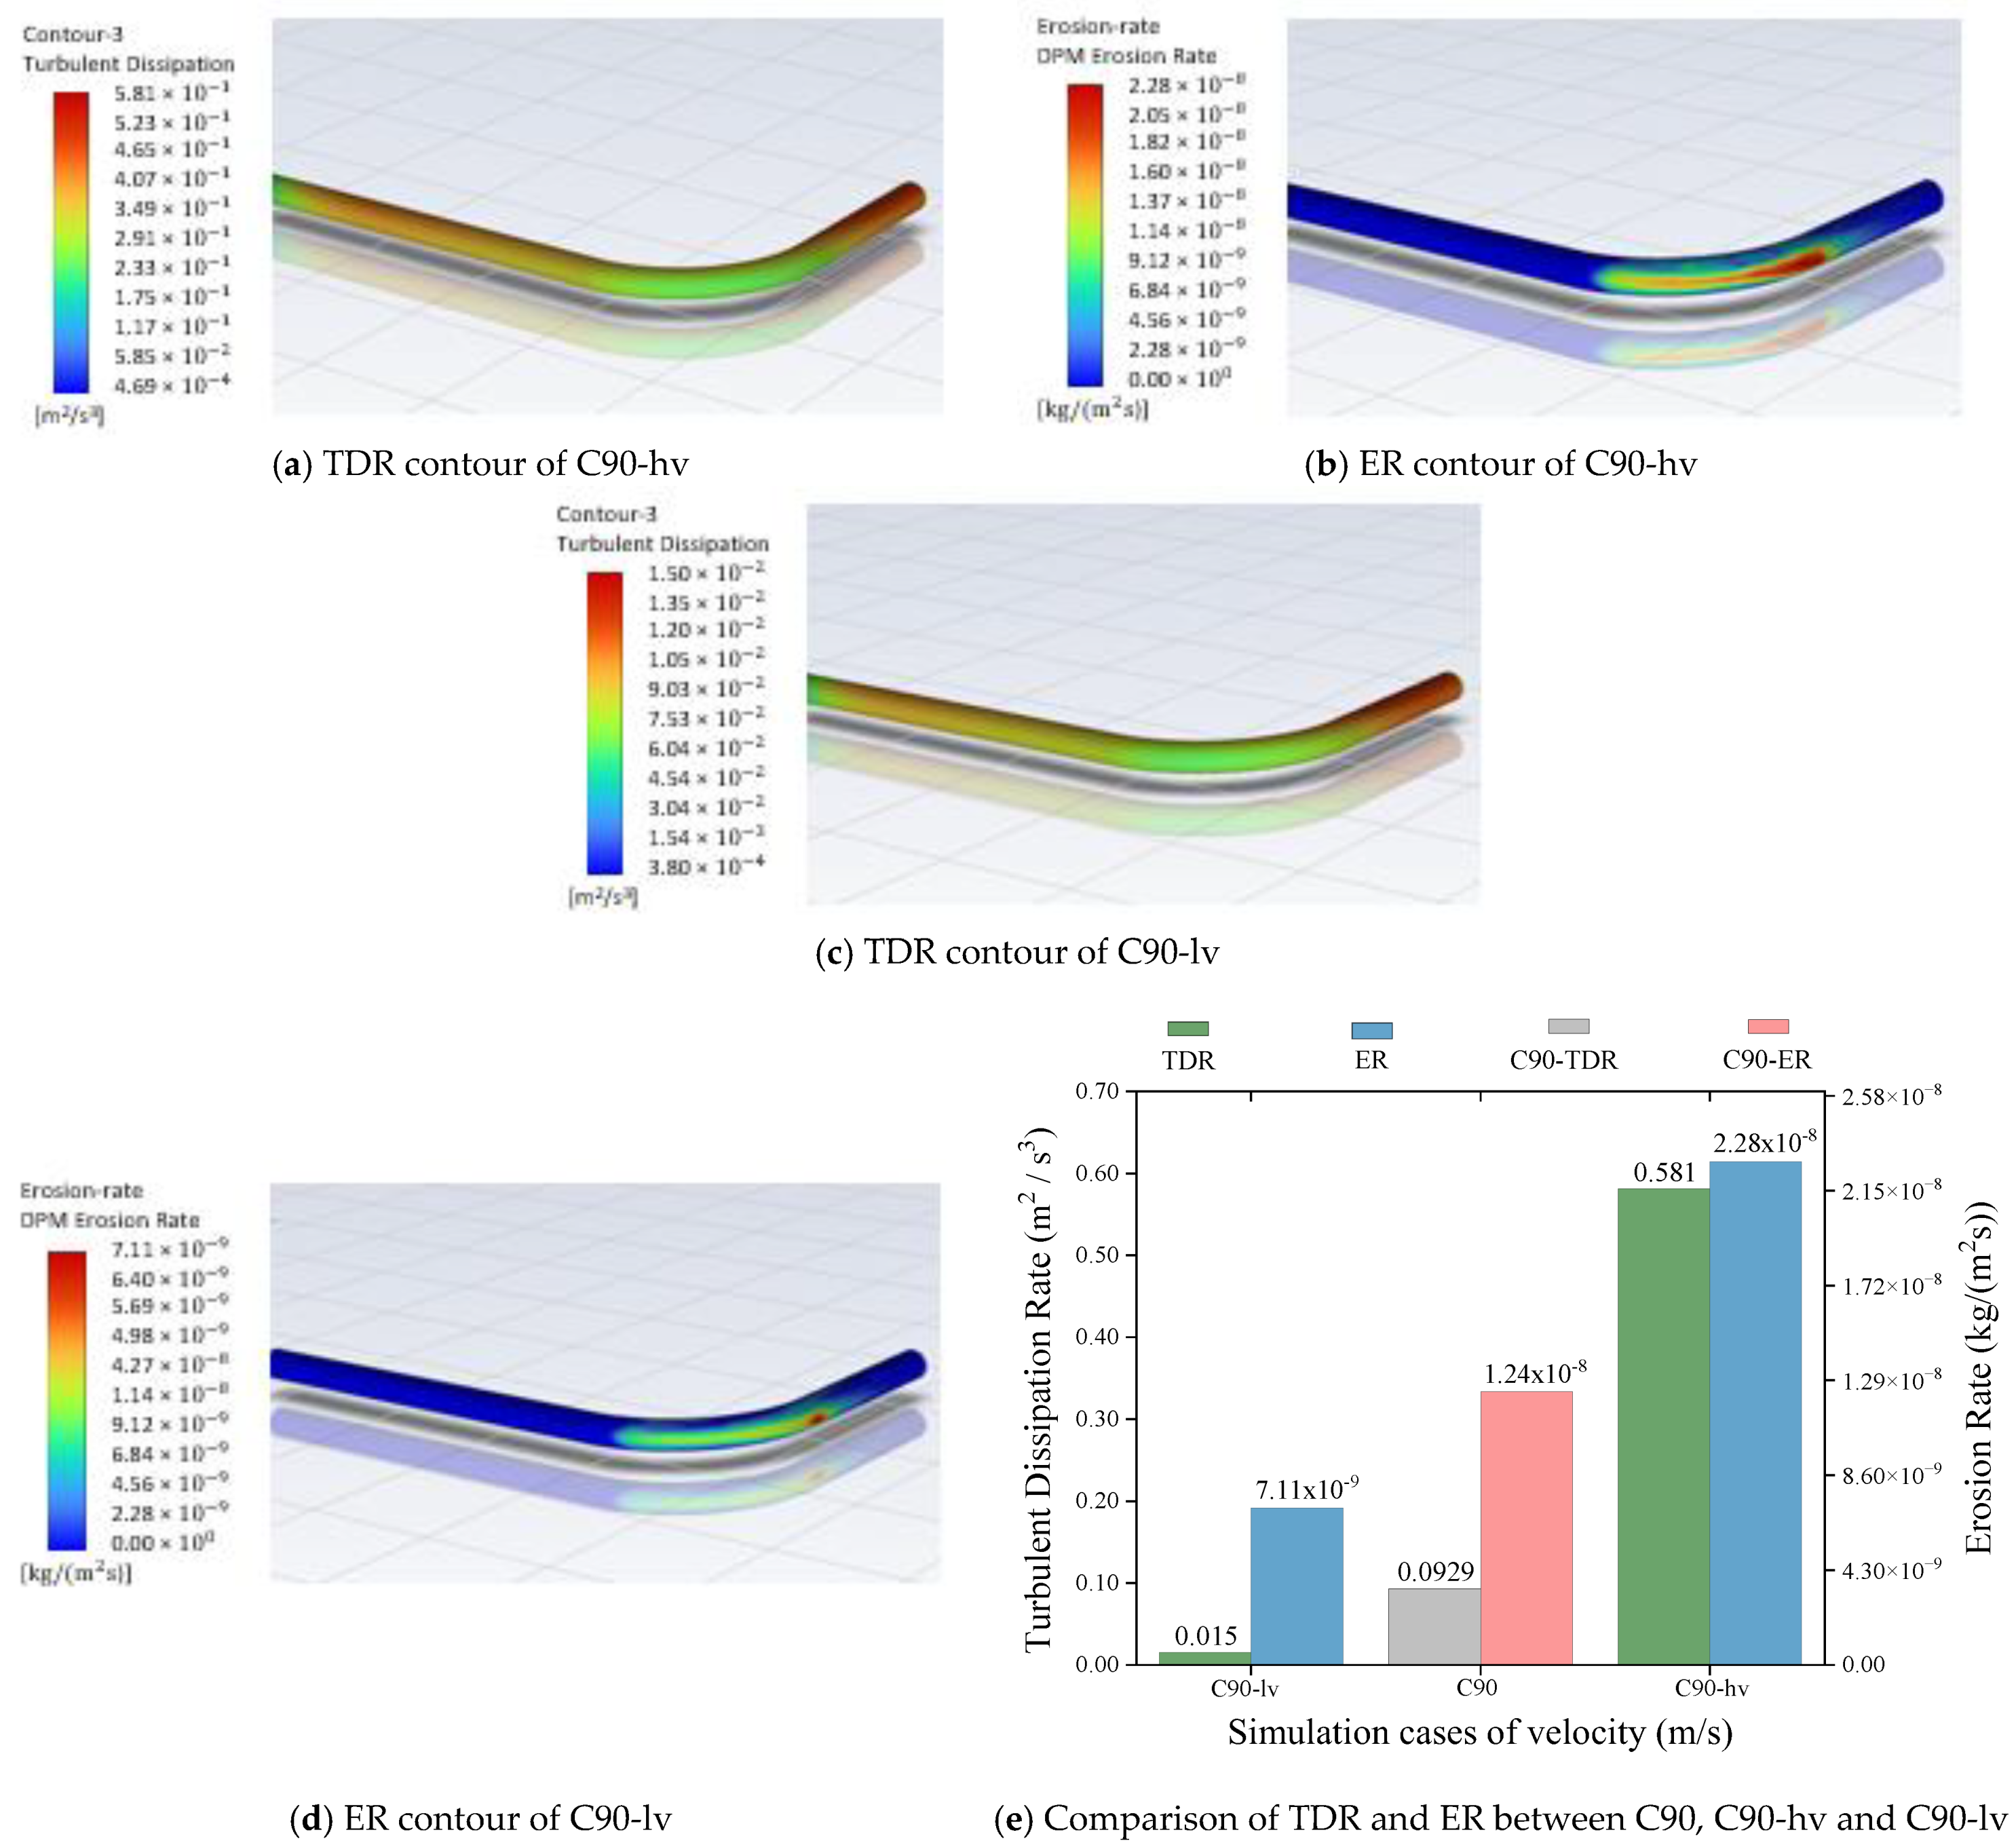
In C90-hv and C90-lv, the CFD simulations were performed by altering the fluid and particles velocity. In C90-hv, when the velocity increased from 0.688 to 1.38 m/s, which is two times the C90 velocity, it was observed that the TDR increased to 5.81 × 10⁻¹ m2/s3, as displayed in Figure 10a, and the erosion rate increased to 2.28 × 10 8   k g / m 2 s , as shown in Figure 10b. While in C90-lv, when the velocity was decreased from 0.688 m/s to 0.344 m/s, which is half of the C90 velocity, the TDR decreased to 1.50 × 10⁻² m2/s3, as shown in Figure 10c, and the erosion rate decreased to 7.11 × 10 9   k g / m 2 s , as shown in Figure 10d. After thorough comparison of the simulation results, the TDR and ER in C90-lv were found to be lower than those in C90-hv and C90, as shown in Figure 10e.

5.5. Optimize Model

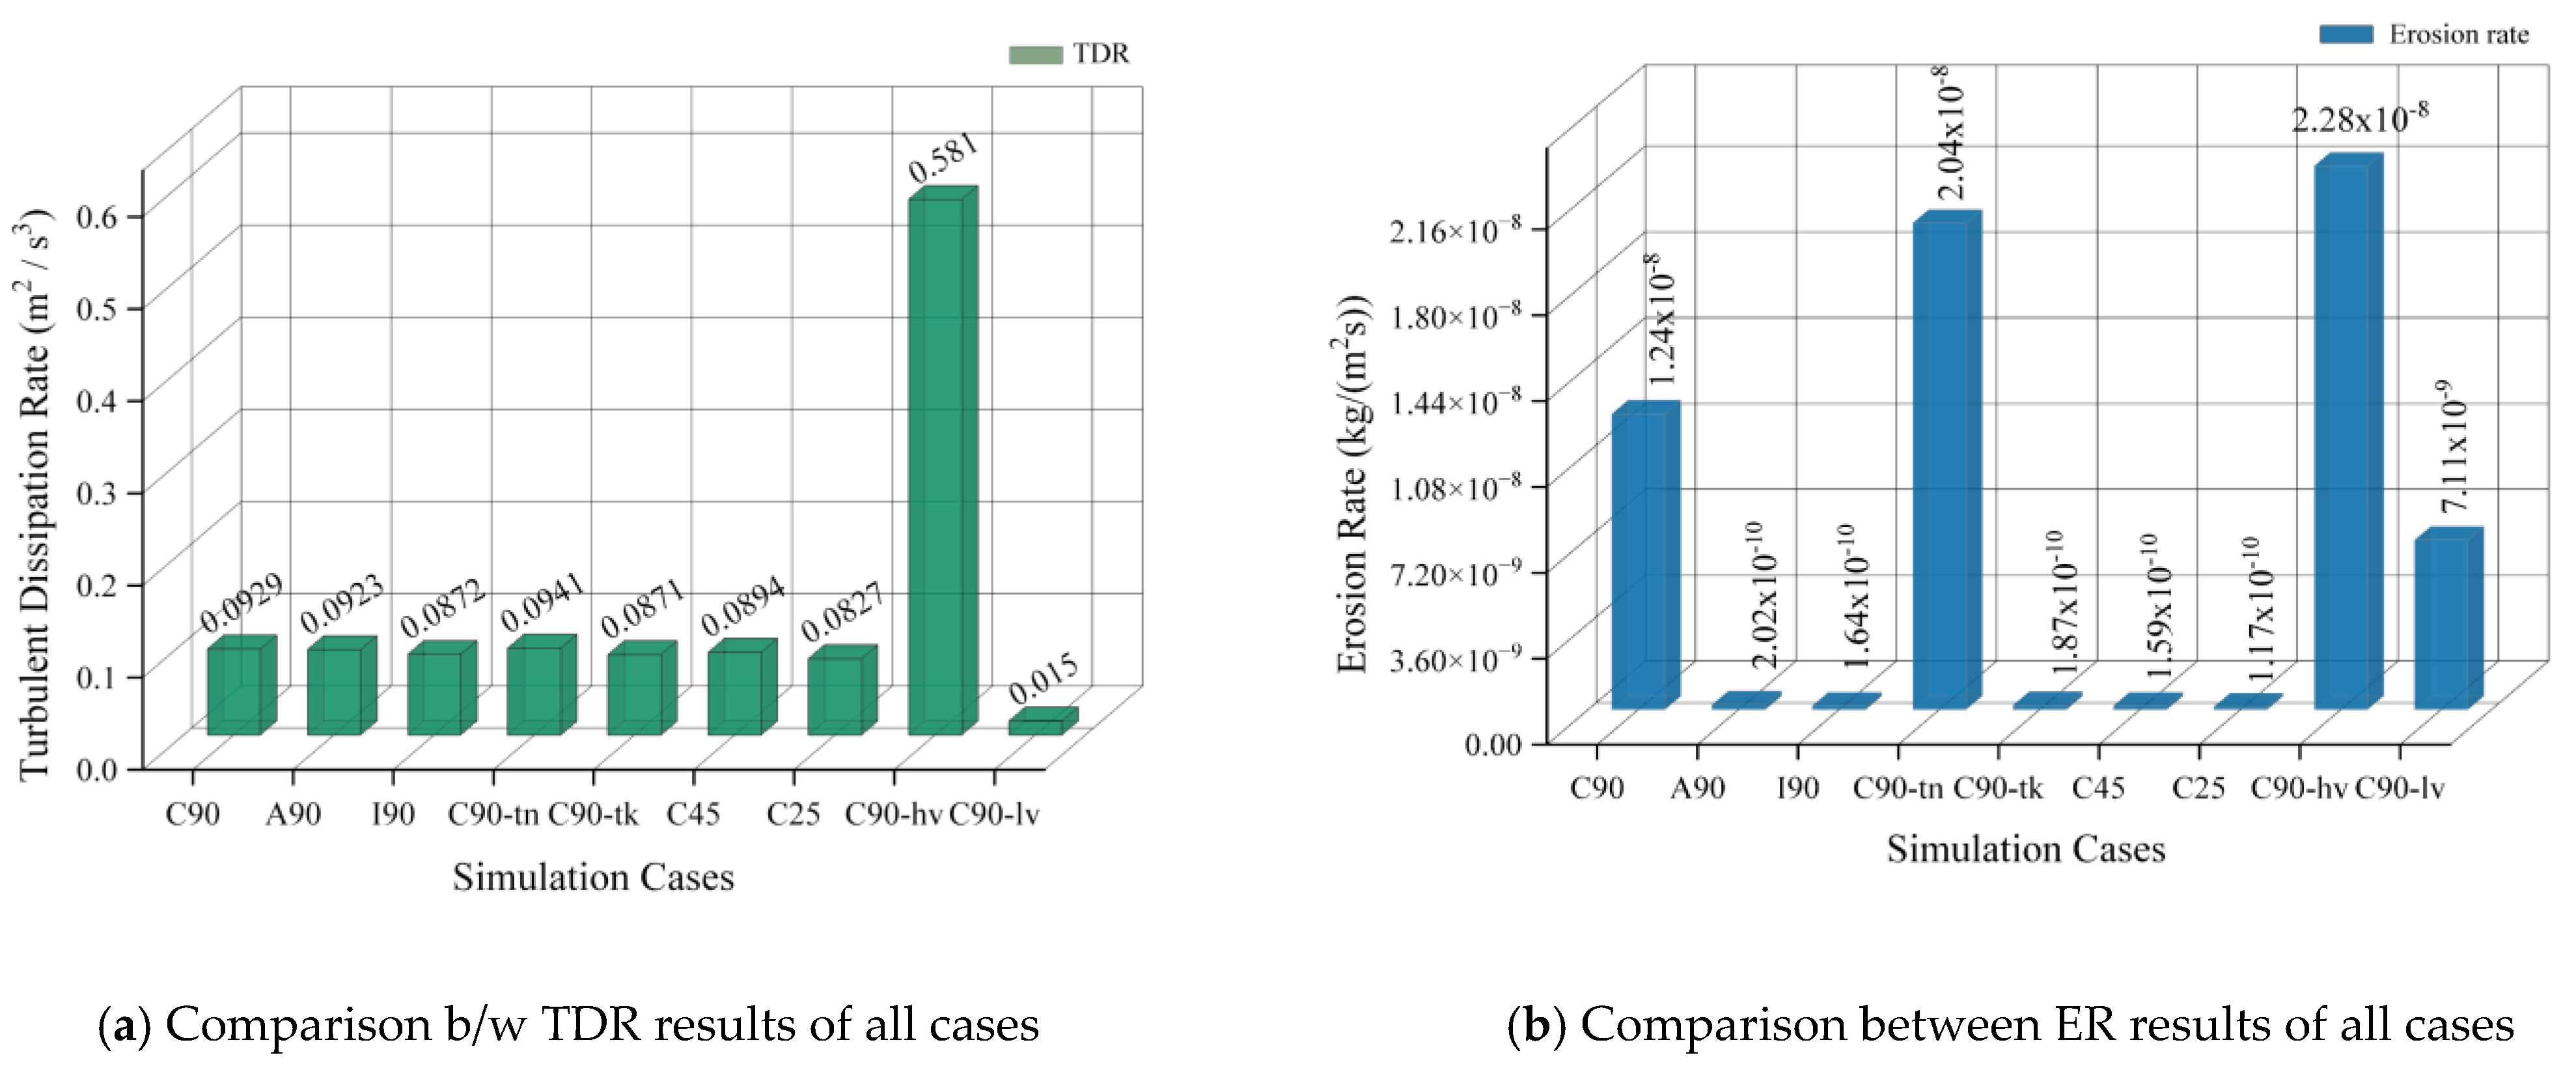
For designing an optimize piping structure (OP), the simulation results of TDR and ER for all cases were compared, as shown in Figure 11a,b. This comparison aimed to identify the best material choice, optimal pipeline wall thickness, suitable elbow angle, and the most appropriate velocity for the design. Among the material cases for A90 and I90, the I90, where the Inconel 617 alloy was utilized, exhibited the lowest TDR and ER compared with C90. Similarly, in the context of pipeline wall thickness cases for C90-tn and C90-tk, the C90-tk, in which pipeline wall thickness of 14.02 mm and an outer diameter of 87.02 mm were employed in pipeline design, displayed a TDR and ER comparable to C90. Moreover, in the CFD analysis of elbow angle cases C45 and C25, the C25, in which the elbow angle of 25 ° was used, demonstrated the least TDR and ER. Furthermore, in the investigation of fluid velocity cases for C90-hv and C90-lv, the C90-lv, in which the fluid velocity was reduced to half of the C90, exhibited a lower TDR and ER when compared with C90.
In light of the above findings, a pipe wall material of I90, pipeline thickness (t/D) of C90-tk, elbow angle of C25, and velocity of C90-lv were employed for designing OP, as shown Figure 12a, and the same inflation meshing size was used as employed in C90 and is displayed in Figure 12b.
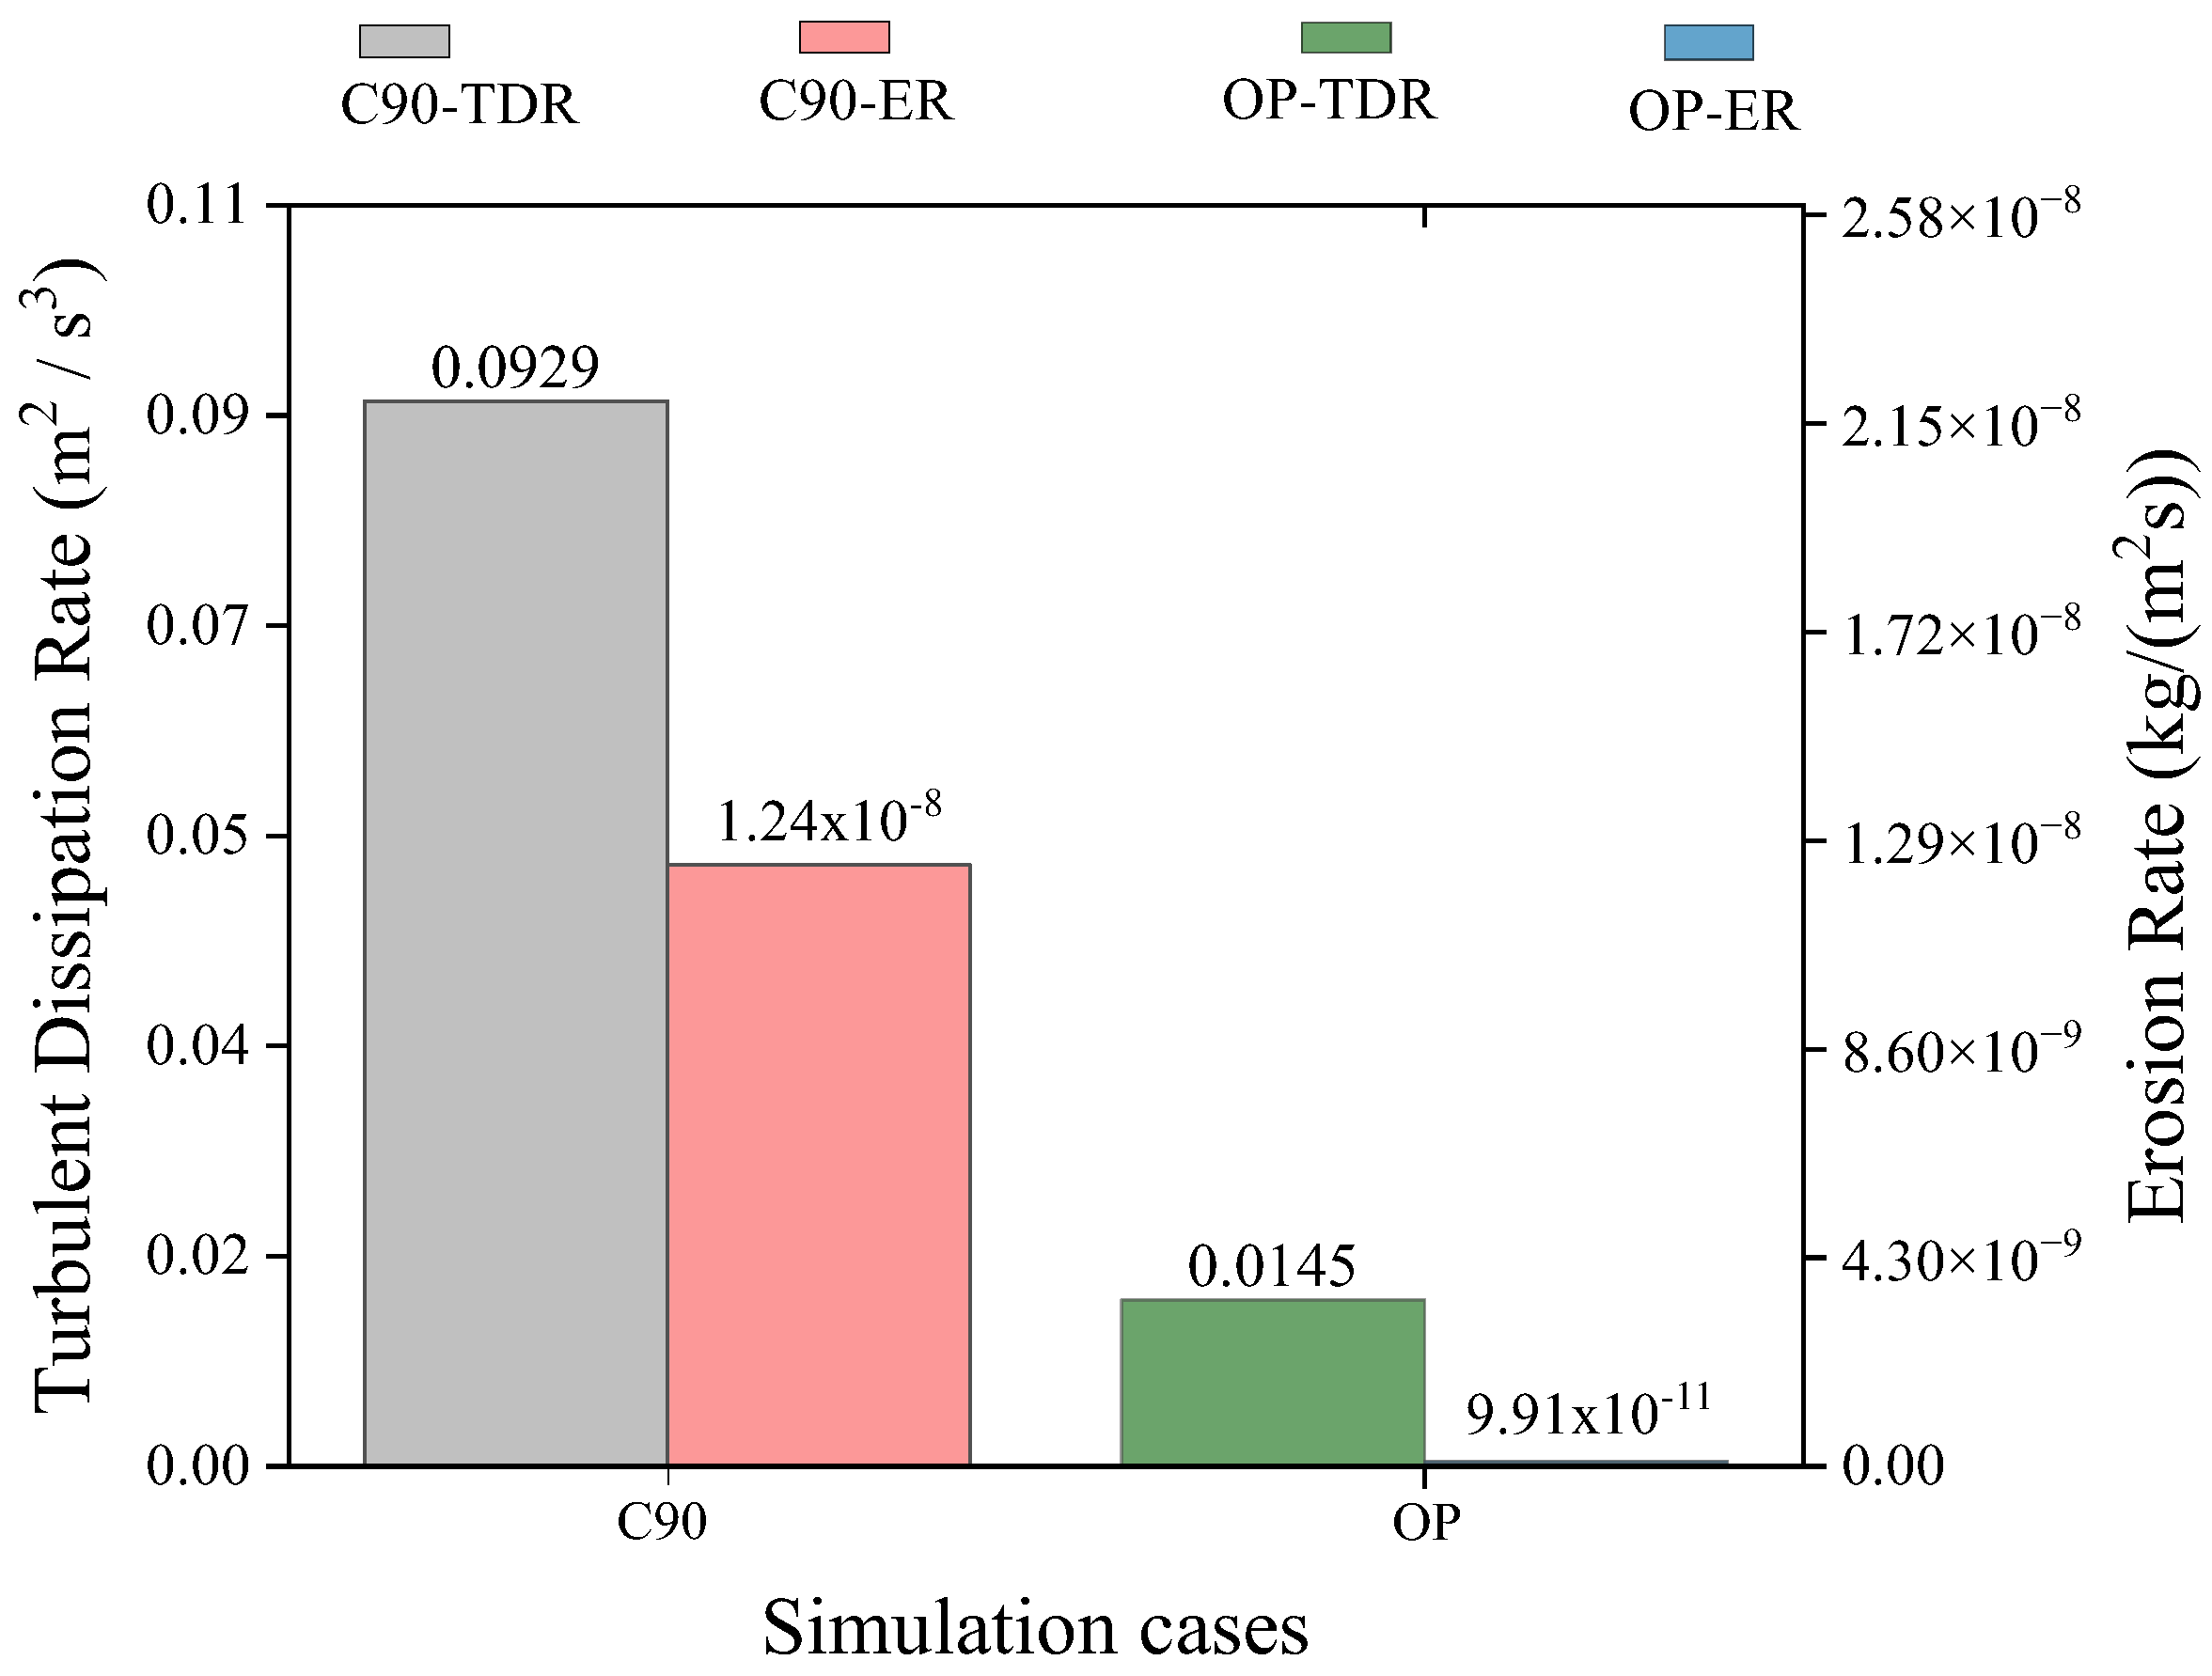
Upon comparing the C90 model with the OP model, it can be clearly seen in Figure 13a,b that the TDR decreased from 9.29 × 10 2   m 2 / s 3 to 1.45 × 10 2   m 2 / s 3 and the ER decreased from 1.24 × 10 8   k g / m 2 s to 9.91 × 10 11   k g / m 2 s , as shown in Figure 14.

6. Conclusions

This study was conducted to reduce the erosion rate in piping structures utilized in non-conventional oil plants and to optimize the design and material. The literature was reviewed based on the piping structure variables affecting the TDRs and ERs, and four key variables were selected to model the optimized piping structure that are piping material, piping thickness (t/D), elbow angle, and fluid velocity. The conclusions drawn based on this survey are as follows:
  • Upon comparing the simulation results of pipe material cases A90, and I90 with C90, it is evident from the CFD results that I90, in which the Inconel 617 alloy material was utilized, exhibited a significantly lower TDR and ER than A90 and C90. This decrease of the TDR and ER in I90 is attributed to the distinctive material properties of I90. Notably, I90 showcased a higher density and a superior Brinell hardness number in comparison to the properties of A90 and C90. Additionally, I90 exhibited lower thermal conductivity. These specific material characteristics played a crucial role in significantly reducing the erosion rate within the piping structure. Consequently, I90 emerged as a resilient choice, offering notable resistance against erosion.
  • After a thorough comparison of pipe thickness cases, specifically C90-tn and C90-tk, with the C90, the results revealed significant distinctions. C90-tk, characterized by a substantial pipe thickness (t/D) of 14.02/87.02 mm, demonstrated superior resilience against the impact of solid particles, owing to the provision of a more substantial material barrier against erosion. Notably, it exhibited the lowest TDR and ER in contrast to C90-tn and C90, in which thin pipe walls were used. This highlights the effectiveness of a thicker wall in mitigating erosion-related damage, resulting in decreased TDRs and ERs.
  • When comparing the outcomes of elbow angle cases C45 and C25, with the C90, it was observed that C25, featuring a 25-degree elbow angle, exhibited the lowest TDR and ER compared to C45 and C90, with 45 ° and 90 ° elbow angles. This attributes to the fact that a 25 ° elbow induces a less abrupt change in direction, reducing turbulence and fluid velocity gradients, ultimately leading to a decrease in the ER. The smoother flow transition in the 25 ° elbow, as opposed to sharper angles like 45 ° and 90 ° , minimizes flow separation thereby mitigates erosion. The favorable flow conditions resulting from this smoother transition contribute to the observed reduction in TDR and ER in C25.
  • Upon comparing the CFD results of fluid velocity cases C90-lv and C90-hv, with C90, C90-lv, with a velocity of 0.344 m/s, demonstrated the least TDR and ER compared to the C90, in which a fluid velocity of 0.688 m/s was used. The reduction in velocity in C90-lv diminished the impingement force of solid particles on the piping surface, thereby decreasing their kinetic energy and erosive potential. This deceleration in fluid flow results in a reduction in erosion action, ultimately lowering the turbulence and erosive forces exerted on the walls of piping structure.
  • The outcomes of the CFD analysis in this investigation suggested optimal configurations for pipe material, pipe thickness, elbow angle, and fluid velocity. Employing these refined parameters, an optimized piping structure (OP) was designed, and the comparison with the standard piping structure (C90) showcased a notable 80% decrease in TDR and a remarkable 99.2% decrease in ER. This reaffirms the effectiveness of utilizing Inconel 617 alloy, adopting a higher pipeline thickness, opting for a 25 ° elbow angle, and employing a lower fluid velocity for enhancing piping structure durability and effectively mitigating erosion.
  • Crude oil is critical, accounting for 34% of the global energy system and over 90% of world transportation. Given the global increase in oil demand since 2004, research and development on non-conventional oil plants are essential. This study highlights the crucial role of pipelines in non-conventional oil plants and confirms the importance of addressing pipeline erosion. Our work emphasizes the necessity for continued research in the piping optimization area. In future studies, we aim to conduct in-depth fatigue and buckling analyses to enhance safety, extend pipeline life, and improve reliability. Additionally, we plan to validate our numerical results with experiments on actual pipelines, thereby proving the reliability of our findings.

Author Contributions

Conceptualization, J.-H.A. and R.A.; Data curation, J.-H.A., R.A. and H.-W.L.; Formal analysis, J.-H.A., R.A., H.-W.L. and I.-J.H.; Writing—original draft, J.-H.A. and R.A.; Writing—review and editing, H.-W.L., I.-J.H. and J.-W.H.; Supervision, J.-W.H.; Visualization, I.-J.H. and J.-W.H. All authors have read and agreed to the published version of the manuscript.

Funding

This work is supported by the Korea Agency for Infrastructure Technology Advancement (KAIA) grant funded by the Ministry of Land, Infrastructure and Transport (Grant RS-2022-00143541).

Data Availability Statement

The original contributions presented in the study are included in the article, further inquiries can be directed to the corresponding author.

Conflicts of Interest

The authors declare no conflict of interest.

References

  1. Berkowitz, N.; Speight, J.G. The Oil Sands of Alberta. Fuel 1975, 54, 138–149. [Google Scholar] [CrossRef]
  2. Bedore, J.; Turner, L. The Industrialization of the Middle Eastern Oil Producers. World Today 1977, 33, 326–334. [Google Scholar]
  3. Dorian, J.P. Central Asia: A Major Emerging Energy Player in the 21st Century. Energy Policy 2006, 34, 544–555. [Google Scholar] [CrossRef]
  4. Study of Greenhouse Gases Reduction Alternatives for the Exploitation of Non-Conventional Oil Sands in Canada (Conference) | ETDEWEB. Available online: https://www.osti.gov/etdeweb/biblio/21219437 (accessed on 24 November 2023).
  5. Alberta Oil Sands Development|PNAS. Available online: https://www.pnas.org/doi/abs/10.1073/pnas.0912880107 (accessed on 24 November 2023).
  6. Hedrick, B.; Seibert, K.; Crewe, C. A New Approach to Heavy Oil and Bitumen Upgrading. Available online: https://es.scribd.com/document/638939122/A-New-Approach-to-Heavy-Oil-and-Bitumen-Upgrading (accessed on 17 April 2023).
  7. Thermal Techniques for the Recovery of Heavy Oil and Bitumen|SPE International Improved Oil Recovery Conference in Asia Pacific|OnePetro. Available online: https://onepetro.org/SPEAPIOR/proceedings-abstract/05IIOR/All-05IIOR/89539 (accessed on 24 November 2023).
  8. Okonkwo, P.C.; Mohamed, A.M. Erosion-Corrosion in Oil and Gas Industry: A Review. Int. J. Metall. Mater. Sci. Eng. 2014, 4, 7–28. [Google Scholar]
  9. Wee, S.K.; Yap, Y.J. CFD Study of Sand Erosion in Pipeline. J. Pet. Sci. Eng. 2019, 176, 269–278. [Google Scholar] [CrossRef]
  10. Alghurabi, A.; Mohyaldinn, M.; Jufar, S.; Younis, O.; Abduljabbar, A.; Azuwan, M. CFD Numerical Simulation of Standalone Sand Screen Erosion Due to Gas-Sand Flow. J. Nat. Gas Sci. Eng. 2021, 85, 103706. [Google Scholar] [CrossRef]
  11. Peng, W.; Cao, X. Numerical Prediction of Erosion Distributions and Solid Particle Trajectories in Elbows for Gas–Solid Flow. J. Nat. Gas Sci. Eng. 2016, 30, 455–470. [Google Scholar] [CrossRef]
  12. Arabnejad, H.; Mansouri, A.; Shirazi, S.A.; McLaury, B.S. Abrasion Erosion Modeling in Particulate Flow. Wear 2017, 376, 1194–1199. [Google Scholar] [CrossRef]
  13. McLaury, B.S.; Wang, J.; Shirazi, S.A.; Shadley, J.R.; Rybicki, E.F. Solid Particle Erosion in Long Radius Elbows and Straight Pipes. In Proceedings of the SPE Annual Technical Conference and Exhibition, San Antonio, TX, USA, 5–8 October 1997; OnePetro: Richardson, TX, USA, 1997. [Google Scholar]
  14. Parsi, M.; Najmi, K.; Najafifard, F.; Hassani, S.; McLaury, B.S.; Shirazi, S.A. A Comprehensive Review of Solid Particle Erosion Modeling for Oil and Gas Wells and Pipelines Applications. J. Nat. Gas Sci. Eng. 2014, 21, 850–873. [Google Scholar] [CrossRef]
  15. Oka, Y.I.; Ohnogi, H.; Hosokawa, T.; Matsumura, M. The Impact Angle Dependence of Erosion Damage Caused by Solid Particle Impact. Wear 1997, 203, 573–579. [Google Scholar] [CrossRef]
  16. Parent, L.L.; Li, D.Y. Wear of Hydrotransport Lines in Athabasca Oil Sands. Wear 2013, 301, 477–482. [Google Scholar] [CrossRef]
  17. Peng, G.; Huang, X.; Zhou, L.; Zhou, G.; Zhou, H. Solid-Liquid Two-Phase Flow and Wear Analysis in a Large-Scale Centrifugal Slurry Pump. Eng. Fail. Anal. 2020, 114, 104602. [Google Scholar] [CrossRef]
  18. Beccati, N.; Ferrari, C.; Parma, M.; Semprini, M. Eulerian Multi-Phase CFD Model for Predicting the Performance of a Centrifugal Dredge Pump. Int. J. CMEM 2019, 7, 316–326. [Google Scholar] [CrossRef]
  19. Sharma, M.; Goyal, D.K.; Kaushal, G.; Grover, N.K.; Bansal, A.; Goyal, K. CFD and Experimental Study of Slurry Erosion Wear in Hydro-Machinery. Mater. Today Proc. 2022, 62, 7581–7594. [Google Scholar] [CrossRef]
  20. Ariyaratne, W.K.H.; Ratnayake, C.; Melaaen, M.C. CFD Modeling of Dilute Phase Pneumatic Conveying in a Horizontal Pipe Using Euler–Euler Approach. Part. Sci. Technol. 2019, 37, 1015–1023. [Google Scholar] [CrossRef]
  21. Martins, N.M.; Carrico, N.J.; Ramos, H.M.; Covas, D.I. Velocity-Distribution in Pressurized Pipe Flow Using CFD: Accuracy and Mesh Analysis. Comput. Fluids 2014, 105, 218–230. [Google Scholar] [CrossRef]
  22. Ansys Workbench 2022. Available online: https://www.ansys.com/products/ansys-workbench (accessed on 24 November 2023).
  23. Sultan, R.A.; Rahman, M.A.; Rushd, S.; Zendehboudi, S.; Kelessidis, V.C. Validation of CFD Model of Multiphase Flow through Pipeline and Annular Geometries. Part. Sci. Technol. 2019, 37, 685–697. [Google Scholar] [CrossRef]
  24. Na, S.J.; Kim, Y.S.; Jeon, E.S. Analysis of Erosion Minimization for a Slurry Pump Using Discrete Phase Model Simulations. Appl. Sci. 2022, 12, 1597. [Google Scholar] [CrossRef]
  25. Abdulla, A. Estimating Erosion in Oil and Gas Pipe Line Due to Sand Presence 2011. Available online: https://www.diva-portal.org/smash/get/diva2:833640/FULLTEXT01.pdf (accessed on 24 November 2023).
  26. Eulerian-Eulerian Simulation of Particle-Liquid Slurry Flow in Horizontal Pipe. Available online: https://www.hindawi.com/journals/jpe/2016/5743471/ (accessed on 30 May 2024).
  27. Hong, B.; Li, Y.; Li, X.; Ji, S.; Yu, Y.; Fan, D.; Qian, Y.; Guo, J.; Gong, J. Numerical Simulation of Gas-Solid Two-Phase Erosionf or Elbow and Tee Pipe in Gas Field. Energies 2021, 14, 6609. [Google Scholar] [CrossRef]
  28. Singh, J.; Gill, H.S.; Vasudev, H. Computational Fluid Dynamics Analysis on Role of Particulate Shape and Size in Erosion of Pipe Bends. Int. J. Interact. Des. Manuf. 2023, 17, 2631–2646. [Google Scholar] [CrossRef]
  29. Pereira, F.A.R.; Ataíde, C.H.; Barrozo, M.A.S. CFD Approach Using a Discrete Phase Model for Annular Flow Analysis. Lat. Am. Appl. Res. 2010, 40, 53–60. [Google Scholar]
  30. Sekavčnik, M.; Ogorevc, T.; Škerget, L. CFD Analysis of the Dynamic Behaviour of a Pipe System. Forsch Ingenieurwes 2006, 70, 139–144. [Google Scholar] [CrossRef]
  31. Marrah, A. Simulating of Erosion Modeling Using ANSYS Fluid Dynamics. Ph.D. Thesis, Memorial University of Newfoundland, St. John’s, NL, Canada, 2019. [Google Scholar]
  32. Lv, Z.; Hou, R.; Tian, Y.; Huang, C.; Zhu, H. Investigation on Flow Field of Ultrasonic-Assisted Abrasive Waterjet Using CFD with Discrete Phase Model. Int. J. Adv. Manuf. Technol. 2018, 96, 963–972. [Google Scholar] [CrossRef]
  33. Zhao, Y.; Ma, H.; Xu, L.; Zheng, J. An Erosion Model for the Discrete Element Method. Particuology 2017, 34, 81–88. [Google Scholar] [CrossRef]
  34. Habib, M.A.; Ben-Mansour, R.; Badr, H.M.; Kabir, M.E. Erosion and Penetration Rates of a Pipe Protruded in a Sudden Contraction. Comput. Fluids 2008, 37, 146–160. [Google Scholar] [CrossRef]
  35. Khan, R.; Ya, H.; Pao, W. An Experimental Study on the Erosion-Corrosion Performance of AISI 1018 Carbon Steel and AISI 304L Stainless Steel 90-Degree Elbow Pipe. Metals 2019, 9, 1260. [Google Scholar] [CrossRef]
  36. Rajkumar, Y.; Shirazi, S.A.; Karimi, S. Effect of Pipe Size on Erosion Measurements and Predictions in Liquid-Dominated Multiphase Flows for the Elbows. Wear 2023, 523, 204797. [Google Scholar] [CrossRef]
  37. Near-Wall k-Epsilon Turbulence Modeling|AIAA Journal. Available online: https://arc.aiaa.org/doi/abs/10.2514/3.10222?journalCode=aiaaj (accessed on 24 November 2023).
  38. ASME B36.10M-2015; Welded and Seamless Wrought Steel Pipe. The American Society of Mechanical Engineers (ASME): New York, NY, USA, 2015.
  39. An Investigation of Erosion Prediction for 15° to 90° Elbows by Numerical Simulation of Gas-Solid Flow—ScienceDirect. Available online: https://www.sciencedirect.com/science/article/pii/S003259101830305X (accessed on 24 November 2023).
  40. Mazumder, Q.H.; Zhao, S.; Ahmed, K. Effect of Bend Radius on Magnitude and Location of Erosion in S-Bend. Model. Simul. Eng. 2015, 2015, 930497. [Google Scholar] [CrossRef]
  41. Li, C.; Huang, Q.; Yan, S.; Huang, T. Parametric CFD Studies on Erosion in 3D Double Elbow. Int. J. Eng. Syst. Model. Simul. 2016, 8, 264. [Google Scholar] [CrossRef]
  42. Lopez, D.; Congote, J.P.; Cano, J.R.; Toro, A.; Tschiptschin, A.P. Effect of Particle Velocity and Impact Angle on the Corrosion–Erosion of AISI 304 and AISI 420 Stainless Steels. Wear 2005, 259, 118–124. [Google Scholar] [CrossRef]
  43. Islam, M.A.; Farhat, Z.N. Effect of Impact Angle and Velocity on Erosion of API X42 Pipeline Steel under High Abrasive Feed Rate. Wear 2014, 311, 180–190. [Google Scholar] [CrossRef]
Figure 1. Non-traditional oil plant and bitumen extraction method.
Applsci 14 05234 g001
Figure 2. Modeling of standard piping structure taken from oil facility.
Applsci 14 05234 g002
Figure 3. Development of piping models by varying (t/D).
Applsci 14 05234 g003
Figure 4. Modeling of piping structure by varying elbow angles.
Applsci 14 05234 g004
Figure 5. Modeling and meshing.
Applsci 14 05234 g005
Figure 6. Simulation results of C90.
Applsci 14 05234 g006
Figure 7. Simulation results of A90 and I90 and their comparison with simulation results of C90.
Applsci 14 05234 g007
Figure 8. Simulation results of C90-tn and C90-tk and their comparison with simulation results of C90.
Applsci 14 05234 g008
Figure 9. Simulation results of C45 and 25 and their comparison with simulation results of C90.
Applsci 14 05234 g009
Figure 10. Simulation results of C90-hv and C90-lv and their comparison with simulation results of C90.
Applsci 14 05234 g010
Figure 11. Comparison b/w TDR and ER among all simulation cases.
Applsci 14 05234 g011
Figure 12. Design and Meshing of OP pipeline.
Applsci 14 05234 g012
Figure 13. TDR and ER result of OP.
Applsci 14 05234 g013
Figure 14. Comparison of TDR and ER between C90 and OP.
Applsci 14 05234 g014
Table 1. Material properties used in simulations.
Pipeline MaterialCarbon Steel AISI 304 Stainless SteelInconel 617 Alloy
Density (g/ c m 3 )7.858.008.36
Brinell Hardness Number120123170
Specific Heat J/(kg·k)480500419
Thermal Conductivity(w/m-k) 47.616.213.6
Modulus of Elasticity (Gpa)200193173
Poison’s Ratio (v)0.290.290.30
Table 2. Simulation cases with design variable details.
Case IDVariablesPipe MaterialPipe Outer Diameter (D) (mm)Pipe Inner Diameter (mm)Pipe Wall Thickness (t) (mm)Elbow Angle (Degree)Velocity (m/s)
C90Standard pipeCarbon Steel SCH807358.987.01900.688
A90Pipe materialAISI 304 Stainless Steel7358.987.01900.688
I90Inconel 617 Alloy7358.987.01900.688
C90-tnPipe size (t/D)Carbon Steel69.358.985.16900.688
C90-tkCarbon Steel87.0258.9814.02900.688
C45Elbow angleCarbon Steel7358.987.01450.688
C25Carbon Steel7358.987.01250.688
C90-hvVelocityCarbon Steel7358.987.01901.38
C90-lvCarbon Steel7358.987.01900.344
Table 3. Detail of Meshing.
Element size61.431
Growth rate1.2
Sizing
Growth rate1.2
Max size122.86 mm
Mesh Defeaturing
Defeature size0.30715
Capture Curvatureyes
Curvature in size0.61431 mm
Curvature normal Angle 18.0 degree
Capture ProximityNo
Bounding box diagonal1228.6 mm
Average surface area57,194 mm2
Minimum edge length92.653 mm
Table 4. Inflation.
Table 4. Inflation.
Inflation OptionSmooth Transition
Transition ratio0.272
Maximum layers5
Growth rate1.2
Inflation algorithmPre
Table 5. The defined parameters in design point.
P1—Mesh
Element Size [mm]
P2—Mesh NodesP3—Mesh ElementsP4—Turbulent
Dissipation Rate [m2/s3]
P5—Erosion Rate (kg/(m−2 s)
NameP1 P2P3P5 P4
DP 061.43114,46912,9569.29 × 10−21.24 × 10⁻⁸
DP 15014,62813,1149.29 × 10−21.24 × 10⁻⁸
DP 24017,36815,7709.29 × 10−21.24 × 10⁻⁸
Table 6. Properties of water, bitumen, and CO2.
Fluid TypeOily Water
(99.97%)
Bitumen
(0.02%)
CO2
(0.01%)
Density (g/ c m 3 )9.56110.151.7878 × 10 3
Specific Heat J/(kg·k)4186.81850840.37
Thermal Conductivity (w/m-k) 0.61600.0145
Viscosity (kg/m s)0.0010032401.37 × 10−5
Fluid Temperature (°C)909090
Table 7. DPM properties of simulation cases.
Velocity and Inert Particles PropertiesCase 1–7Case-8 Case-9
Fluid Velocity (m/s)0.6881.380.344
Fluid Temperature909090
Environment Temperature−10−10−10
Bitumen and CO2 Velocity (m/s)0.6881.380.344
Gauge Pressure (kg f/ m 2 )500010,0002500
Flow rate of water ( m 3 /h)6.7713.573.38
Mass Flow rate of water (99.97%) (kg/s)1.793.60.898
Bitumen Particle Size (mm)2.5 × 10 3 2.5 × 10 3 2.5 × 10 3
Mass Flow rate of Bitumen (0.02%) (kg/s)3.58 × 10 4 7.2 × 10 4 1.796 × 10 4
CO2 Particle Size (mm)3.3 × 10 7 3.3 × 10 7 3.3 × 10 7
Mass Flow rate of CO2 (0.01%) (kg/s)1.79 × 10 4 3.6 × 10 4 8.98 × 10 5
Disclaimer/Publisher’s Note: The statements, opinions and data contained in all publications are solely those of the individual author(s) and contributor(s) and not of MDPI and/or the editor(s). MDPI and/or the editor(s) disclaim responsibility for any injury to people or property resulting from any ideas, methods, instructions or products referred to in the content.