Article

Safety Analysis and Condition Assessment of Corroded Energy Pipelines under Landslide Disasters

1
School of Civil Engineering and Geomatics, Southwest Petroleum University, Chengdu 610500, China
2
School of Petroleum Engineering, Southwest Petroleum University, Chengdu 610500, China
3
School of Mechatronic Engineering, Southwest Petroleum University, Chengdu 610500, China
4
Safety and Security Science Section, Department of Values, Technology and Innovation, Faculty of Technology, Policy and Management, Delft University of Technology, 2628 BX Delft, The Netherlands
*
Author to whom correspondence should be addressed.
Appl. Sci. 2023, 13(23), 12880; https://doi.org/10.3390/app132312880
Submission received: 24 October 2023 / Revised: 27 November 2023 / Accepted: 29 November 2023 / Published: 30 November 2023
(This article belongs to the Special Issue Pipeline Risk Assessment and Risk-Informed Pipeline Maintenance)

Abstract

:
Corrosion poses a significant risk to the safety of energy pipelines, while landslide disasters emerge as the primary threat responsible for triggering pipeline failures across mountainous areas. To date, there is limited research focused on the safety of energy pipelines considering the synergistic effect of corrosion and landslides. The present study proposes a finite element (FE)-based model to assess the condition of corroded pipelines under landslides. The effects of corrosion dimensions (length and depth) and location are determined. A novel equation is finally developed to predict the maximum stress and determine the most disadvantageous position for corroded pipelines under various landslide displacements. The results demonstrate that (1) as the landslide progresses, the pipeline’s stress significantly increases; (2) corrosion depth has a more significant impact on the pipeline condition than the corrosion length, and it is positively correlated with the pipe’s stress; (3) the maximum stress exhibits a nonlinear relationship with the landslide-facing position and the corrosion circumferential location; and (4) when the axial position of the corrosion is more than 6.5 m away from the center of the landslide, the location of maximum stress shifts from the corrosion region to the central section of the pipeline within the landslide. This work contributes to helping pipeline owners to understand the applicability of energy pipelines subjected to the combined effects of corrosion and landslides and provides support for future risk assessment efforts in pipeline integrity management.

1. Introduction

Pipelines are bestowed with a significance akin to a lifeline. With the ever-increasing global energy demand, pipeline construction is poised for a new era of rapid development [1]. As of 2022, China has constructed 15.5 × 10⁴ km of long-distance oil and gas pipelines, and it is projected to reach 24 × 104 km by 2025 [2]. Owing to the complex geographical and climatic conditions in specific regions and considerations regarding project timelines and costs, a substantial number of pipelines will inevitably traverse areas prone to geological disasters. According to historical records, from 2009 to 2019, out of the 130,000 geological disasters in China, landslides accounted for 71% [3]. Pipeline damage caused by landslides is also the most hazardous of all geological disasters. Under the impact of landslides and with the increasing thrust from the soil, pipelines inevitably undergo tensile, compressive, and shear stresses, making them highly prone to deformation and even rupture. Given that some of pipelines have been in service for an extended duration, external and internal corrosion induced by soil and other mediums can significantly undermine the pipeline’s load-bearing capability. This accelerates the likelihood of pipeline fractures and leaks, resulting in incalculable losses related to life, property, and energy [4,5].
Numerous researchers have studied the condition of pipelines under landslide conditions to enhance their protective capabilities. In classifying landslide pipelines, Brodavkin [6] was the first to categorize them based on the angle between the direction that the pipeline is laying in and the landslide direction, differentiating them into transverse landslides, longitudinal landslides, and landslides at specific angles. In the case of transverse and longitudinal landslides, based on the analysis of the ultimate soil resistance [7], Rajani et al. [8] were the first to propose analytical solutions for elastic pipelines in elastoplastic soil under two different landslide scenarios. The variations in factors concerning pipeline landslides, soil–pipe contact, and semi-analytical issues have been further developed in subsequent research [9,10,11,12]. Analytical methods were pioneered early on and served as guiding approaches in initial projects. However, due to the inherent simplifications in each model, there were inevitable accuracy issues in the results. With the advancement of computer technology, numerical simulation methods have become increasingly favored by scholars due to their efficiency and cost-effectiveness [13,14,15,16]. A uniform landslide force load was conventionally employed for simplification, and this approach has gradually transitioned to a force distribution modeled by parabolic curves [17], further evolving into a more realistic fourth-power parabolic curve of the displacement [18]. Building upon the displacement load distribution of the fourth-power parabolic curve, Li et al. [19] investigated the strain distribution in transverse pipelines subjected to tensile and compressive stress caused by landslides. This led to the introduction of a criterion for pipeline failure based on relative stiffness. Beyond analytical and numerical simulation methods, some researchers have conducted extensive studies using full-scale, large-scale, and small-scale indoor experiments by establishing experimental platforms [20,21,22,23,24].
Pipelines in service face potential corrosion risks due to soil environmental changes in their buried locations [25]. Currently, most of the long-distance pipelines in use in China have been operational for over 20 years [26]. As time progresses, the protective coatings of these pipelines have started to deteriorate and peel off, causing the pipeline to be in direct contact with both the conveyed material and the enveloping soil. Consequently, this leads to internal and external corrosion, critically undermining the structural integrity and load-bearing capacity of the pipeline [27]. Numerous studies have been conducted regarding the mechanical behavior of corroded pipelines. These primarily focus on the mechanism of corrosion [28,29,30], the impact of corrosion dimensions on pipelines [31,32,33], and the interference effects under multiple corrosion factors [34,35] based on studies of intact pipelines. However, there is limited research addressing the safety of energy pipelines considering the synergistic effect of corrosion and landslides.
To fill the gaps identified, this study develops a rigorous FE model of corroded pipelines under landslides to analyze the circumferential stress, axial stress, and the location of maximum von Mises stress considering various dimensions and positions of corrosion defects. Parameter effects, including the corrosion size, origin location, and landslide displacement are analyzed to ascertain the mechanical response patterns of the pipeline under landslides. This work helps to assess the condition of long-distance energy pipelines under landslides and make wise risk management decisions.
The remainder of this paper is outlined as follows: Section 2 presents the theoretical foundations of the pipeline across landslides; Section 3 details the implementation of the FE modeling; Section 4 analyzes the influencing factors and the detailed patterns between corrosion and stress; a prediction equation is proposed in Section 5 to determine the maximum stress and the most disadvantageous position of corroded pipelines; and finally, this work concludes in Section 6.

2. Mechanism of Pipeline across Landslides

In past studies on pipeline mechanics across landslides, uniform landslide load and parabolic load distributions have been validated [13,17]. However, there are limitations in fully accounting for the sudden nature of landslides and the entire stress–strain response of pipelines. The fourth-power parabolic curve of displacement [18], due to its robust validation, has been widely used in recent years. As shown in Figure 1, this section proceeds with research based on this theory.
Soil displacement is symmetrical to the Y-axis, calculated as
D x = 2 D c w 1 2 ( x w 1 ) 2 D c w 1 4 ( x w 1 ) 4 , 0 x w 1 D x = 2 D c w 2 2 ( x + w 2 ) 2 D c w 2 4 ( x + w 2 ) 4 , w 2 x 0
where Dx is the soil displacement at position x from the landslide center, m; Dc is the soil displacement at the landslide center, m; w1 and w2 are the distances from the two ends of the landslide to its center, m. Substituting into the pipeline differential equation gives
E I d 4 γ 1 d x 4 T d 2 γ 1 d x 2 + k 1 γ 1 = k 1 ( 2 D c x 1 2 ( x w 1 ) 2 D c x 1 4 x w 1 ) 4
q x = k 1 γ 1 D x
Solving the equation yields
γ 1 x = e a 1 x c 1 cos β 1 x + c 2 sin β 1 x + c 3 cos β 1 x + c 4 sin β 1 x e a 1 x D c w 1 [ ( x w 1 ) 4 24 E I k 1 + 12 T k 1 ( x w 1 ) 2 + 24 T 2 k 1 2
where a 1 = k 1 / 4 E I + T / 4 E I and β 1 = k 1 / 4 E I T / 4 E I , and given that T 2 k 1 E I , E is the modulus of elasticity, N/m2; I is the moment of inertia, m4; γ1 is the deflection at position x from the landslide center, m; q(x) is the lateral soil pressure at that position, KN; and T is the axial tension, KN. Similarly for non-landslide affected pipelines, the solution is
E I d 4 γ 2 d x 4 + k 2 γ 2 = 0
q x = k 2 γ 2
γ 2 x = e λ x c 5 c o s λ x + c 6 s i n λ x
where λ = k 2 / 4 E I 4 , and constants c1c6 can be determined using boundary conditions.

3. Numerical Modeling

When the natural gas transported in the pipeline contains impurities such as water vapor, CO2, and H2S, under specific conditions, water vapor may condense into a liquid state. Impurity gases can dissolve in the liquid water, leading to the corrosion of the inner wall of the pipeline [26,27,33,34].
This study primarily addresses the internal corrosion of long-distance pipelines caused by impurity gases. The modelled corrosion defect was assumed to be rectangular as it a common assumption for pipeline corrosion [27,36,37]. The soil–pipeline interaction in a landslide context is intricate and nonlinear. All modeling tasks are executed using the ABAQUS software, and this work is based on the following assumptions:
  • Both the soil and the pipeline are composed of uniform materials.
  • The soil thickness in the landslide area is consistent, with cracks penetrating the landslide wall.
  • The soil displacement in the landslide area follows a fourth-power parabolic distribution.
  • Temperature effects on pipeline stress are neglected.
  • Landslide displacement is applied from the rear of the model.
  • The corrosion defects are considered as regular metal losses with uniform depth.
To better simulate the mechanical response of pipelines under landslides, field investigations were conducted. The landslide depth was determined to be 3 m, with 3 m of soil beneath the landslide area and a width of 25 m for the landslide zone. Based on study [38], the impact of rear soil on the pipeline stress becomes negligible when its length exceeds 5D. Therefore, a starting rear soil length of 6 m is used. The pipeline has a burial depth of 1 m, an internal pressure of 10 MPa, a non-landslide soil width of 25 m, and an initial crack located at 3 m. The detailed properties of the pipeline and soil are presented in Table 1 and Table 2. The soil’s constitutive model utilizes the Coulomb–Mohr model [19], while the pipeline material is based on stress–strain data from relevant research [39]. To ensure nonlinear contact between the pipeline and soil, a face-to-face contact approach is adopted [40], a hard contact is used in the normal direction, while a penalty method is applied in the tangential direction, and the friction coefficient between the soil and the pipeline can be set at 0.4. The bottom of the model is fixed, and except for the landslide area, vertical surface constraints are applied to the four sides of the model. The initial mesh has four layers aligned with the pipeline thickness, with two layers designated for defects in corroded regions and another two for non-defective areas. Figure 2 depicts the on-site conditions, model details, and mesh layout.

4. Results and Discussion

Studies on corrosion in pipelines indicates a negligible effect of corrosion width on stress and strain responses [31,34,35]. Hence, this study omits the subtle impacts of width. Leveraging the fourth strength theory [40,41], the emphasis lies on evaluating the stress distribution of the maximum, axial, and circumferential equivalent stresses of the pipeline, accounting for variables such as the defect depth, length, landslide displacement, and both the circumferential and axial positions.

4.1. Model Validation

The model validation is divided into three parts: model size validation, mesh validation for landslide models without pipeline corrosion, and mesh validation for landslide models with pipeline corrosion.
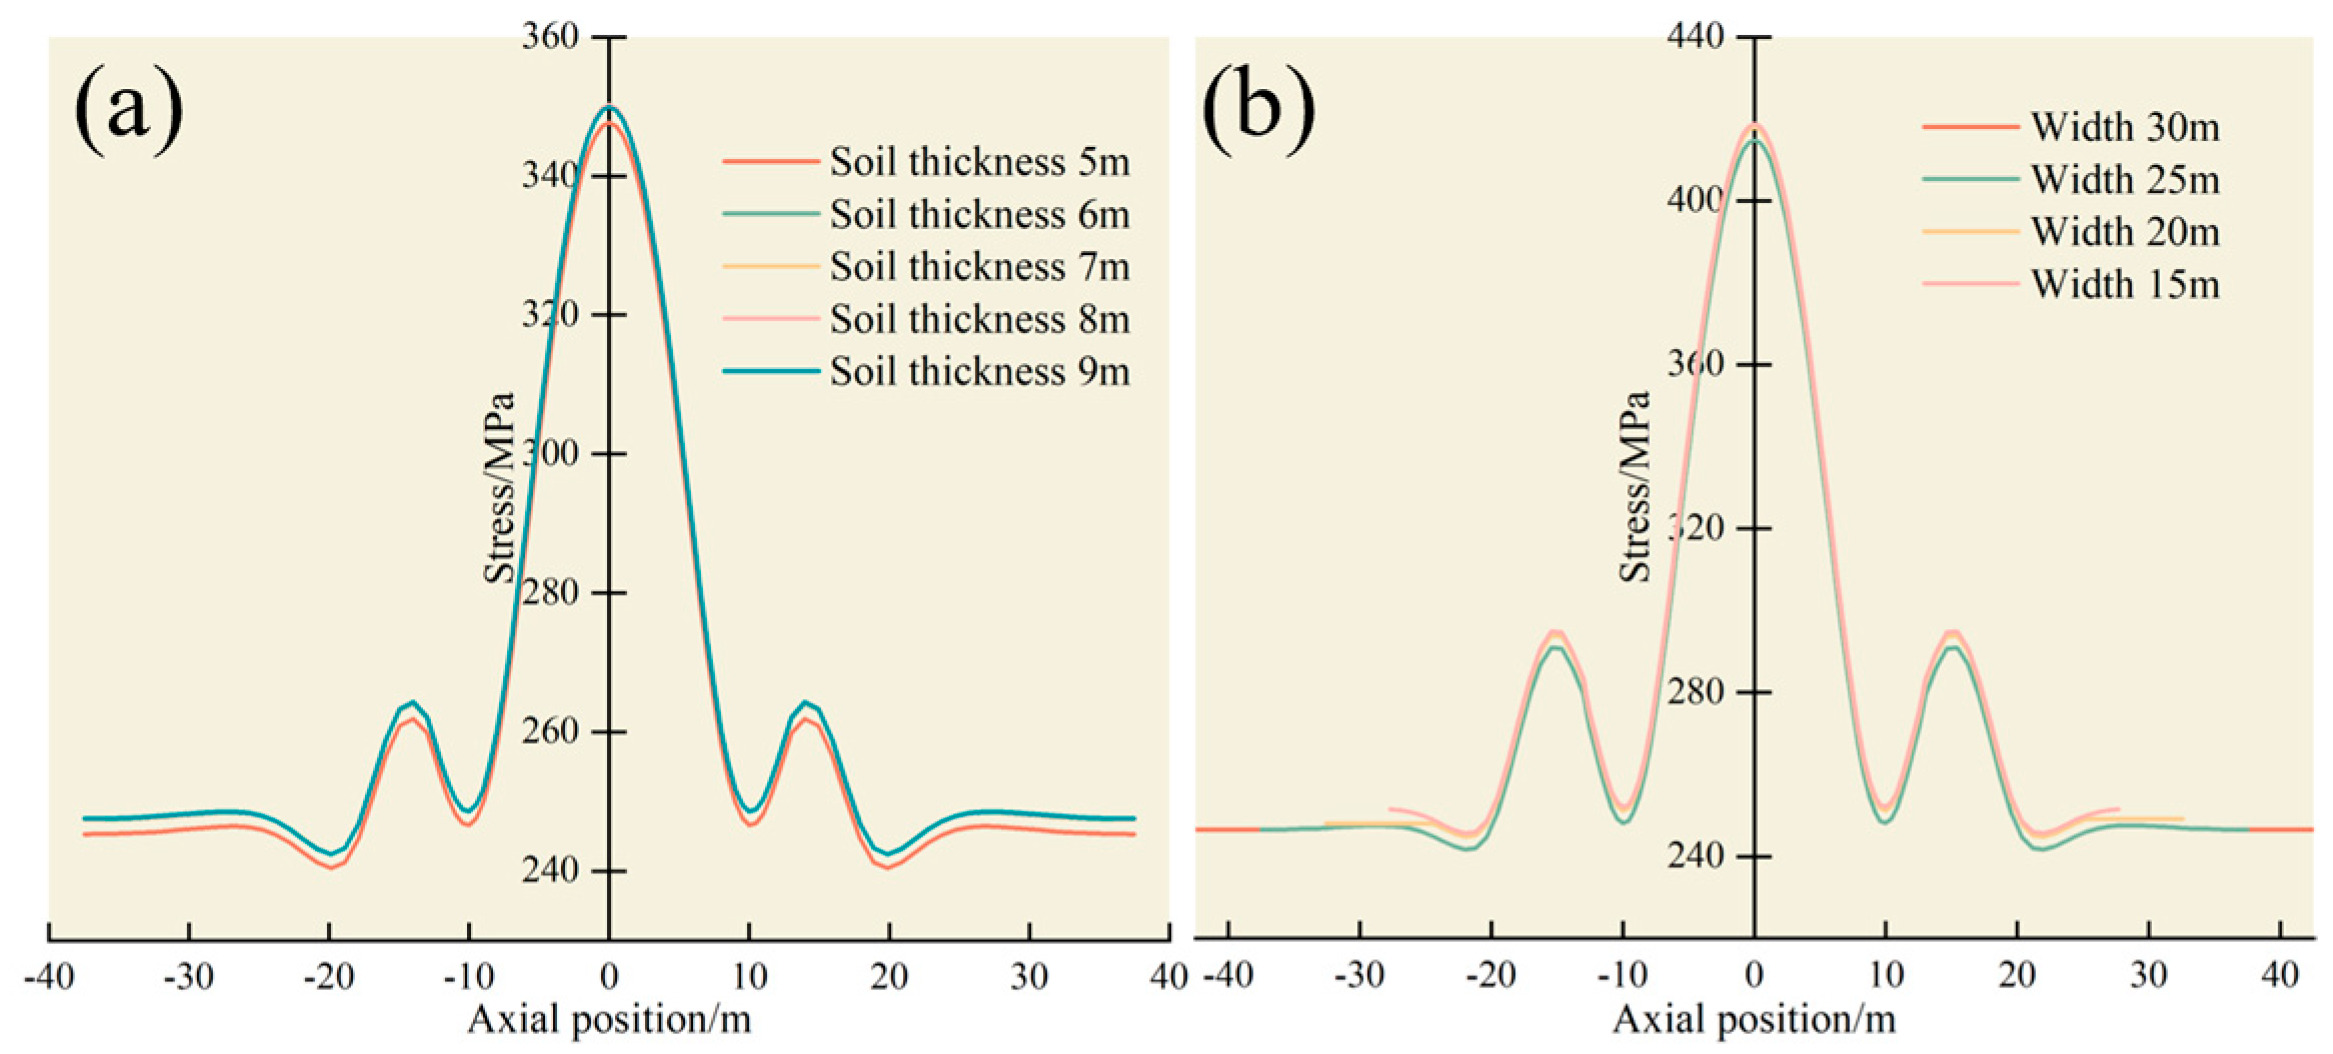
In the landslide region with a soil thickness of 3 m, a thickness impact analysis was performed to minimize potential computational biases. The axial equivalent stress distribution at the central area of the pipeline exposed to sliding is depicted in Figure 3a. To assess the influence of the non-landslide width on the distribution of equivalent stress in the pipeline, models with a non-landslide region width ranging from 15 to 30 m were established, and the axial stress distribution is illustrated in Figure 3b. The soil thickness shows minimal deviation between 5 m and 6 m. In other cases, the stress distribution and values of the pipeline are nearly identical, suggesting that a model with a thickness of 6 m can be used for subsequent research. For a non-landslide width of 15 m, the edge equivalent stress of the pipeline is notably high, attributed to the stress not being fully accounted for and not yet stabilized. At 20 m, the stress nears stability but varies from those observed at 25 m and 30 m. With almost identical stress distributions at 25 m and 30 m, selecting a 25 m width for the non-landslide area optimizes both the precision and computational efficiency.
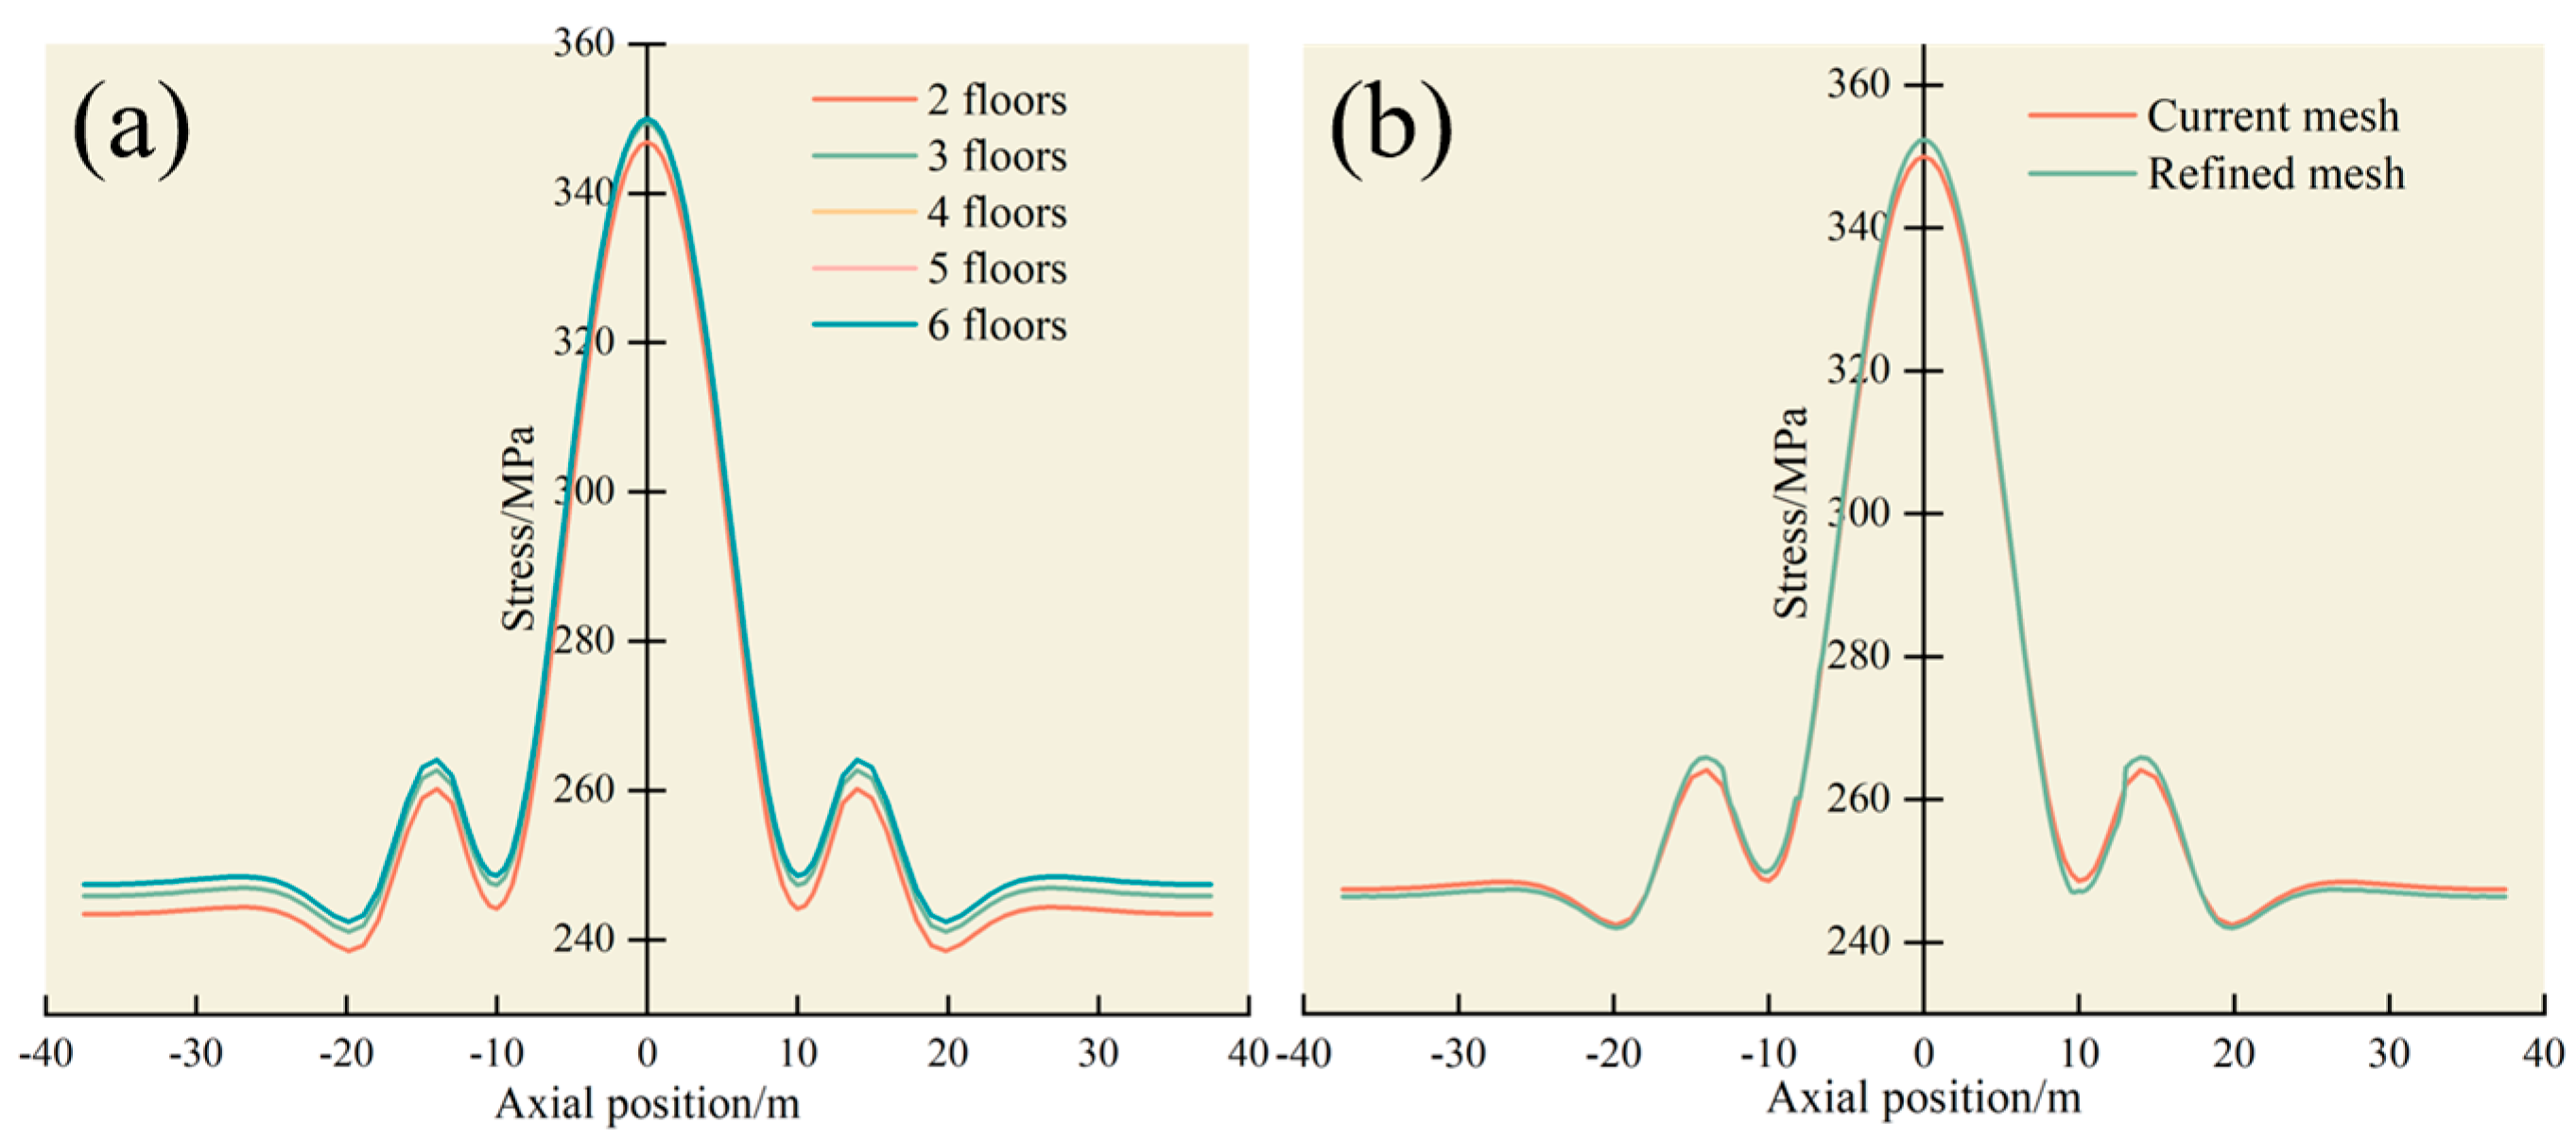
Mesh quality in the model directly impacts the accuracy of computational results. With the pipeline wall subjected to internal pressure, the number of layers in the thickness direction can influence the stress transmission within the pipeline. The wall thickness was meshed with 2–6 layers, and the axial stress distribution of the pipeline under various conditions is illustrated in Figure 4a. For the entire landslide–pipeline model, a 0.5 m mesh size was applied in the landslide area and a 0.75 m mesh size in the non-landslide area. Doubling the overall refinement serves as the refined model, with comparisons between the two shown in Figure 4b. The analysis reveals that while the stress distribution is consistent across layer counts, a distinct variance emerges between two and four layers, the stress patterns for three and four layers align closely, and the curves for five and six layers virtually match the four-layer curve. Hence, a four-layer mesh in the thickness direction is optimal. Additionally, the high overlap between the current and refined mesh stresses confirms the current mesh’s robustness.
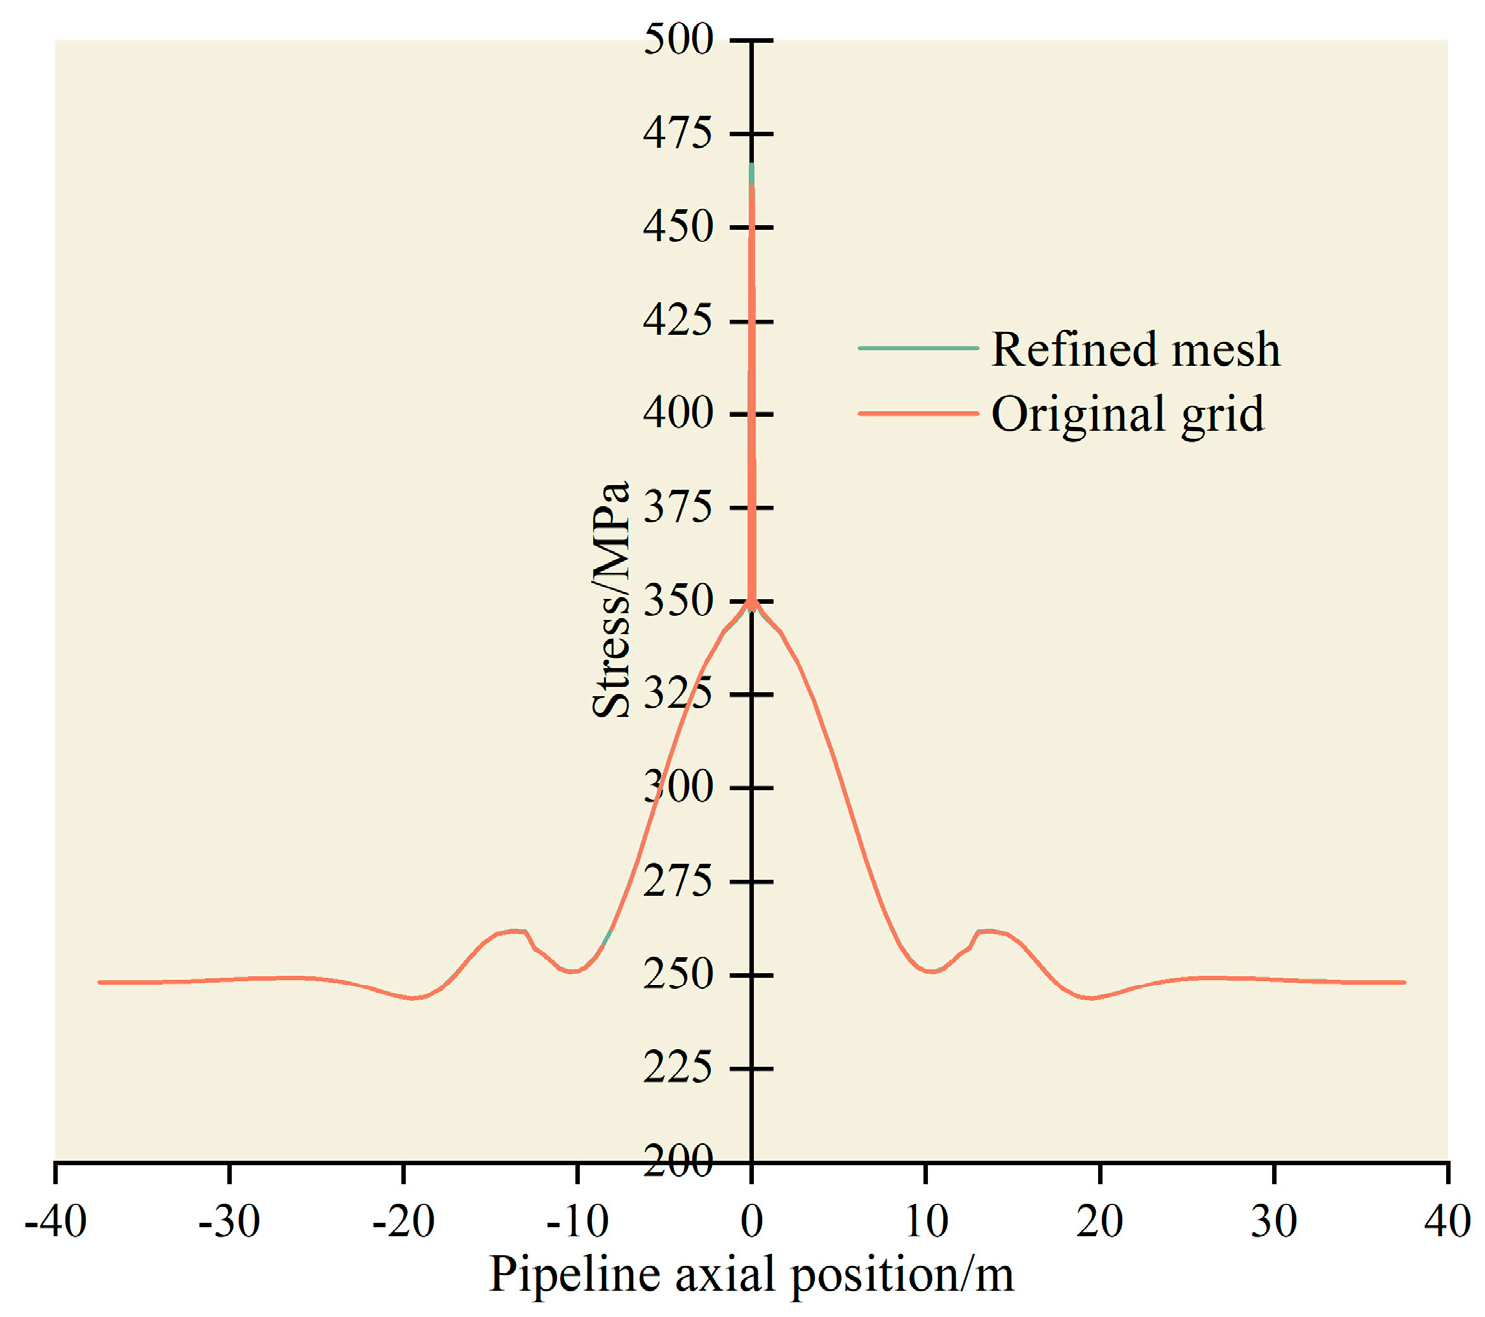
For the mesh sensitivity analysis, a corrosion defect of 20 cm in length, 0.25t in depth, and 6° in width is considered. The defect is positioned at the midpoint in the axial direction of the pipeline and on the inner wall facing the landslide. The mesh layers in the pipeline thickness direction are set as two layers for the defect area and two layers for the non-defect area, totaling four layers in the thickness direction. The corrosion zone is meshed at intervals of 0.01 m in length and 0.5° in width, and based on this, the mesh refinement of the corrosion with the rest of the model dimensions follow the previous specifications. The axial equivalent stress at the pipeline defect is illustrated in Figure 5. The stress distribution curves largely overlap, with a mere 0.4 MPa difference at the central defect, indicating that the mesh precision for the defect meets the requirements. Hence, the corrosion length and width can be segmented at 0.01 m and 0.5°, respectively.

4.2. Effect of Corrosion Dimension

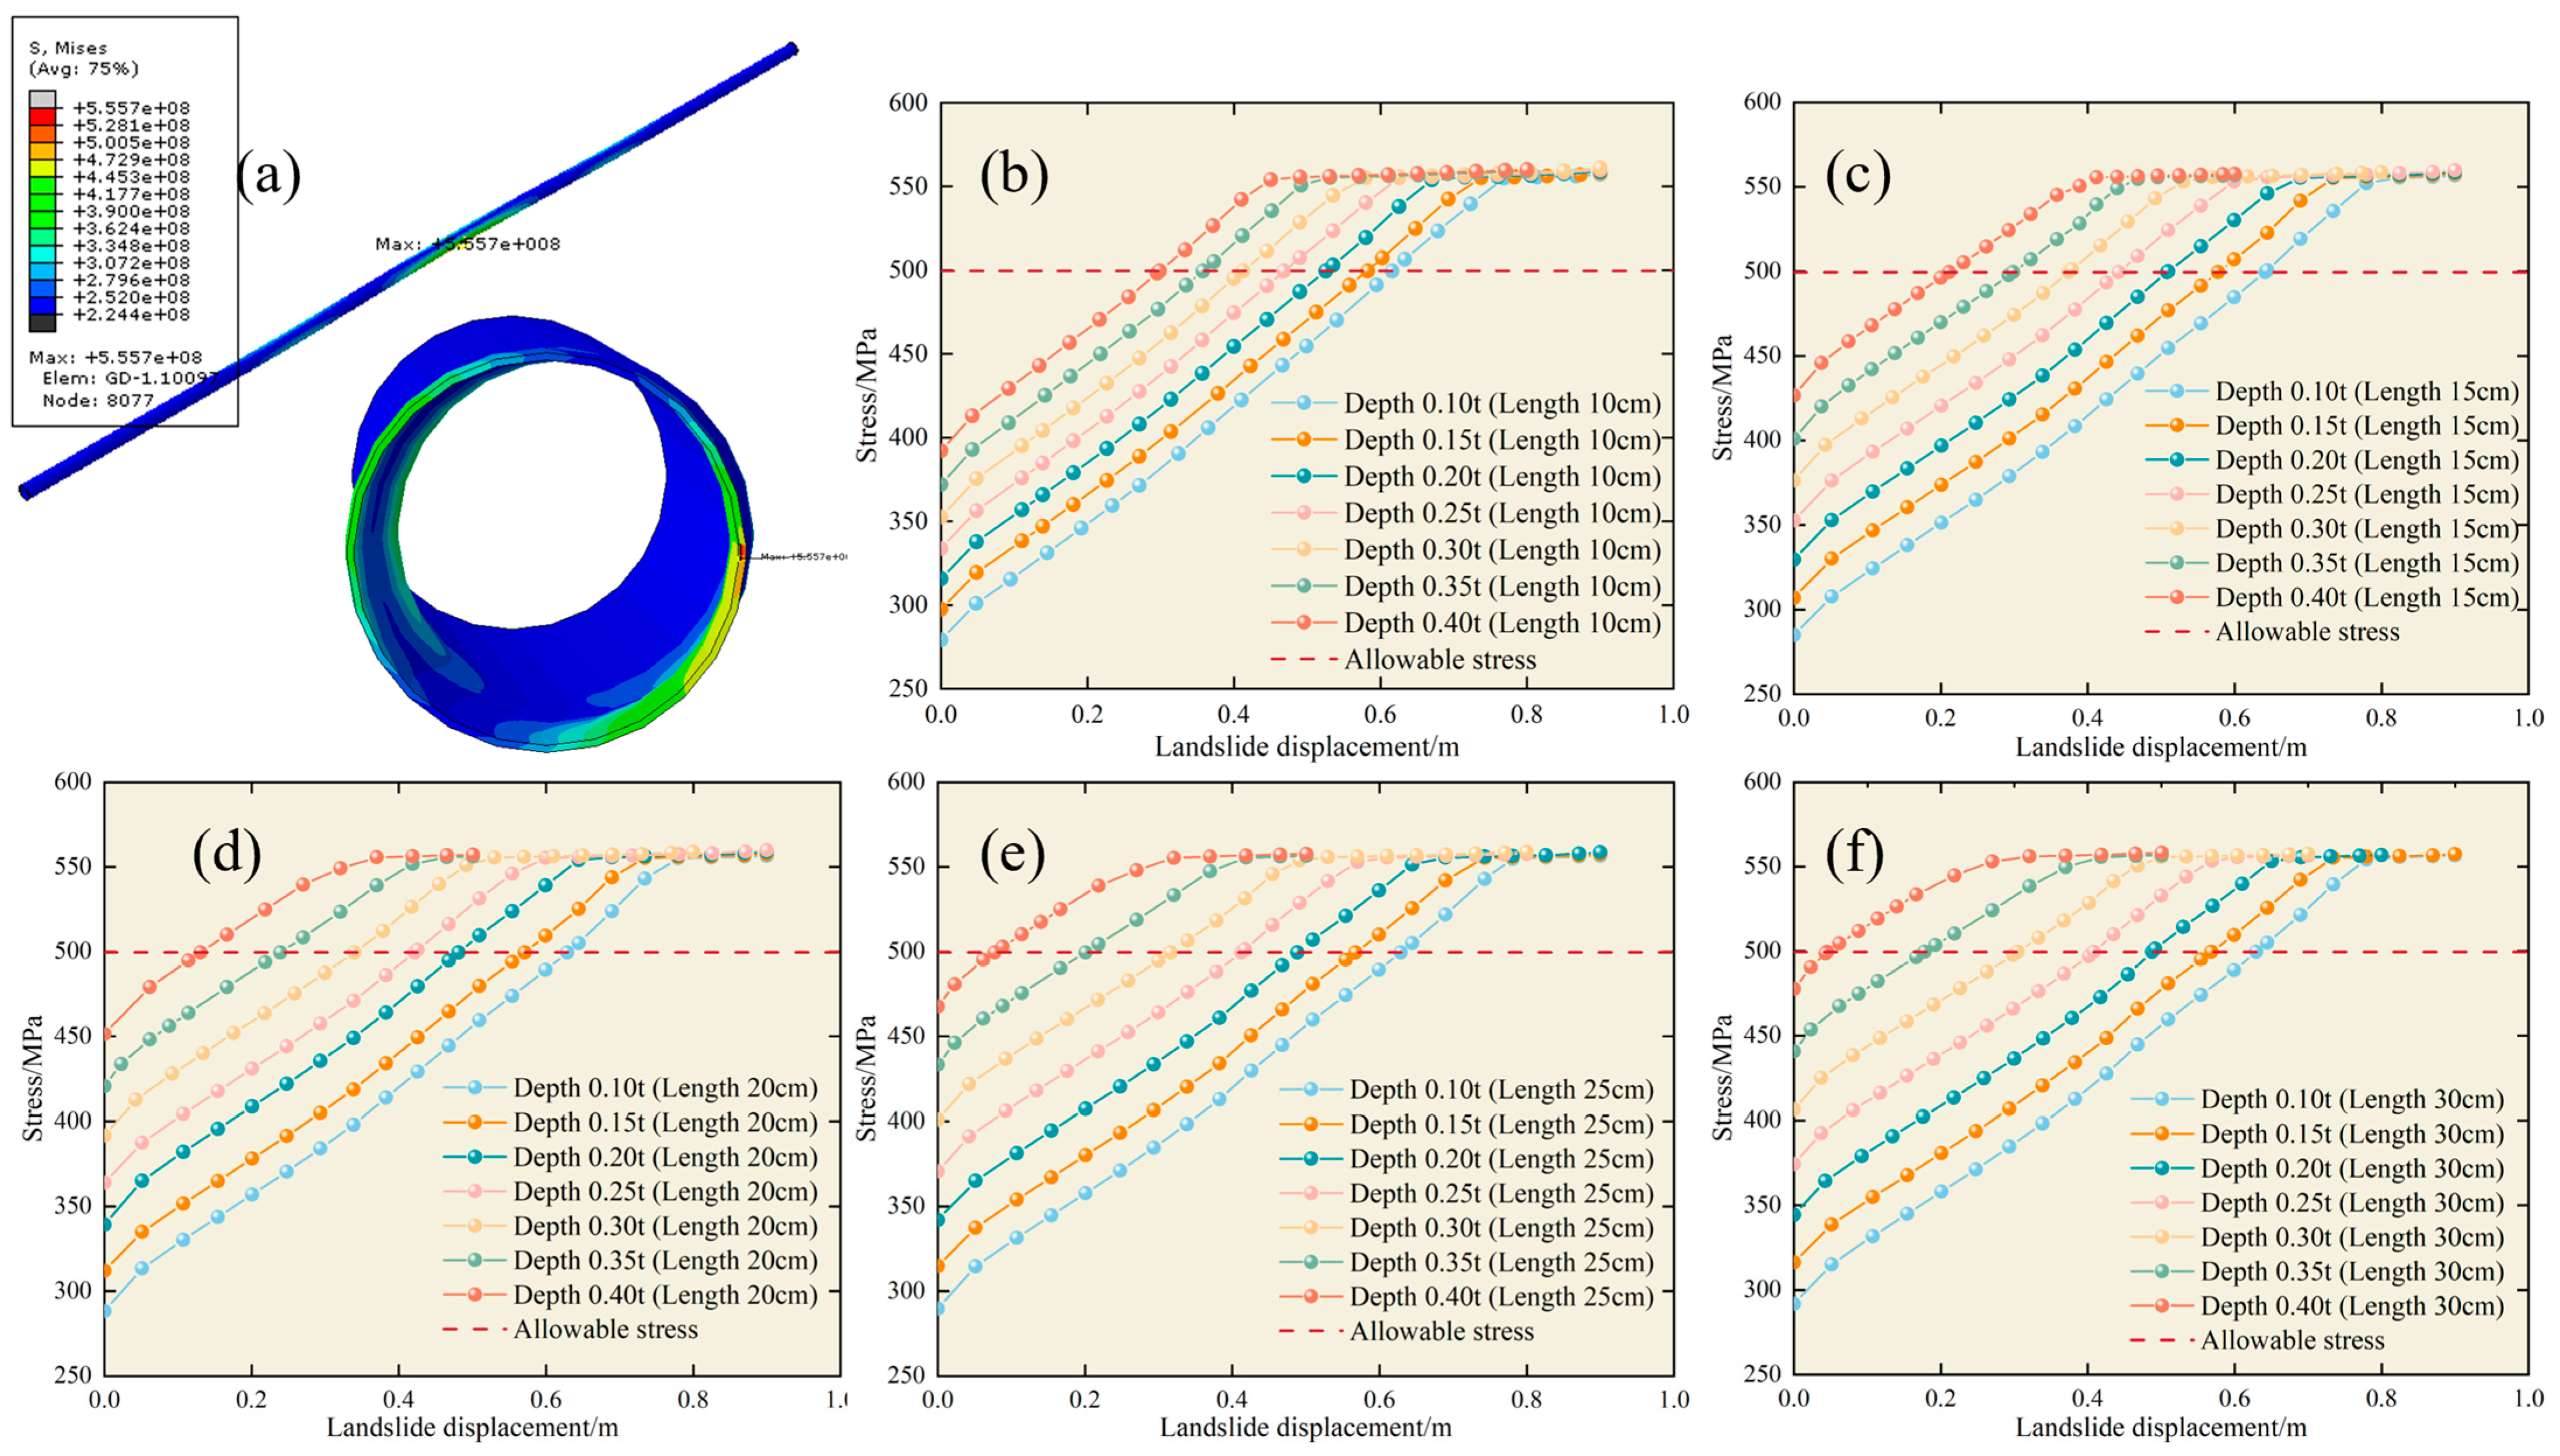
The corrosion defect is located on the pipeline side facing the landslide. Corrosion depths from 0.10t to 0.40t and lengths between 10 cm and 30 cm are considered. This study investigates the influence of the corrosion depth on equivalent stress variations for different defect lengths across displacements ranging from 0 m to 1 m. Figure 6a reveals a stress concentration at the location of the corrosion defect generating the maximum equivalent stress. A distinctive zone of stress fluctuation is evident in the central region facing the slide, while both the edge and central part on the opposite side of the pipeline to the slide also show distinct stress zones. Three salient phenomena emerge based on the findings from Figure 6b–f:
  • Given a constant corrosion length and depth, with increasing landslide displacement, the maximum equivalent stress in the pipeline notably rises, stabilizing close to the yield stress of 555 MPa.
  • Given a constant corrosion length and landslide displacement, an increase in the corrosion depth significantly elevates the maximum equivalent stress in the pipeline.
  • Given a constant corrosion depth and landslide displacement, the corrosion length positively correlates with the maximum equivalent stress in the pipeline, albeit the correlation magnitude is not pronounced.
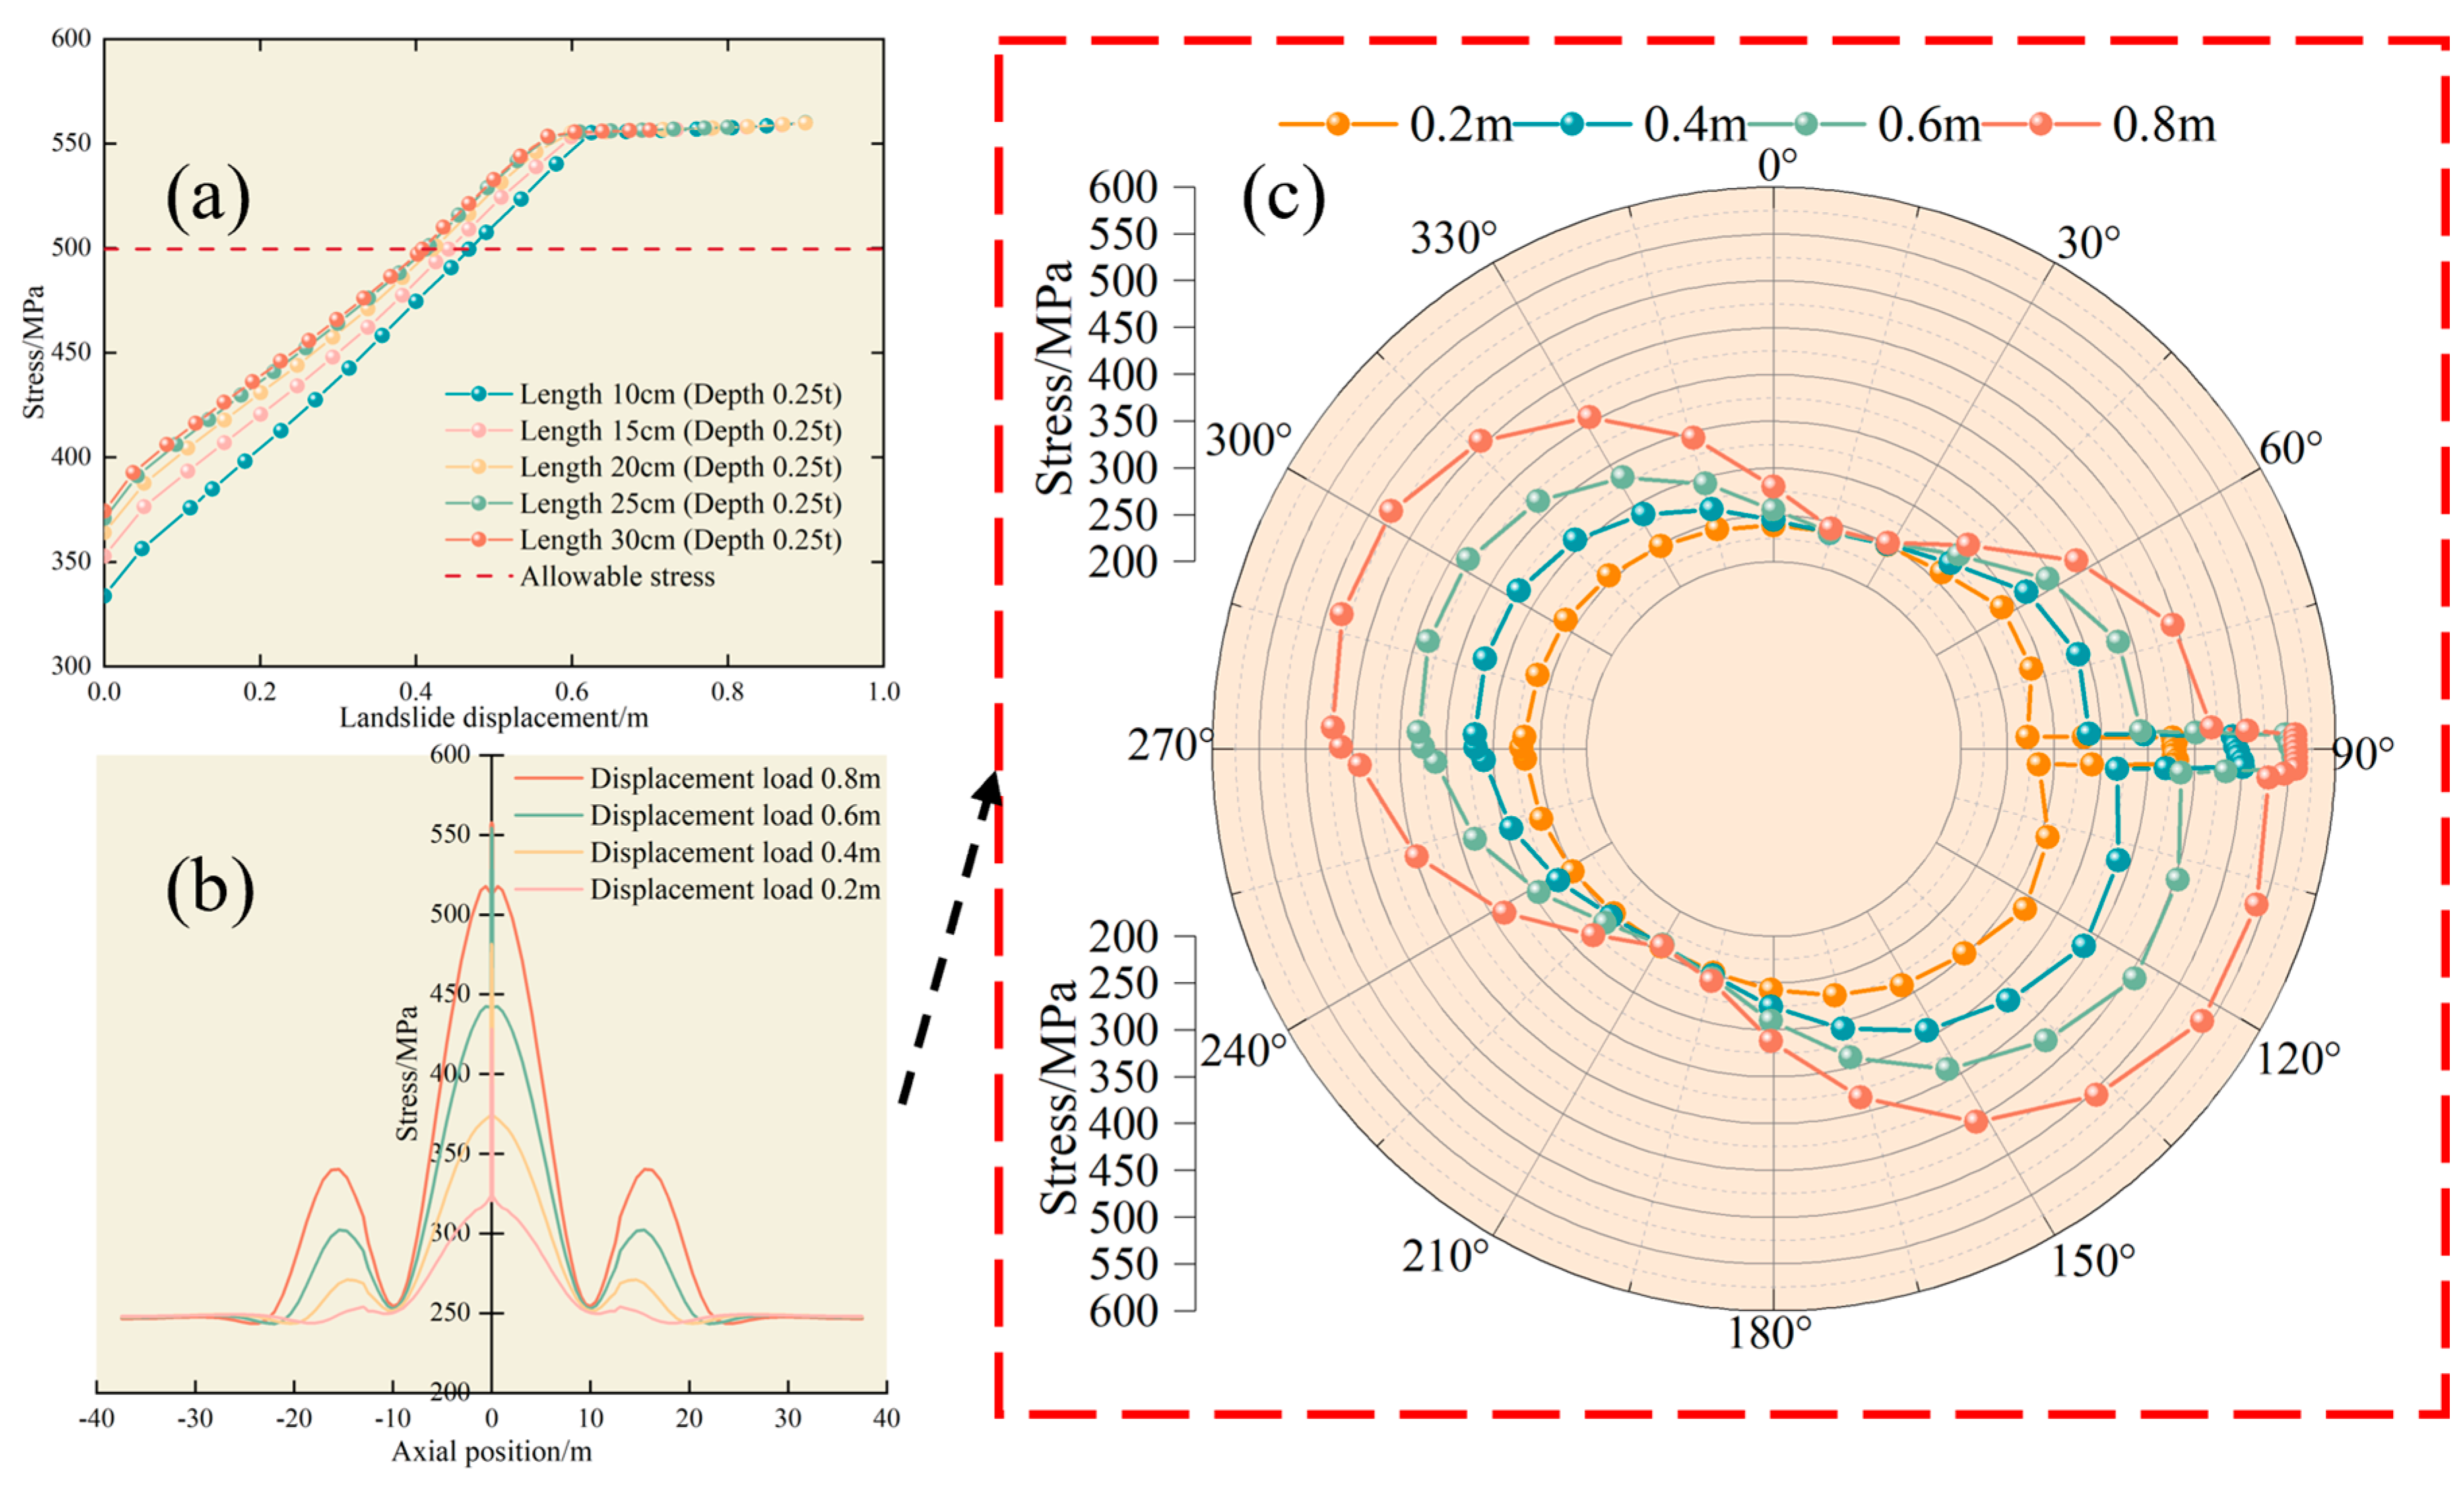
Figure 7 illustrates the stress distributions in the pipeline affected by varying corrosion lengths and landslide displacements with a set corrosion depth of 0.25t. As shown in Figure 7a, the corrosion length has a limited impact on the maximum equivalent stress of the pipeline. The stress variation curves closely overlap when the corrosion length exceeds 20 cm. When the corrosion length is short, its weakening effect on the pipeline is also limited as the length increases, resulting in a larger corroded area, which ironically affects the stress concentration, leading to a slower trend in the stress increase. Using an allowable stress of 499 MPa as the pipeline failure criterion, with a corrosion depth of 0.25t, the limit landslide displacements corresponding to corrosion lengths ranging from 10 cm to 30 cm are 0.47 m, 0.44 m, 0.42 m, 0.41 m, and 0.40 m.
For a corrosion length of 20 cm in the axial and circumferential analyses of the pipeline, Figure 7b shows the midpart of the pipeline as the most susceptible location under the landslide effect. As the landslide displacement increases, the difference in the equivalent stress between the central section and its adjacent areas diminishes. This trend can be attributed to the reduced impact of displacement once the corroded part of the pipeline achieves its yield stress, while the stress in the non-corroded sections continues to rise. As the shear action from the landslide edge on the pipeline intensifies, the equivalent stress at the edge increases from 252 MPa to 340 MPa. The axial distribution of pipeline stress transitions from an initial single peak to a tri-peak configuration, and the stress area near the edge peak value continually expands. This pattern is consistent with observations under non-corroded conditions.
As shown in Figure 7c, based on the circumferential distribution, stress concentration occurs only at the corrosion site. It exceeds equivalent stresses in other circumferential locations of the pipeline when the displacement load is minimal. As the displacement load increases, stresses in both the slide-facing and slide-backing areas of the pipeline rise. However, the distribution does not display symmetrical patterns either horizontally or vertically. The maximum equivalent stress in the slide-facing region is located at the corrosion site at 90°, while the highest equivalent stress in the slide-backing area is positioned at 300°. Between 15° and 90°, the pipeline stress increases. A sudden increase in stress is evident at the corrosion point, followed by a decline with the circumferential angle. It then reaches another peak at 120°, highlighting the significance of the landslide movement direction for the circumferential pipeline contact. With increasing displacement, the difference in the equivalent stress between the pipeline face directly exposed to the slide and the stress concentration at the defect is continuously decreasing. It is anticipated that as the displacement reaches a certain level, the stress at the 120° front-facing slide surface will surpass that of the defect, making it the first area to yield.
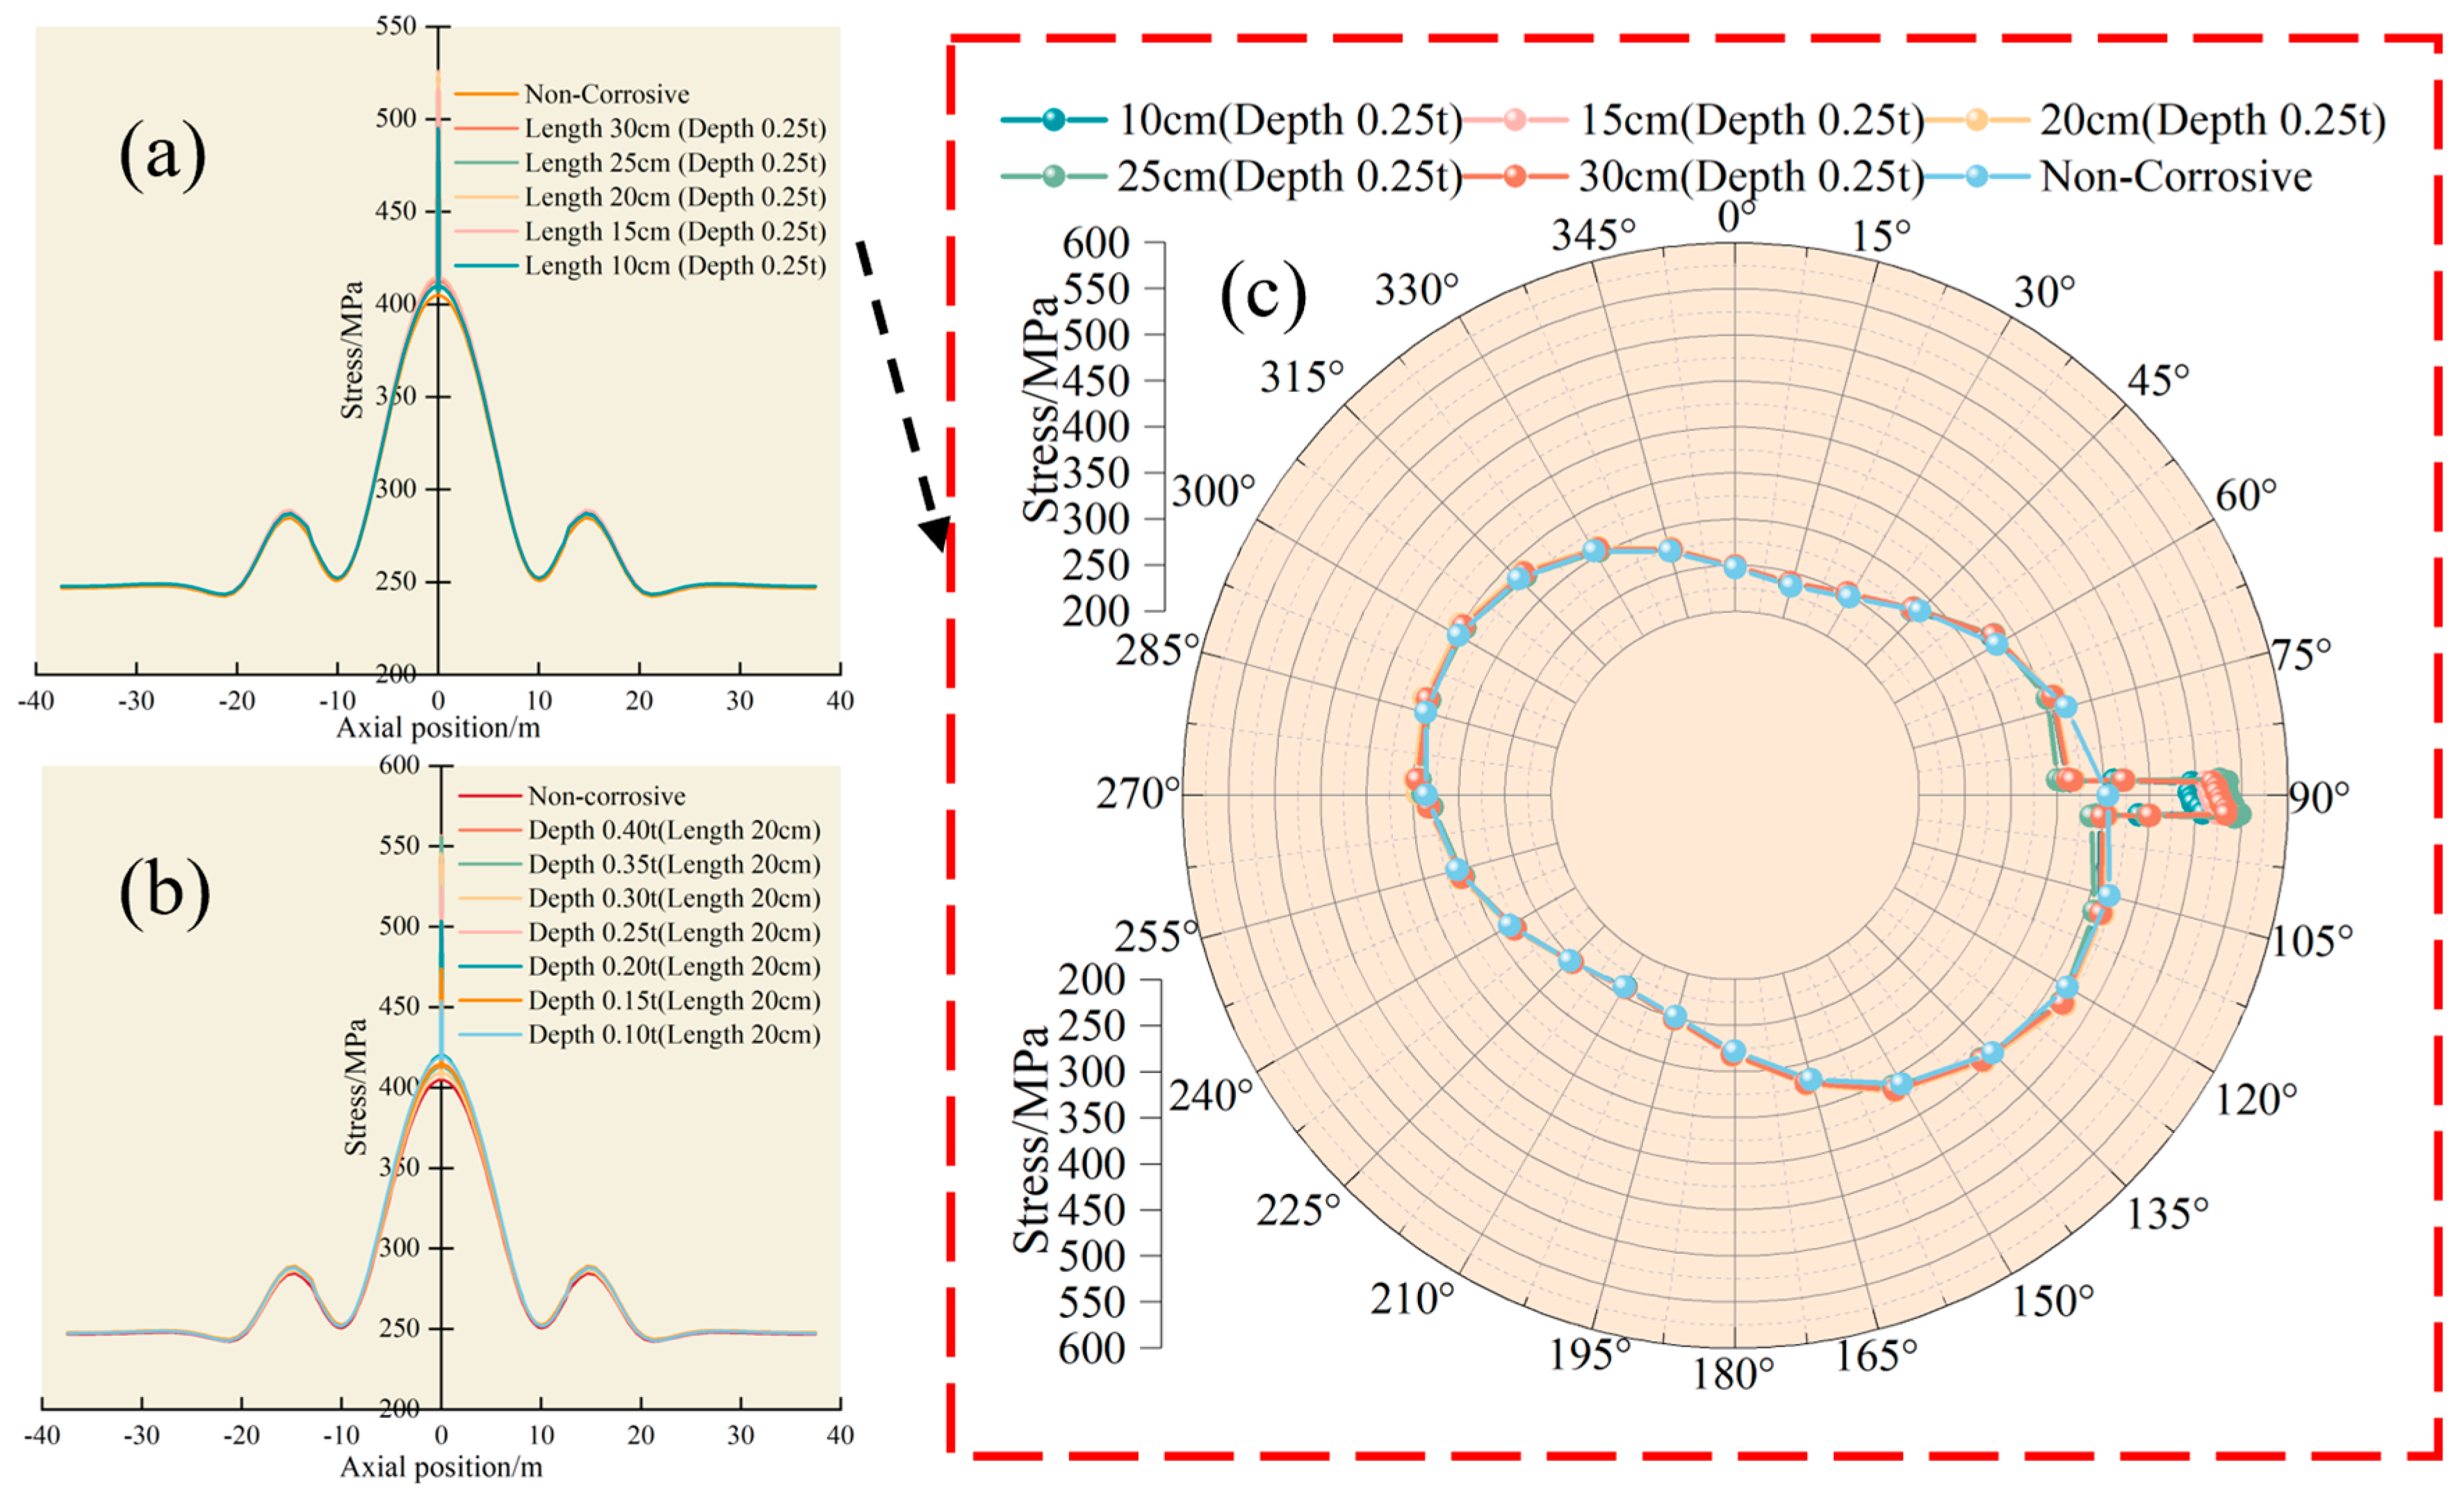
To comprehensively assess the influence of the corrosion length and depth on the axial and circumferential pipeline stress, the stress distribution is studied for a displacement load of 0.5 m, as shown in Figure 8. As the corrosion length and depth increase, the equivalent stresses for different lengths are 495 MPa, 507 MPa, 516 MPa, 522 MPa, and 526 MPa, and the maximum equivalent stresses or different depths are 453 MPa, 474 MPa, 503 MPa, 516 MPa, 545 MPa, 555 MPa, and 556 MPa. Notably, the increment is relatively modest, and the stress levels at other axial positions remain roughly consistent. As shown in Figure 8c, it is evident that at a depth of 0.25t, circumferential stress curves for various lengths essentially overlap, except at the corrosion site. It is clear that stress concentration in the pipeline only occurs at the corrosion site when compared with the circumferential distribution for non-corroded pipelines. In the corresponding area of the non-corroded pipeline, the stress is much lower, while stress levels in other regions are nearly identical. This suggests that, given a certain landslide displacement, the variation in the corrosion size has a negligible impact on the stress distribution of the pipeline outside the corroded region.
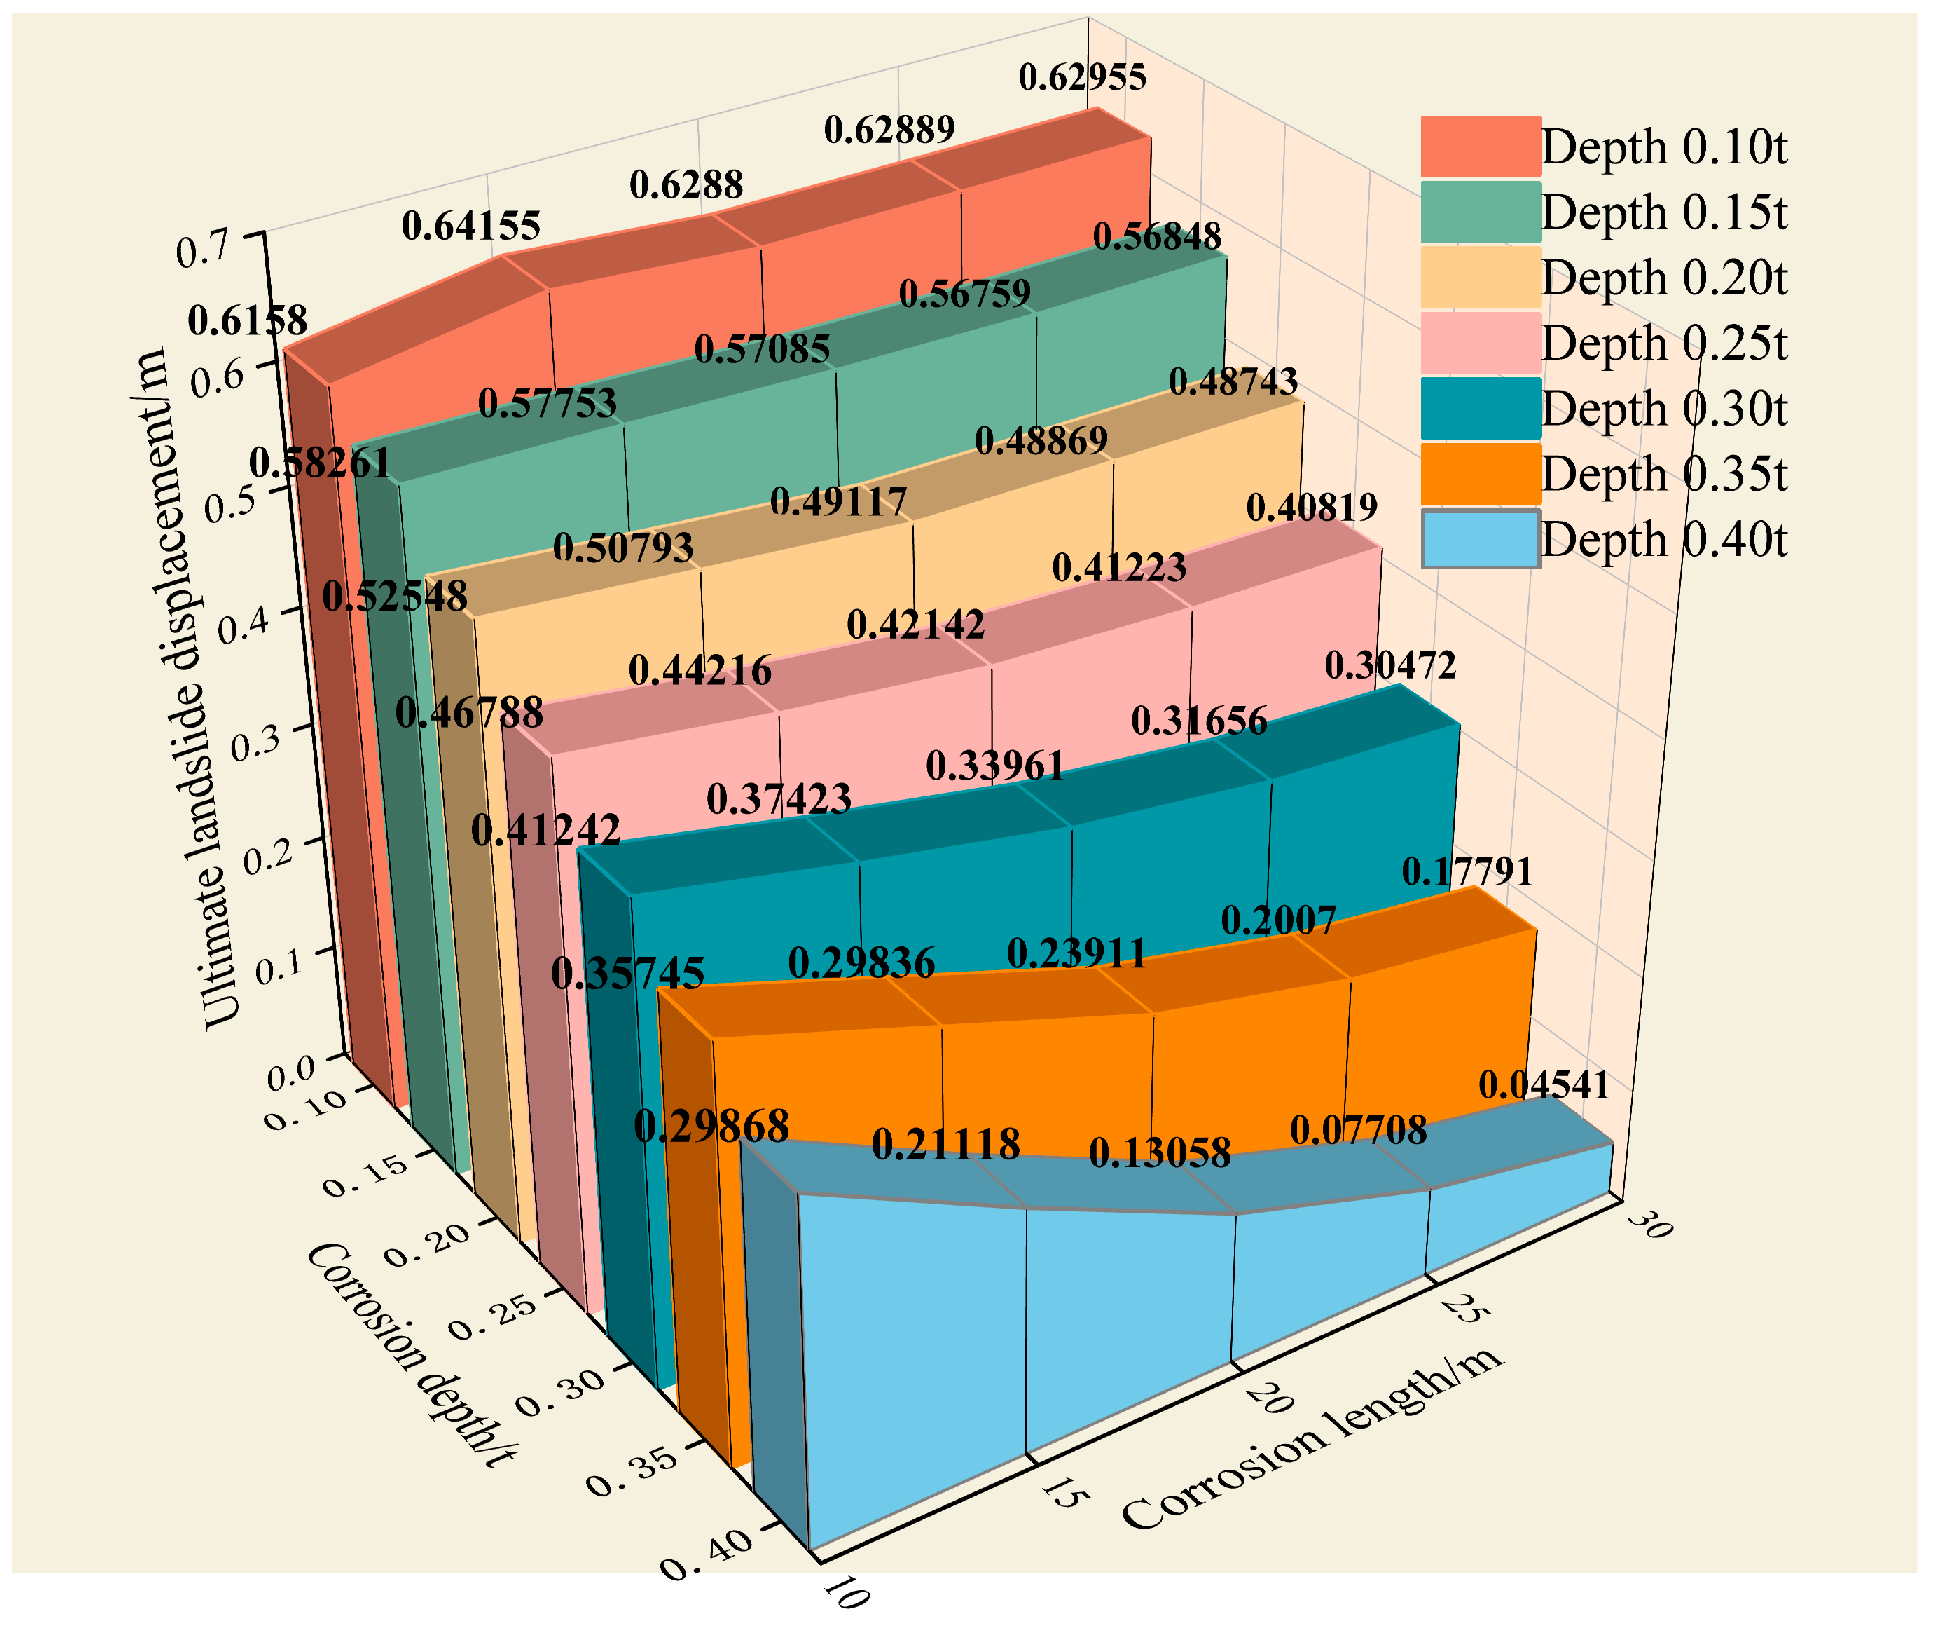
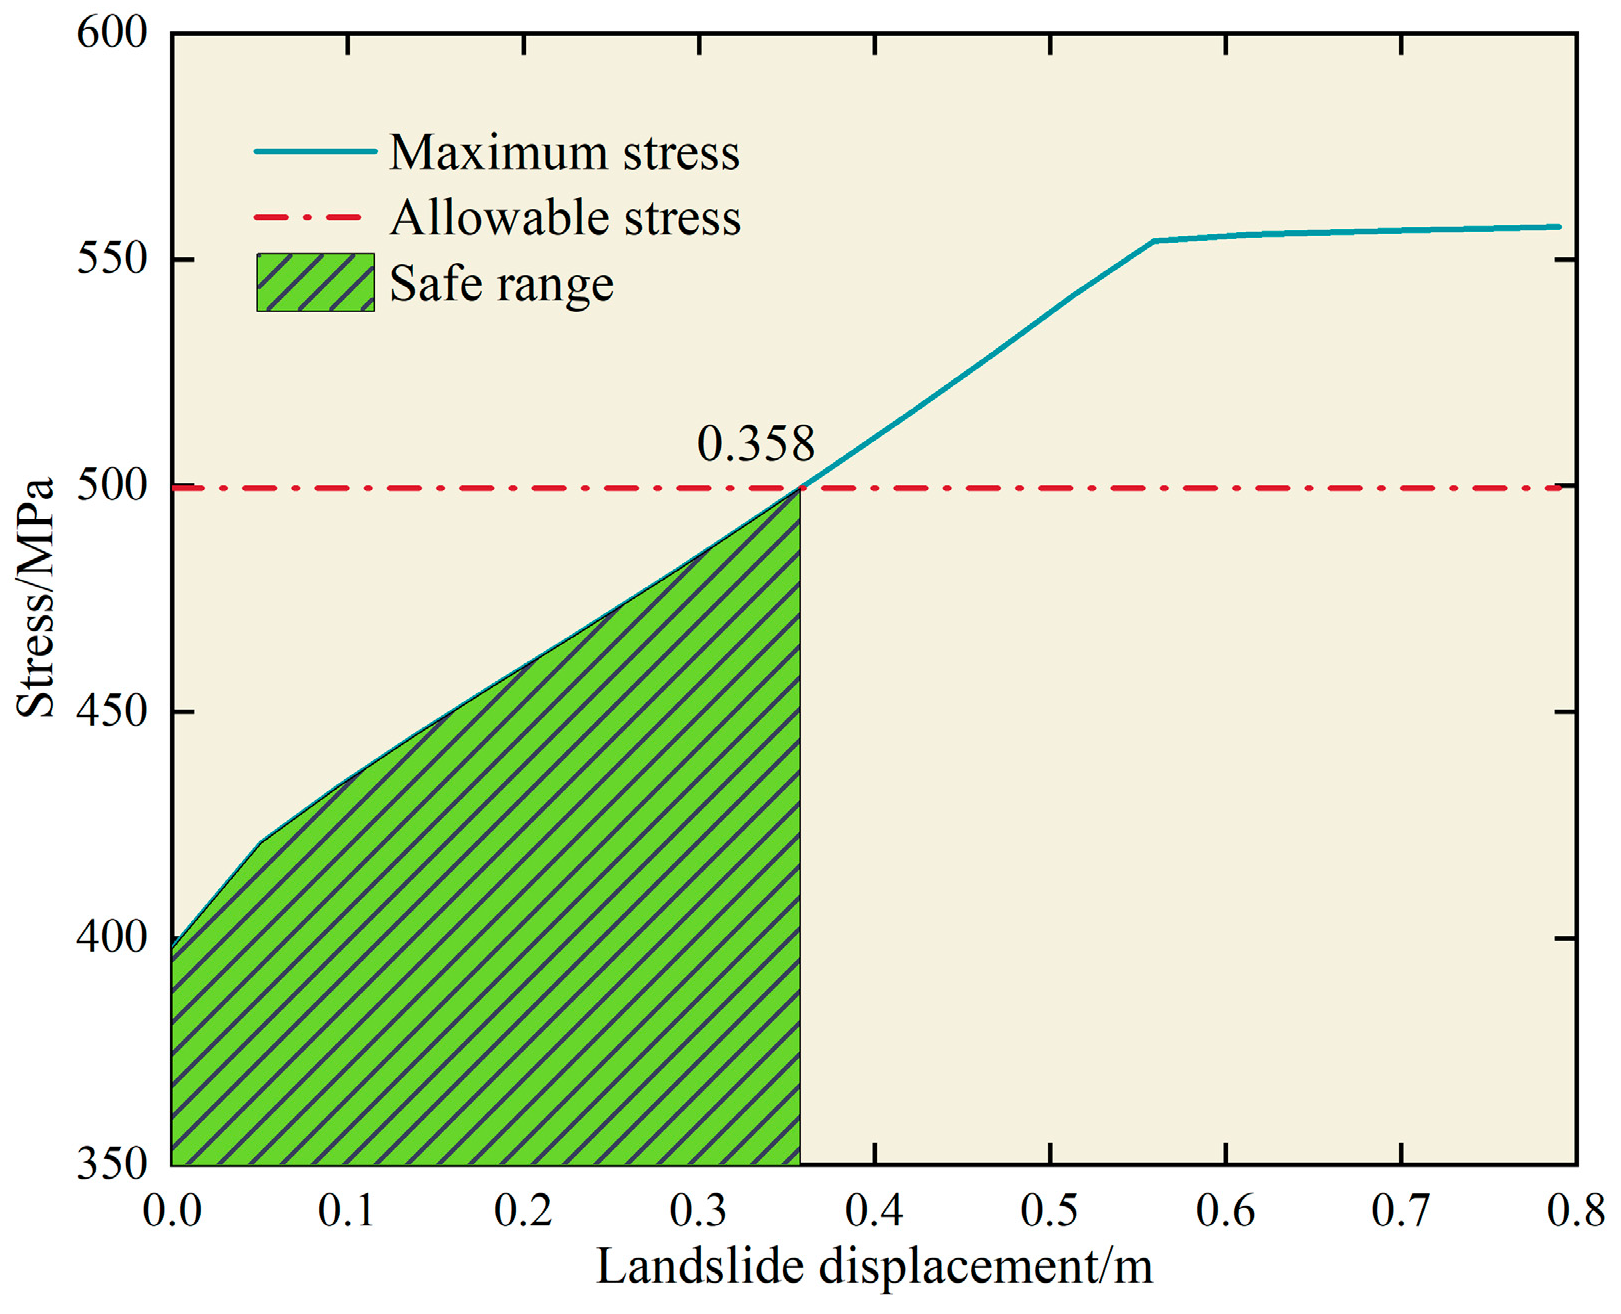
Define the limit displacement under landslide conditions as the displacement when reaching the allowable stress of the pipeline, and the extracted limit displacements for various corrosion dimensions are shown in Figure 9. At depths ranging from 0.15t to 0.40t, it is evident that the limit landslide displacement decreases with the increase in the corrosion length. The maximum reduction rates in the limit displacement are 2.57%, 7.80%, 14.71%, 35.08%, 50.14%, and 84.95%, respectively, indicating that the rate of reduction grows with the increase in the corrosion depth. Interestingly, at a depth of 0.1t, the landslide limit displacement for a corrosion length of 15 cm is 0.64 m, which is greater than the 0.62 m displacement for a 10 cm corrosion length. This contrasts with the previously observed pattern. In reality, at a depth of 0.1t with a corrosion length of 10 cm, the pipeline experiences stress concentration. The enlarged corroded area reduces the stress concentration when this length increases to 15 cm, resulting in a decrease in the maximum equivalent stress of the pipeline, which leads to an increase in the limit displacement. The corrosion depth significantly affects the limited landslide displacement. In practical scenarios, it is vital to monitor the pipeline corrosion depth and assess the pipeline mechanical status according to the surface landslide displacement, ensuring the operational safety of pipelines.

4.3. Effect of Corrosion Location

To study the impact of different circumferential positions, the top of the pipeline is set at 0° with an angle interval of 30°. Using a corrosion depth of 0.25t and a length of 20 cm, a circumferential corrosion model is constructed in the middle of the landslide area. The equivalent stress is extracted for the landslide displacement of 0.8 m, as shown in Figure 10. For corrosion positioned at angles of 90°, 120°, 150°, 270°, and 300°, the maximum equivalent stress is observed at the corrosion site. In contrast, when the corrosion is at other circumferential angles, the maximum equivalent stress manifests near the sliding face, specifically within the range of 105° to 120°. Under this displacement, the pipeline with corrosion at all positions except for at 300° exceeds the allowable stress of 499 MPa and fails. Notably, the stress in the pipeline corroded at 90°, 120°, and 150° surpasses the yield stress of 555 MPa, indicating a yield state. Even the pipeline with corrosion at 300° is on the verge of failure and should not be overlooked.
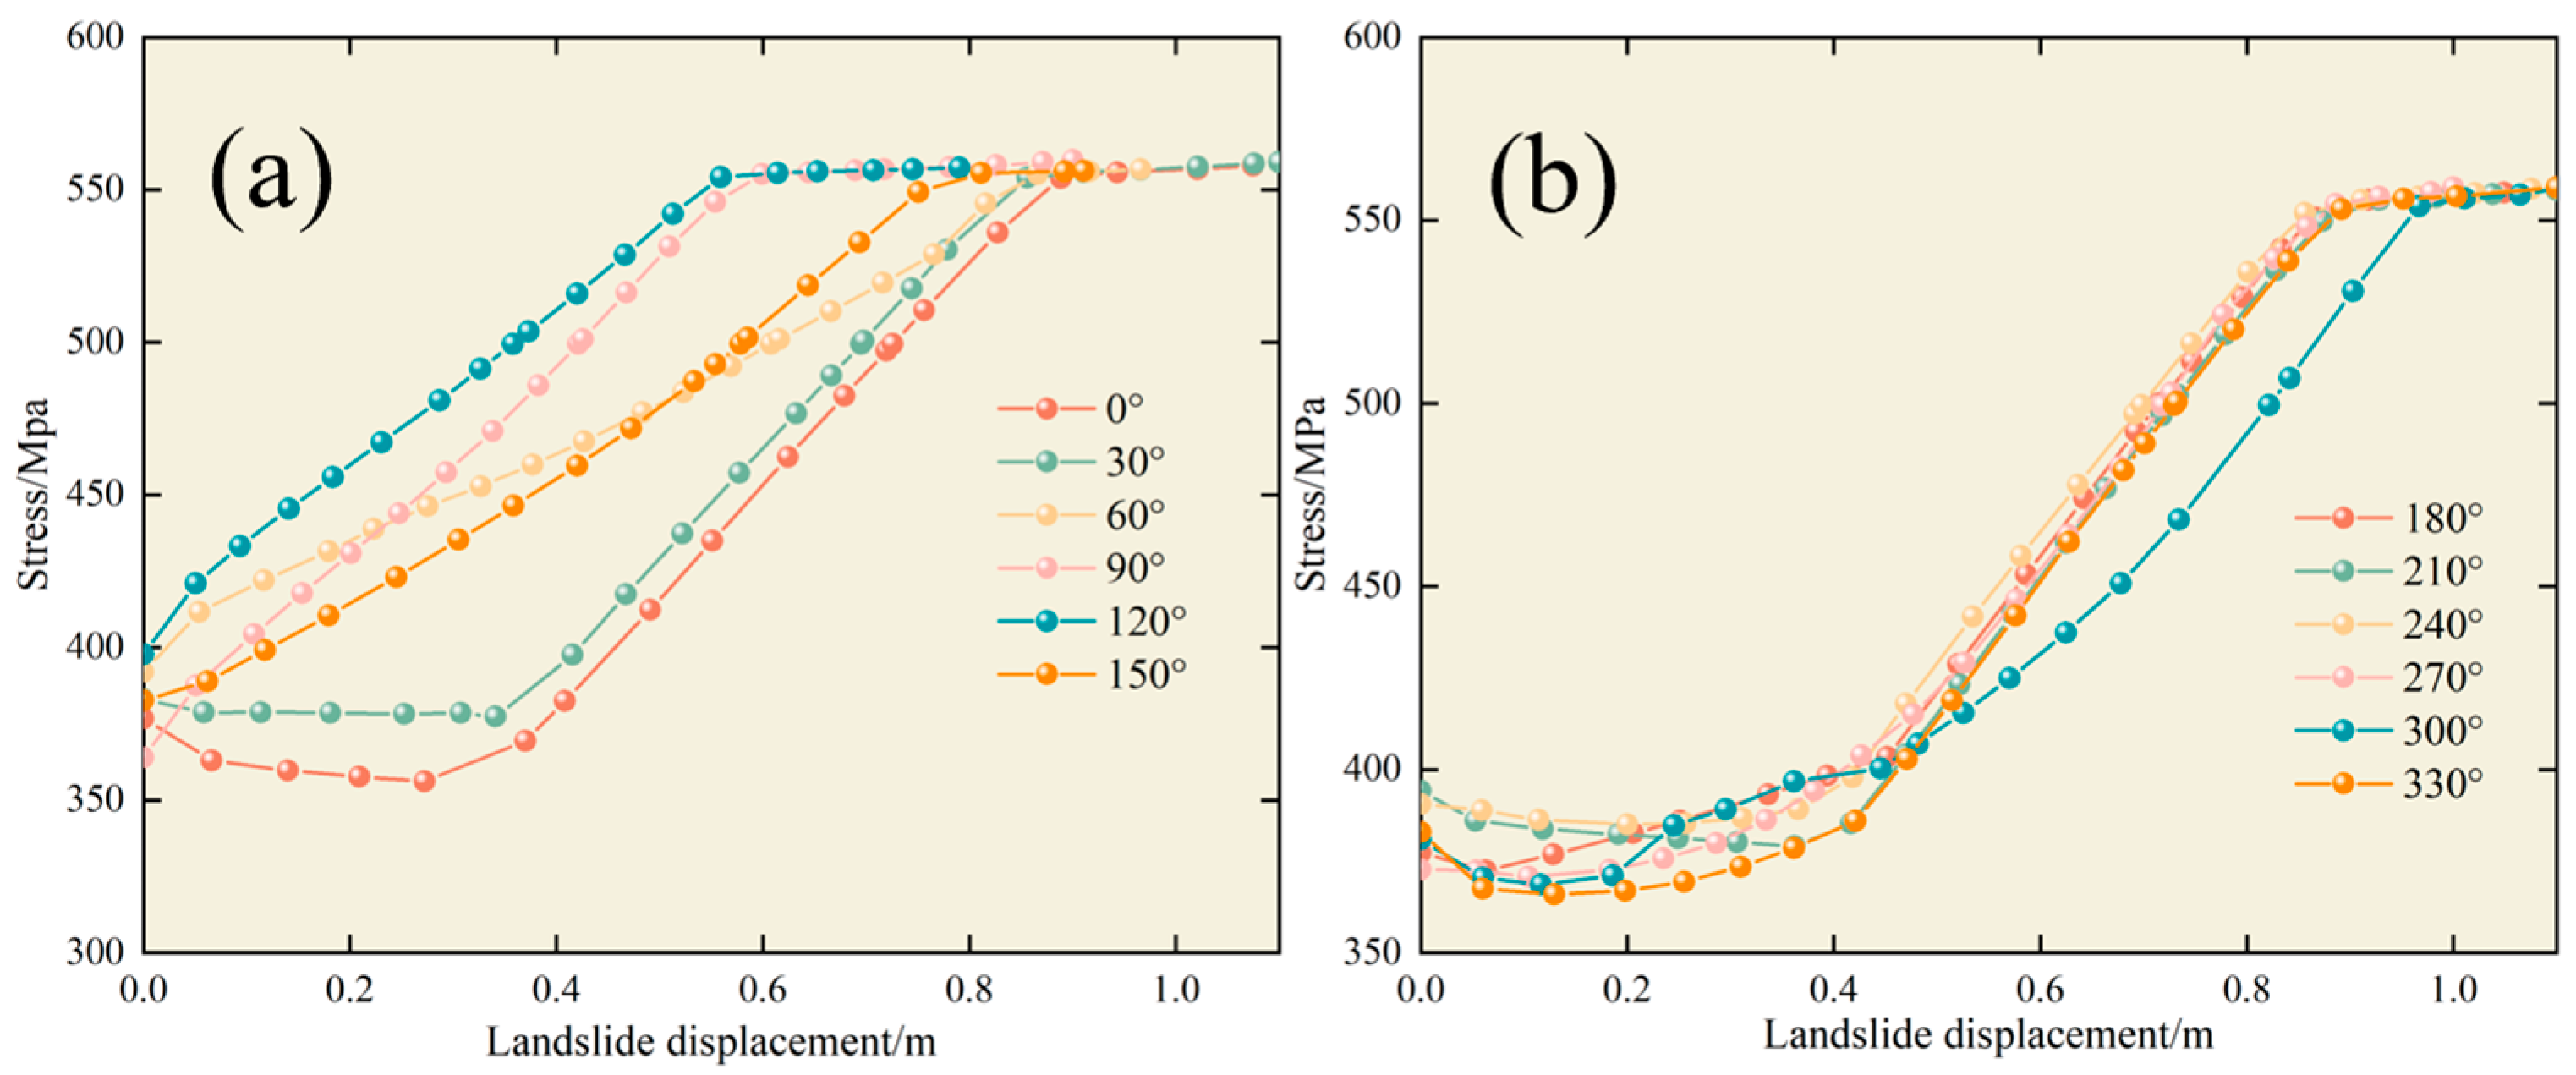
Figure 11 shows the maximum equivalent stress across different circumferential corrosion angles under varied displacements; angles at 0°, 30°, 180°, 210°, 240°, 270°, 300°, and 330° first experience a minor stress decrease before increasing with displacement; conversely, other angles display a consistent increase in stress with displacement. The observed trends stem from the interplay between the internal pressure and displacement loads. Initially, in specific locations, the dominant internal pressure causes a stress reduction with minor displacements. However, as the dragging effect of the landslide on the pipeline intensifies, surpassing the internal pressure effect, the circumferential stress begins to increase.
When the corrosion defect is located at 300°, its stress curve is notably lower than in other conditions, indicating the maximum equivalent stress remains at the corroded site. Analyzing the trends in stress changes, the circumferentially corroded pipelines can be categorized into three scenarios:
  • An initial decrease followed by a consistent growth rate (at 0°, 30°, 180°, 210°, 240°, 270°, and 330°).
  • An initial decrease then a gradual increase (at 300°).
  • Continuous growth (at 60°, 90°, 120°, and 150°).
Figure 12 shows the stress profile for defects positioned from 0° to 330° under landslide displacements ranging from 0.2 m to 1 m. Stress concentration is evident at the corrosion site. With increasing displacement, stress rises in the circumferential positions of the pipeline. At a given displacement, the stress at the defect angular position does not follow a uniform trend. The site of maximum stress can differ from the actual corrosion defect, influenced by the angular position and landslide displacement.
While stress outcomes differ across angular positions and landslide displacements, the areas between the slide-facing and its opposite side exhibit subdued stress variations. This underscores the engineering rationale behind prioritizing monitoring stress in the slide-facing and slide-backing areas of the pipeline.
Figure 13 shows a stress analysis contrasting the maximum stresses at corroded sites with those at non-corroded areas across various circumferential angles. For corrosion defects at positions of 0°, 30°, 60°, 180°, 210°, 240°, and 330°, as the landslide displacement grows, the area of maximum stress transitions from the defect to around 105–120° on the slide-facing side. Initially, the weakening effect of the defect dominates. Still, as displacement increases, the load from the sliding soil becomes paramount, shifting the stress concentration from the defect toward the slide face until a potential failure occurs. When corrosion defects are located on or near the slide-facing side (90°, 120°, 150°), the stress at the defect remains consistently higher than in other orientations as the landslide displacement increases. This is primarily due to the combined effects of the defect and landslide, which collectively outweigh the impact of the landslide alone. Consequently, there is a pronounced stress concentration at the defect, leading to steadily increasing stress levels until yielding occurs as the displacement load grows. When corrosion defects are positioned on the back side of the slide, specifically at 270° and 300°, the stress at the defect location increases with the growing landslide displacement. However, the stress in areas closer to the slide-facing side eventually surpasses the defect stress. This behavior results from the combined stress on the pipeline, induced by the increasing displacement and the defect on the non-slide facing side. When the landslide load becomes more incredible, the stress near the slide-facing side becomes the primary influence.
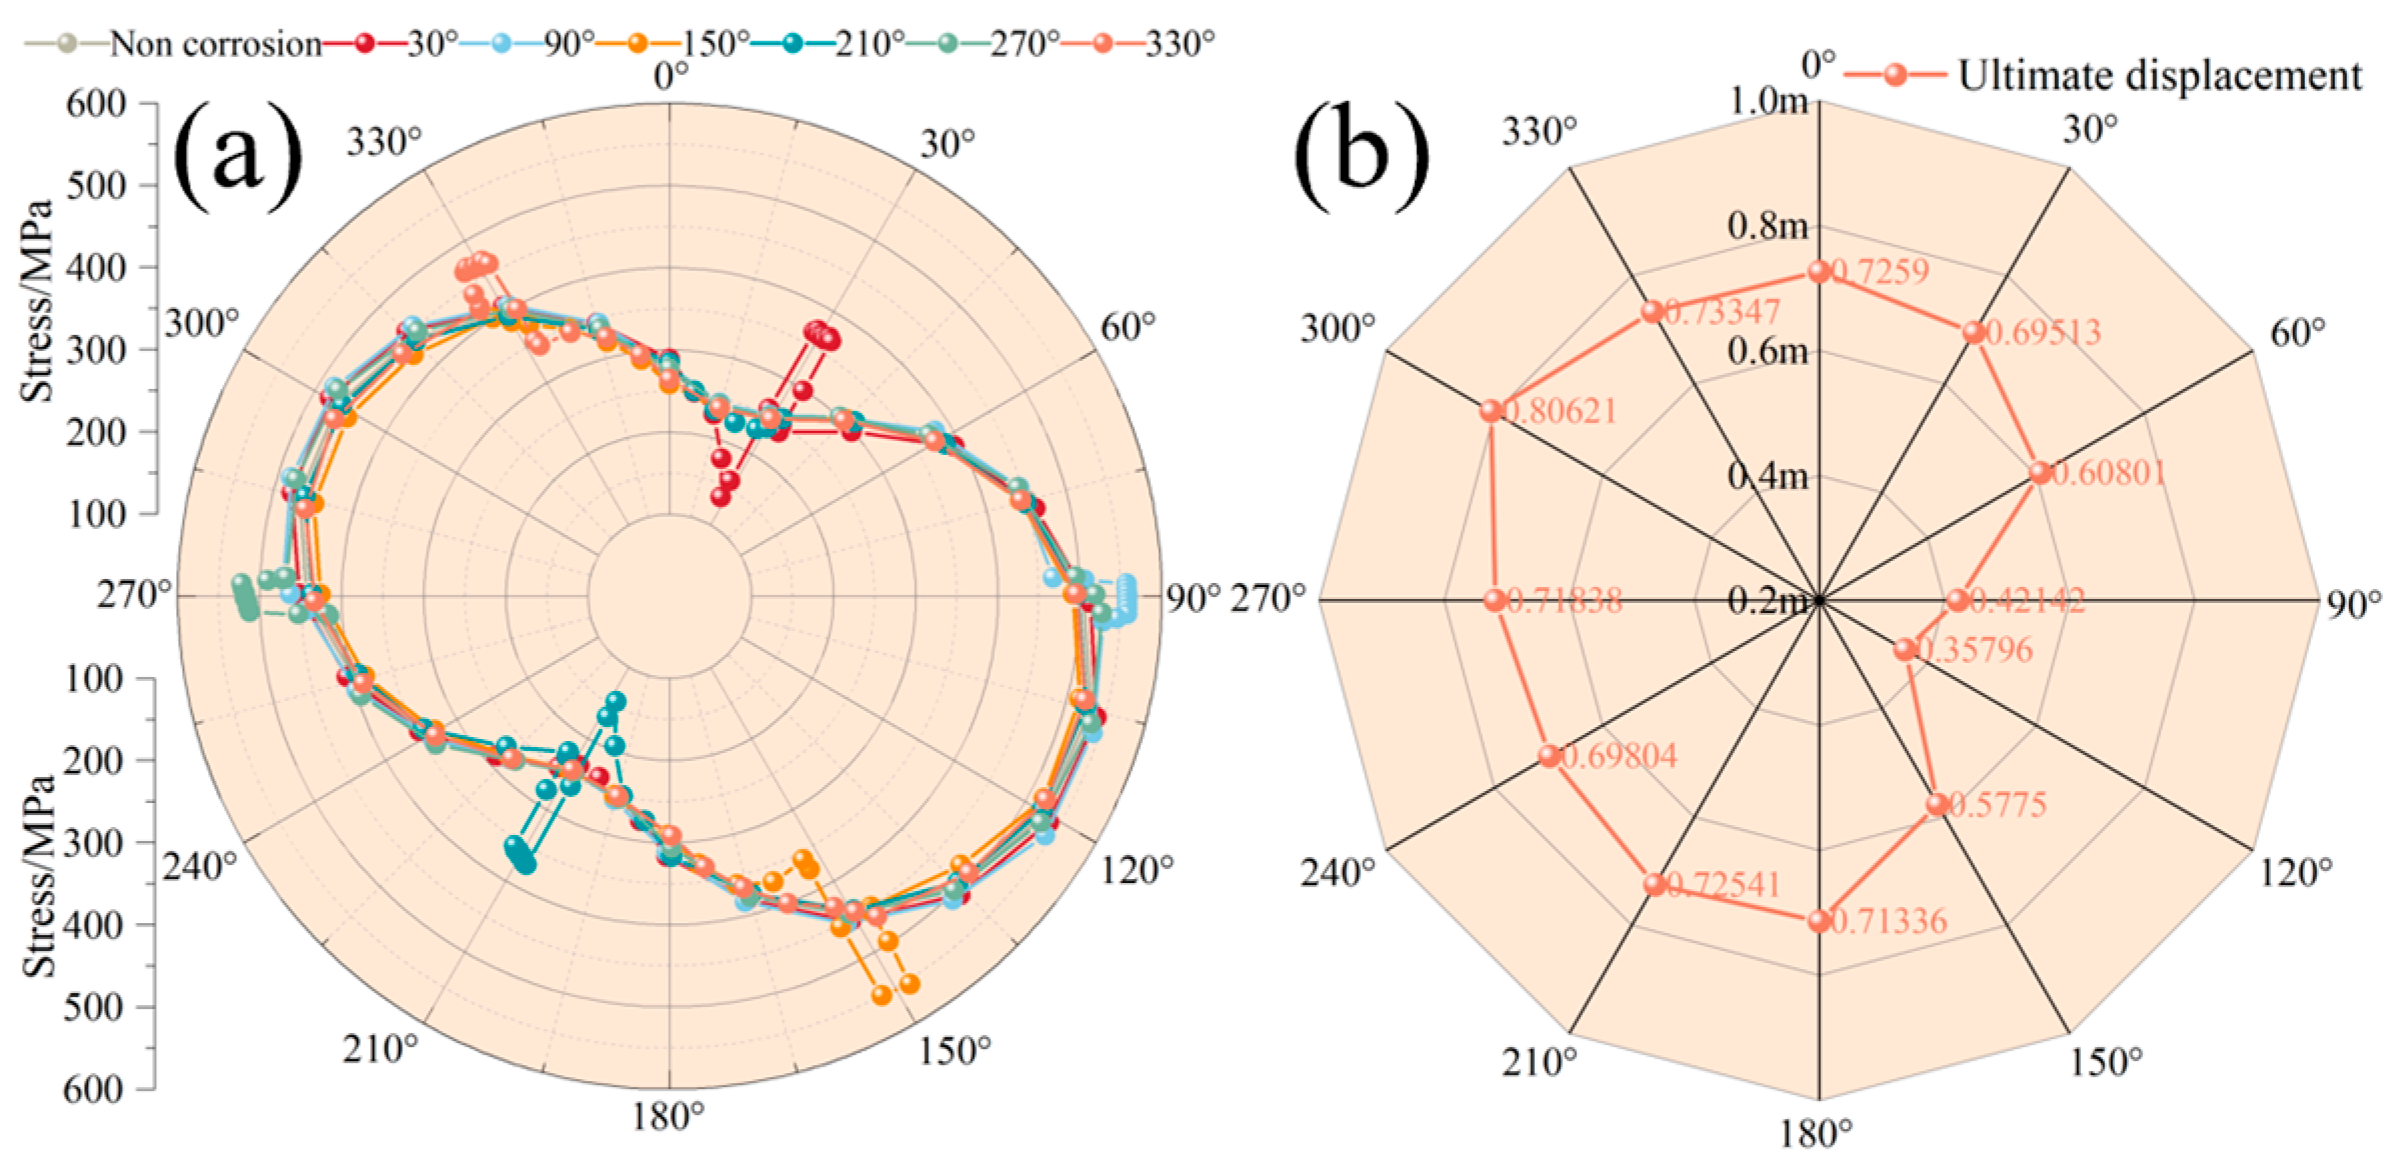
Figure 14 shows the stress distribution for corrosion positions at 30°, 90°, 150°, 210°, 270°, and 330° under a 0.8 m displacement and the corresponding limit displacements for each angle. In Figure 14a, the stress variation across different corrosion circumferential positions is prominent only at the defect, while it remains almost uniform elsewhere. Notably, when the corrosion is at 90°, the stress reaches 558 MPa, indicating yielding, whereas at 210°, the stress is at its lowest at 365 MPa, signifying a safe state. An interesting phenomenon is observed based on the stress distribution. For non-corroded pipelines, areas under low stress show significant stress shifts when corroded, while high-stress regions exhibit a minimal change when the defect occurs.
In Figure 14b, the minimum limit displacement is 0.358 m when the corrosion is located at 120° on the pipeline. From 120° to 300°, the limit displacement distribution gradually increases in a semi-heart shape. The maximum limit displacement is 0.806 m, which is 0.053 m higher than the pipeline without corrosion defects. When corrosion occurs in areas with higher stress on the slide-facing front, the hazard is more significant. However, when corrosion occurs in areas with higher stress on the slide-backing face, the hazard is reduced. The harm of landslides on the facing surface is more significant than that on the back surface, and the displacement due to landslides plays a crucial role in determining the safety and integrity of the pipeline.
Evaluating the effects of the axial corrosion location, the stress distribution pattern from the middle of the landslide to the non-landslide area was investigated. As shown in Figure 15, at a displacement of 0.8 m, the maximum stress occurs at the corrosion site when it is within 6 m from the landslide center. Beyond this axial distance, the maximum stress shifts back to the center of the landslide, surpassing the stress at the defect. As this distance increases, the impact of corrosion on pipeline safety gradually diminishes.
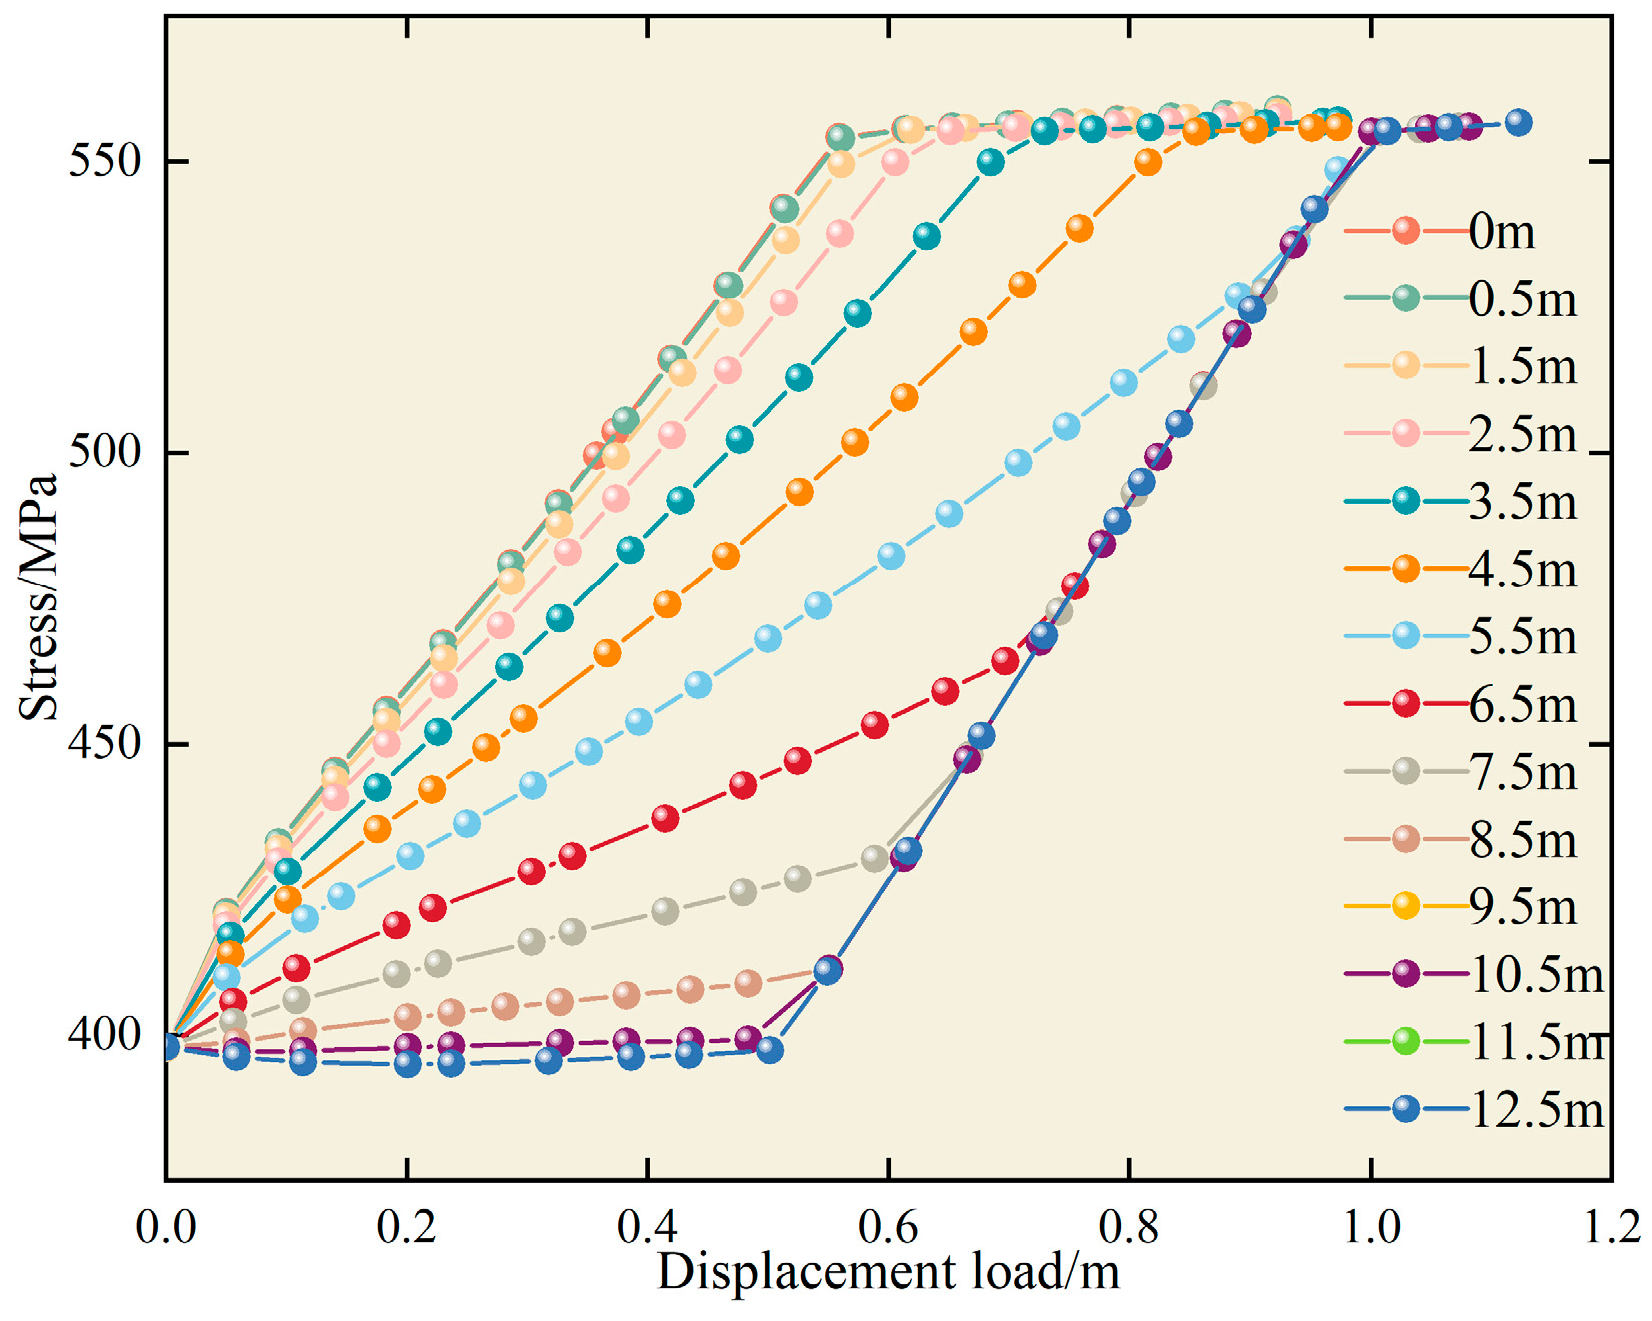
As shown in Figure 16, under a displacement ranging from 0 to 1 m, the equivalent stress is the largest and the fastest growing when the corrosion defect is at the center of the landslide. Upon reaching the yield state, the stress stabilizes. For defects between 0 and 5.5 m, the growth rate consistently decreases, indicating that the weakening effect at the defect site surpasses the landslide impact at the center. However, when the pipeline defect lies between 6.5 and 12.5 m, there is a distinct segmented effect in the stress curve. That is, once the displacement reaches a specific value, the stress escalates at a faster rate until it hits the yield strength. Because with low landslide load, the maximum stress is at the corrosion defect away from the landslide center. As the load increases, stress at the landslide center sharply rises. After a certain point, stress growth aligns closely until yielding. Thus, for a corrosion distance of 5.5 m from the landslide center, the focus is on the safety impact of corrosion. Beyond 6.5 m, we prioritize the effect of landslide displacement on central pipeline safety.
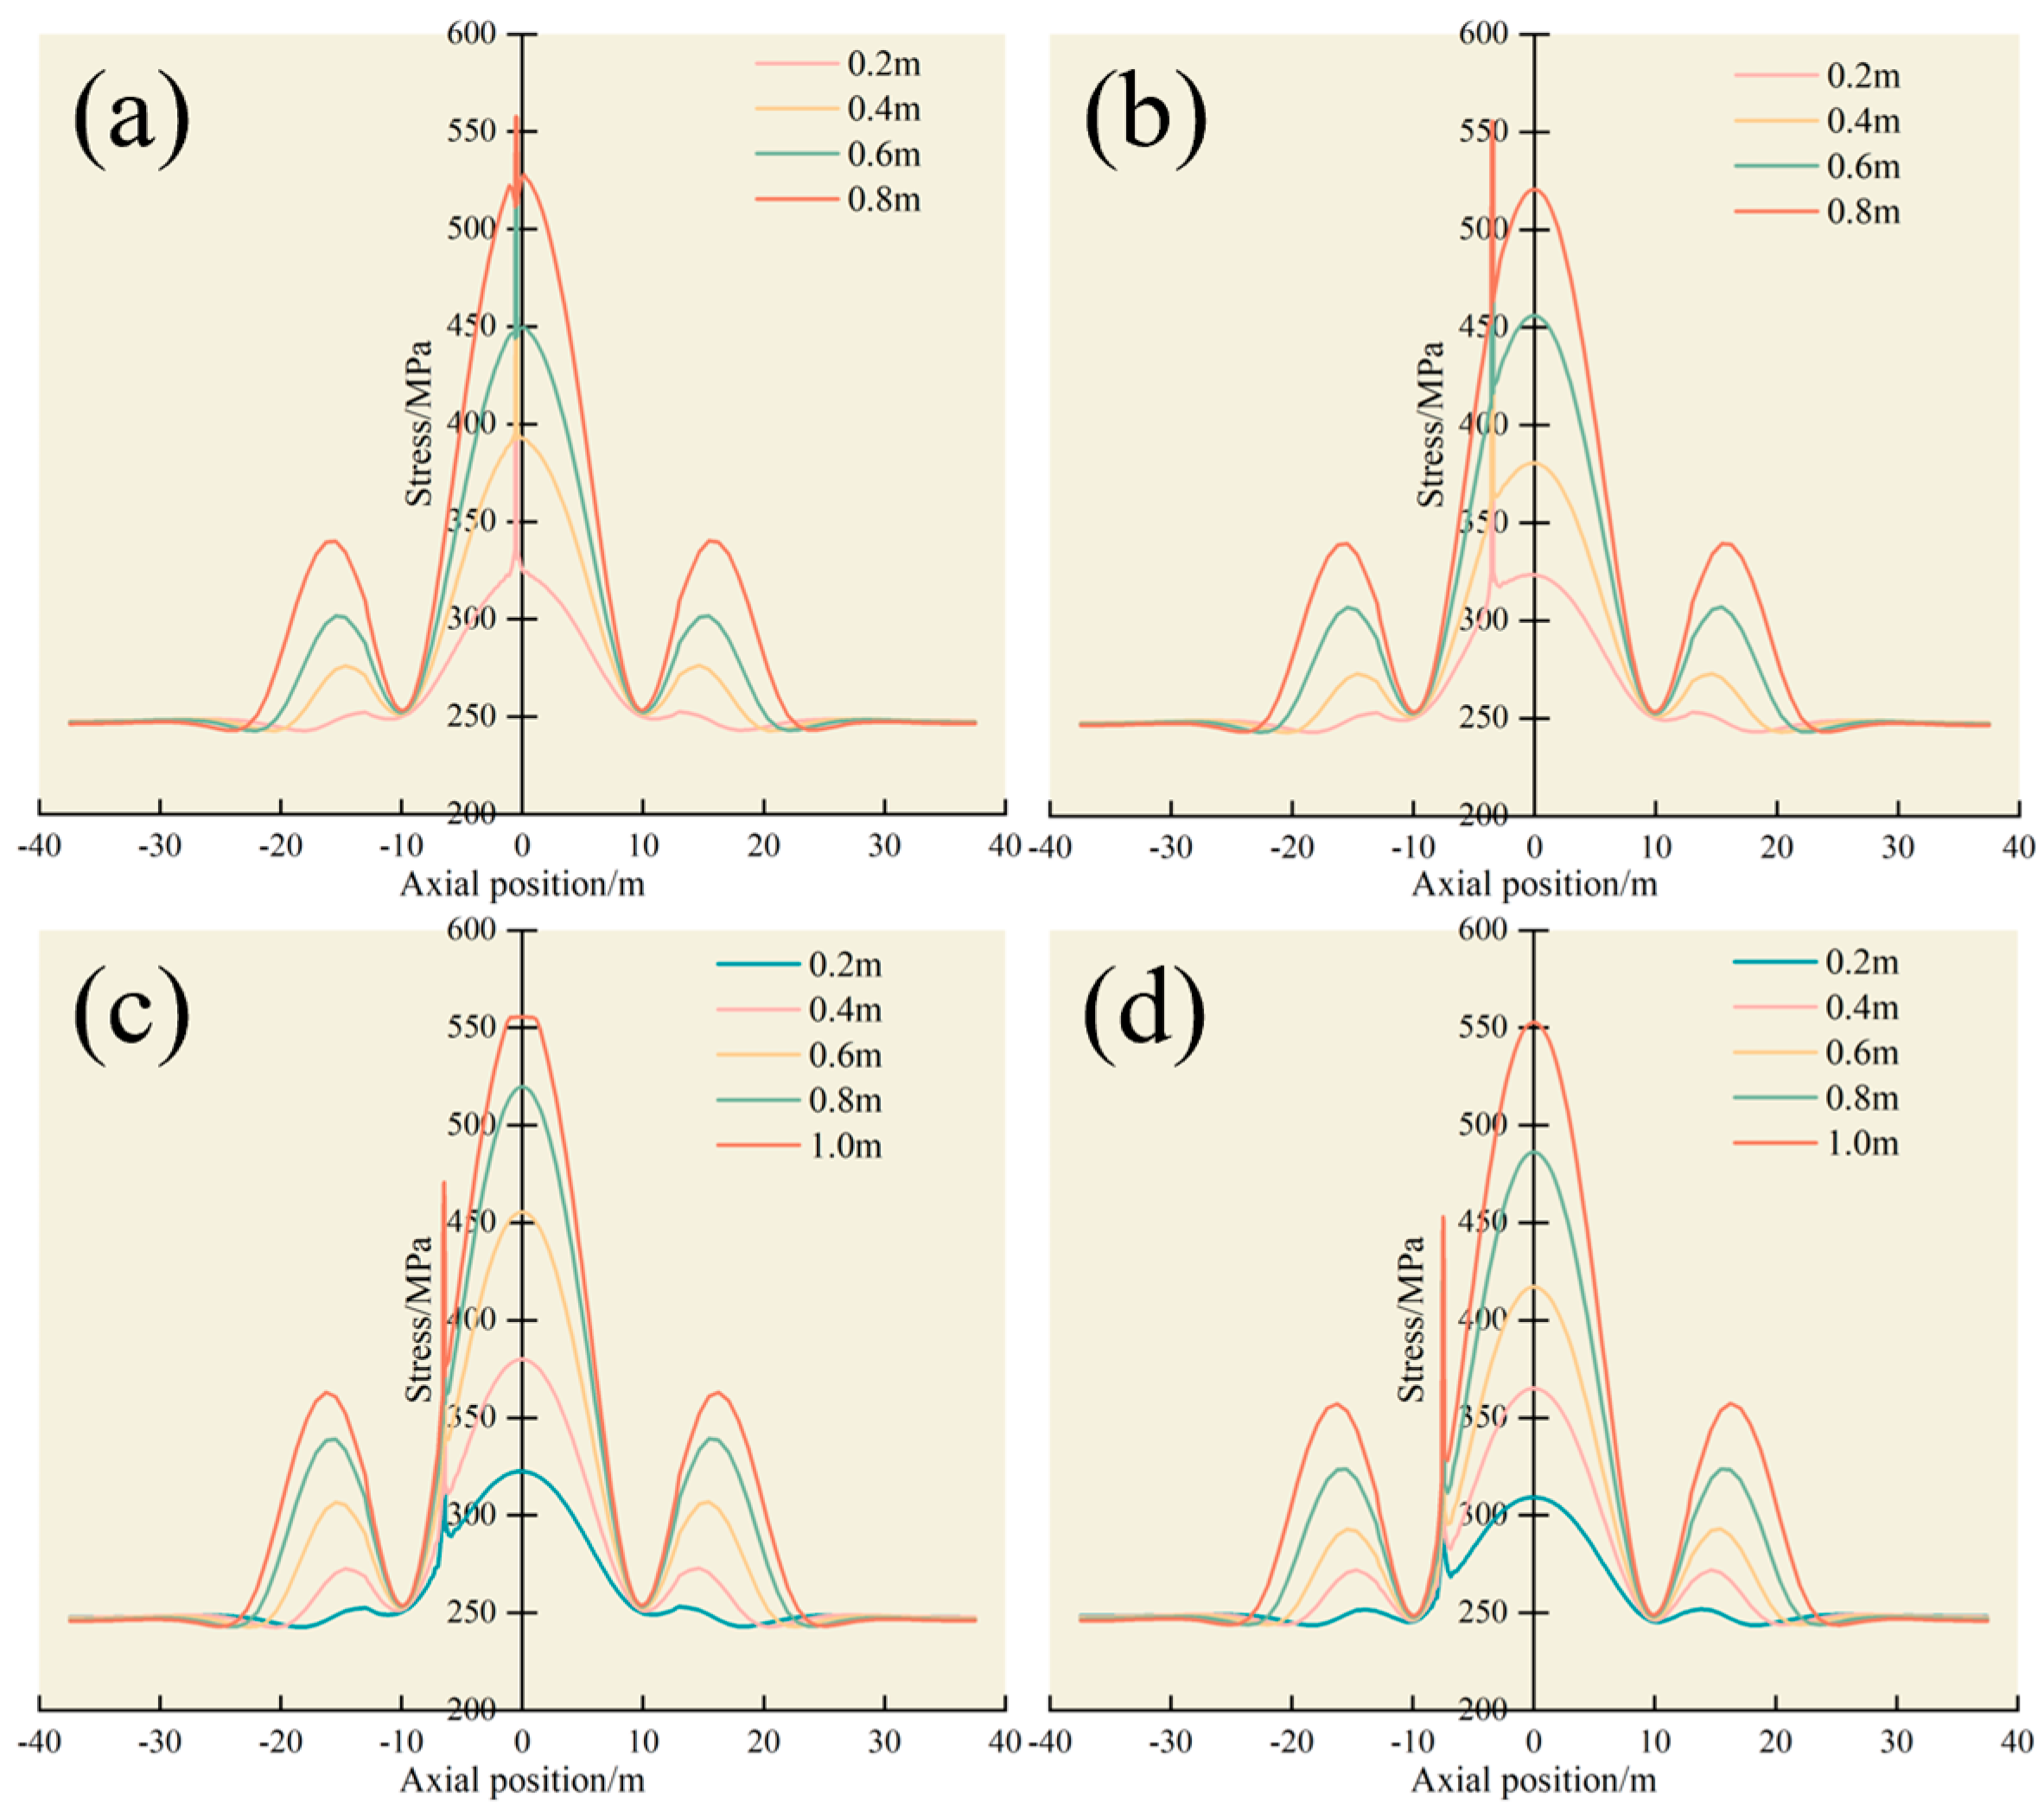
To further validate the conclusions, an analysis was conducted for corrosion distances of 0 m, 3.5 m, 7.5 m, and 10.5 m from the pipeline center, as shown in Figure 17. With increasing landslide loads for distances of 0.5 m and 3.5 m, the stress in the landslide and adjacent areas rises, concentrating at the corrosion site, resulting in pipe failure and reaching its yield strength, and the most critical point remains at the corrosion location. For distances of 7.5 m, the maximum stress shifts from the corrosion site to the center of the landslide, and the disparity between them widens with increasing displacement.
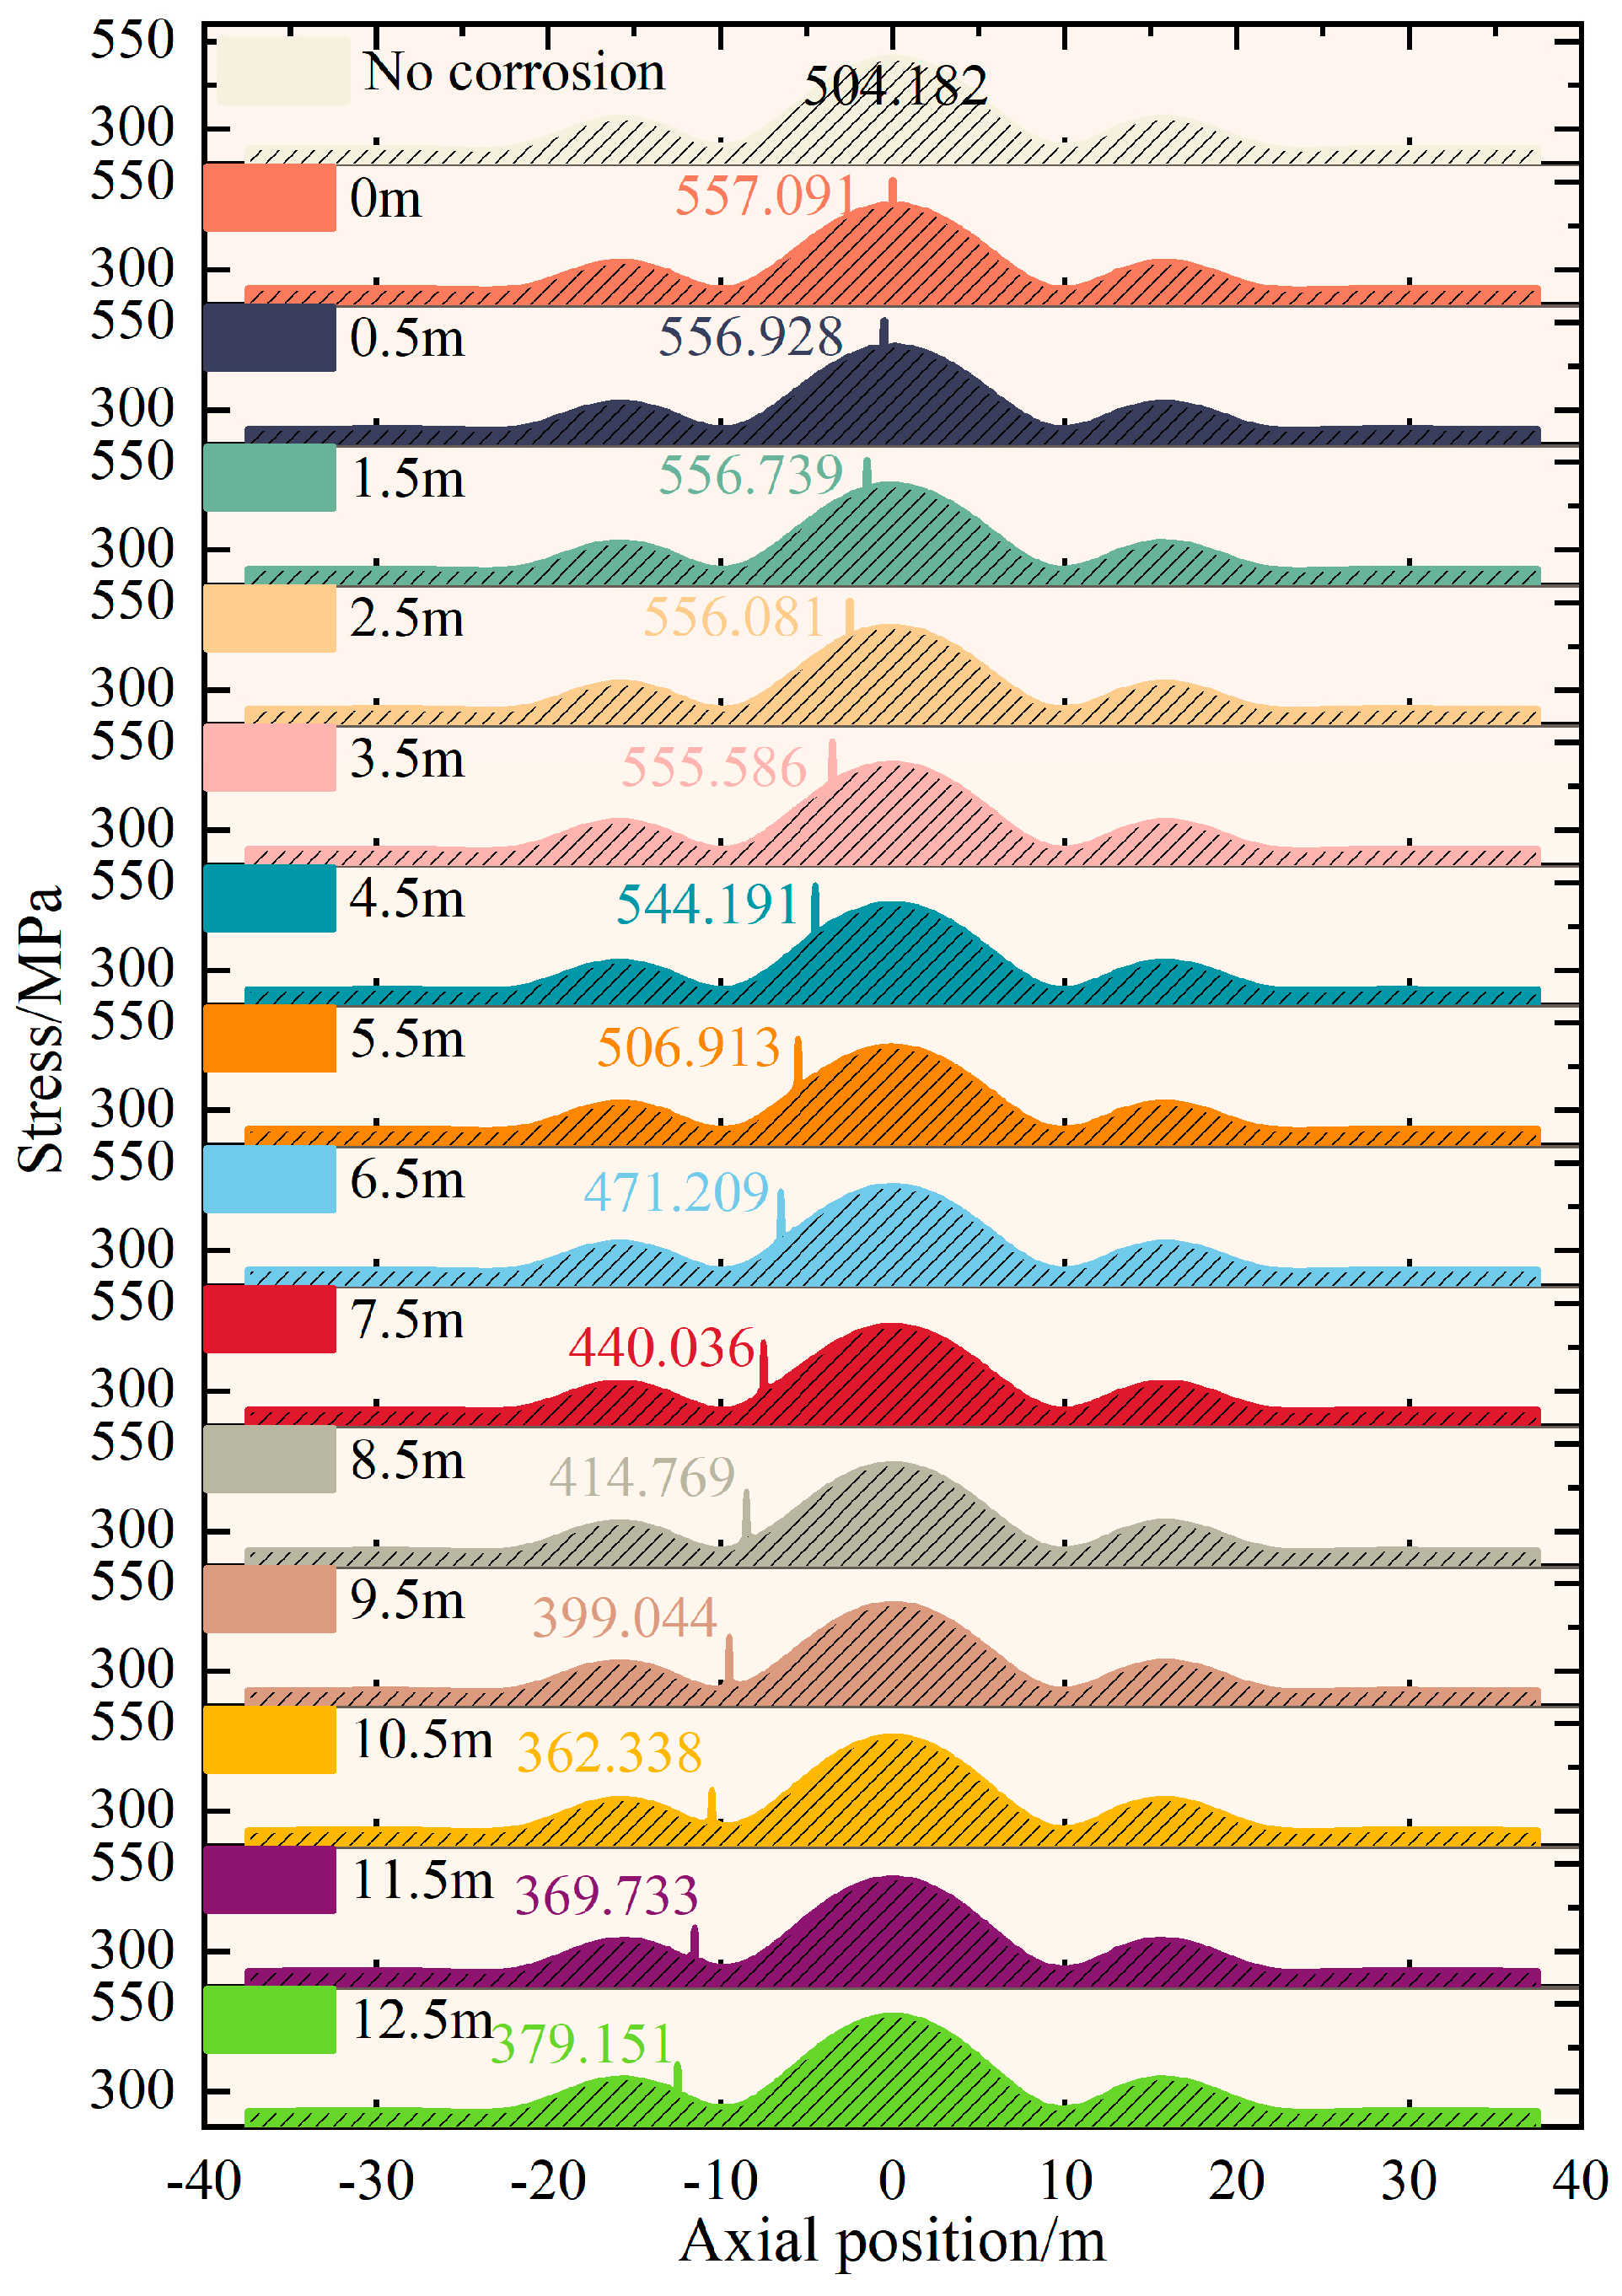
For a displacement of 0.8 m, the axial stress distribution of pipelines both without corrosion and with corrosion ranging from 0 to 12.5 m is extracted. As shown in Figure 18, aside from the abrupt change in the corrosion defect, the axial stress distributions across all scenarios are largely consistent, displaying a tri-peak profile. When the corrosion is within 3.5 m from the center, the stress at the corroded spot exceeds the minimum yield stress with minor abrupt changes. Beyond 3.5 m, the pipeline has not yielded, but defects within 5.5 m exceed the allowable stress, failing with a relatively significant stress change at the corrosion site. The stress at the corrosion defect decreases axially but shows a slight increase between 10.5 m and 12.5 m. This is due to the decreasing distance to the landslide edge, where the edge shear combined with the corrosion defect intensify the stress on the pipeline at this location.
Under the landslide influence, the most hazardous point on the pipeline is not necessarily the corrosion defect. In real-world conditions, evaluations should consider the landslide direction, displacement, and the axial and circumferential position of the corrosion. It is crucial to understand the relationship between corrosion sites and landslide-affected pipelines, pinpoint potential danger zones, and avoid over-protection.
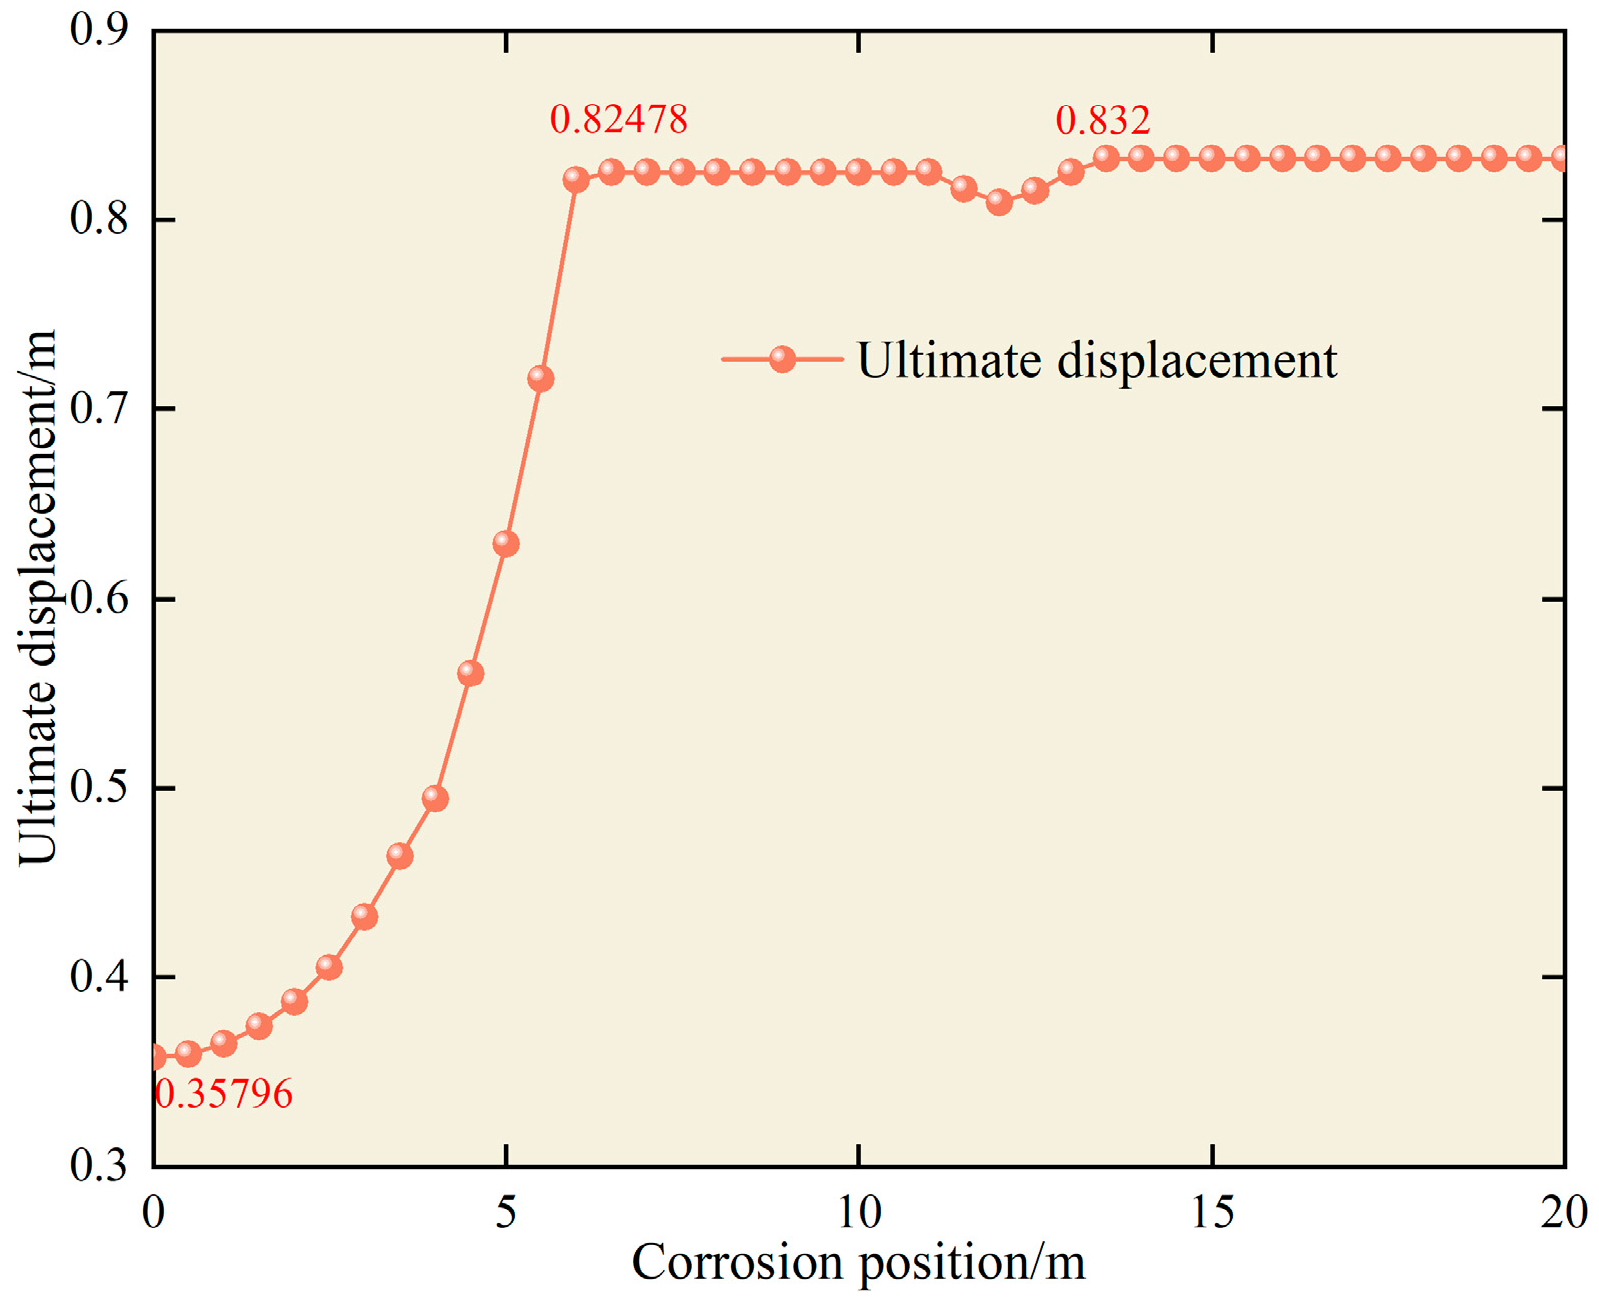
The curve in Figure 19 shows the limit landslide displacement for various axial corrosion positions on the pipeline. The pipeline is most susceptible to yield when the corrosion is at the center of the landslide, with the smallest limit displacement. This increases to a displacement of 0.825 m at 6.5 m from the center, and there is a slight decline then rise between 11 and 12 m, peaking at 0.832 m at 13.5 m, and remaining stable after that. The region impacted by the limited landslide displacement spans up to 13 m. Beyond this, the corrosion impact is negligible.
In practical engineering, landslide simulations under various scenarios can be combined with the distribution patterns of corroded pipeline stress under landslides for modeling, monitoring, forecasting, and excavation repairs.

5. Equation Prediction

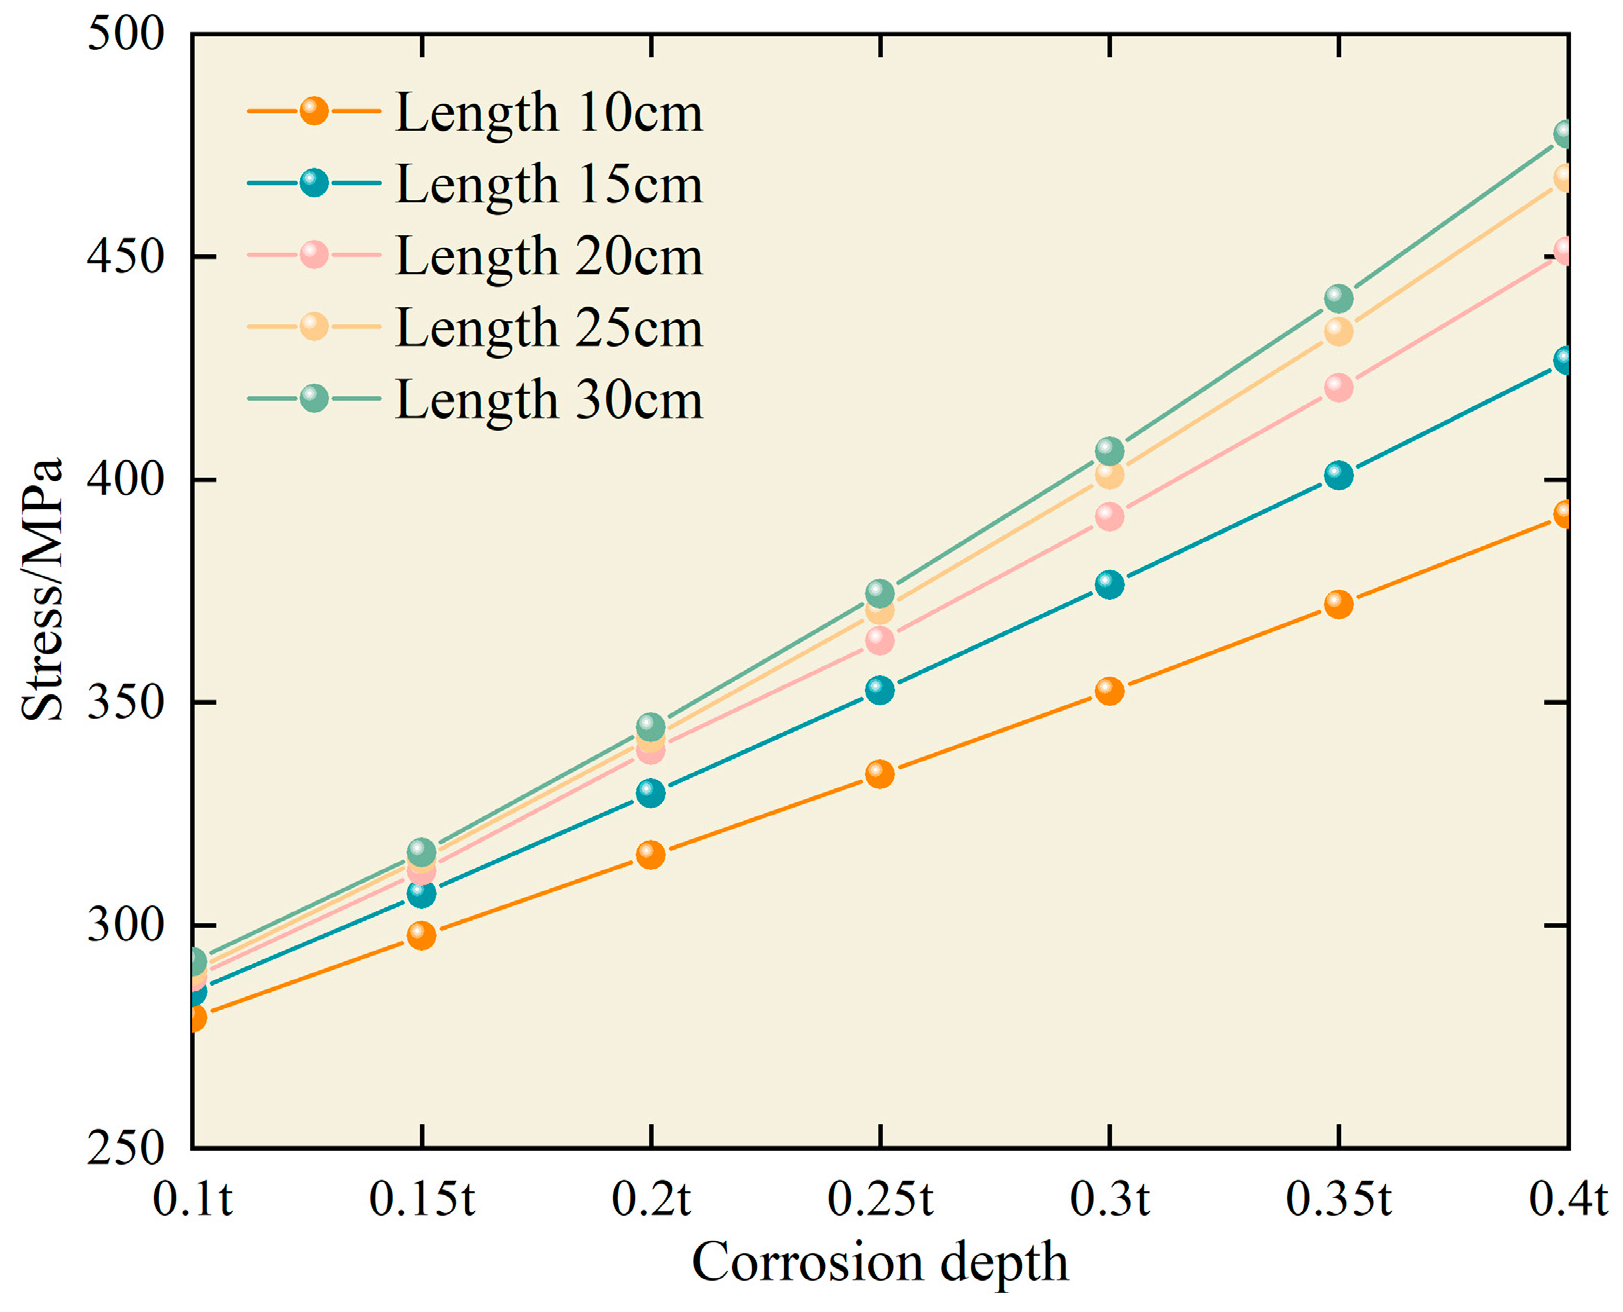
When no landslide displacement acts on the pipeline, the specific weakening effect of the corrosion size on the pipeline is studied, as shown in Figure 20.
As the depth of the corrosion increases, the stress of the pipeline continuously grows at an accelerating rate. However, with the extension of the corrosion length, while the stress still rises, the growth rate gradually decreases. Thus, it can be inferred that the depth of the corrosion defect is the primary factor affecting the pipeline stress without the influence of a landslide. Based on the stress results of the corroded pipeline under internal pressure, using the Marquardt method in nonlinear multivariate regression and the general global optimization technique, a multivariate fit was performed with the maximum equivalent stress as the dependent variable and the corrosion length and depth as independent variables.
σ = E × a ( x c t + b ) 2 x s t + σ 0
where xc is the length of the corrosion defect, mm; xs is the depth of the corrosion defect, mm; σ is the equivalent stress of the pipeline, MPa; t is the wall thickness of the pipeline, 18.2 mm; E is the elastic modulus, 2.07 × 10⁵ MPa; σ0 is the stress value of the intact pipeline under normal operation, MPa; and a and b are unknown coefficients.
σ0 was determined to be 252.5 MPa following the numerical simulation, and the coefficients a and b were found to be 7.25 × 10⁻⁷ and 43.526, respectively, through the fitting analysis. Thus, the relationship describing the impact of the corrosion size on stress without landslide influence can be represented by the ensuing equation:
σ = E × 7.25 × 10 7 ( x c t + 43.526 ) 2 x s t + 252.5
Table 3 shows that the fitted expression aligns closely with the original data.
Given the high unpredictability of corrosion in pipelines, to ensure their safe operation, the most unfavorable position in both the axial and circumferential directions is analyzed. Hence, based on the corrosion defect located axially in the middle of the landslide and circumferentially at 120°, the trend with displacement is shown in Figure 21.
The fitted relationship between the pipeline stress under the landslide and the soil displacement is as follows:
σ = E × ( 0.002 x L c ) 0.527 + σ 1
where σ1 is the stress of the pipeline without landslide, which is determined to be 366.5 MPa through numerical simulation; x is the landslide displacement, m; and Lc is the distance of the pipeline from the landslide crack, set as 3 m. The correlation coefficients for the fitted pipeline stress and displacement load equation are shown in Table 4, suggesting a satisfactory regression outcome that aligns closely with the original data.
Combining Formulas (9) and (10), the stress equation for the pipeline under the influence of various displacements with a corrosion defect of 20 cm length and 0.25t depth is derived:
σ = E ( 0.002 x L c ) 0.527 + 7.25 × 10 7 ( x c t + 43.526 ) 2 x s t + σ 0
To investigate the relationship between full-scale corroded pipeline stress and landslide displacement, laying the groundwork for the warning model, it is assumed that the corrosion defect is at its riskiest position (axially central and circumferentially facing the slide). Using corrosion depths of 0 to 0.40t and lengths of 0 to 30 cm, stress results for varying landslide displacements were fitted, and the following equation represents the displacement–size–stress fit with a correlation coefficient of 0.9739:
σ = E 0.012 x L c 0.79 + 4.18 × 10 6 ( x c t + 59.1 ) 2 x s t + σ 0
where σ0 is the initial stress of the intact pipeline without landslide displacement, MPa; x is the landslide displacement, m; xc is the length of the corrosion defect, mm; t is the wall thickness of the pipeline, 18.2 mm; and xs is the depth of the corrosion defect, mm.

6. Conclusions

This study employed numerical simulations to conduct a safety analysis of corroded pipelines under landslide disasters. Effects of critical parameters, including corrosion depth, corrosion length, and landslide displacement, are examined. The main contributions of this work involve (1) a correlation between the corrosion location and the maximum stress of pipelines is explored; and (2) a novel prediction equation for the maximum stress of corroded pipelines under landslides is developed, which considers not only the pipeline–soil interaction but also the existing corrosion dimensions and current landslide displacement. The conclusions of this work are as follows:
  • Under landslide conditions, the maximum stress of the pipeline increases with the growth of corrosion length or depth, albeit marginally. The order of the influence of each factor on the pipeline is landslide displacement > defect depth > defect length.
  • As displacement increases, the initial single-peak axial stress gradually transforms into a tri-peak stress profile (edge–center–edge) due to the combined effects of the landslide-induced soil thrust and soil shear at the edge. The angle facing the slide becomes the most vulnerable part of the pipeline, warranting close attention in engineering projects.
  • There is an interplay between the stress concentration and the increasing corroded area when the corrosion defect is small in depth and length. This interplay can lead to a short-term increase in the limited landslide displacement, followed by a gradual decrease.
  • For the defect at different circumferential positions in the pipeline, the maximum stress location alternates between the slide-facing side and the defect. When the defect is near the slide-facing angle, this side becomes the most critical, when situated between the slide-facing and slide-backing sides, the maximum stress remains on the slide-facing side, and when the defect is located near or at the slide-backing side, the stress at the defect exceeds that of the slide-facing side.
  • When the defect is not central within the landslide, the stress at the defect exceeds that at the landslide center. Yet, when the defect shifts a certain distance from the center, the landslide’s central influence prevails, making the defect location the most hazardous point of maximum stress. Moreover, its stress decreases as the defect distance from the center increases, but in edge areas, shearing effects cause some increases in stress.
The limitation of this work lies in its omission of an in-depth exploration into the formation mechanism of corrosion. The corrosion defect was modeled as a rectangular shape, assuming uniform thinning of local wall thickness. Additionally, this study did not account for the possibility of multiple corrosion defects occurring in pipelines. Future directions involve addressing the condition assessment of parallel corroded pipelines under landslide conditions, which can be combined with a finite element simulation, theoretical analysis, and reliability assessment, with a focus on addressing the coupled safety issues of parallel pipelines under landslide conditions.

Author Contributions

Conceptualization, S.L. and W.L.; Methodology, P.Z. and T.X.; Software, S.L. and Y.L.; Validation, W.L. and T.X.; Investigation, Y.H.; Data curation, Y.L.; Writing—original draft preparation, W.L.; Writing—review and editing, P.Z., S.L. and Y.H.; Supervision, P.Z. All authors have read and agreed to the published version of the manuscript.

Funding

This work was supported by National Natural Science Foundation of China, grant number 50974105; Special Research Fund for Doctoral Programs in Universities, grant number 20105121110003; Major Consulting Research Project of the Chinese Academy of Engineering, grant number 2011-ZD-20.

Institutional Review Board Statement

Not applicable.

Informed Consent Statement

Not applicable.

Data Availability Statement

The data presented in this study are available on request from the corresponding author. The data are not publicly available due to privacy.

Acknowledgments

The authors express their gratitude to Xuemei Tang for providing valuable suggestions in this study.

Conflicts of Interest

The authors declare no conflict of interest.

Nomenclature

DxThe soil displacement at position x from the landslide center, m
DcThe soil displacement at the landslide center, m
w1 and w2The distances from the two ends of the landslide to its center, m
γ1The deflection at position x from the landslide center, m
q(x) The lateral soil pressure at that position, KN
TThe axial tension, KN
EElastic modulus, MPa
IThe moment of inertia, m4
μPoisson ratio
DThe X80 pipeline outside diameter, mm
tThe X80 pipeline wall thickness, mm
[σ]The allowable stress of X80 pipeline, MPa
σsThe yield stress of X80 pipeline, MPa
γThe bulk density of soil, KN/m3
ΦThe internal friction angle of soil, °
CThe cohesion of soil, KPa
xcThe length of the corrosion defect, mm
xsThe depth of the corrosion defect, mm
σThe equivalent stress of the pipeline, MPa
σ0The stress value of the intact pipeline under normal operation, MPa
xThe landslide displacement, m
LcThe distance of the pipeline from the landslide crack, m
RThe correlation coefficient
R2The coefficient of determination
MSEMean squared error
F-testThe joint hypotheses test

References

  1. Qin, G.; Cheng, Y.F. Modeling of mechano-electrochemical interaction at a corrosion defect on a suspended gas pipeline and the failure pressure prediction. Thin-Walled Struct. 2021, 160, 107404. [Google Scholar] [CrossRef]
  2. Yan, Y.; Zhou, J.; Xie, C.; Yin, S.; Hu, S.; Wang, R. Quantitative estimation of pipeline slope disaster risk in China. Int. J. Disaster Risk Sci. 2023, 14, 298–312. [Google Scholar] [CrossRef]
  3. Liang, G.; Zhang, X.; Ling, X.; Zhou, H.; Lin, W. Analysis of temporal-spatial characteristics of geological disasters in China from 2009 to 2019. J. Disaster Prev. Reduct. 2021, 37, 58–64. [Google Scholar] [CrossRef]
  4. Wang, Y.; Xia, A.; Qin, G. Probabilistic modeling for reliability analysis of buried pipelines subjected to spatiotemporal earthquakes. Probabilistic Eng. Mech. 2022, 69, 103315. [Google Scholar] [CrossRef]
  5. Wang, Y.; Zhang, P.; Hou, X.Q.; Qin, G. Failure probability assessment and prediction of corroded pipeline under earthquake by introducing in-line inspection data. Eng. Fail. Anal. 2020, 115, 104607. [Google Scholar] [CrossRef]
  6. Kozhaeva, K.V.; Azmetov, K.A.; Pavlova, Z.K. Analysis of the general stability of buried pipelines in the longitudinal direction taking into account the peculiarities of their construction and operation. IOP Conf. Ser. Earth Environ. Sci. 2022, 988, 052001. [Google Scholar] [CrossRef]
  7. Rowe, R.K.; Davis, E.H. The behaviour of anchor plates in clay. Geotechnique 1982, 32, 9–23. [Google Scholar] [CrossRef]
  8. Rajani, B.B.; Robertson, P.K.; Morgenstern, N.R. Simplified design methods for pipelines subject to transverse and longitudinal soil movements. Can. Geotech. J. 1995, 32, 309–323. [Google Scholar] [CrossRef]
  9. O’Rourke, M.J.; Liu, X.; Flores-Berrones, R. Steel pipe wrinkling due to longitudinal permanent ground deformation. J. Transp. Eng. 1995, 121, 443–451. [Google Scholar] [CrossRef]
  10. Chan, P.D. Soil: Pipeline Interaction in Slopes. Master’s Thesis, University of Calgary, Calgary, AB, Canada, 1999. Available online: http://hdl.handle.net/1880/42245 (accessed on 11 November 2022).
  11. Trifonov, O.V.; Cherniy, V.P. A semi-analytical approach to a nonlinear stress–strain analysis of buried steel pipelines crossing active faults. Soil Dyn. Earthq. Eng. 2010, 30, 1298–1308. [Google Scholar] [CrossRef]
  12. Trifonov, O.V.; Cherniy, V.P. Elastoplastic stress–strain analysis of buried steel pipelines subjected to fault displacements with account for service loads. Soil Dyn. Earthq. Eng. 2012, 33, 54–62. [Google Scholar] [CrossRef]
  13. Yuan, F.; Wang, L.; Guo, Z.; Shi, R. A refined analytical model for landslide or debris flow impact on pipelines. Part I: Surface pipelines. Appl. Ocean Res. 2012, 35, 95–104. [Google Scholar] [CrossRef]
  14. Li, C.; Wang, L.; Jing, H.; Liu, Q. Protection control scheme and evaluation of effects on pipeline crossing beneath landslide area. J. Pipeline Syst. Eng. Pract. 2013, 4, 41–48. [Google Scholar] [CrossRef]
  15. Wu, X.; Lu, H.; Huang, K.; Wu, S.; Qiao, W. Frequency spectrum method-based stress analysis for oil pipelines in earthquake disaster areas. PLoS ONE 2015, 10, 0115299. [Google Scholar] [CrossRef] [PubMed]
  16. Liu, J.; Tian, J.; Yi, P. Impact forces of submarine landslides on offshore pipelines. Ocean Eng. 2015, 95, 116–127. [Google Scholar] [CrossRef]
  17. Liu, P.; Zheng, J.; Zhang, B.; Shi, P. Failure analysis of natural gas buried X65 steel pipeline under deflection load using finite element method. Mater. Des. 2010, 31, 1384–1391. [Google Scholar] [CrossRef]
  18. Chaudhuri, C.H.; Choudhury, D. Buried pipeline subjected to seismic landslide: A simplified analytical solution. Soil Dyn. Earthq. Eng. 2020, 134, 106155. [Google Scholar] [CrossRef]
  19. Li, H.-J.; Zhu, H.-H.; Zhang, C.-X.; Zhang, W. Modelling and analysing failure modes of buried pipelines perpendicularly crossing landslide boundaries. Soil Dyn. Earthq. Eng. 2022, 162, 107447. [Google Scholar] [CrossRef]
  20. Audibert, J.M.; Kenneth, J.N. Soil restraint against horizontal motion of pipes. J. Geotech. Eng. Div. 1977, 103, 1119–1142. [Google Scholar] [CrossRef]
  21. Calvetti, F.; Claudio, D.P.; Roberto, N. Experimental and numerical analysis of soil–pipe interaction. J. Geotech. Geoenvironmental Eng. 2004, 130, 1292–1299. [Google Scholar] [CrossRef]
  22. Wijewickreme, D.; Karimian, H.; Honegger, D. Response of buried steel pipelines subjected to relative axial soil movement. Can. Geotech. J. 2009, 46, 735–752. [Google Scholar] [CrossRef]
  23. Lin, D.; Lei, Y.; Xu, K.; Huang, R.; Zhu, Y.; Luo, M.; Tao, H. An experiment on the effect of a transverse landslide on pipelines. Acta Pet. Sin. 2011, 32, 728–732. [Google Scholar] [CrossRef]
  24. Sarvanis, G.C.; Karamanos, S.A.; Vazouras, P.; Mecozzi, E.; Lucci, A.; Dakoulas, P. Permanent earthquake-induced actions in buried pipelines: Numerical modeling and experimental verification. Earthq. Eng. Struct. Dyn. 2018, 47, 966–987. [Google Scholar] [CrossRef]
  25. Huang, Y.; Qin, G.; Hu, G. Failure pressure prediction by defect assessment and finite element modelling on pipelines containing a dent-corrosion defect. Ocean Eng. 2022, 266, 112875. [Google Scholar] [CrossRef]
  26. Li, N. Principle and direct assessment of internal corrosion of gas pipelines. Corros. Prot. 2013, 34, 362–366. [Google Scholar]
  27. Chen, Y.; Hou, F.; Dong, S.; Guo, L.; Xia, T.; He, G. Reliability evaluation of corroded pipeline under combined loadings based on back propagation neural network method. Ocean Eng. 2022, 262, 111910. [Google Scholar] [CrossRef]
  28. Liang, P.; Li, X.; Du, C.; Chen, X. Stress corrosion cracking of X80 pipeline steel in simulated alkaline soil solution. Mater. Des. 2009, 30, 1712–1717. [Google Scholar] [CrossRef]
  29. Wasim, M.; Djukic, M.B. External corrosion of oil and gas pipelines: A review of failure mechanisms and predictive preventions. J. Nat. Gas Sci. Eng. 2022, 100, 104467. [Google Scholar] [CrossRef]
  30. Huang, Y.; Qin, G.; Yang, M. A risk-based approach to inspection planning for pipelines considering the coupling effect of corrosion and dents. Process Saf. Environ. Prot. 2023, 180, 588–600. [Google Scholar] [CrossRef]
  31. Netto, T.; Ferraz, U.; Estefen, S. The effect of corrosion defects on the burst pressure of pipelines. J. Constr. Steel Res. 2005, 61, 1185–1204. [Google Scholar] [CrossRef]
  32. Shuai, Y.; Wang, X.-H.; Cheng, Y.F. Modeling of local buckling of corroded X80 gas pipeline under axial compression loading. J. Nat. Gas Sci. Eng. 2020, 81, 103472. [Google Scholar] [CrossRef]
  33. Ma, H.; Zhang, W.; Wang, Y.; Ai, Y.; Zheng, W. Advances in corrosion growth modeling for oil and gas pipelines: A review. Process Saf. Environ. Prot. 2023, 171, 71–86. [Google Scholar] [CrossRef]
  34. Wang, W.; Zhang, Y.; Shuai, J.; Shuai, Y.; Shi, L.; Lv, Z.-Y. Mechanical synergistic interaction between adjacent corrosion defects and its effect on pipeline failure. Pet. Sci. 2023, 20, 2452–2467. [Google Scholar] [CrossRef]
  35. Qin, G.; Huang, Y.; Wang, Y.; Cheng, Y.F. Pipeline condition assessment and finite element modeling of mechano-electrochemical interaction between corrosion defects with varied orientations on pipelines. Tunn. Undergr. Space Technol. 2023, 136, 105101. [Google Scholar] [CrossRef]
  36. Zhang, P.; Tang, X.; Li, H.; Liu, S. Limit width analysis of X80 corroded pipeline pass through landslide. Chin. J. Geol. Hazard Control 2022, 33, 47–54. [Google Scholar] [CrossRef]
  37. Arumugam, T.; Karuppanan, S.; Ovinis, M. Finite element analyses of corroded pipeline with single defect subjected to internal pressure and axial compressive stress. Mar. Struct. 2020, 72, 102746. [Google Scholar] [CrossRef]
  38. Kang, J.; Frazie, P.; Chai, H.Y. Soil–structure interaction for deeply buried corrugated steel pipes Part I: Embankment installation. Eng. Struct. 2008, 30, 384–392. [Google Scholar] [CrossRef]
  39. Gu, X.; Zhang, Y.; Huang, C.; Luo, X.; Zhang, H.; Zhou, R.; Qiu, Y. Sensitivity Analysis of Influencing Factors of Gas Pipelines with Corrosion Defects under the Action of Landslides. Energies 2022, 15, 6640. [Google Scholar] [CrossRef]
  40. Zhu, X.; Chen, J.; Du, Y. Limit load prediction analysis of X80 pipeline containing corrosion in mountainous landslide section. Geoenergy Sci. Eng. 2023, 229, 212107. [Google Scholar] [CrossRef]
  41. Liu, S.; Zhang, P.; Tang, Q.; Wu, S.; Huang, Y. A novel safety early warning methodology for pipelines under landslide geological hazard. J. Pipeline Syst. Eng. Pract. 2024, 15, 04023050. [Google Scholar] [CrossRef]
Figure 1. Landslide and displacement distribution: (a) landslide model and (b) fourth-power parabolic curve.
Applsci 13 12880 g001
Figure 2. Overview of working conditions and model: (a) on-site conditions; (b) model description; and (c) model meshing.
Applsci 13 12880 g002
Figure 3. Model dimension verification: (a) soil thickness; and (b) width of non-landslide area.
Applsci 13 12880 g003
Figure 4. Mesh validation for the model: (a) mesh distribution in wall thickness; and (b) mesh refinement.
Applsci 13 12880 g004
Figure 5. Mesh comparison for corrosion model.
Applsci 13 12880 g005
Figure 6. Stress curves for pipelines with varying corrosion lengths and depths: (a) schematic of the model; (b) 10 cm corrosion length; (c) 15 cm corrosion length; (d) 20 cm corrosion length; (e) 25 cm corrosion length; and (f) 30 cm corrosion length.
Applsci 13 12880 g006
Figure 7. Stress distribution in the pipeline with a corrosion depth of 0.25t: (a) maximum equivalent stress distribution with varying landslide displacements; (b) axial stress distribution in the pipeline; and (c) circumferential stress distribution in the pipeline.
Applsci 13 12880 g007
Figure 8. Stress distribution in the pipeline with a displacement of 0.5 m: (a) axial stress distribution with varying lengths; (b) axial stress distribution with varying depths; and (c) circumferential stress distribution.
Applsci 13 12880 g008
Figure 9. Distribution of limit displacement and safety range.
Applsci 13 12880 g009
Figure 10. Stress for different circumferential corrosion positions of the pipeline.
Applsci 13 12880 g010
Figure 11. Variation in equivalent stress with displacement for different defect angles: (a) 0–150° and (b) 180–330°.
Applsci 13 12880 g011
Figure 12. Stress distribution in the pipeline with varying landslide displacement across different angular directions.
Applsci 13 12880 g012
Figure 13. Comparison of maximum equivalent stress at corrosion and non-corrosion sites across different angular directions.
Applsci 13 12880 g013
Figure 14. Stress distribution and limit displacement: (a) circumferential stress distribution at 0.8 m displacement across different corrosion positions; and (b) limit displacement for various corrosion locations.
Applsci 13 12880 g014
Figure 15. Stress distribution cloud diagrams at different axial positions: (a) 0.5 m from pipeline center with corrosion; (b) 6 m from pipeline center with corrosion; (c) 6.5 m from pipeline center with corrosion; and (d) 12.5 m from pipeline center with corrosion.
Applsci 13 12880 g015
Figure 16. Stress variation for different axial corrosion positions in the pipeline.
Applsci 13 12880 g016
Figure 17. Axial stress distribution in the pipeline with displacement at typical corrosion locations: (a) corrosion at the pipeline center; (b) corrosion 3.5 m from the center; (c) corrosion 7.5 m from the center; and (d) corrosion 10.5 m from the center.
Applsci 13 12880 g017
Figure 18. Axial pipeline stress distribution.
Applsci 13 12880 g018
Figure 19. Limit landslide displacement for different axial corrosion positions.
Applsci 13 12880 g019
Figure 20. Stress in corroded pipeline without landslide impact.
Applsci 13 12880 g020
Figure 21. Limiting landslide displacement for specific corrosion dimensions.
Applsci 13 12880 g021
Table 1. Material parameters of X80 pipeline.
ρ (kg/m3)E (MPa)μD (mm)T (mm)[σ] (MPa)σs (MPa)
7850207,0000.3101618.2499555
Table 2. Properties of the soil.
ParametersE (MPa)μγ (kN/m3)Φ (°)C (kPa)
Landslide zone32.50.4201015
Non-landslide zone32.50.35202520
Table 3. Model verification.
ModelRR2MSEF-Test
Test value0.99280.96799.88321.95
Table 4. Model verification.
ModelRR2MSEF-Test
Test value0.99430.97324.797749.7363
Disclaimer/Publisher’s Note: The statements, opinions and data contained in all publications are solely those of the individual author(s) and contributor(s) and not of MDPI and/or the editor(s). MDPI and/or the editor(s) disclaim responsibility for any injury to people or property resulting from any ideas, methods, instructions or products referred to in the content.