Featured Application
A new non-destructive rapid prediction method for subsurface damage in ultra-precision grinding of fused silica optics has been proposed. By introducing damage precursor detection technologies, accurate prediction of subsurface damage in ultra-precision grinding can be achieved, which can effectively guide the subsequent polishing process.
Abstract
In order to achieve accurate prediction of subsurface damage (SSD) in ultra-precision grinding of high-performance ultra-violet laser-irradiated fused silica optics, the paper combines damage precursor multimodal measurement technology with magnetorheological finishing spot method detection. Various methods such as photothermal weak absorption and fluorescence confocal imaging are used for measuring the surface roughness and subsurface damage depth of a series of fused silica samples prepared under different ultra-precision grinding parameters. The correlation between surface roughness and subsurface damage depth in ultra-precision grinding based on laser damage performance is established using curve fitting. The results indicate that there is a metamorphic layer below the subsurface crack layer, which can cause additional photothermal absorption. Subsurface damage is constituted of the subsurface crack layer and metamorphic layer. Under ultra-precision grinding conditions, the maximum depth of subsurface damage is generally 2.00–4.22 times the depth of the subsurface damage cluster. The roughness Ra and the subsurface damage cluster depth correspond to SSD(cluster) = 195 × Ra − 0.13. The maximum depth of subsurface damage can be predicted by measuring the Ra value, by which accurate prediction of defect depth in ultra-precision grinding and guiding the high-performance manufacturing of ultra-violet laser-irradiated fused silica optics can be achieved.
1. Introduction
Fracture defects such as subsurface cracks caused by grinding are the manufacturing defects that are most likely to cause laser irradiation damage and must be completely removed in the subsequent polishing process so that the fused silica optics can withstand the irradiation of high-power lasers [1,2,3,4,5,6]. The polishing process is expensive, however, and requires a long process cycle. In order to save time and the economic cost of polishing, it is of great significance to accurately evaluate the manufacturing defects caused by ultra-precision grinding and formulate a reasonable polishing process to improve processing efficiency.
With the purpose of achieving non-destructive, fast and accurate subsurface damage (SSD) detection, scholars at home and abroad usually combine theoretical research with experimental measurement for verification, ending up by empirically predicting subsurface damage through surface roughness [7]. Lambropoulos et al. analyzed the PV linear relationship between subsurface damage depth and surface roughness based on indentation fracture mechanics theory [8,9]. Preston, Kachalov and, Hed et al., have established empirical formulas for the linear proportional ratio of subsurface damage depth and surface roughness based on experimental data [10,11]. On the basis of Lambropoulos, Li et al. established a theoretical nonlinear model to predict the depth of subsurface damage and studied the subsurface crack depth and surface roughness of BK7 glass after grinding and lapping, verifying the accuracy of the nonlinear model [10,12]. Li et al. established a nonlinear relationship model between subsurface damage depth and surface roughness Rz during BK7 grinding, which can not only evaluate the subsurface damage depth, but also guide the optimization of grinding parameters to reduce subsurface damage [13].
Researchers have carried out extensive and profound research on the relationship model between subsurface damage and surface roughness, and subsurface damage depth is well predicted in coarse grinding and even in finish grinding [14,15,16,17]. With the progress of grinding technology [18,19], however, the removal mechanism of grinding materials has gradually changed [20,21,22,23,24,25], and the removal mechanism of fused silica in ultra-precision grinding is at the stage of plastic embrittlement transition. Ductile domain removal is a non-negligible factor in the formation of surface/subsurface features in ultra-precision grinding, which leads to the existing empirical models of subsurface damage prediction facing three dilemmas: (a) the research results of traditional grinding are based on classical grinding dominated by brittle removal, which means that it may be difficult to apply the traditional empirical prediction model of subsurface damage to the ductility domain removal surface generated by ultra-precision grinding of fused silica; (b) the scale of subsurface manufacturing defects rapidly decreases from the micron scale to the submicron scale due to ductility domain removal, and it is more difficult to judge subsurface defects through microscopic observation relying on human eyes; (c) detection technology for traditional subsurface damage only has the geometric size and distribution of cracks in the characterization, which cannot reflect the distribution of other subsurface defects, and cannot offer the laser damage performance information of the ground subsurface, failing to guide the processing of high-performance ultra-violet laser-irradiated fused silica optics.
Therefore, it is necessary to reconsider the relationship between the surface integrity of fused silica optics and subsurface damage under ultra-precision grinding conditions, and to establish the relationship between subsurface depth and subsurface laser damage characteristics. This paper uses the detection combined multimodal measuring instrument for damage precursors with the magnetorheological finishing (MRF) spot method and uses two testing methods of photothermal weak absorption and fluorescence confocal to detect the ground subsurface damage, obtaining laser damage characteristic information to establish a correlation between subsurface depth, subsurface damage, and laser damage characteristics after ultra-precision grinding. A new subsurface damage depth prediction method based on laser damage performance correlation analysis is proposed, which provides direct processing guidance for the manufacture of high-performance ultra-violet laser-irradiated fused silica optics. The full text is structured as follows: Section 1 is an introduction, Section 2 introduces the grinding experiments and measurement methods, Section 3 presents the measurement results, Section 4 is a discussion about how to predict subsurface damage, and Section 5 summarizes the full text.
2. Experiments and Measurement Methods
The grinding experiment was conducted on the UPL-450 ultra-precision three-axis grinder developed by National University of Defense Technology [26], as shown in Figure 1. The ultra-precision grinder draws on the layout and structure of the ultra-precision lathe bed. The X-axis is used to adjust the lateral movement of the workpiece relative to the grinding wheel and to control the workpiece feed during the grinding process. The Z-axis is used to adjust the axial position of the grinding wheel relative to the workpiece and to control the feed in the cutting depth direction during the grinding process. The grinder adopts an open horizontal structure with air static pressure spindles for both the grinding wheel spindle and the workpiece rotary spindle. The grinding wheel spindle rotation accuracy is less than 50 nm, and the workpiece spindle rotation accuracy is less than 25 nm. The X-axis and Z-axis of the grinder′s translation axis both use liquid static pressure guides and nano-level drive feed control systems with linear motion accuracy better than 0.4 µm/400 mm, and the grinder takes measures of temperature control and vibration isolation. The grinding mode adopted is cross grinding. During the grinding process, the workpiece spindle and the grinding wheel spindle rotate simultaneously, and the Z-axis feeds slowly along the cutting depth direction. The process parameters of the grinding experiment are shown in Table 1. The grinding experimental parameters that affect the subsurface damage mainly include grain size of wheel, cutting speed, depth of cut, workpiece rotation speed and workpiece feed speed, etc. In order to explore the correlation relationship between subsurface depth, subsurface damage and laser damage characteristics after grinding, it was necessary to obtain different results of subsurface damage depth. Therefore, the cutting speed and depth of cut in grinding experiments were changed to obtain different results of subsurface damage. Meanwhile, a fine-grained grinding wheel, low workpiece rotation speed and low workpiece feed speed were chosen to achieve ultra-precision grinding and ensure good surface integrity of fused silica samples. The grinding wheels were diamond flake wheels with a grain size of 5 µm from Dr. Müller DIAMANTMETALL® AG, Weilheim, Germany. Moreover, the surface integrity and subsurface crack distribution of fused silica have been investigated under different depths of cut and cutting speeds in ultra-precision grinding in a previous study [26]. The published materials could provide references in terms of surface roughness and subsurface crack depth, but they did not involve the study of laser damage characteristics of fused silica. Based on the previous study, this work delves deeper into assessing subsurface laser damage characteristics by employing damage precursor multimodal analysis techniques, in order to obtain the correlation relationship between subsurface depth, subsurface damage and laser damage characteristics of fused silica after ultra-precision grinding. The fused silica samples in the experiment were sourced from Qinhuangdao Aouaquartz High-Technology Development Co., Ltd, Qinhuangdao, China. with a specimen size of Ø50 mm × 10 mm. The samples were processed by chemical mechanical polishing, and the surface roughness Ra was about 1 nm under a ZYGO NV700S white light interferometer. Cracks were not detected on the subsurface of the samples.
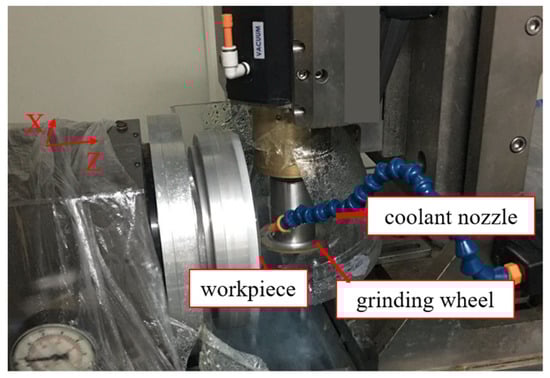
Figure 1.
The UPL-450 ultra-precision three-axis grinder.

Table 1.
Ultra-precision grinding experimental parameters.
Measurement of subsurface damage depth was carried out using the damage precursor multimodal measuring instrument combined with the MRF spot method. First, an MRF machine was used to throw two polishing wedges on the surface of the sample to be measured, as shown in Figure 2a. Two wedges of each sample were measured with the same test parameters. By averaging the test data of two MRF wedges, the SSD results of each sample were obtained. After polishing, the surface was covered with a hydrolytic layer to cover up the subsurface cracks. Next, the sample was shallowly etched with 5% hydrofluoric (HF) acid, which should be undertaken for 10–15 min to fully remove the hydrolytic layer and expose the subsurface defects, which is conducive to microscopic observation. After HF shallow etching, the one-dimensional profile measurement of the surface wedges of the sample was carried out, and the midline profile of the MRF wedges was measured by a high-precision three-dimensional profiler (as shown in Figure 2b) to obtain position information corresponding to different depths. Finally, the samples were placed in the damage precursor multimodal measuring instrument to investigate the laser damage characteristics of each sample at different depths on the subsurface. The instrument contains two test modules, the photothermal weak absorption and the in situ fluorescence confocal imaging. It should be noted that the photothermal weak absorption has a strong correlation with the laser-induced damage threshold of fused silica optics under ultra-violet laser irradiation [27]. By comparing the subsurface photothermal absorption value of fused silica optics, the increase or decrease in the subsurface laser damage performance of fused silica optics can be obtained easily. Hence, photothermal weak absorption analysis as a non-destructive testing method can be used to predict the laser damage performance of ground subsurface [28,29,30]. Fluorescence confocal imaging is also a powerful tool to measure low subsurface damage on ground fused silica [31]. The testing steps in the damage precursor multimodal measuring instrument were as follows:
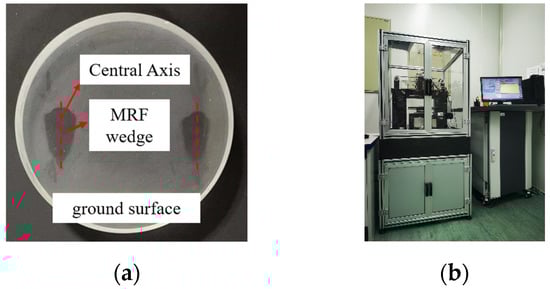
Figure 2.
MRF spot method to measure subsurface cracks after grinding: (a) sample surface and MRF wedges after HF shallow etching; (b) three-dimensional profilometer to measure the center line of the wedges.
(1) The photothermal weak absorption was tested in the MRF wedge area on the samples. In the photothermal weak absorption test, the wavelength of the pump laser was 355 nm, the power of the pump light was 4 W, the test mode was transmission mode, the step interval was 50 µm, and the scanning area was covered with MRF wedges. The accuracy of the test was approximately 0.1 ppm. After setting the test parameters, one can start the module to complete the photothermal weak absorption detection.
(2) The in situ fluorescence confocal imaging was conducted along the central axis of MRF wedges on the samples to obtain the evolution of subsurface damage in the depth direction. The fluorescence confocal imaging objective lens had a magnification of 20× with a field of view of 120 µm × 120 µm and the laser power was 40 mW. After setting the test parameters, one can read historical photothermal data from (1) mentioned above and select the positions along the central axis of the MRF wedge for continuous scanning imaging to complete the test. The repeated positioning accuracy was about ±1 µm and the defect detection resolution was approximately 1 µm. Continuous scanning imaging is constantly updating fluorescence confocal images in real-time in this module.
The characterization techniques for the ground subsurface were carried out using two test methods: photothermal weak absorption and fluorescence confocal imaging to obtain laser damage characteristic information, which is helpful for establishing the correlation relationship between subsurface depth, subsurface damage and laser damage characteristics after grinding, ending up with a new subsurface damage depth prediction method based on the laser damage characteristic information proposed.
3. Results
The MRF wedge area on the #1–#7 samples in Table 1 was first microscopically observed based on the traditional MRF spot method. Figure 3 shows a series of microscope images of subsurface cracks at different depths along the center line of the MRF wedge of sample 2#, which is a typical morphology of an ultra-precision grinding subsurface. The surface morphology after grinding mainly includes fracture pits, microcracks and grooves. Subsurface defects are mainly microcracks, and the quantity of cracks gradually decreases with the increase in depth. When the distance from the surface exceeds 3 µm, the microcracks disappear completely. It should be noted that when the distance from the surface reaches 2.9 µm, the quantity of subsurface cracks not only becomes scarce, but also its appearance size is further reduced, and it becomes increasingly difficult to judge subsurface defects through microscopic observations relying on human eyes. Moreover, in the entire measurement process, the characterization content of subsurface damage only includes the geometric size and distribution of cracks, and no information on the changes in subsurface laser damage performance is given, which cannot directly guide the subsequent polishing of ultra-violet laser-irradiated fused silica optics for improving laser damage performance.
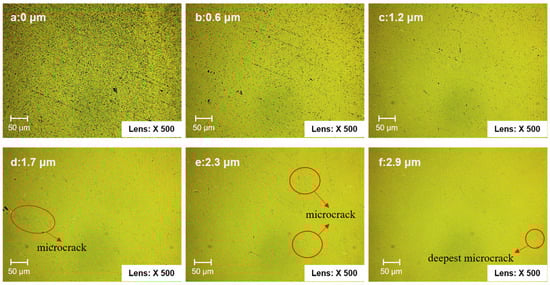
Figure 3.
Typical micromorphology of fused silica subsurface under an optical microscope: (a) subsurface depth 0 µm; (b) 0.6 µm; (c) 1.2 µm; (d) 1.7 µm; (e) 2.3 µm; (f) 2.9 µm.
Based on the MRF spot method, a further photothermal weak absorption analysis was performed on the MRF wedge area of samples #1–#7, as shown in Figure 4, to obtain the laser damage performance of each sample at different depths on the subsurface. Then, the test areas were selected at different depths along the central axis of the MRF wedge for in situ fluorescence confocal imaging to investigate the evolution of subsurface damage distribution in the depth direction.
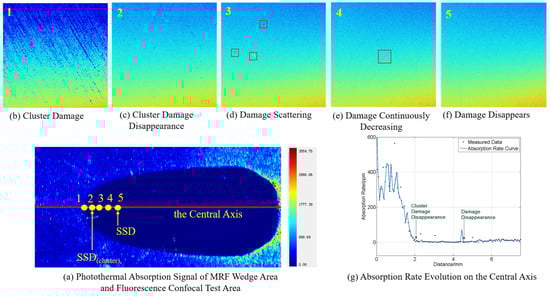
Figure 4.
Multimodal measurement of subsurface damage precursors of fused silica after grinding.
It can be observed that, due to the clustering of cracks (Figure 4b), the surface absorption value after grinding is unstable, but the surface absorption rate is generally high as the order of magnitude remains at hundreds of ppm. When the test depth increases along the central axis, the cluster cracks disappear (Figure 4c) and the photothermal absorption rate drops drastically, suggesting that the absorption level has reached the base level. The subsurface cracks generated by grinding are usually densely distributed in shallow areas. With the increase in depth, crack density gradually decreases. After exceeding a certain depth, the cracks are only sporadically distributed, and their distribution is inconsistent in different areas. Then the depth at which this densely distributed crack disappears is the crack cluster depth, which corresponds to the subsurface damage cluster depth (subsurface defect cluster depth), SSD(cluster) in the photothermal signal. After exceeding the subsurface damage cluster depth, some sporadic peaks still appear in the photothermal signal. The fluorescence confocal test identified that not only individual cracks, but also other defects cause additional absorption (Figure 4d). This individual damage may be caused by uncontrollable vibrations, transient changes in the external environment, large abrasive particles, etc. When these sporadic peaks disappear, the subsurface absorption characteristics of the sample are consistent with those of the matrix material, and no damage is found in the fluorescence confocal test (Figure 4f). The two results determine that the depth at which the absorption peak completely disappears is the maximum subsurface damage depth.
With the guidance of this method, we compared the MRF wedge central axis profile curve to determine the subsurface damage performance distribution characteristics of each sample. Figure 5 shows the photothermal signal changes along the central axis of the MRF wedge of seven samples under different grinding parameters and the corresponding MRF wedge central axis profile. Table 2 lists the SSD(cluster) and SSD results obtained by the damage precursor multimodal measuring instrument and compares them with the SSD(crack) measured by the traditional MRF spot method under the same experimental conditions as our previous research [26].
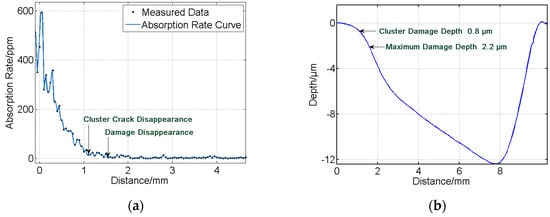
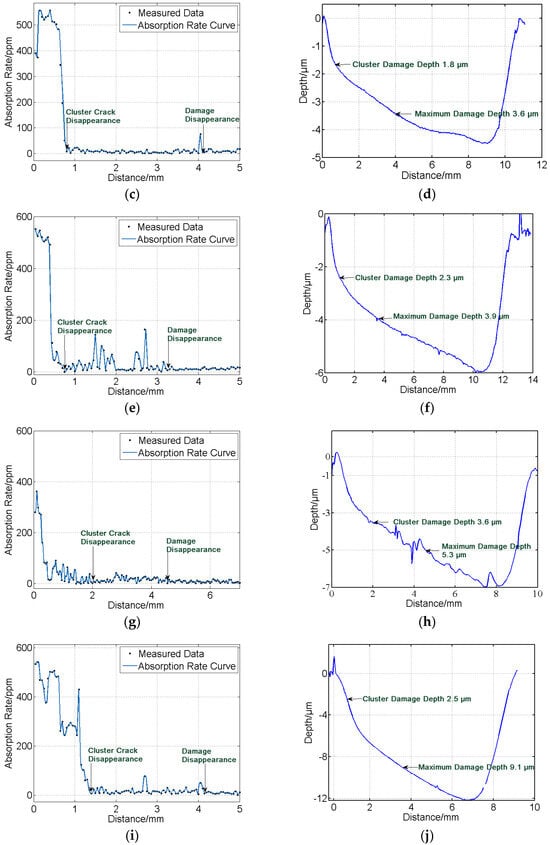
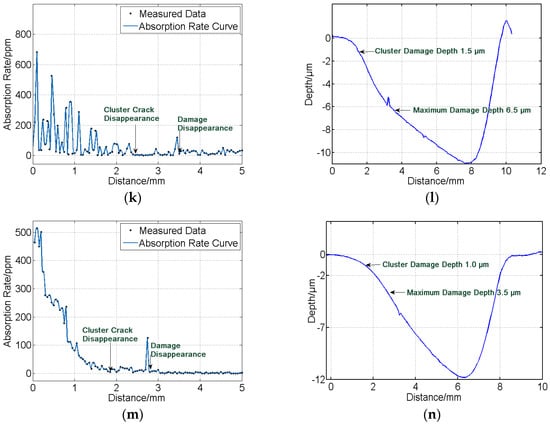
Figure 5.
Variation of subsurface photothermal absorption along the central axis of the MRF wedge of samples and the corresponding MRF wedge central axis profile: (a) photothermal signal of #1; (b) the central axis profile of the MRF wedge of #1; (c) photothermal signal of #2; (d) the central axis profile of the MRF wedge of #2; (e) photothermal signal of #3; (f) the central axis profile of the MRF wedge of #3; (g) photothermal signal of #4; (h) the central axis profile of the MRF wedge of #4; (i) photothermal signal of #5; (j) the central axis profile of the MRF wedge of #5; (k) photothermal signal of #6; (l) the central axis profile of the MRF wedge of #6; (m) photothermal signal of #7; (n) the central axis profile of the MRF wedge of #7.
Table 2.
Subsurface damage depth after ultra-precision grinding.
4. Discussion
To find a way out of the three dilemmas in existing empirical models of subsurface damage prediction, damage precursor multimodal measurement technologies were introduced into the detection of subsurface damage in ultra-precision grinding, and the subsurface damage depth results were different from previous subsurface crack results. It can be seen that the three defect depths generally have a relationship of SSD > SSD(crack) > SSD(cluster). The subsurface damage cluster depth is determined by the cluster crack depth, so it is usually the smallest one. Except for samples #3 and #4, the maximum depth of subsurface damage determined by the damage precursor multimodal tester was generally greater than the subsurface crack depth obtained by microscopic observation. Hed, Wang and other scholars also found a similar phenomenon [10,11]. Having chosen the constant chemical etching rate method and the angle polishing method to measure the subsurface damage depth, Hed found that the former measurement’s result was greater than the latter’s. He believed that the measurement deviation was caused by the residual stress layer under the crack layer [11]. Wang used the constant chemical etching rate method to measure the existence of a subsurface residual stress layer with a thickness of 10~20 µm after rough grinding using the #120 grinding wheel and the #80 grinding wheel [10]. However, there is no evidence in their study to suggest that the residual stress layer can cause additional laser absorption, and the residual stress layer actually affects the laser damage performance of optics. Under ultra-precision grinding conditions here, there is also a metamorphic layer under the subsurface crack. The metamorphic layer contains residual stress and even some other damage precursors that will cause additional absorption. The grinding parameters affect the thickness of the metamorphic layer and the crack depth. The thickness of the metamorphic layer is equivalent to the thickness of the subsurface crack, both of which are in the micron range. Hence, it is not comprehensive to characterize the subsurface damage depth only by the maximum crack depth. The subsurface damage layer is constituted by the metamorphic layer and the subsurface crack layer together. The actual subsurface damage layer depth is approximately:
The introduction of the damage precursor multimodal test method allows for characterization not only including subsurface cracks but also other absorbent damage precursors, resulting in obtaining maximum depths of subsurface defects. It should be noted that the anomalies (SSD less than SSD(crack)) seen in samples #3 and #4 may be due to the limitations of the MRF spot method. The irregular distribution of grinding-induced subsurface damage necessitates a certain scale within characterization methods to obtain relatively accurate maximum damage depth results. While the MRF spot method has a measurement area spanning several millimeters, outcomes obtained through this method only represent local maximum values. As depicted in Figure 3 and Figure 4, there is an exponential decrease in density of grinding-induced subsurface damage as depth increases, indicating that deeper damage is sparse and exhibits randomness. When the depth of the clustered defects is exceeded along the central axis produced by the MRF spot method, the grinding defects are distributed in a sporadic pattern, which is very likely to result in the phenomenon that there are no defects on the central axis, but there are defects in the adjacent regions at similar depths. This caused the small depth of subsurface damage in the damage precursor multimodal measurements for samples #3 and #4. The sporadic distribution of grinding defects at depth makes it very difficult to identify the maximum depth defects, and there is also a risk of significant deviation from the actual subsurface damage depth in the measurement results. Therefore, with the aim of avoiding this limitation within the MRF spot method, it is suggested that the subsurface damage depth be characterized by SSD(cluster). Cluster defects are very suitable for characterization due to their characteristic of appearing in clusters, and the measured photothermal weak absorption signals are obvious and easy to identify (the absorption signals appear to fall off a cliff, and there is a situation in which the absorption signal level reaches the basal level).
We used four surface roughness indicators (PV, Rz, Ra and RMS) to perform curve fitting on the SSD(cluster). The roughness results come from our previous research under the same ultra-precision grinding parameters [26]. Figure 6 shows the mathematical relationship between the SSD(cluster) and different surface roughness indicators, which are SSD(cluster) = 2.32 × PV − 0.03 (root mean square error, RMSE is 0.65), SSD(cluster) = 2.25 × Rz + 0.58 (RMSE is 0.71), SSD(cluster) = 195 × Ra − 0.13 (RMSE is 0.52) and SSD(cluster) = 120 × RMS + 0.15 (RMSE is 0.59). According to the smallest RMSE, it is found that Ra is the most suitable for predicting the SSD(cluster). Based on the prediction of the SSD(cluster), the SSD can be estimated through the ratio relationship of Formula (2) to ensure that the subsurface damage is completely removed in the subsequent polishing process.
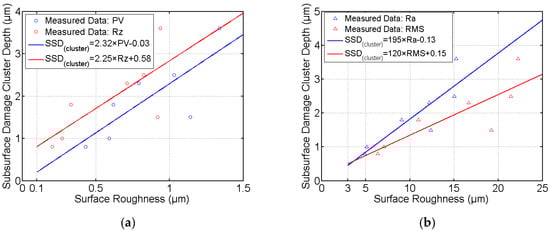
Figure 6.
Correlation between surface roughness and subsurface damage cluster depth: (a) PV and Rz; (b) Ra and RMS.
As a final note, the empirical model we have established is applicable to the cross-grinding mode described in Section 2. Different modes of ultra-precision grinding may yield varying results in terms of subsurface damage. Sun discussed the distinct impacts of parallel and cross-grinding modes on subsurface damage of BK7 glass and found that non-uniform wheel wear may result in a non-uniform distribution of subsurface damage [32]. In the future, we will delve deeper into the effects of different grinding modes on the distribution of subsurface damage, aiming to improve the accuracy and applicability of the empirical model we have established for fused silica.
5. Conclusions
The experiment studied the subsurface damage of fused silica in ultra-precision grinding. With the basis of the MRF spot method, combined with the multimodal test of the grinding subsurface damage precursor, the damage to the grinding subsurface was judged using photothermal weak absorption and fluorescence confocal imaging to obtain the laser damage characteristic information and establish the correlation between subsurface depth, subsurface damage and laser damage characteristics after grinding. There is also a metamorphic layer below the subsurface crack that will cause additional absorption. The subsurface damage was constituted by the subsurface crack layer and the metamorphic layer. Under ultra-precision grinding conditions, the depth of the metamorphic layer is close to that of the crack layer. The maximum depth of subsurface damage was generally 2.00 to 4.22 times the depth of subsurface damage cluster, and the roughness Ra and the subsurface damage cluster depth corresponded to SSD(cluster) = 195 × Ra − 0.13. The maximum depth of subsurface damage can be predicted by measuring the Ra value, and the subsurface damage depth can be accurately predicted to serve the high-performance manufacturing of ultra-violet laser-irradiated fused silica optics.
Author Contributions
Conceptualization, Y.Z. and M.X.; methodology, W.K. and Q.H.; validation, Z.L. and Y.Z.; investigation, Y.Z. and Z.L.; data curation, Y.Z. and Q.H.; writing—original draft preparation, Y.Z.; writing—review and editing, W.K. and Y.Z.; visualization, F.W. and Y.F.; supervision, W.K. and F.X.; project administration, M.X. and F.X. All authors have read and agreed to the published version of the manuscript.
Funding
The National Natural Science Foundation of China (52105496, 12204546).
Institutional Review Board Statement
Not Applicable.
Informed Consent Statement
Not Applicable.
Data Availability Statement
The data presented in this study are available in article.
Conflicts of Interest
The authors declare no conflicts of interest.
References
- Bude, J.; Miller, P.; Baxamusa, S.; Shen, N.; Laurence, T.; Steele, W.; Suratwala, T.; Wong, L.; Carr, W.; Cross, D.; et al. High fluence laser damage precursors and their mitigation in fused silica. Opt. Express 2014, 22, 5839–5851. [Google Scholar] [CrossRef] [PubMed]
- Ye, H.; Li, X.; Jiang, C. Etching behavior of ground fused silica and light enhancement modulated by surface/subsurface cracks. Int. J. Appl. Glass Sci. 2022, 13, 664–675. [Google Scholar] [CrossRef]
- Suratwala, T.; Wong, L.; Miller, P.; Feit, M.; Menapace, J.; Steele, R.; Davis, P.; Walmer, D. Sub-surface mechanical damage distributions during grinding of fused silica. J. Non-Cryst. Solids 2006, 352, 5601–5617. [Google Scholar] [CrossRef]
- Campbell, J.H.; Hawley-Fedder, R.; Stolz, C.J.; Menapace, J.A.; Borden, M.R.; Whitman, P.; Yu, J.; Runkel, M.; Riley, M.; Feit, M.; et al. NIF optical materials and fabrication technologies: An overview. In Proceedings of the SPIE—The International Society for Optical Engineering, San Diego, CA, USA, 15–19 March 2004. [Google Scholar]
- Shi, F.; Shu, Y.; Song, C.; Tian, Y.; Tie, G.; Xue, S.; Xiao, H. Advances in shape controllable and property controllable manufacturing technology for ultraviolet fused silica components with high precision and few defects. High Power Laser Part. Beams 2020, 32, 032002. [Google Scholar]
- Li, Y.; Zheng, N.; Li, H.; Hou, J.; Lei, X.; Chen, X.; Yuan, Z.; Guo, Z.; Wang, J.; Guo, Y.; et al. Morphology and distribution of subsurface damage in optical fused silica parts: Bound-abrasive grinding. Appl. Surf. Sci. 2011, 257, 2066–2073. [Google Scholar] [CrossRef]
- Cui, Y.; Wang, C.; Liu, X.; Wu, Y.; Li, Z.; Li, R.; He, W. A review of subsurface damage detection methods for optical components. AIP Adv. 2023, 13, 060702. [Google Scholar] [CrossRef]
- Randi, J.A.; Lambropoulos, J.C.; Jacobs, S.D. Subsurface damage in some single crystalline optical materials. Appl. Opt. 2005, 44, 2241–2249. [Google Scholar] [CrossRef] [PubMed]
- Lambropoulos, J.C.; Li, Y.; Funkenbusch, P.; Ruckman, J.L. Noncontact estimate of grinding-induced subsurface damage. In Proceedings of the Optical Manufacturing and Testing III, Denver, CO, USA, 20–23 July 1999. [Google Scholar]
- Wang, Z. Study on the Detection and Control Techniques of Subsurface Damage in Optical Fabrication. Doctoral Dissertation, National University of Defense Technology, Changsha, China, 2008. [Google Scholar]
- Hed, P.P.; Edwards, D.F. Optical glass fabrication technology 2: Relationship between surface roughness and subsurface damage. Appl. Opt. 1987, 26, 4677–4680. [Google Scholar] [CrossRef] [PubMed]
- Li, S.; Wang, Z.; Wu, Y. Relationship between subsurface damage and surface roughness of optical materials in grinding and lapping processes. J. Mater. Process. Technol. 2008, 205, 34–41. [Google Scholar] [CrossRef]
- Li, H.; Yu, T.; Zhu, L.; Wang, W. Evaluation of grinding-induced subsurface damage in optical glass BK7. J. Mater. Process. Technol. 2016, 229, 785–794. [Google Scholar] [CrossRef]
- Xiao, H.; Chen, Z.; Wang, H.; Wang, J.; Zhu, N. Effect of grinding parameters on surface roughness and subsurface damage and their evaluation in fused silica. Opt. Express 2018, 26, 4638–4655. [Google Scholar] [CrossRef] [PubMed]
- Jiang, C.; Cheng, J.; Wu, T. Theoretical model of brittle material removal fraction related tosurface roughness and subsurface damage depth of optical glass during precision grinding. Precis. Eng. 2017, 49, 421–427. [Google Scholar] [CrossRef]
- Xiao, H.; Yin, S.; Wang, H.; Liu, Y.; Wu, H.; Liang, R.; Cao, H. Models of grinding-induced surface and subsurface damages in fused silica considering strain rate and micro shape/geometry of abrasive. Ceram. Int. 2021, 47, 24924–24941. [Google Scholar] [CrossRef]
- Gao, S.; Geng, Z.; Wu, Y.; Wang, Z.; Kang, R. Surface Integrity of Quartz Glass Induced by Ultra-precision Grinding. J. Mech. Eng. 2019, 55, 186–195. [Google Scholar] [CrossRef]
- Jiang, Z.; Li, C.; Sun, L.; Duan, D.; Kang, C.; Chen, S.; Lin, Q.; Yang, S. Ultra-Precision Machining Technology and Equipment for High-End Optical Elements. Strateg. Study CAE 2023, 25, 131–141. [Google Scholar] [CrossRef]
- Fang, F.; Zhang, N.; Guo, D.; Ehmann, K.; Cheung, B.; Liu, K.; Yamamura, K. Towards atomic and close-to-atomic scale manufacturing. Int. J. Extrem. Manuf. 2019, 1, 012001. [Google Scholar] [CrossRef]
- Brinksmeier, E.; Mutlugünes, Y.; Klocke, F.; Aurich, J.C.; Shore, P.; Ohmori, H. Ultra-precision grinding. CIRP Ann. Manuf. Technol. 2010, 59, 652–671. [Google Scholar] [CrossRef]
- Onwuka, G.; Abou-EI-Hossein, K. Surface roughness in ultra-high precision grinding of BK7. Procedia CIRP 2016, 45, 143–146. [Google Scholar] [CrossRef][Green Version]
- Zhang, S.; To, S.; Wang, S.; Zhu, Z. A review of surface roughness generation in ultra-precision machining. Int. J. Mach. Tools Manuf. 2015, 91, 76–95. [Google Scholar] [CrossRef]
- Ohmori, H.; Umezu, S.; Kim, Y.; Uehara, Y.; Kasuga, H.; Kato, T.; Itoh, N.; Kurokawa, S.; Kusumi, T.; Sugawara, Y.; et al. A high quality surface finish grinding process to produce total reflection mirror for X-ray fluorescence analysis. Int. J. Extrem. Manuf. 2020, 2, 015101. [Google Scholar] [CrossRef]
- Abdulkadir, L.N.; Abou-El-Hossein, K.; Jumare, A.I.; Odedeyi, P.B.; Liman, M.M.; Olaniyan, T.A. Ultra-precision diamond turning of optical silicon—A review. Int. J. Adv. Manuf. Technol. 2018, 96, 173–208. [Google Scholar] [CrossRef]
- Gao, S.; Zhu, L.; Kang, R.; Guo, D.; Wang, Z.; Zhang, B. Surface/Subsurface Damage and Material Removal Mechanism of Glass-ceramics Induced by Ultra-precision Grinding. J. Mech. Eng. 2017, 53, 180–187. [Google Scholar] [CrossRef]
- Zhong, Y.; Dai, Y.; Xiao, H.; Shi, F. Experimental study on surface integrity and subsurface damage of fused silica in ultra-precision grinding. Int. J. Adv. Manuf. Technol. 2021, 115, 4021–4033. [Google Scholar] [CrossRef]
- Huang, J.; Wang, F.; Liu, H.; Geng, F.; Jiang, X.; Sun, L.; Ye, X.; Li, Q.; Wu, W.; Zheng, W.; et al. Non-destructive evaluation of UV pulse laser-induced damage performance of fused silica optics. Sci. Rep. 2017, 7, 16239. [Google Scholar] [CrossRef]
- Zhong, Y.; Dai, Y.; Tian, Y.; Shi, F. Effect on nanoscale damage precursors of fused silica with wet etching in KOH solutions. Opt. Mater. Express 2021, 11, 884–894. [Google Scholar] [CrossRef]
- Zhong, Y.; Shi, F.; Tian, Y.; Dai, Y.; Song, C.; Zhang, W.; Lin, Z. Detailed near-surface nanoscale damage precursor measurement and characterization of fused silica optics assisted by ion beam etching. Opt. Express 2019, 27, 10826–10838. [Google Scholar] [CrossRef]
- Xu, M.; Shi, F.; Zhou, L.; Dai, Y.; Peng, X.; Liao, W. Investigation of laser-induced damage threshold improvement mechanism during ion beam sputtering of fused silica. Opt. Express 2017, 25, 29260–29271. [Google Scholar] [CrossRef]
- Neauport, J.; Cormont, P.; Legros, P.; Ambard, C.; Destribats, J. Imaging subsurface damage of grinded fused silica optics by confocal fluorescence microscopy. Opt. Express 2009, 17, 3543–3554. [Google Scholar] [CrossRef]
- Sun, X.; Stephenson, D.; Ohnishi, O.; Baldwin, A. An investigation into parallel and cross grinding of BK7 glass. Precis. Eng. 2006, 30, 145–153. [Google Scholar] [CrossRef]


Disclaimer/Publisher’s Note: The statements, opinions and data contained in all publications are solely those of the individual author(s) and contributor(s) and not of MDPI and/or the editor(s). MDPI and/or the editor(s) disclaim responsibility for any injury to people or property resulting from any ideas, methods, instructions or products referred to in the content. |
© 2024 by the authors. Licensee MDPI, Basel, Switzerland. This article is an open access article distributed under the terms and conditions of the Creative Commons Attribution (CC BY) license (https://creativecommons.org/licenses/by/4.0/).