Abstract
This research investigates the feasibility of using smartphones as reliable instruments to measure vehicle deceleration under different conditions and compares their accuracy and reliability with traditional decelerometers. The research was conducted using a passenger vehicle (Audi A6 Avant) on different road surfaces—dry, wet, and gravel—at several speed intervals (30, 50, 70, and 90 km/h). The vehicle was equipped with an XL Meter decelerometer and three different smartphones in different price ranges. Each device recorded deceleration data, which was then analyzed to evaluate accuracy and reliability. The findings show that while the smartphones show promising results on dry and gravel surfaces, their accuracy decreases at lower speeds and on wet surfaces due to the limitations of the sensors in detecting subtle deceleration values. The research also highlights that mid-range smartphones can perform comparably to higher-end models, suggesting that excessive investment in more expensive technology may not be necessary for scientific purposes. However, some differences in measurements are attributed to variations in device mounting and orientation sensitivity. In conclusion, this research supports the potential of integrating smartphone technology in vehicle testing for road safety, although it highlights critical limitations that need to be addressed for standardized use.
1. Introduction
Accurately measuring vehicle deceleration is crucial for evaluating traffic safety and the performance of braking systems. Traditionally, this has been achieved using specialized instruments like decelerometers, which provide the precise data needed to enhance vehicle dynamics and safety features. These instruments are the standard in certification and safety tests, ensuring the highest levels of accuracy and reliability.
However, the rise of smartphone technology presents a viable alternative. Modern smartphones are equipped with advanced accelerometers and gyroscopes capable of recording acceleration and deceleration values. In some cases, these embedded sensors can match the performance of dedicated measuring devices. There are several instances where utilizing smartphones for this purpose is both practical and advantageous, for example:
- In educational and training settings, smartphones can be utilized for a variety of purposes, including teaching traffic safety and the physics of vehicle movement. Students can gain practical experience in the principles of deceleration measurement without the need for expensive specialized equipment.
- In the initial stages of research, where the need for extreme accuracy is not paramount, smartphones can serve as a cost-effective data collection tool. This enables researchers to rapidly collect and analyze data before resorting to more sophisticated and costly equipment.
- In the event of a traffic accident or other emergency, smartphones can provide immediate data on vehicle deceleration, which can be useful for analysis and decision-making before the arrival of professional teams and equipment (e.g., experts in road transport).
This study is motivated by the potential of smartphones to serve as cost-effective and easily accessible tools for measuring vehicle deceleration. The primary objective is to assess the accuracy and reliability of smartphones in various conditions, including dry, wet, and gravel roads. Additionally, we aim to compare the performance of smartphones with traditional decelerometers and provide a comprehensive analysis of their effectiveness in real-world scenarios.
In the field of brake system testing and methodological studies, various innovative techniques and tools have recently been explored to evaluate vehicle performance under different conditions. Peter Kožuch et al. [1] evaluated the braking systems of intercity buses through both dynamic and stationary tests, finding that dynamic tests, although more complex, provide a more accurate reflection of real-world capabilities compared to the faster and safer stationary tests. Meanwhile, Andrii Kashkanov and his colleagues [2] presented a mathematical model to improve the accuracy of traffic accident analysis by estimating vehicle stopping distances, which integrates different methodological approaches and shows promising validation results. In another study by A. A. Kashkanov et al. [3], they proposed an adaptive system that estimates the coefficient of friction between the tire and the road using data from tire-road interaction during emergency braking, using a self-learning neuro-fuzzy system to increase the reliability in traffic accident investigation. Peter Kuchar et al. [4] evaluated the accuracy of various devices used in dynamic vehicle testing, highlighting the accuracy of a specially designed 5th wheel device compared to other technologies such as GPS and accelerometers. Finally, Ján Ondruš and Peter Hockicko [5] compared traditional decelerometer equipment with a new method of video analysis, finding a strong correlation between the two when measuring braking parameters, suggesting that video analysis could be a cost-effective alternative for educational purposes or in scenarios where specialized equipment is lacking.
The literature on brake system modifications and performance analysis shows significant advances in vehicle safety technology and brake system optimization. Kyunghan Min et al. [6] developed a deep neural network that predicts vehicle deceleration during braking, which is crucial for improving regenerative braking systems in electric vehicles and integrating autonomous vehicle control with human driving behavior. Tang Tianchi et al. [7] investigated the braking distance of vehicles on different road surfaces, demonstrating that smartphones can accurately measure braking parameters, which helps in traffic safety and accident analysis. A study by Dalibor Viderščak [8] analyzed the relationship between brake pad quality and braking deceleration, highlighting the better deceleration of more expensive pads, especially in extreme conditions. Zdravko Ivanov [9] compared vehicles with and without an anti-lock braking system (ABS), showing that ABS improves safety by allowing faster deceleration and shorter stopping distances. Bojana M. Bošković et al. [10] investigated how brake pressure affects component temperature and vehicle performance, finding that higher pressure improves deceleration and shortens stopping distance. Another study [11] looked at the effects of modifying brake disc diameters on a Volkswagen Golf II, highlighting the risks of unauthorized changes and the benefits of adhering to the manufacturer’s specifications. Finally, Nerijus Kudarauskas [12] investigated the effect of ABS on braking dynamics and provided data confirming the effectiveness of ABS in improving control and shortening braking distances at higher speeds.
Recent studies on braking dynamics and safety under different conditions have significantly advanced our understanding of vehicle behavior and traffic safety. Bayu Erfianto and Andrian Rahmatsyah [13] developed a vehicle data logger that classifies braking behavior into comfort, discomfort, and hazard levels using a Fuzzy Inference System, thus improving the forensic analysis of traffic accidents and vehicle safety. Tomas Skrucany, Jan Vrabel, and Patrik Kazimir [14] investigated the effect of weight and load distribution on braking deceleration of a Citroën Jumper and found that optimal loading of the load near the rear axle improves braking efficiency. Peter Marienka et al. [15] investigated the benefits of trailer-mounted trailer braking systems, demonstrating better matching to the braking deceleration of the autonomous vehicle and improved safety. Akhilesh Kumar Maurya and Prashant Shridhar Bokare [16] analyzed deceleration patterns on the Nagpur-Mumbai expressway, highlighting the importance of vehicle speed in determining deceleration times and distances for traffic safety and engineering. In addition, a study [17] investigating the mean fully developed deceleration threshold (MFDD) developed a formula that relates the MFDD to the initial braking speed and occupant capacity, thus refining the evaluation of the braking deceleration of vehicles under different driving conditions. Another study [18] proposed a method for online monitoring of vehicle braking deceleration using MFDD that integrates data from gyroscopes, brake pedal sensors, and CAN bus to provide accurate evaluation. In addition, Lisardo Prieto González et al. [19] presented a deep learning model to estimate vehicle roll and sideslip angles, demonstrating the potential of artificial intelligence in autonomous vehicle safety systems.
In the field of autonomous and intelligent braking systems, recent studies have used advanced artificial intelligence techniques to improve vehicle safety and passenger comfort. Shen Zhang and his colleagues [20] developed a back-propagation (BP) neural network to predict vehicle braking deceleration, which effectively models complex driving dynamics. This optimization and validation of the BP neural network demonstrates its potential for integration into intelligent driving systems and autonomous vehicles with a strong emphasis on improving traffic safety. At the same time, Myeong Hwan Hwang et al. [21] presented a comfort regenerative braking system (CRBS) for autonomous vehicles with artificial intelligence that controls braking force to keep acceleration and jerk within certain limits, thus maximizing occupant comfort and energy efficiency. The system has been validated through simulations in Car Sim and MATLAB/Simulink, showing how artificial intelligence can improve the interaction between vehicle operation and occupant comfort. In addition, another study [22] investigated the effect of brake pedal force on braking distance in heavy vehicles in wet conditions, using multi-body dynamics simulation to identify the non-linear relationship between brake pedal force and braking distance. This research highlights the critical influence of pedal force on braking deceleration, noting, in particular, its interaction with vehicle speed and weight, which is crucial for improving road safety in severe conditions.
Recent studies in the field of human factors and traffic safety offer fundamental insights into how human perception and vehicle behavior affect safety. Claudia Ackermann et al. [23] investigated how pedestrians perceive vehicle deceleration as a communication signal from automated vehicles, finding that faster deceleration at lower speeds and the presence of larger vehicles significantly improve the clarity of intent to stop, with this perception remaining consistent across different lighting conditions. Christian J. R. Samson and colleagues [24] further investigated the factors influencing stopping distance (SSD) in highway design, noting that deceleration rate, perception, and reaction time vary with different surface conditions, vehicle types, and driving scenarios. This research highlights the importance of incorporating different reaction times and deceleration rates into highway design to better account for real-world driving conditions and improve road safety.
Recent advancements in vehicle navigation and safety systems leverage deep learning, neural network controllers, personalized deceleration models, and sensor data fusion techniques. Jingxian Wang and colleagues [25] introduced a deep learning method integrating GNSS, IMU, barometer, and DeepOdometry data via an Extended Kalman Filter, achieving accurate pitch and heading estimations within one degree, enhancing navigation in GNSS-denied areas. Valery Vodovozov et al. [26] developed a neural network controller for electric vehicle braking, blending electrical and friction brakes to maximize energy recovery and outperforming traditional PID controllers in braking performance and energy efficiency. A study [27] on deceleration prediction models tailored to individual drivers improved regenerative braking by adapting to unique braking behaviors, enhancing comfort and efficiency. Panagiotis Lytrivis, George Thomaidis, and Angelos Amditis [28] emphasized the importance of sensor data fusion, integrating information from various sensors to enhance vehicle safety systems and proposing future integration with wireless communications.
Mobile technology is undergoing a revolution with the advent of affordable systems designed to monitor and enhance driver behavior. This is particularly important in developing nations, where road safety is a pressing concern. Md. Sakibur Rahman Sajal, Maliha Jahan, and Dr. Salekul Islam [29] have developed a system that utilizes smartphones equipped with accelerometers and GPS to identify rough driving actions. Pushpendra Singh, Nikita Juneja, and Shruti Kapoor [30] developed a mobile application that employs GPS, accelerometers, and microphones to detect driving behaviors and support law enforcement efforts. Minglin Wu, Sheng Zhang, and Yuhan Dong [31] designed a driving behavior recognition system using motion sensors and a Kalman filter, achieving an accuracy rate of 93.25%. These studies demonstrate the significant potential of mobile technologies in promoting road safety.
Compared to these studies, our work focuses on the measurement of deceleration under different weather and road conditions. Our results show that smartphones can provide reliable data even in more challenging conditions, expanding the possibilities of their real-world applications. A more detailed examination of the utilization of MEMS sensors and smartphones is provided by studies [32,33] that investigate their accuracy and reliability in a multitude of applications, including vehicle acceleration and deceleration measurement, motion tracking, and vehicle dynamics analysis.
2. Materials and Methods
2.1. Measuring Equipment
Several types of equipment are available for making measurements. It is necessary to choose the right device for our type of measurement. We also need to choose the appropriate software that can evaluate the data we collect.
2.1.1. Decelerometer
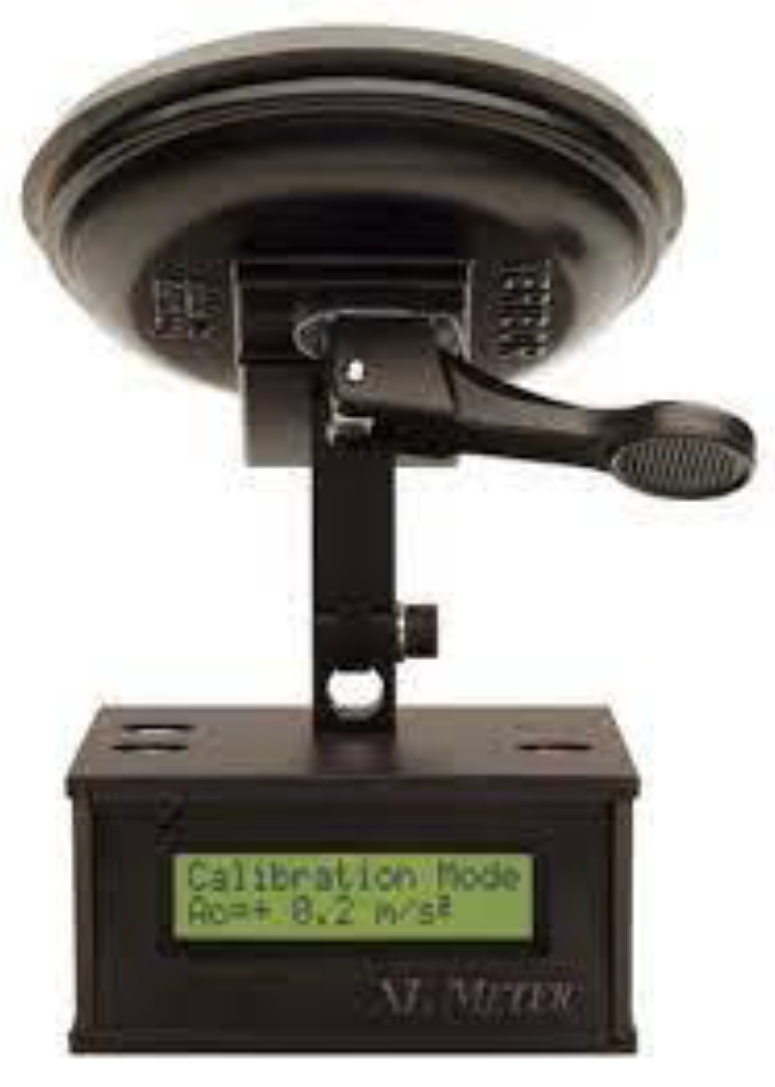
The XL Meter (Figure 1) is a measuring device designed to quantify the deceleration and acceleration parameters of a vehicle, as well as to record other relevant data. The design of the device includes three key components: a primary measuring unit housed in an aluminium housing for acceleration analysis, an articulated arm to allow accurate calibration of the device to a reference (zero) position when mounted on the vehicle, and a suction cup for a stable attachment. A connector on the rear of the device is provided for interfacing with external devices. Communication with a computer and data transfer is via an RS-232 interface using a nine-pin D-USB connector.

Figure 1.
Decelorometer XL Meter [34].
Figure 1.
Decelorometer XL Meter [34].
2.1.2. Smartphones
An alternative measurement method is smartphones, which use a combination of two sensors, a gyroscope and an accelerometer, to record acceleration. The gyroscope, a key element in any modern smartphone, is electronically designed to improve accuracy and minimize dimensionality and is typically used in the range of 1 to 1000 μm. In practice, MEMS gyroscopes (microelectromechanical systems) are often used. This sensor measures the tilt of the device, but for accurate acceleration recording it must be complemented by an accelerometer. The accelerometer effectively detects changes in acceleration, vibration, and tilt of the device in a three-dimensional space, allowing accurate tracking of positional changes of the smartphone (see Figure 2).
In papers [35,36,37], the authors point out the versatility of smartphone sensors in monitoring driver behavior and human activities. Using machine learning algorithms such as artificial neural networks and K-nearest neighbors, researchers have effectively detected abnormal driving patterns and classified physical activities. These applications range from improving road safety to improving health monitoring, demonstrating the significant potential of mobile sensor technology.
Three smartphones from different price segments were analyzed in this study. The 2018 Huawei Mate 20 represents the lower price range and is equipped with Android 9 along with an 8-core processor. This model symbolizes accessible smartphones that are affordable and easy to obtain on the market. The mid-range smartphone, Xiaomi Redmi 5G, which was launched in 2020, runs on the Android 11 operating system and also features an 8-core processor. A significant improvement is the use of six Cortex A-55 cores clocked at 2.0 GHz, which is an upgrade over the weaker cores in the lower-end category. At the top of the range is the 2021 Xiaomi 11T, representing the highest price range. This model features the same Android 11 operating system, but its processor uses more powerful Cortex cores at 3.0 GHz and 2.6 GHz, making it one of the most technologically advanced smartphones on the market.
The use of these three smartphones (Figure 2) was not only to compare whether they can be used as a replacement for a calibrated measuring device but also to compare whether it is necessary to provide a more expensive version to perform the measurements or whether a cheaper version can also do the job.
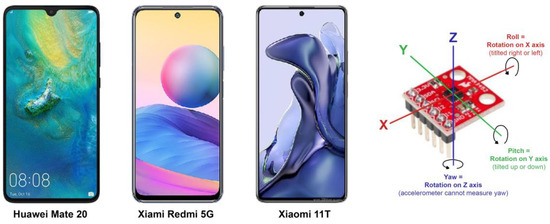
Figure 2.
Smartphones (left) [38,39,40] and Smartphone accelerometer (right).
Figure 2.
Smartphones (left) [38,39,40] and Smartphone accelerometer (right).

For the measurement, an accelerometer analyzer app was used to record acceleration using the accelerometer on the smartphone. This app, unlike the XL Meter, records acceleration in the three axes x, y, and z. Before the measurement, the smartphone was fixed in a holder on the windscreen of the vehicle and the settings of the app were checked, which were as follows:
- -
- sensor speed—fastest;
- -
- sensor units—meters;
- -
- writing setting—number separator—space.
The smartphone was fixed in an upright position using the best-level app, which serves as a digital spirit level. This app uses the smartphone’s built-in gyroscope to determine the position and tilt of the device, allowing both graphical and numerical displays of the tilt angle. Once the smartphone was attached, measurements began to be taken. Similar to the XL Meter, data logging was started, a driving test was performed, and the resulting data were saved to a text file.
2.2. Vehicle
The passenger car (Figure 3) used for the measurements was an Audi A6 Avant, the detailed technical specifications of which are given in Table 1. This table contains comprehensive data such as the weight of the vehicle, the type of powertrain used, the current condition of the braking system, and the types of tires fitted to the vehicle. The Audi A6 Avant in question belongs to the fourth generation of this model range, which was produced in 2017. The vehicle was fitted with Continental PremiumContact 6 summer tires with dimensions 225/50 R18, a load index of 90 (690 kg), and a speed index W of 270 km/h. At the time of measurement, the tires had a mileage of approximately 1000 km and a tread thickness of 7 mm.
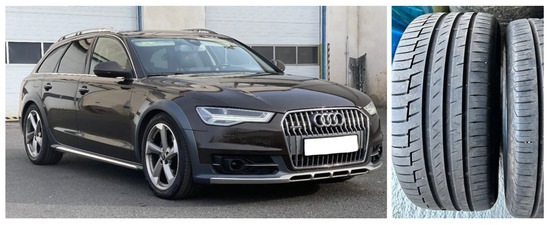
Figure 3.
Vehicle used in the study.

Table 1.
Parameters of the vehicle.
2.3. Measurement Location
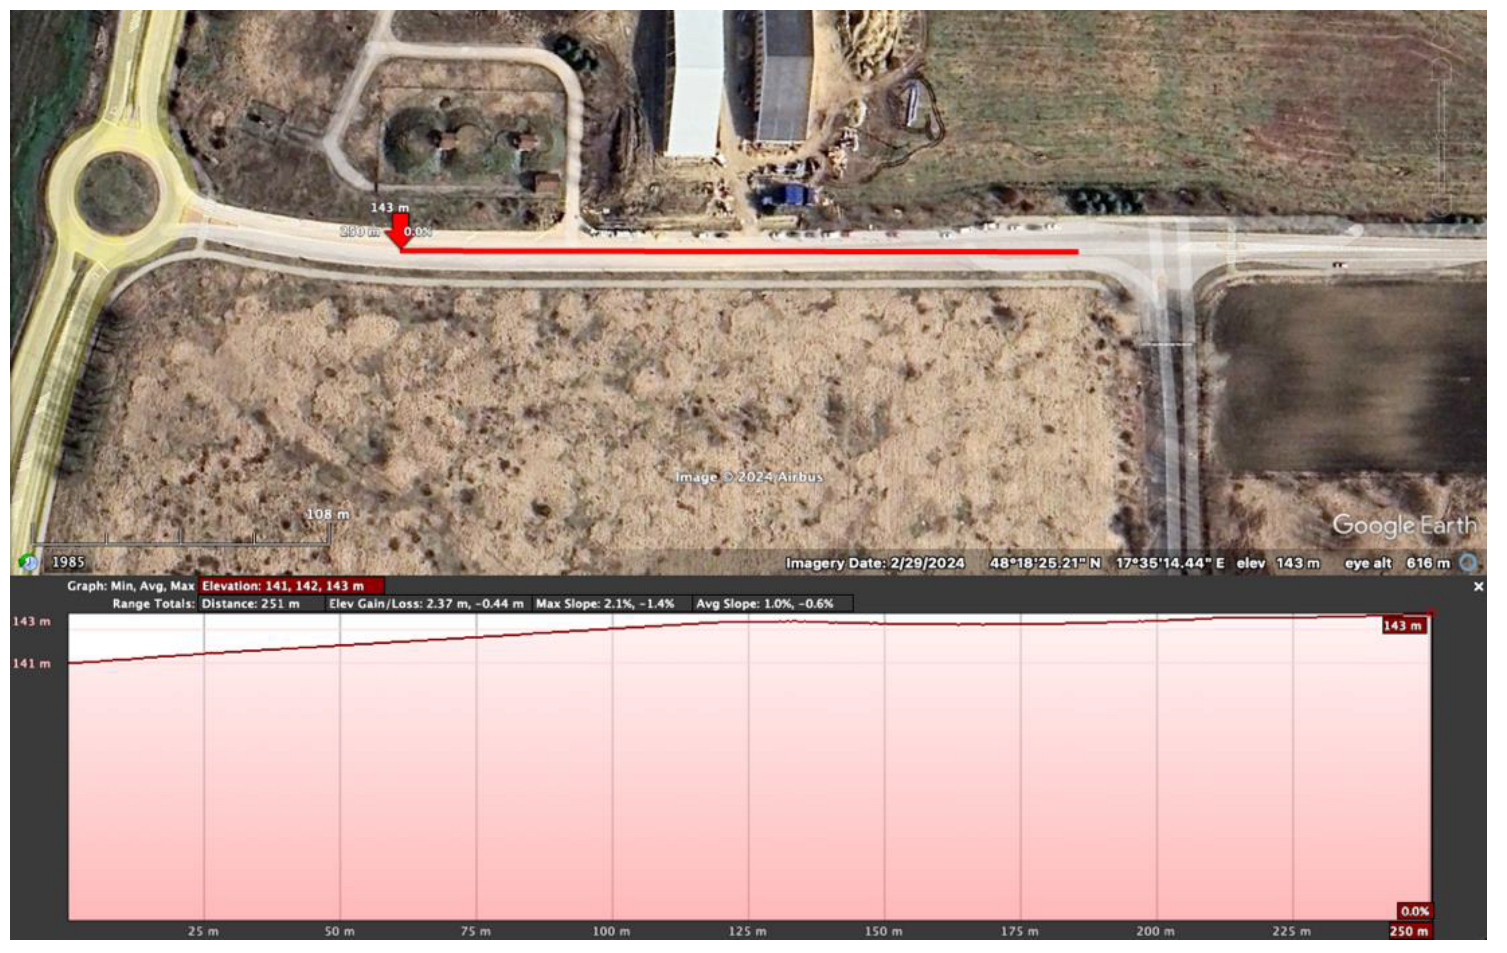
A local road (Figure 4) near the village of Voderady in the Galanta district was used for the measurements. The measurements were carried out on 2 April 2022 (Saturday). The air temperature ranged from 5 °C to 12 °C. The road temperature was between 8 °C and 11 °C. The road surface consisted of asphalt with a grain size of 1 to 10 mm and a prescribed cross slope.
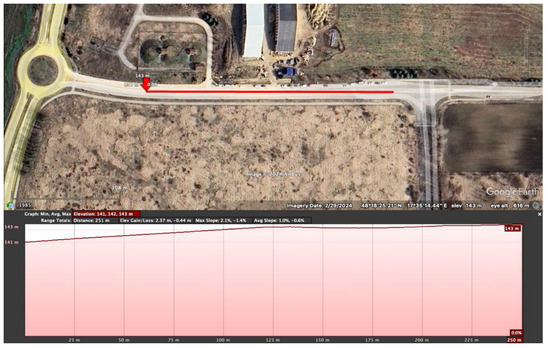
Figure 4.
Measurement location [41].
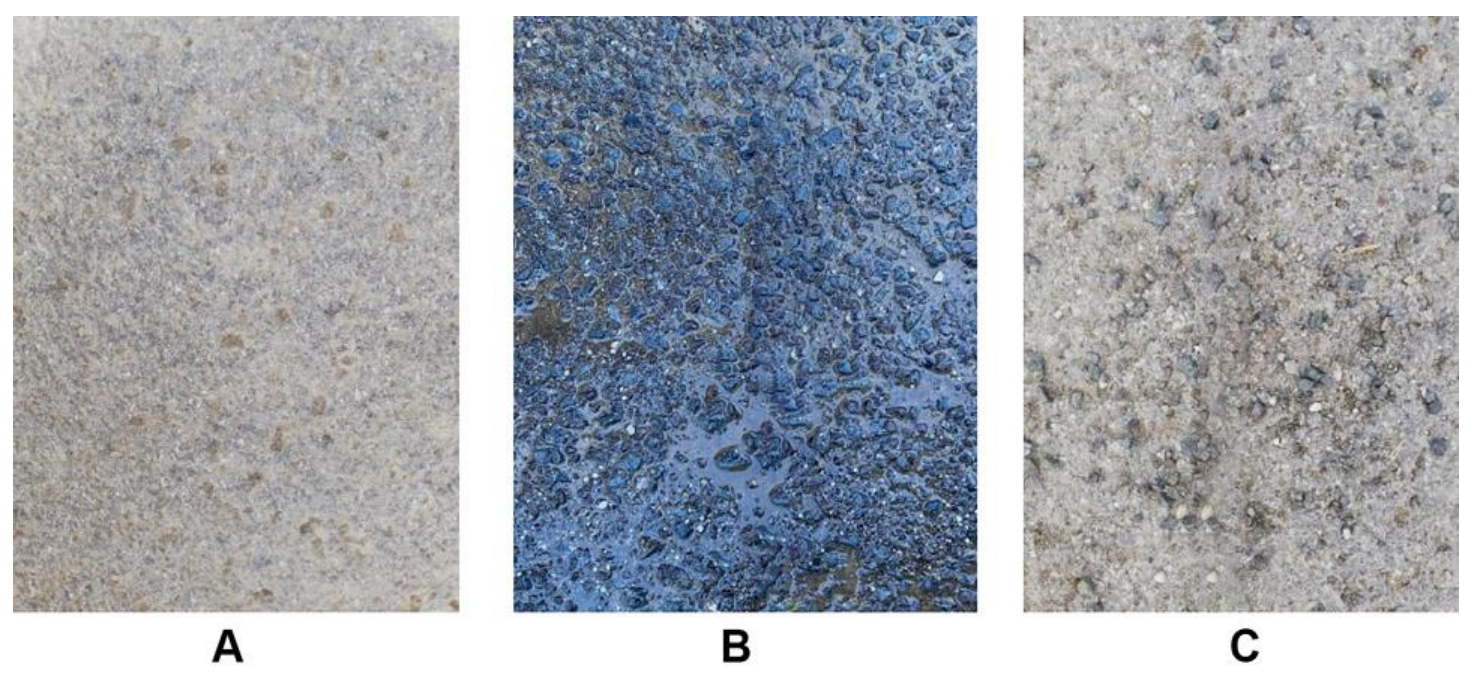
The test section of road (Figure 5) was ideal for the measurements due to its accessibility and low usage, providing sufficient length for vehicle acceleration and width for easy turning. For the wet surface measurements, the roadway was wetted using a Citroen Jumper van with a 1000-L container of water that was spilled on the road. In addition, to simulate uneven or dirty surfaces, such as urban areas with road works or agricultural zones, tests were carried out on a gravel surface at speeds of 50 km/h and 90 km/h. The use of 0.2–0.5 grit aggregate resulted in a reduction in braking deceleration and an increase in braking distance.

Figure 5.
Road surface ((A)—dry, (B)—wet, (C)—gravel).
2.4. Temperature of Brakes
The temperature of the brakes (Table 2) of a motor vehicle is an important factor for the brakes’ proper functioning. The brakes should be heated to the required temperature for their proper functioning. However, this is difficult to achieve in normal traffic. Cold brakes have a lower braking effect than warm brakes. At the same time, overheated brakes lose their braking effect and increase the stopping distance of the vehicle. The situation where the brakes are cold occurs in normal road traffic mainly in cold weather. As the brakes are air-cooled, they cool down very quickly at low temperatures. This is convenient in towns and areas where the vehicle often slows down and stops. The brakes also lose heat when driving out of town, especially on the motorway where the driver is not required to slow the vehicle. Conversely, brake overheating occurs in warm weather and strong sunlight. In this case, the air temperature is high and the brakes are unable to cool down. This problem can occur in the city, in an area with a high number of instances of braking at high speeds.
Table 2.
Brake temperatures reached during tests.
2.5. Procedure of Measurements
When using the XL Meter, it is essential to calibrate the meter immediately after switching it on. The instrument must be firmly fixed to the windscreen of the car so that it is in the zero position. The display will then show the current longitudinal (ax) and lateral (ay) acceleration values, which should be set to zero to ensure the accuracy of the measurements. The calibration also includes a test of the sensors. After successful calibration, the measurement can be started. The XL Meter measures data along the x and y axes, taking 40 (80) s at 200 Hz, allowing data to be recorded every 0.005 s. The device can store data from up to eight measurements in its internal memory. When the measurement is complete, the device automatically evaluates the effectiveness of the service brake. The start and end of braking are determined by analyzing the acquired data. The braking time, referred to as Tbr, is determined by subtracting the braking start time from the vehicle stop time. The initial vehicle speed is calculated by integrating the acceleration data throughout the braking interval. The braking distance is then calculated from this acceleration data.
After a successful measurement, the device will provide the following values:
So—braking distance [m];
Vo—speed of the vehicle at the moment of the start of braking [km/h];
Tbr—braking time [s];
MFDD—mean fully developed deceleration of the vehicle [m/s2].
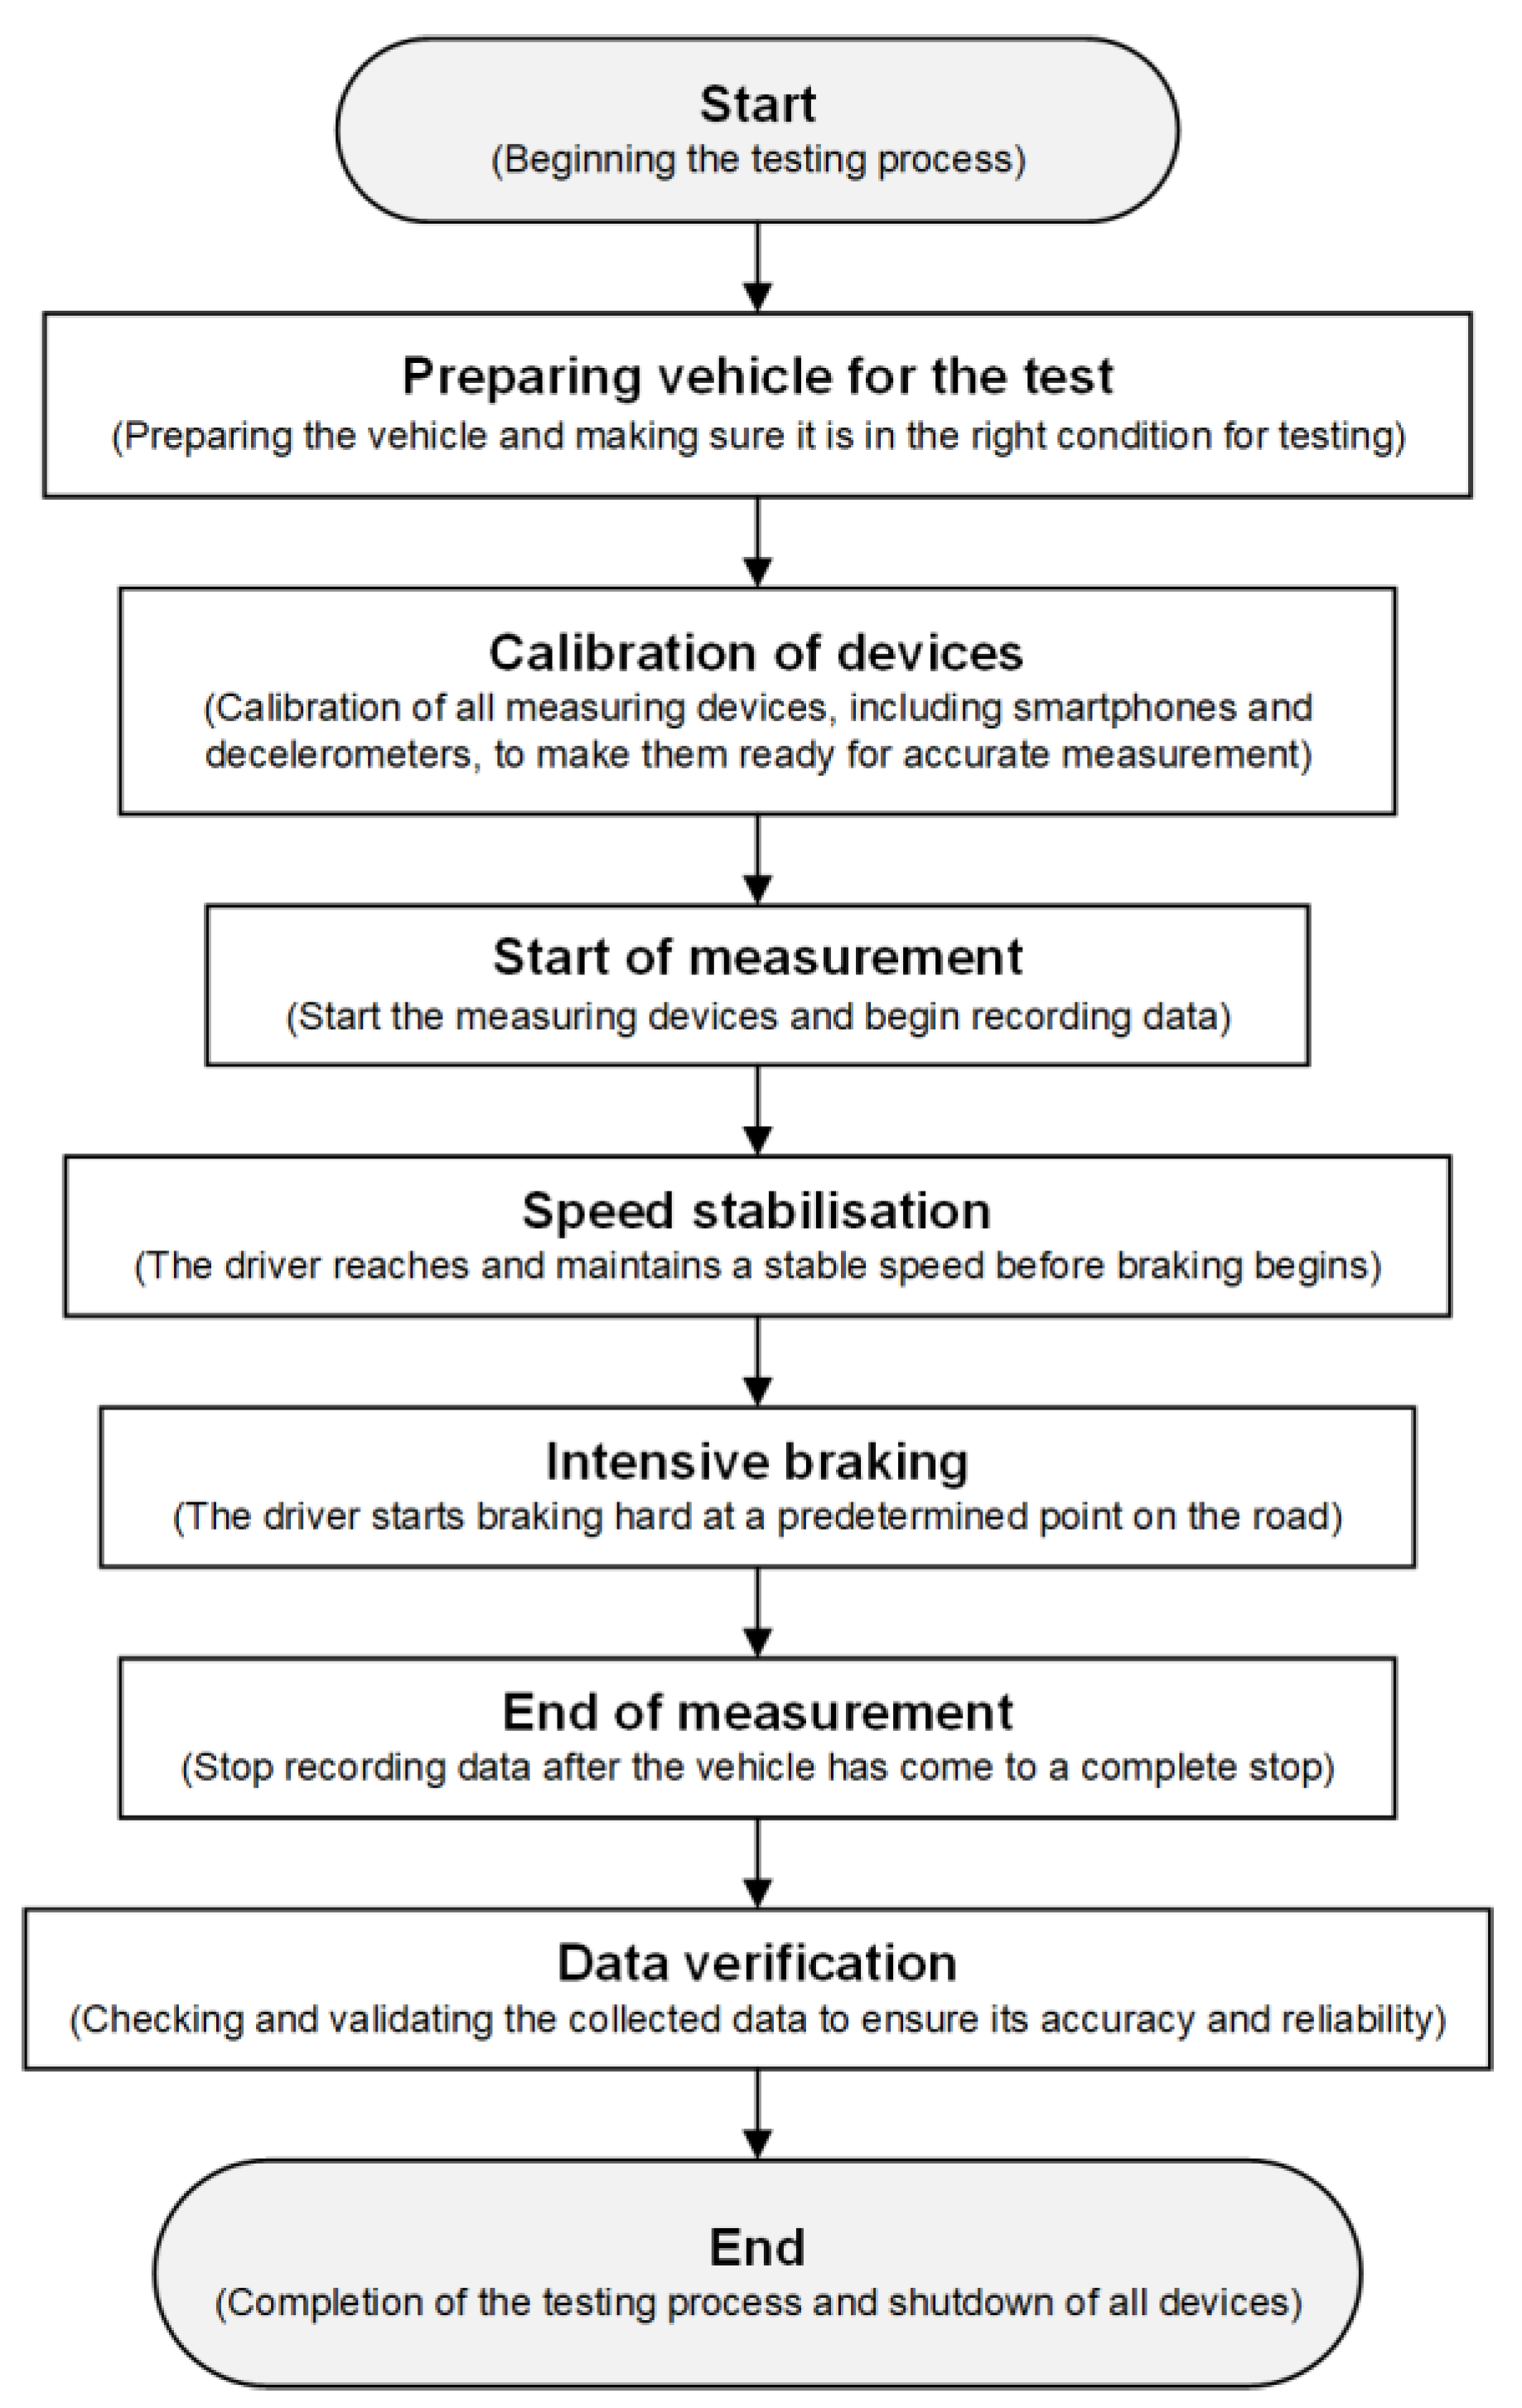
The following flowchart (Figure 6) provides a visual overview of the different phases of the measurement process used to record the deceleration of the vehicle during heavy braking. It details the steps from vehicle preparation and equipment calibration, through the actual measurement, to verification and analysis of the acquired data. In this way, it provides a comprehensive guide to carrying out the test and ensuring the quality of the results.
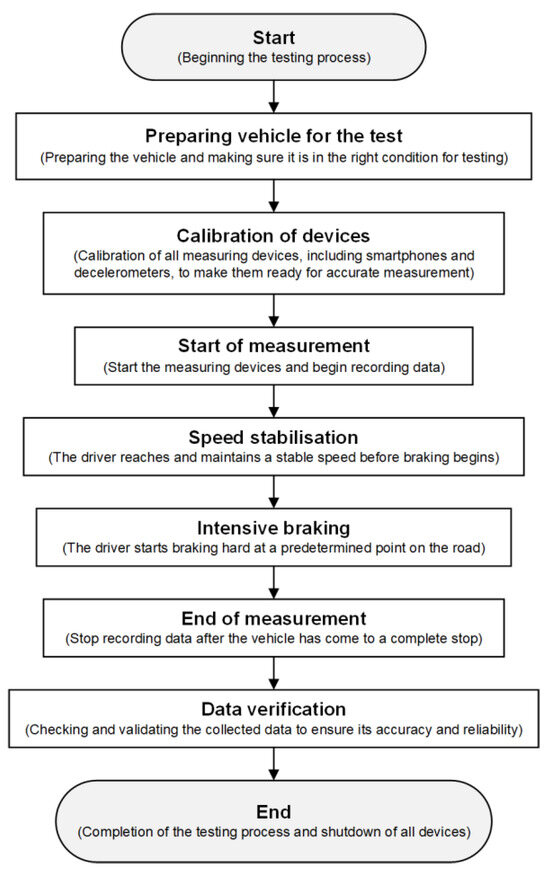
Figure 6.
Flowchart of measurement process.
The calibration of the decelerometer involved setting the device to the zero position using the integrated calibration module. The smartphones were calibrated using an app that ensured that all axes were aligned to zero. The data analysis software employed consisted of XL Vision for the decelerometer and Diagram software 1.0 for the smartphone data. The data processing procedures included the application of noise filtering and the integration of acceleration versus time, which enabled the calculation of velocity and trajectory (Diagram software).
2.6. Measurement Evaluation Process
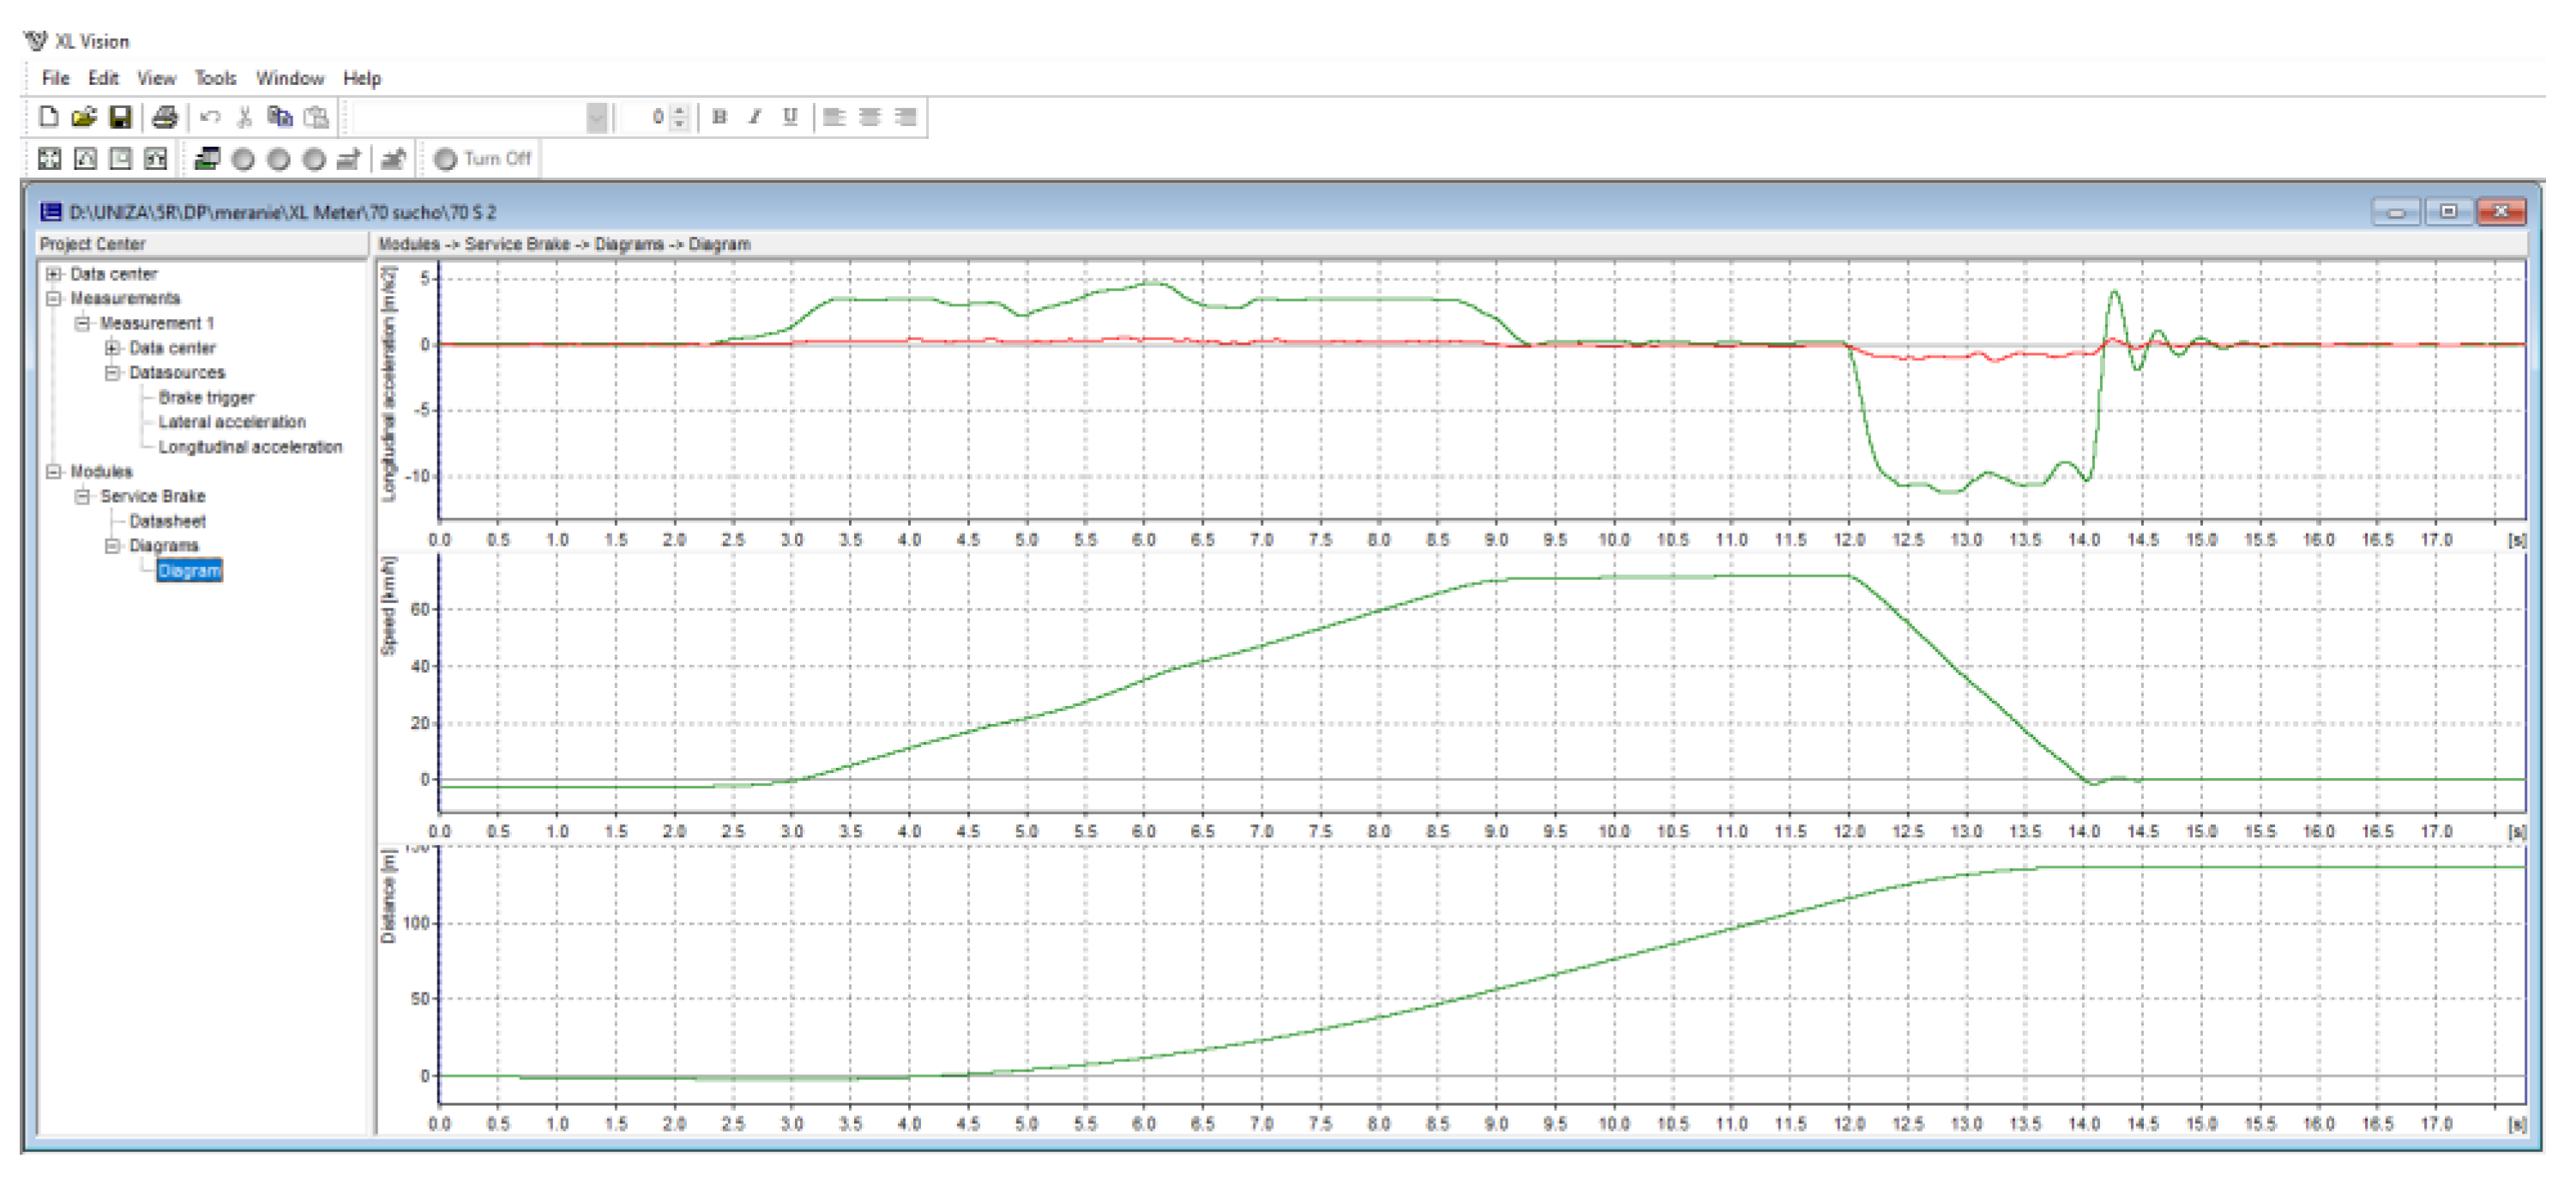
Subsequently, the data were subjected to analysis. XL Vision software (Figure 7), developed by Inventure for this specific purpose, was employed to extract data from the XL Meter. Once the device was connected to a computer, the data from the XL Meter could be downloaded and the corresponding graphs analyzed. XL Vision software was then utilized to export the extracted data to PC Crash software, which enabled the specific outputs that were required to be obtained.
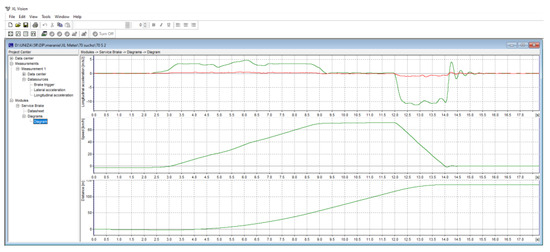
Figure 7.
Evaluation in XL Vision.
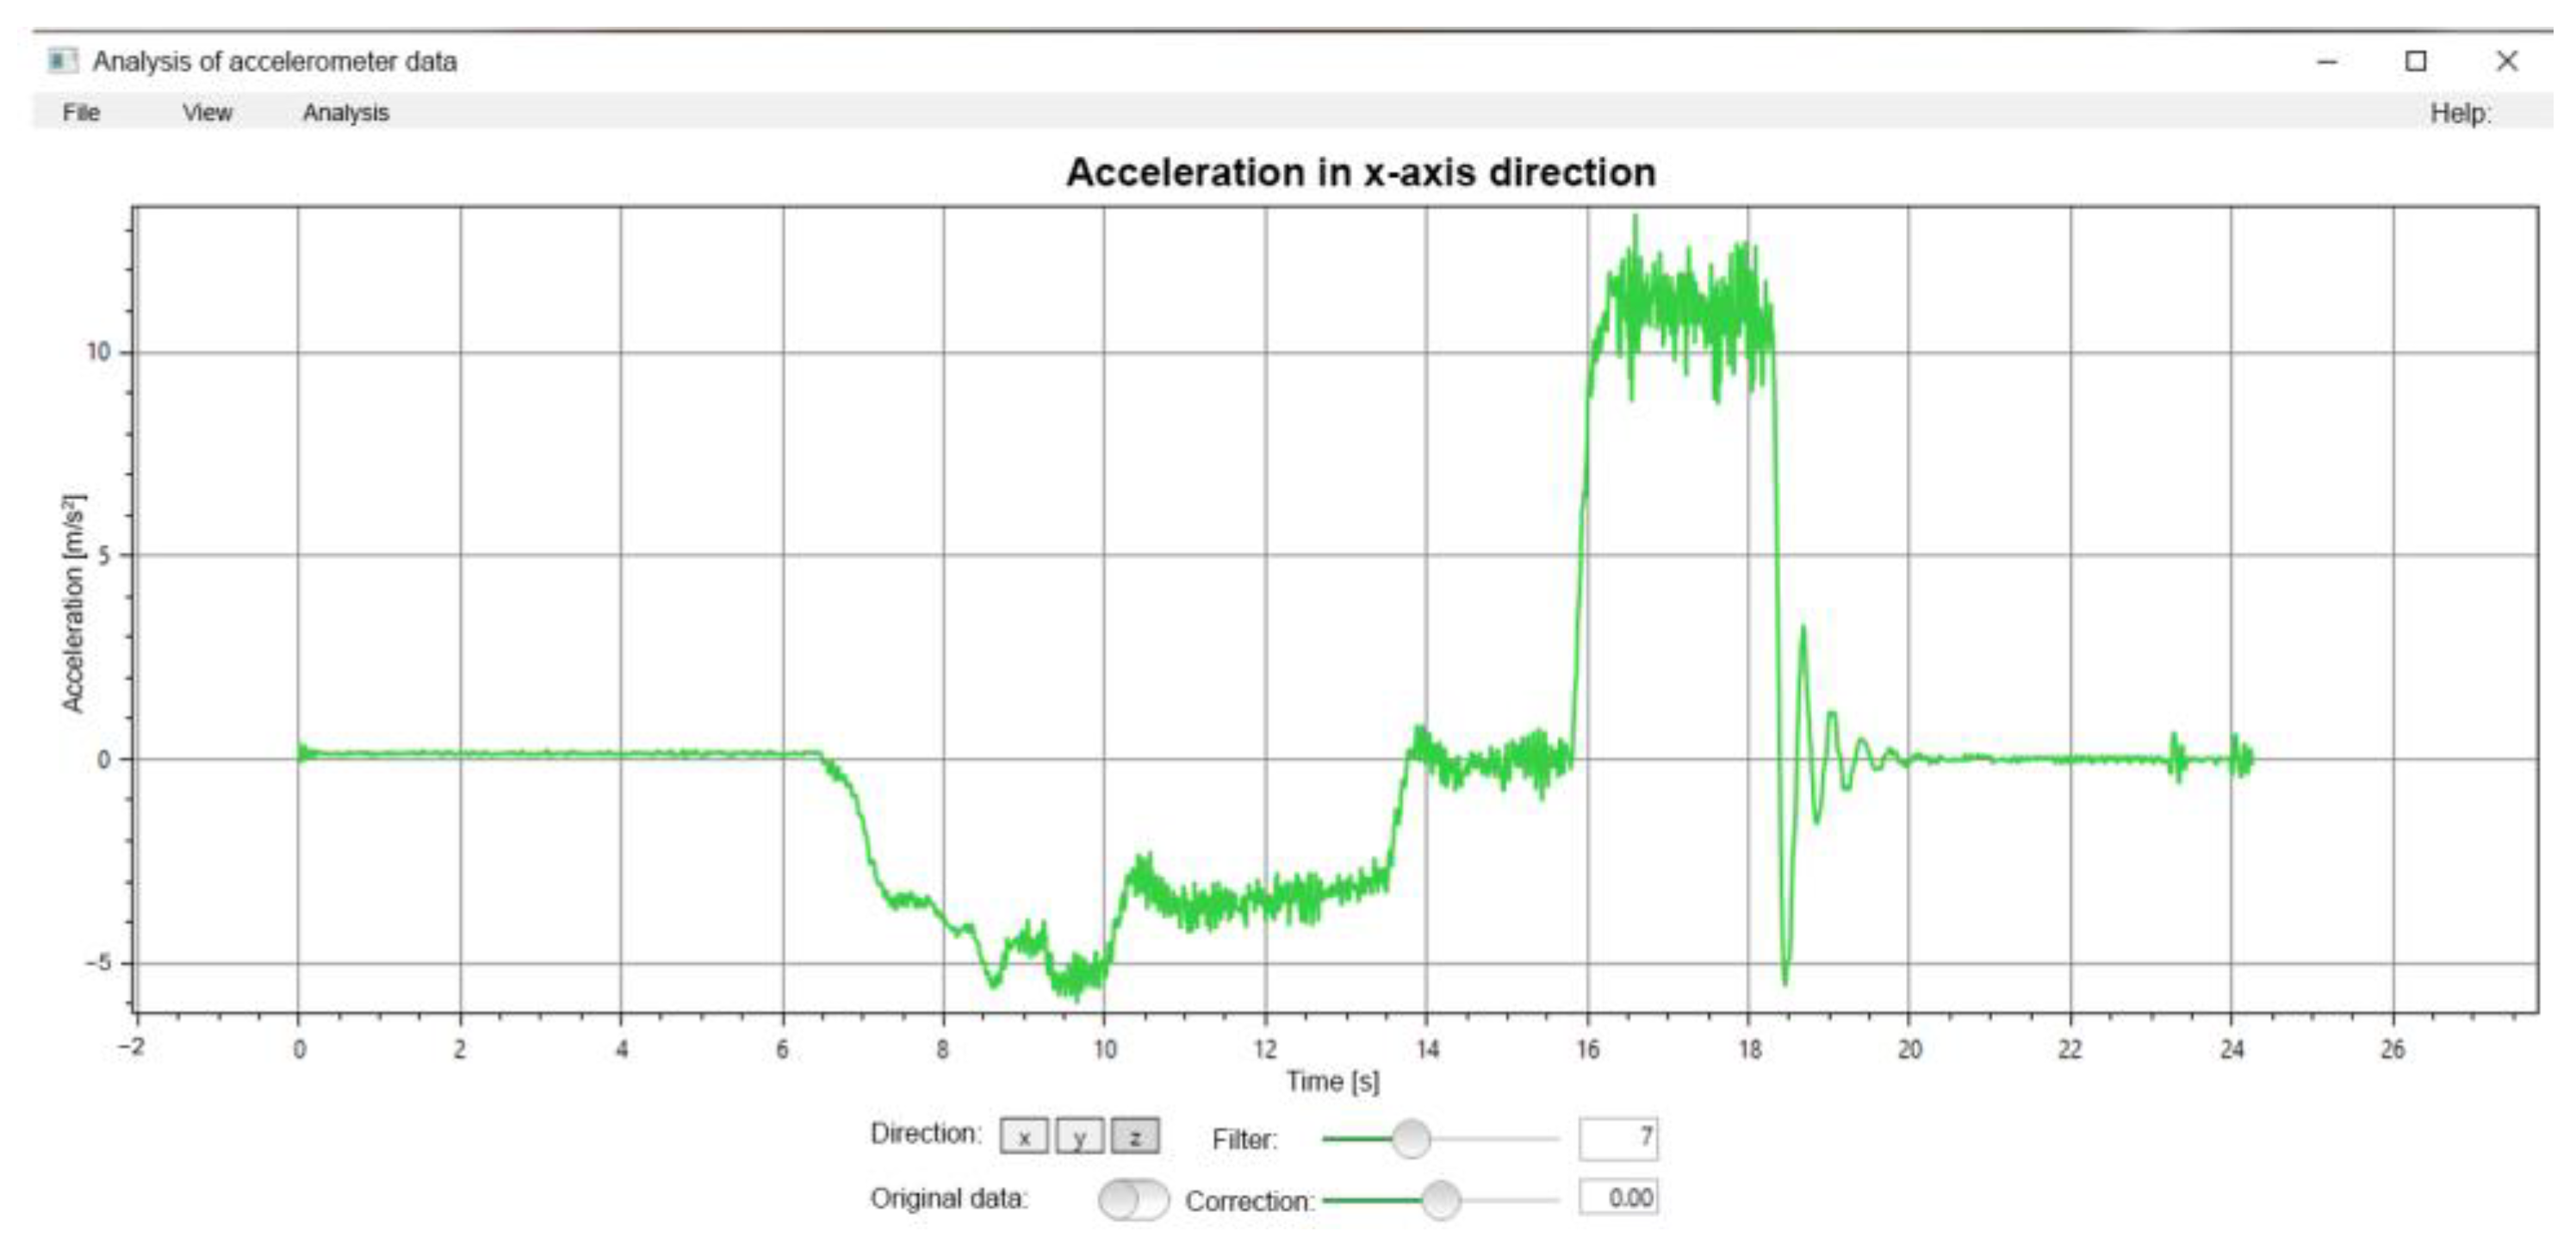
A Diagram software program (Figure 8) was employed to assess the smartphone data. This approach, similar to that used in PC Crash, provides a graphical representation of the measurement process.
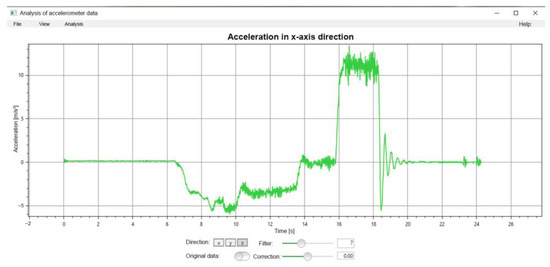
Figure 8.
View in Diagram software.
3. Results
Brake deceleration measurements (see Table 3) were carried out on a single road using a single vehicle on different types of surfaces. The experiment involved braking on a dry surface, where the objective was to achieve maximum braking deceleration. Driving tests were conducted at four different speeds (30, 50, 70, 90 km/h). Speeds of 30 and 50 km/h were chosen to simulate an urban environment where lower speeds lead to shorter braking distances and slightly lower deceleration values. These tests were designed to verify that the smartphones employed can record data with sufficient accuracy for analytical purposes. The speeds of 70 and 90 km/h simulated driving on roads outside a municipality or on roads with higher speed limits, which typically increase deceleration values and lengthen braking distances. To ensure the highest possible accuracy of the measurements made, four trials were performed for each speed.
Table 3.
Processed XL Meter measurements.
3.1. Measurement Results for the Dry Road
All measurements were tabulated for the purpose of evaluating and comparing values between devices.
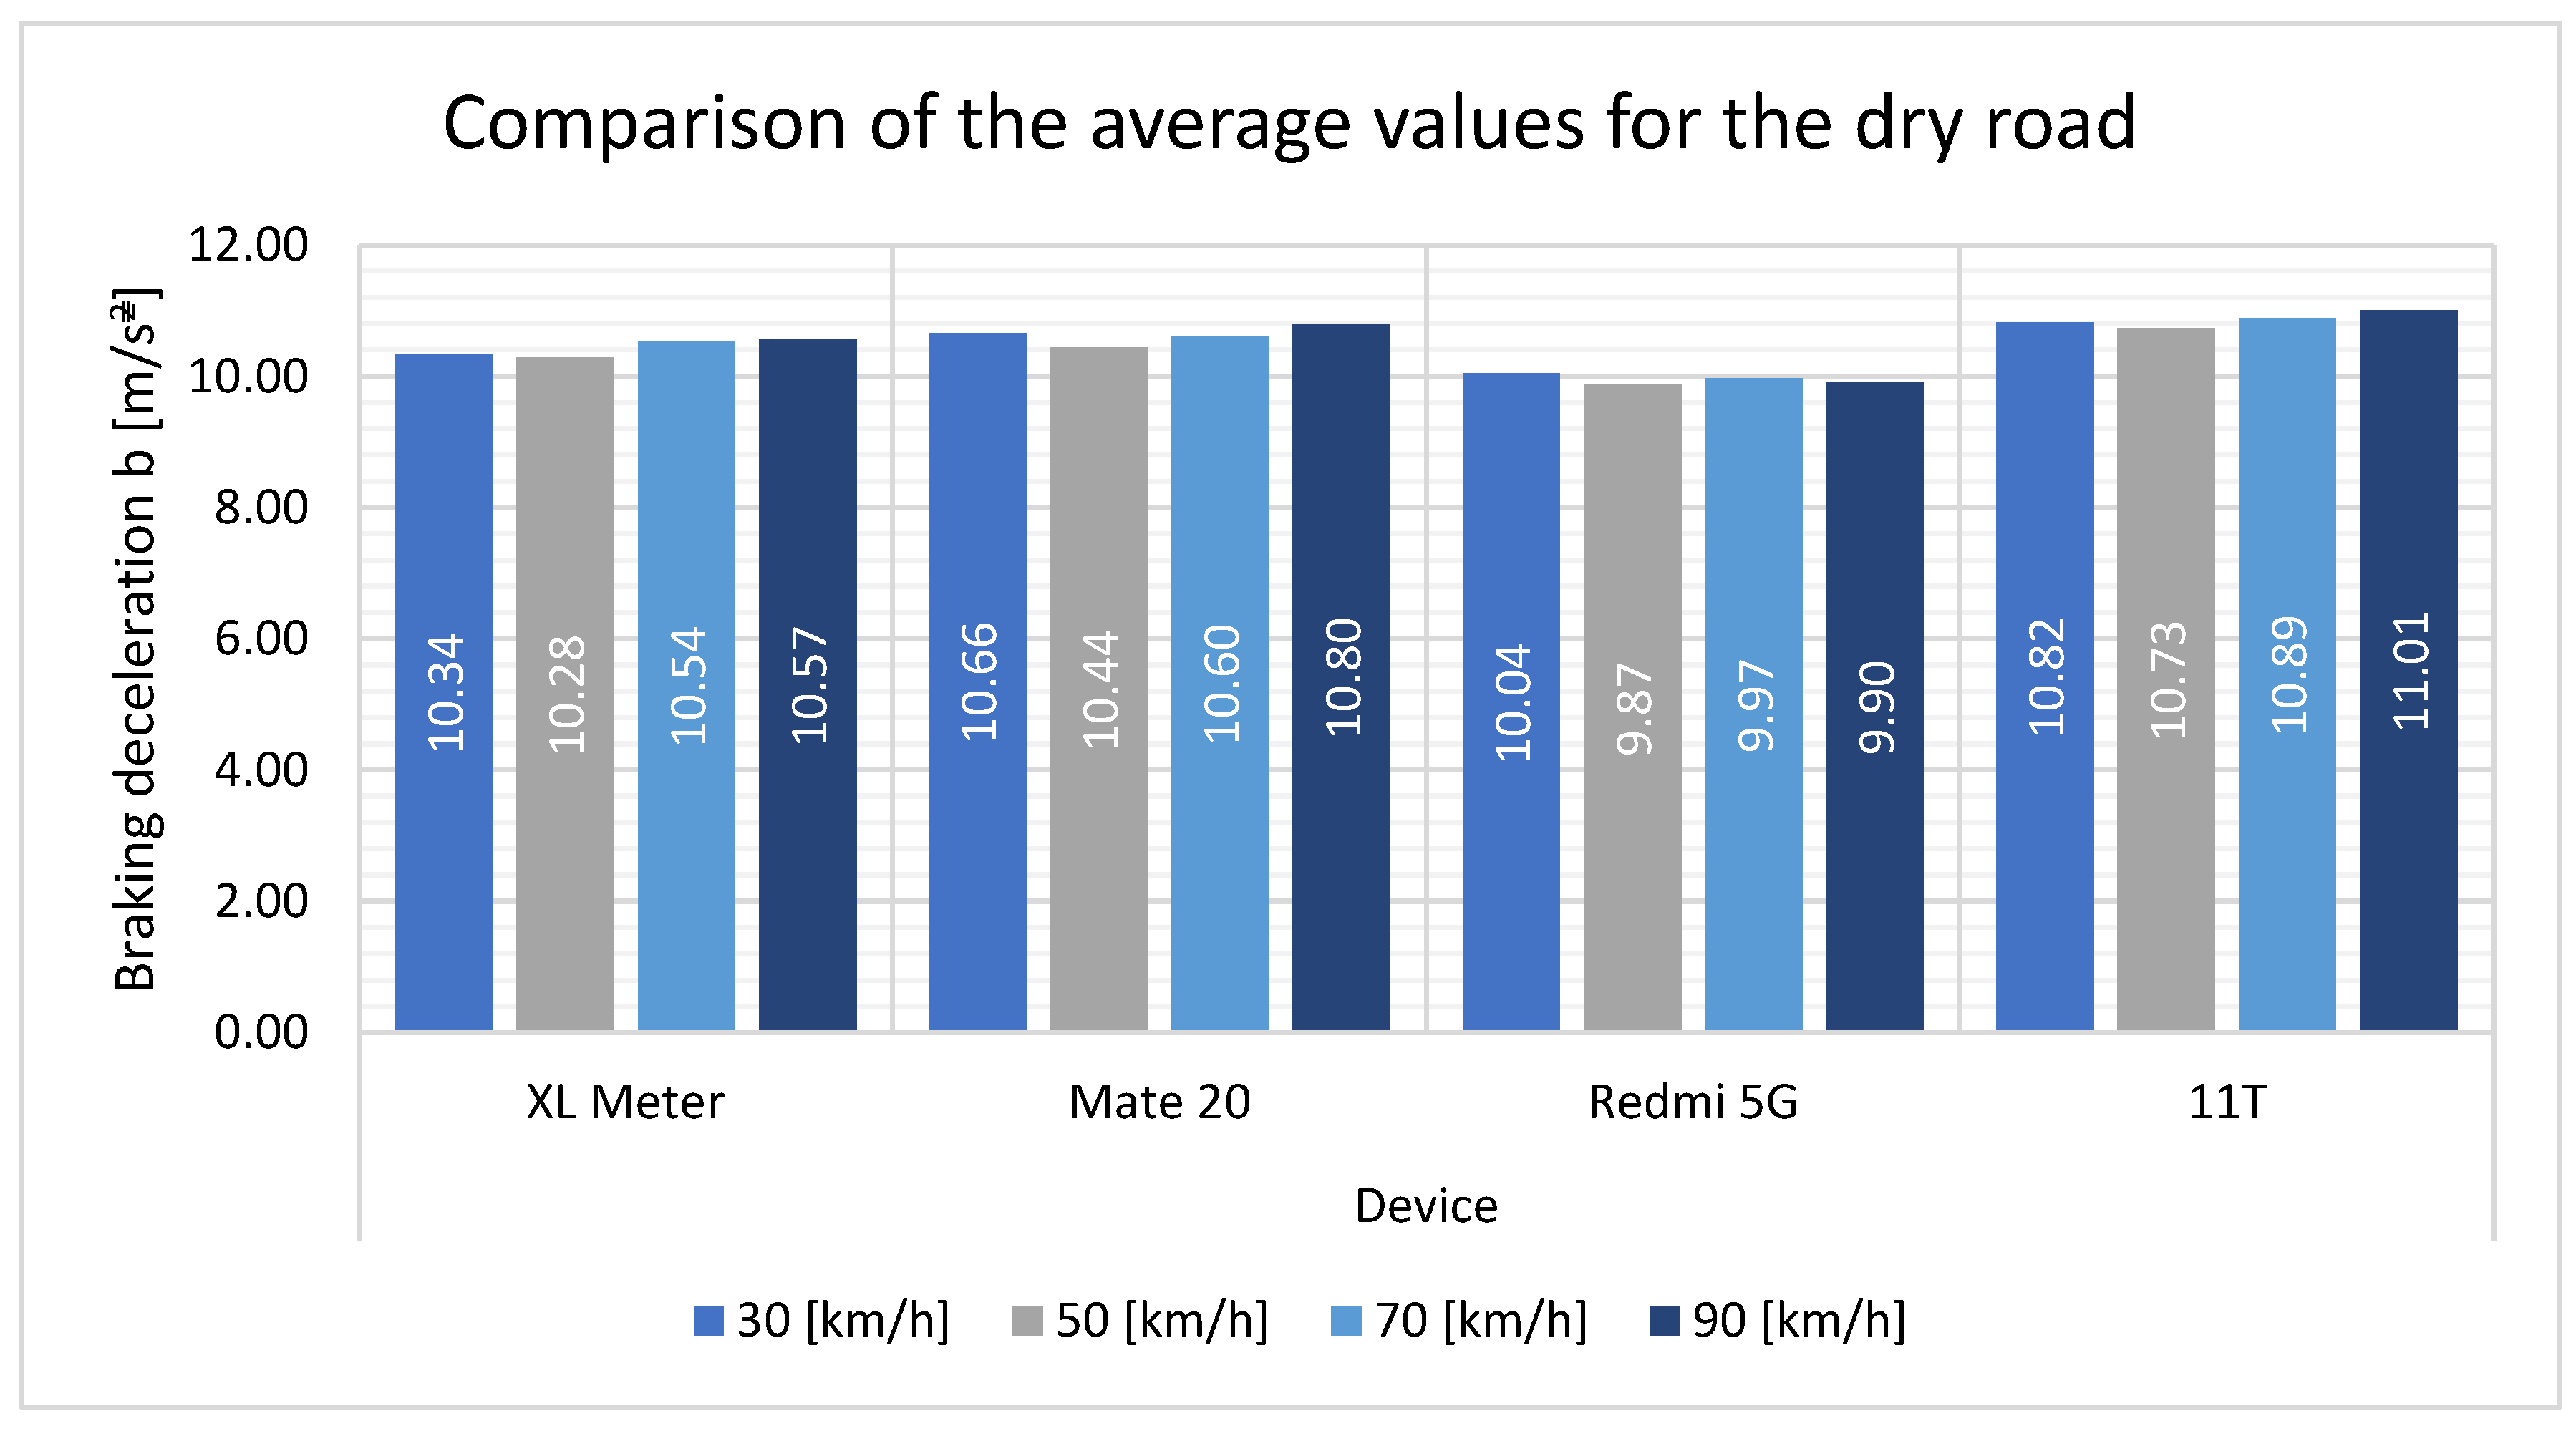
The Table 4 displays the average values measured by the devices for each speed. Additionally, an average has been calculated for the overall measurements on the dry road surface. The differences between each smartphone and the XL Meter are also presented. These differences were evaluated in their absolute value and overall percentage value. It can be observed that the Mate 20 smartphone exhibited the closest percentage value to the XL meter. The Redmi 5G and 11T smartphones exhibited similar percentage difference values.
Table 4.
Evaluation of the measurements on the dry road.
A graphical comparison (Figure 9) of the values measured by each device reveals that at a speed of 30 km/h, the overall measured values are higher than at 50 km/h. For two of the smartphones, the measured values are greater than those for the XL Meter, while for one smartphone, the measured values are lower than those of the XL Meter. Overall, it can be seen that the values measured by the smartphones are not that different from the values measured by the XL Meter. For measurements taken at higher speeds, the trend is consistent with that observed at lower speeds. The Huawei Mate 20 and Xiaomi 11T were able to achieve values that were comparable to those measured with the XL Meter. The Xiaomi Redmi 5G device exhibited similar behavior at lower speeds, with values that were lower than those observed for the other smartphones and the XL Meter.
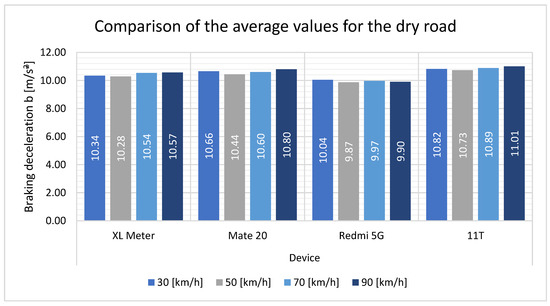
Figure 9.
Comparison of the average values for the dry road.
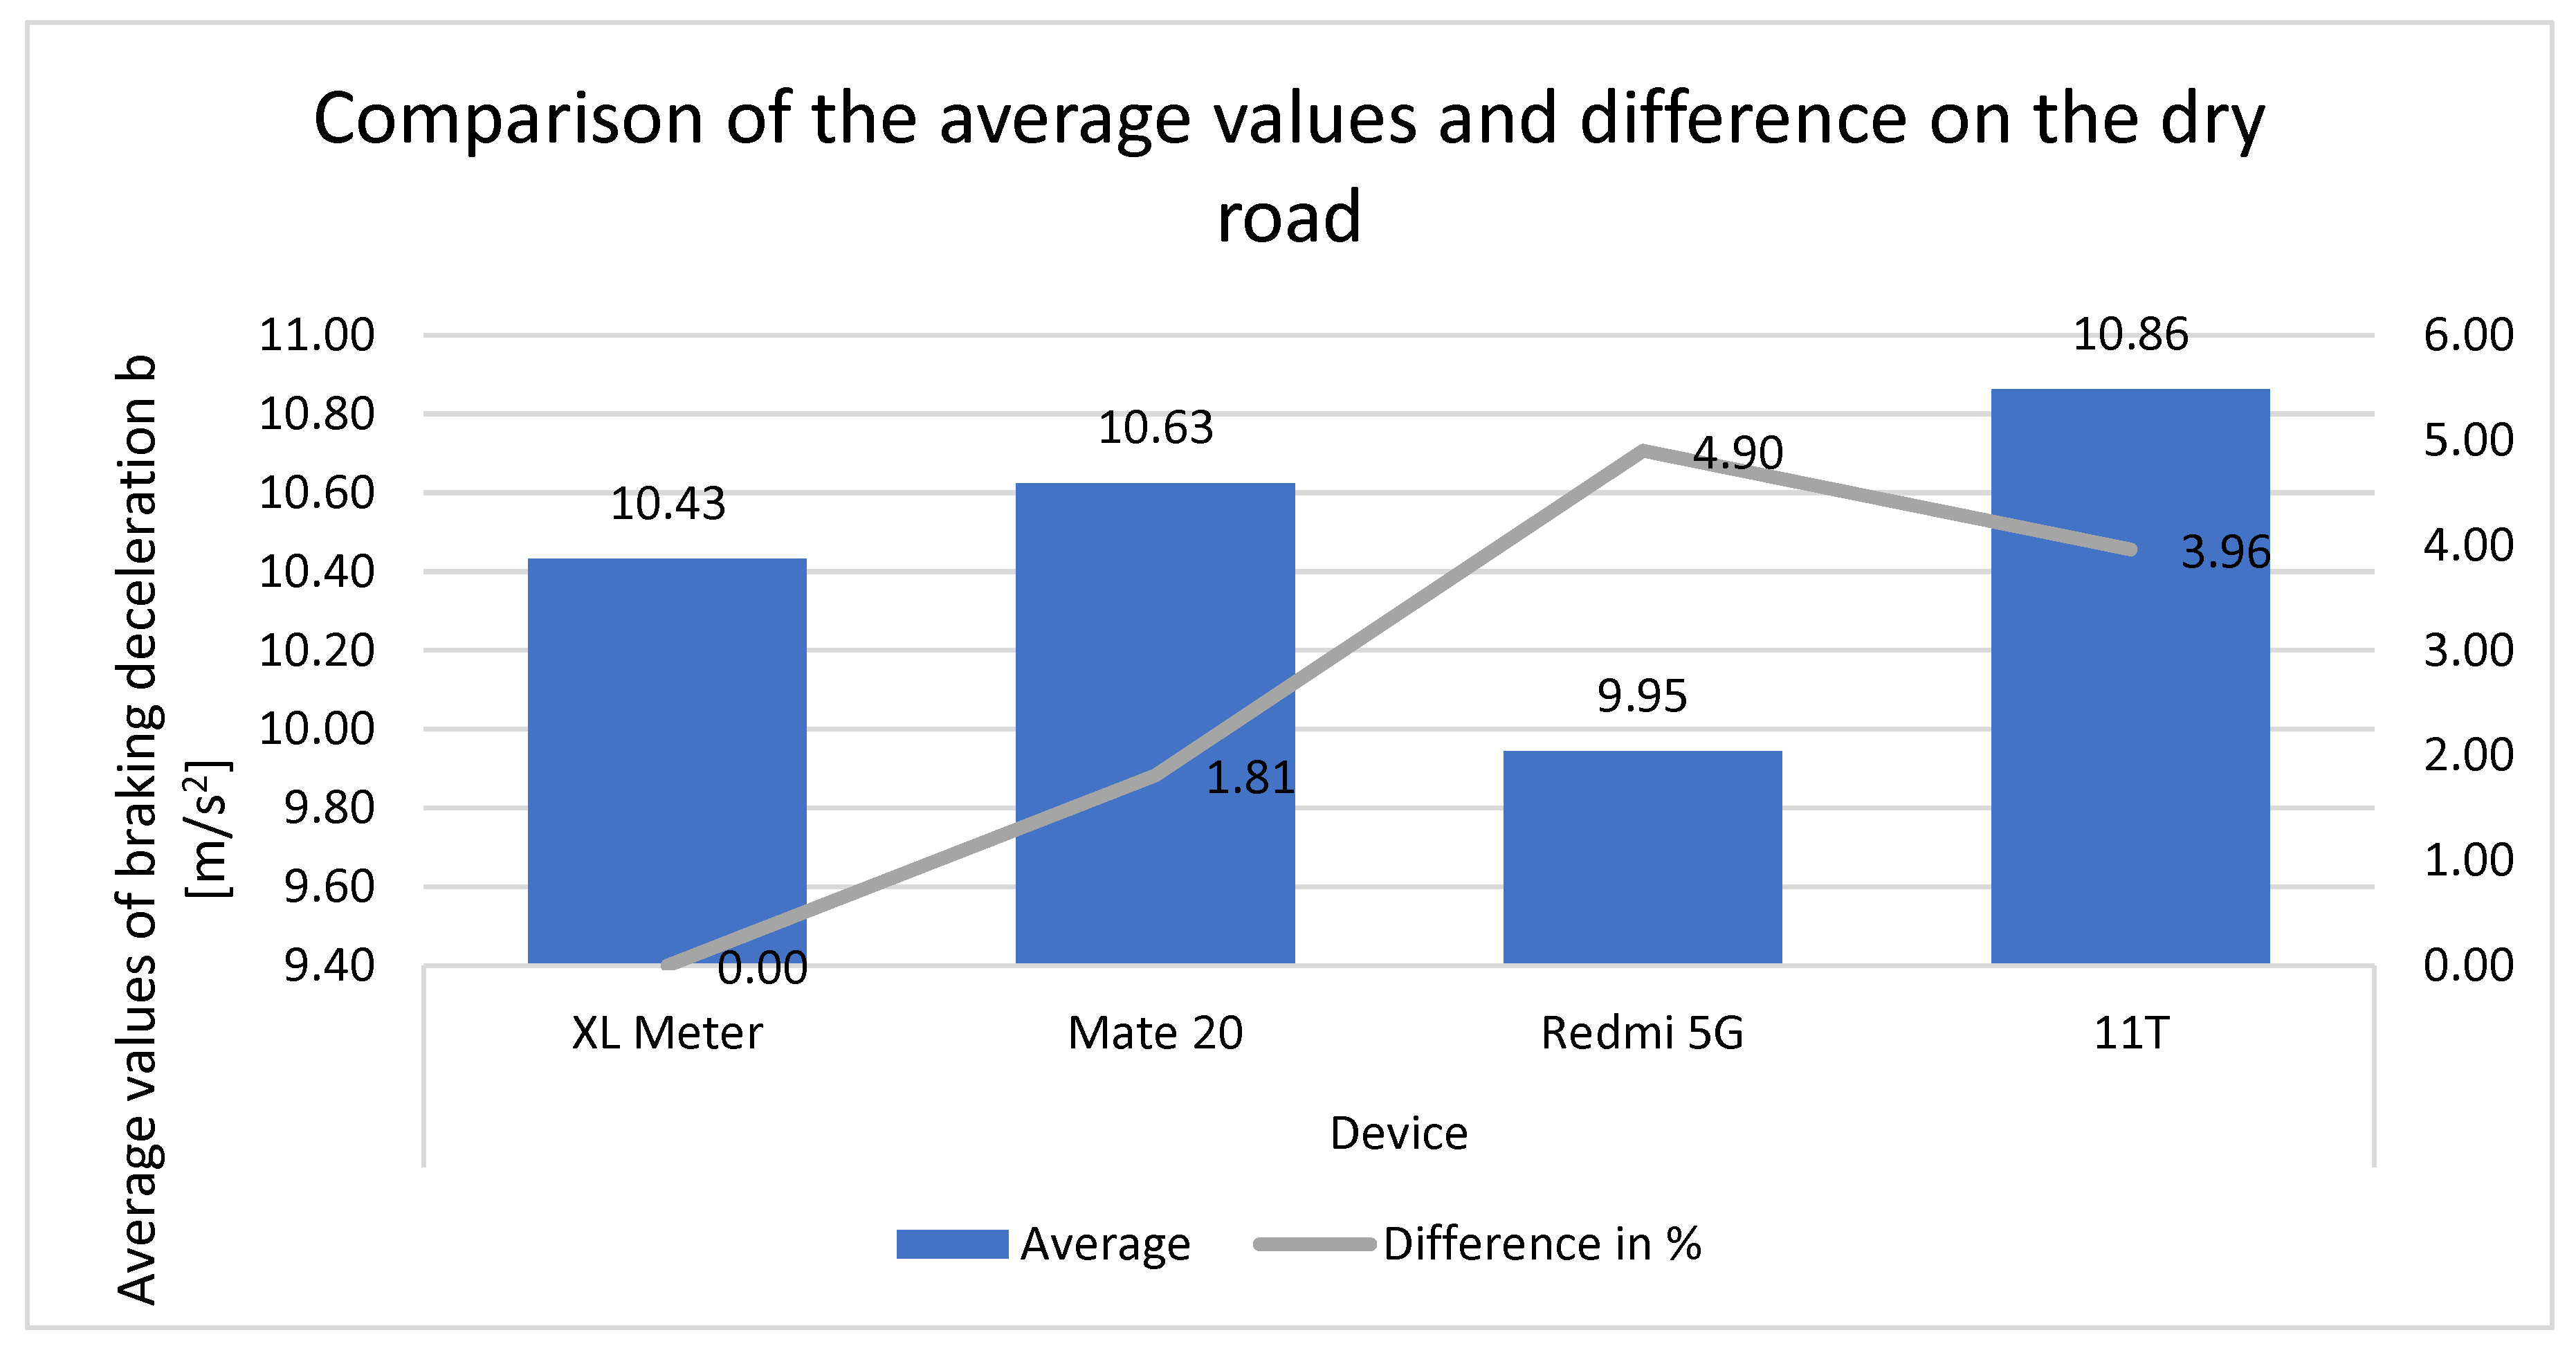
The graph (Figure 10) illustrates the individual values measured by the equipment on a dry road. It also demonstrates the differences between the XL Meter and smartphones. The overall average values are within 0.5 m/s2. Overall, the data indicate that the smartphones do not deviate by more than 5% from the XL Meter.
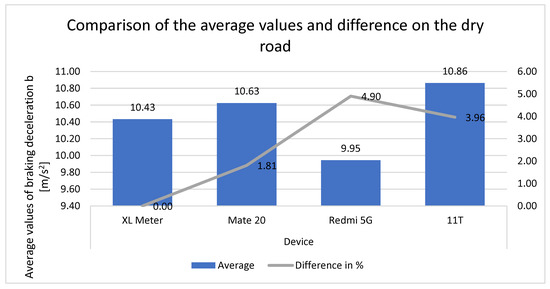
Figure 10.
Comparison of the average values and differences on the dry road.
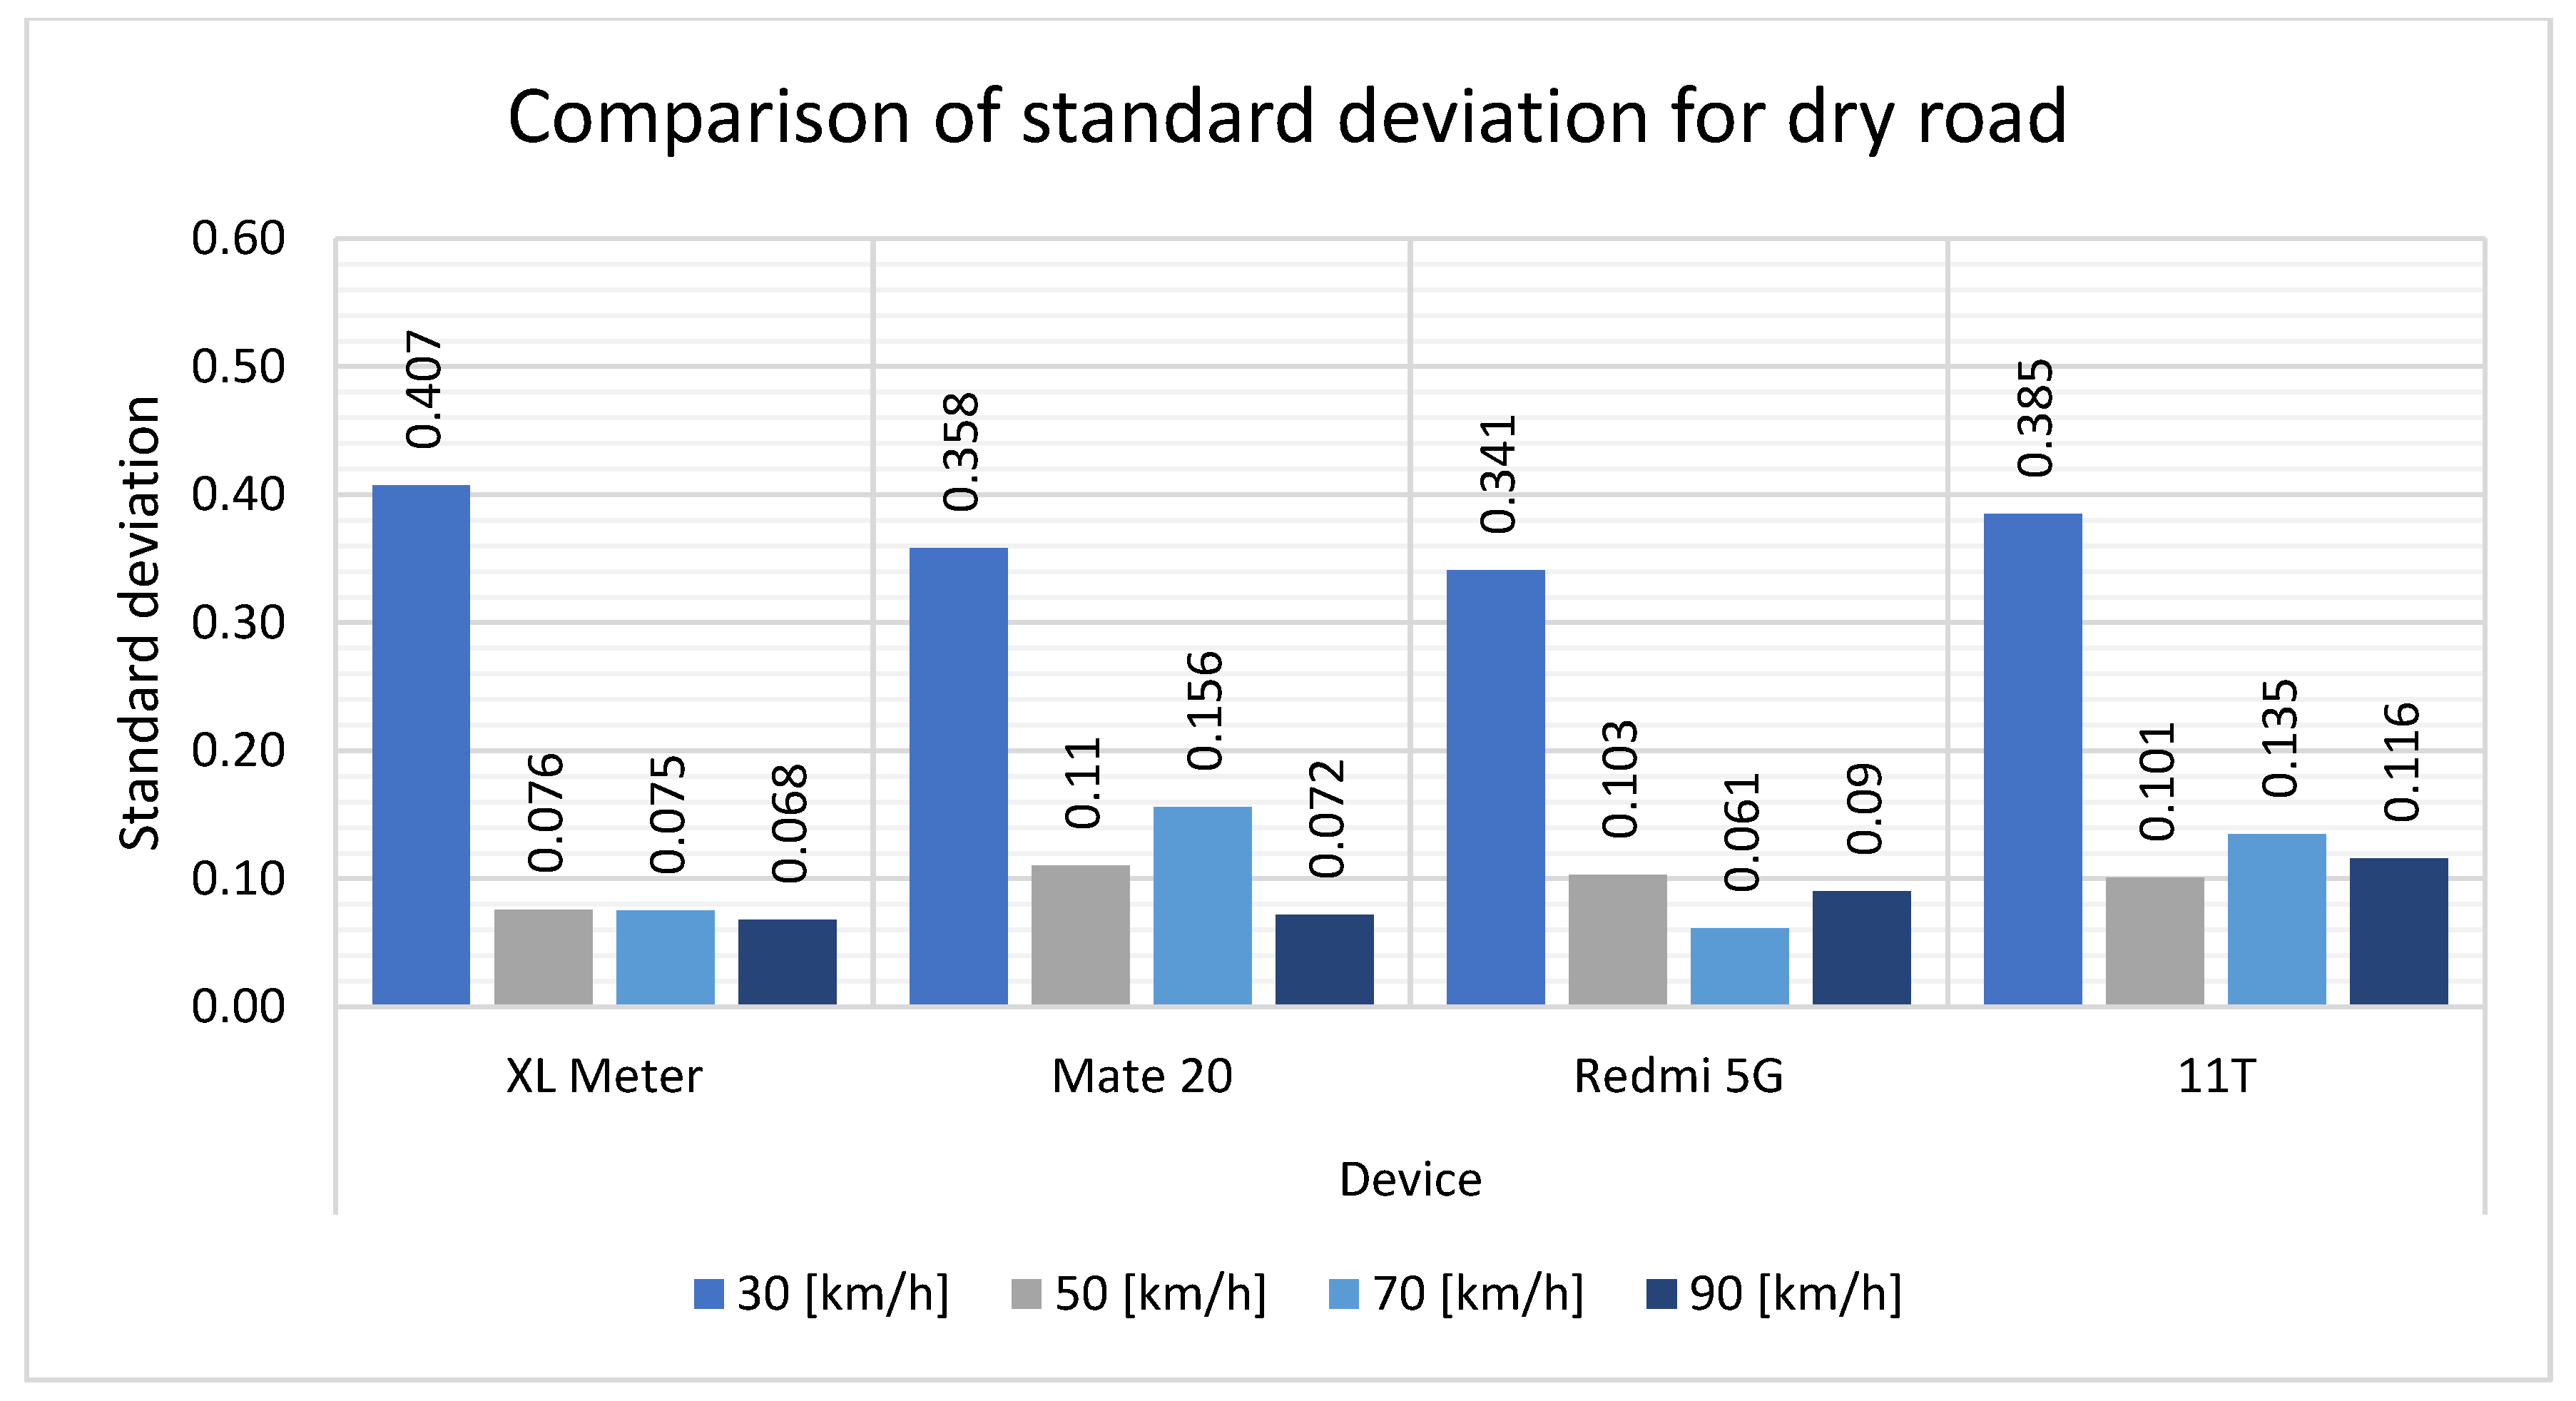
A comparison of the standard deviation is presented in Table 5 This table illustrates how the values varied at dry road speeds. At a speed of 30 km/h, the largest standard deviation values were recorded, reaching as high as 0.4. However, the difference between the XL Meter and the smartphones is not significant. At the remaining speeds, the standard deviation no longer reaches high values. This demonstrates the overall discrepancy between the mean values at all speeds, where the differences between the smartphones and the XL Meter are minimal. The percentage comparison reveals elevated values, which is a consequence of the low standard deviation. It can be observed that the optimal device in this instance is the 11T smartphone.
Table 5.
Comparison of the standard deviation for the dry road.
Figure 11 illustrates the trend in the standard deviation when measured on the dry road. At a speed of 30 km/h, the standard deviation values were at the highest level of all the measurements on that surface. The values at this speed fluctuate slightly between the devices but are not significantly different. In contrast, the standard deviation values for the other measurements on the dry road are at their lowest level, indicating that the measurements are nearly identical to the average values. While slight differences can be observed on the graph at 70 km/h, these are not significant.
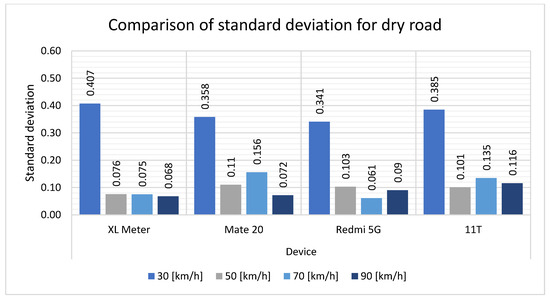
Figure 11.
Comparison of the standard deviation for the dry road.
3.2. Measurement Results for the Wet Road
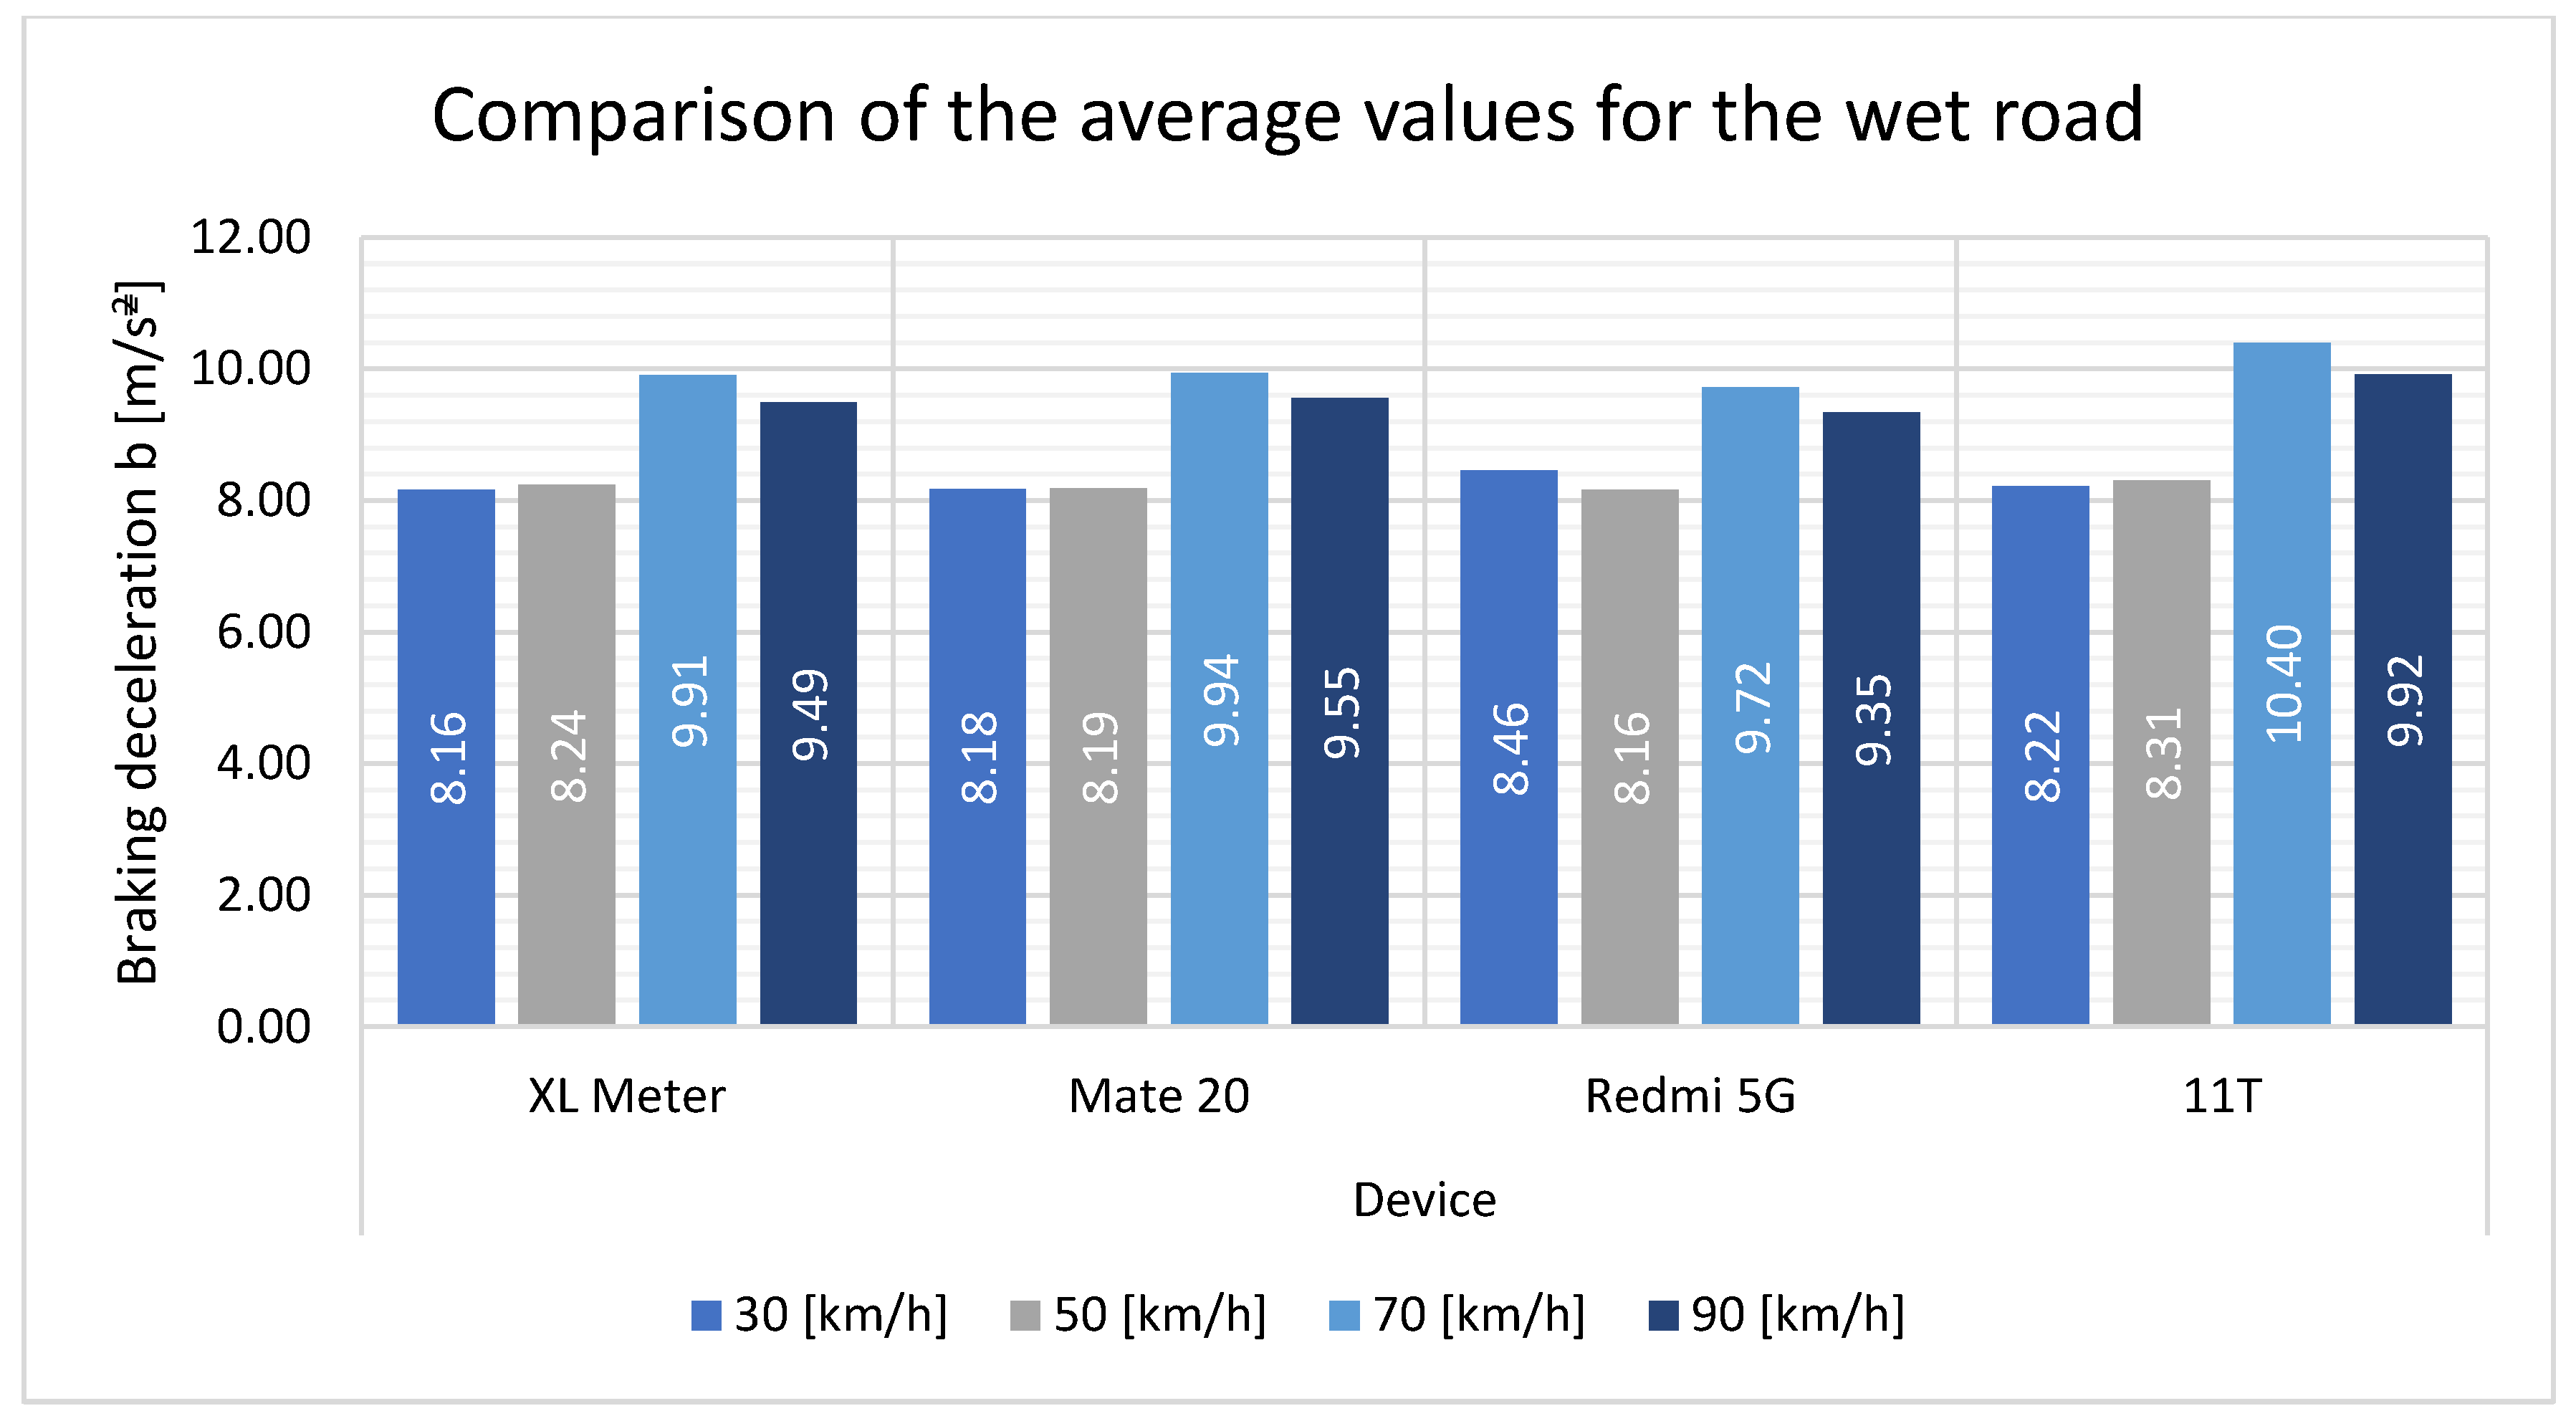
Table 6 presents a comparison of the average measured values during the wet road tests. While the values achieved at low speeds are lower than those at high speeds, the overall average of the XL Meter and the individual smartphones remains at a similar level. There are minor deviations from the average in some instances, but these are not significantly large.
Table 6.
Evaluation of the measurements on the wet road.
Figure 12 illustrates the behavior of the average values when comparing the XL Meter and smartphones. The differences in the values achieved between the different speeds are evident. When measured on wet roads, the values between the devices were nearly identical. At low speeds, the measured values for all devices were nearly identical. At higher speeds, there were smaller differences for the Xiaomi 11T smartphone. However, these values are not significantly different.
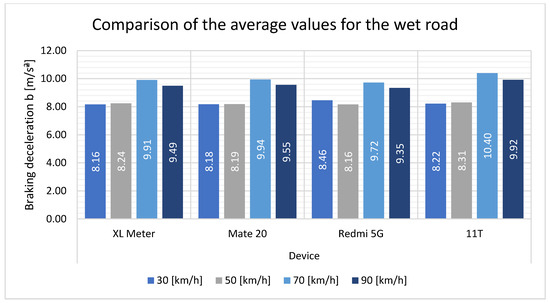
Figure 12.
Comparison of the average values for the wet road.
The overall average values (see Figure 13) obtained during the entire measurement on the wet road are also compared. Here, we observe that the Mate 20 and Redmi 5G smartphones achieve nearly identical values. This is corroborated by the percentage differences, which are minimal. In contrast, the Xiaomi 11T exhibits a different behavior, exhibiting a higher average value in wet road conditions and also a percentage difference from that of the XL Meter.
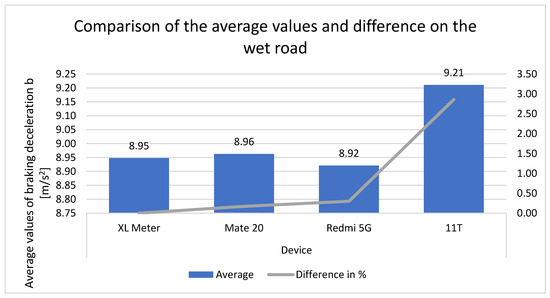
Figure 13.
Comparison of the average values and differences on the wet road.
Table 7 illustrates the differences in standard deviation for each speed. At a speed of 30 km/h, the XL Meter reaches a value of 0.201, whereas with the other devices, the standard deviations are 0.5 and even almost 0.8. These are relatively high standard deviation values encountered with the smartphones compared to the XL Meter. For the remaining speeds, the XL Meter and smartphone values are at a similar level. The overall mean values are elevated for the smartphones relative to the values at 30 km/h. This also results in a high percentage difference.
Table 7.
Comparison of standard deviation for the wet road.
The standard deviation of measurements taken on a wet road (see Figure 14) differs from that of measurements taken on a dry road. For measurements taken at 30 km/h, the XL Meter is situated at the lower end of the standard deviation range, while the other devices are positioned at a higher and distinct level. For the remaining speeds, the standard deviation of the smartphones is comparable to that of the XL Meter. A marginal increase is observed in the values obtained by the Mate 20 and 11T smartphones at 70 km/h.
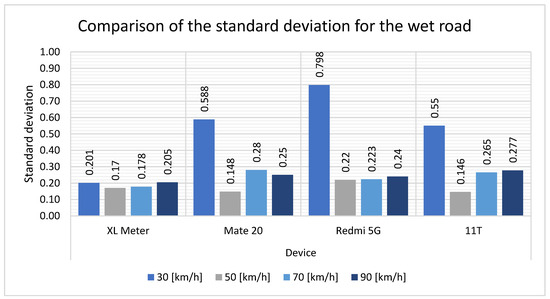
Figure 14.
Comparison of the standard deviation for the wet road.
3.3. Measurement Results for the Gravel Road
The final type of measurement was conducted on a gravel road. In these measurements, we observe a notable alignment of the measured values for all devices. The results of the measurements in the Table 8 demonstrate a similar trend to those observed in the measurements on the wet road. When compared to the value measured with the XL Meter, all the smartphones exhibit a close correlation, with only minor differences.
Table 8.
Evaluation of the measurements on the gravel road.
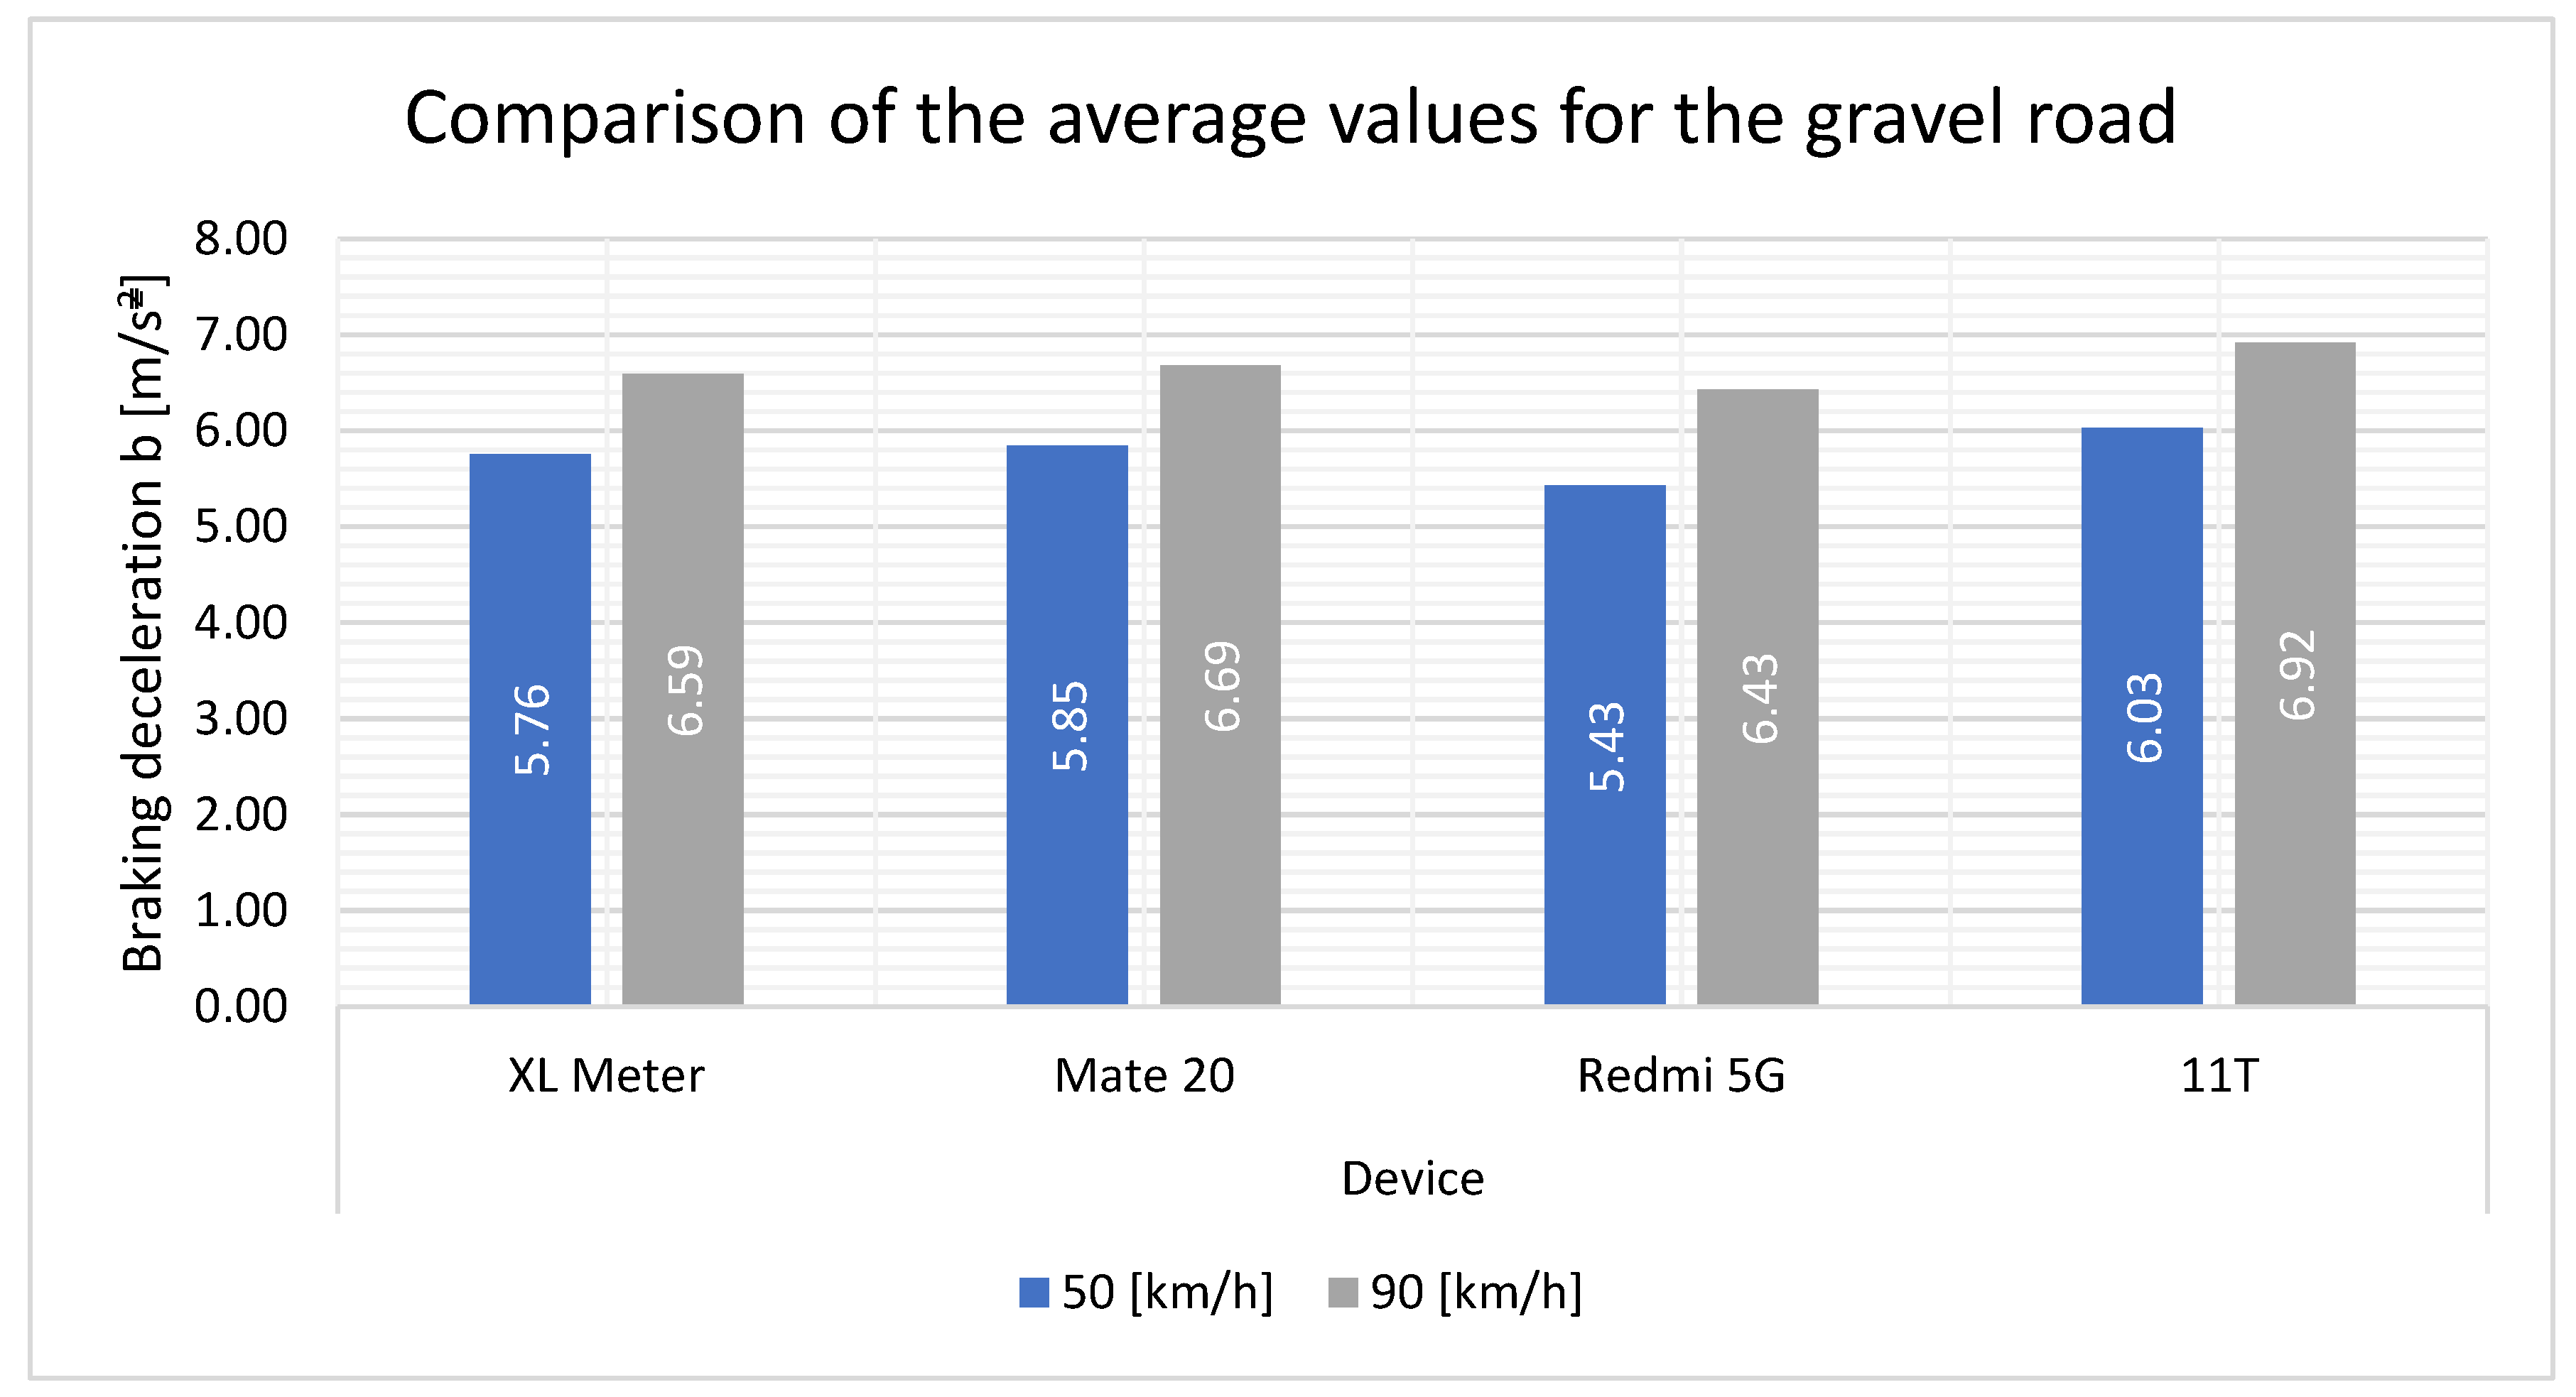
Figure 15 shows that there are the same minor discrepancies as those previously mentioned. It can be observed that the Redmi 5G smartphone exhibited smaller values compared to the XL Meter. Conversely, the other two smartphones exhibited slightly increased values.
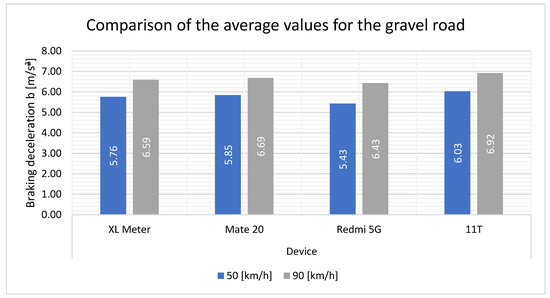
Figure 15.
Comparison of the average values for the gravel road.
Figure 16 shows the average values of the devices during the measurements on the gravel road. It can be seen that, in comparison to the values measured by the XL Meter, the Mate 20 smartphone exhibited higher average values, as did the Xiaomi 11T smartphone. The Redmi 5G exhibits a lower overall average, yet its values are comparable to those of the Xiaomi 11T, which exceeded 4%. Both devices are within close range of the XL Meter.
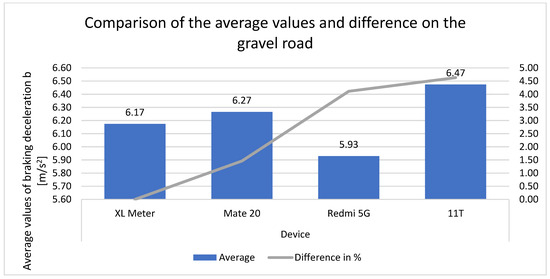
Figure 16.
Comparison of the average values and differences on the gravel road.
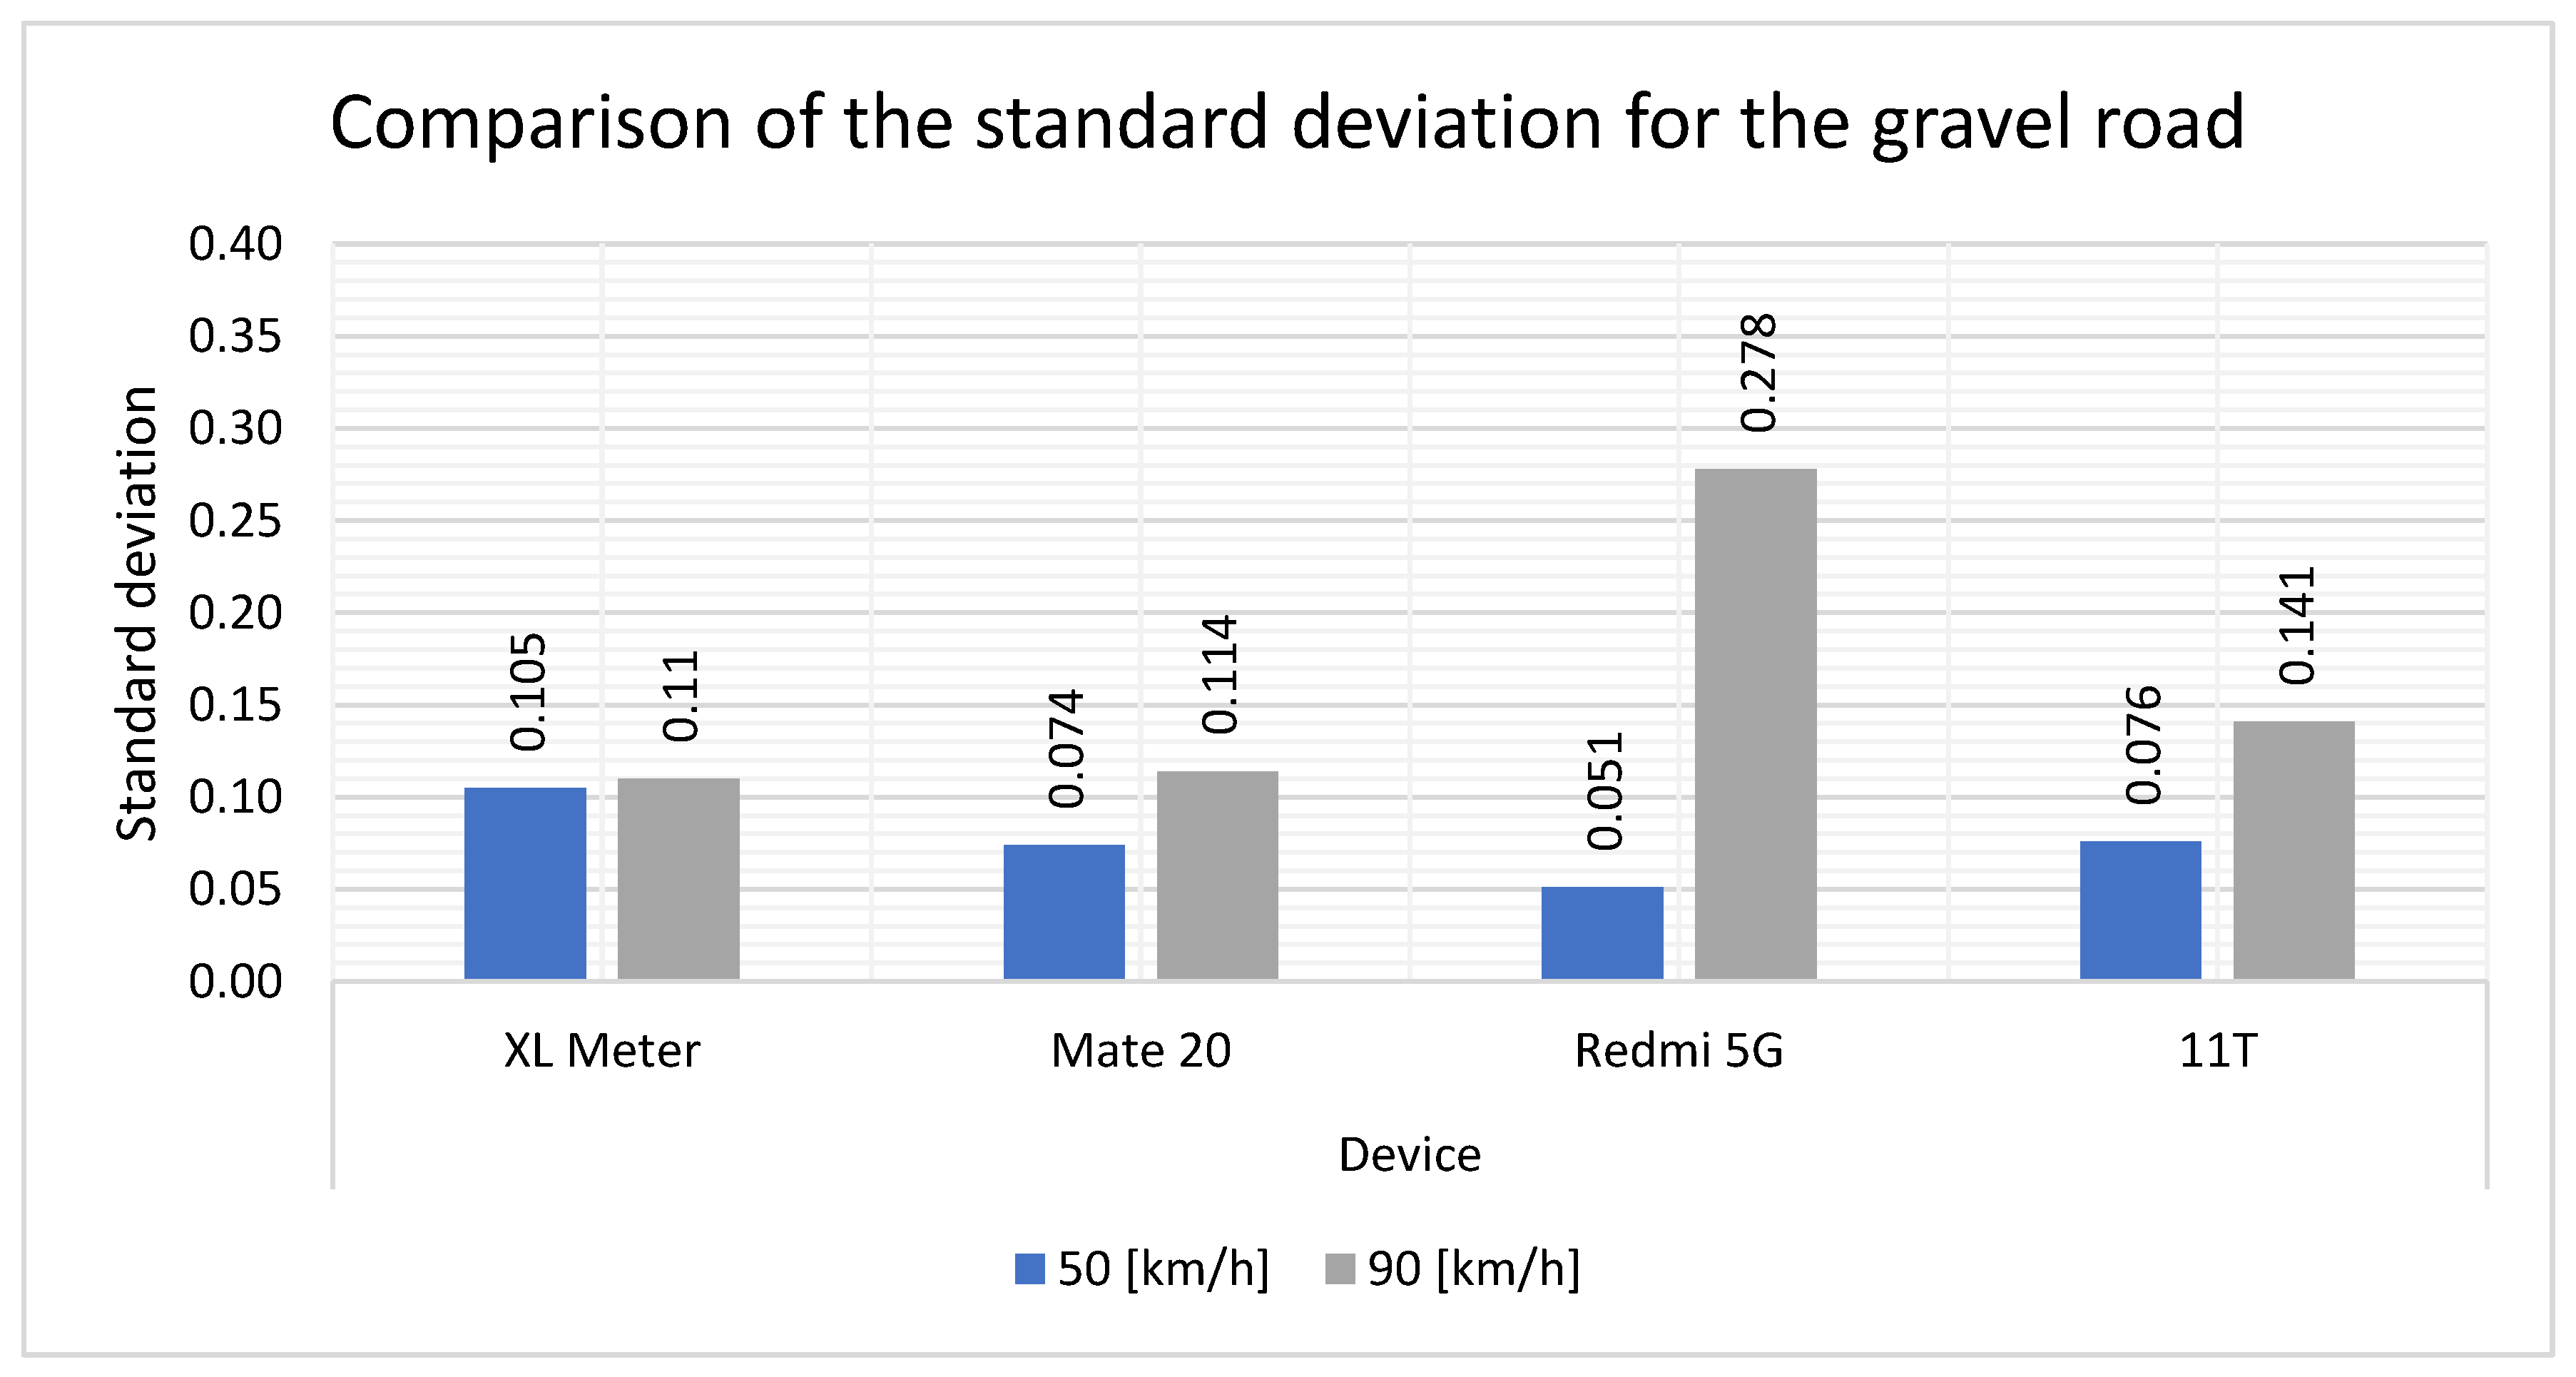
A comparison of the data in Table 9 reveals that the smartphones exhibit similar values to those of the XL Meter. However, the Redmi 5G smartphone stands out as an outlier, with significantly different results. Overall, the standard deviations for these measurements are relatively low, indicating a high degree of consistency. Notably, the average value for the 11T smartphone is only 0.001 different from the XL Meter values.
Table 9.
Comparison of the standard deviation for the gravel road.
The standard deviation values on the gravel roadway (Figure 17) exhibit the lowest deviations of all measurements. At a speed of 50 km/h, the standard deviation is notably minimal. However, a discrepancy is observed with the Redmi 5G, where the standard deviation values at 90 km/h are found to be higher than those of the XL Meter.
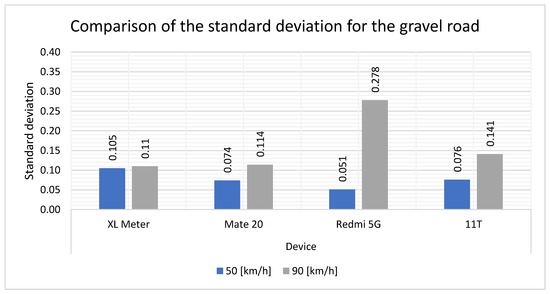
Figure 17.
Comparison of the standard deviation for the gravel road.
3.4. Evaluation of Braking Distance
The braking distance is a crucial factor in assessing the braking deceleration of vehicles. In addition to the force exerted by the vehicle to bring it to a stop, it is also essential to determine the distance at which this occurs.
3.4.1. Braking Distance on Dry Road
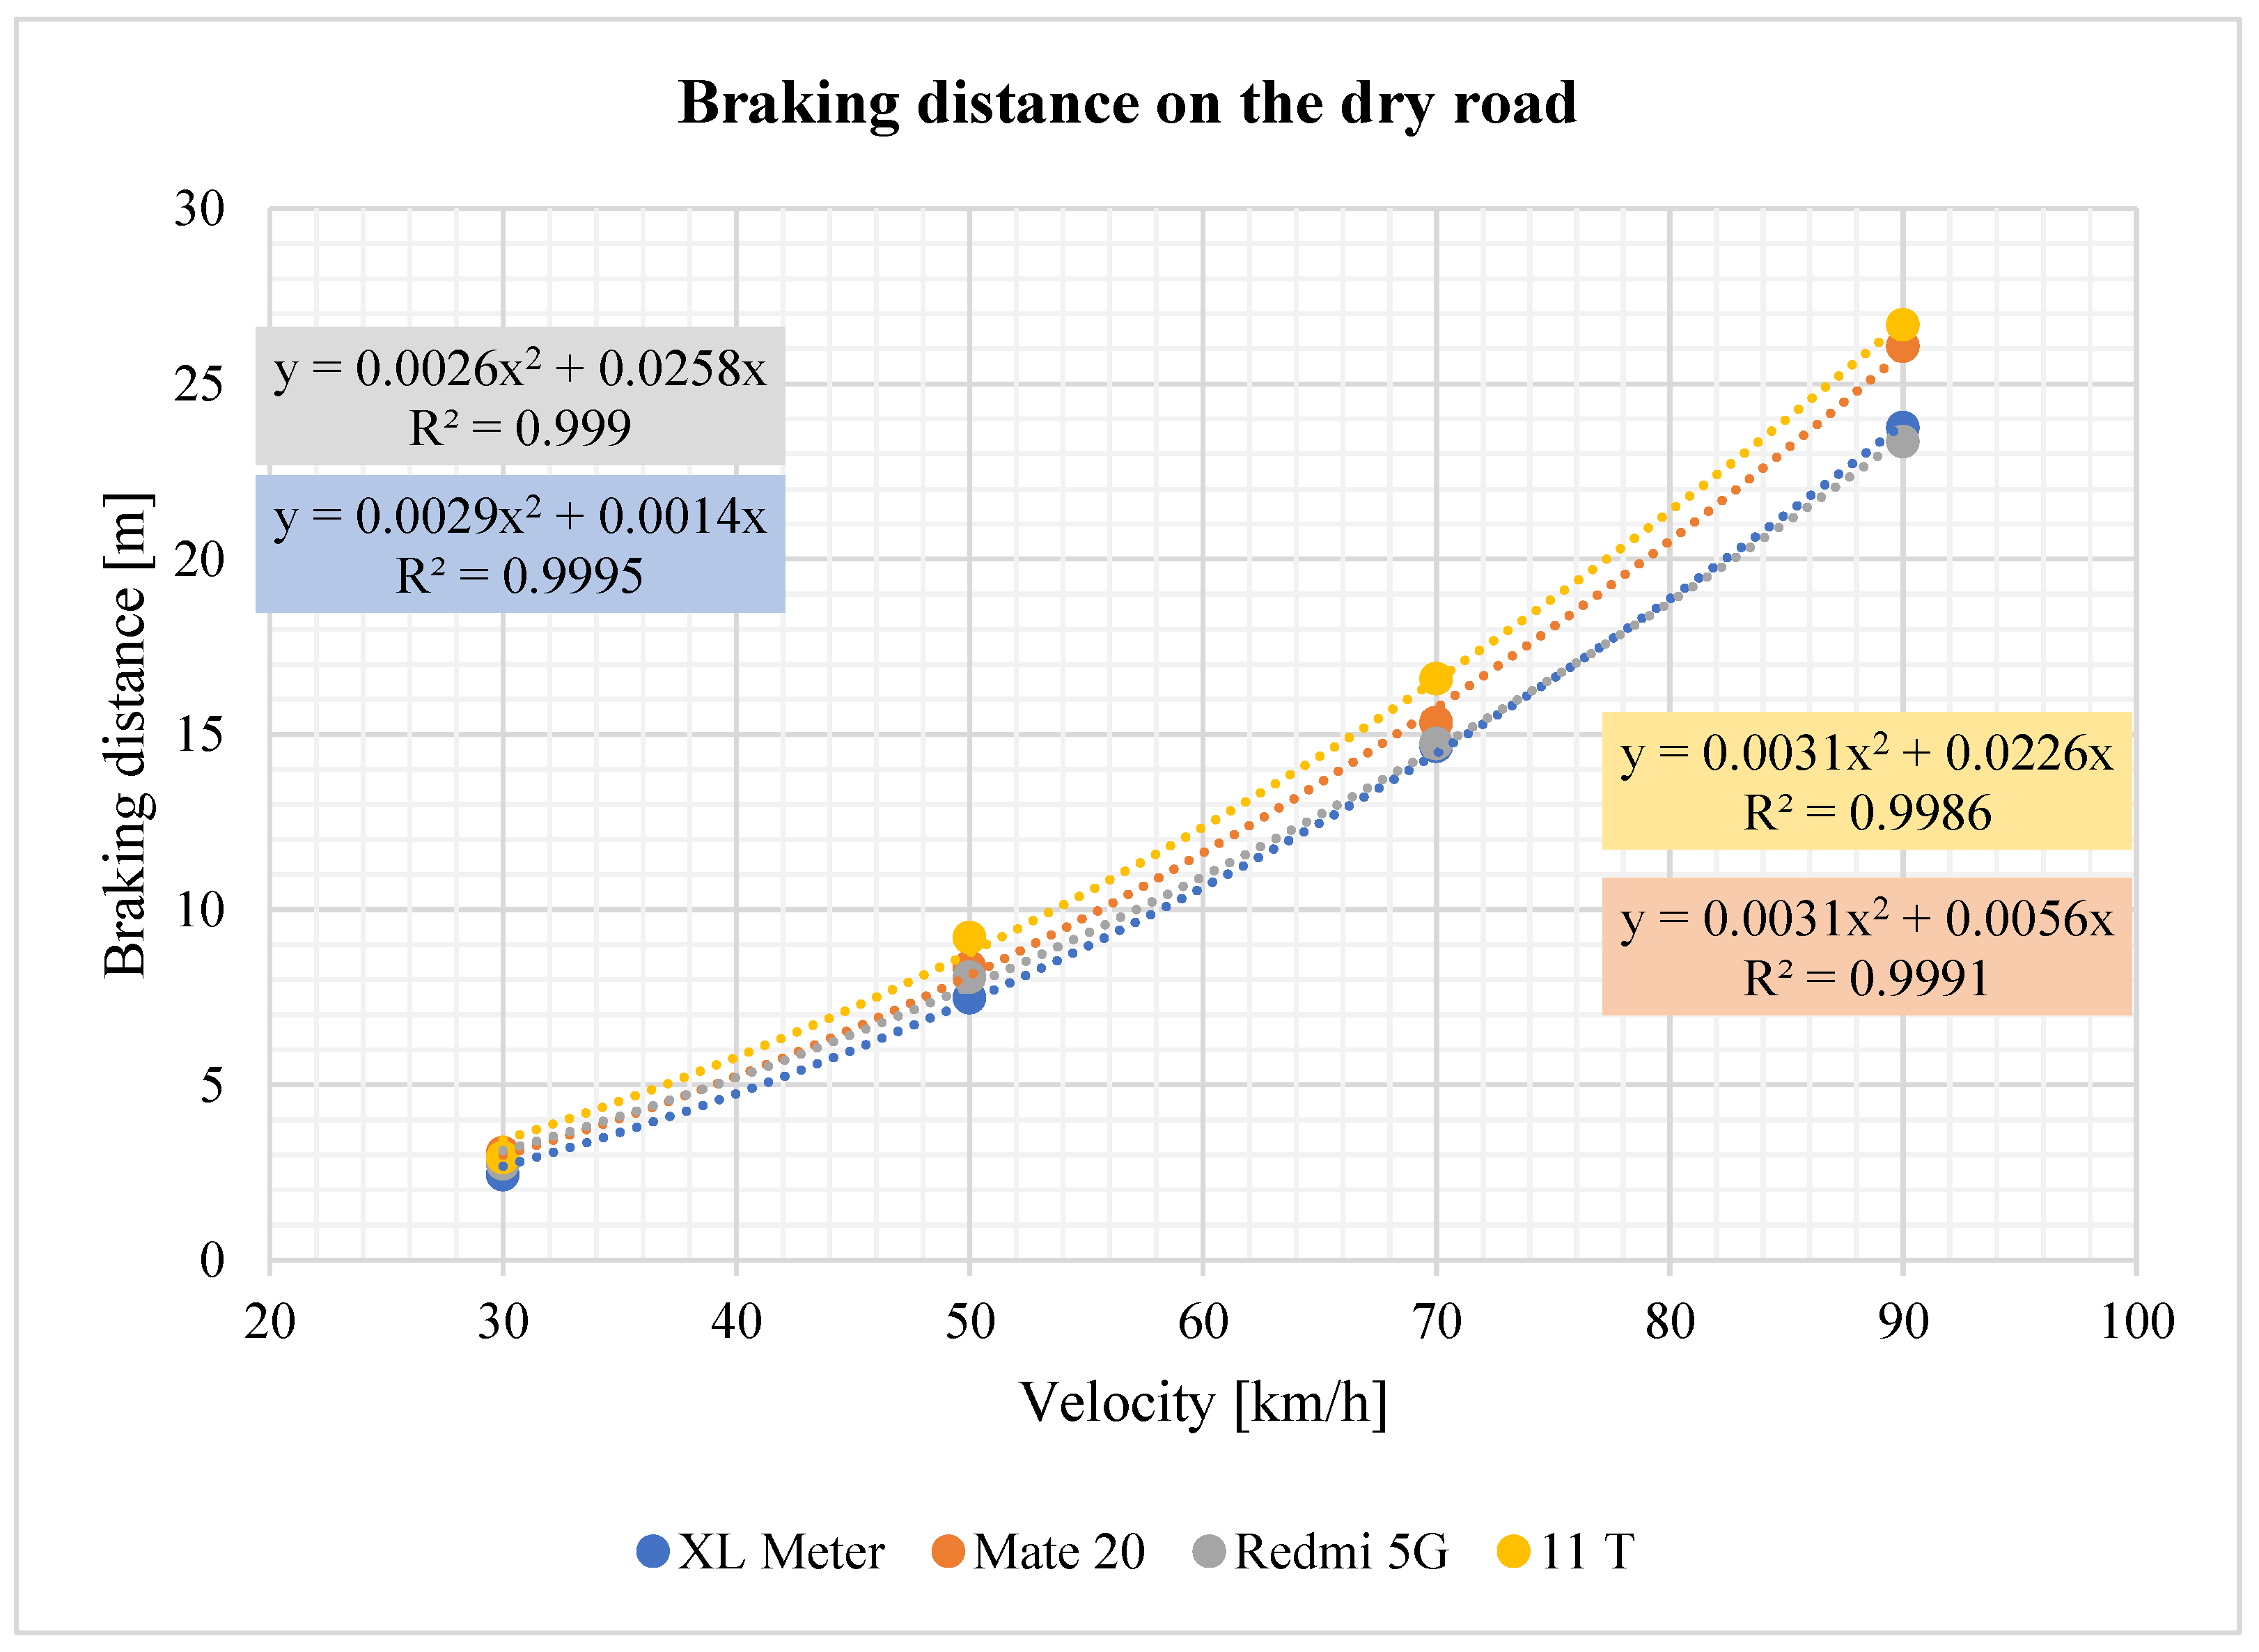
Table 10 illustrates the differences between the devices under consideration. At a speed of 30 km/h, the measured values are close to the standard set by the XL Meter. However, at a speed of 50 km/h, the differences increase to higher values, reaching almost 2 m. It is evident that these differences increase with speed. Furthermore, the braking distances were compared between the different devices. It can be observed that, on average, the smartphones exhibited discrepancies from the values obtained with the XL Meter. In the majority of instances, either the smartphones yielded a larger braking distance or a smaller one. The discrepancy is not limited to the comparison between the XL Meter and the smartphones; it also encompasses the comparison between the smartphones themselves, where their measured values differ. The Redmi 5G smartphone exhibited the closest proximity to the XL Meter.
Table 10.
Comparison of braking distances on the dry road.
Figure 18 illustrates the evaluation of the braking distance of the vehicle with increasing speed. It can be observed that there is a gradual increase in braking distance with speed and that there are differences between the XL Meter and smartphones. The graph also shows the regression equations of the given waveform.
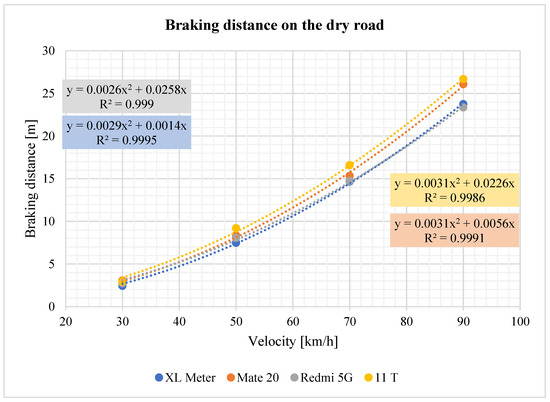
Figure 18.
Braking distance on the dry road.
3.4.2. Braking Distance on the Wet Road
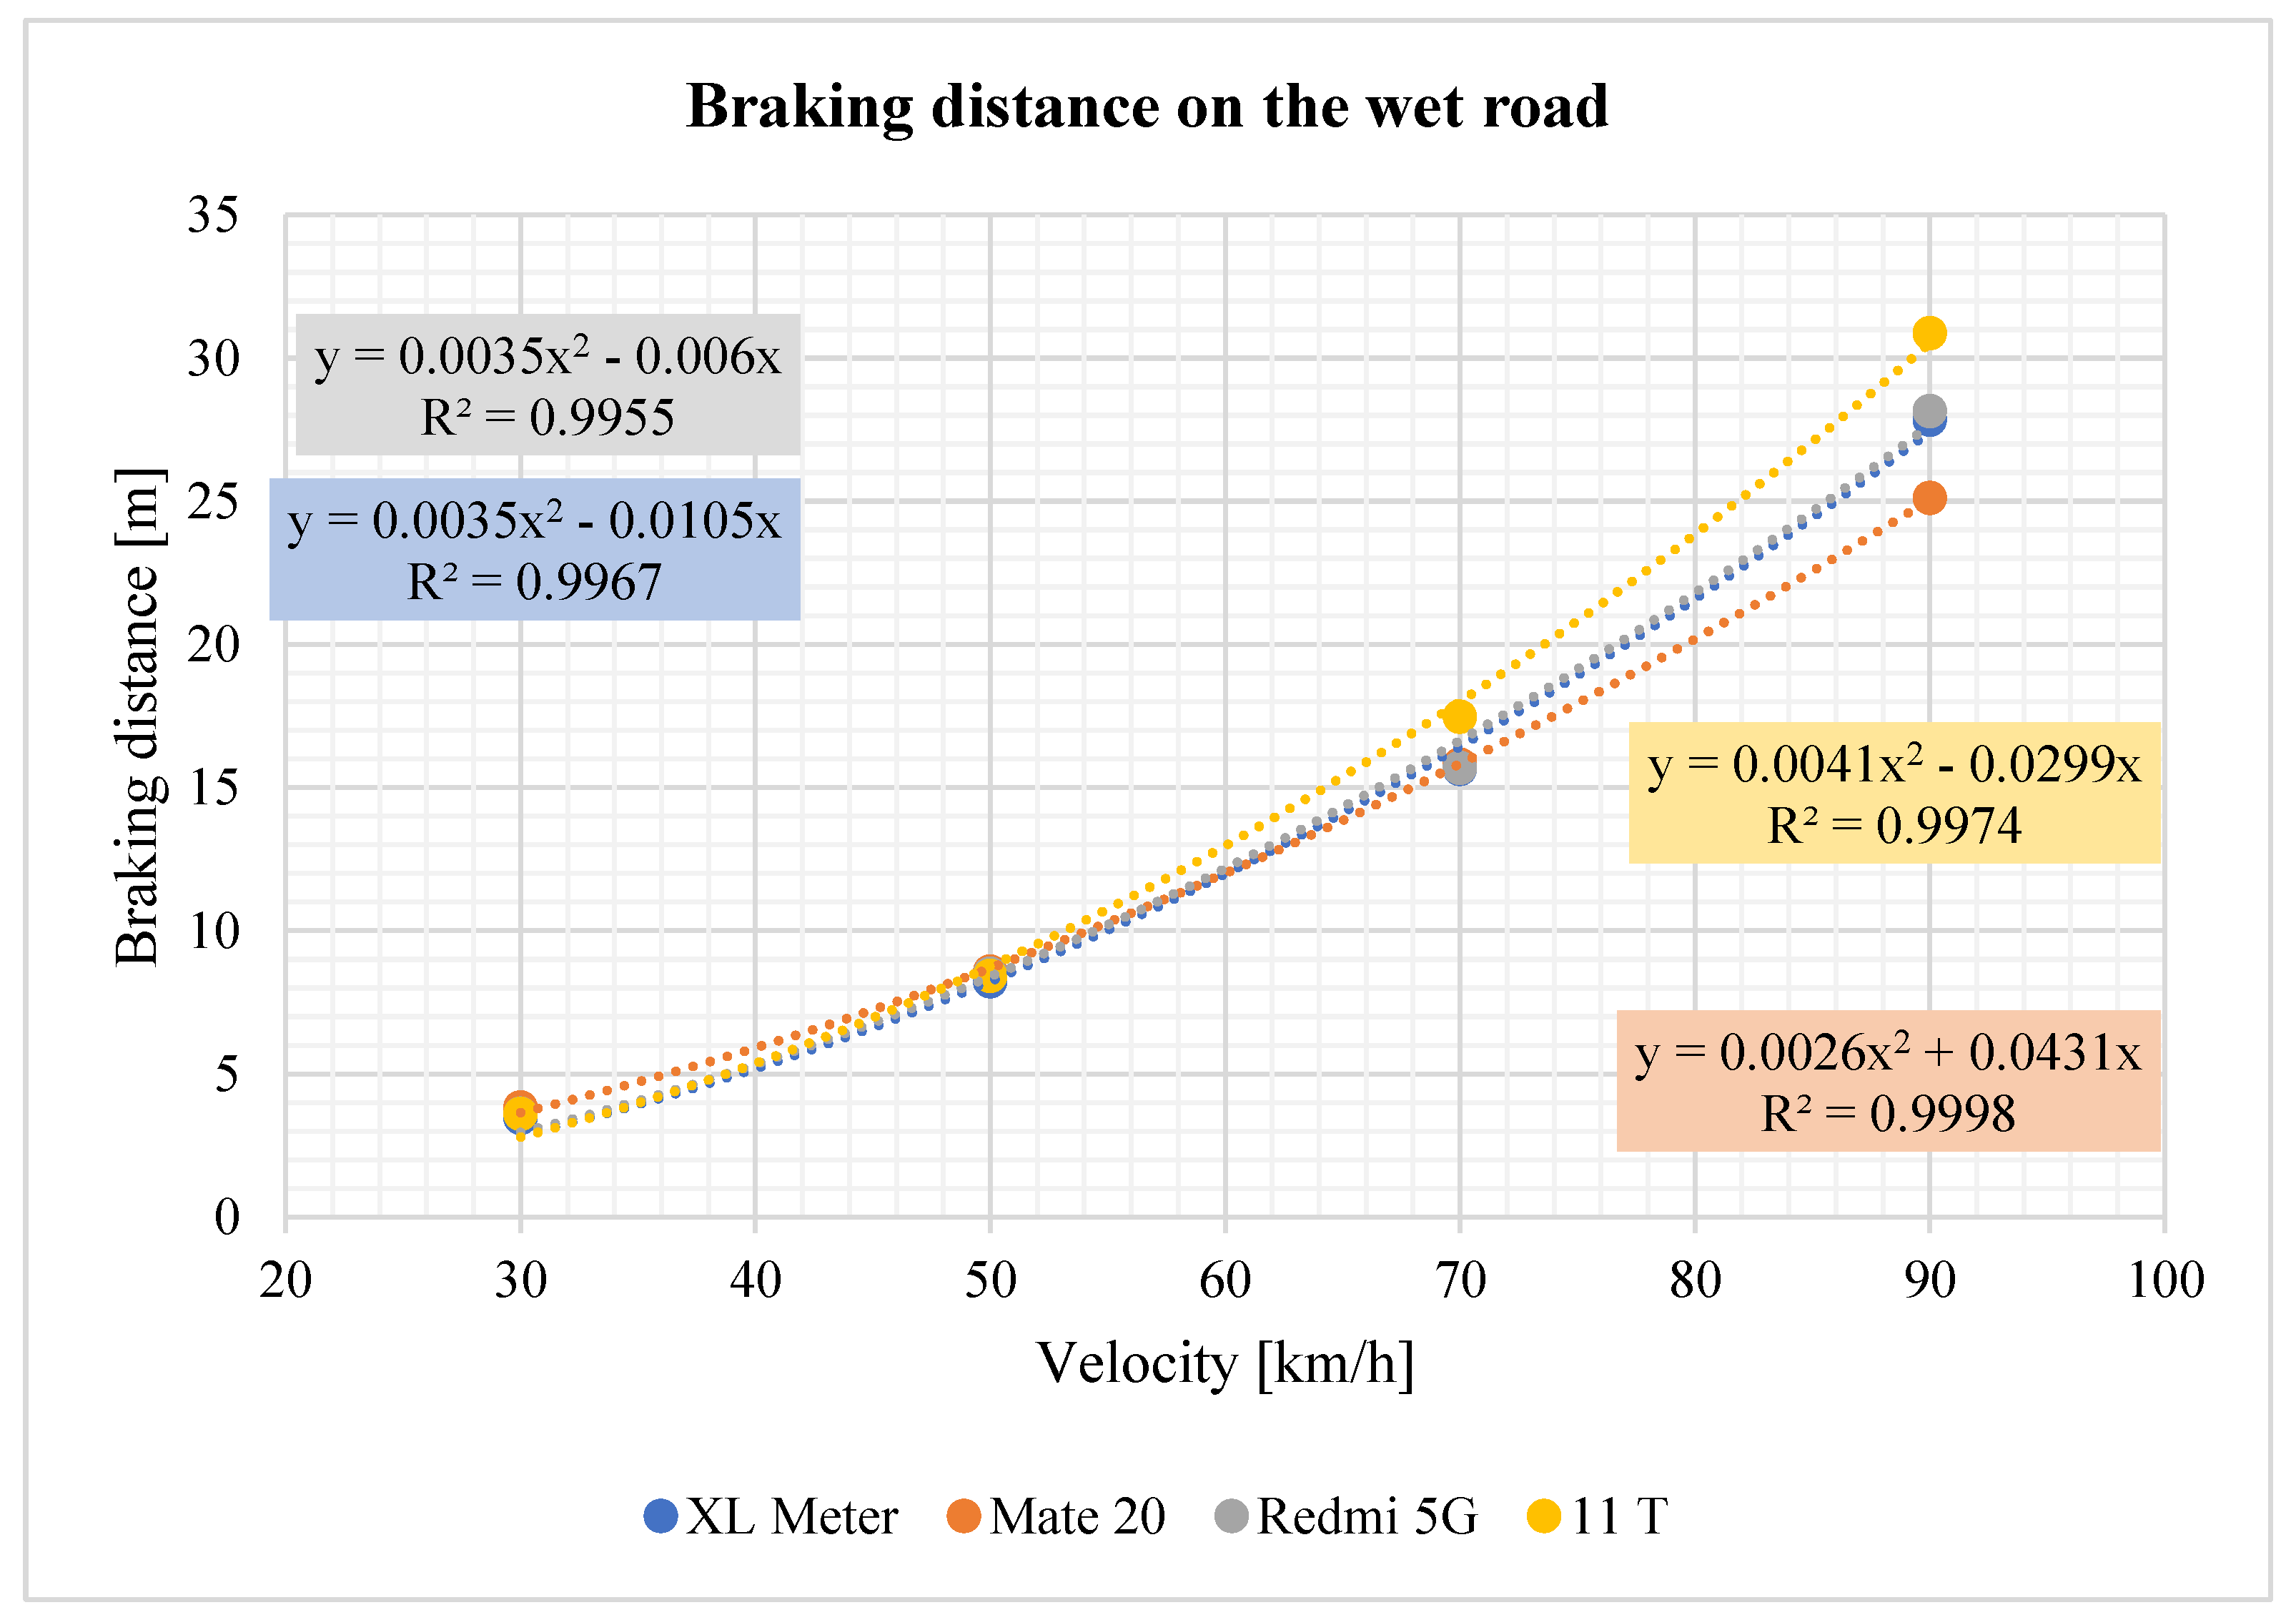
Table 11 illustrates the variability in values between the average measurements obtained from the devices. At low speeds, 30 and 50 km/h, the measured values of all devices are relatively consistent. However, at 70 km/h, there is a notable discrepancy, with two of the smartphones exhibiting closer alignment with the values measured by the XL Meter, while the Xiaomi 11T smartphone exhibited higher values. Significant discrepancies were observed in the measured values at the maximum speed of 90 km/h. Even between smartphones, the readings exhibited notable differences at this speed.
Table 11.
Comparison of braking distances on the wet road.
As Figure 19 shows, in wet road conditions, the deceleration of the devices differs significantly at low speeds (30 and 50 km/h). At speeds of 70 and 90 km/h, the differences in the average values measured become more pronounced. This is particularly evident at 90 km/h, where the XL Meter and smartphone measurements diverge significantly. The regression equations for the braking distance curves on wet roads are once again provided in the graph.
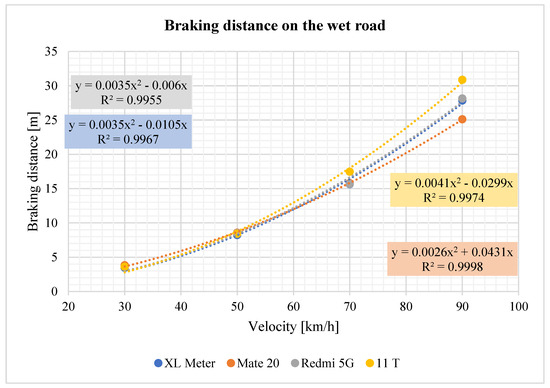
Figure 19.
Braking distance on the wet road.
3.4.3. Braking Distance on Gravel Road
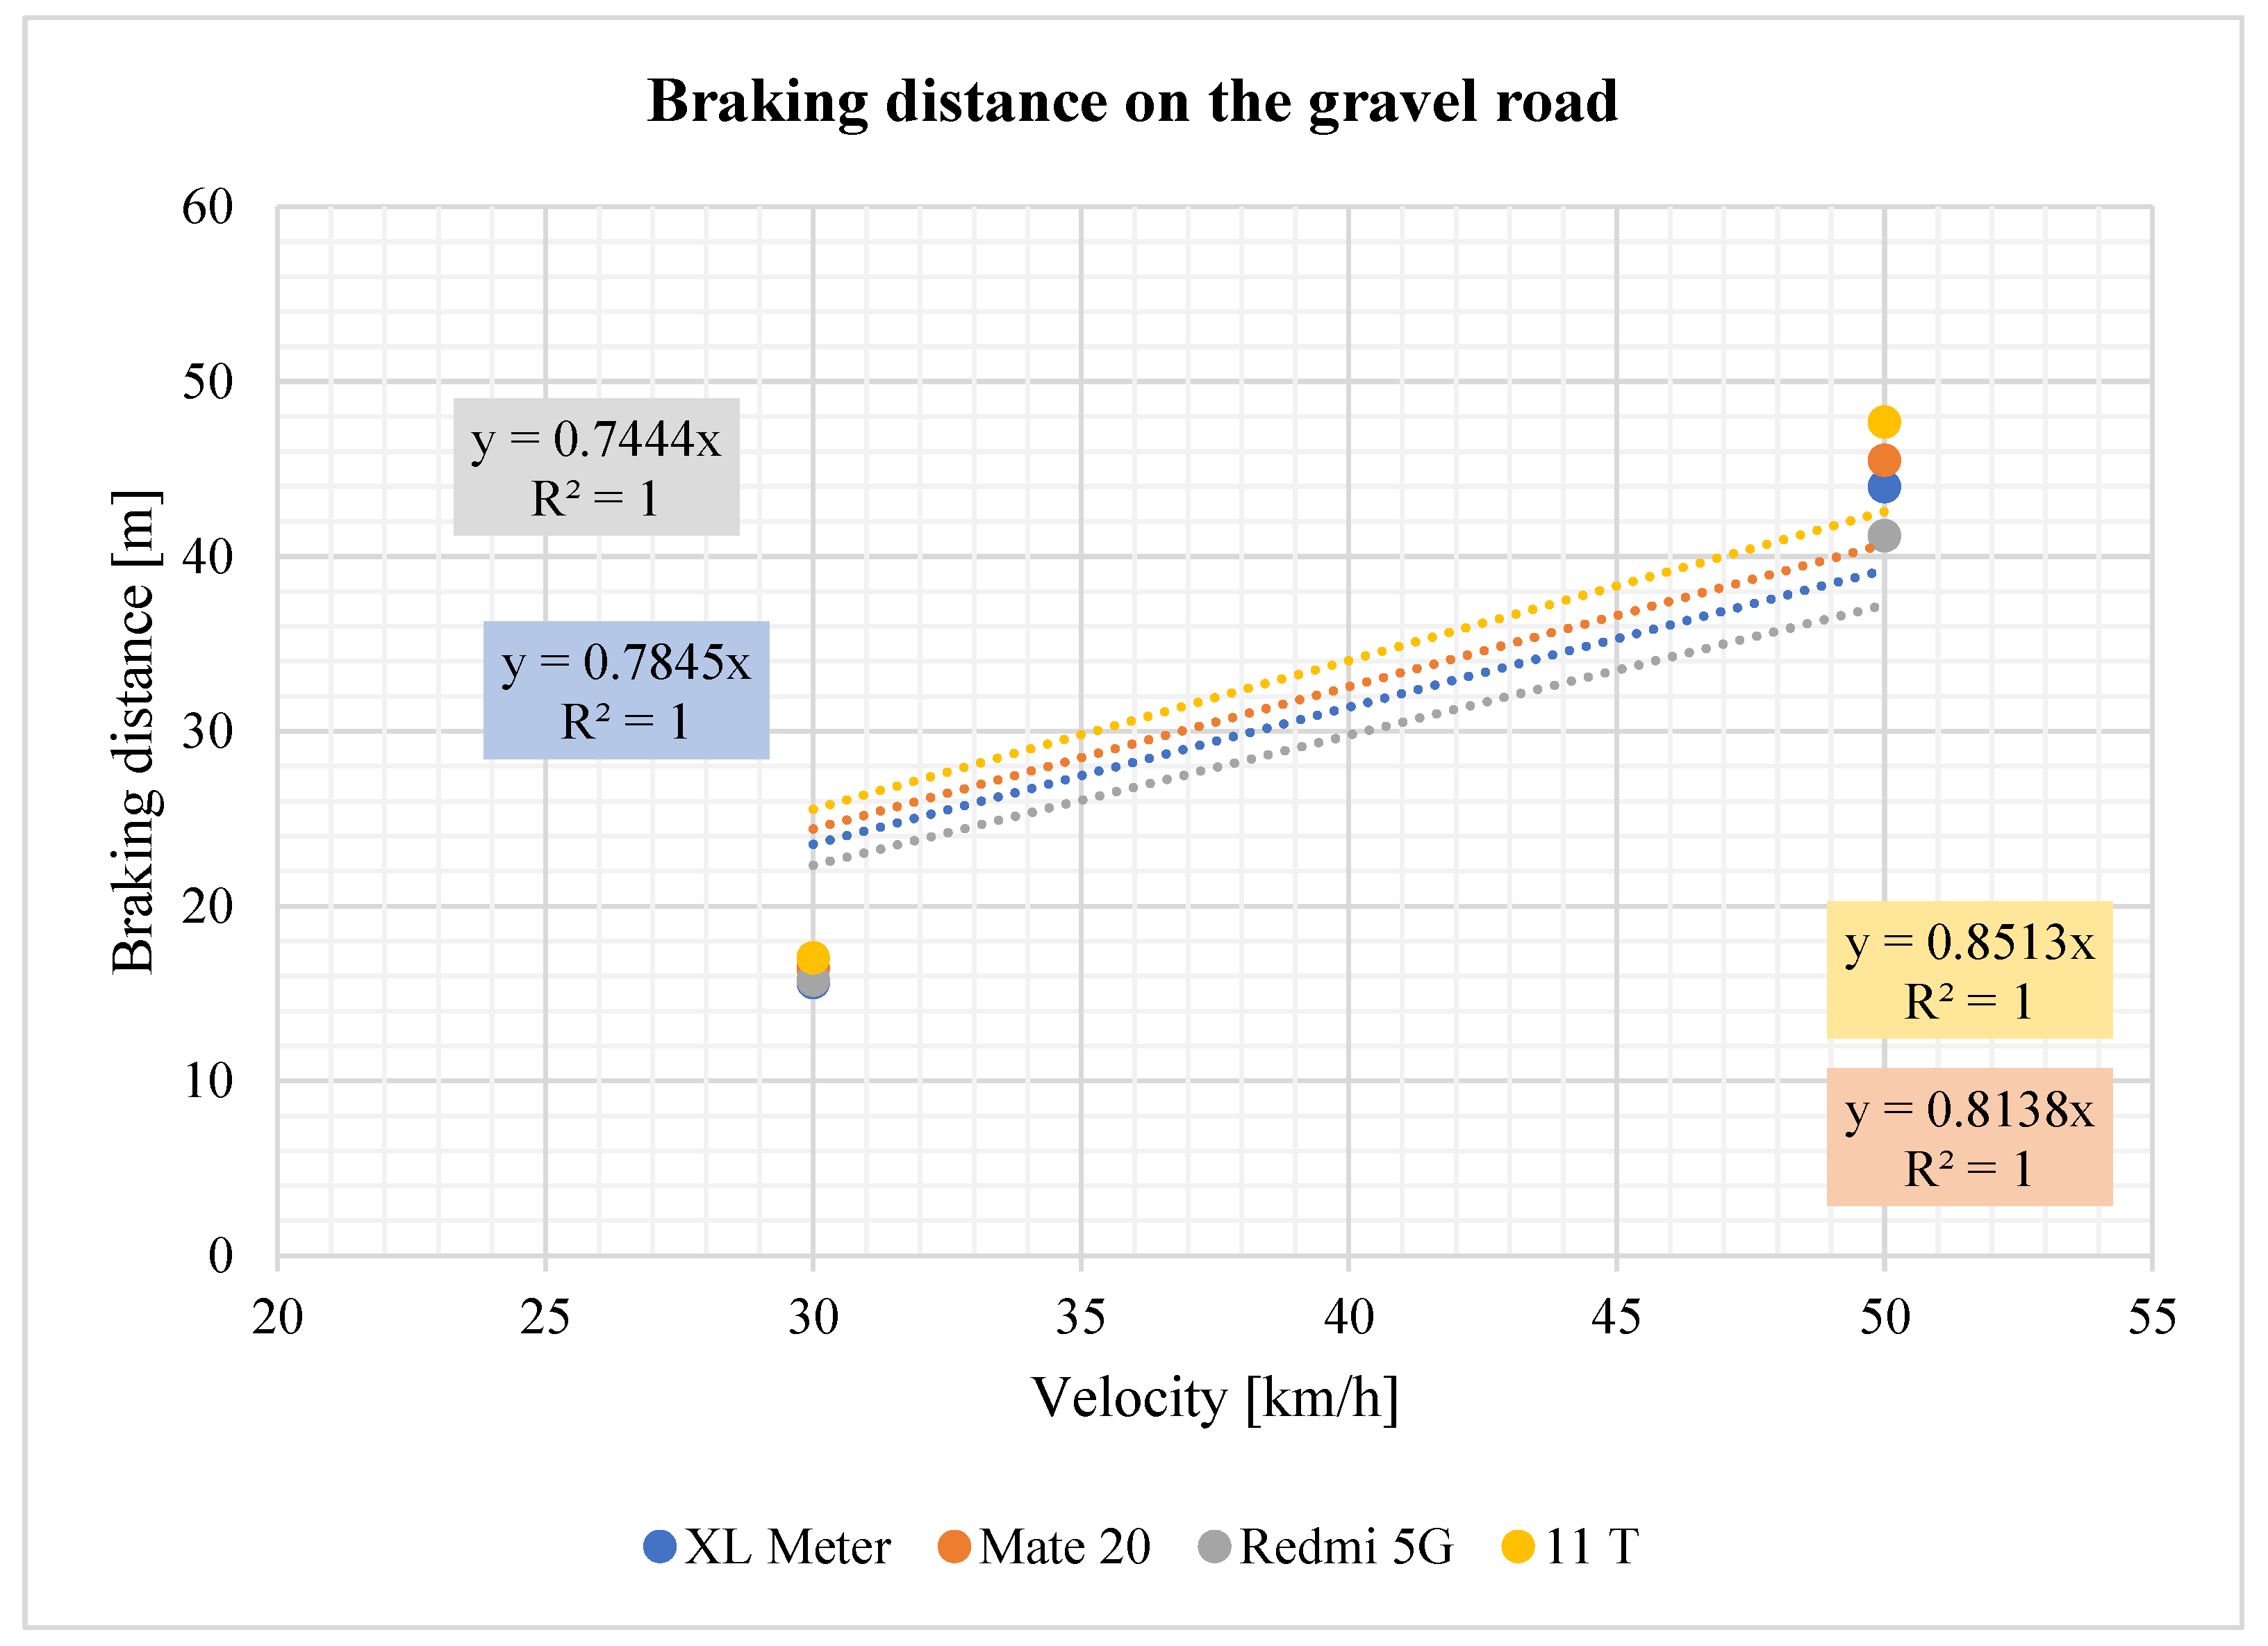
As Table 12 shows, although the values at 50 km/h are approximately the same in the graph (Figure 20), it can be seen that there are individual differences between them. These differences reach values of up to 1.5 m at lower speeds, while at 90 km/h, they reach almost 4 m. At high speeds, there are already large differences in the distance that the smartphones have to the XL Meter, as well as between each other.
Table 12.
Comparison of braking distances on the gravel road.
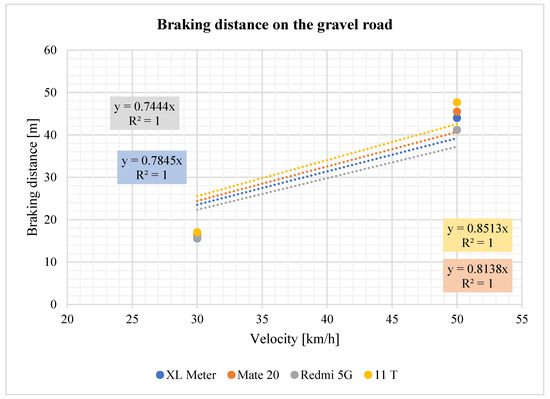
Figure 20.
Braking distance on the gravel road.
The observed trends in the measured values when braking on a gravel road are similar to those observed on a wet road. At a speed of 50 km/h, the braking distances measured between the devices are comparable. However, at 90 km/h, there are notable differences in the values measured by the smartphones. Additionally, regression equations for the braking behavior are provided for reference.
4. Discussion
The results of this research contribute to a nuanced understanding of the capabilities and limitations of smartphones in measuring the braking deceleration of motor vehicles. Our findings indicate that while smartphones are viable tools for capturing deceleration data, their reliability varies significantly depending on the conditions under which they are used.
Sensitivity and Environmental Conditions: One notable limitation is the performance of smartphones at low speeds, particularly on wet surfaces. During tests conducted at 30 km/h on wet surfaces, we observed significant discrepancies between the maximum and minimum deceleration values recorded by smartphones compared to those obtained from the professional XL Meter. This variation could be attributed to the insufficient sensitivity of the smartphones’ accelerometers and gyroscopes, which struggle to accurately capture moderate braking deceleration. The use of advanced sensor fusion algorithms that combine data from multiple sensors to enhance sensitivity could be employed to enhance the accuracy of measurements. Future research could be directed towards integrating machine learning techniques to predict deceleration and to improve measurement accuracy under different conditions. This is particularly critical in scientific settings where precise data are essential for validating models of vehicle dynamics and safety systems.
Performance on Different Surfaces: Conversely, smartphones demonstrated sufficient accuracy when tested on gravel surfaces at speeds of 50 km/h. This suggests that smartphones are more suitable for applications requiring measurements at higher speeds and on surfaces that allow for extended braking distances. These conditions appear to mitigate some of the sensitivity issues observed at lower speeds, providing more reliable data that could potentially be used for preliminary assessments of vehicle performance or in scenarios where high precision is not paramount.
Impact of Repeated Measurements: The research also highlights the importance of repeated measurements to counteract the effects of anomalies that may occur due to the instability of the measurement environment. Ensuring consistency in smartphone-based measurements requires careful consideration of the number of trials and the environmental factors at play during each test. Our comparisons across different smartphone models revealed that mid-priced devices often perform comparably to more expensive alternatives, suggesting that for many applications, the additional investment in high-end smartphones may not yield proportional improvements in data quality. However, the method of device mounting significantly affects measurement accuracy. Precise and expensive smartphones are particularly sensitive to slight changes in orientation, which can inadvertently alter the recorded data. This necessitates the implementation of standardized mounting protocols to ensure the maintenance of data integrity across diverse devices and testing conditions.
Technological and Practical Recommendations: From a scientific standpoint, selecting a smartphone from the mid-priced category may represent an optimal balance between cost and functionality. Older and less powerful models have demonstrated a proclivity towards operational delays or freezes during data collection, which can extend measurement times and compromise data accuracy. Consequently, upgrading to newer models with enhanced processing capabilities and updated sensor technology is recommended.
Future Directions: Considering the rapid advancements in smartphone technology, future research should focus on enhancing the sensitivity and accuracy of these devices’ sensors. Additionally, developing robust software solutions that can compensate for hardware limitations and standardize data collection methods will be crucial. This could broaden the scope of using smartphones in vehicular testing, potentially making them a staple in both professional and academic studies related to traffic safety and vehicle dynamics.
5. Conclusions
This research validates the effectiveness of smartphones as alternative tools for measuring vehicle deceleration on dry and gravel surfaces when vehicles are traveling at high speeds. The demonstrated accuracy and reliability in these specific scenarios indicate that smartphones, particularly those in the mid-range price segment, can indeed replace more expensive models for certain types of vehicular testing, thus offering a cost-effective solution for traffic safety analysis. However, the performance of smartphones in low-speed and wet conditions reveals significant limitations. In these challenging conditions, the sensitivity of smartphone sensors—primarily accelerometers and gyroscopes—is insufficient to capture subtle yet critical deceleration values accurately. This discrepancy underscores the need for traditional high-precision devices when conducting comprehensive vehicular tests across a broader range of environmental conditions.
Additionally, our findings highlight the importance of device orientation and mounting technique in the accuracy of data collection. Inaccurate mounting can introduce significant errors, which complicates the data interpretation process.
In the future, it is crucial to enhance the precision of smartphone sensors in order to expand their applicability in traffic safety research. Furthermore, the establishment of standardized protocols for the use of smartphones in vehicular testing will be of great importance. These protocols should address mounting positions, environmental considerations, and calibration procedures in order to ensure consistency and reliability in results, thereby allowing smartphones to be more widely accepted as valid instruments in scientific studies.
This research not only demonstrates the potential of integrating accessible technology into vehicular safety testing but also outlines a framework for future research aimed at optimizing these tools for more widespread scientific and practical applications.
Author Contributions
Conceptualization, A.J. and J.O.; methodology, J.O., P.V. and A.J.; software, J.O. and P.V.; validation, A.J., J.O. and M.G.; formal analysis, M.G.; investigation, A.J. and J.O.; resources, P.V., J.C. and Ž.Š.; data curation, A.J.; writing—original draft preparation, A.J. and J.O.; writing—review and editing, M.G. and J.C.; visualization, Ž.Š.; supervision, A.J.; project administration, J.O.; funding acquisition, J.O. All authors have read and agreed to the published version of the manuscript.
Funding
This research received no external funding.
Institutional Review Board Statement
Not applicable.
Informed Consent Statement
Not applicable.
Data Availability Statement
The data presented in this research are available on request from the corresponding author.
Acknowledgments
This research was supported by the Slovak Research and Development Agency under contract no. APVV-20-0626. This work was created within the project APVV-20-0626: Biofidelic human body surrogate to increase the objectivity within the forensic analysis of road traffic accidents, and by the project of the UNIZA grant system, University of Zilina, no. 20225/2023, “Perspective use of the video analysis method during driving tests”.
Conflicts of Interest
The authors declare no conflicts of interest.
References
- Kožuch, P.; Hujo, Ľ.; Muślewski, Ł.; Markiewicz-Patalon, M. Dynamic and Stationary Testing of Vehicle Braking Systems. Acta Technol. Agric. 2023, 26, 238–243. [Google Scholar] [CrossRef]
- Kashkanov, A.; Semenov, A.; Kashkanova, A.; Kryvinska, N.; Palchevskyi, O.; Baraban, S. Estimating the Effectiveness of Electric Vehicles Braking When Determining the Circumstances of a Traffic Accident. Sci. Rep. 2023, 13, 19916. [Google Scholar] [CrossRef] [PubMed]
- Kashkanov, A.A.; Rotshtein, A.P.; Kucheruk, V.Y.; Kashkanov, V.A. Tyre-Road Friction Coefficient: Estimation Adaptive System. Bull. Karaganda Univ. Phys. Ser. 2020, 98, 50–59. [Google Scholar] [CrossRef] [PubMed]
- Kuchar, P.; Janoško, I.; Holúbek, M.; Čedík, J.; Pexa, M. The Accuracy Assessment of Devices Used for Distance Measuring in Dynamic Vehicle Tests. Acta Technol. Agric. 2022, 25, 150–156. [Google Scholar] [CrossRef]
- Ondruš, J.; Hockicko, P. Braking Deceleration Measurement Using the Video Analysis of Motions by Sw Tracker. Transp. Telecommun. J. 2015, 16, 127–137. [Google Scholar] [CrossRef]
- Min, K.; Yeon, K.; Jo, Y.; Sim, G.; Sunwoo, M.; Han, M. Vehicle Deceleration Prediction Based on Deep Neural Network at Braking Conditions. Int. J. Automot. Technol. 2020, 21, 91–102. [Google Scholar] [CrossRef]
- Tang, T.; Anupam, K.; Kasbergen, C.; Scarpas, A. Study of Influence of Operating Parameters on Braking Distance. Transp. Res. Rec. 2017, 2641, 139–148. [Google Scholar] [CrossRef]
- Viderščak, D.; Schauperl, Z.; Ormuž, K.; Šolić, S.; Nikšić, M.; Milčić, D.; Ormuž, P. Influence of Brake Pad Properties to Braking Characteristics. Promet 2022, 34, 91–102. [Google Scholar] [CrossRef]
- Ivanov, Z.; Sitnik, L.; Dimitrov, R.; Wrobel, R.; Mihaylov, V.; Skobiej, K.; Ivanov, D.; Andrych-Zalewska, M. Investigation Of Braking Deceleration In Vehicle. In Proceedings of the 2022 8th International Conference on Energy Efficiency and Agricultural Engineering (EE&AE), Ruse, Bulgaria, 30 June–2 July 2022; pp. 1–4. [Google Scholar] [CrossRef]
- Bošković, B.; Stojanovic, N.; Grujic, I.; Babic, S. Experimental Investigation of the Influence of Deceleration on Brake Elements Temperature in Order to Improve Traffic Safety. Therm. Sci. 2023, 286. [Google Scholar] [CrossRef]
- Skrúcaný, T.; Synák, F.; Semanová, Š. Influence of the Braking System That Is Contrary to Legislation on Breaking Characteristics of Passenger Car. Transp. Tech. Technol. 2018, 14, 1–5. [Google Scholar] [CrossRef]
- Kudarauskas, N. Analysis of Emergency Braking of a Vehicle. Transport 2007, 22, 154–159. [Google Scholar] [CrossRef]
- Erfianto, B.; Rahmatsyah, A. Forensic Analysis of Braking Classification Based on Acceleration, Jerk, and Velocity Data. Kinet. Game Technol. Inf. Syst. Comput. Netw. Comput. Electron. Control 2021, 6, 211–220. [Google Scholar] [CrossRef]
- Skrucany, T.; Vrabel, J.; Kazimir, P. The Influence of the Cargo Weight and Its Position on the Braking Characteristics of Light Commercial Vehicles. Open Eng. 2020, 10, 154–165. [Google Scholar] [CrossRef]
- Marienka, P.; Frančák, M.; Jagelčák, J.; Synák, F. Comparison of Braking Characteristics of Solo Vehicle and Selected Types of Vehicle Combinations. Transp. Res. Procedia 2020, 44, 40–46. [Google Scholar] [CrossRef]
- Maurya, A.K.; Bokare, P.S. Study of Deceleration Behaviour of Different Vehicle Types. Int. J. Traffic Transp. Eng. 2012, 2, 253–270. [Google Scholar] [CrossRef]
- Li, W.L.; Cao, C.; Zhou, W.; Gao, L. Influences of Initial Braking Velocity and Passenger Capacity on Mean Fully Developed Deceleration. Appl. Mech. Mater. 2013, 281, 201–205. [Google Scholar] [CrossRef]
- Li, W.L.; Zhou, W.; Gao, L. Vehicle Braking Efficiency On-Line Monitoring and Evaluation with MFDD. Adv. Mater. Res. 2012, 605–607, 968–971. [Google Scholar] [CrossRef]
- González, L.P.; Sánchez, S.S.; Garcia-Guzman, J.; Boada, M.J.L.; Boada, B.L. Simultaneous Estimation of Vehicle Roll and Sideslip Angles through a Deep Learning Approach. Sensors 2020, 20, 3679. [Google Scholar] [CrossRef]
- Zhang, S.; Li, D.; Du, F.; Wang, T.; Liu, Y. Prediction of Vehicle Braking Deceleration Based on BP Neural Network. J. Phys. Conf. Ser. 2022, 2183, 012025. [Google Scholar] [CrossRef]
- Hwang, M.H.; Lee, G.S.; Kim, E.; Kim, H.W.; Yoon, S.; Talluri, T.; Cha, H.R. Regenerative Braking Control Strategy Based on AI Algorithm to Improve Driving Comfort of Autonomous Vehicles. Appl. Sci. 2023, 13, 946. [Google Scholar] [CrossRef]
- Zamzamzadeh, M.; Saifizul, A.; Ramli, R.; Soong, M.F. Dynamic Simulation of Brake Pedal Force Effect on Heavy Vehicle Braking Distance under Wet Road Conditions. Int. J. Automot. Mech. Eng. 2016, 13, 3555–3563. [Google Scholar] [CrossRef]
- Ackermann, C.; Beggiato, M.; Bluhm, L.-F.; Löw, A.; Krems, J.F. Deceleration Parameters and Their Applicability as Informal Communication Signal between Pedestrians and Automated Vehicles. Transp. Res. Part F Traffic Psychol. Behav. 2019, 62, 757–768. [Google Scholar] [CrossRef]
- Samson, C.J.R.; Hussain, Q.; Alhajyaseen, W.K.M. Analysis of Stopping Sight Distance (SSD) Parameters: A Review Study. Procedia Comput. Sci. 2022, 201, 126–133. [Google Scholar] [CrossRef]
- Wang, J.; Ding, W.; Cui, B.; Shao, J.; Weng, D.; Chen, W. Deep Learning-Driven Automatic Estimation of Smartphone Installation Angles for Vehicle Navigation. In Proceedings of the 2023 IEEE/ION Position, Location and Navigation Symposium (PLANS), Monterey, CA, USA, 24–27 April 2023; pp. 137–142. [Google Scholar] [CrossRef]
- Vodovozov, V.; Aksjonov, A.; Petlenkov, E.; Raud, Z. Neural Network-Based Model Reference Control of Braking Electric Vehicles. Energies 2021, 14, 2373. [Google Scholar] [CrossRef]
- Min, K.; Sim, G.; Ahn, S.; Sunwoo, M.; Jo, K. Vehicle Deceleration Prediction Model to Reflect Individual Driver Characteristics by Online Parameter Learning for Autonomous Regenerative Braking of Electric Vehicles. Sensors 2019, 19, 4171. [Google Scholar] [CrossRef] [PubMed]
- Lytrivis, P.; Thomaidis, G.; Amditis, A. Sensor Data Fusion in Automotive Applications; Intech: London, UK, 2009; Volume 490. [Google Scholar]
- Sajal, M.S.R.; Jahan, M.; Islam, S. Cost-Effective Vehicle Monitoring System for Detecting Unacceptable Driver Behaviors on Road. Int. J. Eng. Res. 2019, 8, IJERTV8IS100336. [Google Scholar] [CrossRef]
- Singh, P.; Juneja, N.; Kapoor, S. Using Mobile Phone Sensors to Detect Driving Behavior. In Proceedings of the 3rd ACM Symposium on Computing for Development, Bangalore, India, 11–12 January 2013; pp. 1–2. [Google Scholar]
- Wu, M.; Zhang, S.; Dong, Y. A Novel Model-Based Driving Behavior Recognition System Using Motion Sensors. Sensors 2016, 16, 1746. [Google Scholar] [CrossRef] [PubMed]
- Gnap, J.; Jagelčák, J.; Marienka, P.; Frančák, M.; Kostrzewski, M. Application of MEMS Sensors for Evaluation of the Dynamics for Cargo Securing on Road Vehicles. Sensors 2021, 21, 2881. [Google Scholar] [CrossRef] [PubMed]
- Jagelčák, J.; Gnap, J.; Kuba, O.; Frnda, J.; Kostrzewski, M. Determination of Turning Radius and Lateral Acceleration of Vehicle by GNSS/INS Sensor. Sensors 2022, 22, 2298. [Google Scholar] [CrossRef]
- Inventure Automotive. Available online: https://www.inventure-automotive.com/ (accessed on 28 February 2024).
- Nuswantoro, F.M.; Sudarsono, A.; Santoso, T.B. Abnormal Driving Detection Based on Accelerometer and Gyroscope Sensor on Smartphone Using Artificial Neural Network (ANN) Algorithm. In Proceedings of the 2020 International Electronics Symposium (IES), Surabaya, Indonesia, 29–30 September 2020; pp. 356–363. [Google Scholar]
- D’souza, W.T.; Kavitha, R. Human Activity Recognition Using Accelerometer and Gyroscope Sensors. Int. J. Eng. Technol. 2017, 9, 1171–1179. [Google Scholar] [CrossRef]
- Lu, D.-N.; Nguyen, D.-N.; Nguyen, T.-H.; Nguyen, H.-N. Vehicle Mode and Driving Activity Detection Based on Analyzing Sensor Data of Smartphones. Sensors 2018, 18, 1036. [Google Scholar] [CrossRef] [PubMed]
- Huawei Mate 20—Full Phone Specifications. Available online: https://www.gsmarena.com/huawei_mate_20-9367.php (accessed on 23 April 2024).
- Xiaomi Redmi Note 10 5G—Full Phone Specifications. Available online: https://www.gsmarena.com/xiaomi_redmi_note_10_5g-10768.php (accessed on 23 April 2024).
- Xiaomi 11T—Full Phone Specifications. Available online: https://www.gsmarena.com/xiaomi_11t-11099.php (accessed on 23 April 2024).
- Google Earth. Available online: https://earth.google.com/web/@48.30746013,17.58481183,143.69378208a,2108.15785898d,35y,359.99675246h,0t,0r/data=OgMKATA (accessed on 23 April 2024).


Disclaimer/Publisher’s Note: The statements, opinions and data contained in all publications are solely those of the individual author(s) and contributor(s) and not of MDPI and/or the editor(s). MDPI and/or the editor(s) disclaim responsibility for any injury to people or property resulting from any ideas, methods, instructions or products referred to in the content. |
© 2024 by the authors. Licensee MDPI, Basel, Switzerland. This article is an open access article distributed under the terms and conditions of the Creative Commons Attribution (CC BY) license (https://creativecommons.org/licenses/by/4.0/).