


Determination of the Ground Reaction Curve for an Elasto-Plasto-Fractured Rock Mass

 ,
, 
 and
and 
Abstract
1. Introduction
- The compressive strength of the rock mass within the inelastic zone is equal to the compressive strength in the elastic zone, satisfying the condition:
- The compressive strength of the rock mass within the inelastic zone is lower than the compressive strength in the elastic zone, meeting the following condition:
- The rock mass within the inelastic zone exhibits no compressive strength:
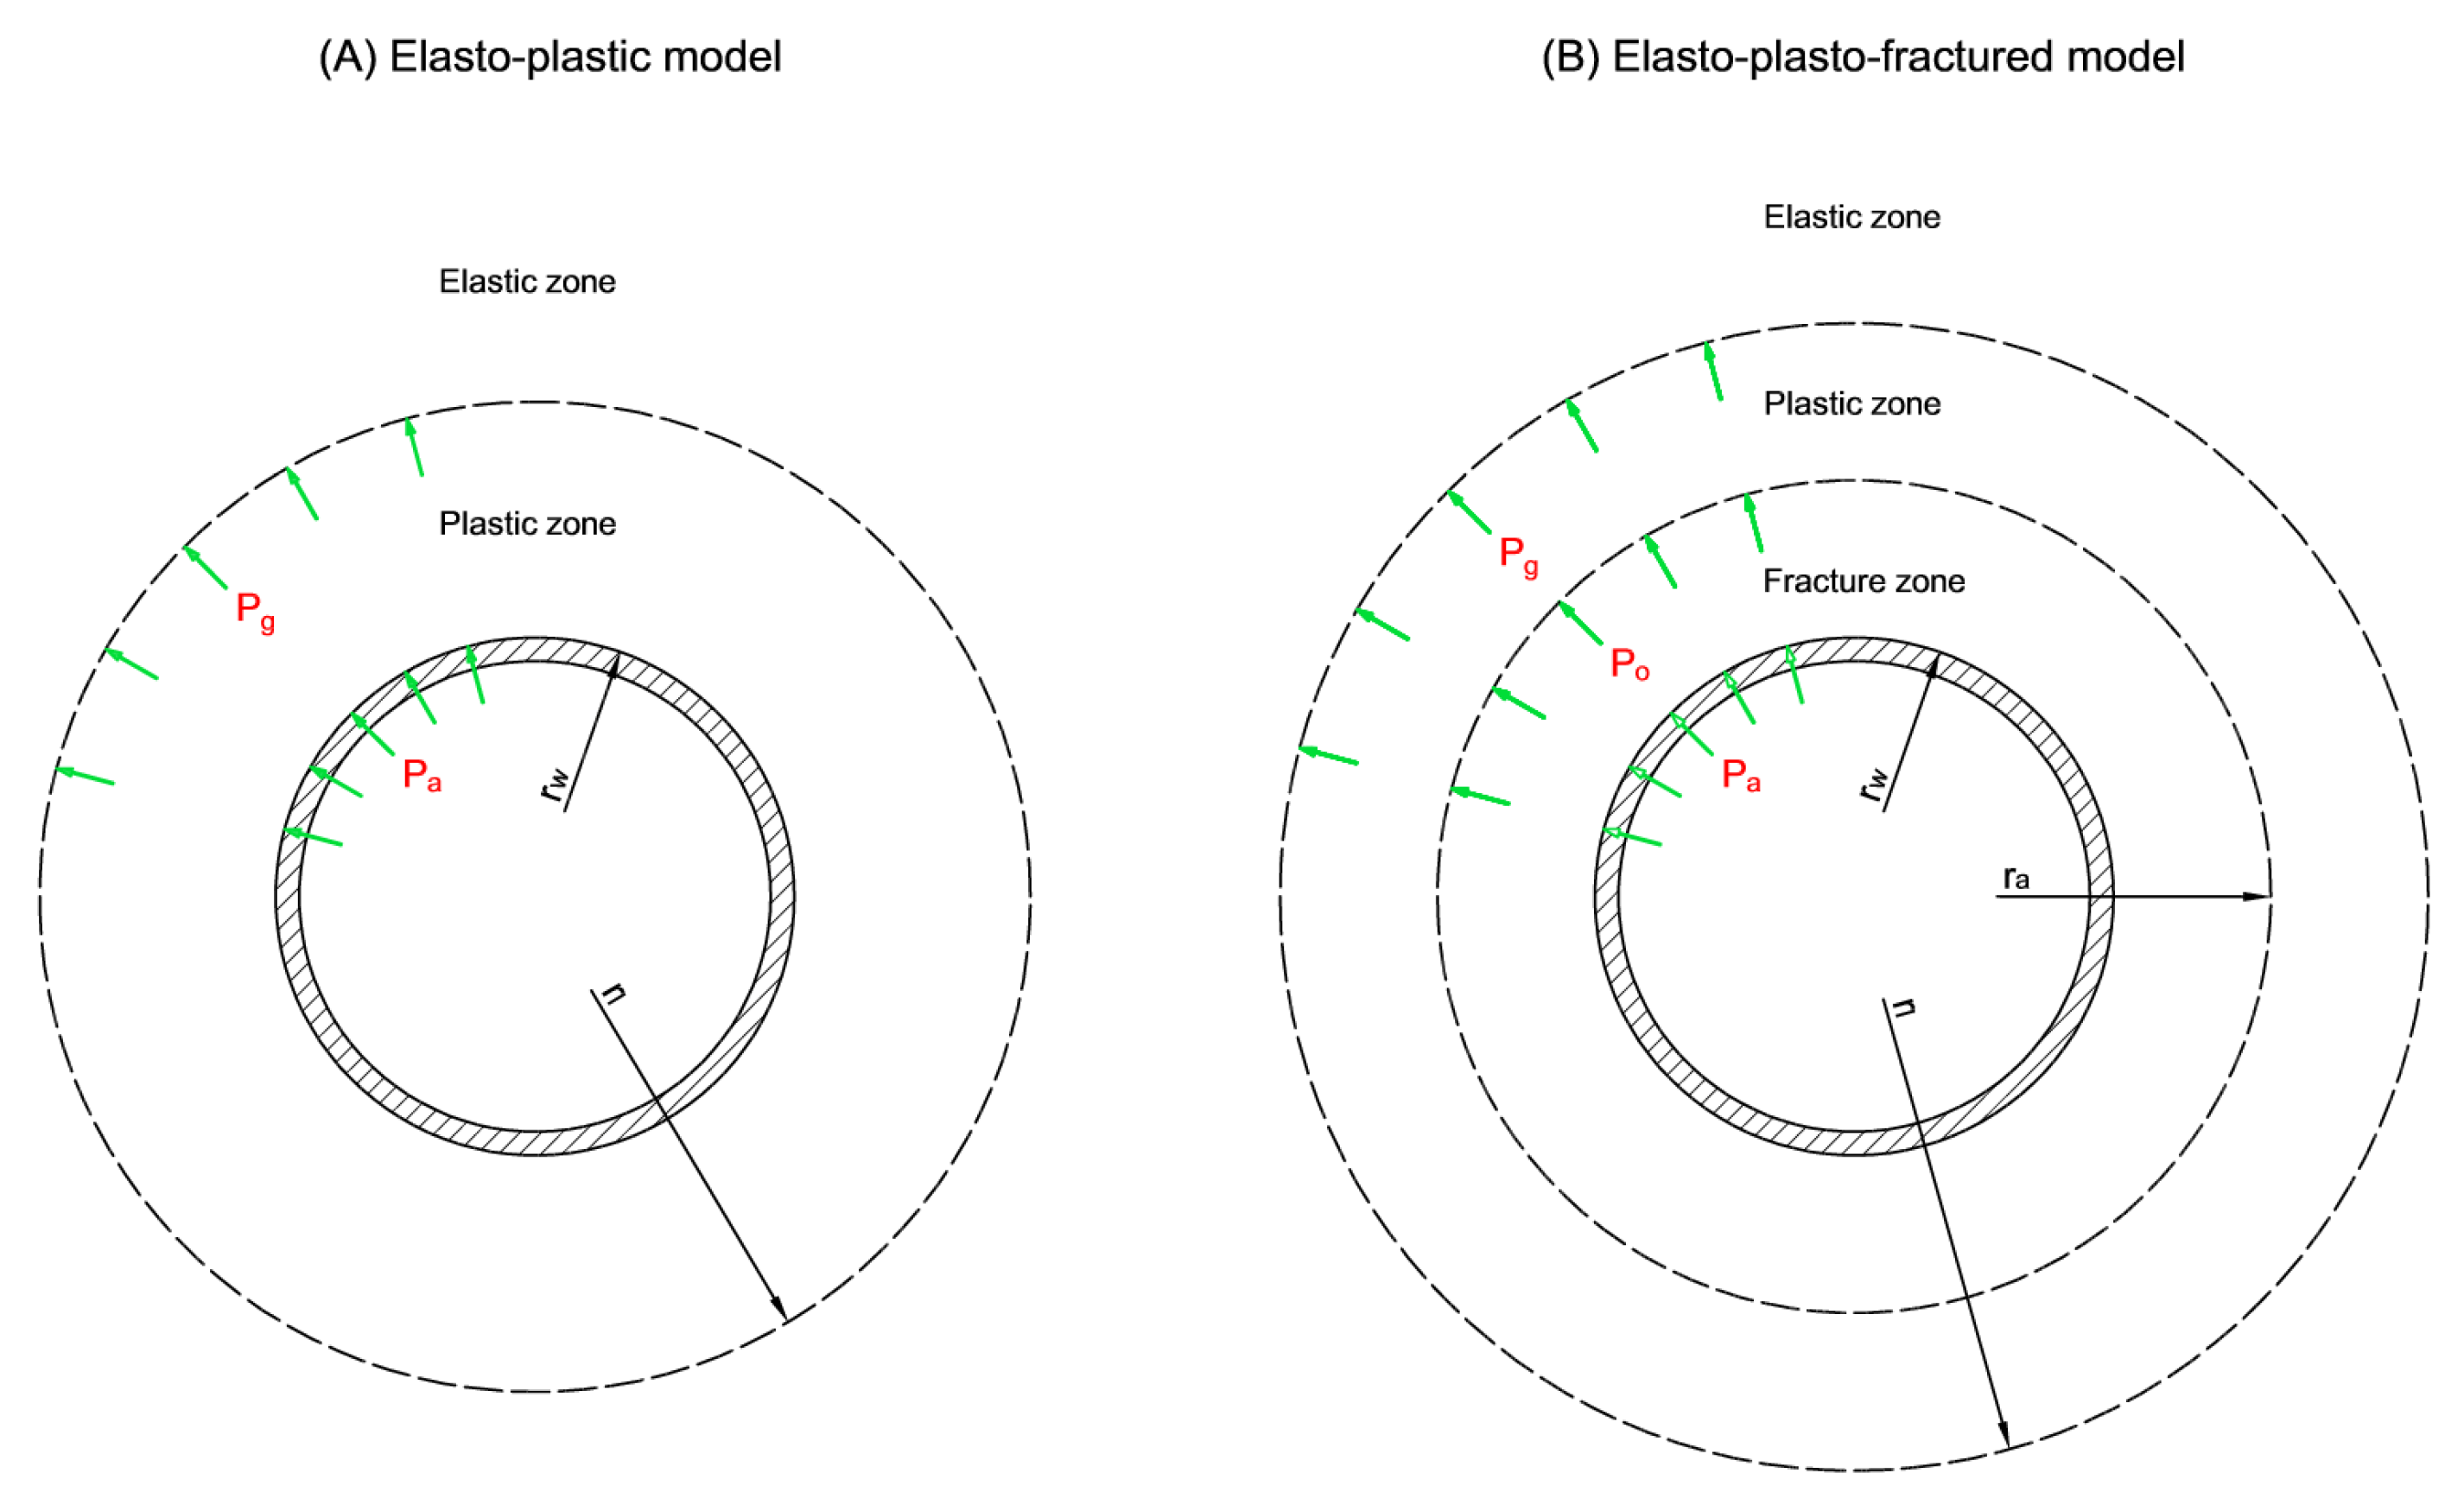
- Two coaxial inelastic zones form around the excavation. In the immediate vicinity of the excavation, there exists a fractured rock mass zone without compressive strength. At a certain distance from the excavation boundary, a zone of plastic rock mass develops, retaining some residual compressive strength. This scenario denotes an elasto-plasto-fractured medium [11].
2. Deformational Pressure Model According to Polish Standards
- the plain strain condition,
- the hydrostatic far-field (primary) stress condition,
- the circular shape of the excavation section,
- the homogeneity, isotropy and weightlessness of the rock mass,
- that rock mass destruction occurs in cases of exceeding its compressive strength (based on the Mohr–Coulomb yield criterion).
- the elasto-plastic model with softening (referred to simply as elasto-plastic model),
- the elasto-plasto-fractured model.
- simultaneous loading of the lining’s self-weight and the static pressure of the rock mass,
- simultaneous loading of the lining’s self-weight and the deformational pressure of the rock mass,
- simultaneous load of the lining’s self-weight and the injection pressure.
3. Theoretical Background for the Convergence Confinement Method
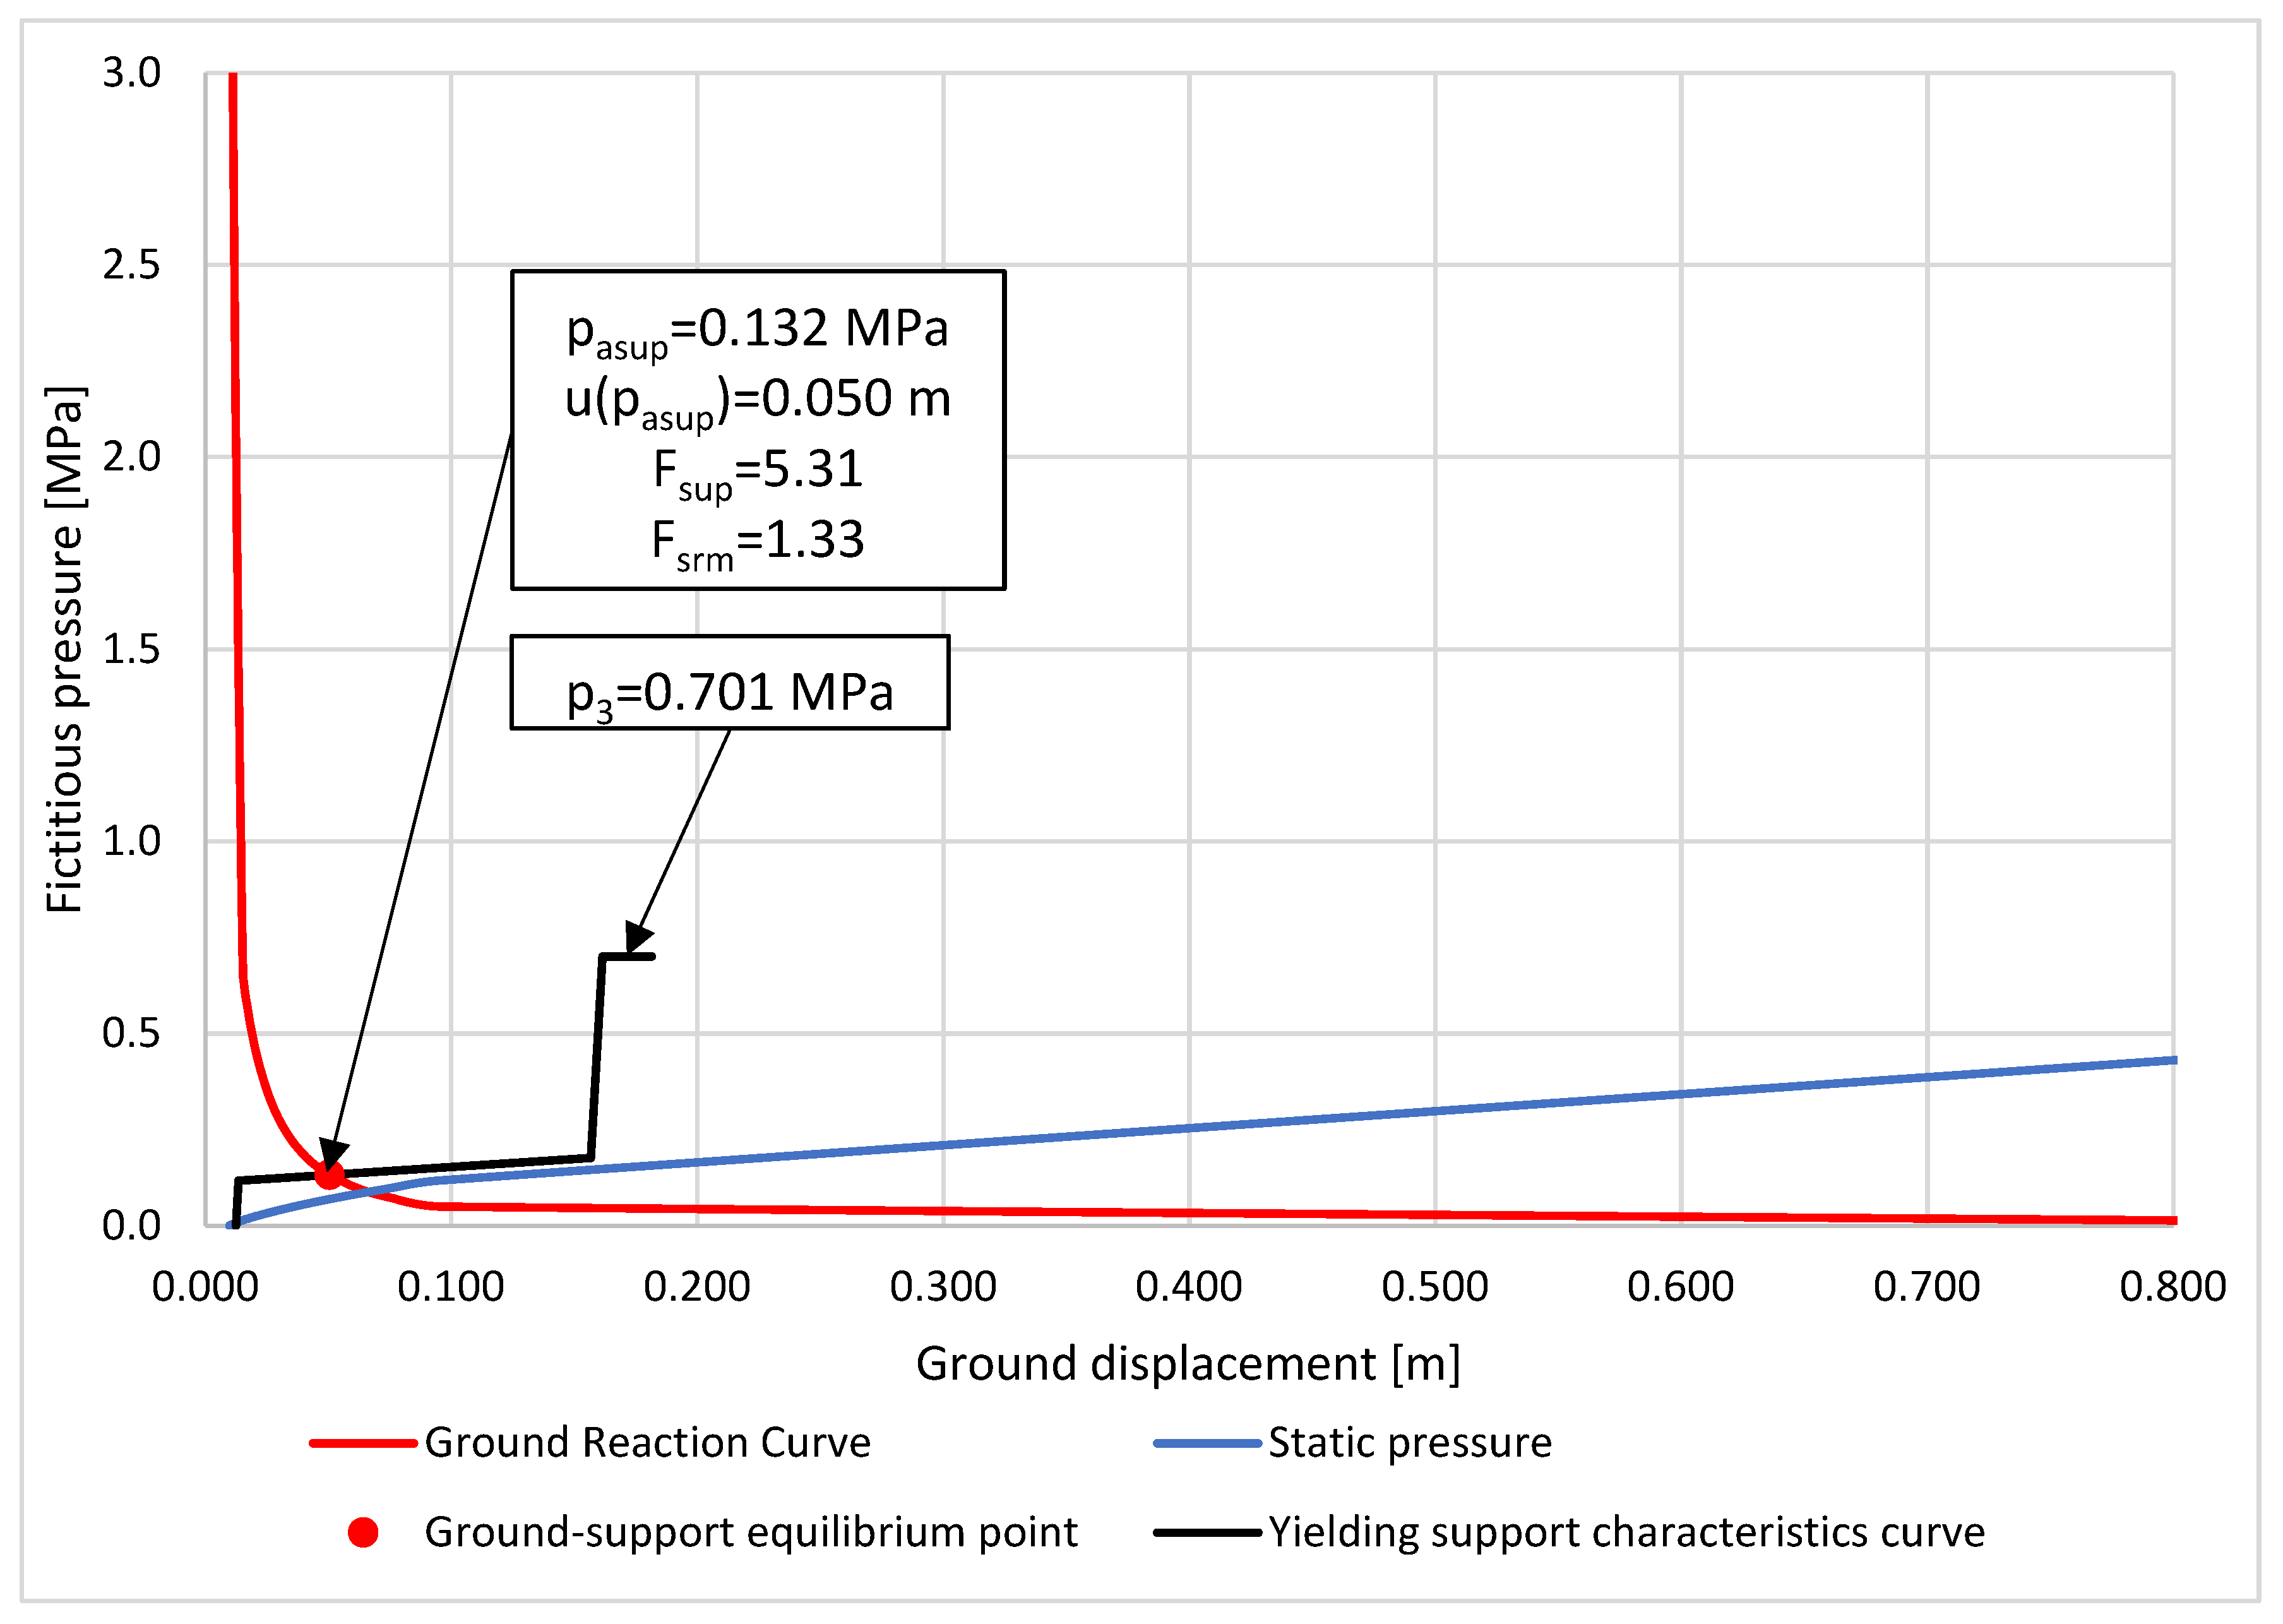
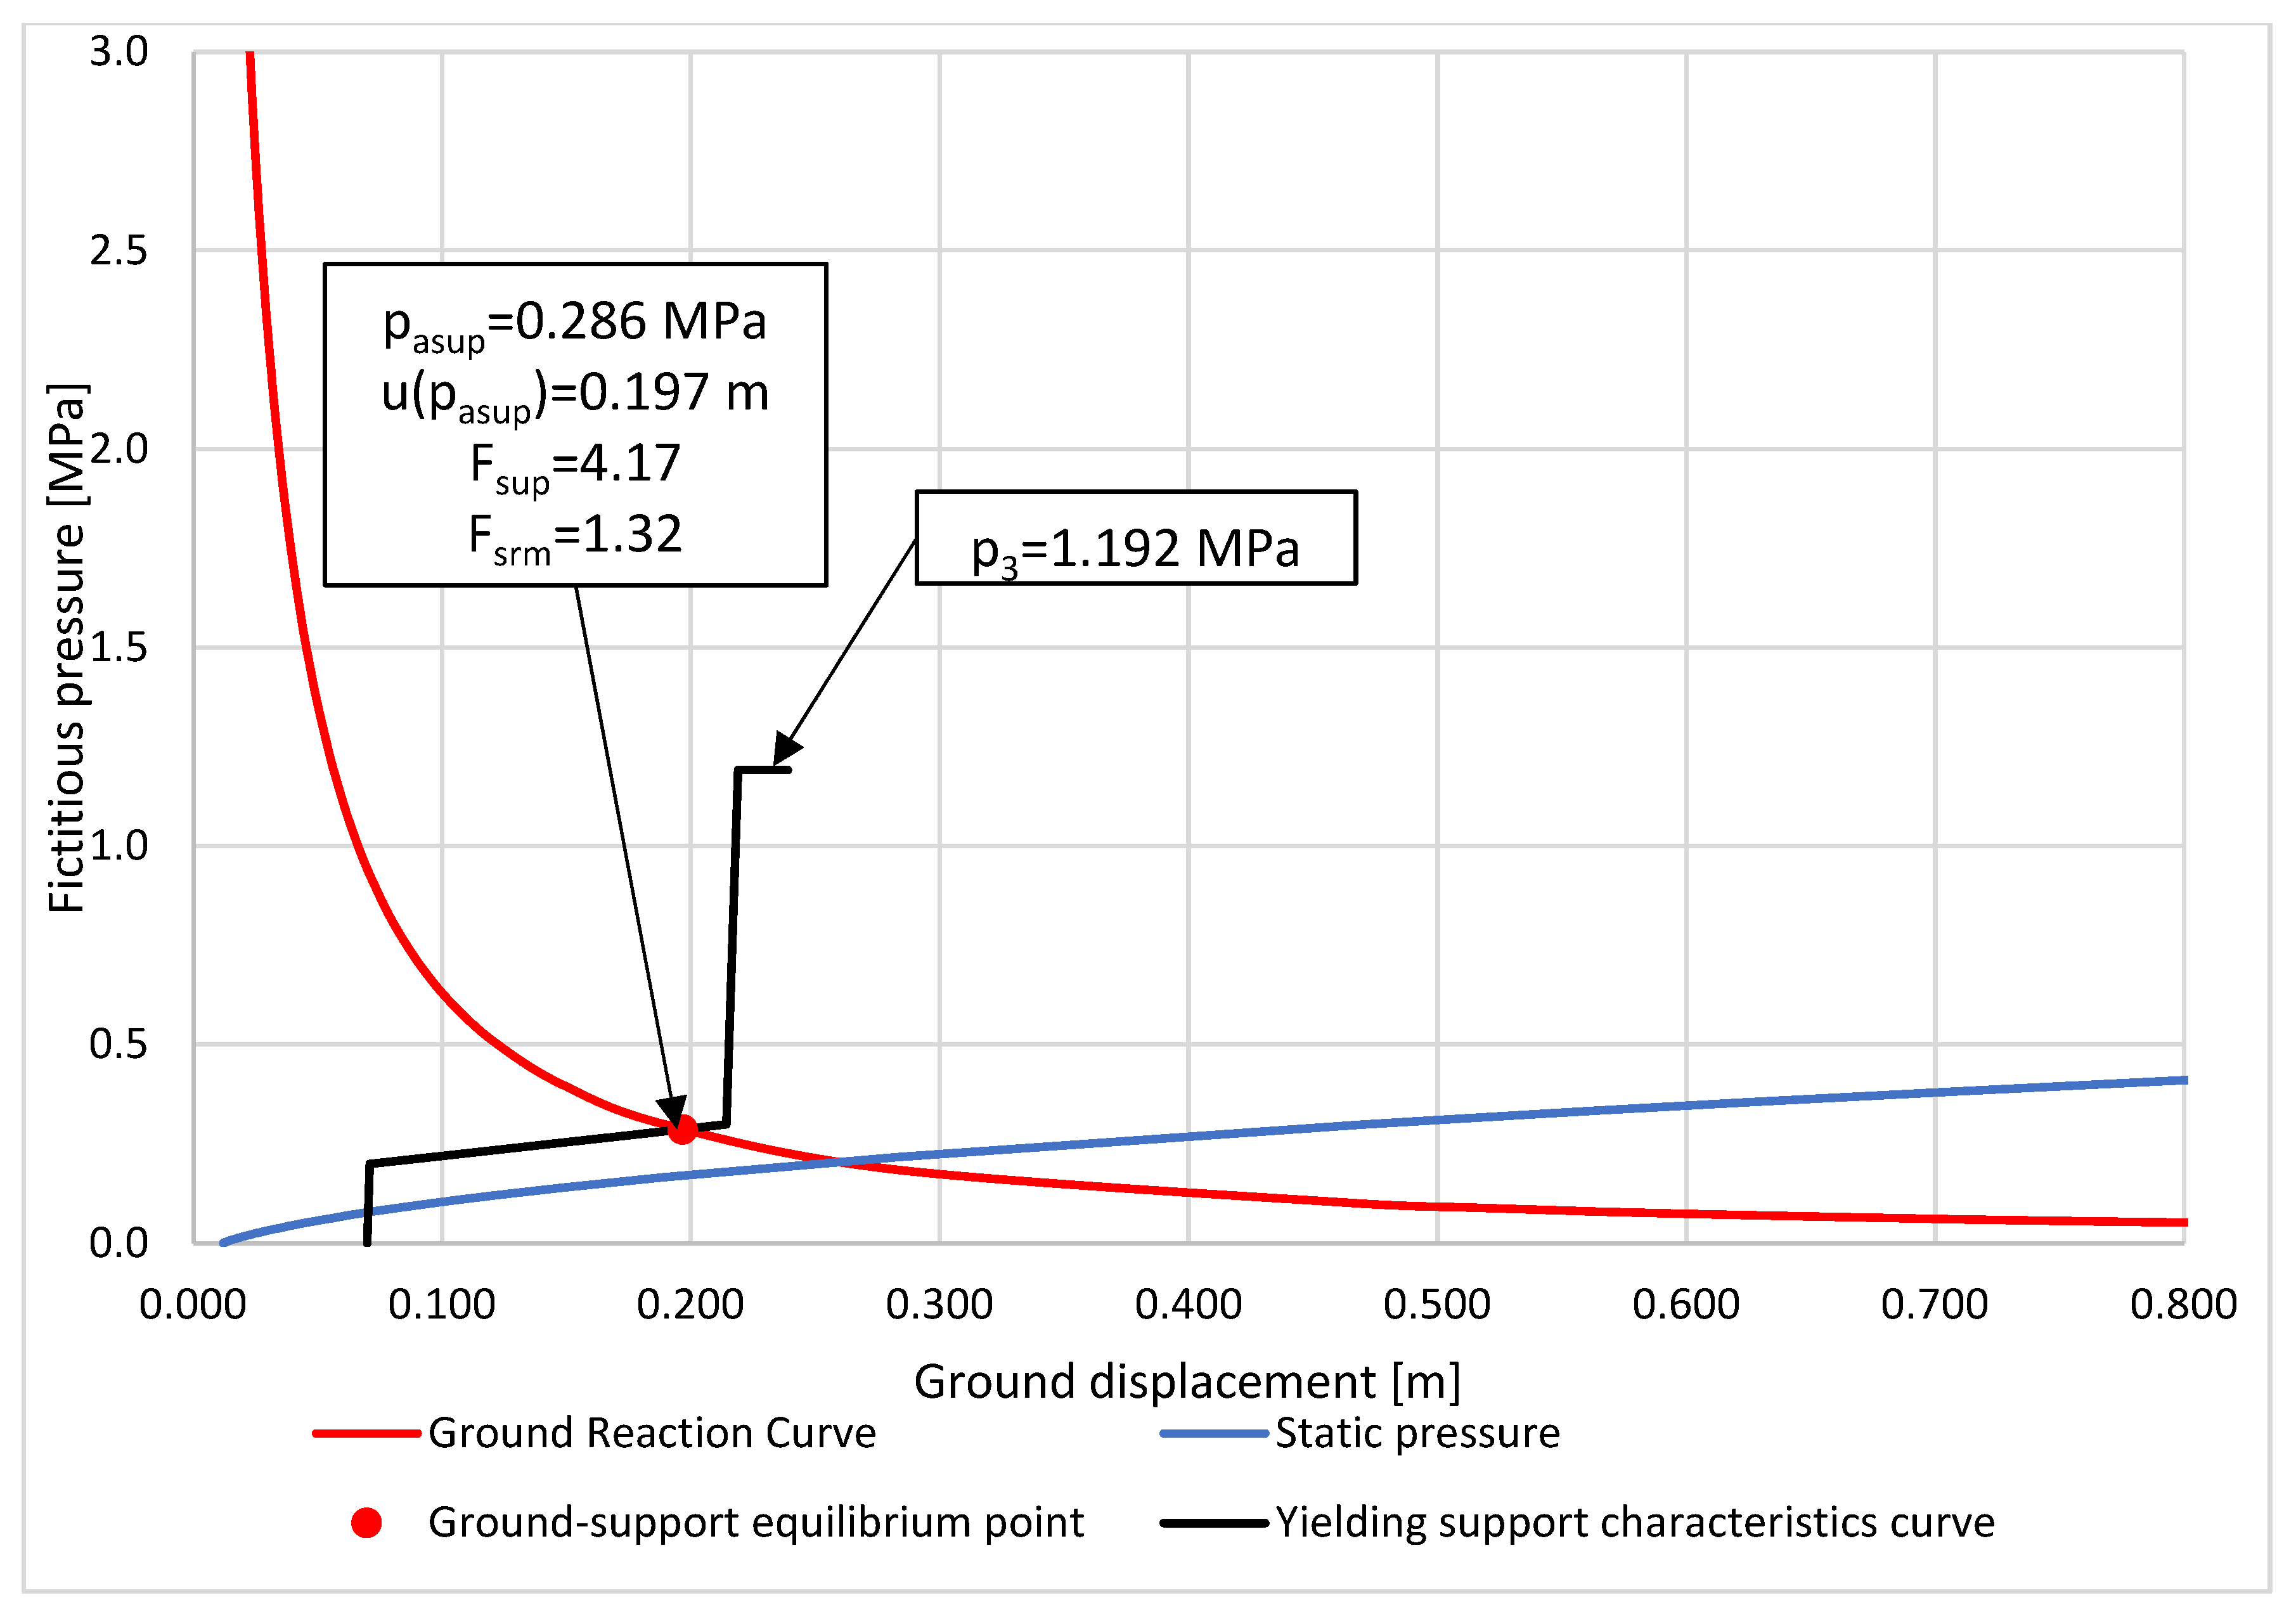
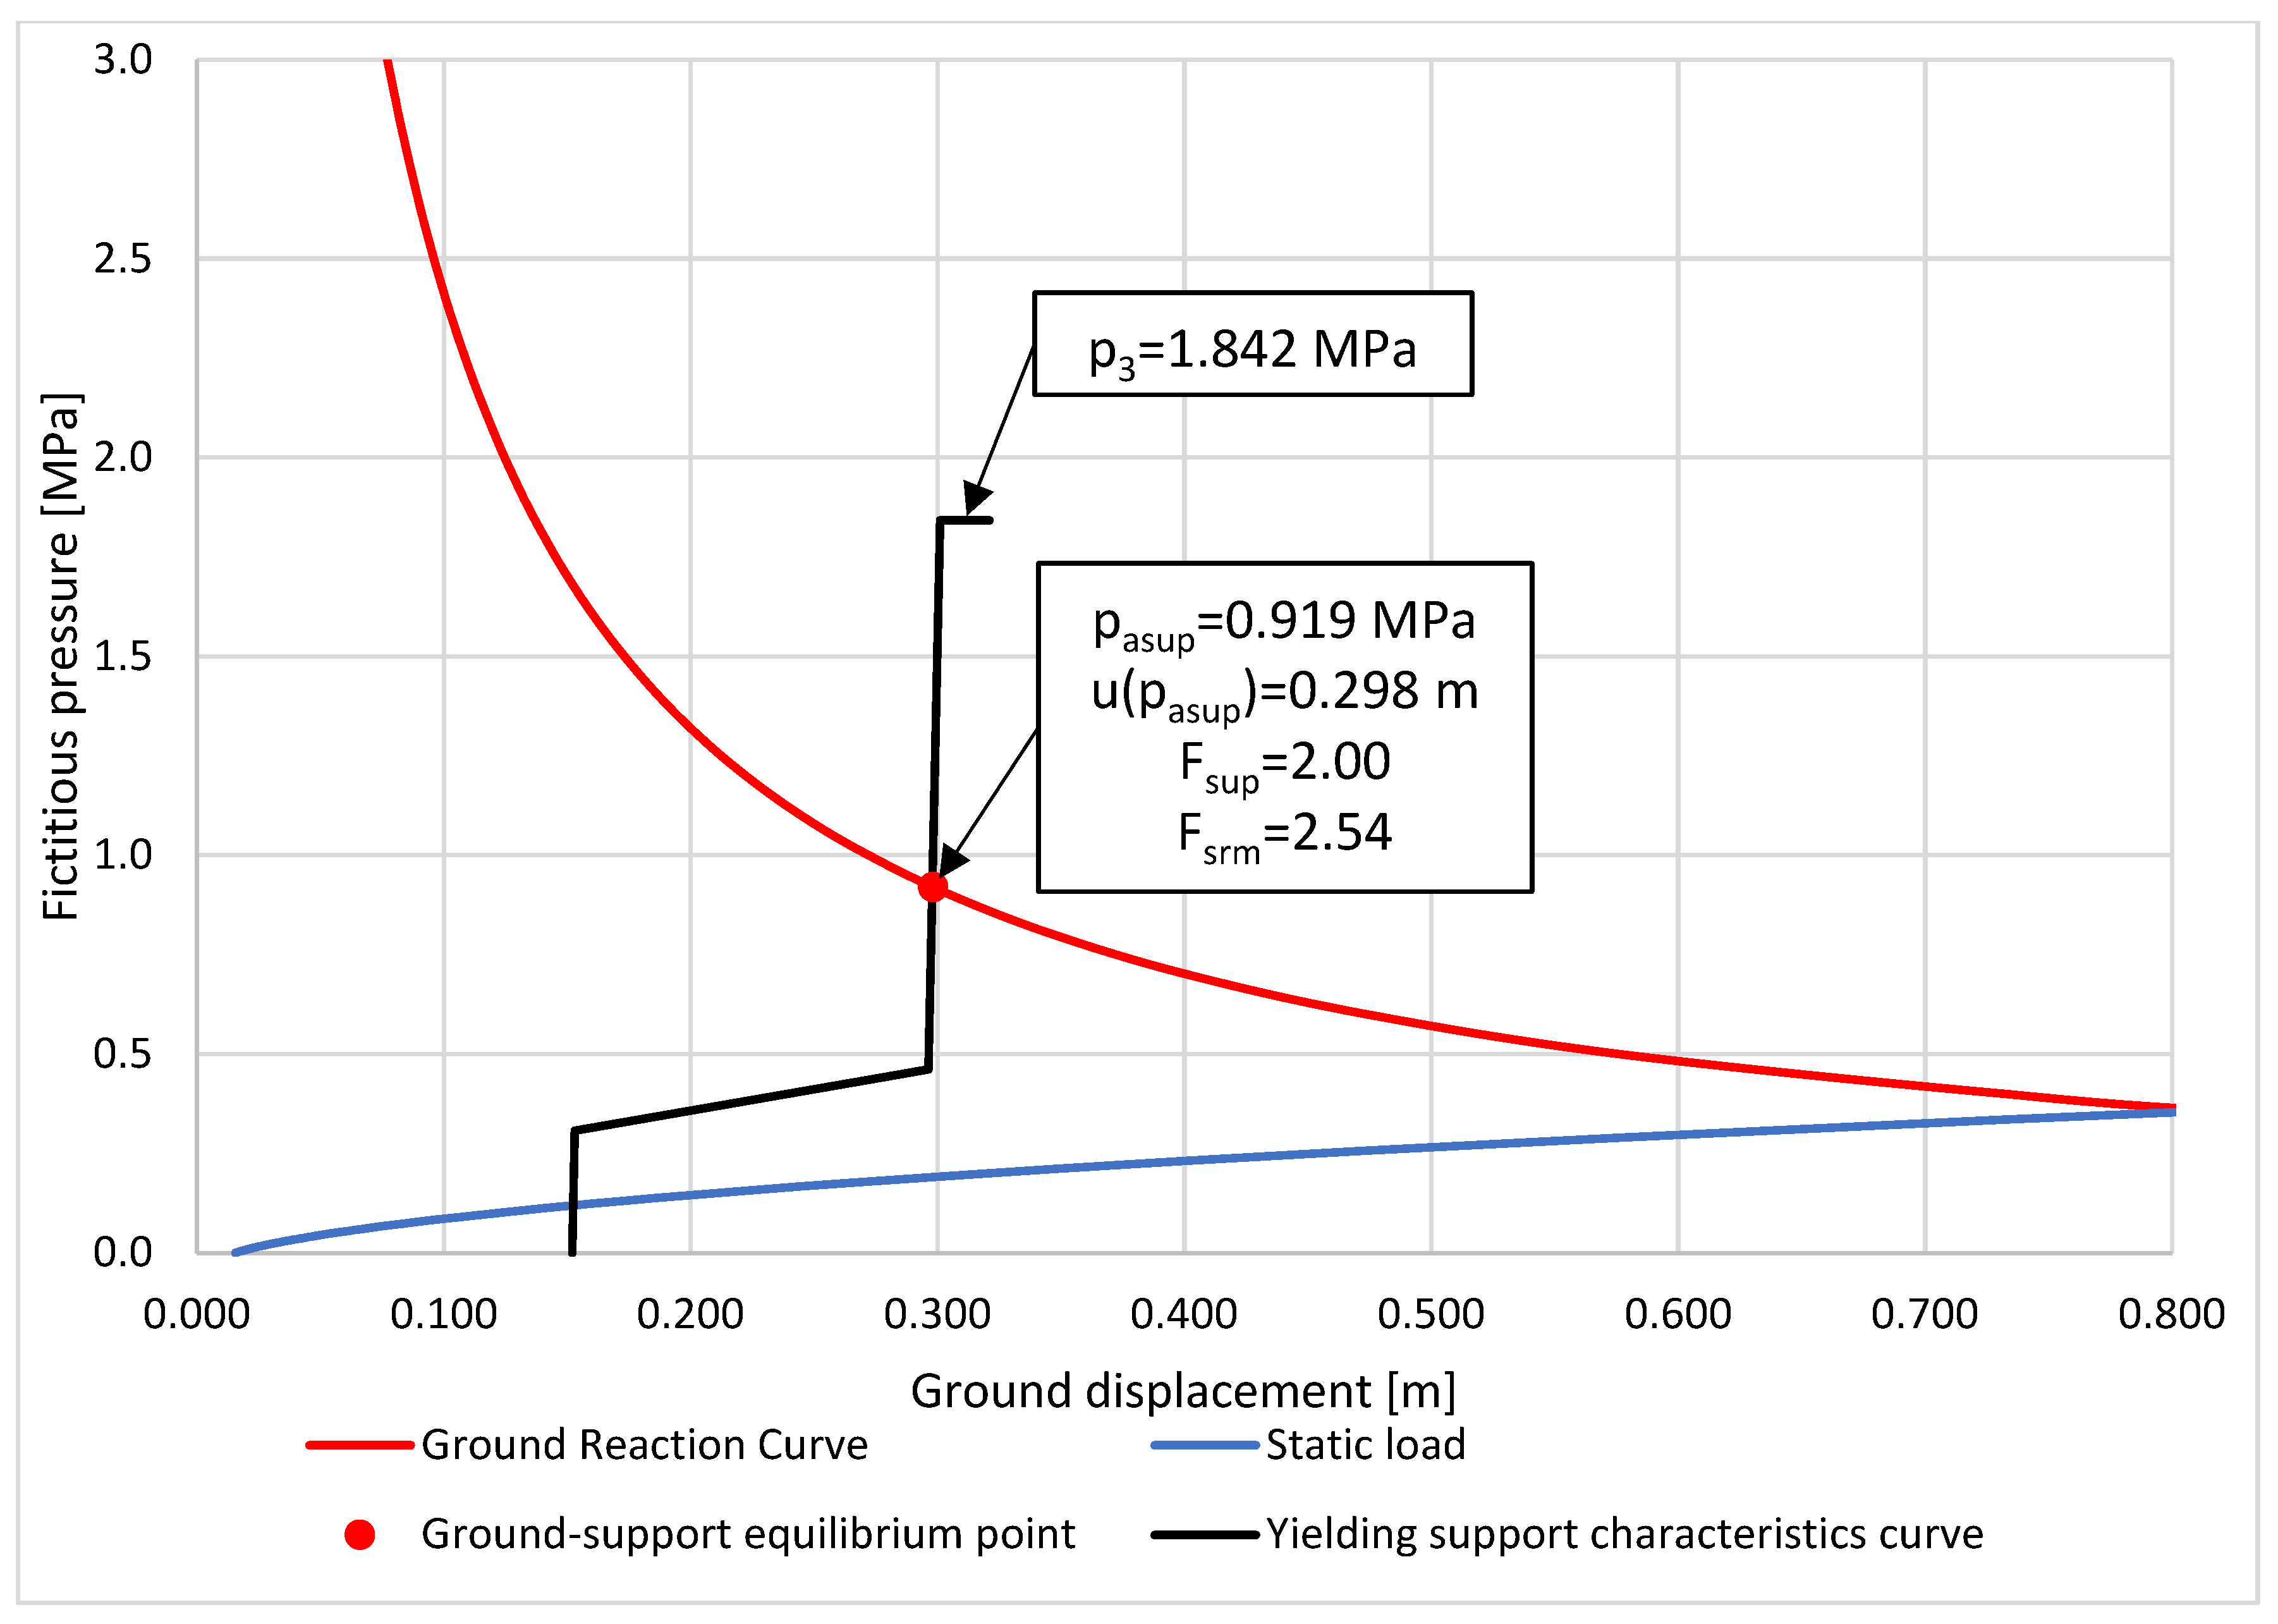
- Ground reaction curve (GRC)—illustrates the correlation between fictitious support pressure and the radial displacement of the excavation boundary. In essence, fictitious pressure refers to the internal support pressure required to prevent further ground displacement.
- Support characteristics curve (SCC)—depicts the relationship between increases in the radial displacement of the support and the external radial stress applied to the support (deformational pressure).
- Longitudinal displacement profile (LDP)—depicts the correlation between the radial displacement of the excavation boundary and the longitudinal distance from the excavation face.
- More accurately considering the three-dimensional character of an underground roadway or chamber excavation.
- Considering rigid support systems, which enable the quick suppression of rock mass displacement.
- Considering the correlation between support system stiffness and the value of the excavation boundary displacement.
- Considering the deformational load acting on the designed support system.
4. Algorithm for the Establishment of a Ground Reaction Curve for an Elasto-Plasto-Fractured Rock Mass
- Within the elastic, the zone action of the rock mass is depicted by a straight line inclined by the angle , where is a rock mass deformation modulus.
- Within the plastic zone a following condition, depicting rock mass action, is met:
- Within the fracture zone a following condition, depicting rock mass action, is met:

- if , the rock mass acts as an elastic medium;
- if , the rock mass acts as a plastic medium;
- if , the rock mass acts as a fractured medium.
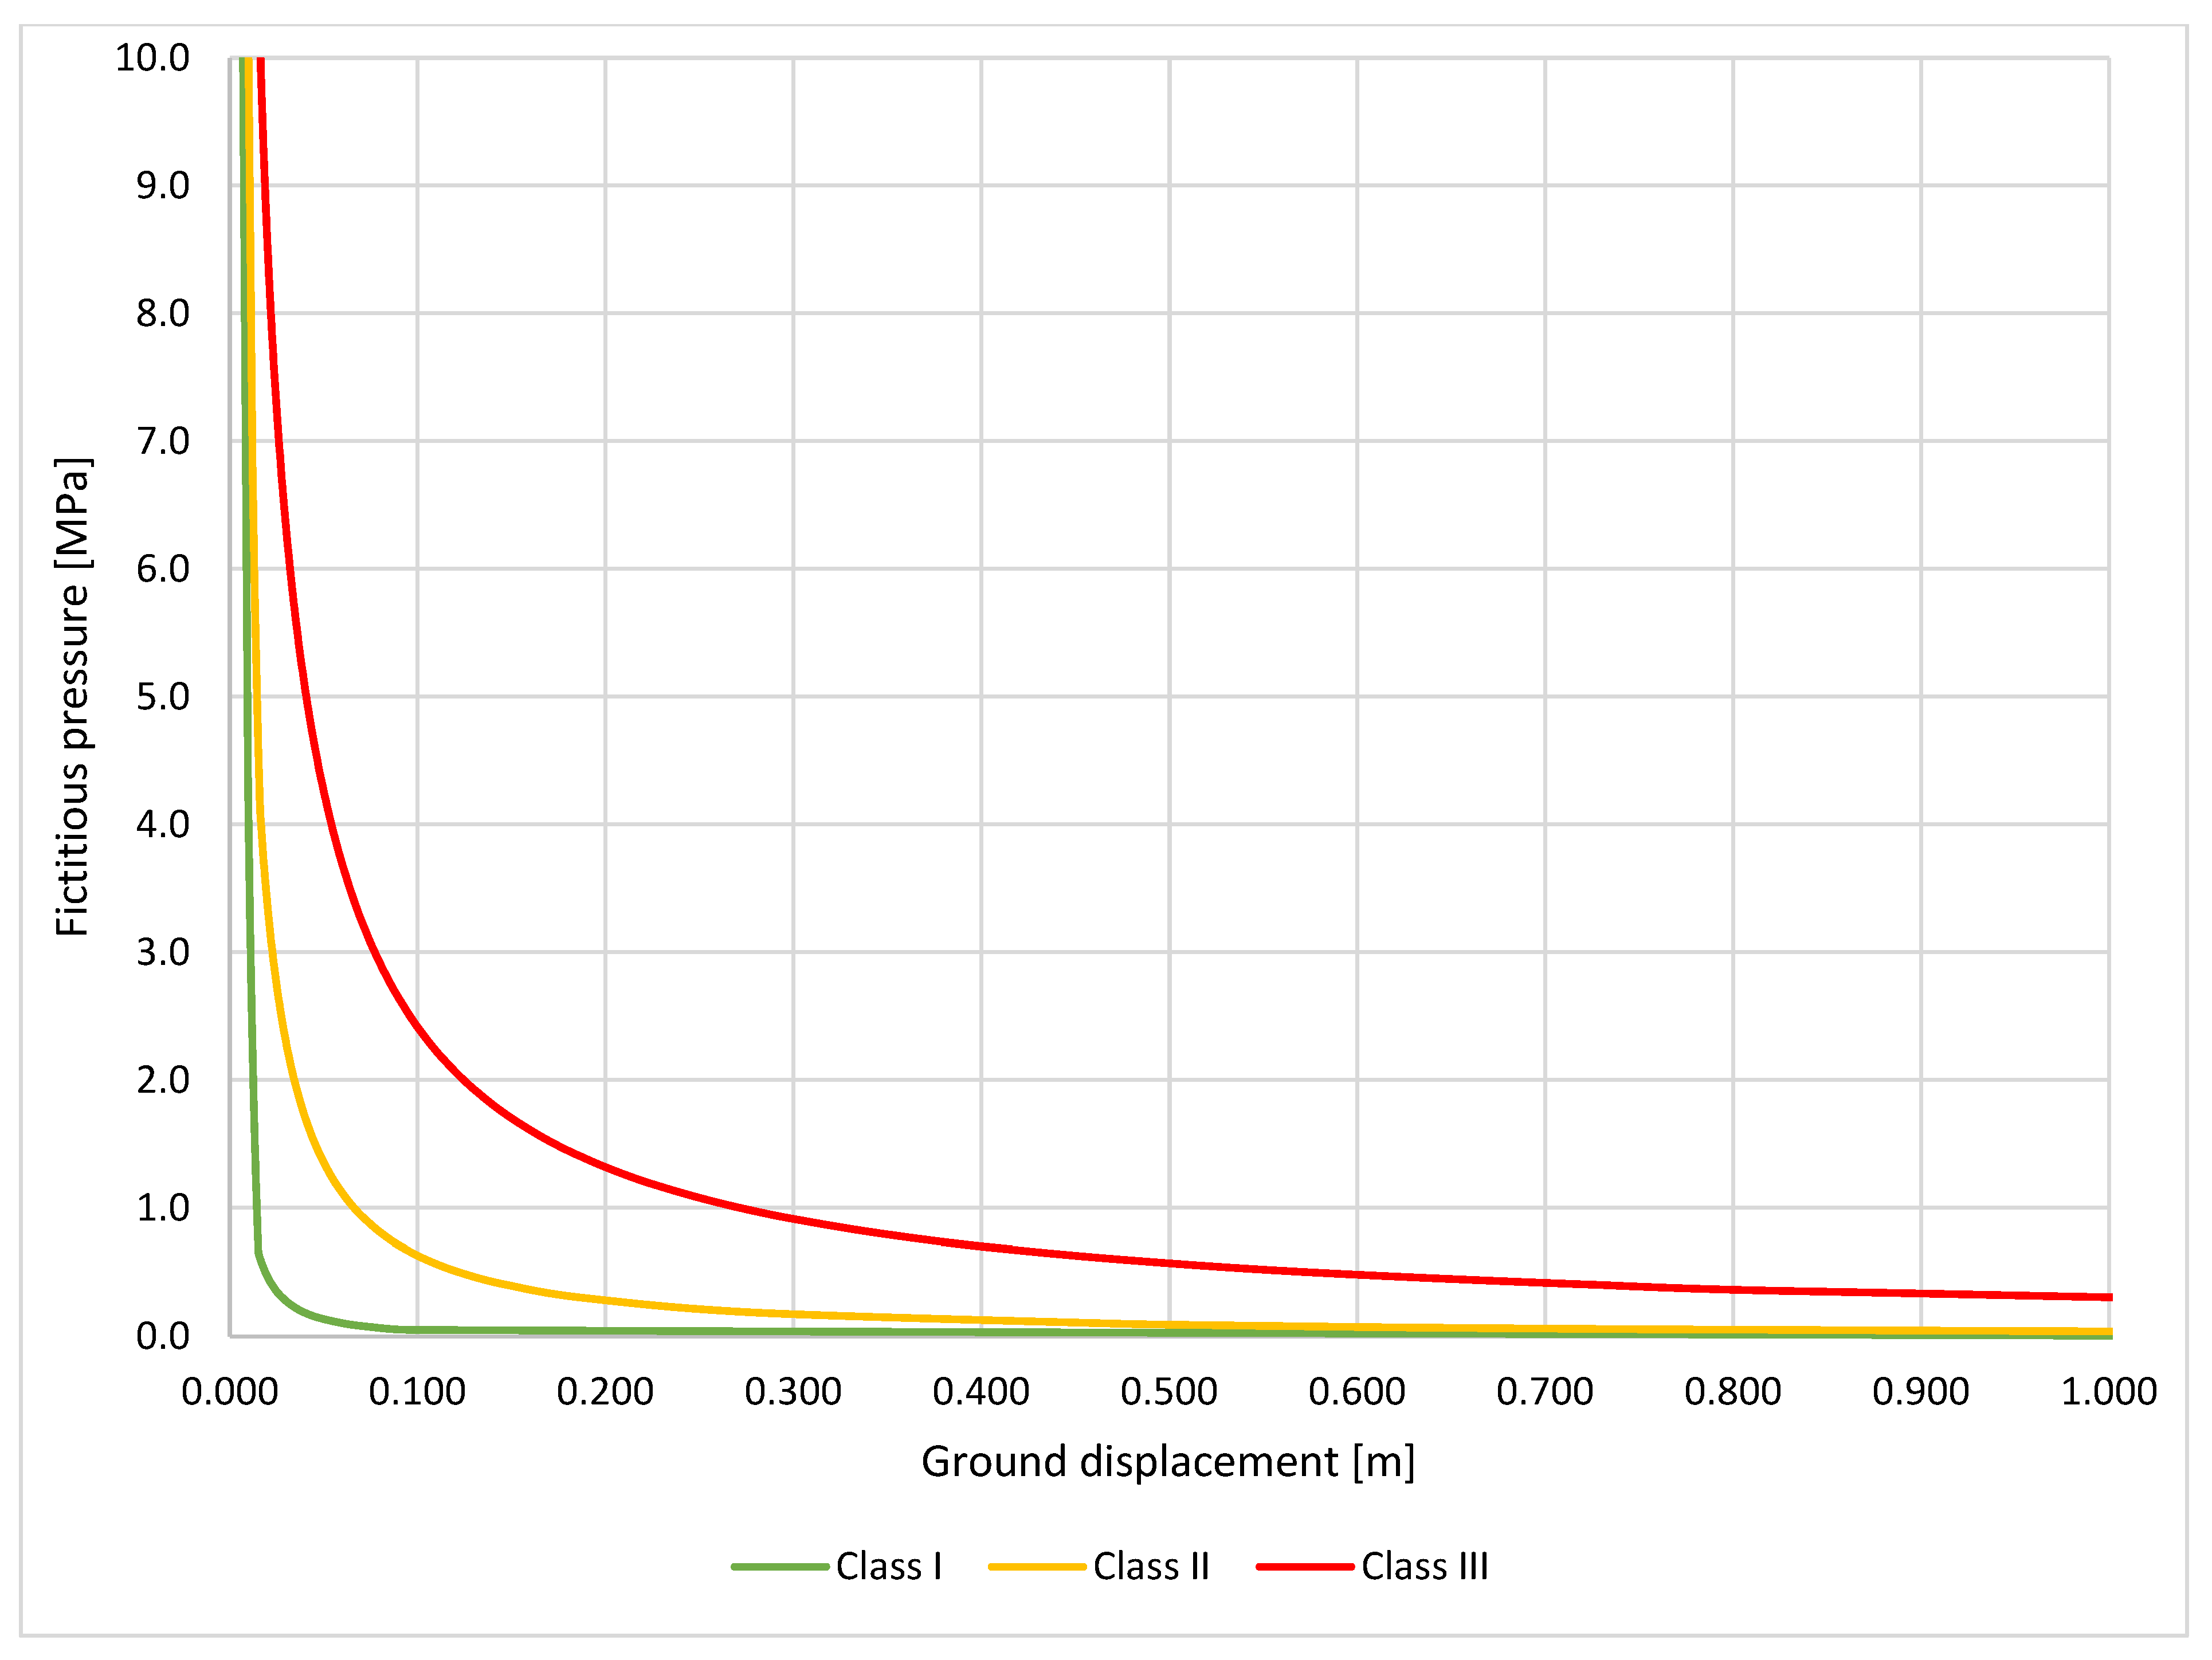
5. Application of the Developed Approach
- class I—competent rock mass,
- class II—fair rock mass,
- class III—weak rock mass.
- (1)
- First part involves elastic deformation, where steel arches act as rigid elements.
- (2)
- Second part involves yielding, where overlapped segments of the steel sets start to slide and the arch section diminishes.
- (3)
- Third part once again involves elastic deformation, wherein the maximum yielding capacity of the steel arch is reached, and therefore, it acts again as a rigid element.
- (4)
- Fourth part involves plastic deformation, wherein the bearing capacity of the rigid steel support is reached, and therefore, a certain amount of plastic deformation occurs.
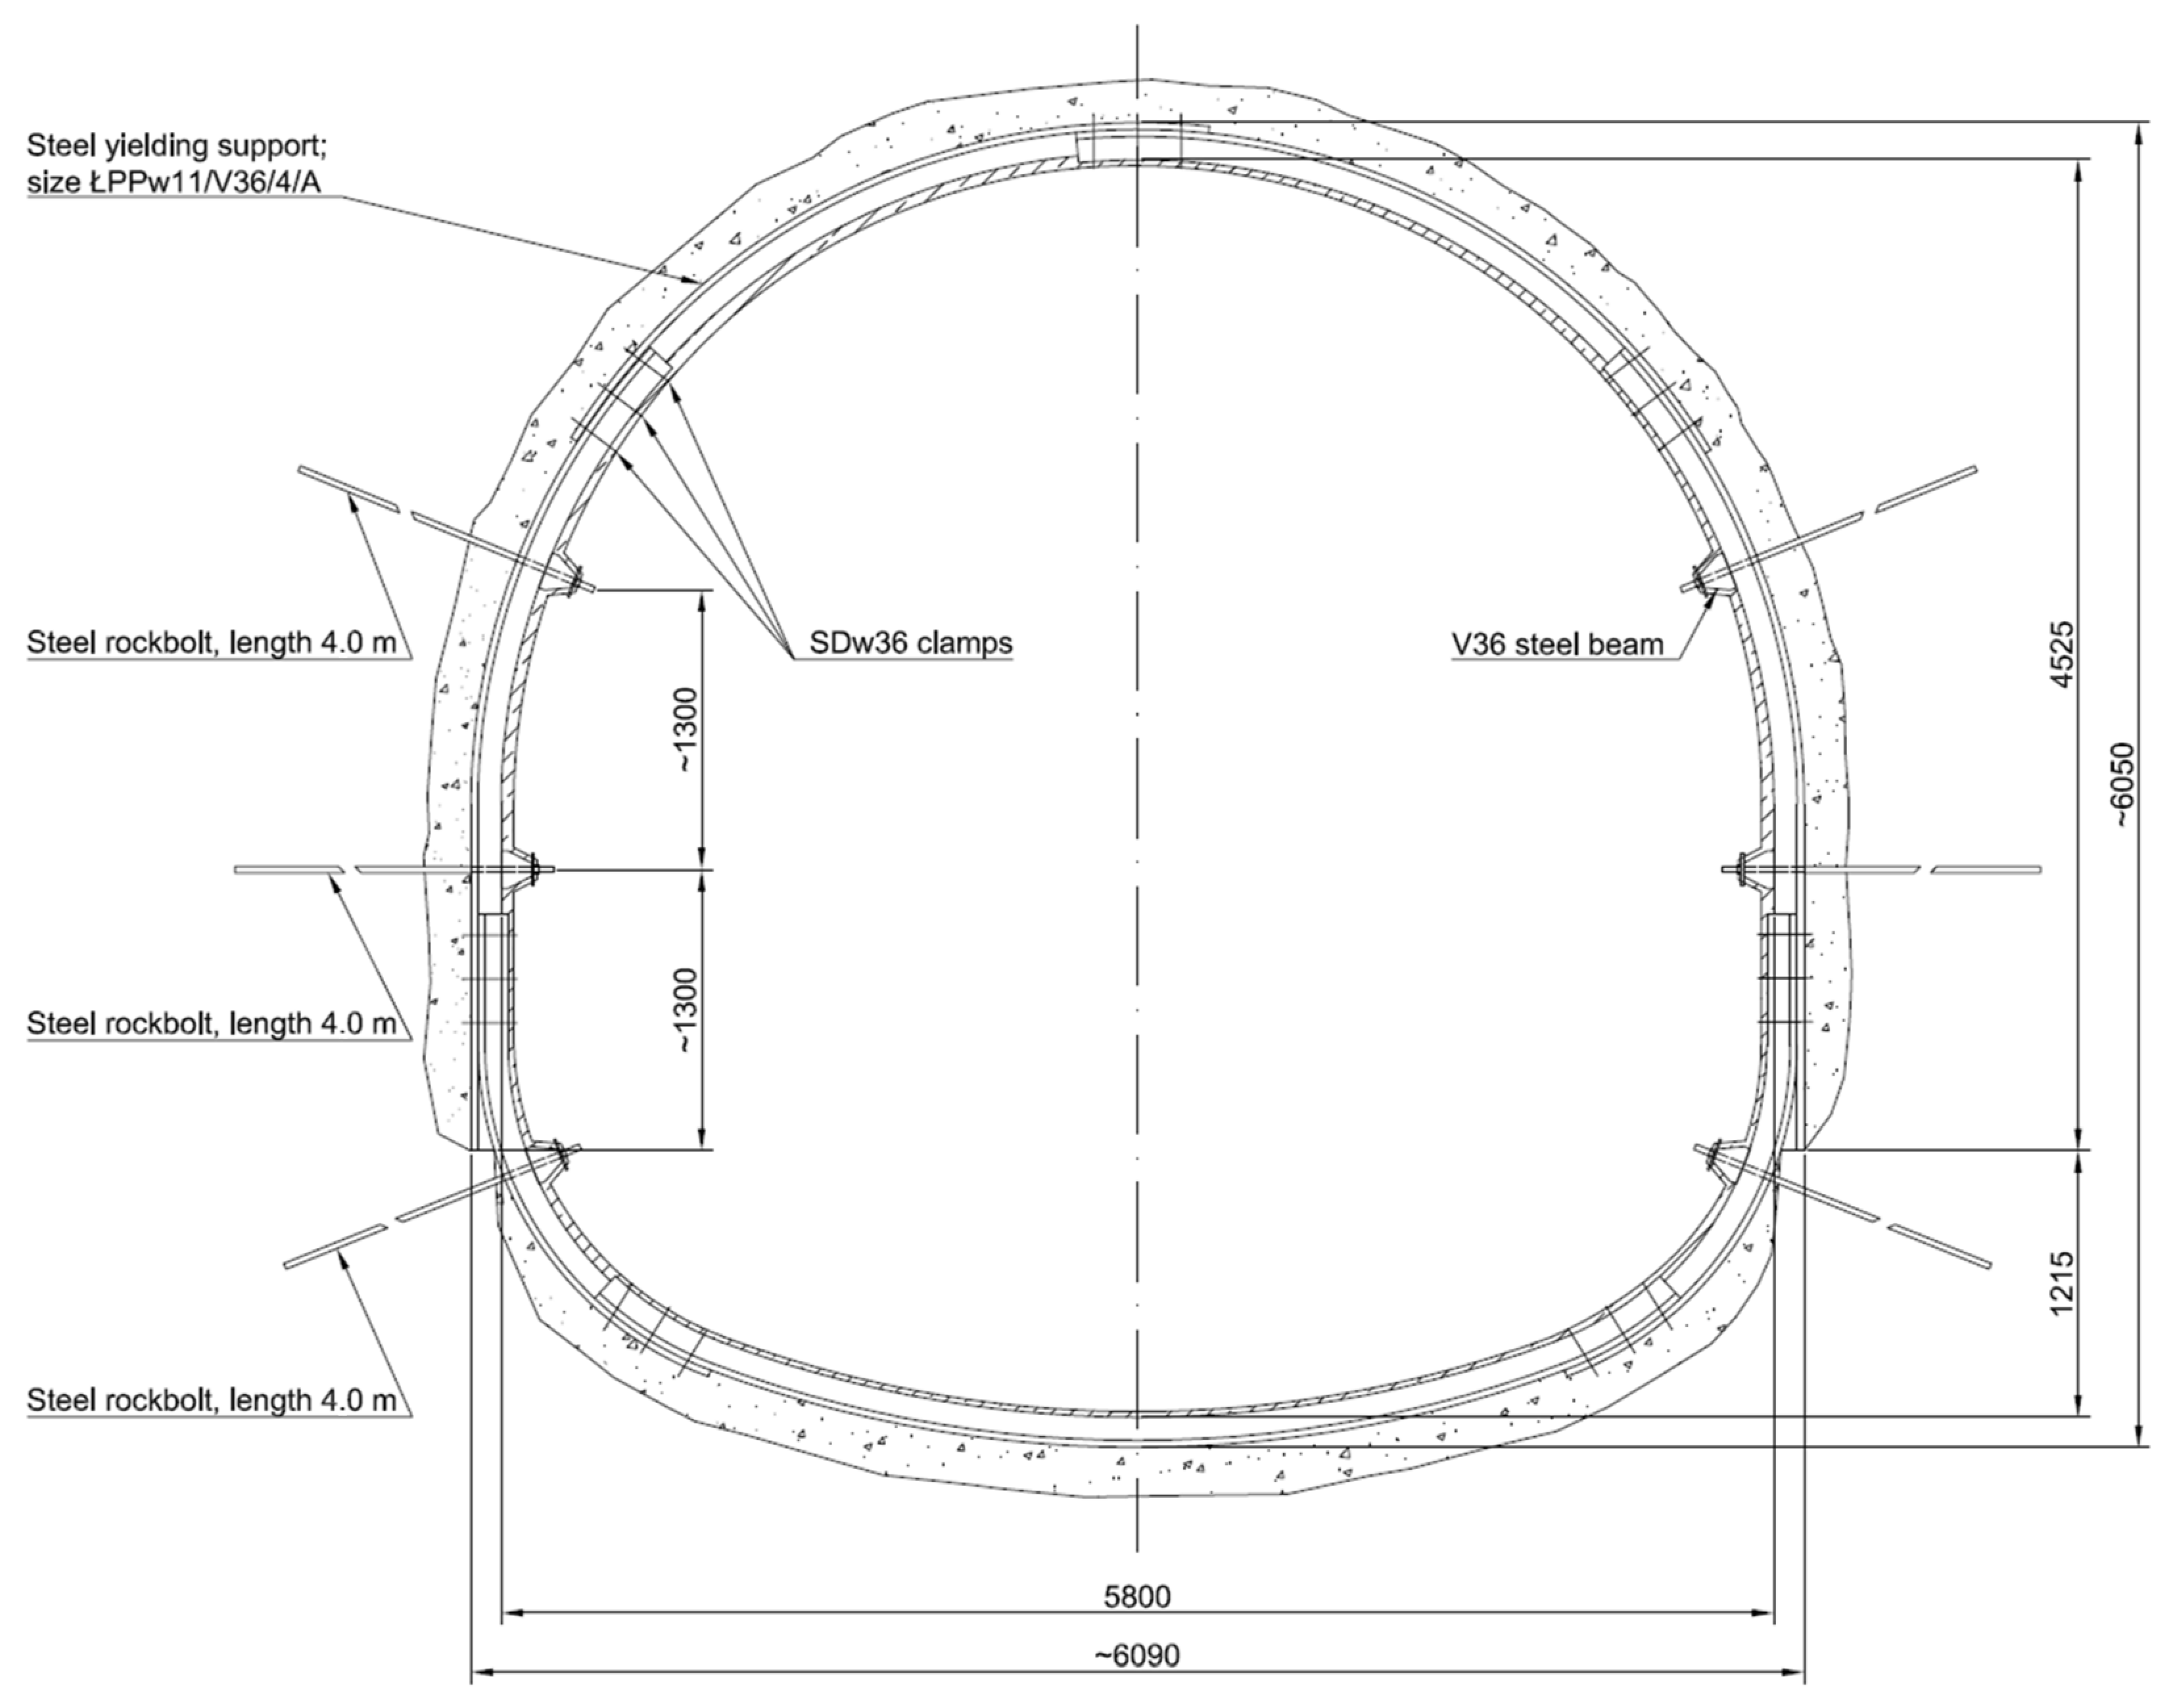
- creation of a favorable, triaxial state of stress on the roadway boundary,
- protection of steel arches from corrosion,
- shielding the rock mass from the influence of water inflow and the mine’s atmosphere.
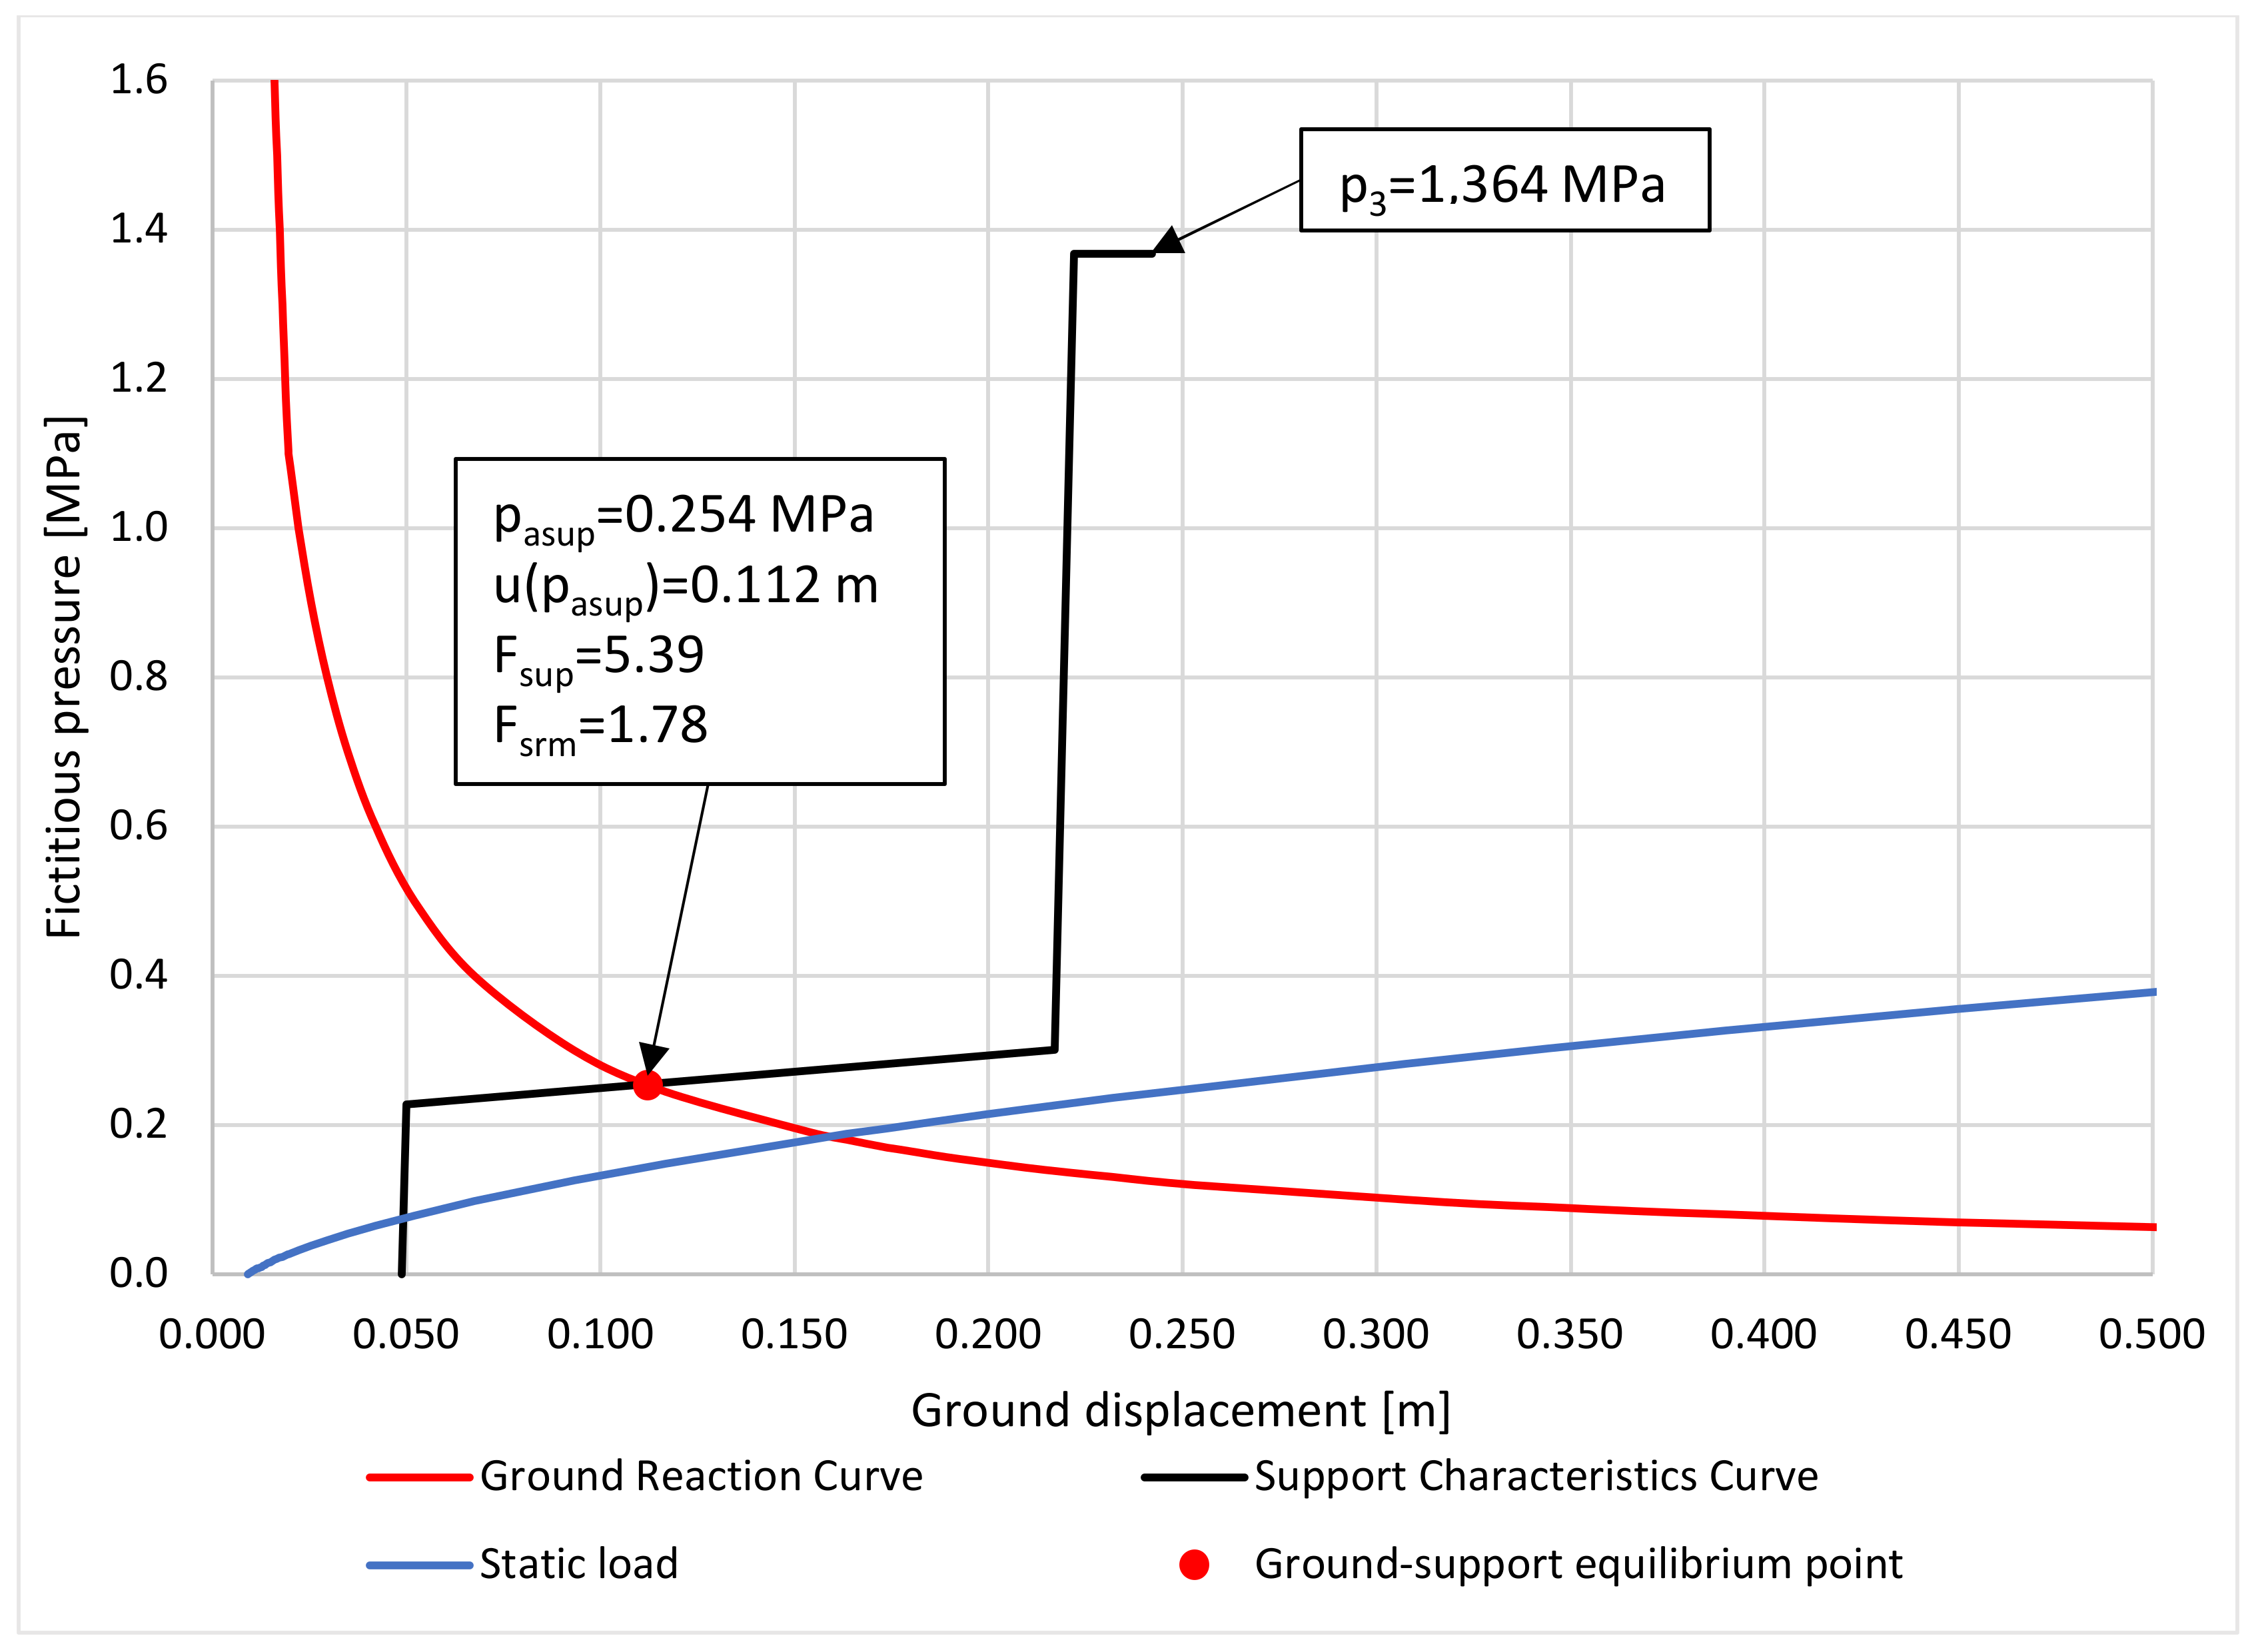
6. Engineering Application—Ventilating a Roadway in the “Knurów” Coal Mine
7. Conclusions
Author Contributions
Funding
Institutional Review Board Statement
Informed Consent Statement
Data Availability Statement
Conflicts of Interest
References
- Gałczyński, S. Geotechnika górnicza. In Ćwiczenia Projektowe z Mechaniki Górotworu; Wydawnictwa Politechniki Wrocławskiej: Wrocław, Poland, 1970. [Google Scholar]
- Hoek, E. Practical Rock Engineering [e-Book]; Rocscience Inc.: Vancouver, BC, Canada, 2007; Available online: https://www.rocscience.com/learning/hoeks-corner (accessed on 26 February 2024).
- Barla, G.; Bonini, M.; Debernardi, D. Time Dependent Deformations in Squeezing Tunnels. Int. J. Geoeng. Case Hist. 2010, 2, 40–65. [Google Scholar] [CrossRef]
- Chudek, M.; Głuch, P.; Szczepaniak, Z. Projektowanie i Wykonywanie Wyrobisk Komorowych, 2nd ed.; Wydawnictwo Politechniki Śląskiej: Gliwice, Poland, 1991. [Google Scholar]
- Paraskevopoulou, C. Time-dependent behaviour of rock materials. In Engineering Geology; Lwisa, E., Arman, H., Eds.; IntechOpen: Rijeka, Croatia, 2021. [Google Scholar] [CrossRef]
- Paraskevopoulou, C.; Diederichs, M.S. Long-term behaviour in tunnelling: Limitations in using creep parameters. In Proceedings of the 66th Canadian Geotechnical Conference, GeoMontreal on Geoscience for Sustainability, Montreal, QC, Canada, 29 September–3 October 2013. [Google Scholar]
- Schubert, W.; Button, E.A.; Sellner, P.J.; Solak, T. Analysis of time dependent displacements of tunnels. Felsbau 2003, 21, 96–103. [Google Scholar]
- Vlachopoulos, N.; Diederichs, M.S. Improved Longitudinal Displacement Profiles for Convergence Confinement Analysis of Deep Tunnels. Rock. Mech. Rock. Eng. 2009, 42, 131–146. [Google Scholar] [CrossRef]
- Vlachopoulos, N.; Su, Y. Longitudinal Displacement Profiles for Convergence-Confinement Analysis of Excavations: Applicability to Tunnelling, Limitations and Current Advancements. In Proceedings of the 72st Annual Conference of the Canadian Geotechnical Society, St John’s, NL, Canada, 29 September–2 October 2019. [Google Scholar]
- Chudek, M.; Mateja, J.; Rułka, K. Podstawy teoretyczne oraz nowe zasady doboru, ustalenia obciążeń i wymiarowania obudów długotrwałych wyrobisk korytarzowych i komorowych. Zesz. Nauk. Politech. Śląskiej 1985, 761, 1–178. [Google Scholar]
- Duży, S. Studium niezawodności konstrukcji obudowy i stateczności wyrobisk korytarzowych w kopalniach węgla kamiennego z uwzględnieniem niepewności informacji. Zesz. Nauk. Politech. Śląskiej 2007, 1750, 1–221. [Google Scholar]
- Oke, J.; Vlachopoulos, N.; Diederichs, M.S. Improvement to the Convergence-Confinement Method: Inclusion of Support Installation Proximity and Stiffness. Rock. Mech. Rock. Eng. 2018, 51, 1495–1519. [Google Scholar] [CrossRef]
- Su, Y.; Su, Y.; Zhao, M.; Vlachopoulos, N. Tunnel Stability Analysis in Weak Rocks Using the Convergence Confinement Method. Rock. Mech. Rock. Eng. 2021, 54, 559–592. [Google Scholar] [CrossRef]
- BN-78/0434-07; Wyrobiska Korytarzowe i Komorowe w Kopalniach. Obudowa Powłokowa. Wytyczne Projektowania i Obliczeń Statycznych. Główne Biuro Studiów i Projektów Górniczych: Katowice, Poland, 1978.
- BN-79/0434-04; Wyrobiska Korytarzowe i Komorowe w Kopalniach. Obudowa Sklepiona. Wytyczne Projektowania i Obliczeń Statycznych. Główne Biuro Studiów i Projektów Górniczych: Katowice, Poland, 1979.
- PN-G-05600:1998; Podziemne Wyrobiska Korytarzowe i Komorowe. Obudowa Powłokowa. Zasady Projektowania i Obliczeń Statycznych. Polski Komitet Normalizacyjny: Warszawa, Poland, 1998.
- PN-G-05020:1997; Podziemne Wyrobiska Korytarzowe i Komorowe. Obudowa Sklepiona. Zasady Projektowania i Obliczeń Statycznych. Polski Komitet Normalizacyjny: Warszawa, Poland, 1997.
- Wichur, A. Zagadnienia projektowania obudowy długotrwałych wyrobisk podziemnych. Górnictwo i Geoinżynieria 2009, 33, 407–436. [Google Scholar]
- Wichur, A.; Bajorek, M.; Frydrych, K. Metoda sprawdzania podatności obudowy powłokowej. Górnictwo i Geoinżynieria 2007, 31, 459–468. [Google Scholar]
- Dawidziuk, P.; Otto, A.; Kamiński, P.; Małkowski, P. Zastosowanie metody sterowania konwergencją do projektowania obudowy wyrobisk kapitalnych w kopalniach podziemnych na przykładzie kopalń JSW S.A. Przegląd Górniczy 2022, 77, 29–43. [Google Scholar]
- Wichur, A.; Domańska, D.; Frydrych, K.; Bugiel, A.; Oślizło, K.; Franiel, J. Budowa wlotu w szybie VI JSW S.A. KWK “Budryk"” poz. 1290. In Proceedings of the XXV Mineral Resources & Energy Congress (SEP), Kraków, Poland, 26–28 February 2016. [Google Scholar]
- Tajduś, A.; Cała, M.; Tajduś, K. Geomechanika w budownictwie podziemnym. In Projektowanie i Budowa Tuneli; Wydawnictwo AGH: Kraków, Poland, 2012. [Google Scholar]
- Kirsch, G. Die Theorie der Elastizität und die Bedürfnisse der Festigkeitslehre. Zeitshrift Des Vereines Dtsch. Ingenieure 1898, 42, 797–807. [Google Scholar]
- Carranza-Torres, C.; Fairhurst, C. Application of the Convergence-Confinement Method of Tunnel Design to Rock Masses that Satisfy The Hoek-Brown Failure Criterion. Tunn. Undergr. Space Technol. 2000, 15, 187–213. [Google Scholar] [CrossRef]
- Duncan Fama, M.E. Numerical modelling of yield zones in weak rock. In Comprehensive Rock Engineering: Principles, Practice and Projects. Analysis and Design Methods; Fairhurst, C., Ed.; Pergamon Press: Oxford, UK, 1995; pp. 49–75. [Google Scholar]
- Fenner, R. Untersuchungen zur Erkenntnis des Gehirndruckes. Glückauf. Berg-Und Hüttenmännische Z. 1938, 74, 681–695. [Google Scholar]
- Panet, M.; Guenot, A. Analysis of convergence behind the face of a tunnel. In Proceedings of the International Symposium Tunnelling, Brighton, VIC, Australia, 7–11 June 1982. [Google Scholar]
- Brown, E.; Bray, J.; Landayi, B.; Hoek, E. Ground response curves for rock tunnels. J. Geotech. Eng. 1983, 109, 15–39. [Google Scholar] [CrossRef]
- Pacher, F. Deformationsmessungen im Versuchsstollen als Mittel zur Erforschung des Gebirgsverhaltens und zur Bemessung des Ausbaus. Felsmech. u Ing. Geol. 1964, 1, 149–161. [Google Scholar]
- Chang, L.; Alejano, L.R.; Cui, L.; Sheng, Q.; Xie, M. Limitation of convergence-confinement method on three-dimensional tunnelling effect. Sci. Rep. 2023, 13, 1988. [Google Scholar] [CrossRef]
- Alejano, L.R. Why the convergence confinement method is not much used in practice. In Rock Mechanics in Civil and Environmental Engineering; Zhao, J., Labiouse, V., Dudt, J.P., Mathier, J.F., Eds.; CRC Press: London, UK, 2010; pp. 347–350. [Google Scholar] [CrossRef]
- Hoek, E.; Brown, E.T. Practical estimates of rock mass strength. Int. J. Rock Mech. Min. Sci. 1997, 34, 1165–1186. [Google Scholar] [CrossRef]
- Molladavoodi, H. Ground Response Curve (GRC) and Excavation Damage Zone Based on an Isotropic Damage Model. In Constitutive Modeling of Geomaterials; Yang, Q., Zhang, J.M., Zheng, H., Yao, Y., Eds.; Springer: Berlin, Germany, 2013; pp. 741–750. [Google Scholar] [CrossRef]
- Cai, M.; Kaiser, P.K.; Tasaka, Y.; Minami, M. Determination of residual strength parameters of jointed rock masses using the GSI system. Int. J. Rock Mech. Min. Sci. 2007, 44, 247–265. [Google Scholar] [CrossRef]
- Gkikas, V.I.; Nomikos, P.P. Primary Support Design for Sequentially Excavated Tunnel Junctions in Strain-Softening Hoek–Brown Rock Mass. Geotech. Geol. Eng. 2021, 39, 1997–2018. [Google Scholar] [CrossRef]
- Karki, S.; Karki, B.; Chhushyabaga, B.; Khadka, S.S. Design and Analysis of Squeezing Ground Hydropower Tunnel in the Himalaya through a Case Study. Lowl. Technol. Int. 2020, 21, 268–278. [Google Scholar]
- Marini, D.; Zurlo, R.; Rivoltini, M.; Pizzarotti, E.M. Brenner Base Tunnel, Italian Side: Mining methods stretches—Design procedures. In Tunnels and Underground Cities. Engineering and Innovation Meet Archaeology, Architecture and Art. Volume 7: Long And Deep Tunnels; Peila, D., Viggiani, G., Celestino, T., Eds.; CRC Press: London, UK, 2020. [Google Scholar] [CrossRef]
- Sebbeh-Newton, S.; Shehu, S.A.; Ayawah, P.; Kaba, A.A.; Zabidi, H. Analytical and numerical assessment of a preliminary support design—A case study. Cogent Eng. 2021, 8, 1869367. [Google Scholar] [CrossRef]
- Rodríguez, R.; Díaz-Aguado, M.B. Deduction and use of an analytical expression for the characteristic curve of a support based on yielding steel ribs. Tunn. Undergr. Space Technol. 2013, 33, 159–170. [Google Scholar] [CrossRef]


| Parameter | Symbol | Unit | Rock Mass Class | ||
|---|---|---|---|---|---|
| I | II | III | |||
| Cohesive strength of the rock mass | MPa | 6.39 | 5.18 | 2.65 | |
| Internal friction angle of the rock mass | ⁰ | 38.67 | 33.73 | 29.30 | |
| Rock mass Young modulus | MPa | 7667 | 5409 | 3338 | |
| Rock mass Poisson’s ratio | - | 0.20 | 0.20 | 0.20 | |
| Critical longitudinal strain of the rock mass | - | 0.0046 | 0.0051 | 0.0054 | |
| Parameter | Symbol | Unit | Rock Mass Class | ||
|---|---|---|---|---|---|
| I | II | III | |||
| Compressive strength of the rock mass within the elastic zone | MPa | 26.60 | 19.37 | 9.05 | |
| Compressive strength of the rock mass within the plastic zone | MPa | 13.30 | 9.69 | 4.53 | |
| Computational factor | - | 3.33 | 2.50 | 1.92 | |
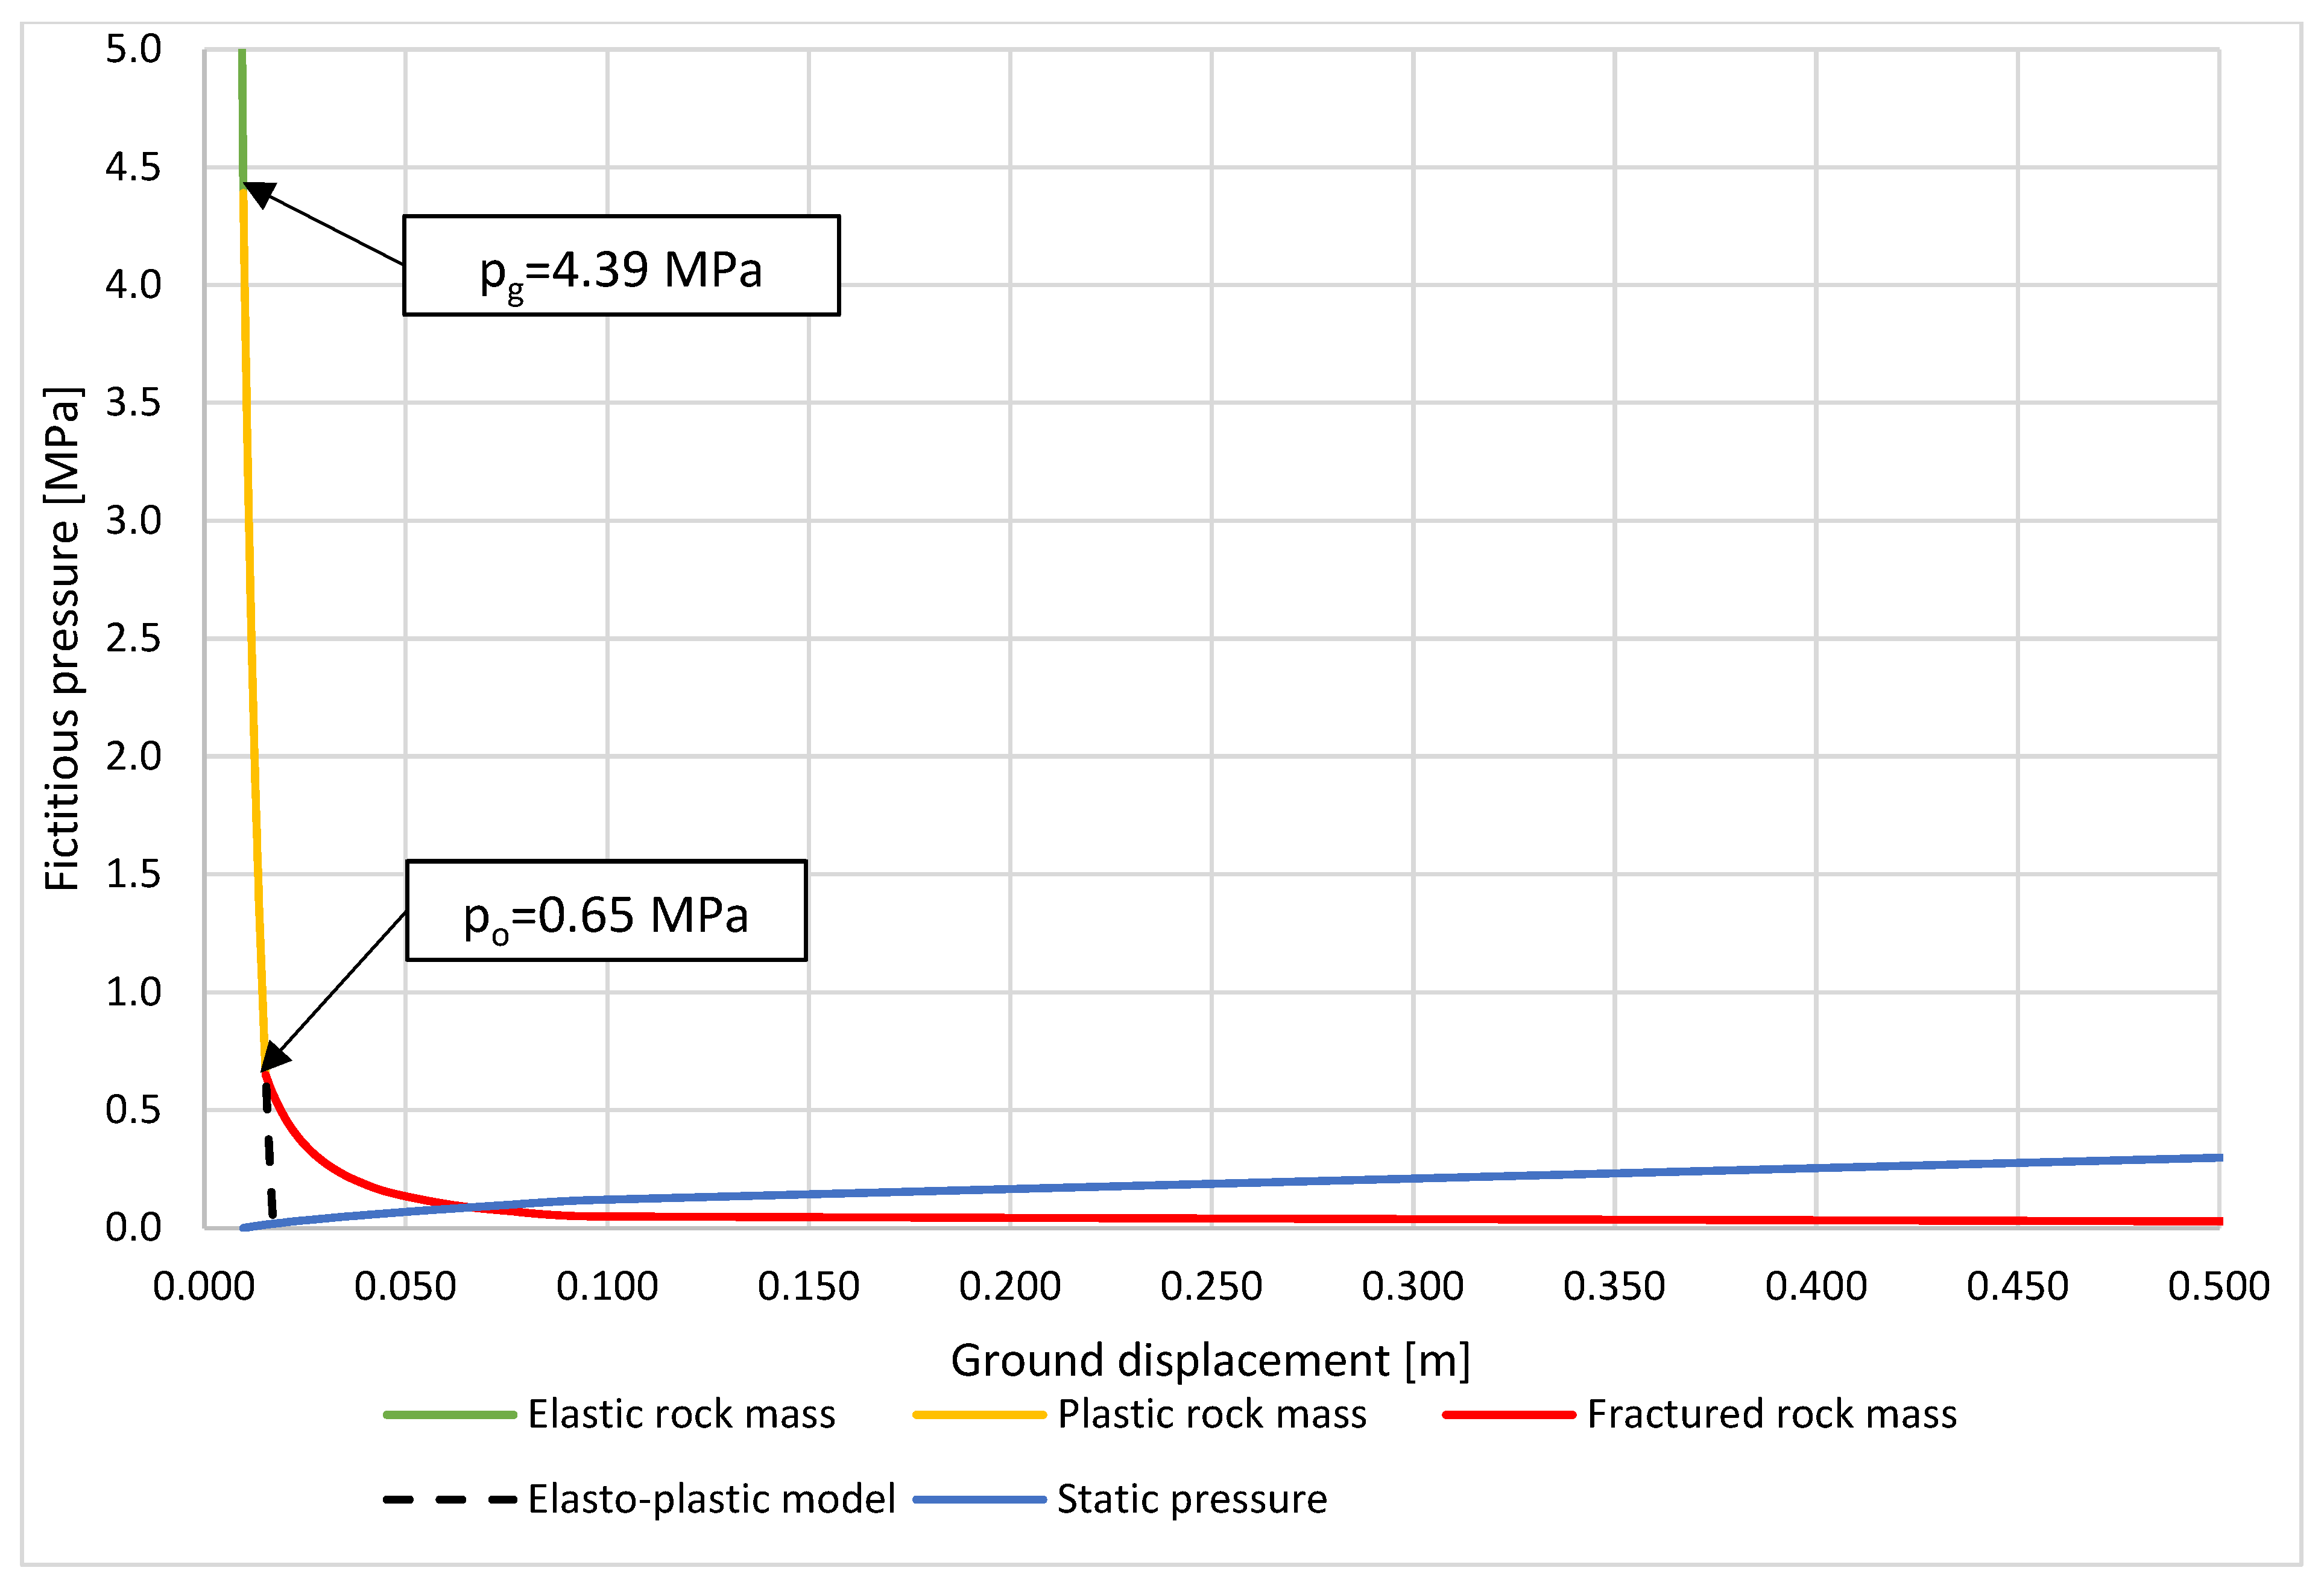
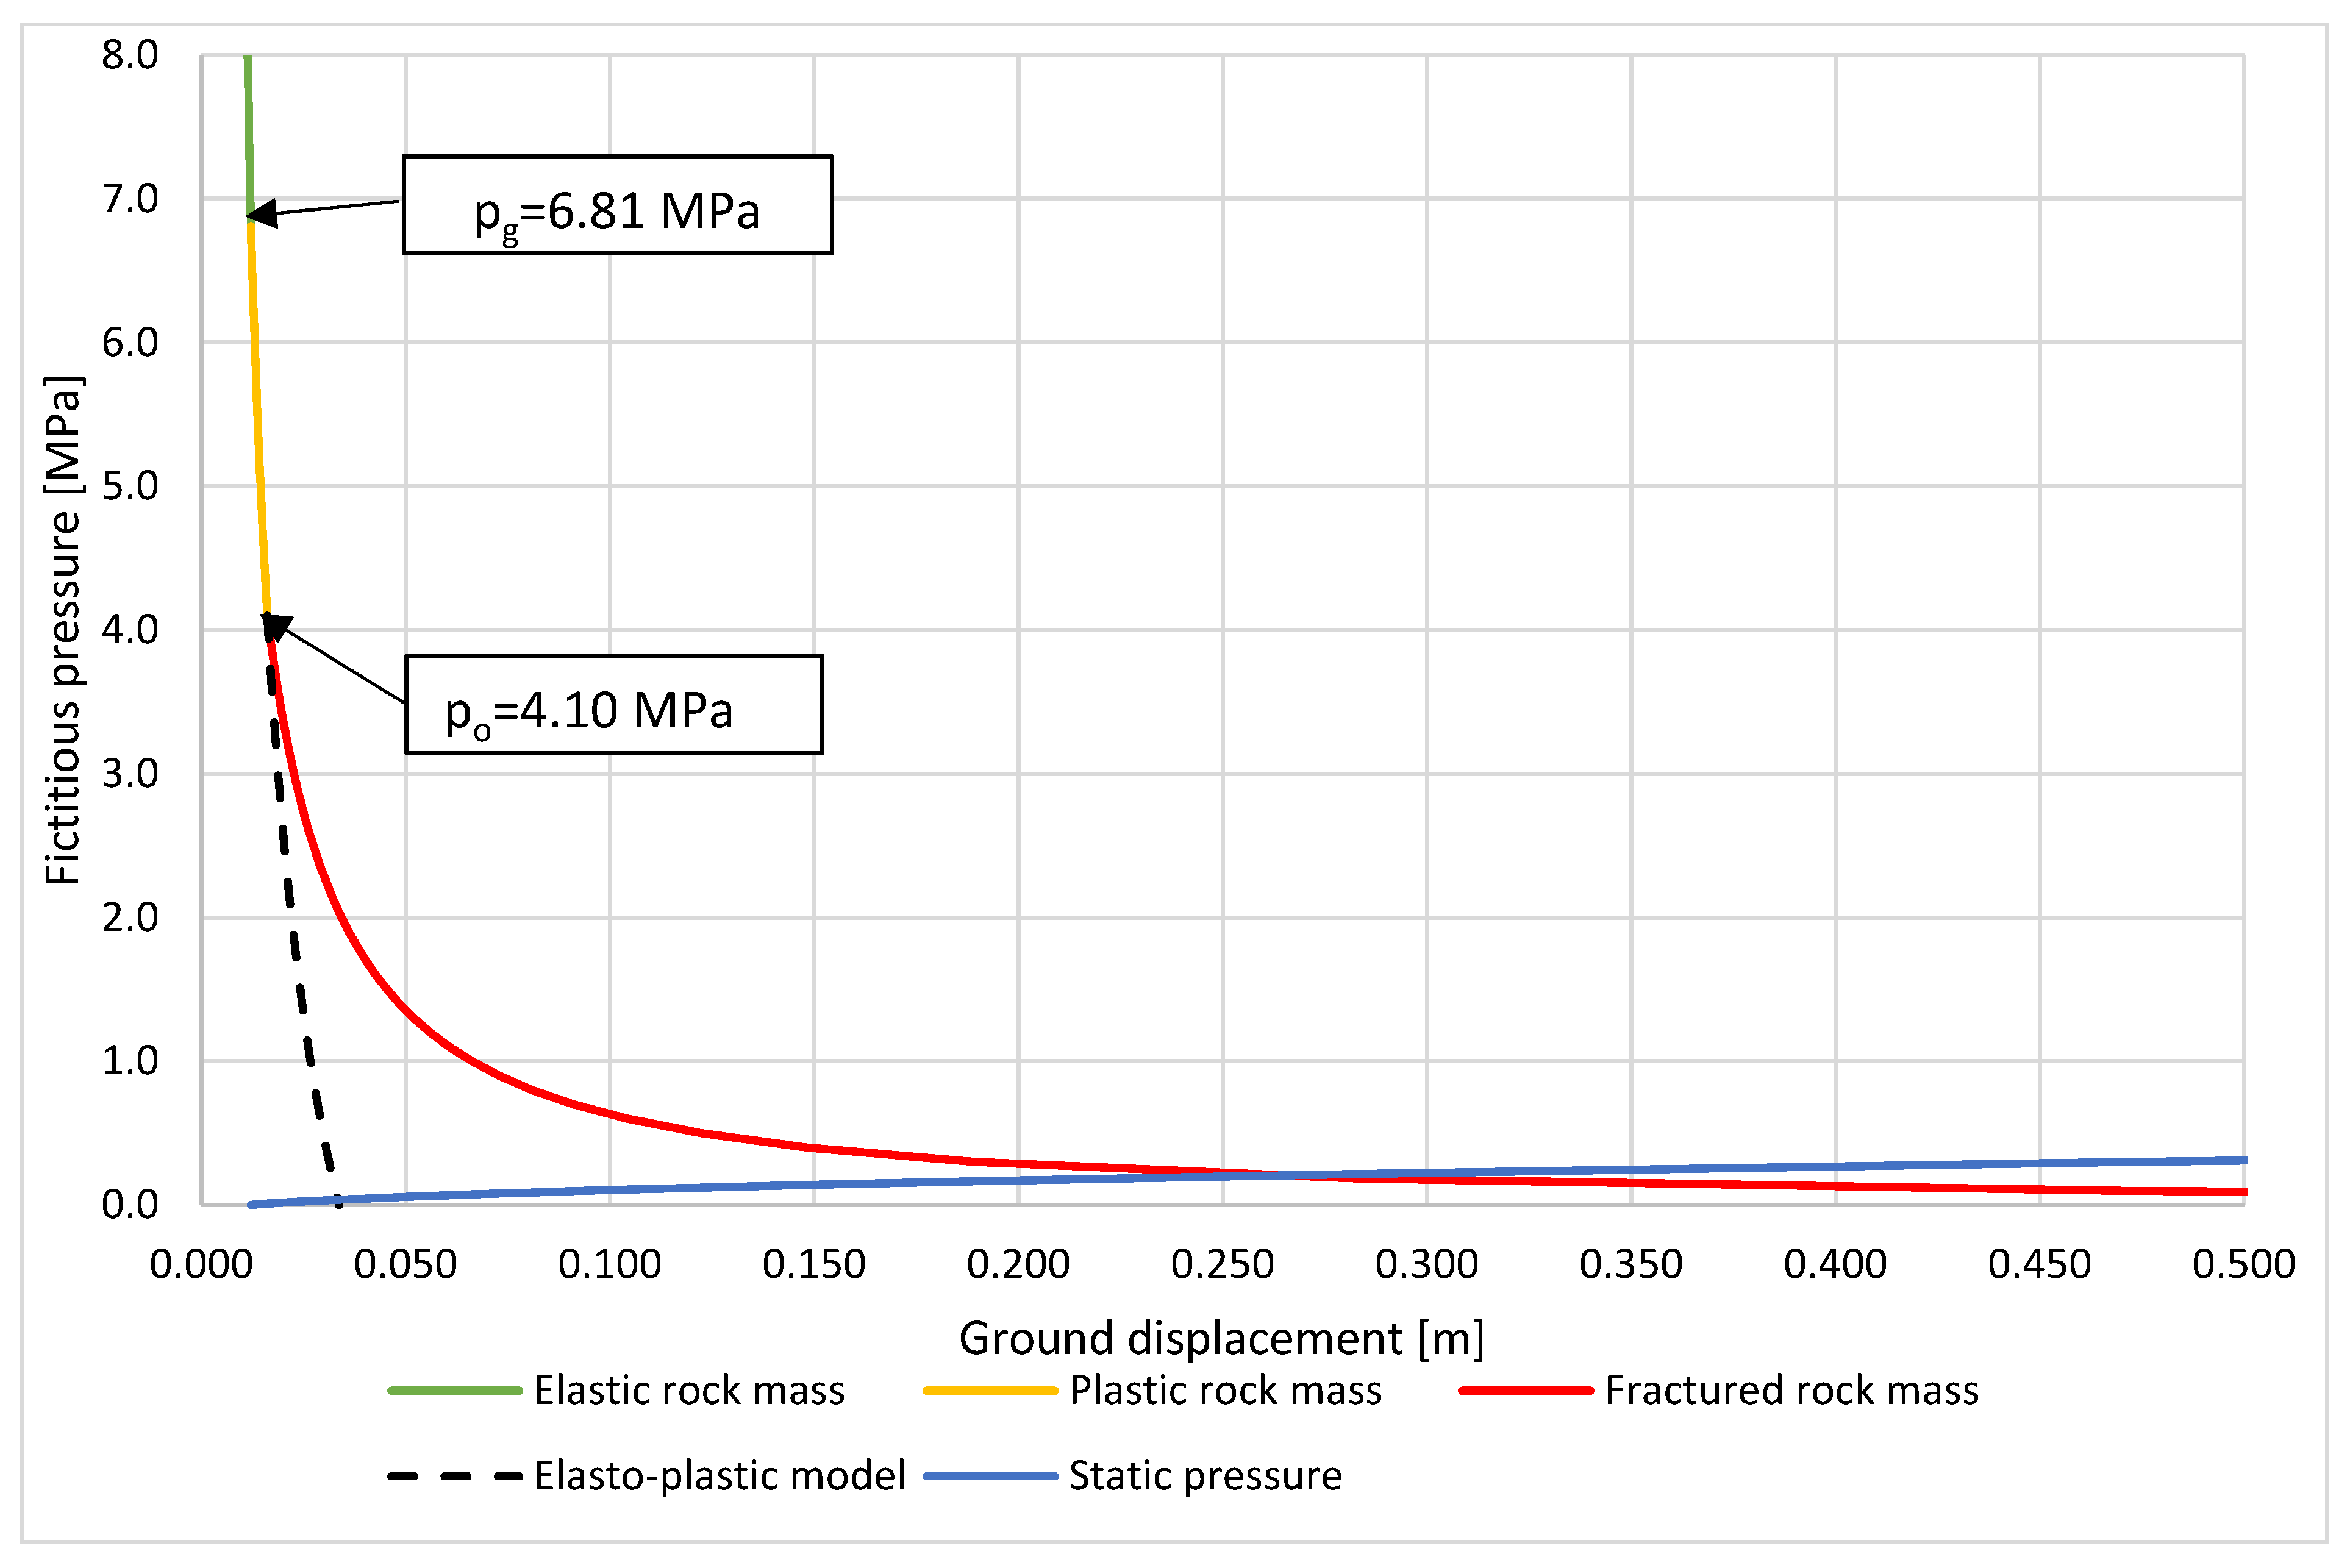
| Radial stress on the boundary between plastic and elastic zone | MPa | 4.39 | 6.81 | 10.45 | |
| Radial stress on the boundary between fracture and plastic zone | MPa | 0.65 | 4.10 | 10.03 | |
| Deformational pressure at the equilibrium state | MPa | 0.071 | 0.284 | 0.354 | |
| Fracture zone radius at the equilibrium state | m | 5.83 | 10.39 | 17.17 | |
| Plastic zone radius at the equilibrium state | m | 6.96 | 11.68 | 17.47 | |
| Rock mass displacement at the equilibrium state | m | 0.076 | 0.217 | 0.833 | |
| Parameter | Symbol | Unit | Rock Mass Class | ||
|---|---|---|---|---|---|
| I | II | III | |||
| Cross sectional area of the section | m2 | 0.00452 | |||
| Young’s modulus of the steel | MPa | 210,000 | |||
| Yield strength of the steel | MPa | 440 | |||
| Yielding force of the sliding joint | MN | 0.35 | |||
| Maximum sliding length | m | 0.30 | |||
| Number of sliding joints in the steel set | - | 3 | |||
| Initial overlapped length | m | 0.6 | |||
| Steel set spacing | m | 1.0 | 0.6 | 0.4 | |
| Support capacity at 1st part of elastic deformation | MPa | 0.117 | 0.199 | 0.307 | |
| Maximum support capacity at yielding part | MPa | 0.176 | 0.299 | 0.461 | |
| Support capacity at 2nd part of elastic deformation | MPa | 0.701 | 1.192 | 1.842 | |
| Parameter | Symbol | Unit | Value |
|---|---|---|---|
| Input Parameters | |||
| Excavation radius | m | 3.13 | |
| In situ hydrostatic stress | MPa | 11.39 | |
| Cohesive strength of the rock mass | MPa | 2.65 | |
| Internal friction angle of the rock mass | ° | 29.30 | |
| Rock mass Young’s modulus | MPa | 3347.83 | |
| Rock mass Poisson’s ratio | - | 0.24 | |
| Critical longitudinal strain of the rock mass | - | 0.0054 | |
| Results | |||
| Compressive strength of the rock mass within the elastic zone | MPa | 9.05 | |
| Compressive strength of the rock mass within the plastic zone | MPa | 3.62 | |
| Computational factor | - | 1.92 | |
| Radial stress on the boundary between plastic and elastic zone | MPa | 3.504 | |
| Radial stress on the boundary between fracture and plastic zone | MPa | 1.103 | |
| Deformational pressure at the equilibrium state | MPa | 0.143 | |
| Fracture zone radius at the equilibrium state | m | 9.09 | |
| Plastic zone radius at the equilibrium state | m | 12.35 | |
| Rock mass displacement at the equilibrium state | m | 0.210 | |
| Parameter | Symbol | Unit | Value |
|---|---|---|---|
| Input Parameters | |||
| Cross sectional area of the section | m2 | 0.00452 | |
| Young’s modulus of the steel | MPa | 210,000 | |
| Yield strength of the steel | MPa | 440 | |
| Yielding force of the sliding joint | MN | 0.35 | |
| Maximum sliding length | m | 0.15 | |
| Number of sliding joints in the steel set | - | 7 | |
| Initial overlapped length | m | 0.60 | |
| Steel set spacing | m | 0.50 | |
| Results | |||
| Support capacity at 1st part of elastic deformation | MPa | 0.227 | |
| Maximum support capacity at yielding part | MPa | 0.299 | |
| Support capacity at 2nd part of elastic deformation | MPa | 1.364 | |
Disclaimer/Publisher’s Note: The statements, opinions and data contained in all publications are solely those of the individual author(s) and contributor(s) and not of MDPI and/or the editor(s). MDPI and/or the editor(s) disclaim responsibility for any injury to people or property resulting from any ideas, methods, instructions or products referred to in the content. |
© 2024 by the authors. Licensee MDPI, Basel, Switzerland. This article is an open access article distributed under the terms and conditions of the Creative Commons Attribution (CC BY) license (https://creativecommons.org/licenses/by/4.0/).
Share and Cite
Kamiński, P.; Otto, A.; Dawidziuk, P.; Malinowski, L.; Stecuła, K.; Dyczko, A. Determination of the Ground Reaction Curve for an Elasto-Plasto-Fractured Rock Mass. Appl. Sci. 2024, 14, 5409. https://doi.org/10.3390/app14135409
Kamiński P, Otto A, Dawidziuk P, Malinowski L, Stecuła K, Dyczko A. Determination of the Ground Reaction Curve for an Elasto-Plasto-Fractured Rock Mass. Applied Sciences. 2024; 14(13):5409. https://doi.org/10.3390/app14135409
Chicago/Turabian StyleKamiński, Paweł, Aleksandra Otto, Piotr Dawidziuk, Leszek Malinowski, Kinga Stecuła, and Artur Dyczko. 2024. "Determination of the Ground Reaction Curve for an Elasto-Plasto-Fractured Rock Mass" Applied Sciences 14, no. 13: 5409. https://doi.org/10.3390/app14135409
APA StyleKamiński, P., Otto, A., Dawidziuk, P., Malinowski, L., Stecuła, K., & Dyczko, A. (2024). Determination of the Ground Reaction Curve for an Elasto-Plasto-Fractured Rock Mass. Applied Sciences, 14(13), 5409. https://doi.org/10.3390/app14135409