Article

Electroencephalography Response during an Incremental Test According to the V̇O2max Plateau Incidence

by
Véronique Billat
1,2,*,
Christian Berthomier
3,
Michel Clémençon
4,5,
Marie Brandewinder
3,
Slim Essid
6,
Cécilia Damon
6,
François Rigaud
6,
Alexis Bénichoux
6,
Emmanuel Maby
7,
Lesly Fornoni
7,
Patrick Bouchet
7,
Pascal Van Beers
8,
Bertrand Massot
9,
Patrice Revol
10,
Luc Poinsard
1,
Thomas Creveaux
4,
Christian Collet
4,
Jérémie Mattout
7 and
Vincent Pialoux
4,11
1
Movement, Balance, Performance, and Health Laboratory (EA 4445), Université de Pau et des Pays de l’Adour, 65000 Tarbes, France
2
Faculté des Sciences du Sport, Université Paris-Saclay, Univ Evry, 91000 Evry-Courcouronnes, France
3
Physip, 6 Rue Gobert, 75011 Paris, France
4
Inter-University Laboratory of Human Movement Biology (EA 7424), Claude Bernard University of Lyon 1, 69100 Villeurbanne, France
5
Centre d’Etudes des Transformations des Activités Physiques et Sportives, Normandie Université, UNIROUEN, CETAPS, 76000 Rouen, France
6
Institut Telecom Paris, CNRS-LTCI, 91120 Palaiseau, France
7
Lyon Neuroscience Research Center, Brain Dynamics and Cognition Team, INSERM UMRS 1028, CNRS UMR 5292, Université Claude Bernard Lyon 1, 69100 Villeurbanne, France
8
Unité Fatigue et Vigilance, Institut de Recherche Biomédicale des Armées (IRBA), 91220 Brétigny-sur-Orge, France
9
INSA Lyon, Ecole Centrale de Lyon, CNRS, Université Claude Bernard Lyon 1, CPE Lyon, INL, UMR5270, 69621 Villeurbanne, France
10
Service de Médecine Physique et Réadaptation, Hôpital Henry Gabrielle, Hospices Civils de Lyon, 69230 Saint-Genis-Laval, France
11
Institut Universitaire de France, 75231 Paris, France
*
Author to whom correspondence should be addressed.
Appl. Sci. 2024, 14(13), 5411; https://doi.org/10.3390/app14135411
Submission received: 13 May 2024 / Revised: 17 June 2024 / Accepted: 18 June 2024 / Published: 21 June 2024
(This article belongs to the Special Issue Computational and Mathematical Methods for Neuroscience)

Abstract

:
V ̇ O2max is recognized as a key measure in exercise physiology and sports medicine. However, only 20–50% of maximal incremental exercise tests (IET) result in a plateau of V ̇ O2 ( V ̇ O2pl). To our knowledge, no study has yet examined the possible difference in brain activity during an IET, in V ̇ O2pl and non-plateau athletes with the same V ̇ O2max and age. This study aimed to shed light on the central governor hypothesis, namely that the inability to reach a V ̇ O2pl may be dictated by the brain rather than by a peripheral physical limit. This hypothesis can now be explored using electroencephalography (EEG) during IET, measuring concomitant power in specific frequency bands. Forty-two athletes were divided into two groups: those who practiced endurance sports and those who did not, and were asked to perform an IET. EEG signals and gas exchange were recorded. A V ̇ O2pl was observed in twenty-two subjects (52%). EEG power increased in all subjects during IET, except in the alpha band, which showed variability, but not significantly (64% increase, 34% decrease, p = 0.07). No differences were found between endurance athletes and non-endurance athletes, except for V ̇ O2max (60.10 ± 6.16 vs. 51.77 ± 6.41, p < 0.001). However, the baseline-corrected ratio of EEG power to V ̇ O2 was found to decrease in all subjects during IET, in the alpha, beta and theta bands. In conclusion, the presence or absence of a V ̇ O2pl is not related to the type of EEG response during an IET. Nevertheless, the decline in brain and V ̇ O2 powers/ratios in all frequency bands suggests that aerobic power may be constrained by brain mobilization.

1. Introduction

The fundamental tenet of maximal oxygen consumption ( V ̇ O2max), positing a threshold in speed or work rate beyond which no further increases in V ̇ O2 is observed, traces its origins back in the seminal work of Hill and Lupton in 1923 [1]. They observed a limit to the body’s ability to use oxygen during exercise, beyond which oxygen consumption reaches a plateau despite increasing exercise intensity. Currently, V ̇ O2max is recognized as a key measure in exercise physiology and sports medicine [2,3]. However, it should be noted that the certainty of reaching V ̇ O2max requires the observation of a V ̇ O2 plateau ( V ̇ O2pl), defined as the point at which V ̇ O2 remains relatively constant despite increasing work rate. Therefore, by definition, diagnosis of V ̇ O2max requires a V ̇ O2pl, whether it occurs at the end of a continuous incremental test, between the final stages of a discontinuous test, or between an incremental test and a subsequent verification test, as Poole and Jones pointed out [4].
The observation that only a subset of participants in an incremental test have a V ̇ O2pl highlights the variability inherent in such assessments. Reported incidences vary considerably, ranging from 17 to 94%, even in studies involving more than 50 participants, particularly depending on the definition of V ̇ O2pl used [5]. This variability has led to an extensive debate on the conceptualization and diagnosis of V ̇ O2max over the last three decades [2,4]. Only 20–50% of V ̇ O2max tests result in a plateau according to this definition [6,7,8,9,10,11,12,13,14]. The low frequency of the V ̇ O2pl has been reported by [15].
However, behind the discussion about the absolute necessity of observing a V ̇ O2pl to assess true “ V ̇ O2max”, and not just a “ V ̇ O2peak” [16,17,18,19], lies the fundamental question of the limiting factors of V ̇ O2. Reasons for the presence of V ̇ O2pl in some, but not all, athletes are not yet clear [18]. Lower anaerobic power or capacity has been suggested as a cause of the absence of plateau [19,20,21]. Furthermore, it has been shown that faster oxygen kinetics, which minimizes the anaerobic contribution to metabolism in the severe intensity range between the respiratory compensation threshold (RCP) and V ̇ O2max (or V ̇ O2peak) during an incremental exercise test (IET), increases the chances of a plateau occurring at V ̇ O2max [5].
However, the role of the brain in regulating exercise intensity to exhaustion has been hotly debated [22,23,24,25]. More specifically, the brain has been given greater consideration in models describing the factors responsible for continuing or stopping ongoing exercise. Noakes has suggested that unpleasant sensations of fatigue provide useful feedback to the central nervous system and are used as key regulators to stop exhausting exercise before there is a risk of physiological damage [26]. This hypothesis underlines the importance of recording brain activity alongside exercise characteristics and environmental conditions, particularly under conditions of exhaustion. A better understanding of brain responses to exhaustive exercise up to V ̇ O2max would rely on a multimodal approach that could combine neurological, physiological, and biomechanical data.
Regarding neurophysiological aspects, two methods are less restrictive and allow body and head movements: near-infrared spectroscopy (NIRS) and electroencephalogram (EEG). Indeed, brain activity has already been studied during high-intensity exercise, notably when performing an IET on an ergobicycle until exhaustion using NIRS [27,28,29,30] or EEG [31,32,33]. EEG provides robust information on changes in cortical potentials, particularly rhythmic activity and frequency of synaptic processes [33,34,35]. EEG is one of the most pragmatic means of monitoring changes in brain activity in humans during exercise, certainly because it is less intrusive [31,34,36]. EEG is used to measure cortical brain activity, which is categorized into distinct frequency ranges such as alpha (α: 8–12 Hz) and beta (β: 12–30 Hz), each related to different cognitive functions regulated by the brain. Alpha activity, characterized by quite low-frequency oscillations, is associated with perceptual awareness and inhibition of non-essential processing, which facilitates task performance [37,38]. Conversely, beta activity, characterized by high-frequency oscillations, is associated with voluntary contractions, alertness, and arousal, enhancing the perception of stimuli [39,40,41]. Spectral analysis is a common means of quantifying the frequency content of these bands, the main result being the power spectral density (PSD), which indicates the strength or energy of variations between frequencies. An increase in oscillations in cortical regions yields to an increase in the EEG’s spectral power.
Several studies have coupled EEG recording with a breath-by-breath expired gas system [31,33,34]. EEG activity has generally been recorded during pedaling tests at a constant load without exhaustion [42,43,44,45]. It has also been recorded during exercise to exhaustion in an incremental test [31,32,33,46]. While the role of the prefrontal cortex in exercise tolerance and termination has been investigated [47,48,49,50] showing, for example, that the alpha/beta ratio decreased after the subject experienced exercise as “hard” in reference to the Rate of Perception of Exhaustion [51] and then above the RCP [33,47,48], no study has yet examined the relationship between the occurrence of V ̇ O2pl with EEG response in well-trained athletes.
To our knowledge, no study has yet examined the possible difference in brain activity during maximal incremental testing in V ̇ O2pl and non-plateau athletes with the same V ̇ O2max and age. This study aimed to shed light on the central governor hypothesis, namely that the inability to reach a V ̇ O2pl may be dictated by the brain rather than by a peripheral physical limit. This hypothesis can now be explored using EEG during IET, measuring concomitant power in specific frequency bands. Forty-two athletes were divided into two groups: those who practiced endurance sports and those who did not, and were asked to perform an IET.
We hypothesize that the difference between athletes who reached the plateau of their V ̇ O2max and those who did not could be present in different EEG characteristics and in EEG/ V ̇ O2 ratios. Specifically, we believe that athletes who do not achieve a V ̇ O2pl will show a more pronounced decrease in the ratio between EEG power and V ̇ O2 as metabolic demand increases. To test this hypothesis, we compared, in the V ̇ O2pl and non-plateau groups of athletes, the relationship between increasing metabolic demand and EEG response by examining the ratios between the α, β, θ (theta) bands of the EEG and V ̇ O2. The aim was to tackle the possible issue of a decrease in the ratio between metabolic demand and brain activity during physical exercise.

2. Materials and Methods

2.1. Participants Recruitment and Ethical Approval

Forty-two volunteers participated in the experimentation (Table 1).
The population consisted of active men aged between 18 and 35 years old with no declared neurological or motor deficits. Participants were recruited through posters and communication among well-trained physical students and multisport practitioners. Volunteers were included in the experimental group and remunerated for their participation. This study was approved by the Léon Bérard Centre’s Research and Ethics Committee under the number A 13–160.
In addition, to take into account the types of sports practiced by the subjects, we divided them into two categories: sports with endurance (END) characteristics (triathlon, running, cycling and trail running) and those without (climbing, volleyball, basketball, judo, water polo, etc.). We had 22 athletes in the NONEND group and 20 in the END group.

2.2. Participants Recruitment and Ethical Approval

Each participant completed an IET. The purpose of the IET was to assess maximal aerobic power (MAP) and maximal oxygen consumption ( V ̇ O2max).
Prior to the test, a standardized warm-up allowed participants to familiarize themselves with the protocol and equipment. Each participant was asked to pedal constantly for 8 min: 2 min and 45 s at 50 W, and 5 min and 15 s, including six stages of 15 s each from 90 to 240 W (increasing by 30 W per stage), interspersed with 45 s intervals at 50 W basal power output. During the 5 min recovery period that followed, the participants were fully equipped before beginning the IET. This test was preceded by a 30 s period at 50 W before performing an incremental test until exhaustion. The test itself began at the power of 90 W and consisted of a series of two-minute increments of 30 W, with participants pedaling at their own frequency. No information on power or time was given during the test.
No verbal encouragement was given during the test. The experimental session is presented in Figure 1.

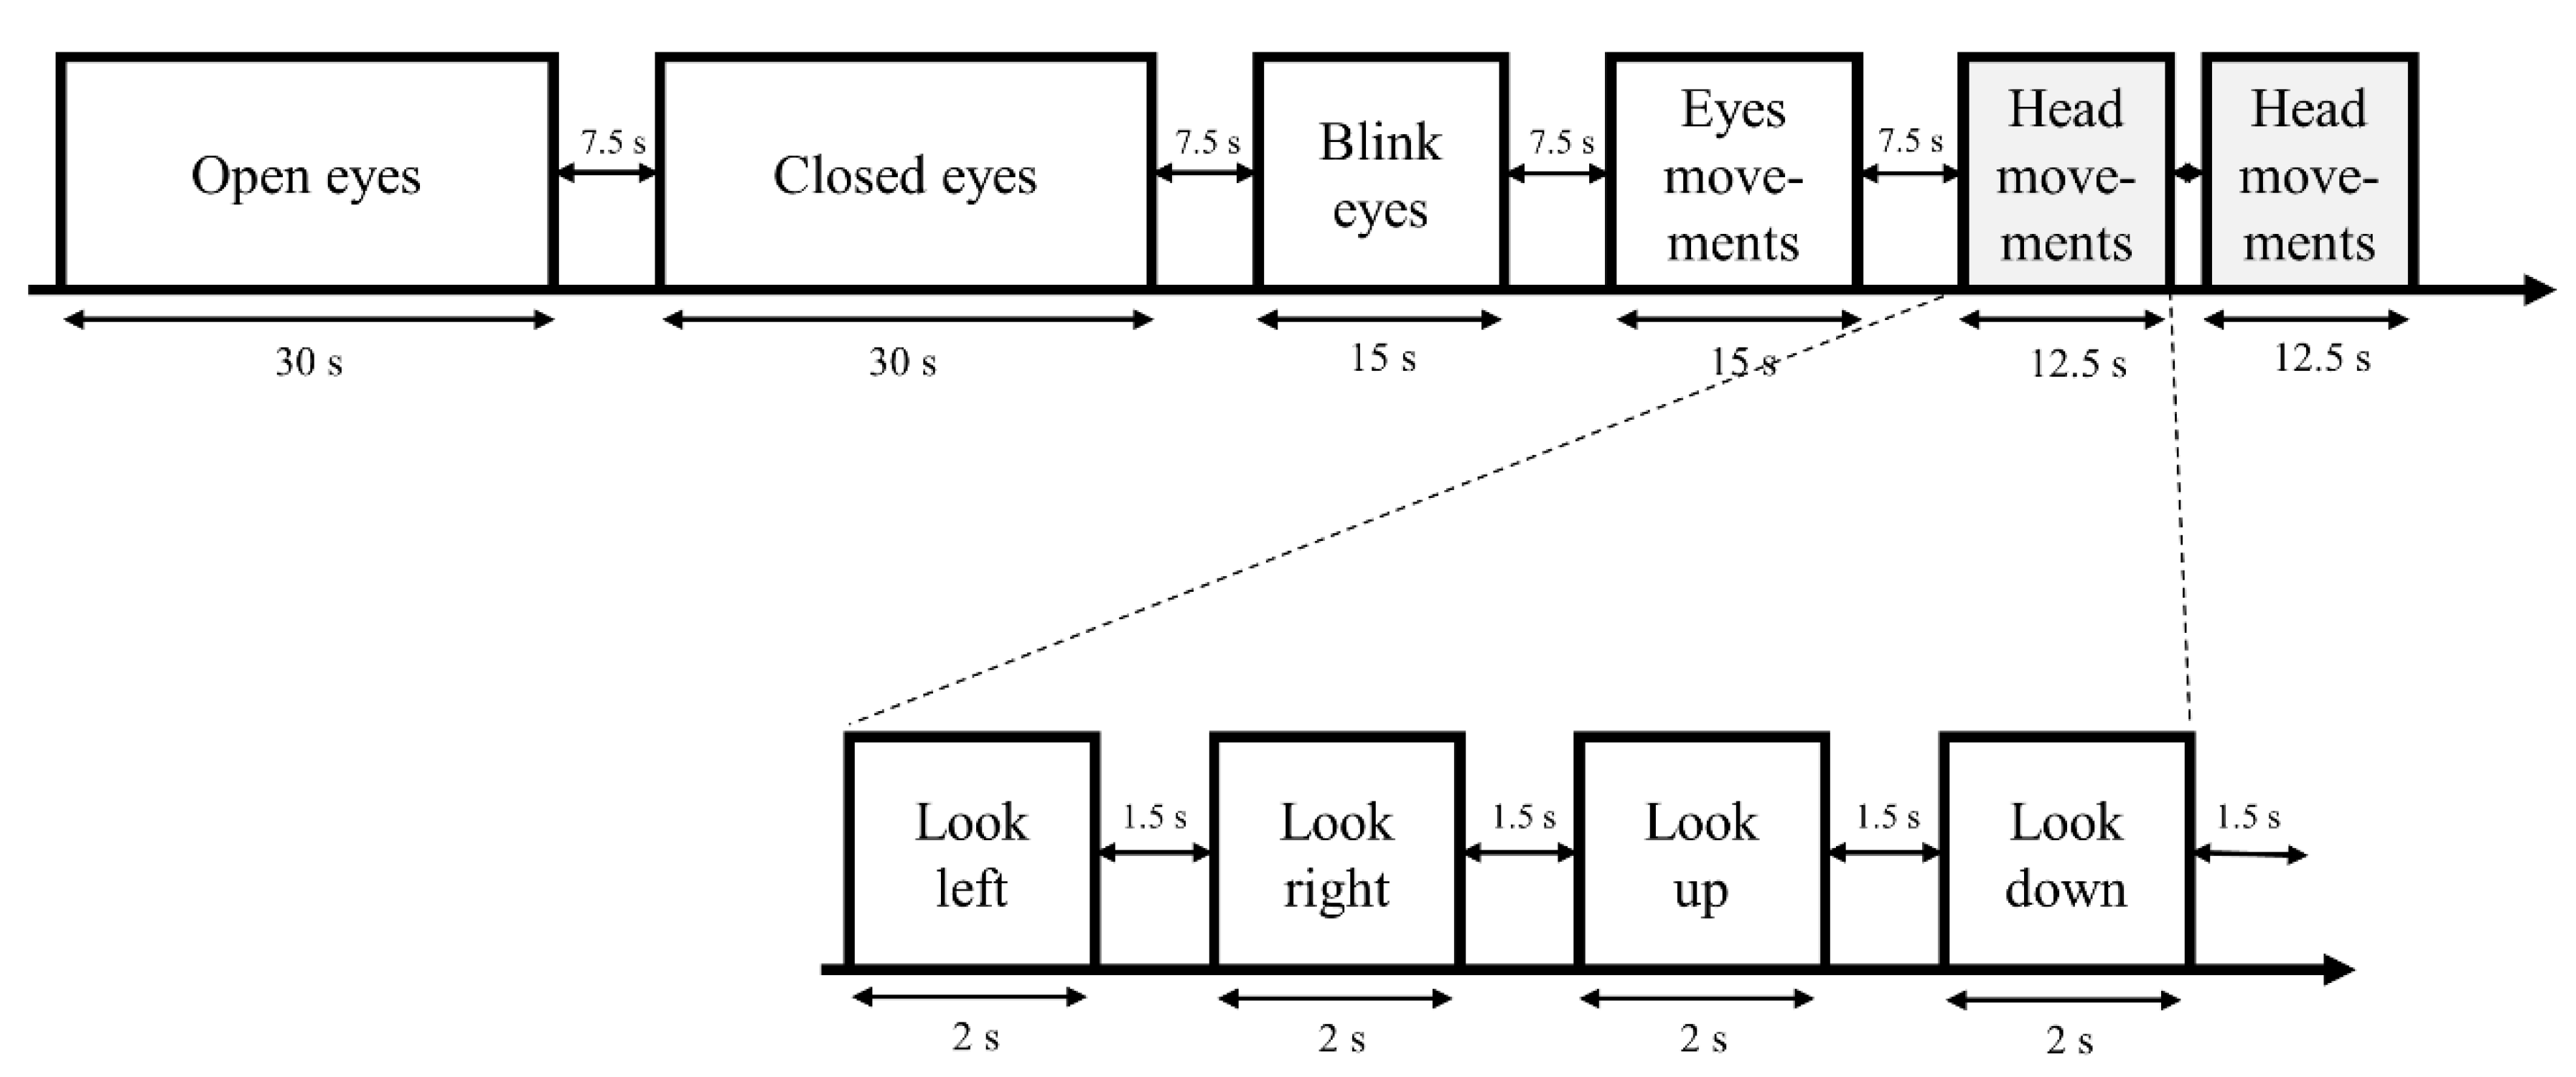
2.3. Experimental Design

Participants were seated in a chair. Using an abrasive cream (Nuprep®, Weaver and Company, Aurora, CO, USA) and a cotton swab, the skin was rubbed at the location of the reference and ground electrodes. This operation removed dead cells, impurities, and excess sebum to improve conductivity. Additionally, the forehead, scalp, and hair were degreased with a compress soaked in 70% alcohol [52]. They were then fitted with a Polar® heart rate belt, a gas mask, and an EEG headset. The EEG electrodes were positioned with conductive gel between the scalp and the electrodes to improve contact between the skin and the sensor. Subjects were then seated in a semi-recumbent position on a cyclo-ergometer, as shown in Figure 2.
In accordance with traditional recommendations [53,54], the electrodermal sensors were placed on the second phalanx of the second and third fingers of the non-dominant hand (or on the third phalanx, in case of frequent potential contact between the sensors and the environment). A conductive gel (Teca, ref. 822-201210) was applied between the sensors and the skin to improve contact after cleansing the skin with a mixture of alcohol and ether. The electrodes were then firmly strapped to the fingers using hypoallergenic adhesive tape. Finally, six 3D kinematic markers were placed on the head and shoulder (see Figure 2).
The impedance of the EEG electrodes was then checked, allowing the conductive EEG gel time to warm up to body temperature. The target impedance values were between 1 and 5 kΩ. If the impedance values were higher than 5 kΩ, conductive gel was added until the impedance reached the required values. At this point, the EEG calibration procedure began, as shown in Figure 3, and proceeded in the following sequence: 30 s with eyes open, 30 s with eyes closed, 15 s of eye blink, 15 s of eye movement, and 12.5 s of head movement alone in the four directions (left, right, up, and down). A 7.5 s pause was observed between each test sequence. The experimental EEG calibration procedure was carried out using Presentation® software (version 18.1, www.neurobs.com (accessed on 19 June 2024)) and presented on a computer in front of the subject. Participants were asked to look straight ahead and to remain motionless during the procedure, except for what they were asked to do.
After remaining static during the EEG calibration sequence, each participant warmed up for 8 min (see Figure 1). They were then fitted with a nafion/permapure sampling tube connected to a turbine for measurements of pulmonary gas exchange. Each subject then performed the physical test described above. The participants were asked to remain seated on the saddle in order to limit head and upper body movements as much as possible. After each test and one minute’s rest, each participant was asked to complete a perceived exertion rating scale (see below). After a 5 min rest, the EEG calibration procedure (Figure 3) was again performed, along with the impedance check.

Rating of Perceived Exertion (RPE) Scale
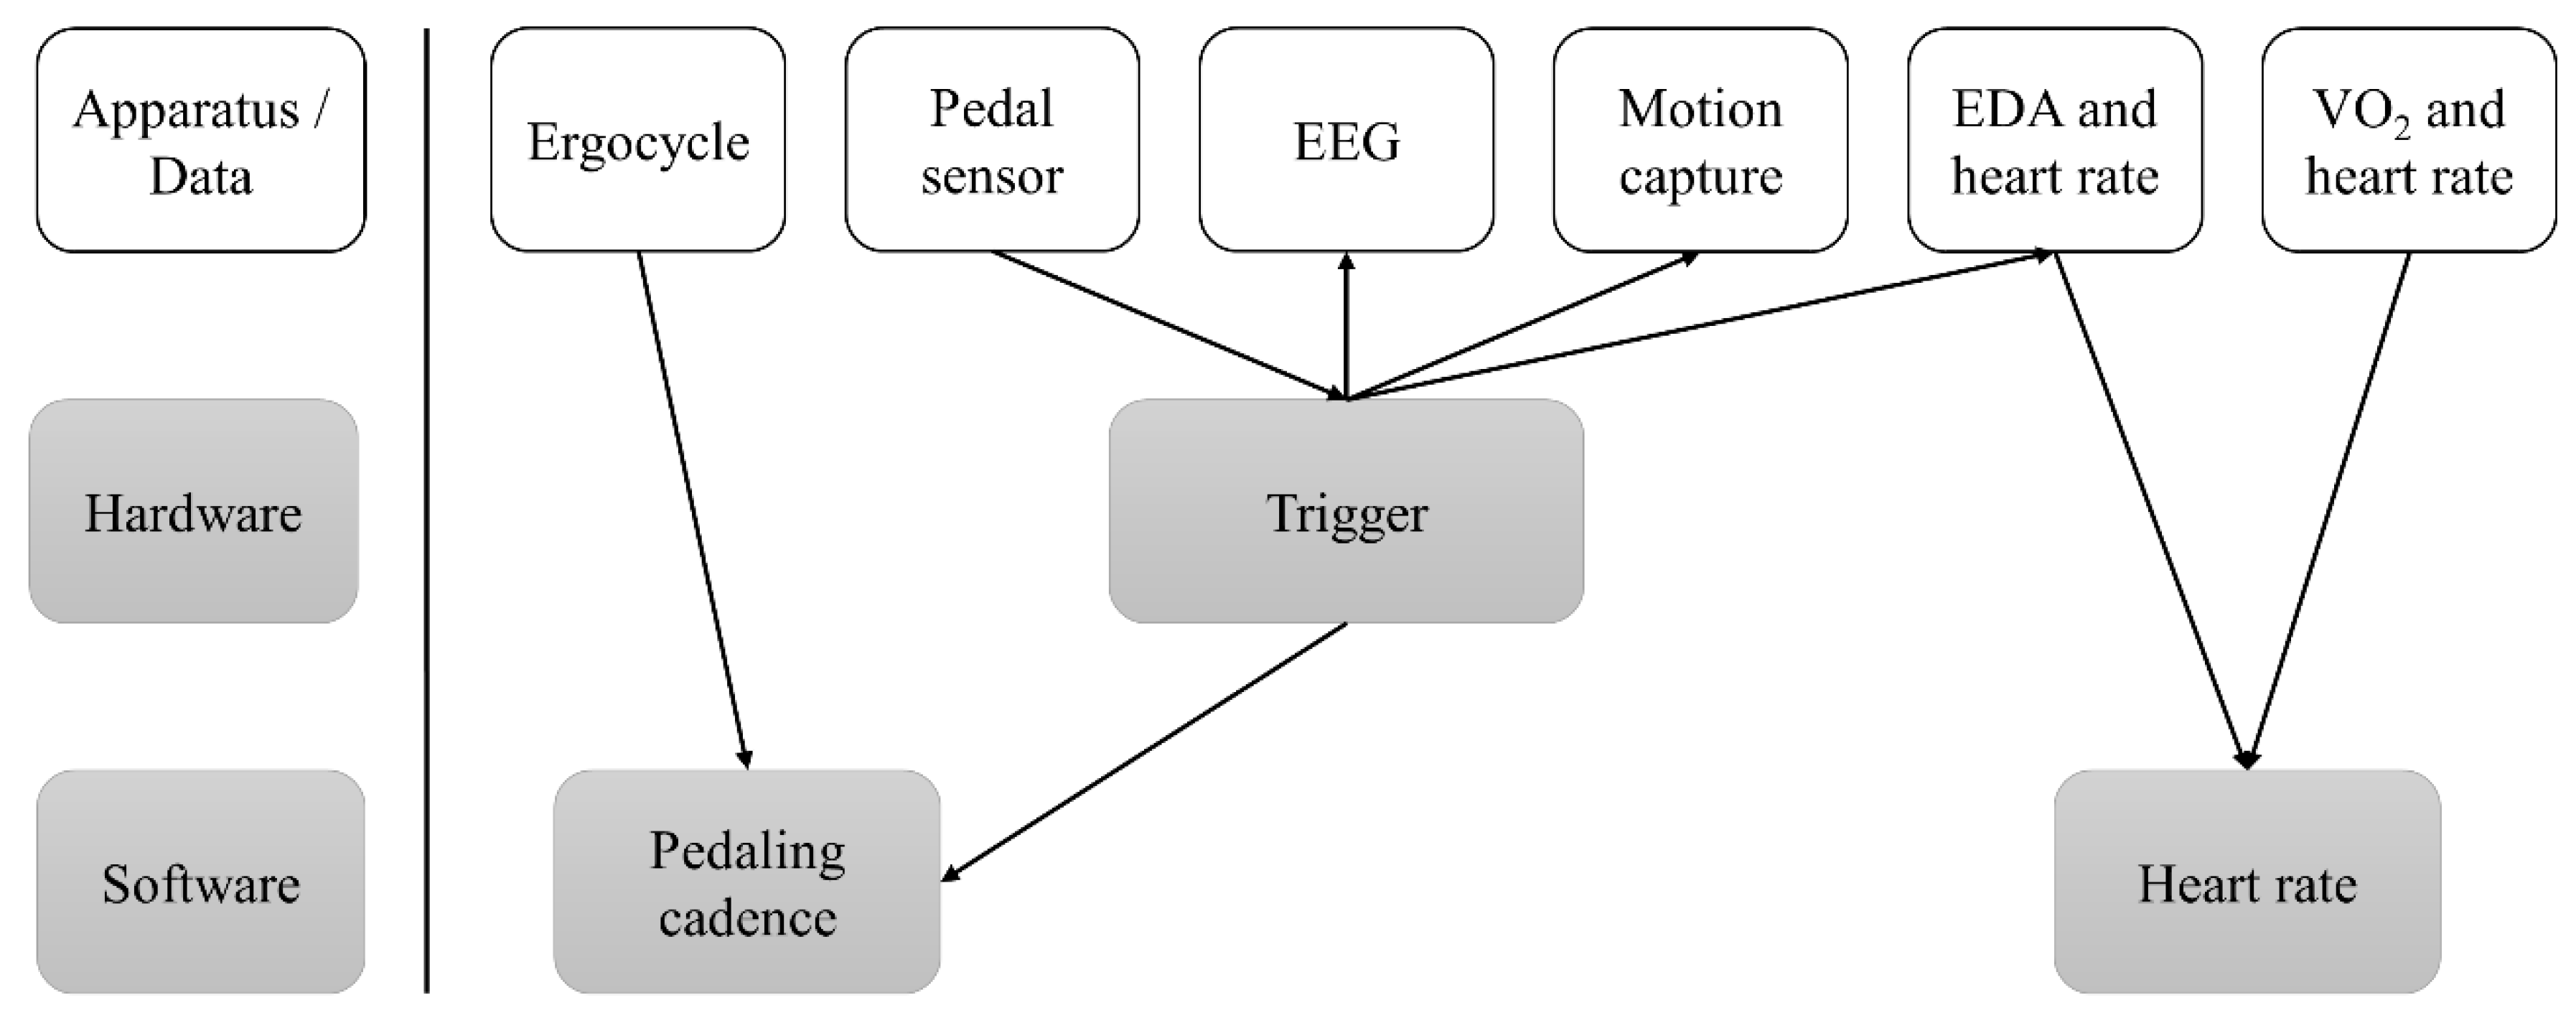
We asked each participant to rate the perceived exertion on a scale of 6 to 20 at the end of the IET. A score of 6 corresponds to rest and is closely correlated to a resting heart rate value, while 20/20 corresponds to maximal effort with the highest heart rate values [55].

2.4. Measurements

During the test, six apparatus recorded measurements throughout the exercise. Descriptions of each device are presented here, along with the relevant data recorded.

2.4.1. Ergocycle Data

We used the CycleOps 400 Pro Indoor Cycle (Saris Cycling Group, Inc., 5253 Verona Road, Madison, WI 53711, USA) with the CycleOps Joule 3.0 (Saris Cycling Group, Inc.) computer. The Joule 3.0 CPU uses ANT+ technology to communicate wirelessly with the bike’s sensors (i.e., the PowerTap power meter in the rear flywheel, speed sensor, cadence sensor, and heart rate strap sensor). The warm-up and the IET have been programmed in advance. This ergocycle makes it possible to adjust the power output regardless of the pedaling cadence. All data were stored on the Joule 3.0 CPU and downloaded to a computer running Power agent software (version 7.8.28) (Saris Cycling Group, Inc.). Power (W), torque (Nm), speed (km/h), cadence (rpm), and heart rate (bpm) were recorded and stored at a sampling rate of 1 Hz.

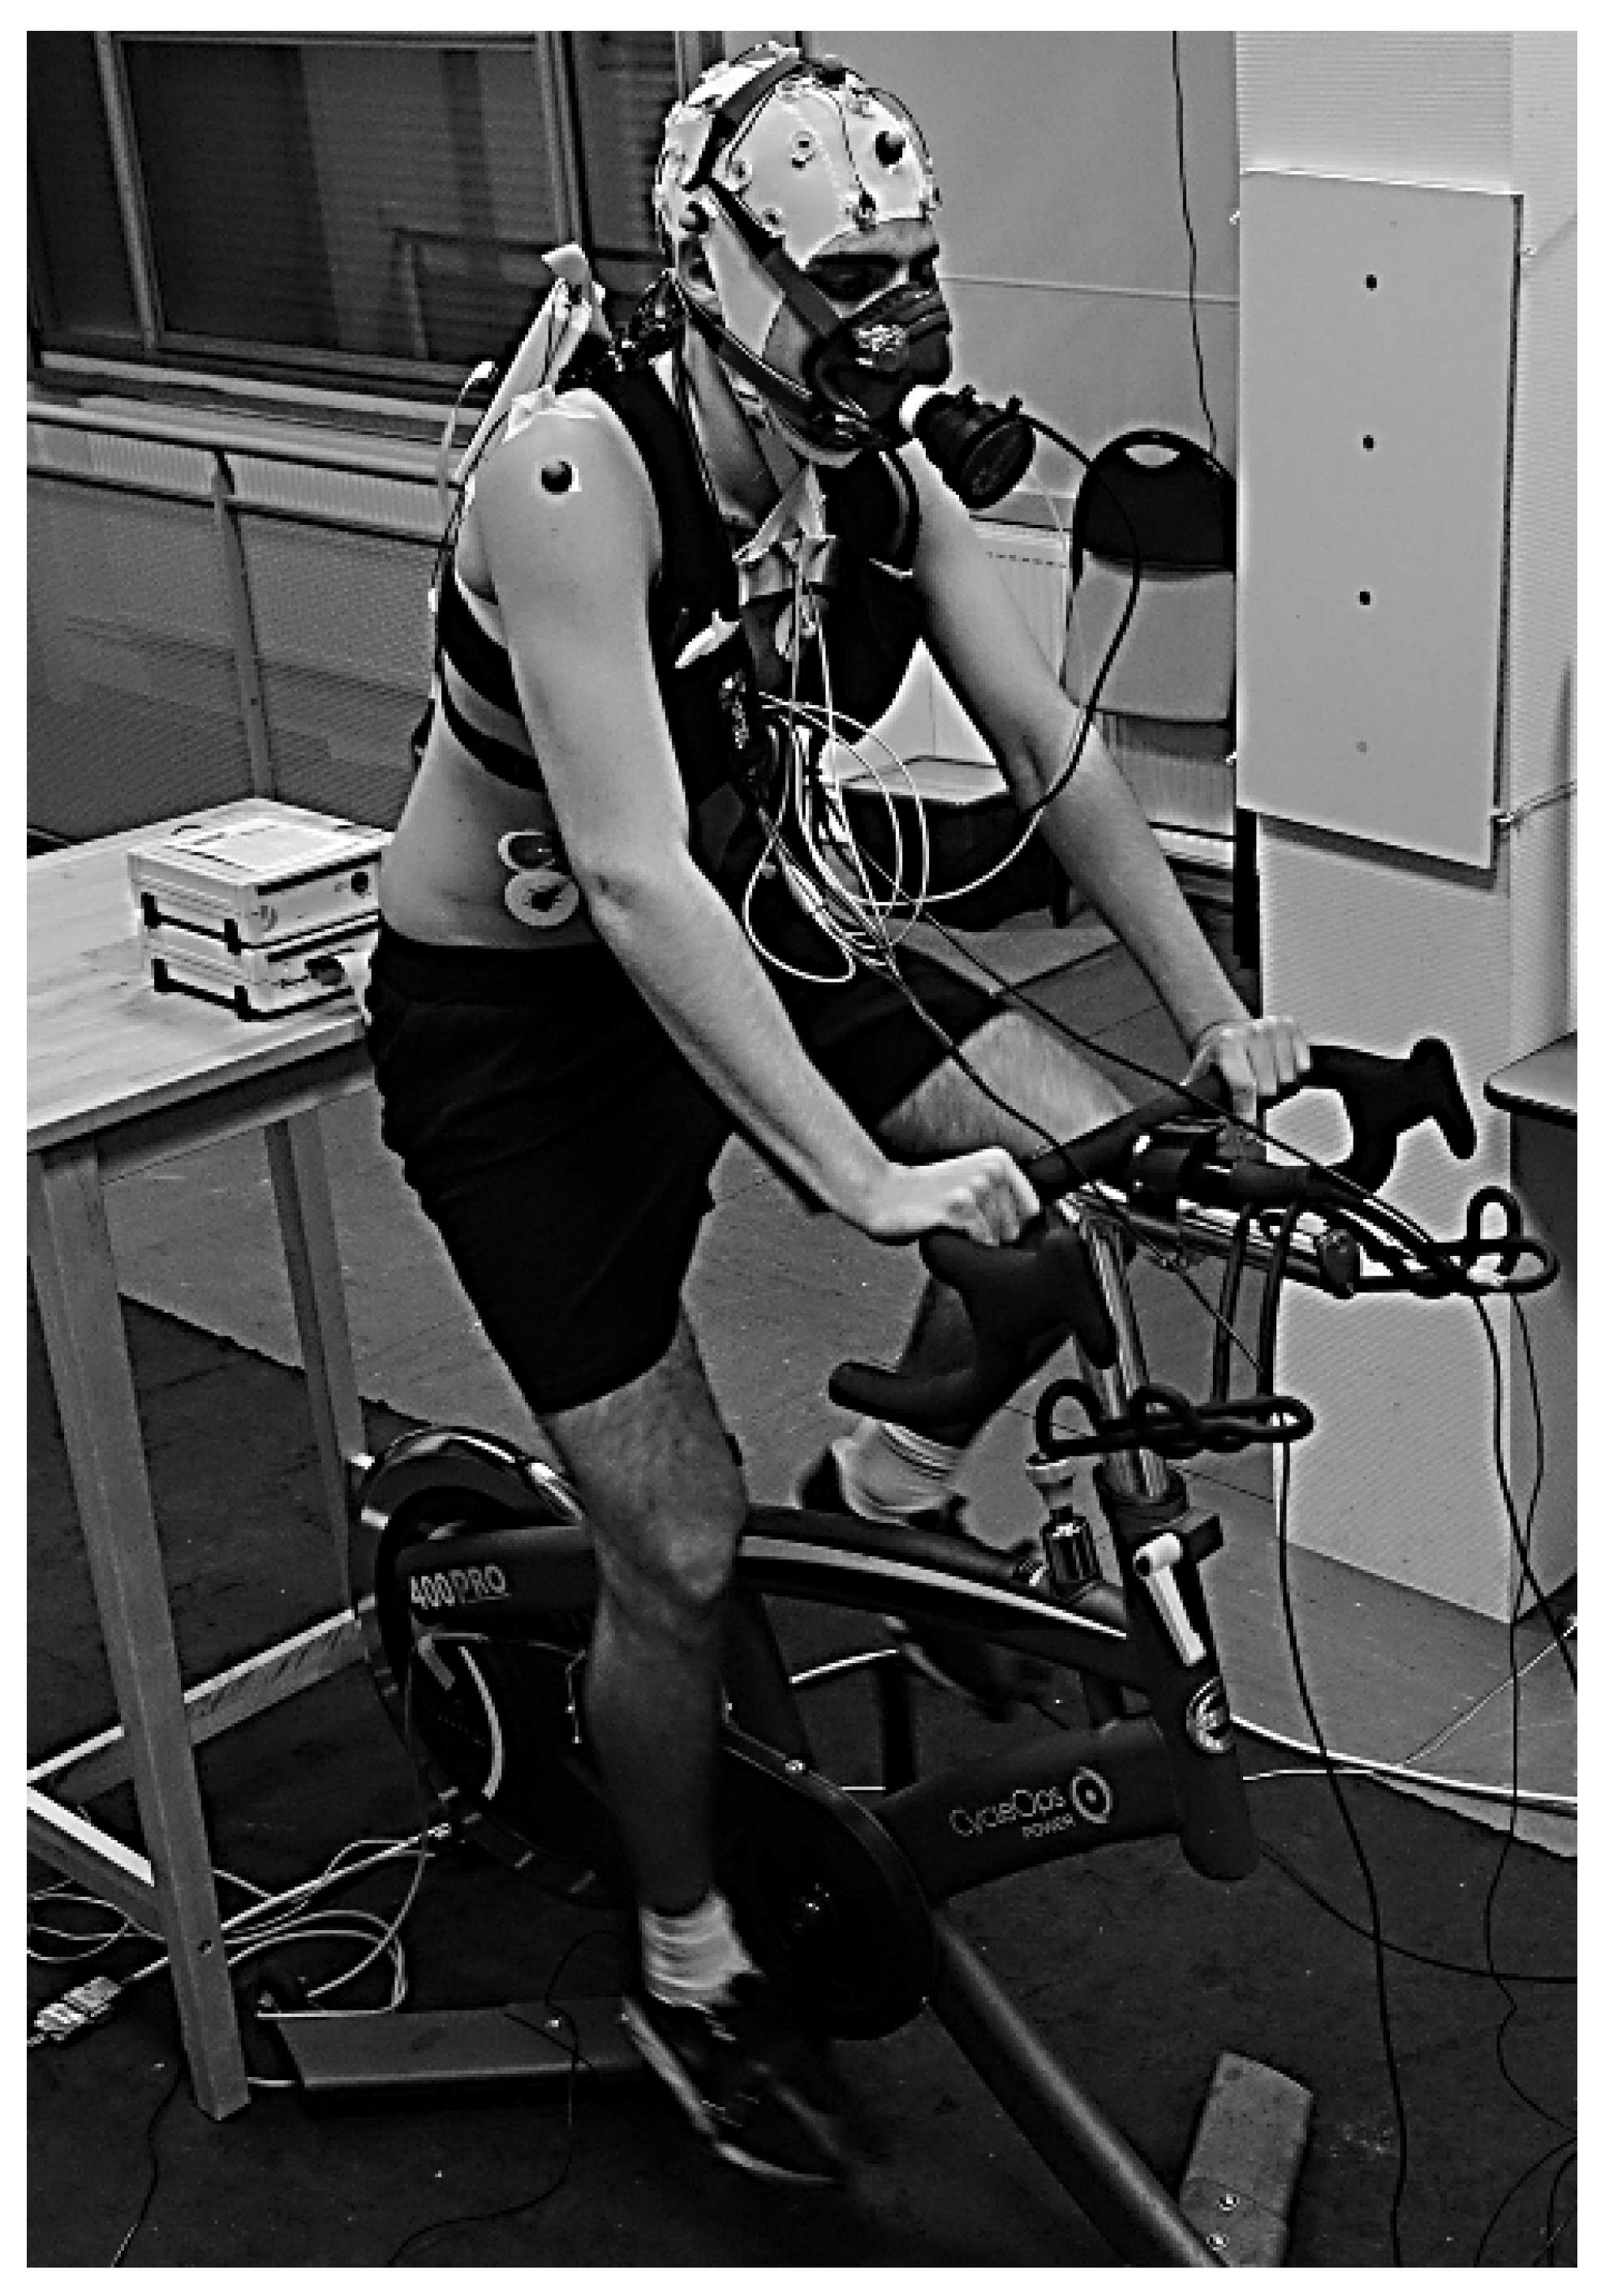
2.4.2. Electroencephalography Measurements

EEG was recorded using a 32-channel ActiCap system (Brain Products, Gilching, Germany), which combines active electrodes based on high-quality Ag/AgCl sensors with the application of a conductive gel to lower impedances. Ten sensors were used for the measurements. We used the following sites from the extended 10–10 system: Fp1, Fp2, Fz, C3, Cz, C4, Pz, O1, Oz, O2. The ground electrode was placed on the lateral third of the right scapula spine. All electrodes were referenced to an electrode placed on the right mastoid, and impedances were kept below 5 kΩ for all sensors. Analog signals were amplified (analog band-pass filter 0.016 Hz–1000 Hz) with a BrainAmp amplifier (Brain Products, Germany) and digitized at a frequency of 5000 Hz. EEG data were downsampled to 1000 Hz (with a 400 Hz anti-aliasing filter) and recorded using the Brain Vision Recorder software (version 1.20.0601, Brain Products, Gilching, Germany).

2.4.3. Heart Rate (HR) Measurements

Heart rate was measured in two different ways. Firstly, it was measured using a heart rate belt (Polar®) and synchronized with the gas measurements. Secondly, it was measured using a three-channel electrocardiogram (ECG) and synchronized with the electrodermal apparatus. The time of occurrence of the R-waves could thus be accurately determined. The D2 derivation signal (the interval between two consecutive ECG R-waves) was electronically processed and delivered in the form of instantaneous heart rate. In the case of missed ECG R-waves or false detection due to artifacts, HR could be estimated offline using an algorithm that iteratively replaced changes in IHR above a threshold of 10 beat per minute (bpm) with interpolated values. The interpolation was calculated between pairs of values below the threshold. The new signal, free of artifact, was then resampled. The smallest appreciable variation was 0.5 bpm, and the calibrated scale ranged from zero to 200 bpm. The IHR signal was then extracted directly from the ECG at the sensors. The IHR was therefore treated as an analog signal. Data acquisition was performed at 10 Hz on this analog signal.

2.4.4. Gas Measurements

O2 and CO2 concentrations during the test were measured using a Metamax® 3B mobile gas analyzer (Cortex Biophysik GmbH, Leipzig, Germany). Breath-by-breath data on respiratory volume and gas concentrations were sent in real-time by telemetry to a PC. Metasoft® software (version 3.9.9 SR5) calculated ventilation rate ( V ̇ E), oxygen consumption ( V ̇ O2), carbon dioxide output ( V ̇ CO2), and synchronized all gas data with heart rate. The system ran for at least 30 min and was calibrated before each test in accordance with the manufacturer’s recommendations.
As the ergocycle used in this study could not receive any analog or digital signal, we used its pedaling signal, as well as the pedaling signal provided by the trigger, to synchronize the ergocycle’s data with the others (Figure 4).
Similarly, as the gas analyzer used in this study had no possible signal input, we used its ability to record heart rate to synchronize it with the electrodermal activity (EDA) device, which also provided a heart rate measurement.
In summary, Figure 5 shows the different devices and how they are synchronized with each other.

2.4.5. Determination of the V ̇ O2max Plateau

Following the recommendations of Niemeyer and colleagues in the major review of the oxygen uptake plateau as a “frequently misunderstood phenomenon” [5], we used fairly wide sampling intervals (i.e., the V ̇ O2pl was determined from more than the final 30 W or 60 s) and a cut-off that was set at approximately half the expected increase in V ̇ O2 in the submaximal intensity range. Additionally, as recommended by Poole and colleagues [14], we did not use the “so-called” secondary criteria as a maximal value of respiratory exchange ratio (RER) ≥ 1.1, maximum HR value (HRmax) greater than 95% of the maximum value predicted for age (220-age), and the end-exercise blood lactate criterion greater than 8.0 mmol/L, although we only checked that all subjects had achieved these at the end of the IET at the same time as we asked them for their RPE value. If subjects did not satisfy the V ̇ O2 criteria but satisfied the secondary ones, we considered the higher V ̇ O2 value was a V ̇ O2peak. The workload eliciting the RCP was determined using the criteria of an increase in both the VE/ V ̇ O2 and VE/ V ̇ O2 and a decrease in end-tidal carbon dioxide pressure (PetCO2) [56]. To determine RCP, the values of the gas-exchange variables were averaged for every 1 min period and plotted against workload. For statistical comparisons between groups (see below), RCP was expressed as the mean value of % V ̇ O2max for the corresponding 1 min interval. Two experienced independent observers detected RCP. In case of disagreement, we sought the opinion of a third investigator.

2.5. Signal Processing

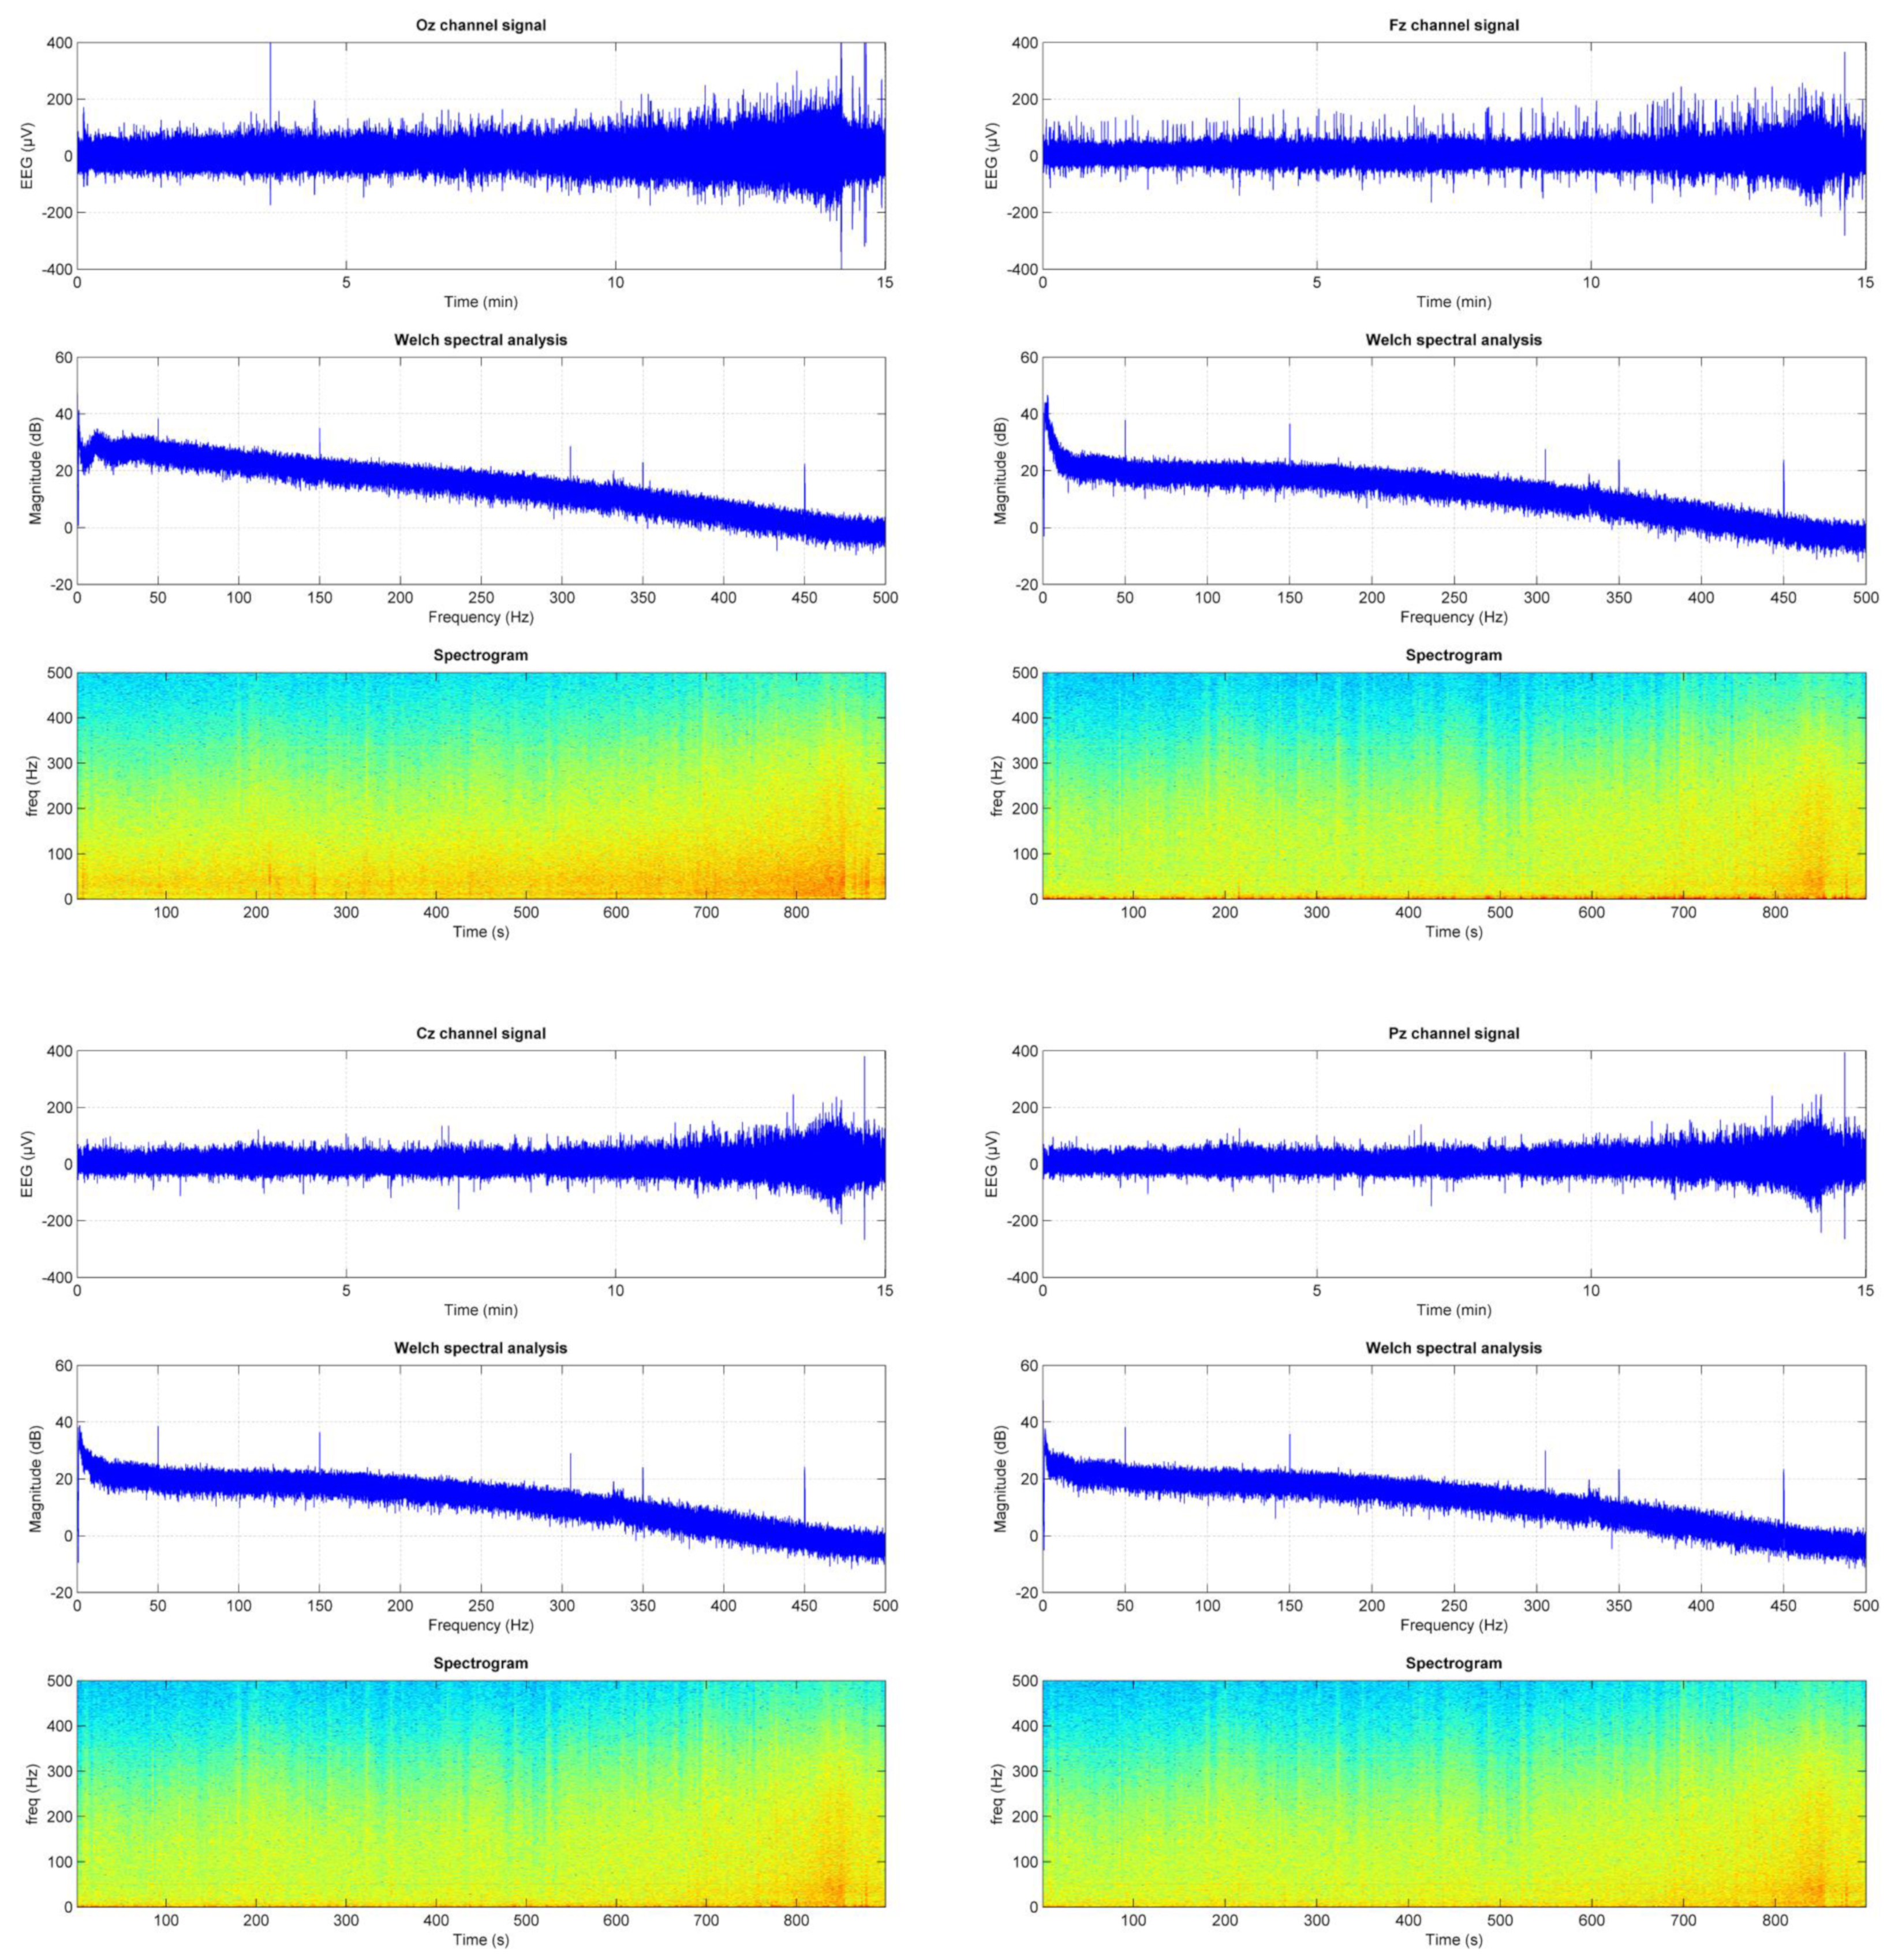
EEG: Data Reduction Procedures for Artifact Correction and Removal

We paid particular attention to preventing and/or limiting artifacts due to muscle contraction, eye, or body movement [57]. The use of active gel EEG electrodes was likely to overcome this problem thanks to an integrated noise subtraction circuit, thus improving the reliability of data collection [32]. We rejected abrupt variations in the signal by analyzing it using a 2 s time window. The resulting EEG signal shows a noise level (Figure 6) that:
  • Increases systematically towards the end of the recording and the highest effort.
  • Is higher on the occipital derivation, probably due to muscle contraction.
  • Is kept to an acceptable level (approximately 20 dB at 50 Hz).
It also shows the presence of residual artifacts. Eye blinks are visible in the temporal signal at the frontal site. Some artifacts are found in the lower frequency bands where EEG activity is expected to occur, but at an amplitude that does not generate signal saturation. These artifacts will present a challenge to subsequent EEG analysis, but can be subject to artifact rejection procedures. A specific artifact rejection method has been developed [58].

2.6. Statistics

A two-way ANOVA was used to analyze changes in the mean of a quantitative variable as a function of the levels of two categorical variables (END and NONEND, PLAT and NONPLAT). More specifically, we investigated the main effect A: the average difference in physiological and neurophysiological responses due to variations in the first independent variable, i.e., PLAT vs. NONPLAT factor, and for the main effect B: the average difference in the dependent variable due to variations in the second independent variable, i.e., the END vs. NONEND sports practice. We also examined the interaction effect in order to determine whether the effect of PLAT compared with NONPLAT depended on the level of the END vs. NONEND variable. In other words, we wanted to check whether the combined effect of both variables was different from what we expected on the basis of their individual effects. We therefore measured the impact of achieving V ̇ O2max NONPLAT and PLAT on the ratio of EEG power to V ̇ O2 profile during the IET for θ, α, β, α/β ratio, RPE, V ̇ O2max, HRmax, and RCP (% V ̇ O2max). We also proceeded in the same manner for the NONEND and END factors. To achieve this, we used a two-way ANOVA (XLSTAT 2023.2.0, Paris, France).
In addition, we used the Pearson product-moment correlation coefficient to measure the strength of the linear relationship between the EEG response (α, β, α/β ratio) and V ̇ O2. If the relationship between the variables is not linear, the correlation coefficient does not correctly represent the strength of the relationship between the variables. We have considered the value alpha < 0.05 for the significance level, i.e., the probability that you will make the mistake of rejecting the null hypothesis when it is true. If the p value is greater than alpha, you accept the null hypothesis. If it is less than alpha, you reject the null hypothesis.

3. Results

3.1. Occurrence of V ̇ O2pl in the Whole Group (n = 42)

All subjects completed the test. The results are presented in Table 2.
A V ̇ O2pl was observed in twenty-two subjects (52%) (Figure 7, example of a V ̇ O2pl), while the remaining twenty subjects achieved a V ̇ O2peak and met the secondary V ̇ O2max criterion. It should be noted that the RPE did not reach maximal values corresponding to very hard (17/20), since the average value for the whole group was only 16.8 ± 1.5 (Table 2). On the other hand, there was no difference between the NONPLAT and PLAT groups or NONEND and END groups (Table 3).

3.2. Difference in Physiological and Training Parameters between the NONPLAT and PLAT Groups or NONEND and END Ones

Table 3 reports the non-significant values of V ̇ O2max, training volume, height, final RPE, and fractional use of V ̇ O2max at the RCP. The only significant difference between plateau or endurance practice criteria was that the endurance group had a higher V ̇ O2max (p = 0.0002) and was older (p = 0.03). Training volume did not differ significantly between the groups.

3.3. EEG Responses vs. V ̇ O2 Increase, between the NONPLAT and PLAT Groups or NONEND and END Ones during the IET

In all subjects, we observed a decrease in the α/β ratio and an increase in theta and beta (presented as percentage of the start value in Table 4).
Figure 7 (and Table 5) shows an example of the EEG response during the IET in one subject (id 940) who was in the PLAT and NONEND groups. These EEG responses were the same for all subjects, with the exception of the alpha response, which exhibited some variability. Specifically, it increased in 27 of 42 subjects and decreased in the remaining 15. However, the frequency distribution of the alpha value tendency did not differ significantly from the expected frequencies (Table 6).
Nevertheless, although not significant, given the alpha threshold of 5% against which we compare p values (p = 0.07), fewer END subjects show a decrease in alpha power compared to the NONEND group. However, when we focused on the ratio of alpha power expressed as a percentage of the starting value to V ̇ O2 as a percentage of the starting value, it decreases in all subjects, indicating a “depletion” of alpha power compared to the metabolic demand, as was observed in all subjects for the other EEG power bands.
In addition, there was also no impact of the distribution of these different tendencies between groups for NONPLAT and PLAT subjects (Table 7) and the increase or decrease tendency of cadence, EEG θ/ V ̇ O2, EEG α/ V ̇ O2, EEG β/ V ̇ O2, and α/β ratio (Table 8).

4. Discussion

The main aim of this study was to compare the EEG responses during an incremental exercise test in two groups of subjects who had achieved a V ̇ O2pl or not.
The debate around the V ̇ O2pl and its cause remains a long story of exercise physiology for nearly half a century, and as Noakes [59] states, “it is time to move beyond a brainless exercise physiology”. We hypothesize that the difference between athletes who reached the plateau of their V ̇ O2max and those who did not could be present in different EEG characteristics and in EEG/ V ̇ O2 ratios. Our main results showed no incidence of the V ̇ O2pl or not, nor of endurance or non-endurance practice, on EEG activity during IET. Regardless of group, all subjects showed an increase in beta and theta band power, while alpha band power was less uniform (half increasing and half decreasing, independent of group membership).
However, when we plotted the EEG band power against oxygen power demand, both relative to the start value, all subjects showed a decrease in alpha, beta, and theta/ V ̇ O2 ratios during IET. Therefore, even if the brain is not the limiting factor of V ̇ O2max or responsible for the attainment of V ̇ O2pl or not, these results, given the relationship between EEG responses and oxygen demand, could constitute a new marker of a progressive “depletion” of EEG power capacity. Considering each of these elements, it may be recalled that at rest, alpha waves are generally more observed when a person is in a relaxed mental state [60]. During exercise, an increase in alpha activity may indicate increased attention or alertness, as the brain focuses on the task at hand [61]. However, an excessive reduction in alpha activity during exercise may reflect a large effort, yielding mental fatigue or decrease cognitive performance [62]. Beta waves are associated with active concentration, problem solving, and alertness [63]. During exercise, increased beta wave activity may reflect heightened cognitive engagement and concentration, particularly during tasks requiring attention and coordination [64,65]. Theta waves are linked to deep relaxation, meditation, and drowsiness [66]. During exercise, a decrease in theta wave activity can occur when a person is overexerted, which can lead to difficulties in maintaining precise sensorimotor control and monitoring sensory inputs due to reduced executive functions or decreased attention [67]. Overall, beyond EEG changes in the alpha, beta, and theta bands during exercise, the increases observed relative to that of V ̇ O2 highlight the importance of including central measures in our physical activity studies. This was the goal of this interdisciplinary approach using physiology, neurophysiology and biomechanics synchronizing all measurements during exercise performed at free cadence.
  • Difference in maximal value of V ̇ O2, heart rate, RPE, and training parameters between the NONPLAT and PLAT groups or NONEND and END ones.
The occurrence of V ̇ O2pl was not dependent on specialty and therefore on maximum V ̇ O2, given that, unsurprisingly, the END group had a higher V ̇ O2max than the NONEND group. Thus, given that the END and NONEND athletes were equally distributed in the NONPLAT and PLAT groups, we can consider that specialty does not influence the occurrence of V ̇ O2pl. Since this factor (specialty) also has no impact on RCP, we can assume that they did not have contract a significant oxygen deficit before reaching V ̇ O2max (with or without plateau).
  • The occurrence of V ̇ O2pl
The “plateau phenomenon”, described by Mitchell and Blomqvist in 1971 [68], was observed during 3 consecutive workloads. Before them, in 1955, Taylor and colleagues introduced a criterion for identifying a V ̇ O2pl during exercise [69]. This threshold was set at ≤150 mL/min (or ≤2.1 mL·min−1·kg−1) based on the average increase in subjects’ V ̇ O2 over incremental exercise increments. However, this method has been criticized [5,11]. Moreover, according to the positioning of eminent colleagues [4] on this issue, we did not consider the so-called “secondary” criteria (heart rate (HR) ≤10 beats/min or ≤5% of the maximum predicted by age (220-age), blood lactate concentration ≥8 mM, or respiratory exchange ratio (RER) >1.00, 1.10, or 1.15). Thus, when we obtain these criteria without an individual reaching a plateau, the “ V ̇ O2peak” referred to the highest V ̇ O2 reached during a graded exercise test, as has been done in most research on maximal exercise tests in children for whom there was some difficulty in demonstrating a V ̇ O2pl [70]. Thus, in this study, to compare the EEG response during IET as a function of the occurrence of a V ̇ O2pl, this was defined as less than half the expected increase. According to this definition, we observed a V ̇ O2pl occurrence in 52.6% of our subjects, in accordance with previous studies [4,5,9,11,18,19,71,72].
  • RPE response between the groups
Hill’s model emphasizes the concept of a “critical metabolic state” in which metabolite accumulation reaches a threshold level, triggering fatigue and necessitating a reduction in exercise intensity to avoid metabolic imbalance and potential damage to muscle tissue. In essence, Hill proposed that fatigue is a protective mechanism that prevents excessive muscular strain and maintains physiological homeostasis [1,73,74]. The central governor theory challenged (or we might say, achieved) Hill’s peripheral model of fatigue by emphasizing the role of the brain as a central regulator of exercise performance. The founders and protagonists of this “central governor theory” argue that while peripheral factors, such as muscle fatigue and metabolic stress, undoubtedly contribute to fatigue, the brain’s role in pacing and regulating exercise intensity is paramount [75,76]. They suggest that the brain integrates sensory feedback from the muscles, cardiovascular system, and other physiological systems to modulate exercise effort and prevent catastrophic failure [59,71]. Here, we used perceived exertion to measure the subjective experience of intensity, stress, discomfort, and/or fatigue during physical activity. The RPE scale, first introduced in 1970 and subsequently refined by Borg [77], remains the predominant tool for assessing perceived exertion in adults [78]. Some studies suggest an even stronger correlation between RPE and V ̇ O2 [79,80]. The widespread adoption of RPE to assess exercise intensity may be explained by the ability of human beings to perceive effort, which derives from continuous use of a well-developed sensory system. During exercise, individuals are aware of their overall effort and can discern the location of the effort, allowing them to gauge the intensity of the exercise and estimate their endurance at a given level [81,82]. The experience accumulated with different intensities of exercise enables individuals to numerically evaluate or at least classify the intensity of exercise via the RPE scale. Whatever the group (END or NONEND; PLAT or NONPLAT), the subjects rated their RPE just below 17/20, i.e., the beginning of what they perceived as “very hard”. We can therefore consider that the RPE does not play a role in the difference in potential EEG response during the IET. However, Samuele Marcora’s theory [75] postulates that the perception of effort during exercise may be independent of afferent feedback from the muscles, heart, and lungs. He argues that the prevailing notion attributing a substantial influence to afferent feedback on the perception of effort may result of an overly broad framework. Marcora emphasizes the role of hedonicity in overall perception and argues for a narrower definition of exertion, aligned with the descriptors of Borg’s RPE scale. He suggests that while sensory mechanisms may influence the perception of effort, experimental studies have dissociated the perception of effort from metabolic stress, indicating that the brain primarily generates the sensation of effort, with limited influence from afferent feedback.
  • EEG responses between the NONPLAT and PLAT groups or NONEND and END ones during the IET
Therefore, there is a consensus that an individual’s exercise performance is modulated by feedback from various physiological systems under the control of the brain. This is a different debate to that of the factors limiting V ̇ O2max and its definition and here, by examining the EEG response as a function of the occurrence of V ̇ O2pl, we showed that the EEG response was affected neither by plateau nor by sports specialty and hence, the value of V ̇ O2max. Independently of the occurrence of a V ̇ O2pl, we found an increase in theta and beta power, while alpha power decreased or increased. These results regarding the increase in beta and theta frequency band and alpha/beta ratio, are in accordance with those of previous studies [83]. In their examination on EEG during exercise, Hosang and colleagues observed a predominant increase in alpha and beta activity following high-intensity exercise compared to low or moderate intensity exercise sessions [83]. Previous studies have noted that heat stress induced by exhaustive exercise can increase cortical activity, which could explain the link between exercise intensity and changes in alpha, beta, and delta activity [84,85,86,87]. Another plausible explanation for the increase in beta activity, particularly in fronto–central regions, is its association with high levels of psychomotor arousal [84] and increased cortical activation during voluntary movements [88,89,90]. Increased theta activity has also been associated with the processing of novel information, suggesting that the theta results observed may be related to the control and regulation of attentional resources [91,92].
Emerging evidence suggests that the onset of fatigue leading to exercise cessation is associated with afferent feedback, a neural factor regulated and interpreted by the brain [93]. This feedback is linked to sensory information detecting unpleasant stimuli such as lactate accumulation in active muscles, fatigue of peripheral locomotor muscle or an increase in central temperature, leading to a cerebral response. Afferent information from the periphery is transmitted to the prefrontal cortex, where it is interpreted and influences the decision to stop exercise. EEG has been proposed as a practical, non-invasive approach to gathering valuable information about changes in brain activity during rest and exercise [34]. This study attempted to provide information on brain regulations to exhaustion as a function of their respective limiting factors [31,33,34]. In both cases, our multimodal device may allow fatigue to be monitored by several methods, to study the interactions between the central nervous system, the autonomic nervous system, and respiratory exchanges during acute exercise, which may provide information on exercise tolerance and regulation [25,26,49,50]. Here, we attempted a multimodal approach providing different indicators of cortical activity changes that were synchronized with autonomic nervous system, gas exchanges, heart rate and behavioral performance while controlling body movements during an IET and comparing the EEG/ V ̇ O2 profile according to the occurrence or non-occurrence of V ̇ O2pl.
  • Impact of the cadence on the EEG responses between the NONPLAT and PLAT groups or NONEND and END ones during the IET
As cadence has an impact on EEG and response during exercise [43,94,95], we allowed the participant to freely choose the pedaling frequency associated with a fixed power output. This should facilitate exercise, particularly when participants were not accustomed to pedaling on a cyclo-ergometer. In addition, changes in pedaling frequency can indicate the onset of fatigue or disengagement and can be objectively confirmed by physiological measures. Recording body movements should help to control the quality of EEG data by providing information that helps to distinguish the signal from movement noise. Thanks to the quality of the recordings, and even with a reduced number of electrodes (10 compared with the usual 20 to 64), a wide range of brain areas was covered. We were thus able to analyze the four frequency bands usually studied in sports science in the frontal, parietal and central regions of the brain: theta (4–8 Hz), alpha (8–12 Hz), beta (12–30 Hz), and low gamma (30–50 Hz) [31,33]. As Bailey and colleagues suggest, EEG activity from previous research is difficult to compare due to specific differences in exercise protocol and apparatus [31]. For example, the site-specific density of electrical activity in the motor cortex was found to increase with exercise intensity until exhaustion [32]. Previously reported changes in EEG response to exercise showed that EEG activity varied during incremental or constant load exercise tests across all bandwidths [31,33,34]. Furthermore, it has been found that alpha activity in the motor cortex is not fully activated and is maintained during exercise exhaustion [50]. In contrast, alpha activity in the frontal cortex decreases from the second ventilatory threshold until exhaustion [33]. The frontal cortex could therefore play a central role in the cessation of exercise because of the changes it undergoes during high levels of physical exertion [50]. The precise cause of the effects of high-intensity exercise on cortical activity is difficult to determine because of concomitant physiological responses such as elevated body temperature and increased blood flow, which may influence oscillatory activity [84,85]. Conversely, the effects of moderate-intensity exercise are less likely influenced by such factors because the increase in body temperature is not as pronounced [96]. The results of studies on moderate-intensity exercise have mainly revealed an increase in alpha and beta activity in different regions of the brain, which can be explained by the fact that alpha activity is linked to arousal [97] and beta activity plays a role in maintaining exercise at a steady state [98]. Analysis of the effects of low-intensity exercise on cortical activity has not revealed any significant trends, the most frequent observation being the absence of significant changes in the oscillatory bands, exception of the alpha band. The effects on alpha band activity vary, with some studies reporting an increase [32,99,100], others a decrease [101,102,103], and still others showing no change [104]. Like studies on moderate-intensity exercise, research on low-intensity exercise has focused mainly on the activity of the alpha band, limiting discussion of the other oscillatory bands.
  • Application of the EEG/ V ̇ O2 ratio approach in exercise physiology and medicine.
The application of the EEG/ V ̇ O2 ratio approach in exercise physiology and medicine offers a novel method for understanding the complex relationship between neural activity and metabolic demand during physical exertion. This innovative approach integrates EEG to monitor brain activity and oxygen consumption measurements to assess metabolic function, providing a comprehensive picture of how the brain and body respond to exercise. By analyzing the EEG/ V ̇ O2 ratio, researchers and clinicians can better understand the cognitive and neural mechanisms underlying physical performance, fatigue, and recovery. This method has significant implications for optimizing athletic training, as it makes it possible to identify the mental states that correlate with peak performance and periods of reduced efficiency. For example, understanding how brain activity changes at different V ̇ O2max levels can help to design more effective training regimes that improve both physical and cognitive endurance. Furthermore, in the medical field, the EEG/ V ̇ O2 ratio can be used to adapt rehabilitation programs for patients suffering from cardiovascular or neurological disorders, ensuring that both the cognitive and physical aspects of recovery are taken into account. This dual approach can improve patient outcomes by enhancing not only physical capacity, but also mental resilience and cognitive function. This approach also makes it possible to study the effects of environmental stress factors, such as high altitude, extreme temperatures, or hypoxic conditions, on brain function and overall performance. By monitoring how the brain adapts to these challenging conditions, it is possible to develop strategies to mitigate their adverse effects, thereby improving safety and performance in extreme environments. In this way, the EEG/ V ̇ O2 ratio represents a powerful tool for advancing our understanding of the dynamic interaction between the brain and body in both health and disease, paving the way for more integrated and effective approaches in exercise science and clinical practice.

5. Conclusions

In this study, we mainly demonstrated that, regardless of the occurrence of V ̇ O2pl, a decline was observed for all bandwidths according to the EEG/ V ̇ O2 decline throughout the test. Therefore, we suggest the existence of a “EEG reserve depletion” while alpha activity in motor cortex is preferentially maintained. The EEG responses to fatigue in this study can be associated with other variables to determine brain behavior during exercise, both before and at the end of exercise. Information on heart rate, ventilatory thresholds and maximum oxygen consumption associated with EEG data could emerge from this integrated data analysis. We hypothesized that overall EEG activity would change as fatigue developed throughout both exercise durations and might depend on the sport experience profile. In addition, we hypothesized that EEG analysis could provide a predictive index of exercise exhaustion.
Research into changes in cortical brain activity during an incremental exercise test has produced mixed results. For example, Bailey and colleagues reported increases in alpha and beta frequencies throughout an incremental exercise test [31], whereas Robertson and Marino [33] observed increases in these frequency bands only until RCP, after which EEG activity decrease until the end of exercise.
Therefore, in order to go further on the debate on the impact of exercise intensification on the EEG response, we proposed here to have a systemic approach to exercise limitation, especially applied to the concept of V ̇ O2max, by merging the fields of neuroscience, biomechanics, and physiology. This could open up the black box of the “central governor” that has been at the heart of the debates on factors limiting V ̇ O2max.
In conclusion, the combination of all the scientific fields in this study could help delineate the signature of exhaustive exercise. We might then be able to identify the evolution of multiple signals during exercise and potentially anticipate the decision to stop this exercise by looking for a minimum EEG/ V ̇ O2 threshold or a threshold for continuing exercise beyond a specific EEG/ V ̇ O2 threshold.

6. Limitations

This study was conducted using an “open-loop” control mode, since the power was imposed by the experimenters. Consequently, the movements were pre-programmed or predetermined without continuous feedback from the sensory inputs. In real performance conditions, such as running, the subject is in a closed-loop condition and the EEG response could also be used as a pace controller [48]. This closed-loop configuration is probably the most appropriate exercise model for understanding individual critical threshold [105] and subjective experiences of fatigue, such as in a marathon race [106], and for understanding the limits of exercise tolerance with an integrative model [107,108]. However, our experimental study is limited by the small sample size, which restricts the statistical power and may affect the reliability and generalizability of the results. A smaller sample size increases the risk of type II errors, where true effects may not be detected, and reduces confidence in effect sizes estimates. This limitation may also lead to greater variability and margin of error in the results, which could impact the robustness and reproducibility of our findings. Therefore, although our results provide valuable preliminary information, further research with larger and more diverse samples is essential to validate and extend these findings.

Author Contributions

Conceptualization, C.B., E.M., M.B. and J.M.; methodology, V.B., C.B., M.C., E.M., M.B., S.E., P.B., P.V.B., V.P., J.M., P.R., B.M. and C.C.; software, C.B., E.M., S.E., C.D., F.R. and A.B.; formal analysis, V.B., C.B., L.P., E.M. and J.M.; data curation, E.M. and T.C.; writing, V.B., C.B. and M.C.; review and editing, L.P.; project administration, C.B., M.B., S.E., L.F., V.P., J.M. and C.C.; funding acquisition, C.B., M.B. and J.M. All authors have read and agreed to the published version of the manuscript.

Funding

This study was conducted with the financial support of the French Defense Procurement Agency (DGA/AID) through a RAPID Project named MEEGAPERF, grant number 112906033.

Institutional Review Board Statement

This study was conducted in accordance with the Declaration of Helsinki, and approved by the Research and Ethics Committee of the Léon Bérard center under the ref A 13-160 number 2013-A00503-42 for studies involving humans.

Informed Consent Statement

Informed consent was obtained from all subjects involved in this study.

Data Availability Statement

The data presented in this study are available on request from the corresponding author. The data are not publicly available due to privacy.

Conflicts of Interest

The authors declare no conflicts of interest.

References

  1. Hill, A.V.; Lupton, H. Muscular Exercise, Lactic Acid, and the Supply and Utilization of Oxygen. QJM Int. J. Med. 1923, 16, 135–171. [Google Scholar] [CrossRef]
  2. Bassett, D.R., Jr.; Howley, E.T. Limiting factors for maximum oxygen uptake and determinants of endurance performance. Med. Sci. Sports Exerc. 2000, 32, 70–84. [Google Scholar] [CrossRef] [PubMed]
  3. Ross, R.; Blair, S.N.; Arena, R.; Church, T.S.; Despres, J.P.; Franklin, B.A.; Haskell, W.L.; Kaminsky, L.A.; Levine, B.D.; Lavie, C.J.; et al. Importance of Assessing Cardiorespiratory Fitness in Clinical Practice: A Case for Fitness as a Clinical Vital Sign: A Scientific Statement from the American Heart Association. Circulation 2016, 134, e653–e699. [Google Scholar] [CrossRef] [PubMed]
  4. Poole, D.C.; Jones, A.M. Measurement of the maximum oxygen uptake VO2max: Vo2peak is no longer acceptable. J. Appl. Physiol. 2017, 122, 997–1002. [Google Scholar] [CrossRef] [PubMed]
  5. Niemeyer, M.; Knaier, R.; Beneke, R. The Oxygen Uptake Plateau—A Critical Review of the Frequently Misunderstood Phenomenon. Sports Med. 2021, 51, 1815–1834. [Google Scholar] [CrossRef] [PubMed] [PubMed Central]
  6. Vella, C.A.; Marks, D.; Robergs, R.A. Oxygen cost of ventilation during incremental exercise to VO2 max. Respirology 2006, 11, 175–181. [Google Scholar] [CrossRef] [PubMed]
  7. Bassett, D.R., Jr. Scientific contributions of A. V. Hill: Exercise physiology pioneer. J. Appl. Physiol. 2002, 93, 1567–1582. [Google Scholar] [CrossRef] [PubMed]
  8. Astorino, T.A.; Willey, J.; Kinnahan, J.; Larsson, S.M.; Welch, H.; Dalleck, L.C.; Shephard, R.J. Elucidating determinants of the plateau in oxygen consumption at VO2max. Br. J. Sports Med. 2005, 39, 655–660. [Google Scholar] [CrossRef] [PubMed]
  9. Day, J.R.; Rossiter, H.B.; Coats, E.M.; Skasick, A.; Whipp, B.J. The maximally attainable Vo2during exercise in humans: The peak vs. maximum issue. J. Appl. Physiol. 2003, 95, 1901–1907. [Google Scholar] [CrossRef] [PubMed]
  10. Duncan, G.E.; Howley, E.T.; Johnson, B.N. Applicability of VO2max criteria: Discontinuous versus continuous protocols. Med. Sci. Sports Exerc. 1997, 29, 273–278. [Google Scholar] [CrossRef] [PubMed]
  11. Rossiter, H.B.; Kowalchuk, J.M.; Whipp, B.J. A test to establish maximum O2uptake despite no plateau in the O2uptake response to ramp incremental exercise. J. Appl. Physiol. 2006, 100, 764–770. [Google Scholar] [CrossRef] [PubMed]
  12. Astorino, T.A. Alterations in VO2max and the VO2 plateau with manipulation of sampling interval. Clin. Physiol. Funct. Imaging 2009, 29, 60–67. [Google Scholar] [CrossRef] [PubMed]
  13. Astorino, T.A.; White, A.C.; Dalleck, L.C. Supramaximal testing to confirm attainment of VO2max in sedentary men and women. Int. J. Sports Med. 2009, 30, 279–284. [Google Scholar] [CrossRef] [PubMed]
  14. Poole, D.C.; Wilkerson, D.P.; Jones, A.M. Validity of criteria for establishing maximal O2 uptake during ramp exercise tests. Eur. J. Appl. Physiol. 2008, 102, 403–410. [Google Scholar] [CrossRef] [PubMed]
  15. Doherty, M.; Nobbs, L.; Noakes, T.D. Low frequency of the “plateau phenomenon” during maximal exercise in elite British athletes. Eur. J. Appl. Physiol. 2003, 89, 619–623. [Google Scholar] [CrossRef] [PubMed]
  16. Green, S.; Askew, C.D. VO2peak is an acceptable estimate of cardiorespiratory fitness but not VO2max. J. Appl. Physiol. 2018, 125, 229–232. [Google Scholar] [CrossRef] [PubMed]
  17. Azevedo, P.; Bhammar, D.M.; Babb, T.G.; Bowen, T.S.; Witte, K.K.; Rossiter, H.B.; Brugniaux, J.V.; Perry, B.D.; Dantas de Lucas, R.; Turnes, T.; et al. Commentaries on Viewpoint: VO2peak is an acceptable estimate of cardiorespiratory fitness but not VO2max. J. Appl. Physiol. 2018, 125, 970. [Google Scholar] [CrossRef] [PubMed]
  18. Niemeyer, M.; Leithaeuser, R.; Beneke, R. Oxygen uptake plateau occurrence depends on oxygen kinetics and oxygen deficit accumulation. Scand. J. Med. Sci. Sports 2019, 29, 1466–1472. [Google Scholar] [CrossRef] [PubMed]
  19. Niemeyer, M.; Bergmann, T.G.J.; Beneke, R. Oxygen uptake plateau: Calculation artifact or physiological reality? Eur. J. Appl. Physiol. 2020, 120, 231–242. [Google Scholar] [CrossRef] [PubMed]
  20. Gordon, D.; Hopkins, S.; King, C.; Keiller, D.; Barnes, R.J. Incidence of the plateau at VO2max is dependent on the anaerobic capacity. Int. J. Sports Med. 2011, 32, 1–6. [Google Scholar] [CrossRef] [PubMed]
  21. Demarle, A.P.; Slawinski, J.J.; Laffite, L.P.; Bocquet, V.G.; Koralsztein, J.P.; Billat, V.L.; Cruz, R.S.d.O.; de Aguiar, R.A.; Turnes, T.; Pereira, K.L.; et al. Decrease of O2 deficit is a potential factor in increased time to exhaustion after specific endurance training. J. Appl. Physiol. 2001, 90, 947–953. [Google Scholar] [CrossRef] [PubMed]
  22. Esteve-Lanao, J.; Lucia, A.; Dekoning, J.J.; Foster, C. How Do Humans Control Physiological Strain during Strenuous Endurance Exercise? PLoS ONE 2008, 3, e2943. [Google Scholar] [CrossRef] [PubMed] [PubMed Central]
  23. Marcora, S.M. Do we really need a central governor to explain brain regulation of exercise performance? Eur. J. Appl. Physiol. 2008, 104, 929–931. [Google Scholar] [CrossRef] [PubMed]
  24. Tucker, R.; Noakes, T.D. The physiological regulation of pacing strategy during exercise: A critical review. Br. J. Sports Med. 2009, 43, e1. [Google Scholar] [CrossRef] [PubMed]
  25. Weir, J.P.; Beck, T.W.; Cramer, J.T.; Housh, T.J. Is fatigue all in your head? A critical review of the central governor model. Br. J. Sports Med. 2006, 40, 573–586. [Google Scholar] [CrossRef] [PubMed] [PubMed Central]
  26. Noakes, T.D. Fatigue is a Brain-Derived Emotion that Regulates the Exercise Behavior to Ensure the Protection of Whole Body Homeostasis. Front. Physiol. 2012, 3, 82. [Google Scholar] [CrossRef] [PubMed] [PubMed Central]
  27. Ganesan, G.; Leu, S.-Y.; Cerussi, A.; Tromberg, B.; Cooper, D.M.; Galassetti, P. Cerebral and Muscle Tissue Oxygenation During Incremental Cycling in Male Adolescents Measured by Time-Resolved Near-Infrared Spectroscopy. Pediatr. Exerc. Sci. 2016, 28, 275–285. [Google Scholar] [CrossRef] [PubMed] [PubMed Central]
  28. Jung, R.; Moser, M.; Baucsek, S.; Dern, S.; Schneider, S. Activation patterns of different brain areas during incremental exercise measured by near-infrared spectroscopy. Exp. Brain Res. 2015, 233, 1175–1180. [Google Scholar] [CrossRef] [PubMed]
  29. Racinais, S.; Buchheit, M.; Girard, O. Breakpoints in ventilation, cerebral and muscle oxygenation, and muscle activity during an incremental cycling exercise. Front. Physiol. 2014, 5, 142. [Google Scholar] [CrossRef] [PubMed] [PubMed Central]
  30. Rooks, C.R.; Thom, N.J.; McCully, K.K.; Dishman, R.K. Effects of incremental exercise on cerebral oxygenation measured by near-infrared spectroscopy: A systematic review. Prog. Neurobiol. 2010, 92, 134–150. [Google Scholar] [CrossRef] [PubMed]
  31. Bailey, S.P.; E Hall, E.; E Folger, S.; Miller, P.C. Changes in EEG during graded exercise on a recumbent cycle ergometer. J. Sports Sci. Med. 2008, 7, 505–511. [Google Scholar] [PubMed]
  32. Brümmer, V.; Schneider, S.; Strüder, H.; Askew, C. Primary motor cortex activity is elevated with incremental exercise intensity. Neuroscience 2011, 181, 150–162. [Google Scholar] [CrossRef] [PubMed]
  33. Robertson, C.V.; Marino, F.E. Prefrontal and motor cortex EEG responses and their relationship to ventilatory thresholds during exhaustive incremental exercise. Eur. J. Appl. Physiol. 2015, 115, 1939–1948. [Google Scholar] [CrossRef] [PubMed]
  34. Enders, H.; Nigg, B.M. Measuring human locomotor control using EMG and EEG: Current knowledge, limitations and future considerations. Eur. J. Sport Sci. 2016, 16, 416–426. [Google Scholar] [CrossRef] [PubMed]
  35. Thompson, T.; Steffert, T.; Ros, T.; Leach, J.; Gruzelier, J. EEG applications for sport and performance. Methods 2008, 45, 279–288. [Google Scholar] [CrossRef] [PubMed]
  36. Park, J.L.; Fairweather, M.M.; Donaldson, D.I. Making the case for mobile cognition: EEG and sports performance. Neurosci. Biobehav. Rev. 2015, 52, 117–130. [Google Scholar] [CrossRef] [PubMed]
  37. Klimesch, W.; Doppelmayr, M.; Schimke, H.; Pachinger, T. Alpha frequency, reaction time, and the speed of processing information. J. Clin. Neurophysiol. 1996, 13, 511–518. [Google Scholar] [CrossRef] [PubMed]
  38. Samaha, J.; Bauer, P.; Cimaroli, S.; Postle, B.R. Top-down control of the phase of alpha-band oscillations as a mechanism for temporal prediction. Proc. Natl. Acad. Sci. USA 2015, 112, 8439–8444. [Google Scholar] [CrossRef] [PubMed] [PubMed Central]
  39. De, A.; Mondal, S. Yoga and Brain Wave Coherence: A Systematic Review for Brain Function Improvement. Heart. Mind 2020, 4, 33–39. [Google Scholar] [CrossRef]
  40. Kropotov, J.D. Beta and gamma rhythms. In Functional Neuromarkers for Psychiatry: Applications for Diagnosis and Treatment; Academic Press: Cambridge, MA, USA, 2016; pp. 107–119. [Google Scholar] [CrossRef]
  41. Abhang, P.A.; Gawali, B.W.; Mehrotra, S.C. Introduction to EEG- and Speech-Based Emotion Recognition; Elsevier: Amsterdam, The Netherlands, 2016. [Google Scholar]
  42. Hilty, L.; Langer, N.; Pascual-Marqui, R.; Boutellier, U.; Lutz, K. Fatigue-induced increase in intracortical communication between mid/anterior insular and motor cortex during cycling exercise. Eur. J. Neurosci. 2011, 34, 2035–2042. [Google Scholar] [CrossRef] [PubMed]
  43. Ludyga, S.; Gronwald, T.; Hottenrott, K. Effects of high vs. low cadence training on cyclists’ brain cortical activity during exercise. J. Sci. Med. Sport 2016, 19, 342–347. [Google Scholar] [CrossRef] [PubMed]
  44. Pontifex, M.B.; Hillman, C.H. Neuroelectric and behavioral indices of interference control during acute cycling. Clin. Neurophysiol. 2007, 118, 570–580. [Google Scholar] [CrossRef] [PubMed]
  45. Schneider, S.; Rouffet, D.M.; Billaut, F.; Strüder, H.K. Cortical current density oscillations in the motor cortex are correlated with muscular activity during pedaling exercise. Neuroscience 2013, 228, 309–314. [Google Scholar] [CrossRef] [PubMed]
  46. Brümmer, V.; Schneider, S.; Abel, T.; Vogt, T.; Strüder, H.K. Brain cortical activity is influenced by exercise mode and intensity. Med. Sci. Sports Exerc. 2011, 43, 1863–1872. [Google Scholar] [CrossRef] [PubMed]
  47. Mechau, D.; Liesen, H.; Mücke, S.; Weiß, M. Effect of increasing running velocity on electroencephalogram in a field test. Eur. J. Appl. Physiol. 1998, 78, 340–345. [Google Scholar] [CrossRef] [PubMed]
  48. Dykstra, R.M.; Hanson, N.J.; Miller, M.G. Brain activity during self-paced vs. fixed protocols in graded exercise testing. Exp. Brain Res. 2019, 237, 3273–3279. [Google Scholar] [CrossRef] [PubMed]
  49. Robertson, C.V.; Marino, F.E. A role for the prefrontal cortex in exercise tolerance and termination. J. Appl. Physiol. 2016, 120, 464–466. [Google Scholar] [CrossRef] [PubMed]
  50. Robertson, C.V.; Marino, F.E. Last Word on Viewpoint: A role for the prefrontal cortex in exercise tolerance and termination. J. Appl. Physiol. 2016, 120, 470. [Google Scholar] [CrossRef] [PubMed]
  51. Borg, G.A. Psychophysical bases of perceived exertion. Med. Sci. Sports Exerc. 1982, 14, 377–381. [Google Scholar] [CrossRef] [PubMed]
  52. Maby, E. Practical Guide to Performing an EEG Experiment. In Brain–Computer Interfaces 2: Technology and Applications; Clerc, M., Bougrain, L., Lotte, F., Eds.; John Wiley & Sons, Inc.: Hoboken, NJ, USA, 2016; pp. 163–177. [Google Scholar]
  53. Boucsein, W.; Fowles, D.C.; Grimnes, S.; Ben-Shakhar, G.; Roth, W.T.; Dawson, M.E.; Filion, D.L. Society for Psychophysiological Research Ad Hoc Committee on Electrodermal Measures Publication recommendations for electrodermal measurements. Psychophysiology 2012, 49, 1017–1034. [Google Scholar] [CrossRef] [PubMed]
  54. Fowles, D.C.; Christie, M.J.; Edelberg, R.; Grings, W.W.; Lykken, D.T.; Venables, P.H. Committee report. Publication recommendations for electrodermal measurements. Psychophysiology 1981, 18, 232–239. [Google Scholar] [CrossRef] [PubMed]
  55. Borg, G.; Hassmén, P.; Lagerström, M. Perceived exertion related to heart rate and blood lactate during arm and leg exercise. Eur. J. Appl. Physiol. Occup. Physiol. 1987, 56, 679–685. [Google Scholar] [CrossRef] [PubMed]
  56. Midgley, A.W.; McNaughton, L.R.; Carroll, S. Time at VO2max during intermittent treadmill running: Test protocol dependent or methodological artefact? Int. J. Sports Med. 2007, 28, 934–939. [Google Scholar] [CrossRef] [PubMed]
  57. Pontifex, M.B.; Hillman, C.H. Neuroelectric measurement of cognition during aerobic exercise. Methods 2008, 45, 271–278. [Google Scholar] [CrossRef] [PubMed]
  58. Damon, C.; Liutkus, A.; Gramfort, A.; Essid, S. Non-negative Tensor Factorization for single-channel EEG artifact rejection. In Proceedings of the 2013 IEEE International Workshop on Machine Learning for Signal Processing (MLSP), Southampton, UK, 22–25 September 2013; pp. 1–6. [Google Scholar]
  59. Noakes, T.D. Time to move beyond a brainless exercise physiology: The evidence for complex regulation of human exercise performance. Appl. Physiol. Nutr. Metab. 2011, 36, 23–35. [Google Scholar] [CrossRef] [PubMed]
  60. Desai, R.; Tailor, A.; Bhatt, T. Effects of yoga on brain waves and structural activation: A review. Complement. Ther. Clin. Pract. 2015, 21, 112–118. [Google Scholar] [CrossRef] [PubMed]
  61. Klimesch, W.; Schimke, H.; Pfurtscheller, G. Alpha frequency, cognitive load and memory performance. Brain Topogr. 1993, 5, 241–251. [Google Scholar] [CrossRef] [PubMed]
  62. Klimesch, W. EEG-alpha rhythms and memory processes. Int. J. Psychophysiol. 1997, 26, 319–340. [Google Scholar] [CrossRef] [PubMed]
  63. Neuper, C.; Pfurtscheller, G. Event-related dynamics of cortical rhythms: Frequency-specific features and functional correlates. Int. J. Psychophysiol. 2001, 43, 41–58. [Google Scholar] [CrossRef] [PubMed]
  64. Sauseng, P.; Klimesch, W. What does phase information of oscillatory brain activity tell us about cognitive processes? Neurosci. Biobehav. Rev. 2008, 32, 1001–1013. [Google Scholar] [CrossRef] [PubMed]
  65. Gola, M.; Magnuski, M.; Szumska, I.; Wróbel, A. EEG beta band activity is related to attention and attentional deficits in the visual performance of elderly subjects. Int. J. Psychophysiol. 2013, 89, 334–341. [Google Scholar] [CrossRef] [PubMed]
  66. Sowndhararajan, K.; Kim, S. Influence of Fragrances on Human Psychophysiological Activity: With Special Reference to Human Electroencephalographic Response. Sci. Pharm. 2016, 84, 724–751. [Google Scholar] [CrossRef] [PubMed] [PubMed Central]
  67. Baumeister, J.; Reinecke, K.; Schubert, M.; Schade, J.; Weiss, M. Effects of induced fatigue on brain activity during sensorimotor control. Eur. J. Appl. Physiol. 2012, 112, 2475–2482. [Google Scholar] [CrossRef] [PubMed]
  68. Mitchell, J.H.; Blomqvist, G. Maximal Oxygen Uptake. N. Engl. J. Med. 1971, 284, 1018–1022. [Google Scholar] [CrossRef] [PubMed]
  69. Taylor, H.L.; Buskirk, E.; Henschel, A.; Poole, D.C.; Jones, A.M.; Périard, J.D.; Racinais, S.; Joyner, M.J.; Casey, D.P.; Tipton, C.M.; et al. Maximal Oxygen Intake as an Objective Measure of Cardio-Respiratory Performance. J. Appl. Physiol. 1955, 8, 73–80. [Google Scholar] [CrossRef] [PubMed]
  70. Eisenmann, J.C.; Malina, R.M. Secular trend in peak oxygen consumption among United States youth in the 20th century. Am. J. Hum. Biol. 2002, 14, 699–706. [Google Scholar] [CrossRef] [PubMed]
  71. Noakes, T.D.; St Clair Gibson, A. Logical limitations to the “catastrophe” models of fatigue during exercise in humans. Br. J. Sports Med. 2004, 38, 648–649. [Google Scholar] [CrossRef] [PubMed] [PubMed Central]
  72. Lacour, J.-R.; Messonnier, L.; Bourdin, M. The leveling-off of oxygen uptake is related to blood lactate accumulation. Retrospective study of 94 elite rowers. Eur. J. Appl. Physiol. 2007, 101, 241–247. [Google Scholar] [CrossRef] [PubMed]
  73. Noakes, T.D. Maximal oxygen uptake: “classical” versus “contemporary” viewpoints: A rebuttal. Med. Sci. Sports Exerc. 1998, 30, 1381–1398. [Google Scholar] [CrossRef] [PubMed]
  74. Bassett, D.R., Jr.; Howley, E.T. Maximal oxygen uptake: “classical” versus “contemporary” viewpoints. Med. Sci. Sports Exerc. 1997, 29, 591–603. [Google Scholar] [CrossRef] [PubMed]
  75. Marcora, S. Perception of effort during exercise is independent of afferent feedback from skeletal muscles, heart, and lungs. J. Appl. Physiol. 2009, 106, 2060–2062. [Google Scholar] [CrossRef] [PubMed]
  76. Noakes, T.D.; Marino, F.E. Does a central governor regulate maximal exercise during combined arm and leg exercise? A rebuttal. Eur. J. Appl. Physiol. 2008, 104, 757–759. [Google Scholar] [CrossRef] [PubMed]
  77. Borg, G. Perceived exertion as an indicator of somatic stress. Scand J. Rehabil. Med. 1970, 2, 92–98. [Google Scholar] [CrossRef] [PubMed]
  78. Borg, G. Borg’s Perceived Exertion and Pain Scales; Human Kinetics: Champaign, IL, USA, 1998; p. 104. [Google Scholar]
  79. Chen, M.J.; Fan, X.; Moe, S.T. Criterion-related validity of the Borg ratings of perceived exertion scale in healthy individuals: A meta-analysis. J. Sports Sci. 2002, 20, 873–899. [Google Scholar] [CrossRef] [PubMed]
  80. Coquart, J.B.; Legrand, R.; Robin, S.; Duhamel, A.; Matran, R.; Garcin, M. Influence of successive bouts of fatiguing exercise on perceptual and physiological markers during an incremental exercise test. Psychophysiology 2009, 46, 209–216. [Google Scholar] [CrossRef] [PubMed]
  81. Eston, R.G.; Davies, B.L.; Williams, J.G. Use of perceived effort ratings to control exercise intensity in young healthy adults. Eur. J. Appl. Physiol. 1987, 56, 222–224. [Google Scholar] [CrossRef] [PubMed]
  82. Eston, R.G.; Faulkner, J.A.; Mason, E.A.; Parfitt, G. The validity of predicting maximal oxygen uptake from perceptually regulated graded exercise tests of different durations. Eur. J. Appl. Physiol. 2006, 97, 535–541. [Google Scholar] [CrossRef] [PubMed]
  83. Hosang, L.; Mouchlianitis, E.; Guérin, S.M.R.; Karageorghis, C.I. Effects of exercise on electroencephalography-recorded neural oscillations: A systematic review. Int. Rev. Sport Exerc. Psychol. 2022, 1–54. [Google Scholar] [CrossRef]
  84. Nielsen, B.; Nybo, L. Cerebral changes during exercise in the heat. Sports Med. 2003, 33, 1–11. [Google Scholar] [CrossRef] [PubMed]
  85. Nybo, L.; Nielsen, B.; Sato, K.; Oue, A.; Yoneya, M.; Sadamoto, T.; Ogoh, S.; De Pauw, K.; Roelands, B.; Marušič, U.; et al. Perceived exertion is associated with an altered brain activity during exercise with progressive hyperthermia. J. Appl. Physiol. 2001, 91, 2017–2023. [Google Scholar] [CrossRef] [PubMed]
  86. Nakata, H.; Oshiro, M.; Namba, M.; Shibasaki, M. Effects of aerobic exercise under different thermal conditions on human somatosensory processing. Am. J. Physiol. Regul. Integr. Comp. Physiol. 2016, 311, R629–R636. [Google Scholar] [CrossRef] [PubMed]
  87. Shibasaki, M.; Namba, M.; Oshiro, M.; Kakigi, R.; Nakata, H. Suppression of cognitive function in hyperthermia; From the viewpoint of executive and inhibitive cognitive processing. Sci. Rep. 2017, 7, srep43528. [Google Scholar] [CrossRef] [PubMed] [PubMed Central]
  88. Pogosyan, A.; Gaynor, L.D.; Eusebio, A.; Brown, P. Boosting cortical activity at Beta-band frequencies slows movement in humans. Curr. Biol. 2009, 19, 1637–1641. [Google Scholar] [CrossRef] [PubMed] [PubMed Central]
  89. Chung, J.W.; Ofori, E.; Misra, G.; Hess, C.W.; Vaillancourt, D.E. Beta-band activity and connectivity in sensorimotor and parietal cortex are important for accurate motor performance. NeuroImage 2017, 144, 164–173. [Google Scholar] [CrossRef] [PubMed] [PubMed Central]
  90. Jenkinson, N.; Brown, P. New insights into the relationship between dopamine, beta oscillations and motor function. Trends Neurosci. 2011, 34, 611–618. [Google Scholar] [CrossRef] [PubMed]
  91. Demiralp, T.; Ademoglu, A.; Istefanopulos, Y.; Başar-Eroglu, C.; Başar, E. Wavelet analysis of oddball P300. Int. J. Psychophysiol. 2001, 39, 221–227. [Google Scholar] [CrossRef] [PubMed]
  92. Pesonen, M.; Hämäläinen, H.; Krause, C.M. Brain oscillatory 4–30 Hz responses during a visual n-back memory task with varying memory load. Brain Res. 2007, 1138, 171–177. [Google Scholar] [CrossRef] [PubMed]
  93. Taylor, J.L.; Amann, M.; Duchateau, J.; Meeusen, R.; Rice, C.L. Neural Contributions to Muscle Fatigue: From the Brain to the Muscle and Back Again. Med. Sci. Sports Exerc. 2016, 48, 2294–2306. [Google Scholar] [CrossRef] [PubMed] [PubMed Central]
  94. Hottenrott, K.; Taubert, M.; Gronwald, T. Cortical Brain Activity is Influenced by Cadence in Cyclists. Open Sports Sci. J. 2013, 6, 9–14. [Google Scholar] [CrossRef]
  95. Ludyga, S.; Hottenrott, K.; Gronwald, T. Four weeks of high cadence training alter brain cortical activity in cyclists. J. Sports Sci. 2017, 35, 1–6. [Google Scholar] [CrossRef] [PubMed]
  96. Takeda, R.; Okazaki, K. Body Temperature Regulation During Exercise and Hyperthermia in Diabetics. In Diabetes and Its Complications; IntechOpen: London, UK, 2018; pp. 88–109. [Google Scholar] [CrossRef]
  97. Cantero, J.L.; Atienza, M.; Salas, R.M. Human alpha oscillations in wakefulness, drowsiness period, and REM sleep: Different electroencephalographic phenomena within the alpha band. Neurophysiol. Clin. 2002, 32, 54–71. [Google Scholar] [CrossRef] [PubMed]
  98. Plattner, K.; Lambert, M.I.; Tam, N.; Lamberts, R.P.; Baumeister, J. Changes in cortical beta activity related to a biceps brachii movement task while experiencing exercise induced muscle damage. Physiol. Behav. 2014, 123, 1–10. [Google Scholar] [CrossRef] [PubMed]
  99. Büchel, D.; Sandbakk, Ø.; Baumeister, J. Exploring intensity-dependent modulations in EEG resting-state network efficiency induced by exercise. Eur. J. Appl. Physiol. 2021, 121, 2423–2435. [Google Scholar] [CrossRef] [PubMed] [PubMed Central]
  100. Chaire, A.; Becke, A.; Düzel, E. Effects of Physical Exercise on Working Memory and Attention-Related Neural Oscillations. Front. Neurosci. 2020, 14, 239. [Google Scholar] [CrossRef] [PubMed] [PubMed Central]
  101. Kao, S.-C.; Wang, C.-H.; Hillman, C.H. Acute effects of aerobic exercise on response variability and neuroelectric indices during a serial n-back task. Brain Cogn. 2020, 138, 105508. [Google Scholar] [CrossRef] [PubMed]
  102. Kubitz, K.A.; Mott, A.A. EEG power spectral densities during and after cycle ergometer exercise. Res. Q. Exerc. Sport 1996, 67, 91–96. [Google Scholar] [CrossRef] [PubMed]
  103. Mierau, A.; Schneider, S.; Abel, T.; Askew, C.; Werner, S.; Strüder, H.K. Improved sensorimotor adaptation after exhaustive exercise is accompanied by altered brain activity. Physiol. Behav. 2009, 96, 115–121. [Google Scholar] [CrossRef] [PubMed]
  104. Gutmann, B.; Zimmer, P.; Hülsdünker, T.; Lefebvre, J.; Binnebößel, S.; Oberste, M.; Bloch, W.; Strüder, H.; Mierau, A. The effects of exercise intensity and post-exercise recovery time on cortical activation as revealed by EEG alpha peak frequency. Neurosci. Lett. 2018, 668, 159–163. [Google Scholar] [CrossRef] [PubMed]
  105. Amann, M. Central and peripheral fatigue: Interaction during cycling exercise in humans. Med. Sci. Sports Exerc. 2011, 43, 2039–2045. [Google Scholar] [CrossRef] [PubMed]
  106. Doherty, C.; Keogh, A.; Davenport, J.; Lawlor, A.; Smyth, B.; Caulfield, B. An evaluation of the training determinants of marathon performance: A meta-analysis with meta-regression. J. Sci. Med. Sport 2020, 23, 182–188. [Google Scholar] [CrossRef] [PubMed]
  107. Marcora, S.M.; Staiano, W. The limit to exercise tolerance in humans: Mind over muscle? Eur. J. Appl. Physiol. 2010, 109, 763–770. [Google Scholar] [CrossRef] [PubMed]
  108. Meyniel, F.; Sergent, C.; Rigoux, L.; Daunizeau, J.; Pessiglione, M. Neurocomputational account of how the human brain decides when to have a break. Proc. Natl. Acad. Sci. USA 2013, 110, 2641–2646. [Google Scholar] [CrossRef] [PubMed] [PubMed Central]
Figure 1. Summary of experimental session. The session began with a brief EEG calibration, followed by an 8 min warm-up. After a 5 min recovery period, the IET was performed until exhaustion. RPE test was then performed during the next 5 min of recovery, before the final EEG calibration procedure. EEG: electroencephalogram, IET: incremental exercise test, and RPE: rate of perceived exertion.
Applsci 14 05411 g001
Figure 2. Positioning of sensors and participants on the ergocycle.
Applsci 14 05411 g002
Figure 3. EEG calibration procedure. The whole procedure takes approximately 2′30″. After 30 s of open eyes followed by 30 s of closed eyes, the procedure requires 15 s of blink eyes and 15 s of eyes movement before 2 sets of 12.5 s of demanding head movements.
Applsci 14 05411 g003
Figure 4. Magnet attached to the pedal and Hall-effect sensor attached to the ergocycle frame.
Applsci 14 05411 g004
Figure 5. Device and data synchronization strategies (hardware and software). EEG: electroencephalogram, EDA: electrodermal activity, and V ̇ O2: oxygen consumption.
Applsci 14 05411 g005
Figure 6. Typical raw traces obtained during the incremental exercise test for Oz, Fz, Cz and Pz channel signals with the raw signal, Welch spectral analysis and spectrogram for each channel. In the spectrogram, cooler colors (blue and green) represent low power and warmer colors (white, red and yellow) represent high power. EEG: electroencephalogram; freq: frequency.
Applsci 14 05411 g006
Figure 7. Linear regression of various physiological parameters by time for the subject 940 reaching a V ̇ O2pl. Subfigures include V ̇ O2, theta power, alpha power, beta power, alpha/beta power ratio, alpha/ V ̇ O2 as a percentage of starting alpha/ V ̇ O2 power, beta/ V ̇ O2 as a percentage of starting beta/ V ̇ O2 power, and theta/ V ̇ O2 power as a percentage of starting theta/ V ̇ O2 power. PSD: power spectral density.
Applsci 14 05411 g007
Table 1. Subjects’ characteristics for the incremental exercise test (n = 42).
SubjectsMeanStandard Deviation (SD)
Age (years)25.814.92
Height (cm)180.556.78
Weight (kg)73.9010.71
Body mass index (kg/m2)22.592.27
V ̇ O2max (mL·min−1·kg−1)55.747.51
Table 2. Physiological, mechanical and RPE results for the IET.
VariableMeanSDRange
V ̇ O2max (mL·min−1·kg−1)55.747.5140.0
Maximal Aerobic Power (W)273.7842.49180.0
Relative Maximal Aerobic Power (W/kg)3.740.673.4
HRmax (bpm)188.529.8345.0
Time (s)967.44162.52713.0
RPE16.791.505.0
SD: standard deviation, RPE: rating of perceived exertion, and V ̇ O2max: maximal oxygen consumption.
Table 3. Effects of NONPLAT or PLAT and NONEND or END groups on characteristics and physiological variables.
n V ̇ O2max
(mL·min−1·kg−1)
Age
(Years)
Height
(cm)
Training/Week
(Hour)
Final RPERCP
( % V ̇ O2max)
NONENDn = 2251.77 ± 6.4124.23 ± 4.34181.95 ± 8.006.95 ± 4.7416.55 ± 1.7273.97 ± 11.89
ENDn = 2060.10 ± 6.1627.55 ± 5.04179.00 ± 4.878.05 ± 4.7517.08 ± 3.9977.02 ± 7.52
F value −4.10−2.251.08−0.91−1.04−0.557
p value <0.0010.030.2850.3680.3050.581
NONPLATn = 2055.00 ± 5.6425.85 ± 5.17181.75 ± 6.848.15 ± 5.8216.66 ± 4.0273.88 ± 11.08
PLATn = 2256.41 ± 8.9625.77 ± 4.81179.45 ± 6.706.86 ± 3.4516.91 ± 1.4776.82 ± 9.05
F value 0.3530.6840.6651.149−0.271−1.11
p value 0.720.4980.5100.2580.7880.273
Values in bold indicate a statistically significant p-value (α = 0.05). RCP: respiratory compensation threshold, RPE: rating of perceived exertion, V ̇ O2max: maximal oxygen consumption, NONEND: non-endurance group, and END: endurance group.
Table 4. Effects of NONPLAT or PLAT and NONEND or END groups on EEG variables. Theta and beta values are expressed as a percentage of the starting value of the IET.
Alpha/Beta RatioTheta Increase (%start)Beta Increase (%start)
NONENDn = 22−20.30 ± 12.9320.39 ± 16.4340.06 ± 19.97
ENDn = 20−15.74 ± 11.9320.24 ± 16.4347.00 ± 16.14
F value 1.360.011.33
p value 0.2500.9070.256
NONPLATn = 20−18.58 ± 12.7118.29 ± 13.3144.26 ± 18.59
PLATn = 22−17.93 ± 12.6722.25 ± 18.6542.34 ± 18.93
F value <0.0010.740.08
p value 0.9880.3950.778
NONEND: non-endurance group; END: endurance group.
Table 5. Summary table of analysis of variance for V ̇ O2, theta power, alpha power, beta power, alpha power/beta power ratio, alpha/ V ̇ O2 as a percentage of initial alpha/ V ̇ O2 power, beta/ V ̇ O2 as a percentage of initial beta/ V ̇ O2 power, and theta/ V ̇ O2 power as a percentage of initial theta/ V ̇ O2 power.
V ̇ O2Alpha PSDBeta PSDTheta PSDAlpha/Beta Ratio Alpha / V ̇ O2 Beta / V ̇ O2 Theta / V ̇ O2
R20.9670.0370.3630.0610.0310.0960.1730.170
F25,011.716.0238.127.013.142.785.684.0
Pr > F<0.001<0.001<0.001<0.001<0.001<0.001<0.001<0.001
PSD: power spectral density; V ̇ O2: maximal oxygen consumption.
Table 6. Frequency distribution of alpha value trend in subjects.
Positive Alpha TendencyNegative Alpha Tendencyp Value
NONEND12100.07
END155
NOPLAT1460.75
PLAT1210
NONEND: non-endurance group, END: endurance group, NOPLAT: non-plateau group, and PLAT: plateau group.
Table 7. Effects of NONPLAT or PLAT and NONEND or END groups on alpha power expressed as a percentage of alpha power at the start of the IET.
Chi-Square
(Observed Value)
Chi-Square
(Critical Value)
DFp ValueAlpha
3.6637.81530.3000.05
Table 8. Chi-square test for cadence, EEG β/ V ̇ O2, EEG θ/ V ̇ O2, EEG α/ V ̇ O2 and α/β ratio between the NONPLAT (n = 22) and PLAT (n = 20) groups.
Cadence EEG   θ / V ̇ O2 EEG   α / V ̇ O2 EEG   β / V ̇ O2α/β RatioAll
Chi-square
(Observed value)
0.0050.2250.4310.5580.2887.61
Chi-square
(Critical value)
3.843.853.863.843.8716.9
p value0.9450.6360.5120.4550.5910.57
EEG: electroencephalogram, α: alpha frequency band, β: beta frequency band, and θ: theta frequency band.
Disclaimer/Publisher’s Note: The statements, opinions and data contained in all publications are solely those of the individual author(s) and contributor(s) and not of MDPI and/or the editor(s). MDPI and/or the editor(s) disclaim responsibility for any injury to people or property resulting from any ideas, methods, instructions or products referred to in the content.

