

Research on Range of Appropriate Spatial Scale of Underground Commercial Street Based on Psychological Perception Evaluation

 , , ,
, , , 
Abstract
:Featured Application
Abstract
1. Introduction
2. Materials and Methods
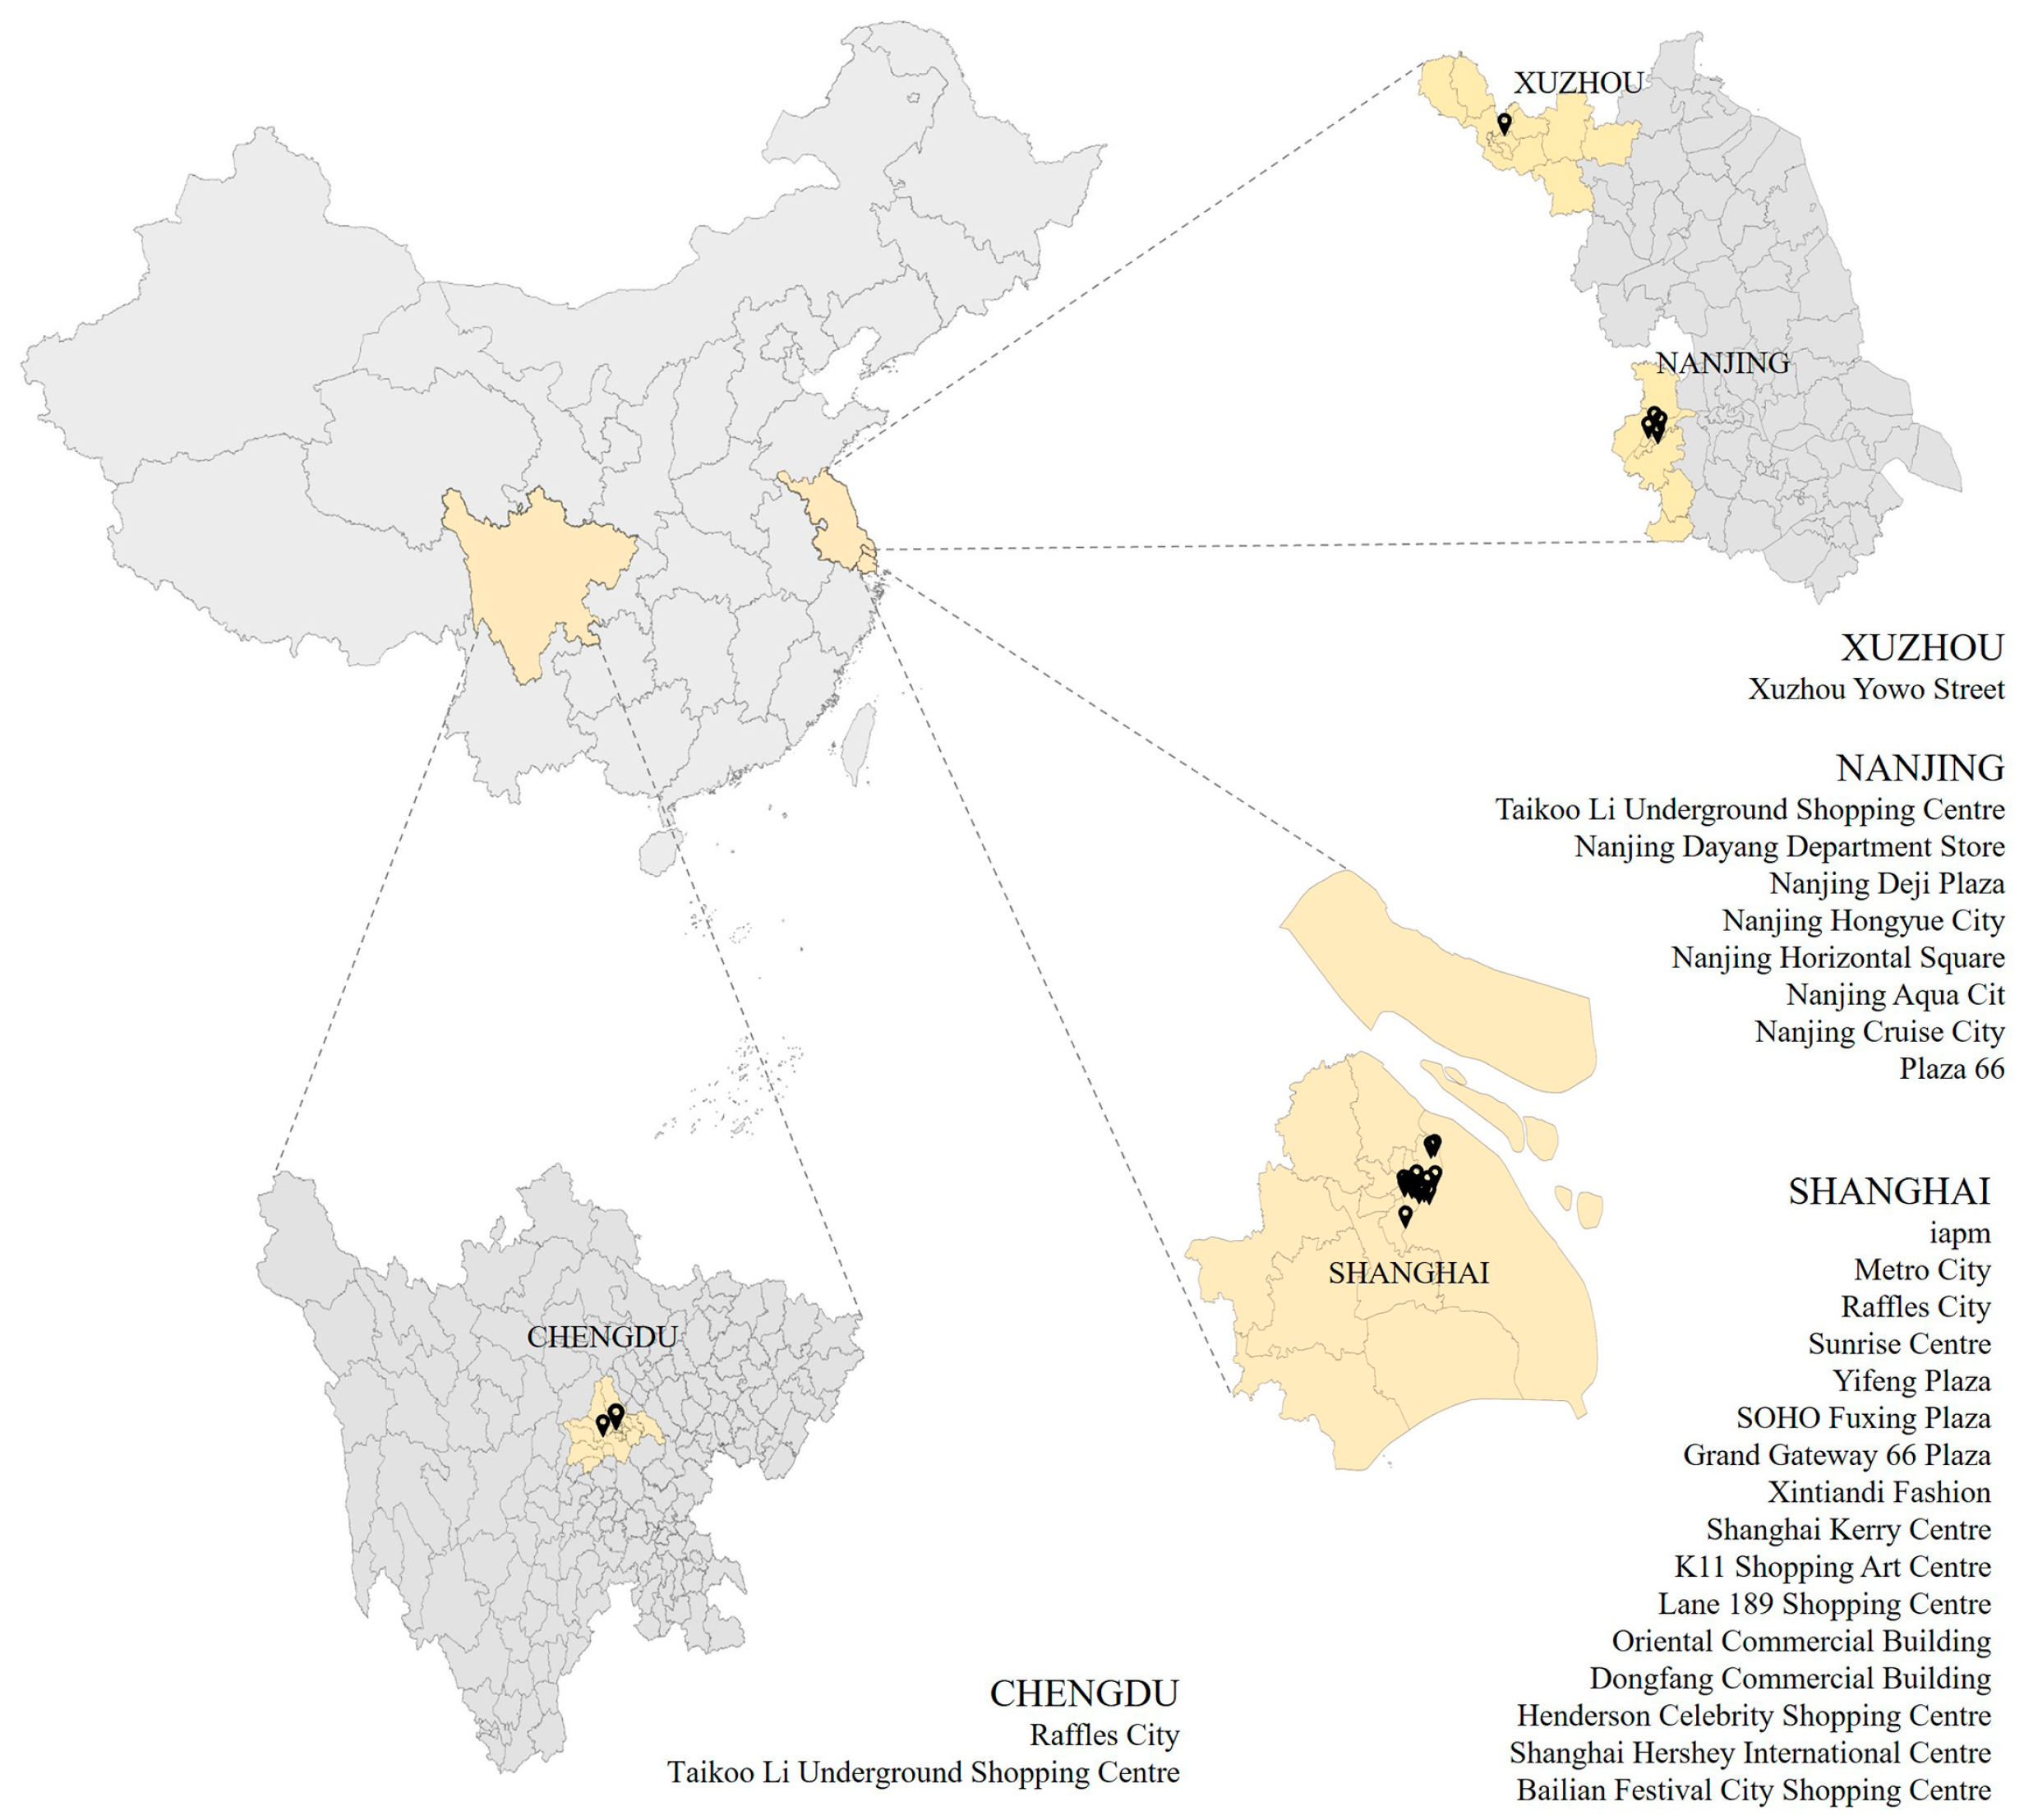
2.1. Research Scope
2.2. Data Processing
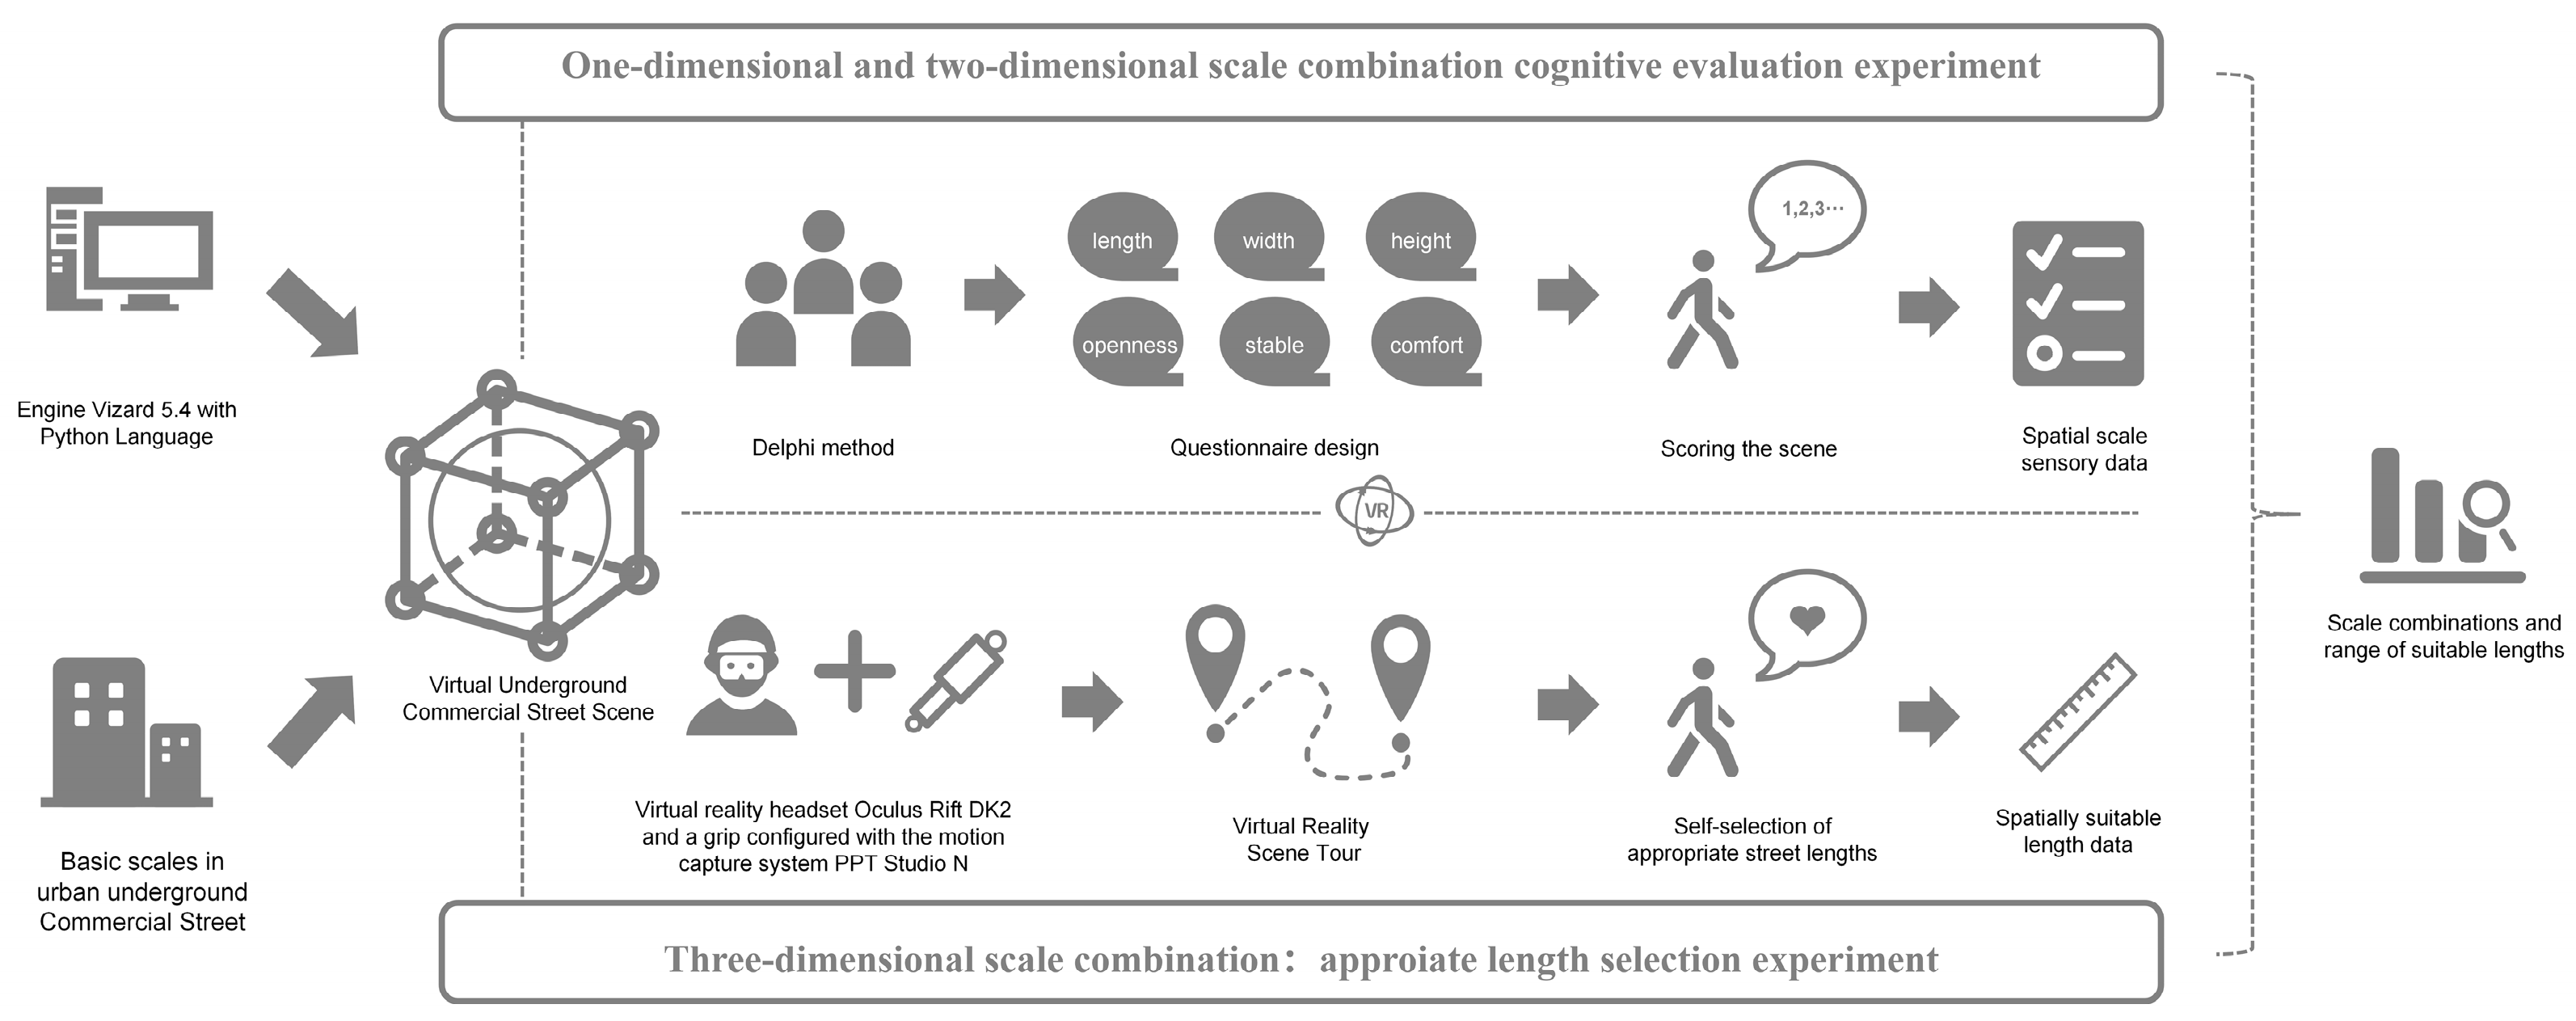
2.3. Experiment Content and Steps
2.4. Questionnaire Setting and Evaluation Index Establishment
2.5. Experimental Design
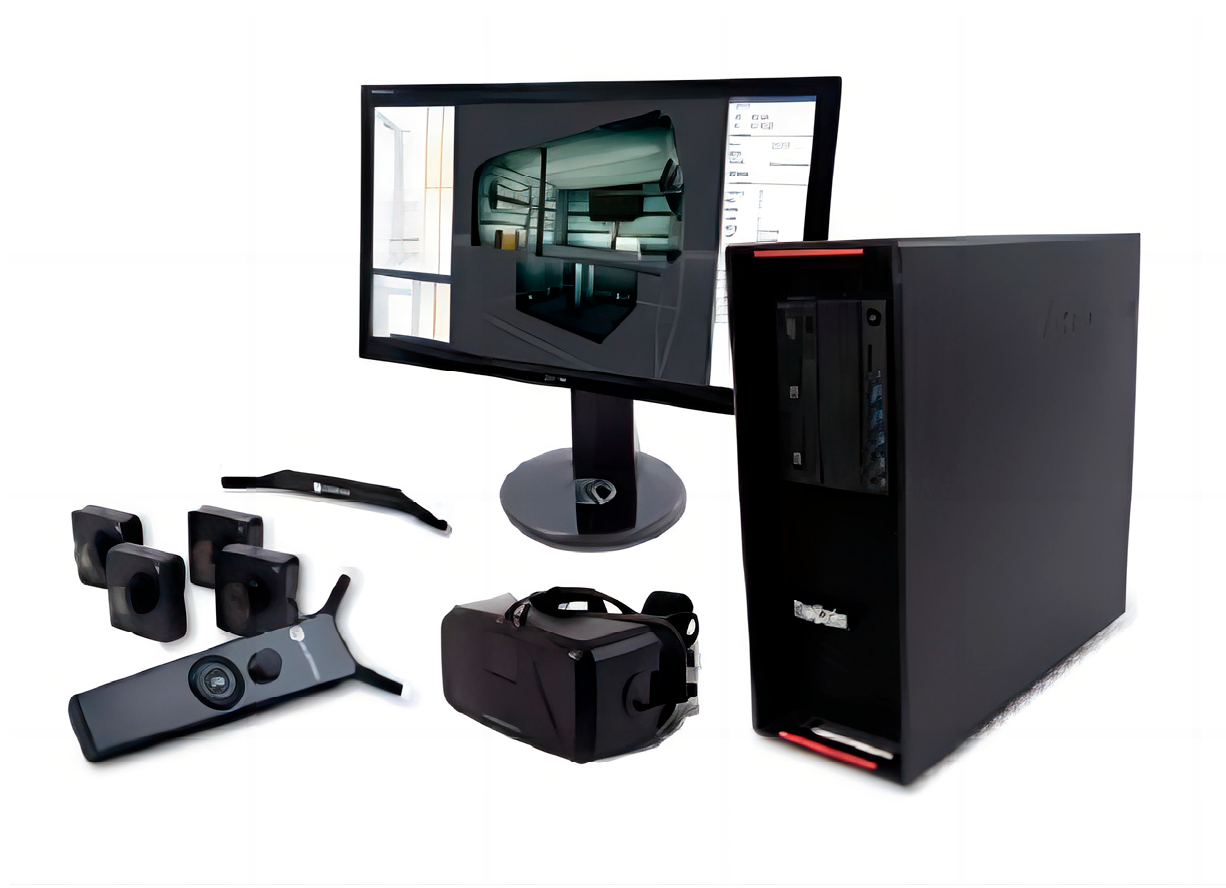
2.5.1. Experimental Equipment
2.5.2. Participants
2.5.3. Construct an Experimental Model
2.6. Experimental Procedure
3. Results
3.1. Analysis of One-Dimensional Scale, Two-Dimensional Scale Combination, and Spatial Perception Correlation
3.1.1. One-Dimensional Scale Combination
3.1.2. Two-Dimensional Scale Combination
3.1.3. Summary Table of Factors of Maximum-Relevance Scale Combinations
3.2. Regression Analysis of Maximum-Correlation Scale Factors and Spatial Perception
3.3. Coverage Analysis of Appropriate Scope of Two-Dimensional Scale Combinations
3.4. Analysis of Selection Range of Appropriate Length of Three-Dimensional Scale Combinations
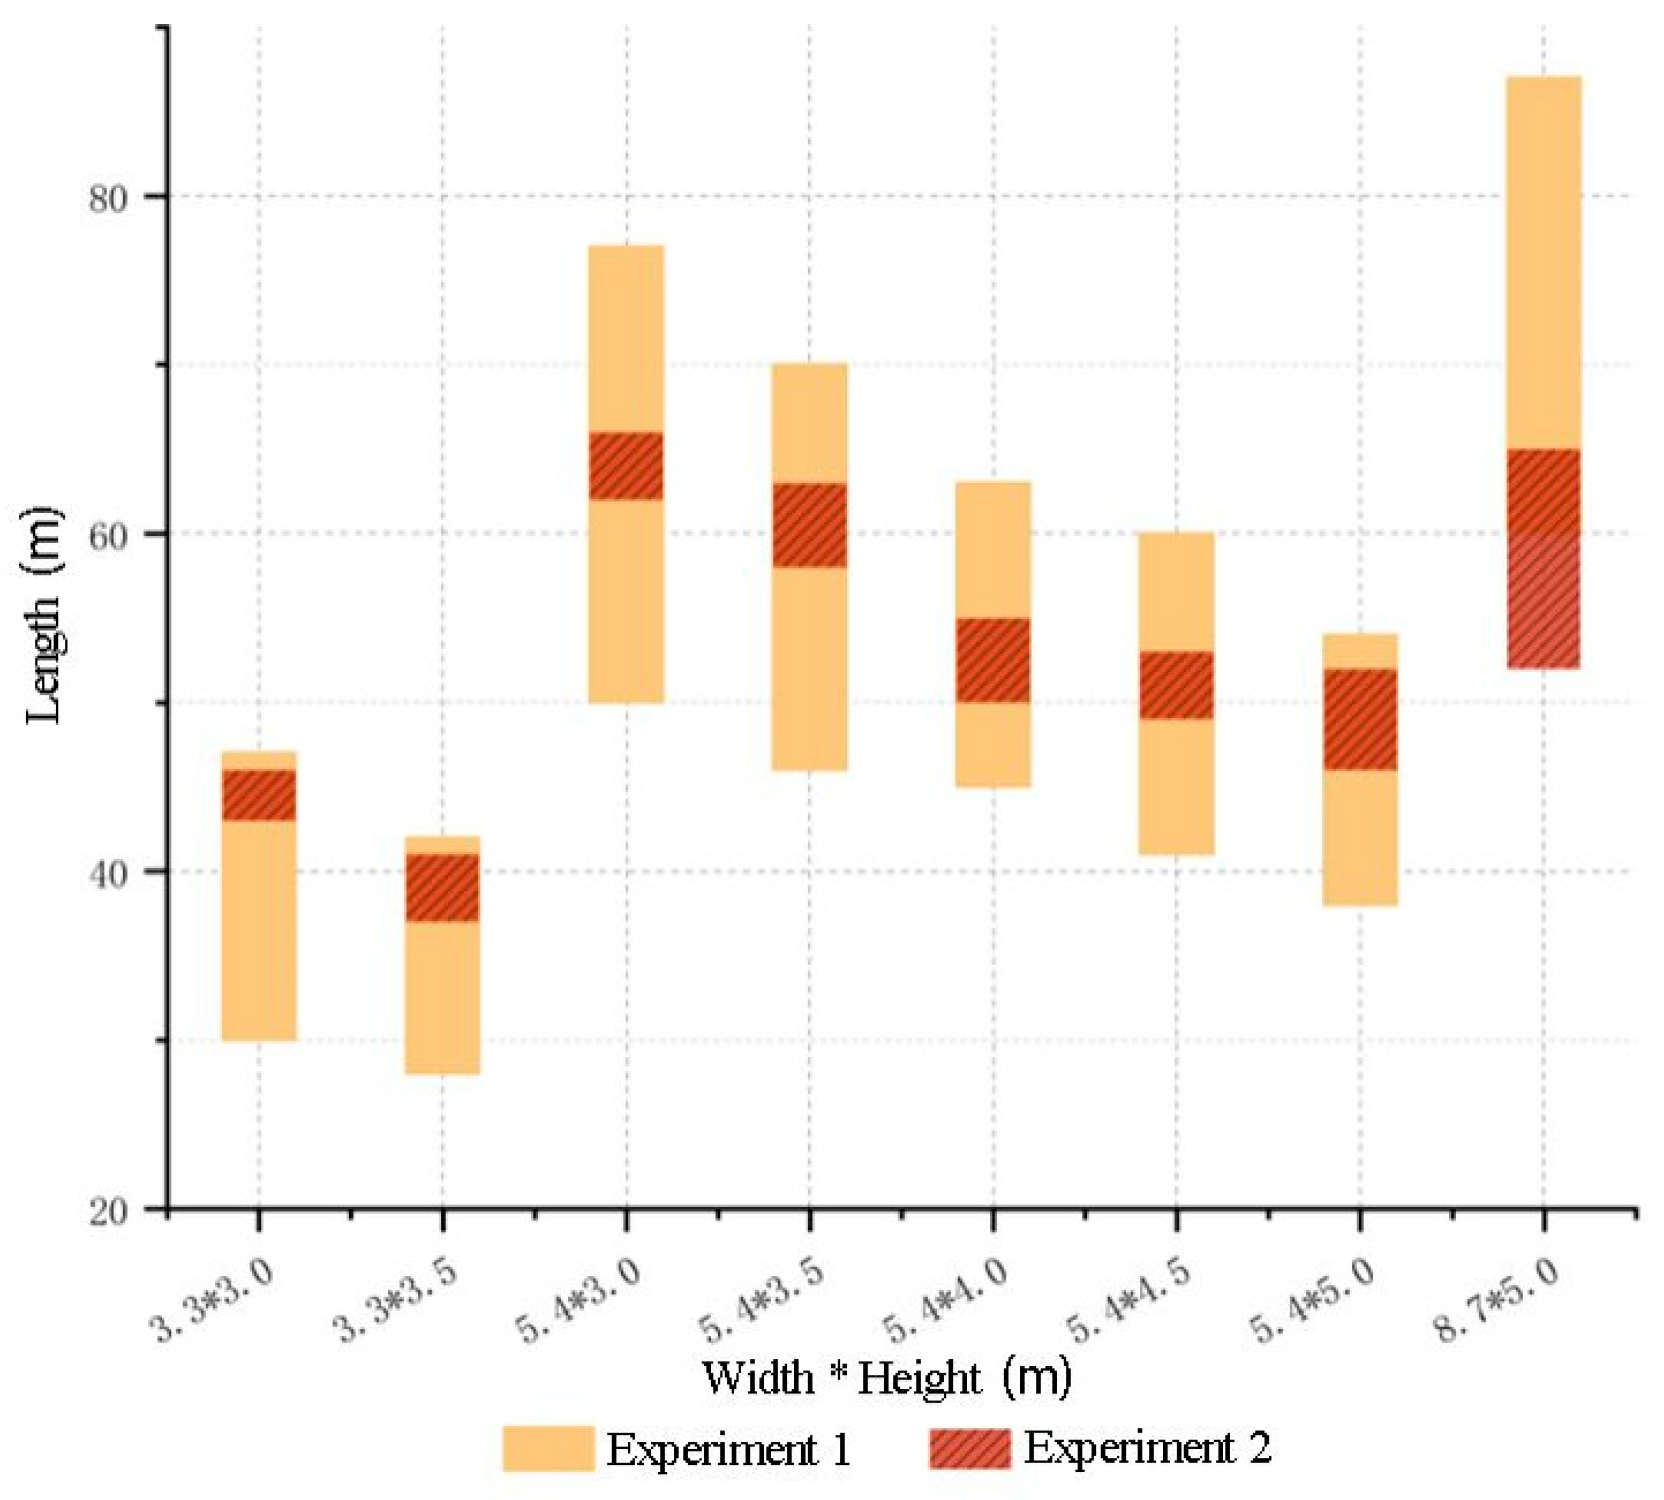
3.5. Comparison Analysis of Appropriate Length Range
4. Discussions
4.1. Research Innovation
4.2. Limitations and Future Directions
4.3. Suggestion of Design and Application
5. Conclusions
Author Contributions
Funding
Data Availability Statement
Conflicts of Interest
Appendix A

| NO. | H (m) | D (m) | L (m) | L × D | L/D | L × H | L/H | D × H | D/H | |
|---|---|---|---|---|---|---|---|---|---|---|
| Scene I | M1 | 3 | 3.3 | 35 | 115.5 | 10.6 | 105 | 11.7 | 9.9 | 1.1 |
| M2 | 3 | 3.3 | 45 | 148.5 | 13.6 | 135 | 15 | 9.9 | 1.1 | |
| M3 | 3 | 3.3 | 55 | 181.5 | 16.7 | 165 | 18.3 | 9.9 | 1.1 | |
| M4 | 3 | 3.3 | 70 | 231 | 21.2 | 210 | 23.3 | 9.9 | 1.1 | |
| M5 | 3 | 5.4 | 35 | 189 | 6.5 | 105 | 11.7 | 16.2 | 1.8 | |
| M6 | 3 | 5.4 | 45 | 243 | 8.3 | 135 | 15 | 16.2 | 1.8 | |
| M7 | 3 | 5.4 | 55 | 297 | 10.2 | 165 | 18.3 | 16.2 | 1.8 | |
| M8 | 3 | 5.4 | 70 | 378 | 13 | 210 | 23.3 | 16.2 | 1.8 | |
| M9 | 3 | 8.7 | 35 | 304.5 | 4 | 105 | 11.7 | 26.1 | 2.9 | |
| M10 | 3 | 8.7 | 45 | 391.5 | 5.2 | 135 | 15 | 26.1 | 2.9 | |
| M11 | 3 | 8.7 | 55 | 478.5 | 6.3 | 165 | 18.3 | 26.1 | 2.9 | |
| M12 | 3 | 8.7 | 70 | 609 | 8 | 210 | 23.3 | 26.1 | 2.9 | |
| Scene II | M13 | 3.5 | 3.3 | 35 | 115.5 | 10.6 | 122.5 | 10 | 11.6 | 0.9 |
| M14 | 3.5 | 3.3 | 45 | 148.5 | 13.6 | 157.5 | 12.9 | 11.6 | 0.9 | |
| M15 | 3.5 | 3.3 | 55 | 181.5 | 16.7 | 192.5 | 15.7 | 11.6 | 0.9 | |
| M16 | 3.5 | 3.3 | 70 | 231 | 21.2 | 245 | 20 | 11.6 | 0.9 | |
| M17 | 3.5 | 5.4 | 35 | 189 | 6.5 | 122.5 | 10 | 18.9 | 1.5 | |
| M18 | 3.5 | 5.4 | 45 | 243 | 8.3 | 157.5 | 12.9 | 18.9 | 1.5 | |
| M19 | 3.5 | 5.4 | 55 | 297 | 10.2 | 192.5 | 15.7 | 18.9 | 1.5 | |
| M20 | 3.5 | 5.4 | 70 | 378 | 13 | 245 | 20 | 18.9 | 1.5 | |
| M21 | 3.5 | 8.7 | 35 | 304.5 | 4 | 122.5 | 10 | 30.5 | 2.5 | |
| M22 | 3.5 | 8.7 | 45 | 391.5 | 5.2 | 157.5 | 12.9 | 30.5 | 2.5 | |
| M23 | 3.5 | 8.7 | 55 | 478.5 | 6.3 | 192.5 | 15.7 | 30.5 | 2.5 | |
| M24 | 3.5 | 8.7 | 70 | 609 | 8 | 245 | 20 | 30.5 | 2.5 | |
| Scene III | M25 | 4 | 3.3 | 35 | 115.5 | 10.6 | 140 | 8.8 | 13.2 | 0.8 |
| M26 | 4 | 3.3 | 45 | 148.5 | 13.6 | 180 | 11.3 | 13.2 | 0.8 | |
| M27 | 4 | 3.3 | 55 | 181.5 | 16.7 | 220 | 13.8 | 13.2 | 0.8 | |
| M28 | 4 | 3.3 | 70 | 231 | 21.2 | 280 | 17.5 | 13.2 | 0.8 | |
| M29 | 4 | 5.4 | 35 | 189 | 6.5 | 140 | 8.8 | 21.6 | 1.4 | |
| M30 | 4 | 5.4 | 45 | 243 | 8.3 | 180 | 11.3 | 21.6 | 1.4 | |
| M31 | 4 | 5.4 | 4 | 5.4 | 10.2 | 220 | 13.8 | 21.6 | 1.4 | |
| M32 | 4 | 5.4 | 70 | 378 | 13 | 280 | 17.5 | 21.6 | 1.4 | |
| M33 | 4 | 8.7 | 35 | 304.5 | 4 | 140 | 8.8 | 34.8 | 2.2 | |
| M34 | 4 | 8.7 | 45 | 391.5 | 5.2 | 180 | 11.3 | 34.8 | 2.2 | |
| M35 | 4 | 8.7 | 55 | 478.5 | 6.3 | 220 | 13.8 | 34.8 | 2.2 | |
| M36 | 4 | 8.7 | 70 | 609 | 8 | 280 | 17.5 | 34.8 | 2.2 | |
| Scene IV | M37 | 4.5 | 3.3 | 35 | 115.5 | 10.6 | 157.5 | 7.8 | 14.9 | 0.7 |
| M38 | 4.5 | 3.3 | 45 | 148.5 | 13.6 | 202.5 | 10 | 14.9 | 0.7 | |
| M39 | 4.5 | 3.3 | 55 | 181.5 | 16.7 | 247.5 | 12.2 | 14.9 | 0.7 | |
| M40 | 4.5 | 3.3 | 70 | 231 | 21.2 | 315 | 15.6 | 14.9 | 0.7 | |
| M41 | 4.5 | 5.4 | 35 | 189 | 6.5 | 157.5 | 7.8 | 24.3 | 1.2 | |
| M42 | 4.5 | 5.4 | 45 | 243 | 8.3 | 202.5 | 10 | 24.3 | 1.2 | |
| M43 | 4.5 | 5.4 | 55 | 297 | 10.2 | 247.5 | 12.2 | 24.3 | 1.2 | |
| M44 | 4.5 | 5.4 | 70 | 378 | 13 | 315 | 15.6 | 24.3 | 1.2 | |
| M45 | 4.5 | 8.7 | 35 | 304.5 | 4 | 157.5 | 7.8 | 39.2 | 1.9 | |
| M46 | 4.5 | 8.7 | 45 | 391.5 | 5.2 | 202.5 | 10 | 39.2 | 1.9 | |
| M47 | 4.5 | 8.7 | 55 | 478.5 | 6.3 | 247.5 | 12.2 | 39.2 | 1.9 | |
| M48 | 4.5 | 8.7 | 70 | 609 | 8 | 315 | 15.6 | 39.2 | 1.9 | |
| Scene V | M49 | 5 | 3.3 | 35 | 115.5 | 10.6 | 175 | 7 | 16.5 | 0.7 |
| M50 | 5 | 3.3 | 45 | 148.5 | 13.6 | 225 | 9 | 16.5 | 0.7 | |
| M51 | 5 | 3.3 | 55 | 181.5 | 16.7 | 275 | 11 | 16.5 | 0.7 | |
| M52 | 5 | 3.3 | 70 | 231 | 21.2 | 350 | 14 | 16.5 | 0.7 | |
| M53 | 5 | 5.4 | 35 | 189 | 6.5 | 175 | 7 | 27 | 1.1 | |
| M54 | 5 | 5.4 | 45 | 243 | 8.3 | 225 | 9 | 27 | 1.1 | |
| M55 | 5 | 5.4 | 55 | 297 | 10.2 | 275 | 11 | 27 | 1.1 | |
| M56 | 5 | 5.4 | 70 | 378 | 13 | 350 | 14 | 27 | 1.1 | |
| M57 | 5 | 8.7 | 35 | 304.5 | 4 | 175 | 7 | 43.5 | 1.7 | |
| M58 | 5 | 8.7 | 45 | 391.5 | 5.2 | 225 | 9 | 43.5 | 1.7 | |
| M59 | 5 | 8.7 | 55 | 478.5 | 6.3 | 275 | 11 | 43.5 | 1.7 | |
| M60 | 5 | 8.7 | 70 | 609 | 8 | 350 | 14 | 43.5 | 1.7 |
References
- Sheng, L.; Jun, S.; Qing, X. Present Situations of Development and Utilization for Underground Space in Cities and New Viewpoints for Future Development. Chin. J. Undergr. Space Eng. 2019, 15, 965–979. [Google Scholar]
- Hong, Y.; Zhong, S. A Study on Functional Evolution and Theoretical Development of the Design of Underground Space. Archit. J. 2016, 12, 77–82. [Google Scholar] [CrossRef]
- Pillan, M.; Maiocchi, M.; Galli, F. Designing Emotional Services for Underground Stations. In Proceedings of the 2nd International Conference on Design Creativity (ICDC2012), Glasgow, UK, 18–20 September 2012; Available online: https://www.xueshufan.com/publication/2507752789 (accessed on 10 April 2024).
- Ewing, R.; Clemente, O.; Neckerman, K.M.; Purciel-Hill, M.; Quinn, J.W.; Rundle, A. Measuring Urban Design Metrics for Livable Places, 1st ed.; Island Press: Washington, DC, USA, 2013; pp. 83–98. [Google Scholar] [CrossRef]
- Roberts, A.C.; Christopoulos, G.I.; Car, J.; Soh, C.-K.; Lu, M. Psycho-biological factors associated with underground spaces: What can the new era of perception neuroscience offer to their study? Tunn. Undergr. Space Technol. Inc. Trenchless Technol. Res. 2016, 50, 15–25. [Google Scholar] [CrossRef]
- Moughtin, J.C. Steet and Square; China Architecture & Building Press: Beijing, China, 2004. [Google Scholar]
- Chiang, Y.C.; Liu, H.H.; Li, D.; Ho, L.C. Quantification through deep learning of sky view factor and greenery on urban streets during hot and cool seasons. Landsc. Urban Plan. 2023, 232, 104679. [Google Scholar] [CrossRef]
- Xia, Y.; Yabuki, N.; Fukuda, T. Development of a system for assessing the quality of urban street-level greenery using street view images and deep learning. Urban For. Urban Green. 2021, 59, 126995. [Google Scholar] [CrossRef]
- Chuan, C.; Liu, Y. On the People-oriented Space Construction in Modern Garden. J. Cent. South Univ. For. Technol. Soc. Sci. 2008, 3, 52–54. [Google Scholar]
- Matzarakis, A.; Rutz, F.; Mayer, H. Modelling radiation fluxes in simple and complex environments—Application of the Rayman model. Int. J. Biometeorol. 2007, 51, 323–334. [Google Scholar] [CrossRef]
- Zhi, F. Study on the Urban Design Based on Suitability of Scale at Human. Ph.D. Thesis, Tianjin University, Tianjin, China, 2014. [Google Scholar]
- Hudec, D.; Kocourek, J.; Matysková, A. Research Findings on the Process of Locating Suitable Areas for Implementing Shared Spaces. In Proceedings of the 2023 Smart City Symposium Prague (SCSP), Prague, Czech Republic, 25–26 May 2023; IEEE: Piscataway, NY, USA, 2023; pp. 1–7. [Google Scholar]
- Qing, L. Study on Optimization of the Pedestrian Perception Experience in Urban Street Space. Ph.D. Thesis, Tianjin University, Tianjin, China, 2017. [Google Scholar]
- Jing, T.; Ying, L. Metropolitan street space quality evaluation: Second and third ring of Beijing, inner ring of Shanghai. Planners 2017, 2, 19–24. [Google Scholar] [CrossRef]
- Zhang, F.; Zhou, B.; Liu, L.; Liu, Y.; Fung, H.H.; Lin, H.; Ratti, C. Measuring Human Perceptions of a Large-Scale Urban Region Using Machine Learning. Landsc. Urban Plan. 2018, 180, 148–160. [Google Scholar] [CrossRef]
- Zhang, L.; Ye, Y.; Zeng, W.; Chiaradia, A. A systematic measurement of street quality through multi-sourced urban data: A human-oriented analysis. Int. J. Environ. Res. Public Health 2019, 16, 1782. [Google Scholar] [CrossRef]
- Vukmirovic, M.; Milena, M. Twitter Data Mining to Map Pedestrian Experience of Open Spaces. Appl. Sci. 2022, 12, 4143. [Google Scholar] [CrossRef]
- Romanova, E. Negative Influence of Underground Constructions on Mental Health of the Person. Procedia Eng. 2016, 165, 1176–1183. [Google Scholar] [CrossRef]
- Kim, J.; Gustafson-Pearce, O. Passengers’ anxiety about using the London Underground. In Proceedings of the IEEE International Conference on Intelligent Rail Transportation (ICIRT), Birmingham, UK, 23–25 August 2016. [Google Scholar] [CrossRef]
- Li, Z.; Zhi, C. Discussion on Exterior Design of Underground Commercial Street in Old City District and Its Application. Chin. J. Undergr. Space Eng. 2017, 13, 1–6. [Google Scholar]
- Liang, S.; Shan, D.; Yan, R. Research on the material and spatial psychological perception of the side interface of an underground street based on virtual reality. Buildings 2022, 12, 1432. [Google Scholar] [CrossRef]
- Liang, S.; Yao, X.; Si, T. Research into the Visual Saliency of Guide Signs in an Underground Commercial Street Based on an Eye-Movement Experiment. Sustainability 2022, 1423, 16062. [Google Scholar] [CrossRef]
- Goshima, T.; Shimabukuro, H.; Senda, M.; Inoue, S. The length of the space in the street: The relation between the scale of space and the structure of mind. In Summaries of Technical Papers of Meeting Architectural Institute of Japan; Architectural Institute of Japan: Tokyo, Japan, 1997. [Google Scholar]
- Ashihara, Y. The Aesthetic Townscape, 1st ed.; Baihua Literature and Art Publishing House: Tianjing, China, 2006; pp. 35–40. ISBN 9787530644768. [Google Scholar]
- Sinéad, H. Review of Literature on the Delphi Technique; National Children’s Office: Dublin, Ireland, 2004; pp. 1–51. [Google Scholar]
- Wang, L.; Han, X.; He, J.; Jung, T. Measuring residents’ perceptions of city streets to inform better street planning through deep learning and space syntax. SPRS J. Photogramm. Remote Sens. 2022, 190, 215–230. [Google Scholar] [CrossRef]
- Peng, Y.; Peng, Z.; Feng, T.; Zhong, C.; Wang, W. Assessing comfort in urban public spaces: A structural equation model involving environmental attitude and perception. Int. J. Environ. Res. Public Health 2021, 18, 1287. [Google Scholar] [CrossRef] [PubMed]
- Siavash, J.; Oktay, D. Urban public spaces and vitality: A socio-spatial analysis in the streets of Cypriot towns. Procedia Soc. Behav. Sci. 2012, 35, 664–674. [Google Scholar]
- Ka-Lun, L.K.; Choi, C.Y. The influence of perceived aesthetic and acoustic quality on outdoor thermal comfort in urban environment. Build. Environ. 2021, 206, 108333. [Google Scholar]
- Park, Y.; Garcia, M. Pedestrian safety perception and urban street settings. Int. J. Sustain. Transp. 2020, 14, 860–871. [Google Scholar] [CrossRef]
- Han, X.; Wang, L.; Seo, S.H.; He, J.; Jung, T. Measuring perceived psychological stress in urban built environments using Google Street View and deep learning. Front. Public Health 2022, 10, 891736. [Google Scholar] [CrossRef] [PubMed]
- Kashiwagi, E.; Iwata, S.; Abe, Y.; Yasui, T. 5383 Research on the recognition tendency of the scale in virtual space experience using Google Street View: Consideration based on the combination pattern of distance, the guess accuracy of time, and a scene. In Summaries of Technical Papers of Meeting; Architectural Institute of Japan: Tokyo, Japan, 2013. [Google Scholar]
- Matsumoto, N.; Fujii, K.; Zhang, Y.; Wakayama, S. The Perceived Shape of Setback Street Space: Perceived shape of street space. J. Archit. Plan. 1995, 60, 115–122. [Google Scholar] [CrossRef] [PubMed]
- Liu, Y.; Yang, D.; Timmermans, H.J.; de Vries, B. The impact of the street-scale built environment on pedestrian metro station access/egress route choice. Transp. Res. Part D Transp. Environ. 2020, 87, 102491. [Google Scholar] [CrossRef]
- Pietro, C.; Serino, S.; Riva, G. Psychometric assessment and behavioral experiments using a free virtual reality platform and computational science. BMC Med. Inform. Decis. Mak. 2016, 16, 37. [Google Scholar]
- Mousavi Hondori, H.; Khademi, M. A review on technical and clinical impact of microsoft kinect on physical therapy and rehabilitation. J. Med. Eng. 2014, 2014, 846514. [Google Scholar] [CrossRef]
- Jian, G.; Hokao, K. Applying the methods of image evaluation and spatial analysis to study the sound environment of urban street areas. J. Environ. Psychol. 2005, 25, 455–466. [Google Scholar]
- Xiaoguang, Y.; Jianming, S.; Xiaoran, L. Research on Urban Street Spatial Perception Based on Quantitative. Archit. Cult. 2018, 6, 175–176. [Google Scholar]
- Yu, Z.; Yu, K. Research on the Open-block-oriented Control Indexes of Street Interface Morphology. Time Archit. 2022, 1, 38–42. [Google Scholar] [CrossRef]
- Liang, S.; Zhan, L.; Le, F. Research on Spatial Appropriate Scale of Underground Street Based on Quantitative Analysis Chinese. J. Undergr. Space Eng. 2019, 15, 25–31. [Google Scholar]
- Yang, H.; Chen, T.; Lin, Y.; Buccolieri, R.; Mattsson, M.; Zhang, M.; Hang, J.; Wang, Q. Integrated impacts of tree planting and street aspect ratios on CO dispersion and personal exposure in full-scale street canyons. Build. Environ. 2020, 169, 106529. [Google Scholar] [CrossRef]
- Zhai, Y.; Gong, R.; Huo, J.; Fan, B. Building façade color distribution, color harmony and diversity in relation to street functions: Using street view images and deep learning. ISPRS Int. J. Geo-Inf. 2023, 12, 224. [Google Scholar] [CrossRef]

| Perception Classification | Evaluation Aspects | Description of the Level of Evaluation | ||
|---|---|---|---|---|
| Level 3 | 0 | Level 3 | ||
| scale perception | length perception | too short | appropriate | too long |
| width perception | too narrow | appropriate | too wide | |
| height perception | too low | appropriate | too high | |
| atmospheric perception | openness perception | confined | moderate openness | appropriate |
| stability perception | unstable | moderately stable | appropriate | |
| comfort perception | indisposed | moderately comfortable | appropriate | |
| 3.3 m Width | 5.4 m Width | 8.7 m Width | |
|---|---|---|---|
| Scene I 3.0 m height | 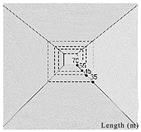 | 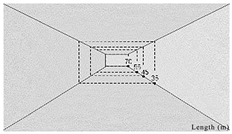 | 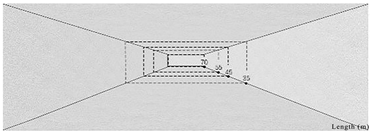 |
| Scene II 3.5 m height | 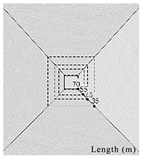 |  | 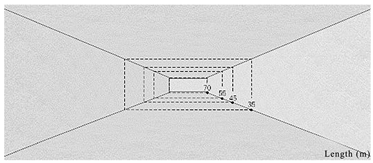 |
| Scene III 4.0 m height | 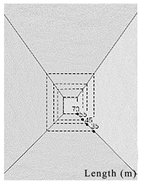 |  |  |
| Scene IV 4.5 m height | 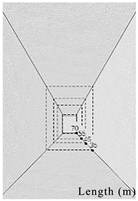 | 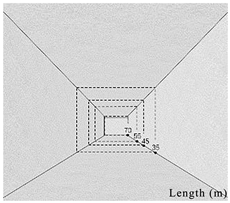 | 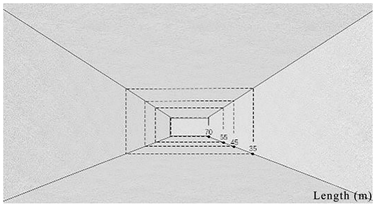 |
| Scene V 5.0 m height | 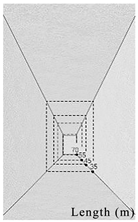 | 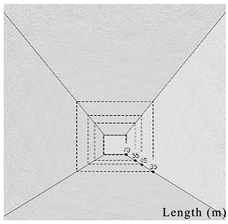 |  |
| Length Perception | Width Perception | Height Perception | Openness Perception | Stability Perception | Comfort Perception | ||
|---|---|---|---|---|---|---|---|
| H | Pearson | 0.156 | −0.263 * | 0.547 ** | −0.293 * | −0.081 | −0.102 |
| significance | 0.234 | 0.042 | 0 | 0.023 | 0.537 | 0.439 | |
| D | Pearson | −0.430 ** | 0.928 ** | −0.836 ** | 0.823 ** | 0.726 ** | 0.557 ** |
| significance | 0.001 | 0 | 0 | 0 | 0 | 0 | |
| L | Pearson | 0.825 ** | 0.189 | 0.223 | 0.045 | −0.231 | −0.09 |
| significance | 0 | 0.149 | 0.086 | 0.733 | 0.075 | 0.495 |
| Length Perception | Width Perception | Height Perception | Openness Perception | Stability Perception | Comfort Perception | ||
|---|---|---|---|---|---|---|---|
| L × D | Pearson | 0.062 | 0.672 ** | −0.546 ** | 0.730 ** | 0.465 ** | 0.449 ** |
| significance | 0.638 | 0 | 0 | 0 | 0 | 0 | |
| L/D | Pearson | 0.854 ** | 0.784 ** | 0.789 ** | 0.745 ** | −0.801 ** | −0.679 ** |
| significance | 0 | 0 | 0 | 0 | 0 | 0 | |
| L × H | Pearson | 0.763 ** | −0.299 * | 0.432 ** | −0.126 | −0.227 | −0.114 |
| significance | 0 | 0.02 | 0.001 | 0.336 | 0.081 | 0.386 | |
| L/H | Pearson | 0.566 | 0.001 | −0.078 | 0.207 | −0.145 | −0.028 |
| significance | 0 | 0.996 | 0.553 | 0.113 | 0.269 | 0.829 | |
| D × H | Pearson | −0.309 * | 0.741 ** | −0.576 ** | 0.626 ** | 0.674 ** | 0.505 ** |
| significance | 0.016 | 0 | 0 | 0 | 0 | 0 | |
| D/H | Pearson | −0.461 ** | 0.960 ** | −0.941 ** | 0.849 ** | 0.622 ** | 0.489 ** |
| significance | 0 | 0 | 0 | 0 | 0 | 0 |
| Length Perception | Width Perception | Height Perception | Openness Perception | Stability Perception | Comfort Perception | |
|---|---|---|---|---|---|---|
| Maximum-relevance scale factor | L/D | D/H | D/H | D/H | L/D | L/D |
| Pearson | 0.854 ** | 0.960 ** | 0.941 ** | 0.849 ** | −0.801 ** | −0.679 ** |
| Maximum-Correlation Scale Factors and Spatial Perception Regression | ||
|---|---|---|
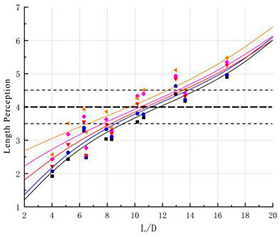 |  | 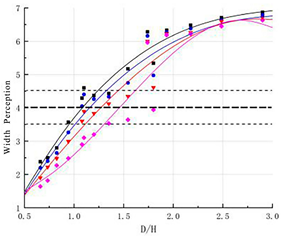 |
| (a) Aspect ratio L/D and perception of length. | (b) Aspect ratio L/D and perception of stability. | (c) Aspect ratio D/H and perception of width. |
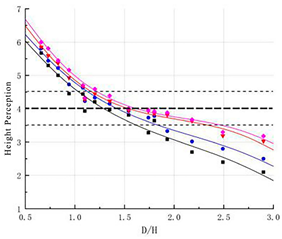 |  | |
| (d) Aspect ratio D/H and perception of height. | (e) Aspect ratio D/H and perception of openness. | |
 | ||
| L/D | ||||||
|---|---|---|---|---|---|---|
| H = 3.0 m | H = 3.5 m | H = 4.0 m | H = 4.5 m | H = 5.0 m | H = 3.0 m | |
| length range | 9.2–14.3 | 8.5–14.0 | 8.3–13.5 | 7.6–13.2 | 7.0–12.5 | 9.2–14.3 |
| stability range | 4.0–17.1 | 4.0–13.5 | 4.0–11.6 | 4.0–11.2 | 4.0–10.0 | 4.0–17.1 |
| length/stability range | 9.2–14.3 | 8.5–13.0 | 8.3–11.6 | 7.6–11.2 | 7.0–10.0 | 9.2–14.3 |
| overall range | 9.2–10.0 | |||||
| D/H | ||||||
|---|---|---|---|---|---|---|
| H = 3.0 m | H = 3.5 m | H = 4.0 m | H = 4.5 m | H = 5.0 m | H = 3.0 m | |
| width range | 0.9–1.3 | 1.0–1.4 | 1.1–1.4 | 1.2–1.6 | 0.9–1.3 | 1.0–1.4 |
| height range | 1.0–1.6 | 1.1–1.8 | 1.2–2.3 | 1.3–2.4 | 1.0–1.6 | 1.1–1.8 |
| openness range | 1.1–2.9 | 1.1–2.9 | 1.1–2.9 | 1.2–2.9 | 1.1–2.9 | 1.1–2.9 |
| width/height/openness range | 1.1–1.3 | 1.1–1.4 | 1.2–1.5 | 1.2–1.6 | 1.1–1.3 | 1.1–1.4 |
| the overall appropriate range | 1.2–1.3 | |||||
| L | |||
|---|---|---|---|
| D = 3.3 m | D = 5.4 m | D = 8.7 m | |
| H = 3.0 m | 30–47 | 50–77 | 80–124 |
| H = 3.5 m | 28–42 | 46–70 | 73–113 |
| H = 4.0 m | 27–38 | 45–63 | 72–100 |
| H = 4.5 m | 25–37 | 41–60 | 66–97 |
| H = 5.0 m | 23–33 | 38–54 | 60–87 |
| 3.3 m Width | 5.4 m Width | 8.7 m Width | |
|---|---|---|---|
| 3.0 m height |  | 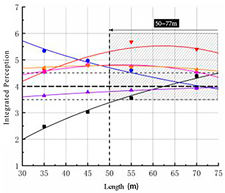 | 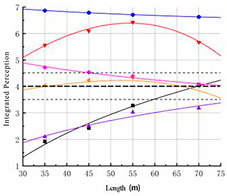 |
| general coverage | good coverage | going beyond coverage | |
| 3.5 m height |  | 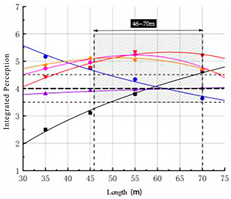 | 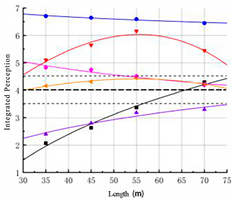 |
| general coverage | good coverage | going beyond coverage | |
| 4.0 m height | 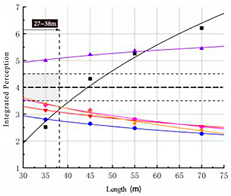 |  | 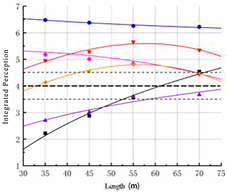 |
| no coverage | good coverage | going beyond coverage | |
| 4.5 m height |  | 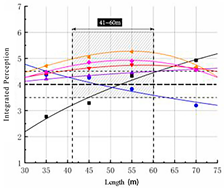 | 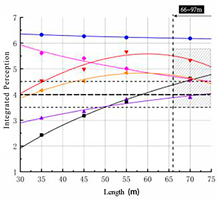 |
| no coverage | good coverage | general coverage | |
| 5.0 m height |  | 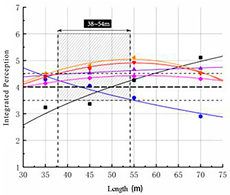 |  |
| no coverage | good coverage | general coverage | |
 | |||
| 3.3 m Width | 5.4 m Width | 8.7 m Width | |
|---|---|---|---|
| 3.0 m height |  |  |  |
| 3.5 m height | 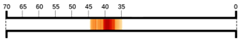 | 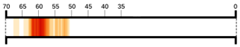 |  |
| 4.0 m height |  | 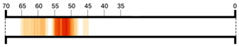 | 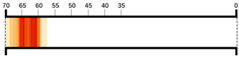 |
| 4.5 m height | 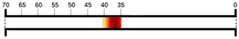 |  | 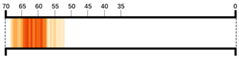 |
| 5.0 m height | 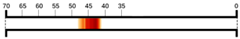 | 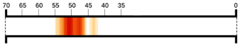 | 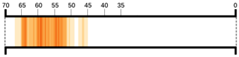 |
| 3.3 m Width | 5.4 m Width | 8.7 m Width | |
|---|---|---|---|
| 3.0 m height | (35–49); (43–46) | (57–70); (62–66) | (62–70); (66–70) |
| 3.5 m height | (35–44); (37–41) | (52–68); (58–63) | (60–70); (64–70) |
| 4.0 m height | (35–44); (35–40) | (45–65); (50–55) | (58–70); (60–66) |
| 4.5 m height | (35–40); (35–38) | (43–63); (49–53) | (51–68); (57–65) |
| 5.0 m height | (42–48); (43–46) | (42–55); (46–52) | (45–67); (52–65) |
| NO. | W × H | Length Range |
|---|---|---|
| 1 | 3.3 × 3.0 | (43–46) |
| 2 | 3.3 × 3.5 | (37–41) |
| 3 | 5.4 × 4.0 | (50–55) |
| 4 | 5.4 × 5.0 | (46–52) |
| 5 | 5.4 × 3.0 | (62–66) |
| 6 | 5.4 × 3.5 | (58–63) |
| 7 | 5.4 × 4.5 | (49–53) |
| 8 | 8.7 × 5.0 | (60–65) |
Disclaimer/Publisher’s Note: The statements, opinions and data contained in all publications are solely those of the individual author(s) and contributor(s) and not of MDPI and/or the editor(s). MDPI and/or the editor(s) disclaim responsibility for any injury to people or property resulting from any ideas, methods, instructions or products referred to in the content. |
© 2024 by the authors. Licensee MDPI, Basel, Switzerland. This article is an open access article distributed under the terms and conditions of the Creative Commons Attribution (CC BY) license (https://creativecommons.org/licenses/by/4.0/).
Share and Cite
Yao, T.; Ding, S.; Zhang, Y.; Chen, X.; Xu, Y.; Hu, K.; Xu, X.; Sun, L.; Liang, Z.; Huang, Y.; et al. Research on Range of Appropriate Spatial Scale of Underground Commercial Street Based on Psychological Perception Evaluation. Appl. Sci. 2024, 14, 5435. https://doi.org/10.3390/app14135435
Yao T, Ding S, Zhang Y, Chen X, Xu Y, Hu K, Xu X, Sun L, Liang Z, Huang Y, et al. Research on Range of Appropriate Spatial Scale of Underground Commercial Street Based on Psychological Perception Evaluation. Applied Sciences. 2024; 14(13):5435. https://doi.org/10.3390/app14135435
Chicago/Turabian StyleYao, Tianning, Shanmin Ding, Yiyun Zhang, Xing Chen, Yao Xu, Kuntao Hu, Xin Xu, Liang Sun, Zheng Liang, Yin Huang, and et al. 2024. "Research on Range of Appropriate Spatial Scale of Underground Commercial Street Based on Psychological Perception Evaluation" Applied Sciences 14, no. 13: 5435. https://doi.org/10.3390/app14135435