Abstract
Significant advances in reverse engineering and additive manufacturing have the potential to provide a faster, accurate, and cost-effective process chain for preserving, analyzing, and presenting forensic impression evidence in both 3D digital and physical forms. The objective of the present research was to evaluate the capabilities and limitations of five 3D scanning technologies, including laser scanning (LS), structured-light (SL) scanning, smartphone (SP) photogrammetry, Microsoft Kinect v2 RGB-D camera, and iPhone’s LiDAR (iLiDAR) Sensor, for 3D reconstruction of 3D impression evidence. Furthermore, methodologies for 3D reconstruction of latent impression and visible 2D impression based on a single 2D photo were proposed. Additionally, the FDM additive manufacturing process was employed to build impression evidence models created by each procedure. The results showed that the SL scanning system generated the highest reconstruction accuracy. Consequently, the SL system was employed as a benchmark to assess the reconstruction quality of other systems. In comparison to the SL data, LS showed the smallest absolute geometrical deviations (0.37 mm), followed by SP photogrammetry (0.78 mm). In contrast, the iLiDAR exhibited the largest absolute deviations (2.481 mm), followed by Kinect v2 (2.382 mm). Additionally, 3D printed impression replicas demonstrated superior detail compared to Plaster of Paris (POP) casts. The feasibility of reconstructing 2D impressions into 3D models is progressively increasing. Finally, this article explores potential future research directions in this field.
1. Introduction
Forensic impression evidence represents powerful visualizations for intelligence gathering, police investigations, and courtroom purposes to help law enforcement agencies better engage with and understand the circumstances of crimes or accidents [1,2]. The examiner’s ability to conduct precise forensic comparisons relies heavily on the quality of impressions documented and collected at the crime scene (CS). Therefore, impressions require meticulous documentation, handling, and storage for evidence integrity. Impressions left at CS can be classified into three categories, namely plastic, latent, and visible. Figure 1 illustrates examples of these impression evidence types. Plastic impressions, depicted in Figure 1a, are three-dimensional marks left on a flexible surface like sand, clay, putty, or wax. The most common plastic impression evidence encountered at outdoor crime scenes includes footprints and tire tracks. Footwear impressions alone are discovered in approximately 35% of all crime scenes [3] and comprise the primary workload of tread examiners who analyze both footwear and tire marks [4]. Despite advancements in forensic technologies, the reconstruction of plastic impressions lags behind, with traditional casting and 2D photography remaining prevalent methods to reconstruct plastic impressions. Casting, a multi-step procedure lasting two days, involves creating replicas using materials like Plaster of Paris (POP), dental stone, or foam and requires various tools. Despite its popularity for recovering plastic imprints, casting presents significant drawbacks [5,6]. It is time-consuming, messy, and results in fragile casts prone to cracking and drying out. Air bubbles are common, and casts have low durability against friction. Moreover, it only produces actual-size molds, demands skilled practitioners, and poses challenges in sharing and storing. Post-casting cleaning is necessary, and processing parameters like water-to-powder ratio and mixing time are sensitive. Additionally, traditional 2D images, even with high resolution, lack sufficient depth information for spatial visualization [7].
Unlike plastic impressions, latent impressions are typically 2D and invisible to the naked eye. However, they can be rendered visible using various methods such as chemicals, special powders, light sources, or electrostatic lifting. Latent impressions are commonly found indoors on hard surfaces like glass or concrete, with fingerprints being the most prevalent type (refer to Figure 1b).
In contrast, 2D visible impressions (depicted in Figure 1c) are marks that can be transferred onto substrates such as dust, floors, or blood. These impressions are typically encountered indoors and are often documented using perpendicular 2D photography. Bloody fingerprints and shoeprints are among the most frequently encountered types of 2D visible impressions.
Computational pattern recognition systems are commonly used for comparison and analysis of 2D latent and visible impressions [8,9]. However, the extensive variability of impressions and the multitude of manufactured and organic patterns pose significant challenges for their computational analysis and presentation in court [4]. In addition, it does not give enough information to represent a spatial visualization due to loss of depth information [7,10,11].
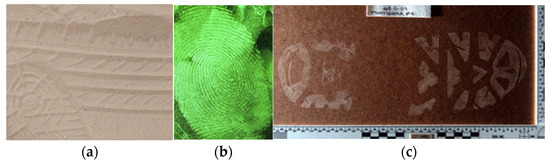
Figure 1.
Examples of impression evidence types: (a) 3D tire–footwear plastic impression in dry sand; (b) 2D latent fingerprint developed on aluminum foil [12]; (c) 2D visible footwear impression (courtesy of Scott Campbell, Ron Smith & Associates, Inc. (Collinsville, MS, USA)).
Figure 1.
Examples of impression evidence types: (a) 3D tire–footwear plastic impression in dry sand; (b) 2D latent fingerprint developed on aluminum foil [12]; (c) 2D visible footwear impression (courtesy of Scott Campbell, Ron Smith & Associates, Inc. (Collinsville, MS, USA)).

In contemporary digital forensics, it is necessary to reconstruct both 2D and 3D impression types digitally and physically in 3D as this will add much value for forensic analysis. 3D reconstruction is vital in computer vision and is gaining importance in future metaverse forensic frameworks that combine virtual reality, augmented reality, and mixed reality [13,14,15]. The spatial representation of evidence may enhance personal identification accuracy, aligning with current technologies and shaping future impression analysis procedures. Therefore, the aforementioned technological limitations associated with traditional casting and 2D photography in reconstruction of impression evidence highlight the importance of employing new 3D technologies like reverse engineering and additive manufacturing for digital and physical 3D reconstruction. Currently, the 3D digital and physical reconstruction of 3D impression is growing rapidly, but the concept of 3D reconstruction of impressions based on 2D photos and its potential utilization are still limited in the field of forensic analysis, but with the advent of 3D technologies, this concept is gaining attention.
In recent years, rapid advancements in 3D technologies have impacted various sectors such as industry, medicine, and culture. Access to realization of the world in 3D is no longer confined to expensive facilities. The key pillars of these technologies include 3D scanning, modeling software, and additive manufacturing.
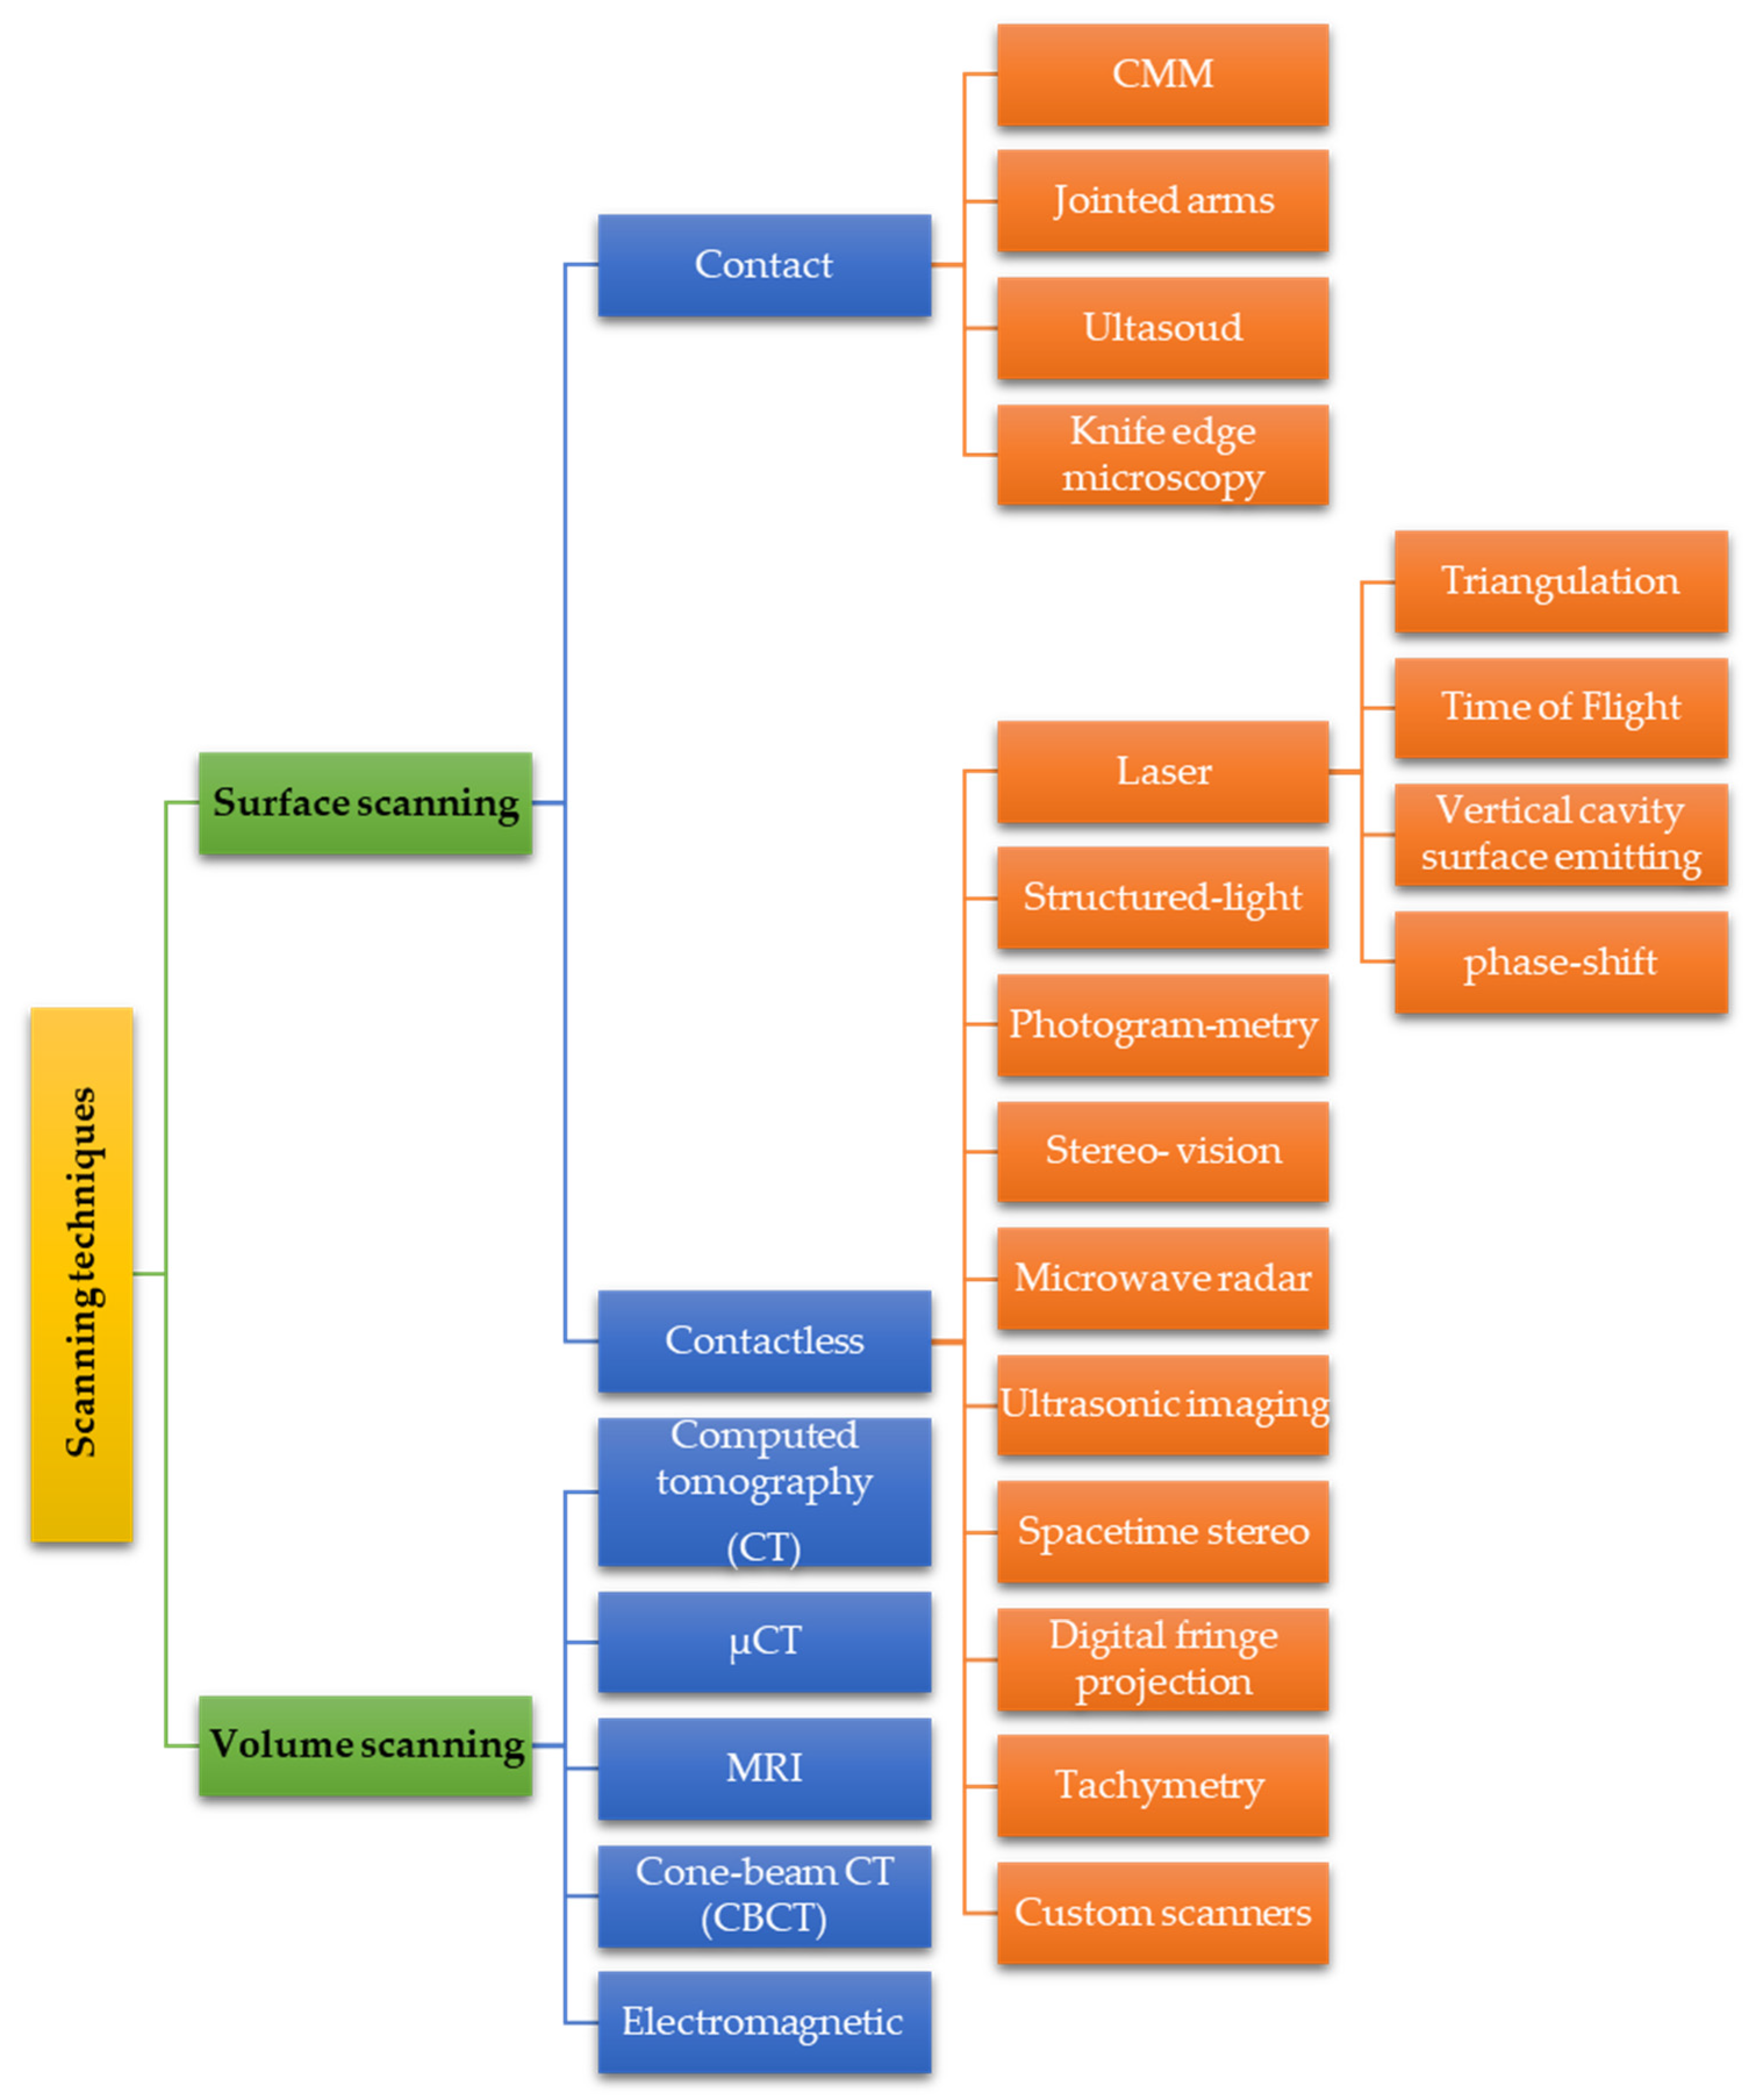
3D scanning is the process of acquiring geometrical and possibly texture color data for an object or environment to generate its corresponding 3D digital model. 3D data can be acquired through many available techniques. Figure 2 shows a classification for 3D scanning techniques. In forensic applications, acquiring 3D scans of crime scenes typically involves costly and specialized equipment like computed tomography (CT) and professional laser scanners. These tools demand extensive training and are often inaccessible [16,17,18]. However, recent advancements in consumer scanning devices, such as SL scanners, handheld LS, RGB-D systems, and iPhone’s LiDAR (iLiDAR) Scanners, alongside SP photogrammetry, have sparked interest within the forensic community. These alternatives offer affordability, ease of use, and time efficiency compared to their high-tech counterparts.
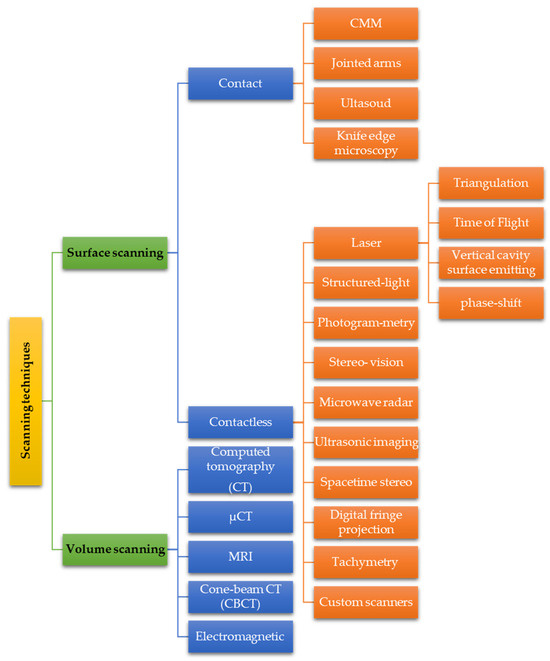
Figure 2.
Classification for 3D scanning techniques.
While researchers increasingly explore 3D scanning in forensic applications [15,17,19,20,21], most studies focus on standalone 3D reconstruction methods for impression evidence. These include laser scanning [6], structured-light scanning [22,23], smartphone photogrammetry [24], RGB-D scanning [25], and iPhone’s LiDAR [17], and only a few studies compared the use of different low-cost consumer-level devices exist for impression evidence scanning. However, comparing various scanning techniques helps identify the most accurate method for producing high-quality 3D impression models. In this work, we compare five non-contact surface scanning methods: handheld laser scanning, structured-light scanning, smartphone photogrammetry, Kinect v2 RGB-D scanning, and iPhone’s LiDAR (iLiDAR) in the 3D reconstruction of plastic impression evidence.
Additive manufacturing (AM) is another 3D technology that has gained attention in the forensic community due to its ability to reconstruct patterns and devices quickly and at various scales for forensic applications. ASTM F2792-12a [26] defines AM as the process of joining materials to make objects from 3D model data, usually layer upon layer, as opposed to subtractive manufacturing methodologies. AM encompasses automated techniques like Fused Deposition Modelling (FDM), Selective Laser Sintering (SLS), Stereolithography (SLA), Selective Laser Melting (SLM), and Three-Dimensional Printing (3DP), which are categorized according to classification Illustrated in Figure 3.
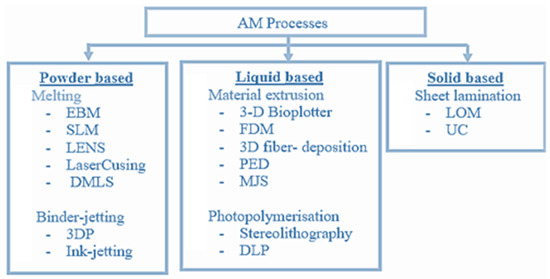
Figure 3.
Classification of AM processes.
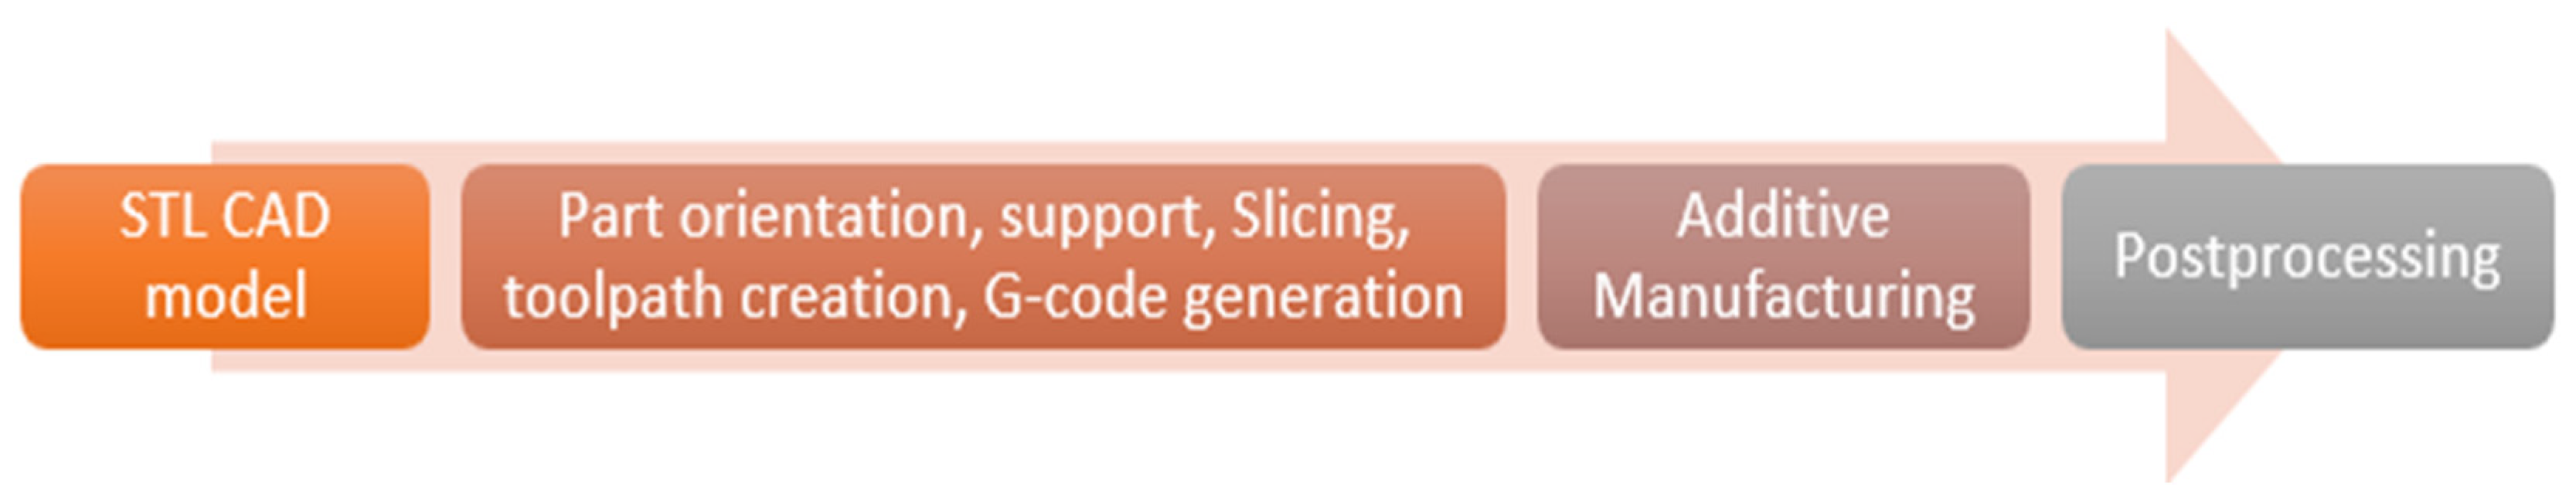
The AM process begins with creating a 3D computer-aided design (CAD) file for the part, which is then converted to “.STL” (StereoLithography) format to approximate the model’s surfaces with a triangle mesh. Next steps include setting part orientation, support creation, virtual slicing into thin layers, toolpath generation, and G-code creation. Based on the G-code, the part is then printed layer by layer and then undergoes suitable postprocessing. Figure 4 shows the generic additive manufacturing procedure and Figure 5 shows a schematic of the FDM AM process as an example.
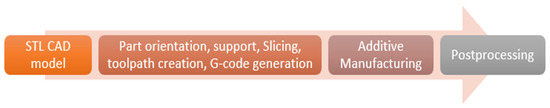
Figure 4.
Generic additive manufacturing procedure.
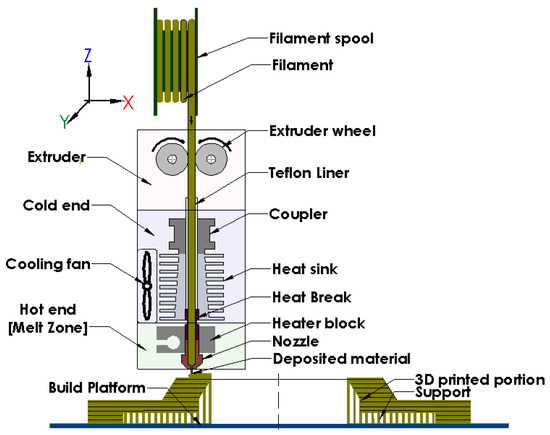
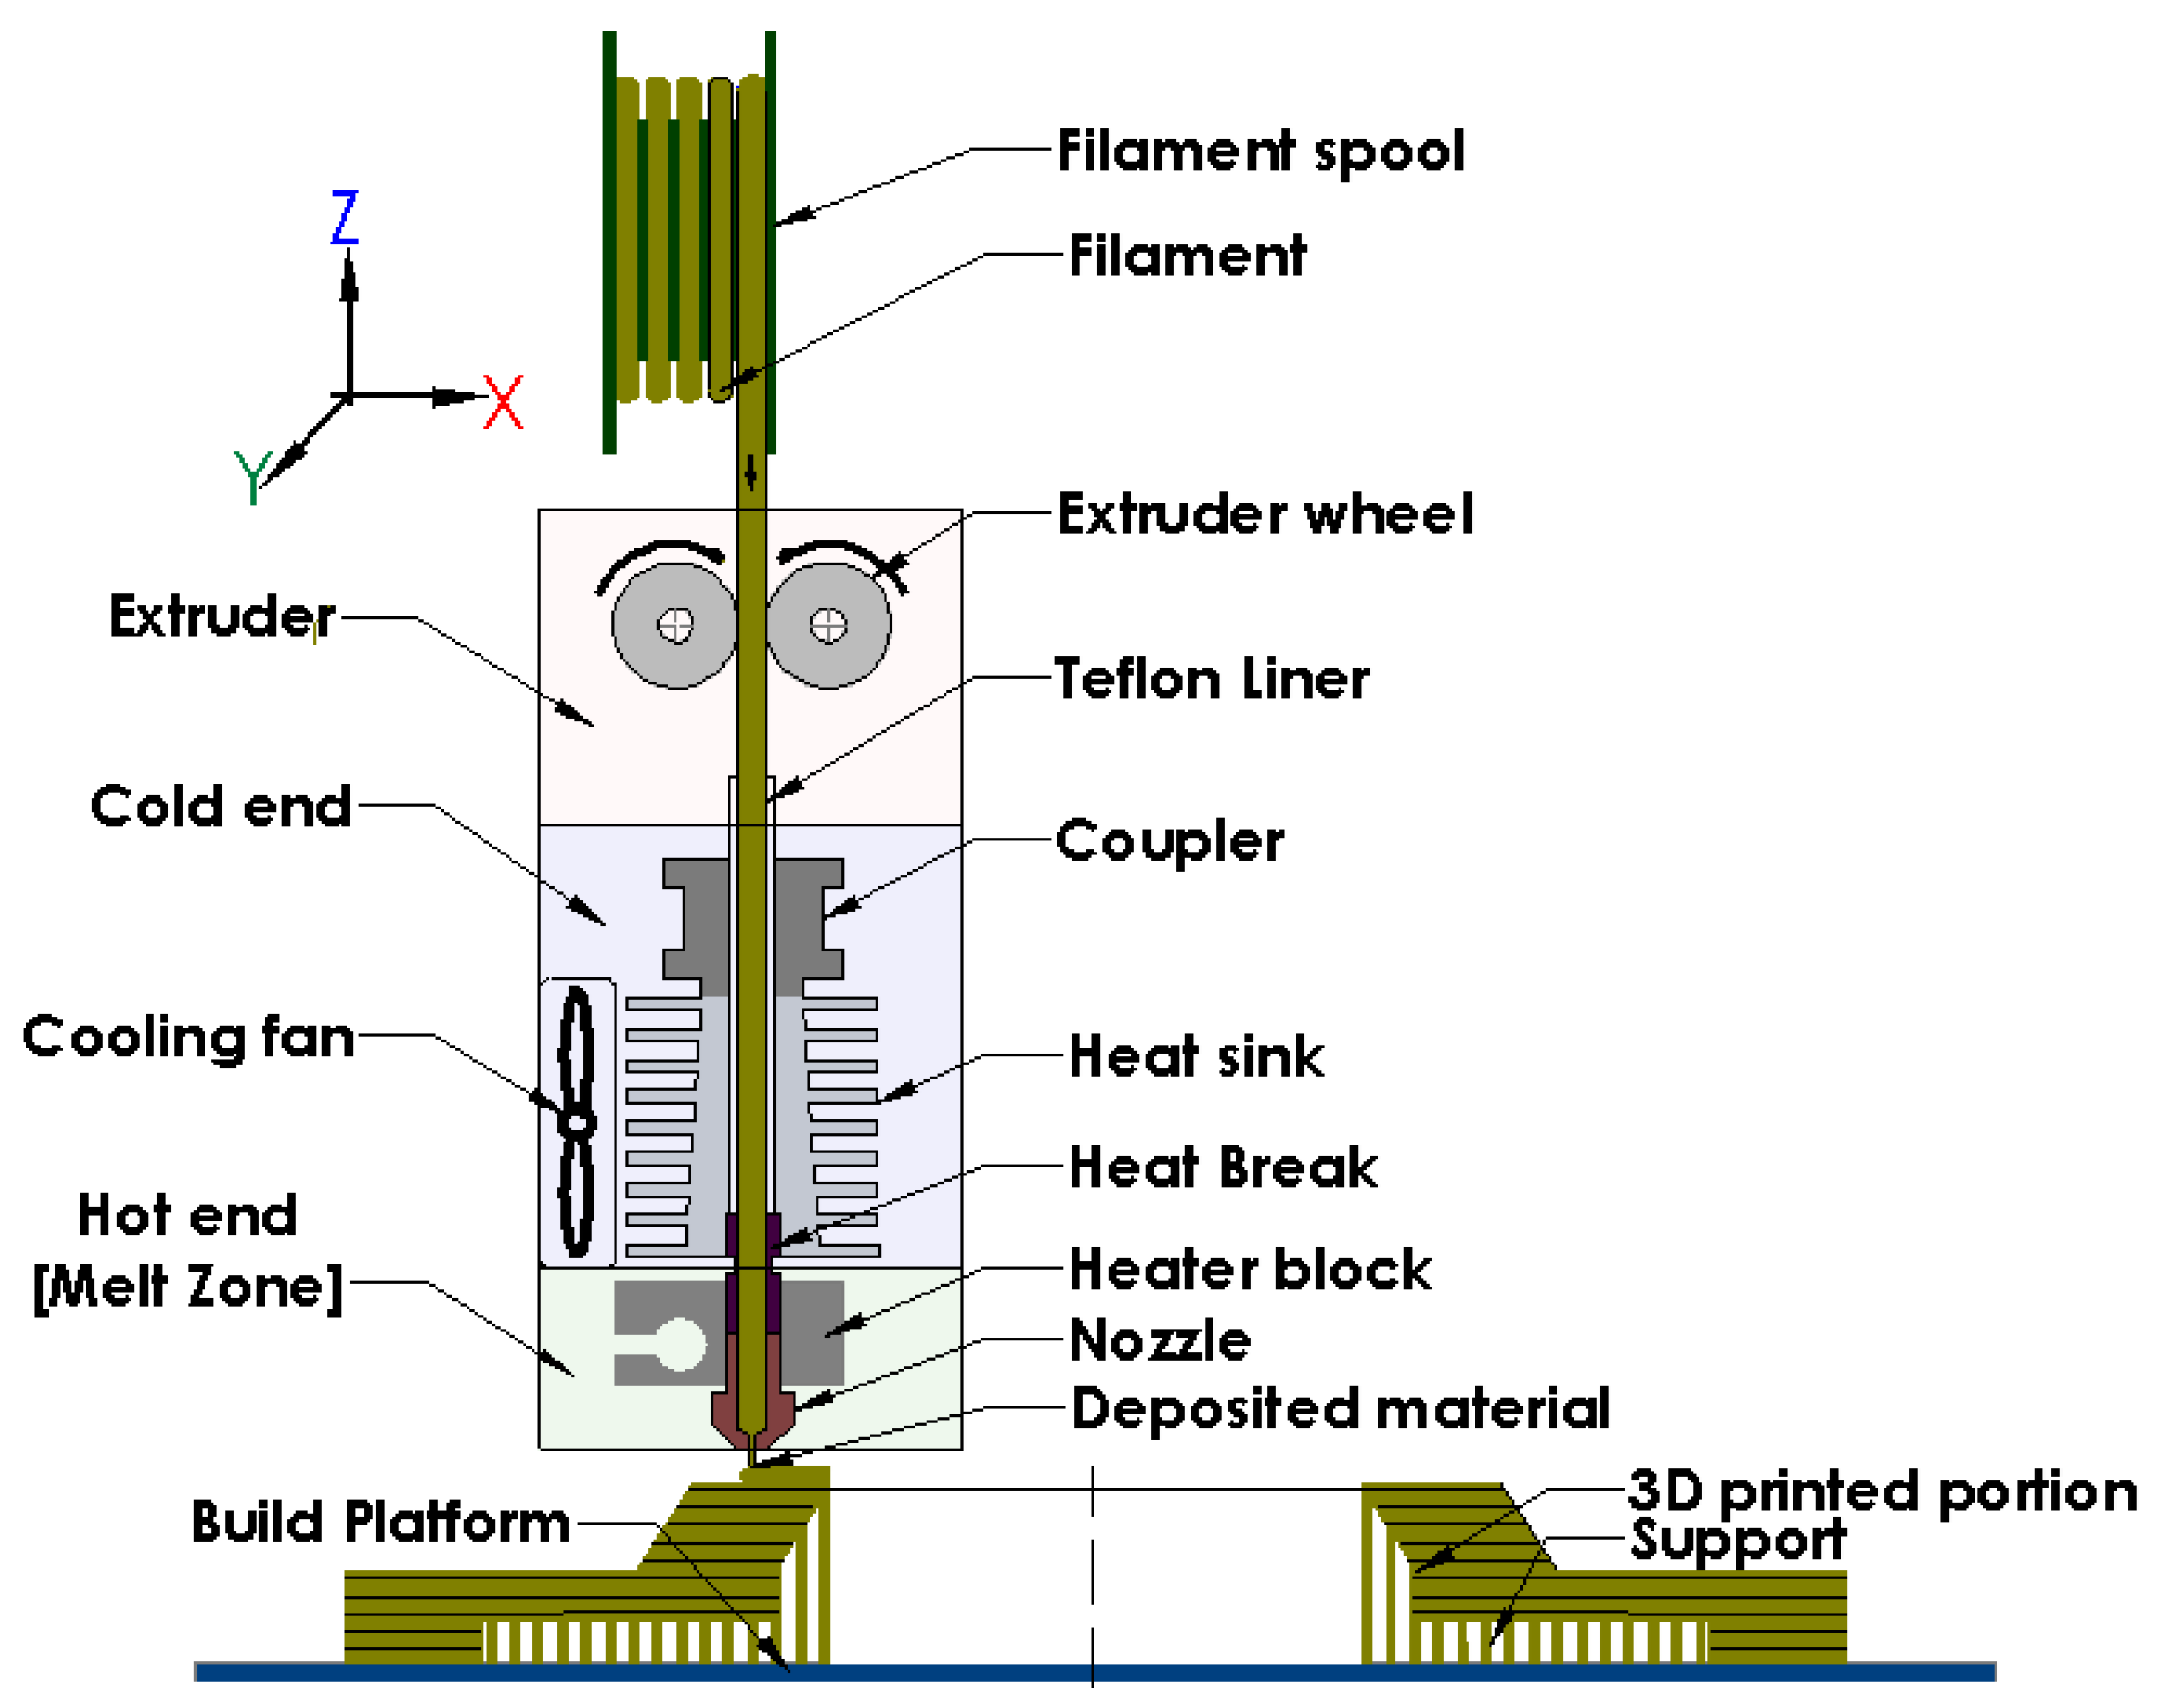
Figure 5.
Schematic of the FDM additive manufacturing process.
The emerging concept of 3D Forensic Science (3DFS) integrates 3D scanning, modeling, and additive manufacturing into forensic reconstruction. Its growing popularity suggests integration into future forensic analysis and presentation workflows [6,27,28]. However, to date, the complete 3D scanning and 3D printing procedure has not yet been standardized by the low enforcement agencies worldwide as a confirmed route in forensic practices. Nonetheless, numerous crime laboratories have started to actively pilot and explore the integration of these technologies into their traditional workflows.
Recent advancements in reverse engineering, coupled with the rise of additive manufacturing, are poised to significantly enhance forensic impression evidence analysis, documentation, and presentation. Therefore, the present work highlights the appropriateness of five non-destructive 3D scanning technologies—handheld laser scanning, structured-light scanning, smartphone photogrammetry, Kinect v2 RGB-D Scanning, and iPhone’s LiDAR (iLiDAR)—to reconstruct 3D impression models, considering factors like accuracy, speed, and cost. This study also utilizes FDM additive manufacturing to produce models from each method, comparing the printed 3D impression replicas with conventional Plaster of Paris (POP) casts. Additionally, two methodologies for 3D reconstruction of latent impression and visible 2D impression evidence from a single 2D image were introduced and FDM was also used in building the models created from each procedure.
2. Materials and Methods
In order to explore the potential of using 3D technologies in the collection, we performed preservation and analysis of impression evidence. The methodology of this study consists of two parts. In the first part, 3D digital and physical reconstructions of a 3D footwear impression using five different 3D scanning systems, namely handheld LS, SL 3D scanning, SP photogrammetry, Kinect v2 camera, and iLiDAR sensor, in capturing a 3D footwear impression was carried out. The overall rationale was to qualitatively and quantitively investigate the quality of the data obtained via different scanning techniques compared with traditional POP casting. The second part consists of 3D digital and physical reconstructions of latent impression and visible 2D impression evidence. The objective was to introduce 2 operational methodologies demonstrating the utility of 3D modeling and 3D printing for the 3D reconstruction of 2D evidence. Description of the acquisition procedure and setup used in part 1 and the workflow of proposed methodologies of part 2 is presented below.
2.1. Reconstruction of Plastic Footwear Impression
2.1.1. 3D Digital Reconstructions of a Footwear Impression
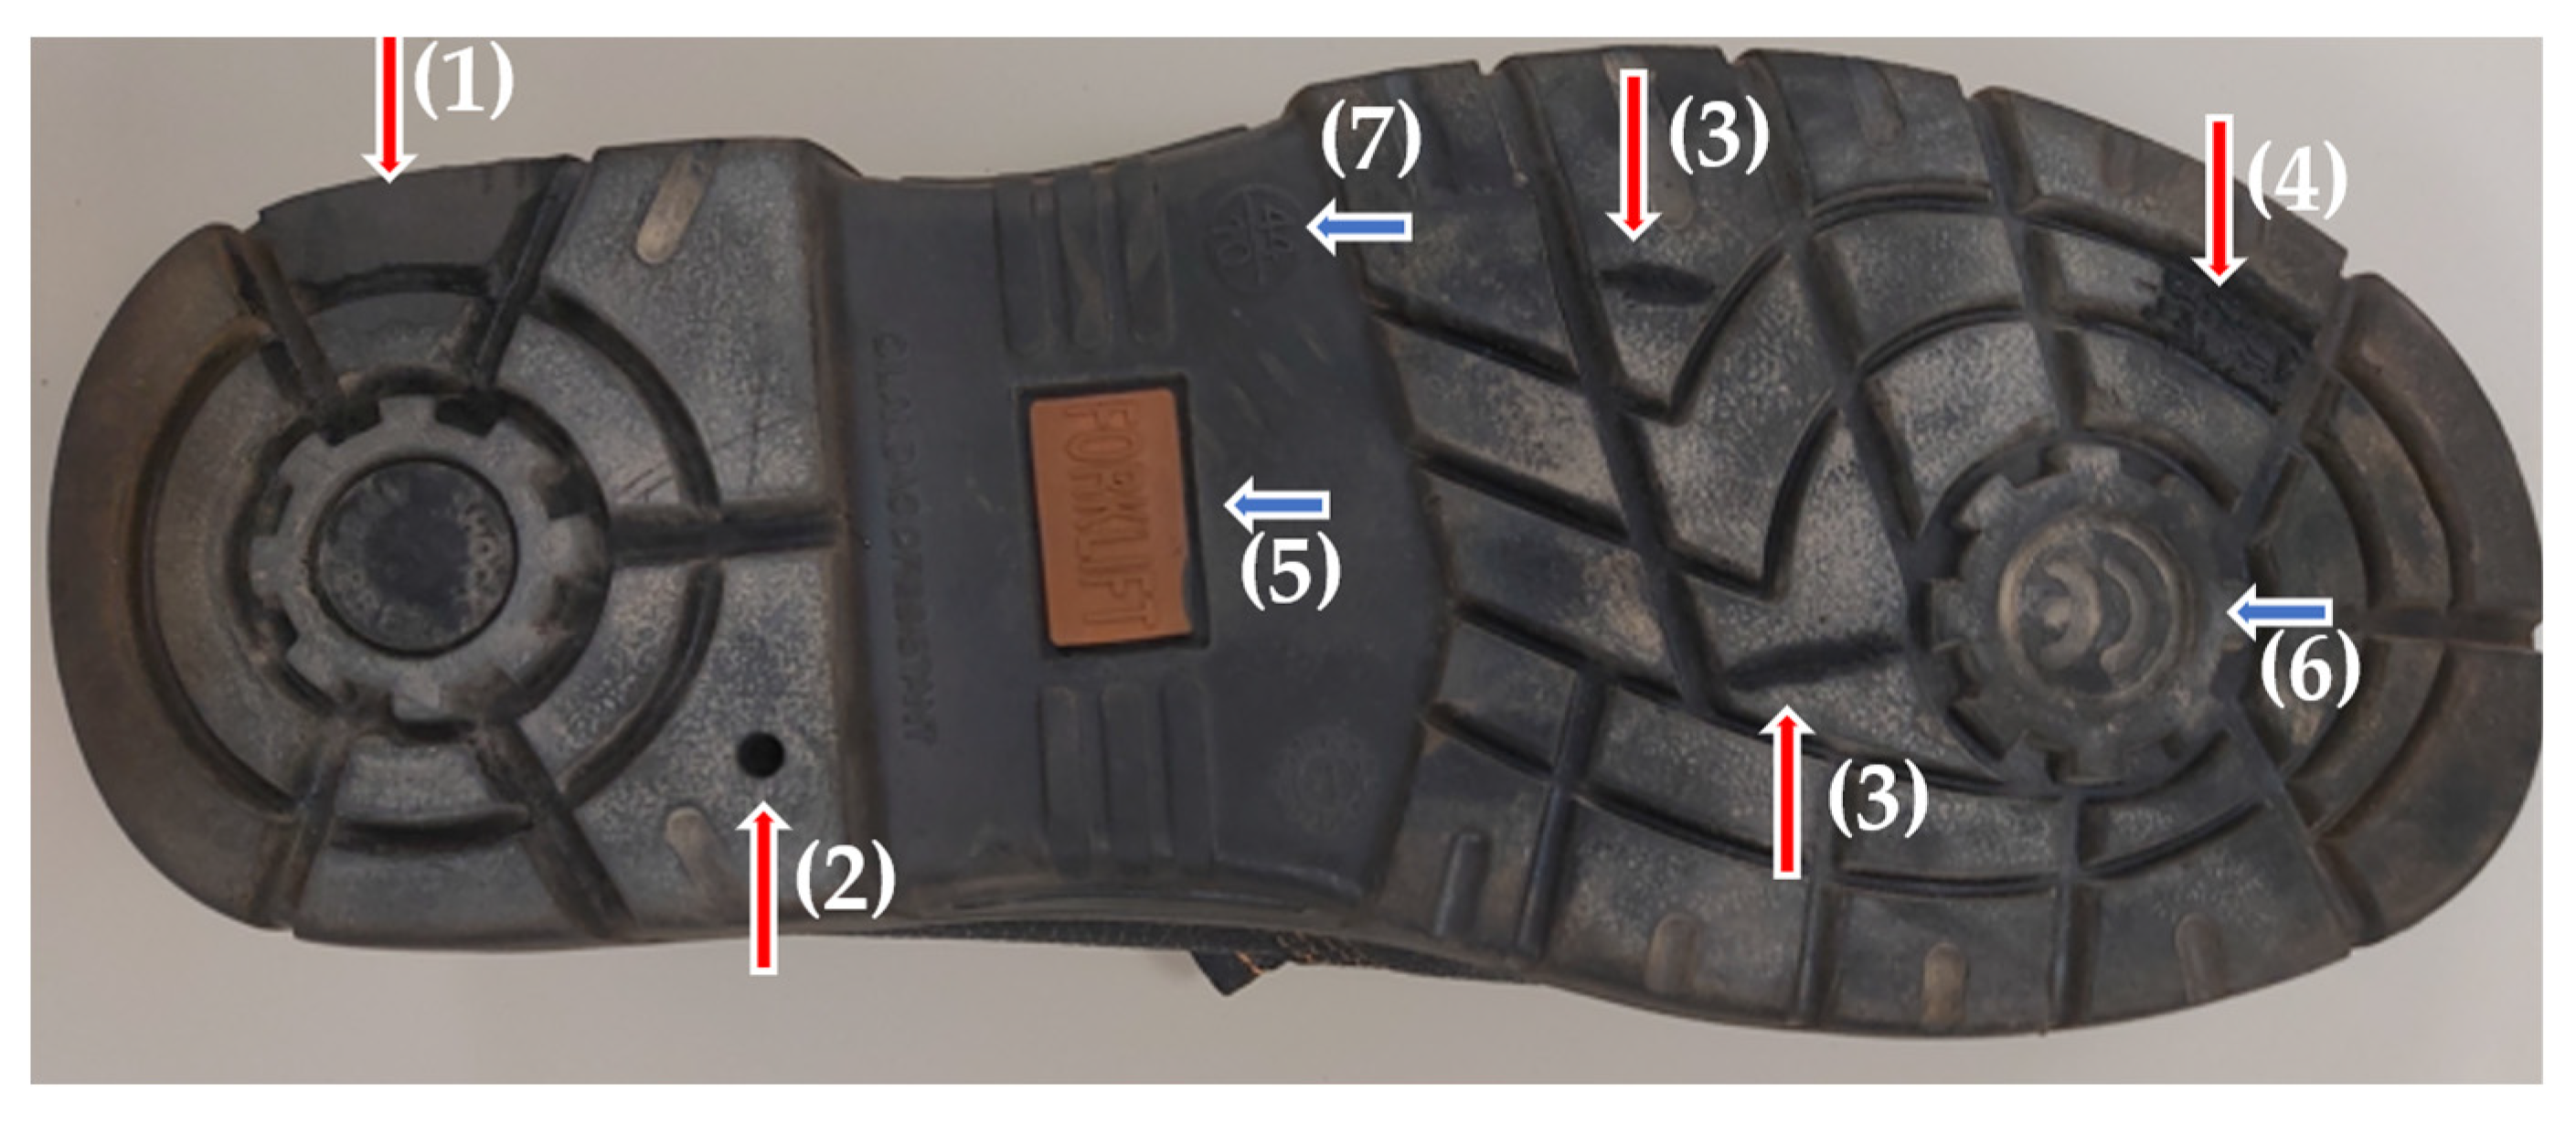
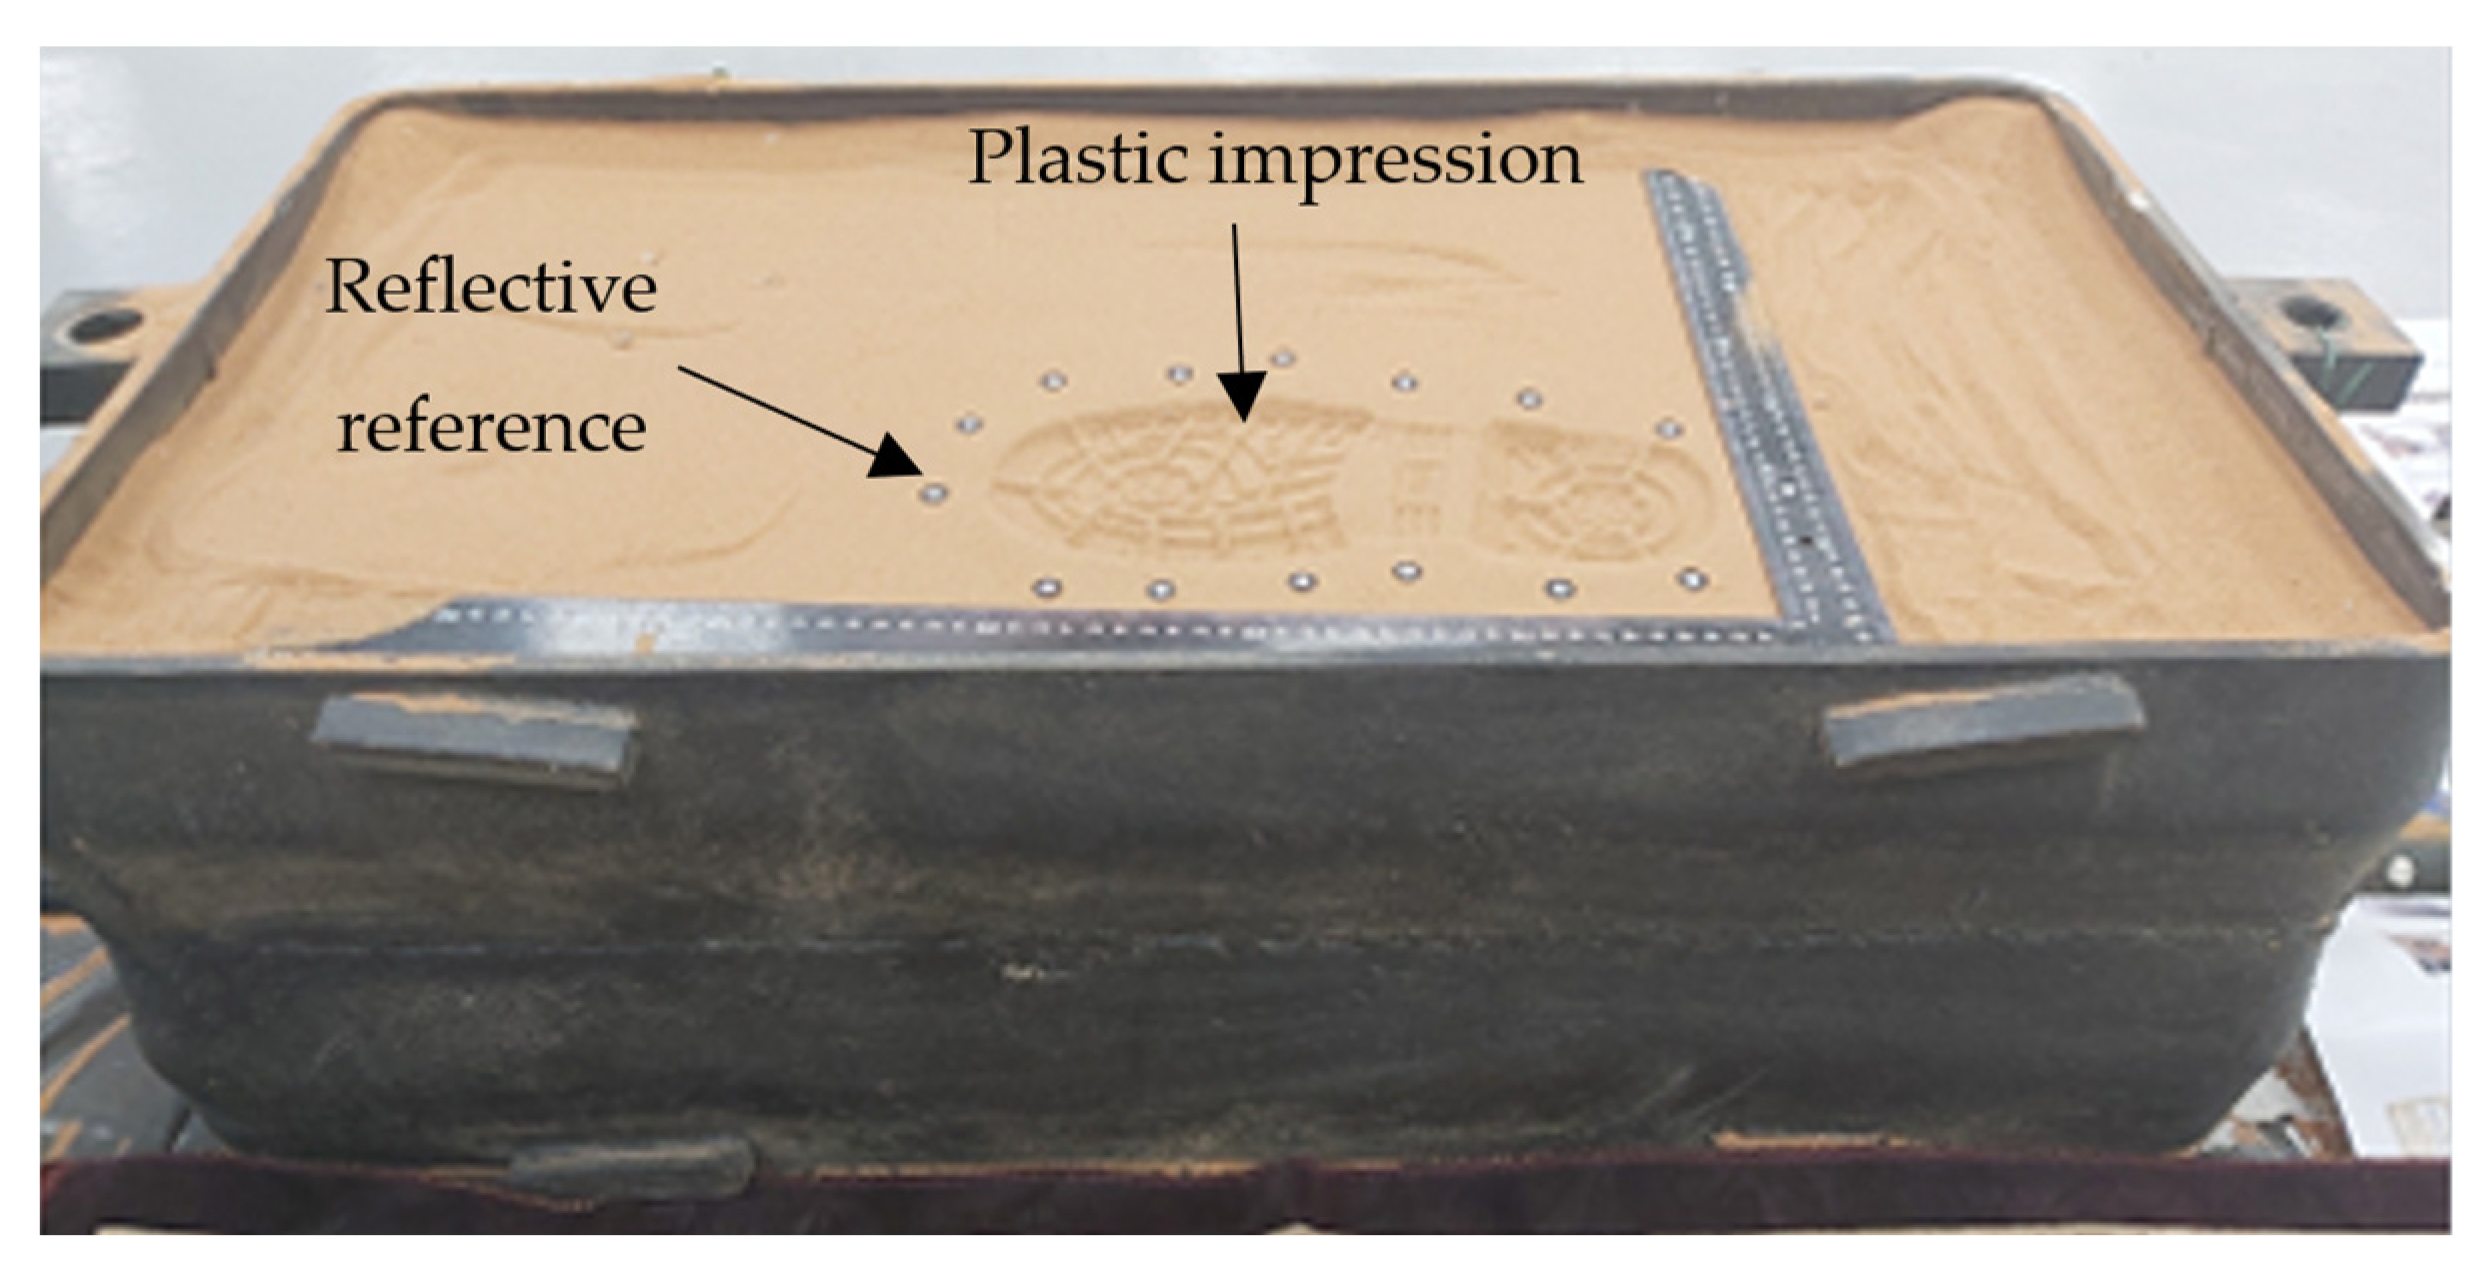
A footwear impression was made indoors in a shallow sandbox (0.8 m long, 0.5 m wide and 0.4 m depth) filled with local dry sand under uniform light using a right-side footwear outsole (Male, European Size 44) shown in Figure 6. Artificial damage features including scratches, wear, hole and two cuts with different sizes, shapes and complexity were made on the outsole before making the impression. Once the impression was created (see Figure 7), it was scanned with the five different non-contact surface scanning systems. Afterwards, the impression was also casted using POP to contrast the 3D reconstruction quality obtained by conventional casting with that obtained by 3D scanning data and its corresponding 3D printed replicas.
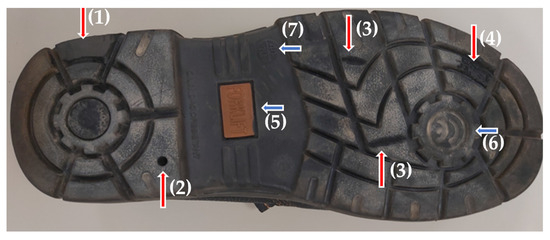
Figure 6.
The reference footwear. Vertical red arrows refer to the artificial individual characteristics: (1) wear, (2) hole, (3) scratches and (4) cut. Horizontal blue arrows refer to class characteristics: (5) brand name, (6) logo, and (7) size.
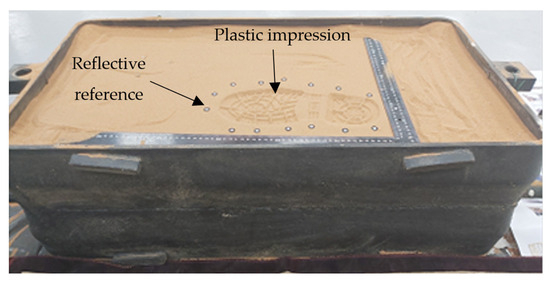
Figure 7.
The footwear impression in the sandbox. The white target dots are reflective reference points used by 3D laser scanner to generate 3D coordinates.
Handheld 3D Laser Scanning (HandySCAN 307, Vxelements)
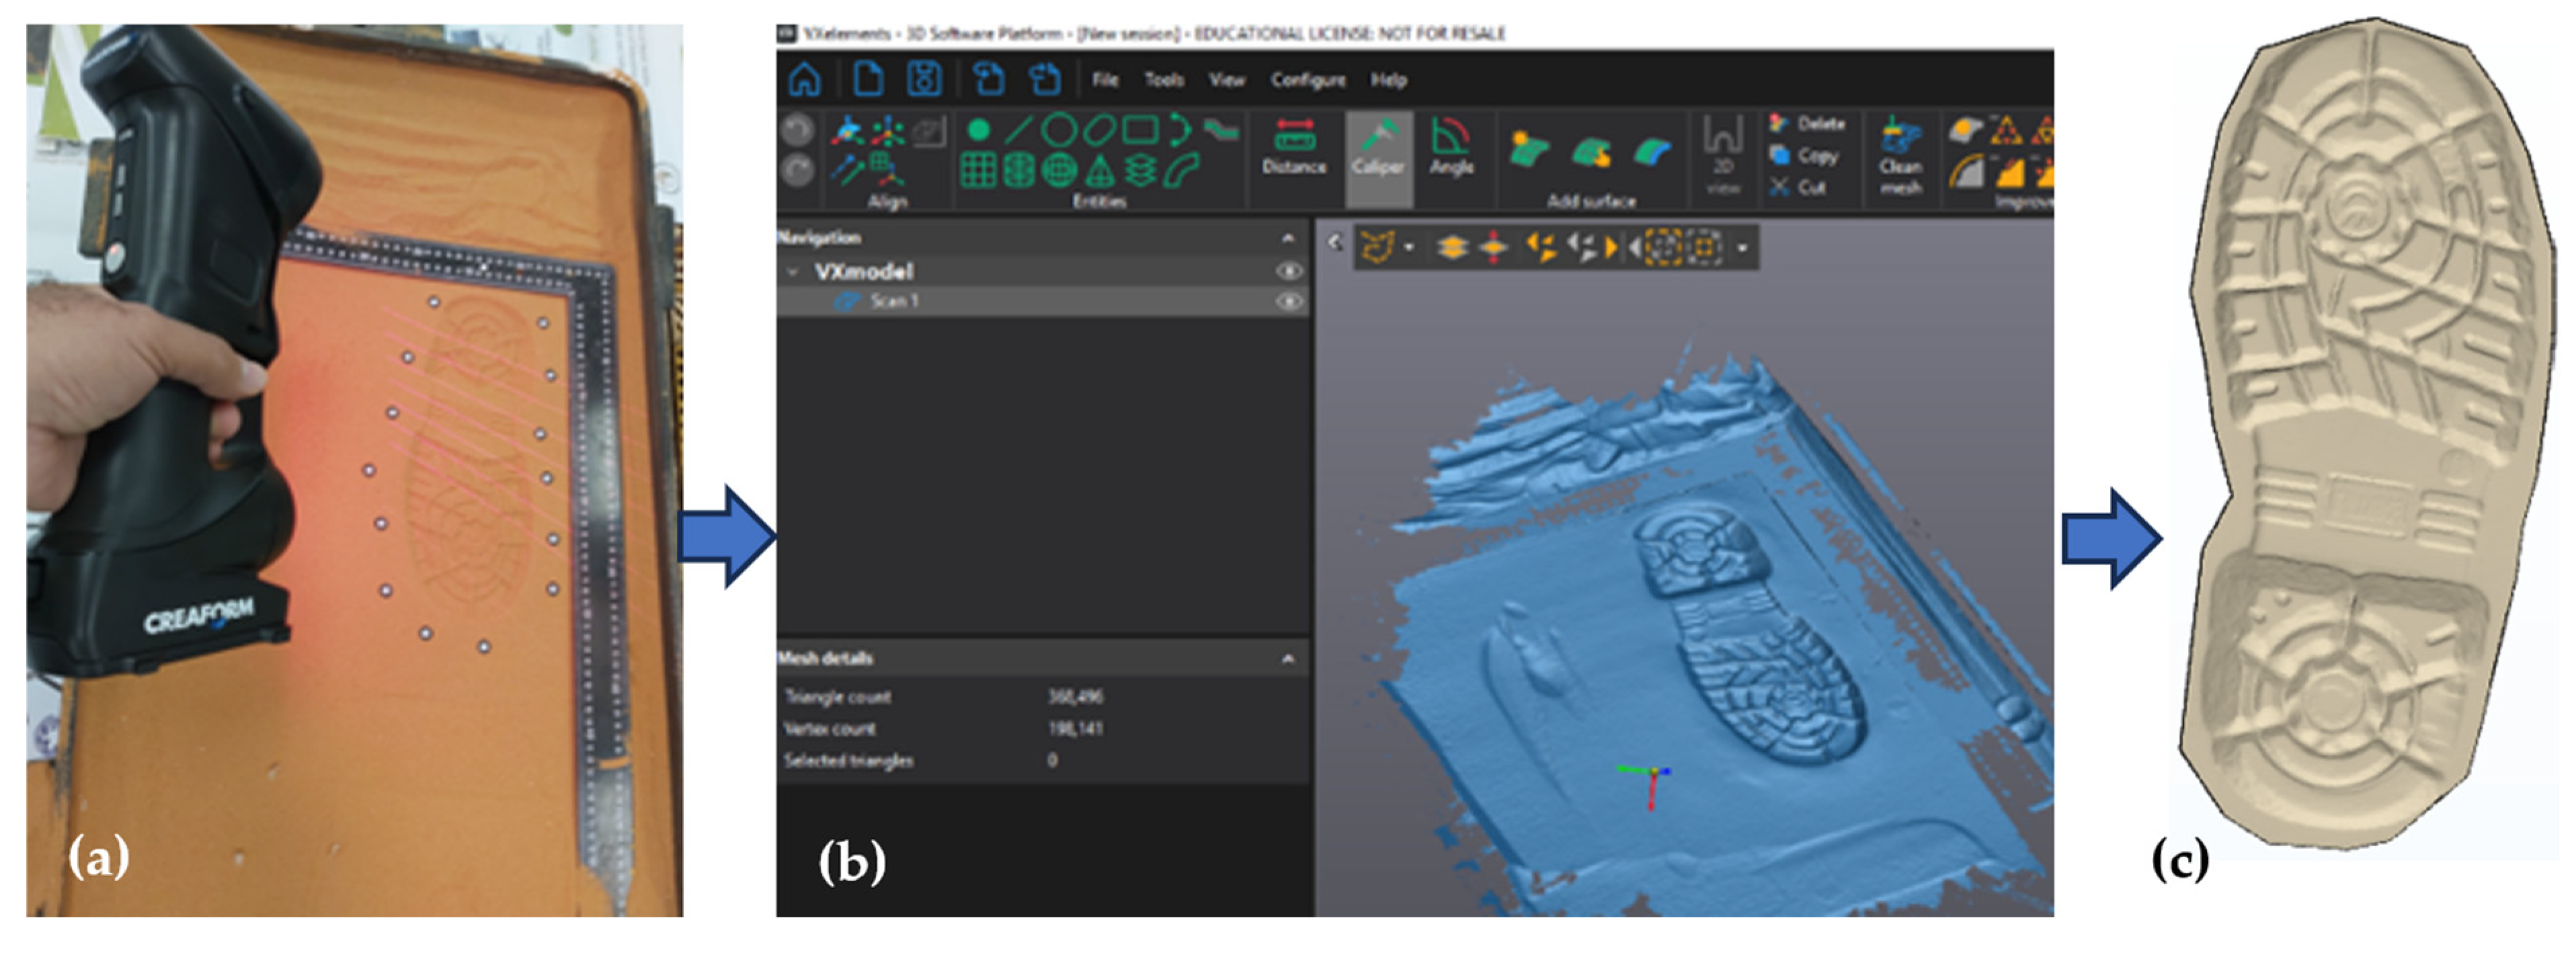
The workflow of 3D reconstruction of footwear impression by laser scanner is illustrated in Figure 8. The outsole impression was scanned by HandySCAN 307 (Creaform, Levis, QC, Canada) handheld 3D laser scanner at a resolution of 0.1 mm (see Figure 8a) through capturing 3D data approximately 360° of the impressions. The scanner was first calibrated prior to scanning using the specific calibration board and the calibration tool within the accompanied Vxelements 10 software. During scanning, the optimal location for the scanner was insured to guarantee a maximum coverage and accuracy through the flashing LED display that changes colors depending on the distance between the scanner and the impression. After impression was scanned, the accompanied Vxelements (Creaform, QC, CA) software used the captured raw data to generate a high-quality surface mesh model by using powerful surface construction algorithms (see Figure 8b). The final model, after removing surrounding artifacts, was saved in STL format (Figure 8c). The scanning process lasted for 5 min, with an additional processing time of 3 min, and the market price of the scanner starting at USD 21,900.

Figure 8.
Workflow of footwear impression 3D reconstruction using HandySCAN 307 laser scanner: (a) scanning; (b) image processing; (c) impression model.
Structured-Light Scanning (EinScan-SP, EXScan S)
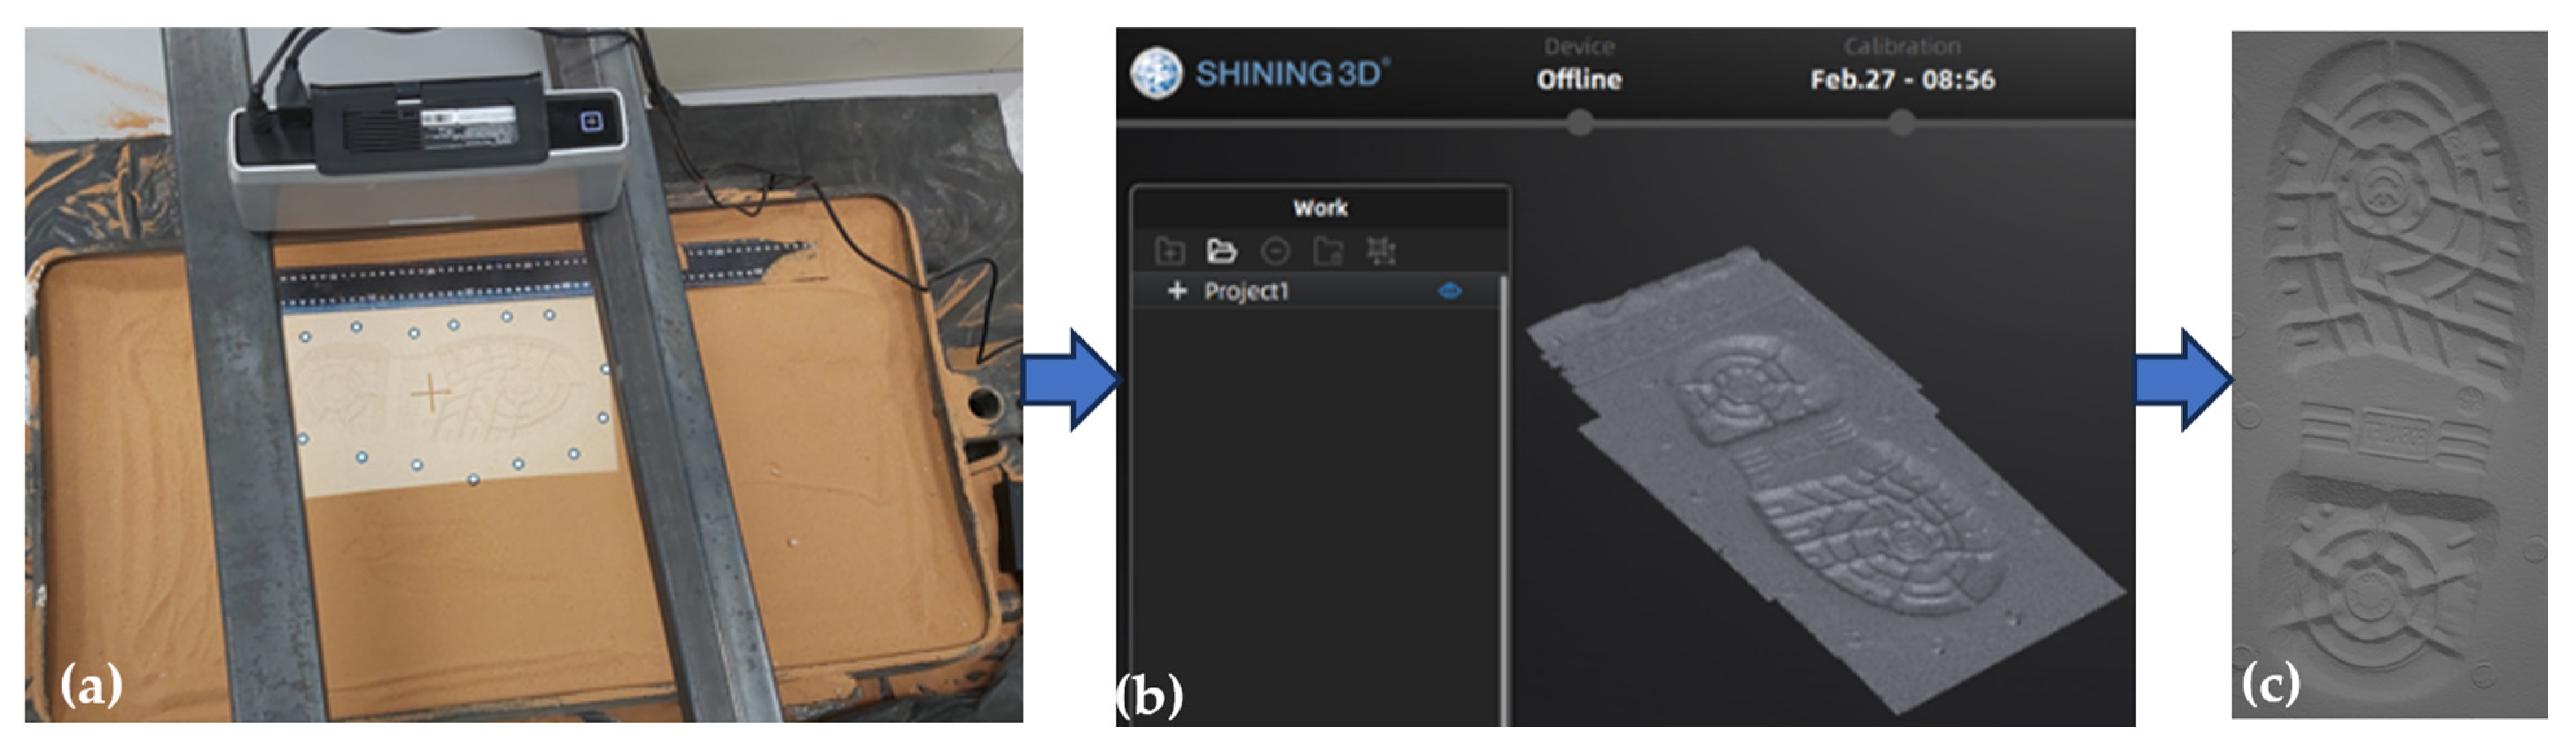
The 3D scan of impression was carried out by using the white-light EinScan-SP 3D scanner (SHINING 3D Tech, Hangzhou, China) at a single-shot accuracy of ≤0.05 mm. the scanner equipped with 1.3 MP resolution camera and white-led light source and calibrated according to manufacturer instructions before scanning. The scanner was mounted on a custom mount at 700 mm from the impression (Figure 9a). Acquired data were processed using the associated software (EXScan S, Shining 3D) (Figure 9b). The scan was then edited to remove excess data and the final model saved in STL (Figure 9c). The scanning process lasted 20 min, with an additional 8 min needed for processing, and the scanner starts at a price of USD 2199. The workflow of 3D reconstruction of footwear impression by SL scanner illustrated in Figure 9.

Figure 9.
3D reconstruction of footwear impression by using the EinScan-SP structured-light scanner: (a) scanning; (b) image processing; (c) impression model.
Smartphone Photogrammetry (Samsung A70, Recap Photo)
The procedure of 3D reconstruction of footwear impression by using Recap Photo photogrammetry is illustrated in Figure 10. The impression was photographed in line with photogrammetry guidelines of Autodesk Recap v2023 Photo web-based professional photogrammetry software (Figure 10a). This includes taking a minimum of at least 20 photographs of from varying oblique angles of ≈0°, 20° and 40° and directly above the sandbox, ensuring all photos overlaps. A scaled ruler was placed next to the impression. Photogrammetry performs well in area of interest with color variability which allowing features to be acquired easily. So, a textured mats were placed around the sandbox to increase the acquisition quality. In total, 226 photos with resolution 1080 × 2400 pixels were captured by Samsung Galaxy A70 smartphone equipped with 32 MP main camera resolution. Following photography, the photos were processed in Autodesk Recap Photo (Autodesk Inc., One Market Plaza, San Francisco, CA, USA) (Figure 10b). The photos were first uploaded to Recap Photo and the project was submitted to Autodesk cloud server and data were then processed on the cloud server. Recap built the mesh model, removed excess geometry before building the final impression model, then the model was scaled to the real dimensions based on the scale ruler. Finally, the high-density triangulated mesh file was downloaded from the server in (.STL) format (Figure 10c). The acquisition lasted for 3 min, processing requires 90 min, and the monthly cost for ReCap Pro is USD 50.
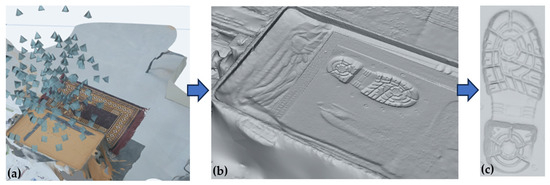
Figure 10.
3D reconstruction of footwear impression by photogrammetry using Autodesk Recap Photo: (a) Taking a series of overlapping photos; (b) image processing; (c) impression model.
Microsoft Kinect v2 Depth Sensor (Kinect v2, Kinect Fusion Explorer)
Steps of 3D reconstruction of footwear impression by Microsoft Kinect v2 depth sensor illustrated in Figure 11. Microsoft Kinect v2 depth camera (Microsoft Inc., Redmond, WA, USA) was used to scan the impression (Figure 11a). It features an HD color camera with RGB resolution of 1920 × 1080 pixels and a 512 × 424 pixels ToF depth sensor resolution, horizontal field of view of 70.6° and 60° and frame rate of 30 frames per second (fps) which acquiring 217,088 colored 3D points every frame. The stand-off distance between the impression and Kinect sensor was kept about 0.5 m due to the limitation of minimum range of Kinect and impression was placed in center in the frame of view of the Kinect sensor. The data collected from Kinect device were processed simultaneously using Kinect fusion explorer application in the free Kinect for Windows Development Kit (SDK) 2.0 software (Figure 11b) and saved in (.STL) format (Figure 11c). The acquisition and processing time was 2 min, and the market price of the Microsoft Kinect v2 is approximately USD 200.
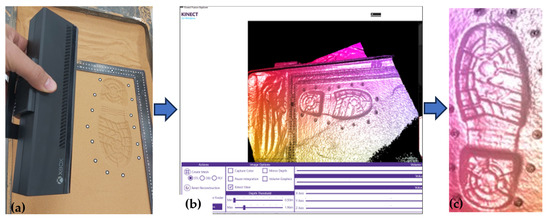
Figure 11.
3D reconstruction of footwear impression by Microsoft Kinect v2 depth sensor: (a) scanning; (b) image processing; (c) impression model.
iPhone’s LiDAR (iPhone 13 Pro, Polycam)
iPhone 13 Pro with iOS 15.4.1 was used in combination with the Polycam 3D Scanning App for the scanning of the impression. The iPhone 13 Pro released on September 2021 and features a 12 MP camera system that contains three different cameras (1x telephoto, 1x wide, and 1x ultrawide camera), a flashlight and a LiDAR sensor on the backside of the phone (Figure 12a). Polycam app processes data in cloud and the user has control over Depth Range, Voxel Size, and Simplification in the processing options. A maximum depth range of 0.5 m, a voxel size of 2 mm, and a simplification 0% were chosen to generate a high-quality point cloud. Polycam is free to use but it requires a paid license (costs USD 7/month) to allow exporting the scan data in different formats. Figure 12 shows the main features of iPhone 13, 3D reconstruction scene of footwear impression by in Polycam app and the final impression model. The acquisition and processing time was 4 min.
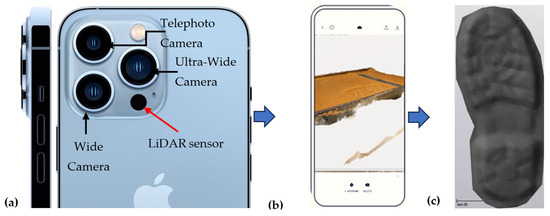
Figure 12.
(a) The main features of the LiDAR system in iPhone 13; (b) the 3D reconstruction scene of footwear impression by in Polycam app; and (c) impression model.
After completing scans with the five different techniques, the resulting 3D models in (.STL) format were imported into Vxelements. To ensure consistency in engineering measurement units, the models from Kinect v2 and iLiDAR were scaled by a factor of 1000. Manual pre-alignment of meshes was performed in Vxelements using set landmarks, followed by the application of the best-fit tool to align all meshes accurately, minimizing manual errors and ensuring reliability in mesh superimposition. Additionally, models were uniformly trimmed to achieve similar surfaces and prevent errors arising from meshes with varying boundaries. Vxelements was selected to align all the meshes because it provides robust tools for precise alignment, which is crucial for ensuring the accuracy of subsequent analyses.
2.1.2. 3D Footwear Impression Models’ Comparison
A Side-by-side morphometrical comparison of the known footwear outsole and surface models of footwear impressions were carried out for qualitative comparison. In addition, to provide a quantitative comparison, the five aligned impression mesh models were subjected to comparative deviation analysis using 3-matic research (Version 12.0; Materialise, Leuven, Belgium), a 3D point cloud and mesh processing software to quantitively determine how much difference between the meshes generated compared to the benchmark reference geometry as an indication of how the characteristics of the footwear outsole are similar represented in the impression evidence. 3-matic offers advanced features tailored for detailed deviation analysis. It installed on a 64-bit Windows 10 Laptop with Core i7-7500U CPU, 12 GB of RAM memory and AMD RADEON 530 (4GB DDR3 video memory). The best device in terms of absolute metrological result will be used as a benchmark reference for testing the reconstruction quality of the other four scanning modalities. The obtained shape deviation results are presented as the mean, SD, RMS and max/min deviations for 100%, 98%, and 88% data percentages and in color maps with gradient color-coded scale linked to differential values and statistical values.
2.1.3. 3D Printing of 3D Footwear Impression Models
An as-built positive copies of footwear outsole impression models replicating the reference outsole’s surface topography were 3D printed using the fused deposition modeling (FDM) AM technique. First, in 3-matic, impression surface models were thickened to 6mm from the impressions’ front side, then each model was prepared for printing using the open-source Ultimaker Cura software (v4.10; Ultimaker, Utrecht, The Netherlands) through selecting machine type, part orientation, material type, process parameters, slicing, toolpath creation and G-code generation. Using the G-code, each model was printed in full size with Delta WASP 4070 (Massa Lombarda RA, Italy) FDM 3D printer using a polylactic acid (PLA) material (eSun Ltd., Shenzhen, China). Main PLA properties and printing process parameters are shown in Table 1 and Table 2, respectively. Figure 13a–f concludes the overall workflow of 3D digital reconstruction and 3D Printing of the plastic footwear impression models.

Table 1.
Properties of 3D printed PLA based on the manufacturer’s data.
Table 2.
FDM process parameters.
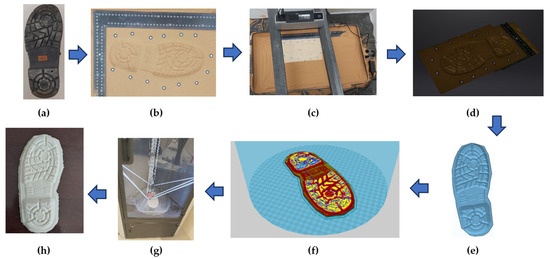
Figure 13.
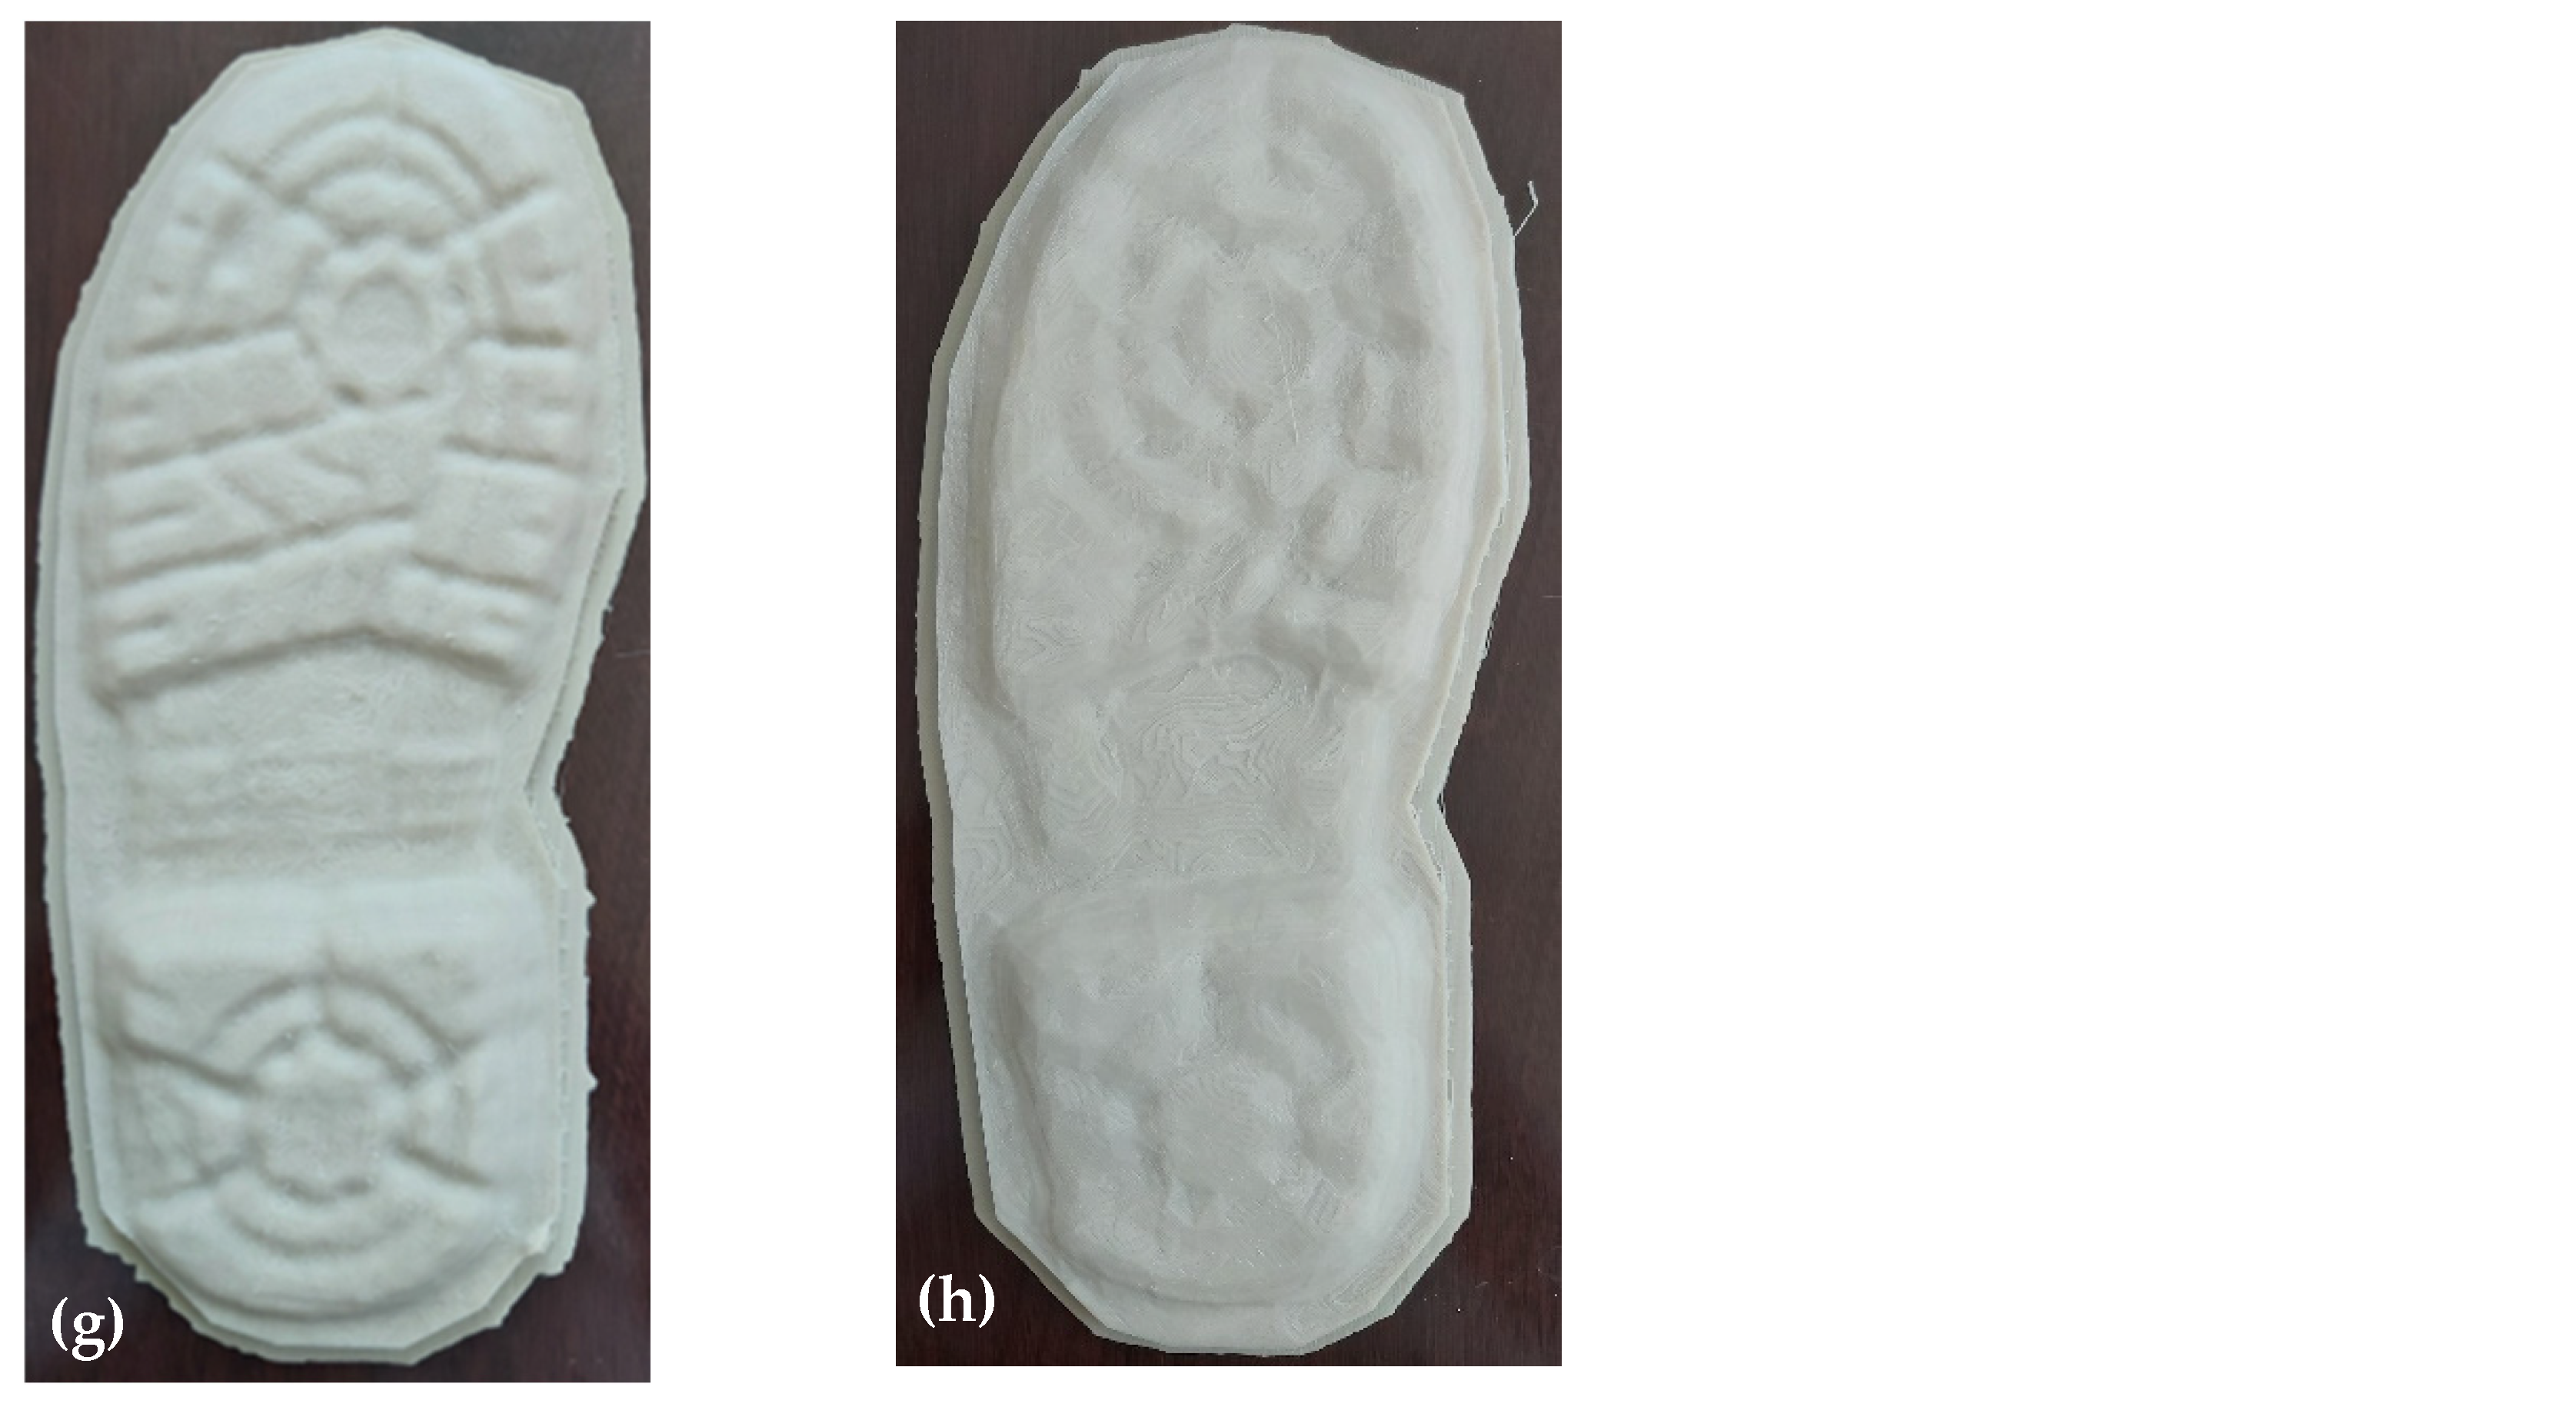
Workflow of 3D digital reconstruction and 3D Printing of the plastic footwear impression models: (a) the reference footwear outsole, (b) impression, (c) 3D scanning, (d) processing, (e) final impression model, (f) preparation for printing, (g) 3D printing of 3D footwear impression, and (h) the 3D printed final impression.
2.1.4. Traditional Casting of 3D Footwear Impression
After photographing and 3D scanning the impression with five different technologies, it was cast using a homogeneous slurry of 4 parts water to 7 parts Plaster of Paris (POP) powder. The POP slurry was mixed in a large Ziploc bag for approximately two minutes, then poured onto the impression surface to achieve the desired thickness. After thorough hardening, the cast was carefully removed from the substrate and carefully cleaned using a soft brush.
2.2. 3D Reconstruction of 2D Latent and Visible Impression Evidences
Part 2 involved the proposal of two procedures for 3D digital and physical reconstruction of 2D latent impression and visible impression evidences, respectively based on a single high-quality 2D image. The procedures aim to extend and support the current practice of impression evidence analysis based on 2D photography only through involving a 3D representation of the evidence. This kind of visualization allows for interactive investigation of the evidence.
2.2.1. 3D Reconstruction of Latent Impression
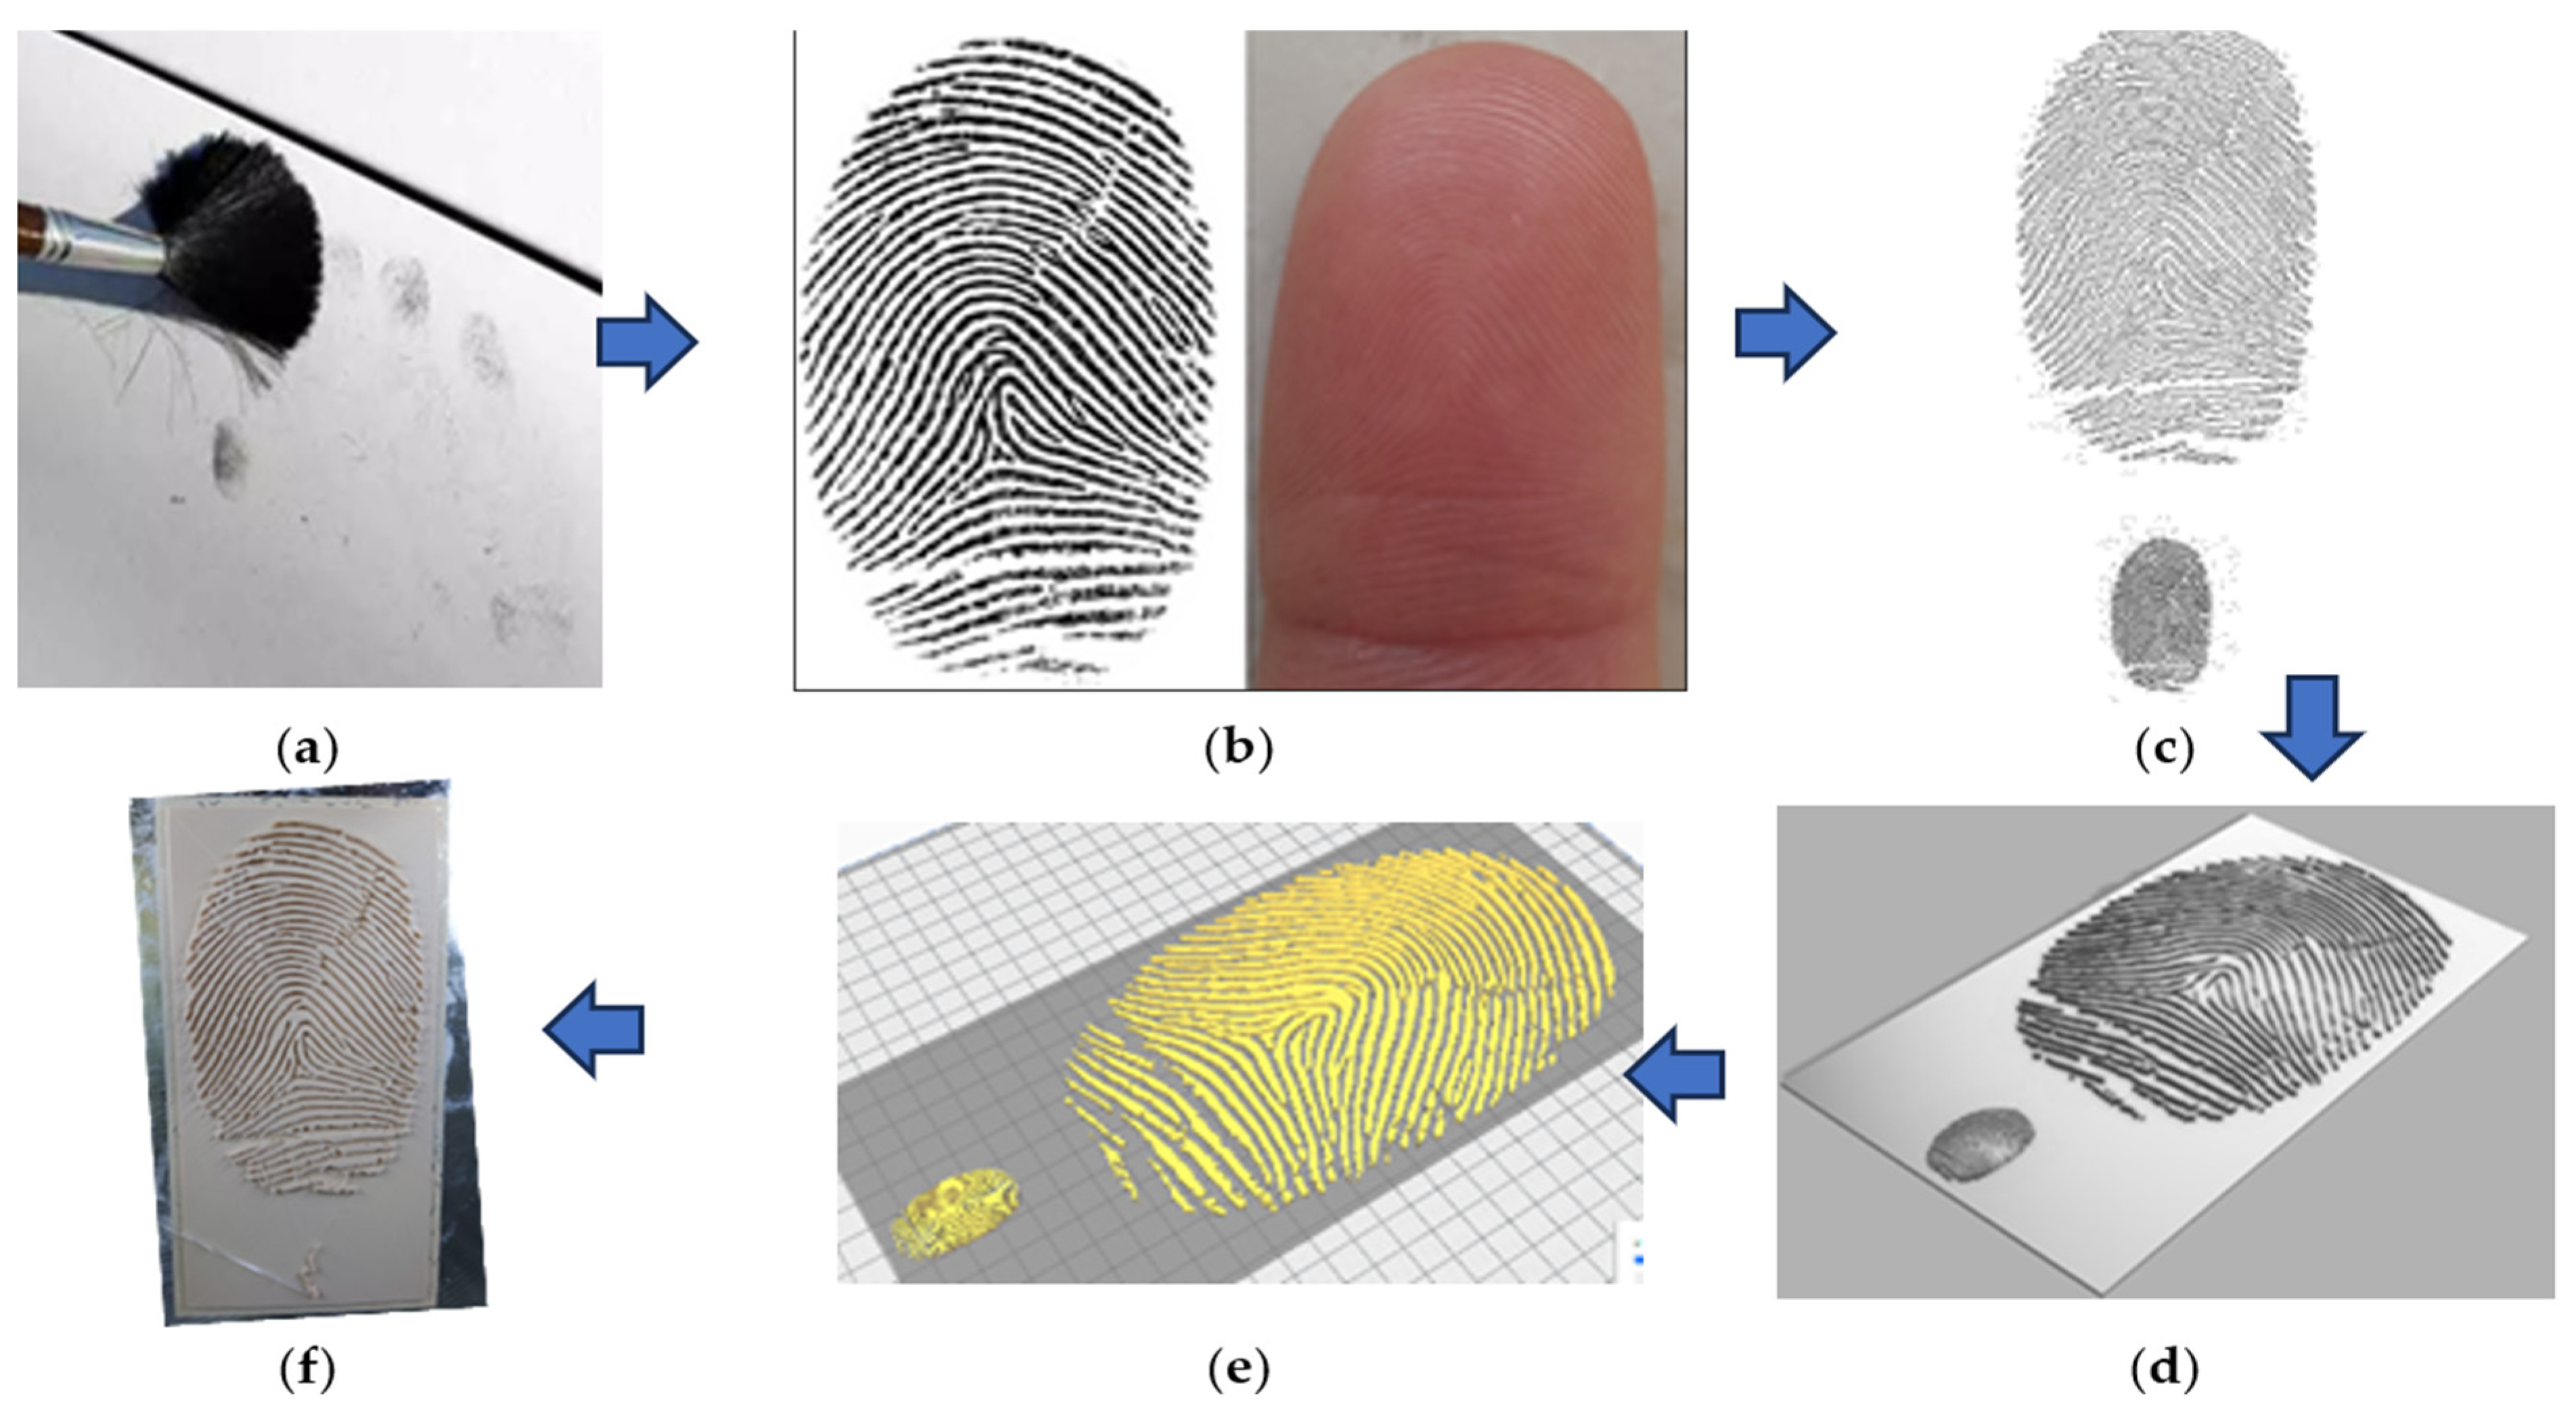
For latent impression, the 3D reconstruction and 3D printing of the 3D latent impressions were carried out based on the workflow shown in Figure 14. Fingerprint impression was selected as a representative of laten impression as it is the most common latent impression type. As a first step, after lifting the fingerprint at crime scene (Figure 14a), the fingerprint image was subjected to vectorization. In this research, a fingerprint impression image adopted from Priesnitz et al. [29] (Figure 14b) was used, then vectorized using Inkscape, an open-source vector graphics editor software (Figure 14c). Vectorization is the process of converting elements of a pixel-based raster image into a series of mathematically defined points, lines, and curves. There exist many alternative vector graphics software as free/open-source and commercial packages for vectorization such as ScienceGL, Adobe Illustrator, OpenVG, Affinity Designer, and more. The vectorized fingerprint image file was then imported to Solidworks 3D modeling CAD software (Dassault Systèmes, Vélizy-Villacoublay, France), and applied on a pre-modeled substrate with the preferred size. The pattern of the fingerprint impression was maintained with same real-life size and an additional copy of the pattern was scaled up 6 times to evaluate the manufacturability of real size and scaled fingerprint using FDM. Digital and physical scaled up models are useful for easier examination to ensure accurate pattern matching. Both actual life-size and scaled pattern copies were extruded to height of 4 mm above the substrate (Figure 14d). Once the vector was extruded and 3D model was created, details such as coloring, lightening can be applied to the model for better realistic visualization. The file was then saved as (.STL) file and imported to Ultimaker Cura for preparation for 3D printing (Figure 14e). Finally, the model was 3D printed with WASP 4070 fused deposition modeling (FDM) 3D Printer using a polylactic acid (PLA) material (E-SUN) utilizing same process parameters mentioned previously (Figure 14f).

Figure 14.
Workflow of 3D reconstruction and 3D Printing of 2D latent fingerprint impressions: (a) lifting the fingerprint at crime scene; (b) fingerprint image preparation and enhancement (adopted from Priesnitz et al. [29] with permission from Elsevier); (c) generation of 2D vector model; (d) create 3D CAD model; (e) STL model slicing and toolpath generation; and (f) 3D printing the impression in different scales.
2.2.2. 3D Reconstruction of Visible 2D Impression
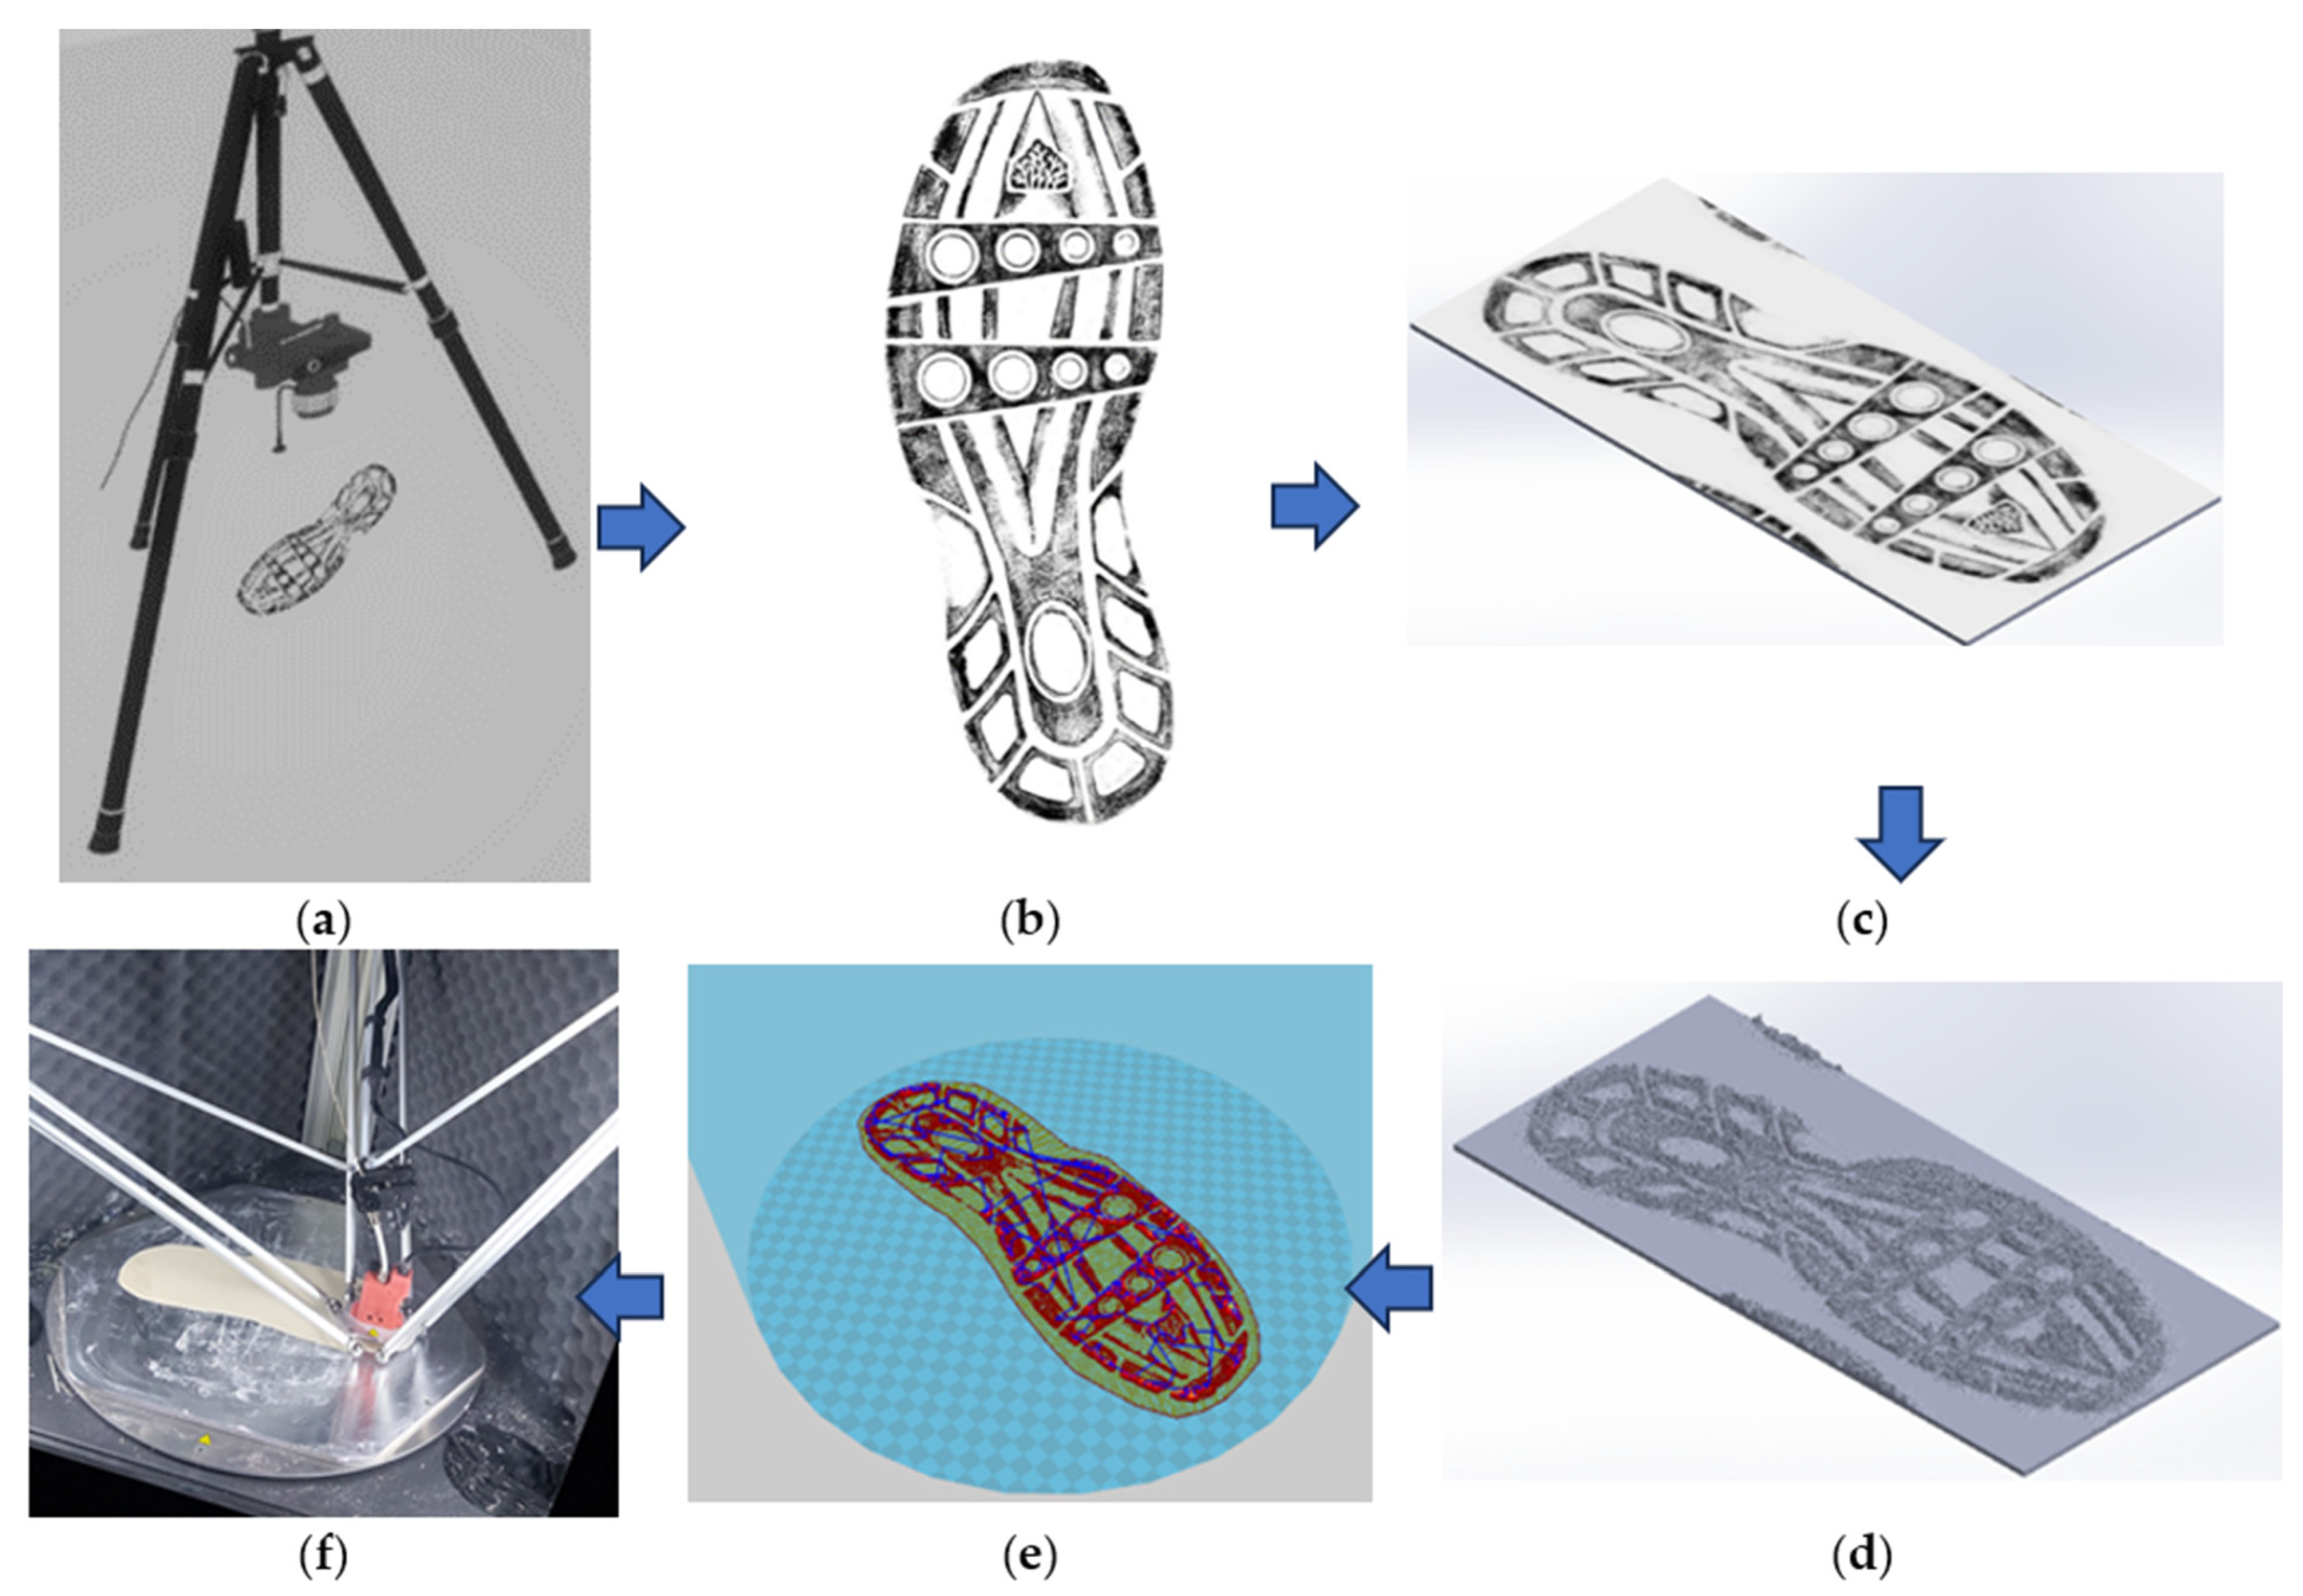
For visible 2D impression, the 3D reconstruction and 3D printing of a visible 2D footwear outsole impression was carried out based on the workflow shown in Figure 15. First, an examination quality photograph of the 2D visible impression should be acquired (Figure 15a). In this research, A greyscale image of a known visible 2D footwear outsole impression with a common primitive shape adopted from Tang and Srihari [30] (Figure 15b). A handful of databases of reference footwear and real crime scene footwear impressions that can also be used in this procedure were available for public use for example at (https://4n6chemometrics.com/Downloads/WVU2019/, accessed 23 April 2024;) which developed by Lin et al. [31], and the one developed by Kortylewski et al. [9]. Secondly, a suitable size substrate was created in Solidworks and the 2D impression image was imported and correctly applied and oriented onto the substrate surface (Figure 15c). After the image has been applied, Solidwork’s 3D texture tool was used to transform the textural (Height Map) appearance of the outsole into 3D geometry based on the color gradient in the greyscale image. The gradient between white and black is used to represent height, where white pixels represent height of zero, and black pixels represent maximum desired height and gray falls in between. Once the outsole image is mapped to preference, desired depth was set, and 3D texture mesh was generated and refined (Figure 15d). The generated 3D texture was in the form of a mesh body and can be used as the basis of solid body modeling, 3D printing, CNC manufacturing or rendering. Figure 15e,f shows file preparation for 3D printing and 3D printing of the impression using FDM. It is worth mentioning that other modeling software have functionality of 3D texturing tool including commercial packages, such as materialize 3-matic, ImageJ, sketchUP, Meshmixer, Rhino3D, Blender, Corel PhotoPaint, and Photoshop can be used as alternative to Solidworks in this workflow.

Figure 15.
Workflow of 3D reconstruction and 3D Printing of a 2D visible impressions: (a) Photographing the shoe print at crime scene; (b) preparing the image and applying enhancements, if necessary (impression adopted from [30], with permission from Elsevier); (c) photograph Applied to substrate surface in Solidworks; (d) generating 3D CAD model by 3D texture tool; (e) STL slicing, toolpath and G-Code generation in Cura; and (f) 3D printing of the model.
In addition to the previous known impression example, using the same procedure, the unknown visible 2D footwear outsole impression images can be also reconstructed. In this research an unknown visible 2D footwear outsole impression adopted from Farrugia et al. [32] was also used as the starting step in the introduced methodology.
The proposed procedure’s concept is comparable to the approach introduced by Yang et al. [33] to construct and 3D print of 2D DIC speckle dot pattern that represents the deformation behavior of test sample surface, and similar to the methodology introduced by Horowitz and Schultz [34] to generate 3D reconstruction and 3D printing of terrain models from 2D geo maps.
3. Results
3.1. 3D Reconstructions of Plastic Footwear Impression
3.1.1. The Overall Reconstruction Scene of the Footwear Outsole Impression
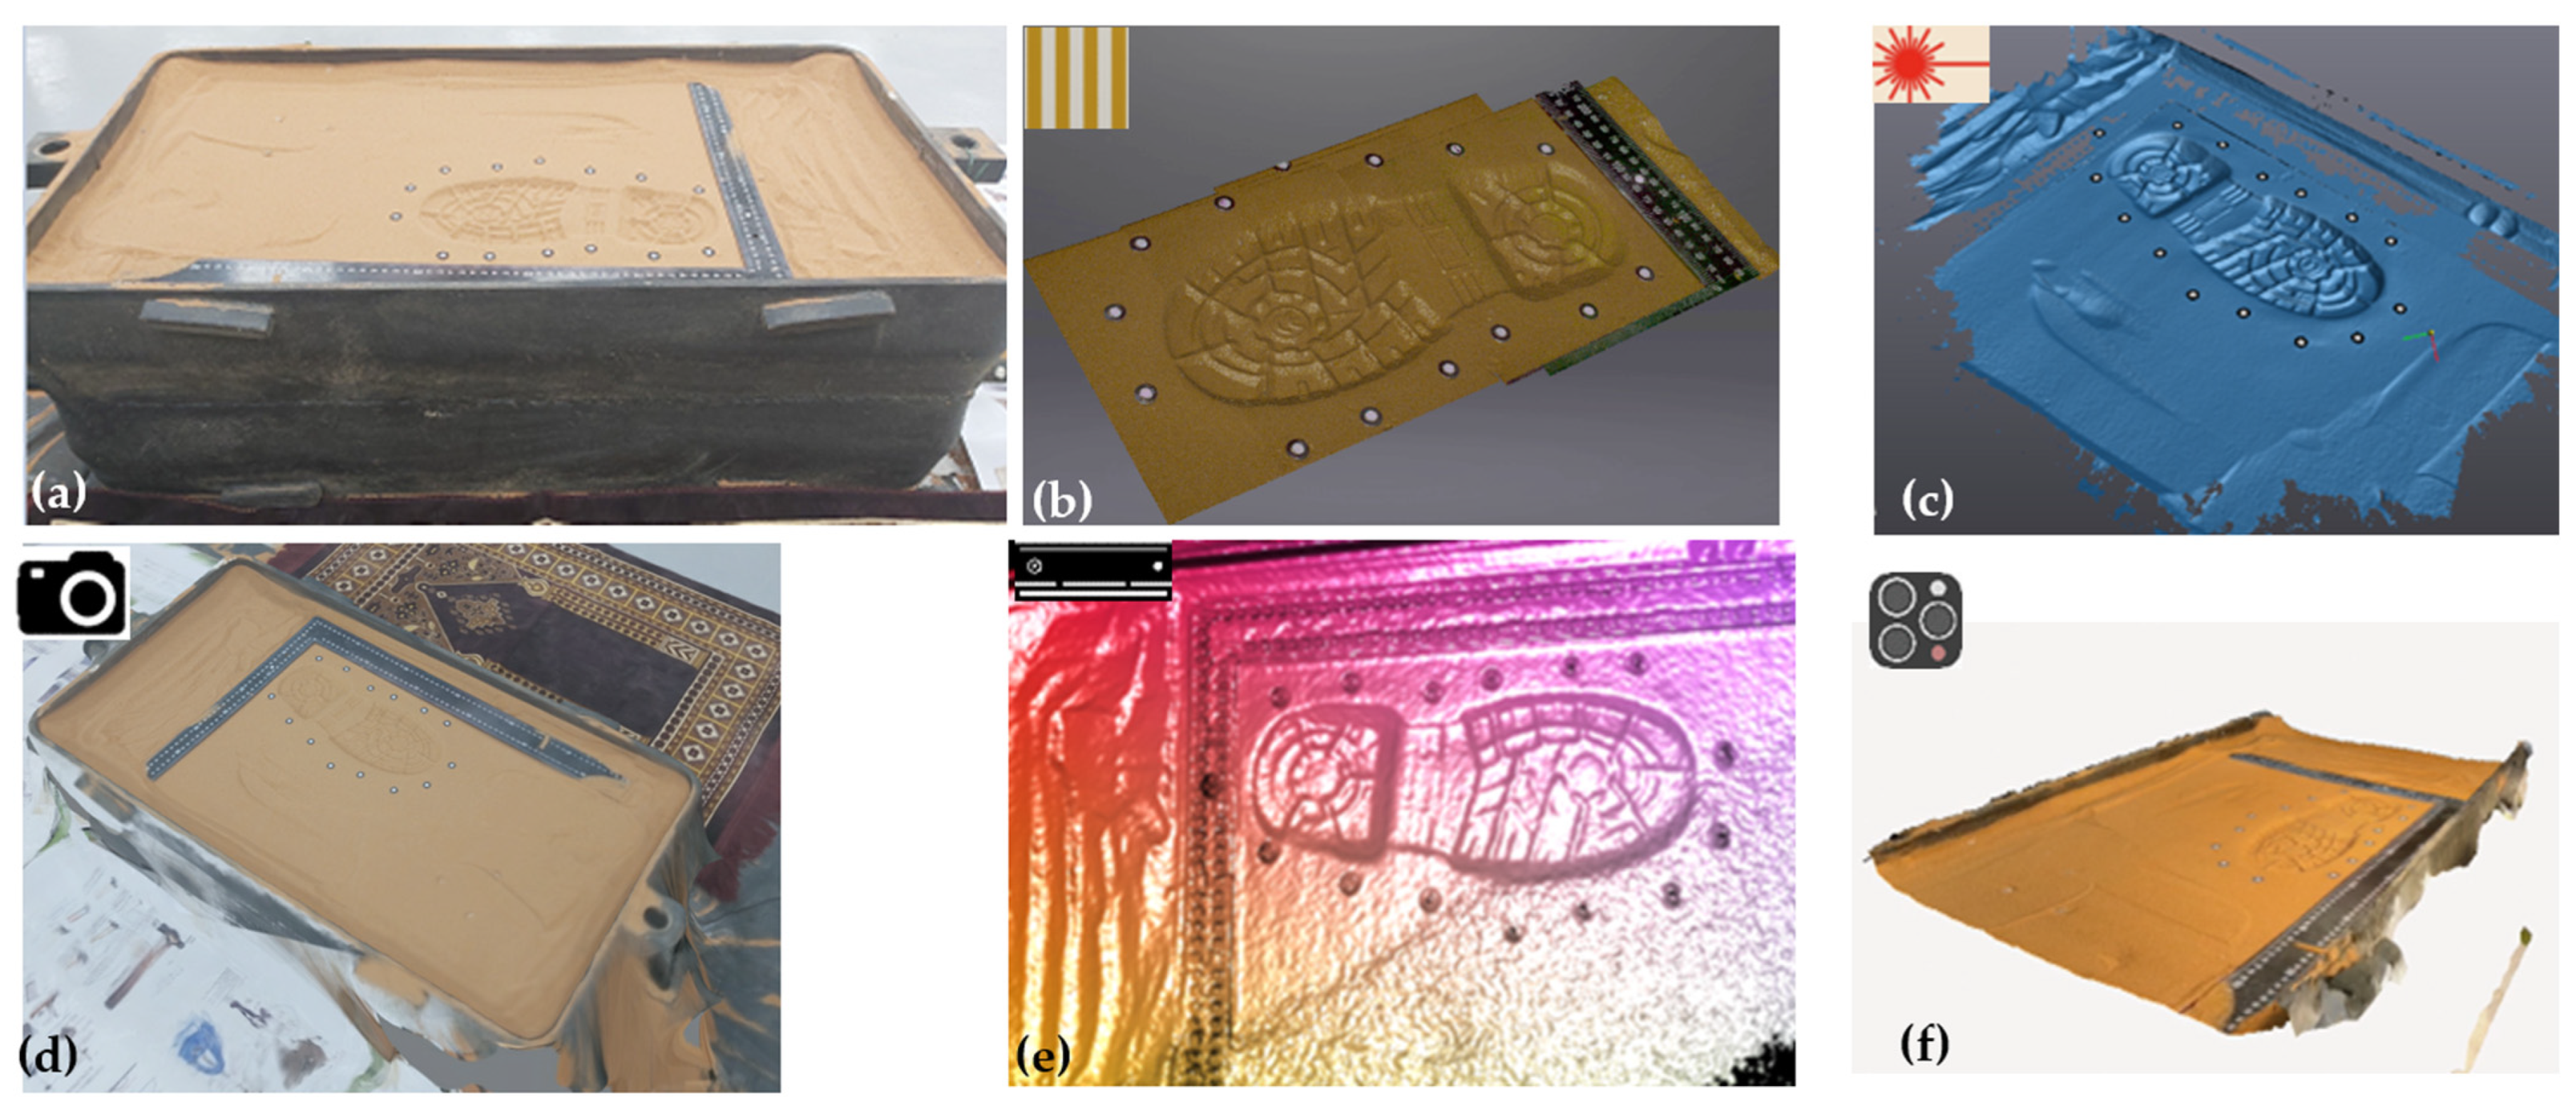
In reverse engineering, while texture acquisition has been less emphasized than geometry acquisition, utilizing 3D textured data from crime scenes with various viewing angles, illumination levels, scaling, mirroring, zooming, rendering, and animation capabilities greatly enhances the realism of reconstructed scenes. This approach holds promise for leveraging textured data in virtual/augmented reality to improve forensic visualization and analysis [6,35]. Additionally, in crime scenes with footwear impression evidence, scanned overall reconstruction scene data offer several advantages. They cover large areas, including sequences of footwear prints, spatial gait parameters like step and stride lengths, and path direction. Integration of temporal crime issues is also possible. Figure 16 displays the overall reconstruction scenes of footwear outsole impressions obtained from the five scanning techniques. Textured construction was achieved with SL scanner, SP photogrammetry, Kinect v2, and iLiDAR. However, the handheld LS used does not capture textured color, and the color map of the Kinect v2 does not provide a realistic appearance to the model.

Figure 16.
The overall reconstruction scene of the footwear outsole impression (a) acquired via: (b) structured-light scanner; (c) handheld laser scanner; (d) Smartphone photogrammetry; (e) Kinect v2 RGB-D camera; and (f) iPhone LiDAR.
3.1.2. Qualitative Geometrical Comparisons
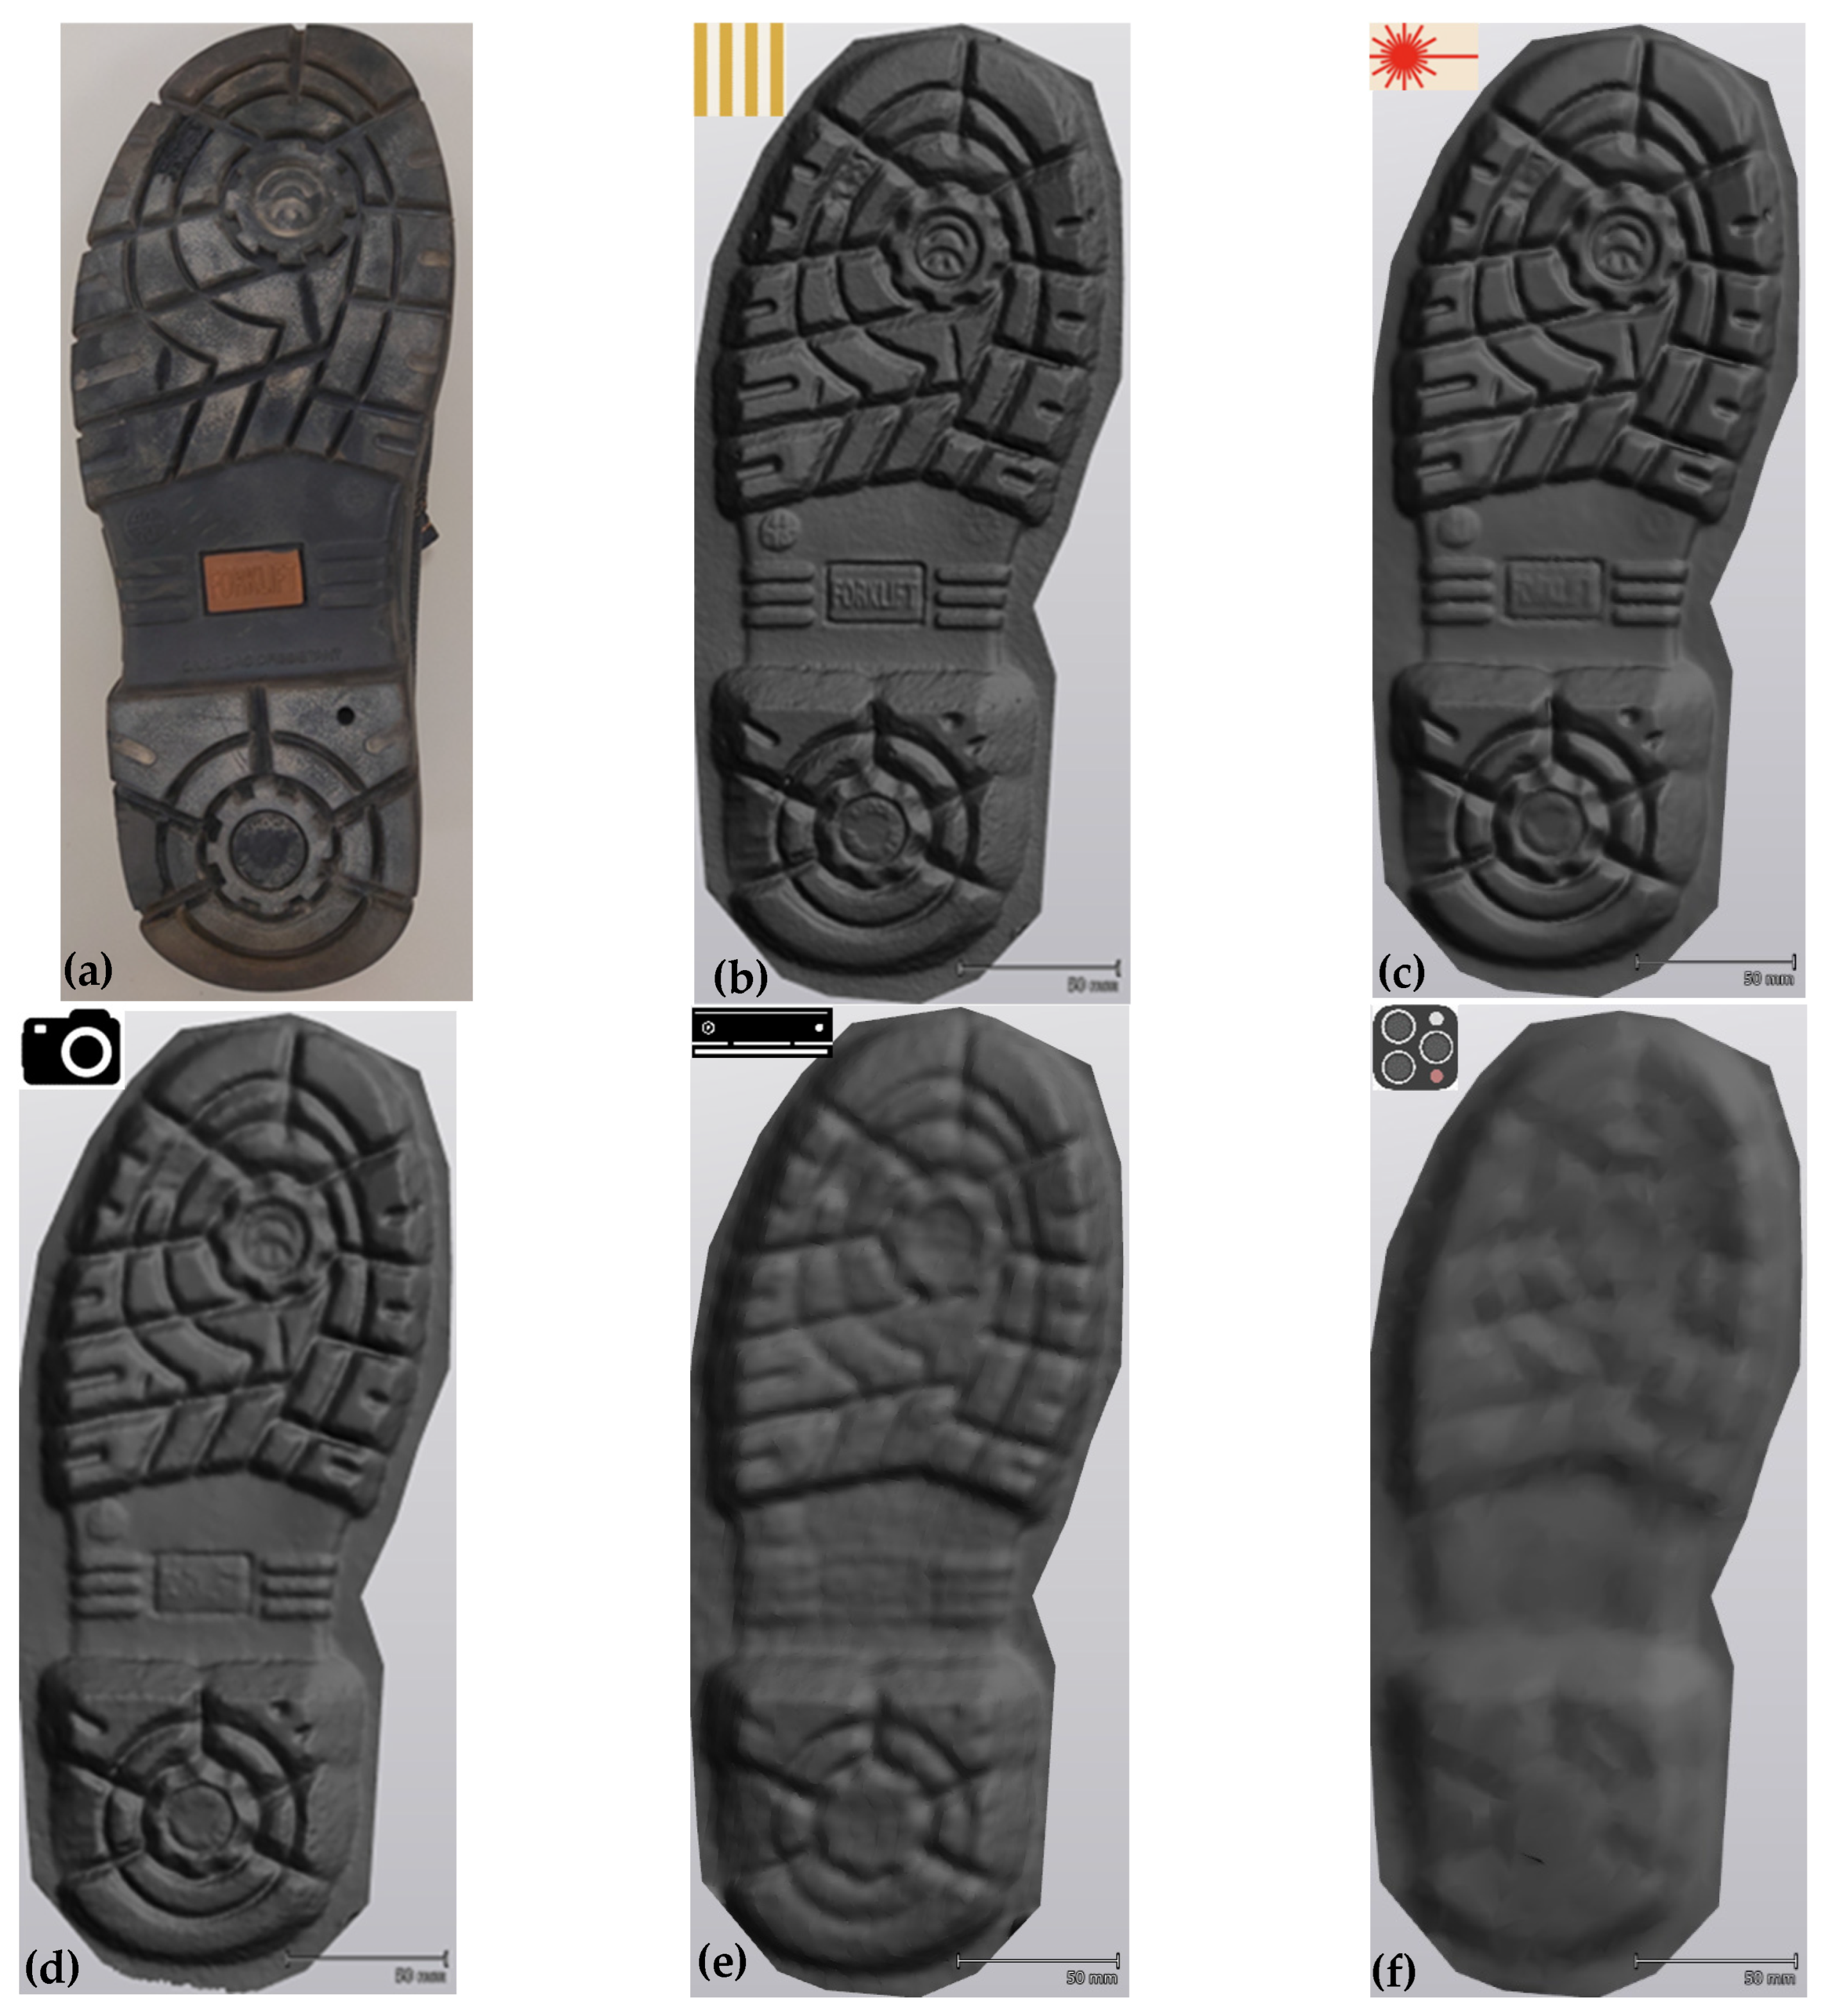
In investigating footwear impressions, an initial step involves qualitatively examining outsole features. Surface models of footwear outsole impressions in dry sand, generated by the five scanning modalities, are visually compared in Figure 17.

Figure 17.
Side by side morphometrical comparison of the known footwear outsole (a), and surface models of footwear outsole impressions in dry sand generated by: (b) EinScan-SP structured-light 3D scanner; (c) HandySCAN 3D handheld laser scanner; (d) smartphone photogrammetry; (e) MS Kinect v2 RGB-D sensor; (f) iPhone’s LiDAR sensor. (Scale bar: 50 mm).
The surface models’ backside represented the positive likeness of the outsole for direct comparison with the known footwear outsole in Figure 17a. The SL 3D scanner offered high geometric detail, precisely capturing fine impression details and matching the reference, albeit with the longest acquisition time (20 min) (Figure 17b). The handheld LS provided comparable or slightly lower geometric accuracy than the SL scanner (Figure 17c). SP photogrammetry (Figure 17d) resolved most fine details but with lower accuracy compared to SL and LS. Being wireless, SP photogrammetry offered more flexibility over wired systems like SL, LS, and Kinect v2 scanners. The Kinect v2 model depicted only the general tread pattern with some similarity, lacking accuracy in class and individual characteristics (Figure 17e). While Kinect v2 had higher resolution than iLiDAR, both provided less detailed surface information compared to SL, LS, and SP photogrammetry, even at the highest quality settings. iLiDAR, though flexible, failed to capture impression characteristics’ depth (Figure 17f). The low quality of Kinect v2 surface models may be due to poor frame alignment of the SDK fusion algorithm. Additionally, iLiDAR’s lower geometric performance in capturing small freeform features may result from the iPhone’s computational limitations compared to a regular computer and iLiDAR’s better performance limited in scanning flat, homogeneous surfaces.
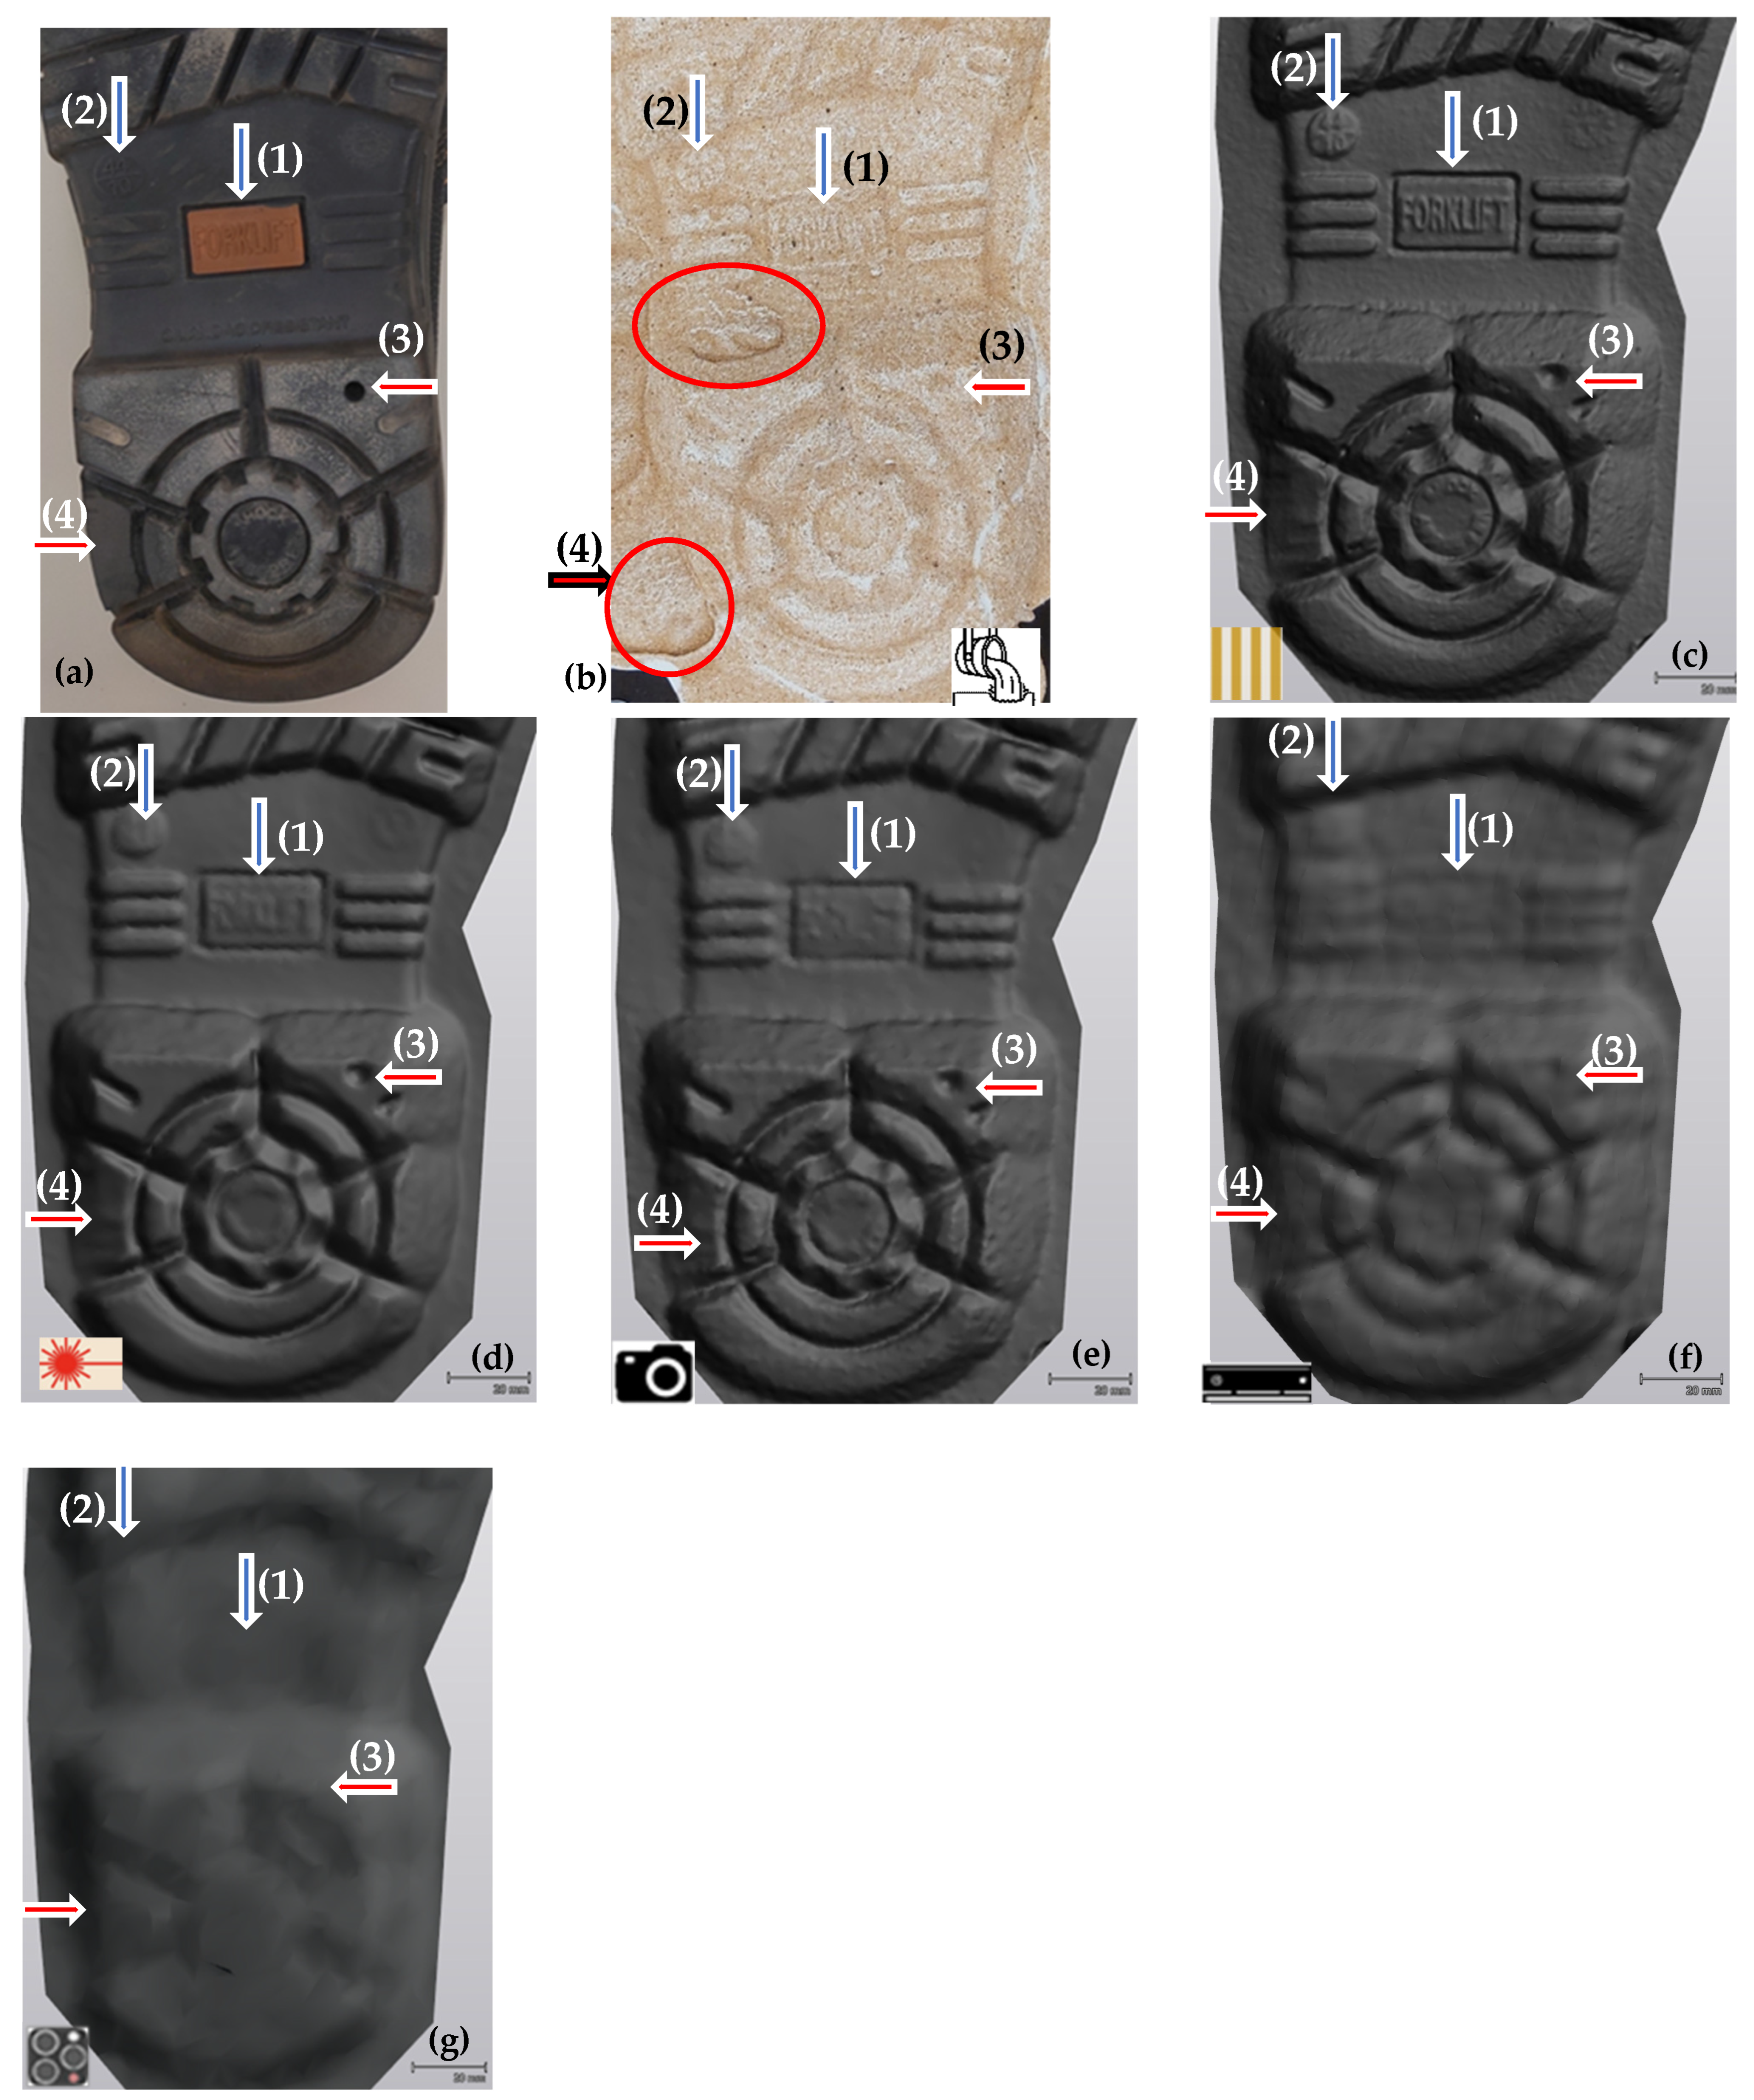
To contrast the data quality from the five scanning methods with conventional POP casting and reference footwear outsoles, both class and individual characteristics were thoroughly assessed by investigating enlarged areas of outsole. Manufacturers’ class characteristics such as logo, brand name, size, shape, and trade design, along with individual features including random cuts, scratches, wear marks, and holes, were examined in detail. Figure 18 and Figure 19 compare enlarged views of the heel and forefoot areas, respectively, in the reference outsole, POP cast, and 3D CAD models of the questioned impressions, with characteristics marked by colored and numbered arrows.

Figure 18.
Enlarged view of heel area of: (a) the known reference outsole; (b) POP Cast, and 3D CAD Models of the questioned outsole impressions acquired by: (c) EinScan-SP structured-light 3D scanner; (d) HandySCAN 3D handheld laser scanner; (e) smartphone photogrammetry; (f) MS Kinect v2 RGB-D camera; (g) iLiDAR sensor. Class characteristics, indicated by numbered vertical blue arrows, include the brand name (FORKLIFT) (1), size (44/10) (2), and general trade design. Individual characteristics, marked by numbered horizontal red arrows, comprise the hole (3) and wear region (4). (Scale bar: 20 mm).
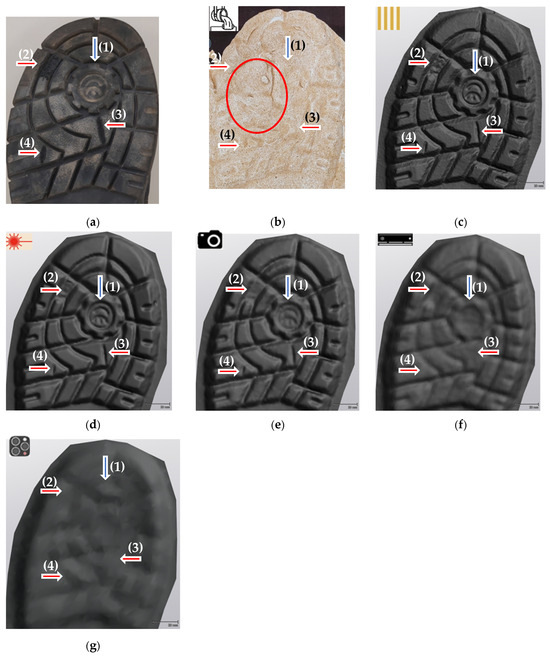
Figure 19.
Enlarged view of forefoot area of: (a) the known reference outsole; (b) POP cast, and 3D CAD models of the questioned outsole impressions acquired by: (c) EinScan-SP structured-light 3D scanner; (d) HandySCAN 3D handheld laser scanner; (e) smartphone photogrammetry; (f) MS Kinect v2 RGB-D camera; (g) iLiDAR sensor. Class characteristics noted with numbered vertical blue arrow (logo (CE) (1), and general trade design). Individual characteristics noted with numbered horizontal red arrows (cuts (2), and scratches (3,4)). (Scale bar: 20 mm).
In the heel section of the impression (Figure 18), the SL scanner clearly depicted the tread pattern, brand name (FORKLIFT), shoe size (44/10), wear, and the hole (Figure 18c). The handheld LS (Figure 18d) captured similar characteristics, though not reaching the quality of the structured-light scanner. SP photogrammetry results (Figure 18d) were lower than SL and LS scanners but still satisfactory.
The POP cast in heel section area (Figure 18b) showed the tread outline but with the appearance of artifacts, inherent surface porosity and incorrect reconstruction of wear region (red circles in Figure 18b).
Similarly, in the forefoot section of the impression (Figure 19), the SL 3D scanner (Figure 19c) also shows a very detailed tread pattern, writing of logo (CE), scratch and the cut (Figure 19c). Handheld LS generated the second-best impression model (Figure 19d). SP photogrammetry (Figure 19e), provided intermediate results. However, the 3D models generated by both Kinect v2 and iLiDAR scanners are not geometrically clear so that is cannot be used for any morphometrical purposes (Figure 19f,g). For the POP cast (Figure 19b), even the basic tread of the outsole as well as other individual characteristics cannot be recognized clearly as there is a great difference due to areas of pouring and artefacts within the plaster cast (red circle in Figure 19b). The main reason behind these artifacts and local destructions may be attributed to the fragile and shallow nature of outsole impression pattern, pouring and POP properties, and the fast hardening of POP. Therefore, producing detailed small-scale characteristics such as scratches and holes are problematic issue in POP casting.
Overall, in comparison to the known outsole reference, the SL 3D scanner demonstrates high clarity and reproducibility of both class and individual characteristics in terms of position, orientation, size, and shape in the reconstructed question outsole impression model. The handheld LS also exhibits a commendable degree of association, affirming the reliability of the acquired models with the known footwear. SP photogrammetry provided intermediate quality suggesting it suitability as secondary supportive reconstruction method. Kinect v2 and iLiDAR provided the worst geometrical output confirming that unsuitable for accurate impression reconstruction. On the other hand, the POP casted model does not provide a sufficient quantity or quality of individual and class characteristics details to produced high clarity casting impression. This observation is in line with Bennett et al., and Buck et al. [6,36].
Considering the qualitative findings mentioned earlier, the subsequent section will provide a quantitative evaluation of the various scanning techniques.
3.1.3. Quantitative Comparison of Impression Models
Using the geometrical performance results from the previous section’s morphological comparison, the structured-light scanner’s model served as the benchmark reference for the quantitative evaluation of the reconstruction quality of the other four scanning modalities.
Table 3 displays the comparative deviation analysis results of 3D reconstructed footwear outsole impression models. Lower standard deviation and RMS values of the distances indicate reduced errors and better scanner performance. As anticipated, the handheld LS performed the best, with the lowest standard deviation and RMS values (SD: 0.0682, RMS: 0.0684), followed by SP photogrammetry (SD: 0.198, RMS: 0.199), then Kinect v2 (SD: 0.522, RMS: 0.620), and finally, the iLiDAR (SD: 0.696, RMS: 0.706).
Table 3.
Statistics of the comparative deviation analysis results of 3D reconstructed footwear outsole impression models.
While the RGB-D Kinect v2 sensor and iLiDAR technologies are fast and cost-efficient, they exhibit the lowest accuracy in capturing fine impression details. However, Kinect v2 outperformed the iLiDAR, which produced the poorest results in impression reconstruction, displaying the highest mean, RMS, and min/max deviation between points across all data percentage levels. This finding aligns with the visual qualitative comparison. The global error outcomes of SL scanning, LS, SP photogrammetry, Kinect v2, and iLiDAR align with those reported by [22,24,36,37].
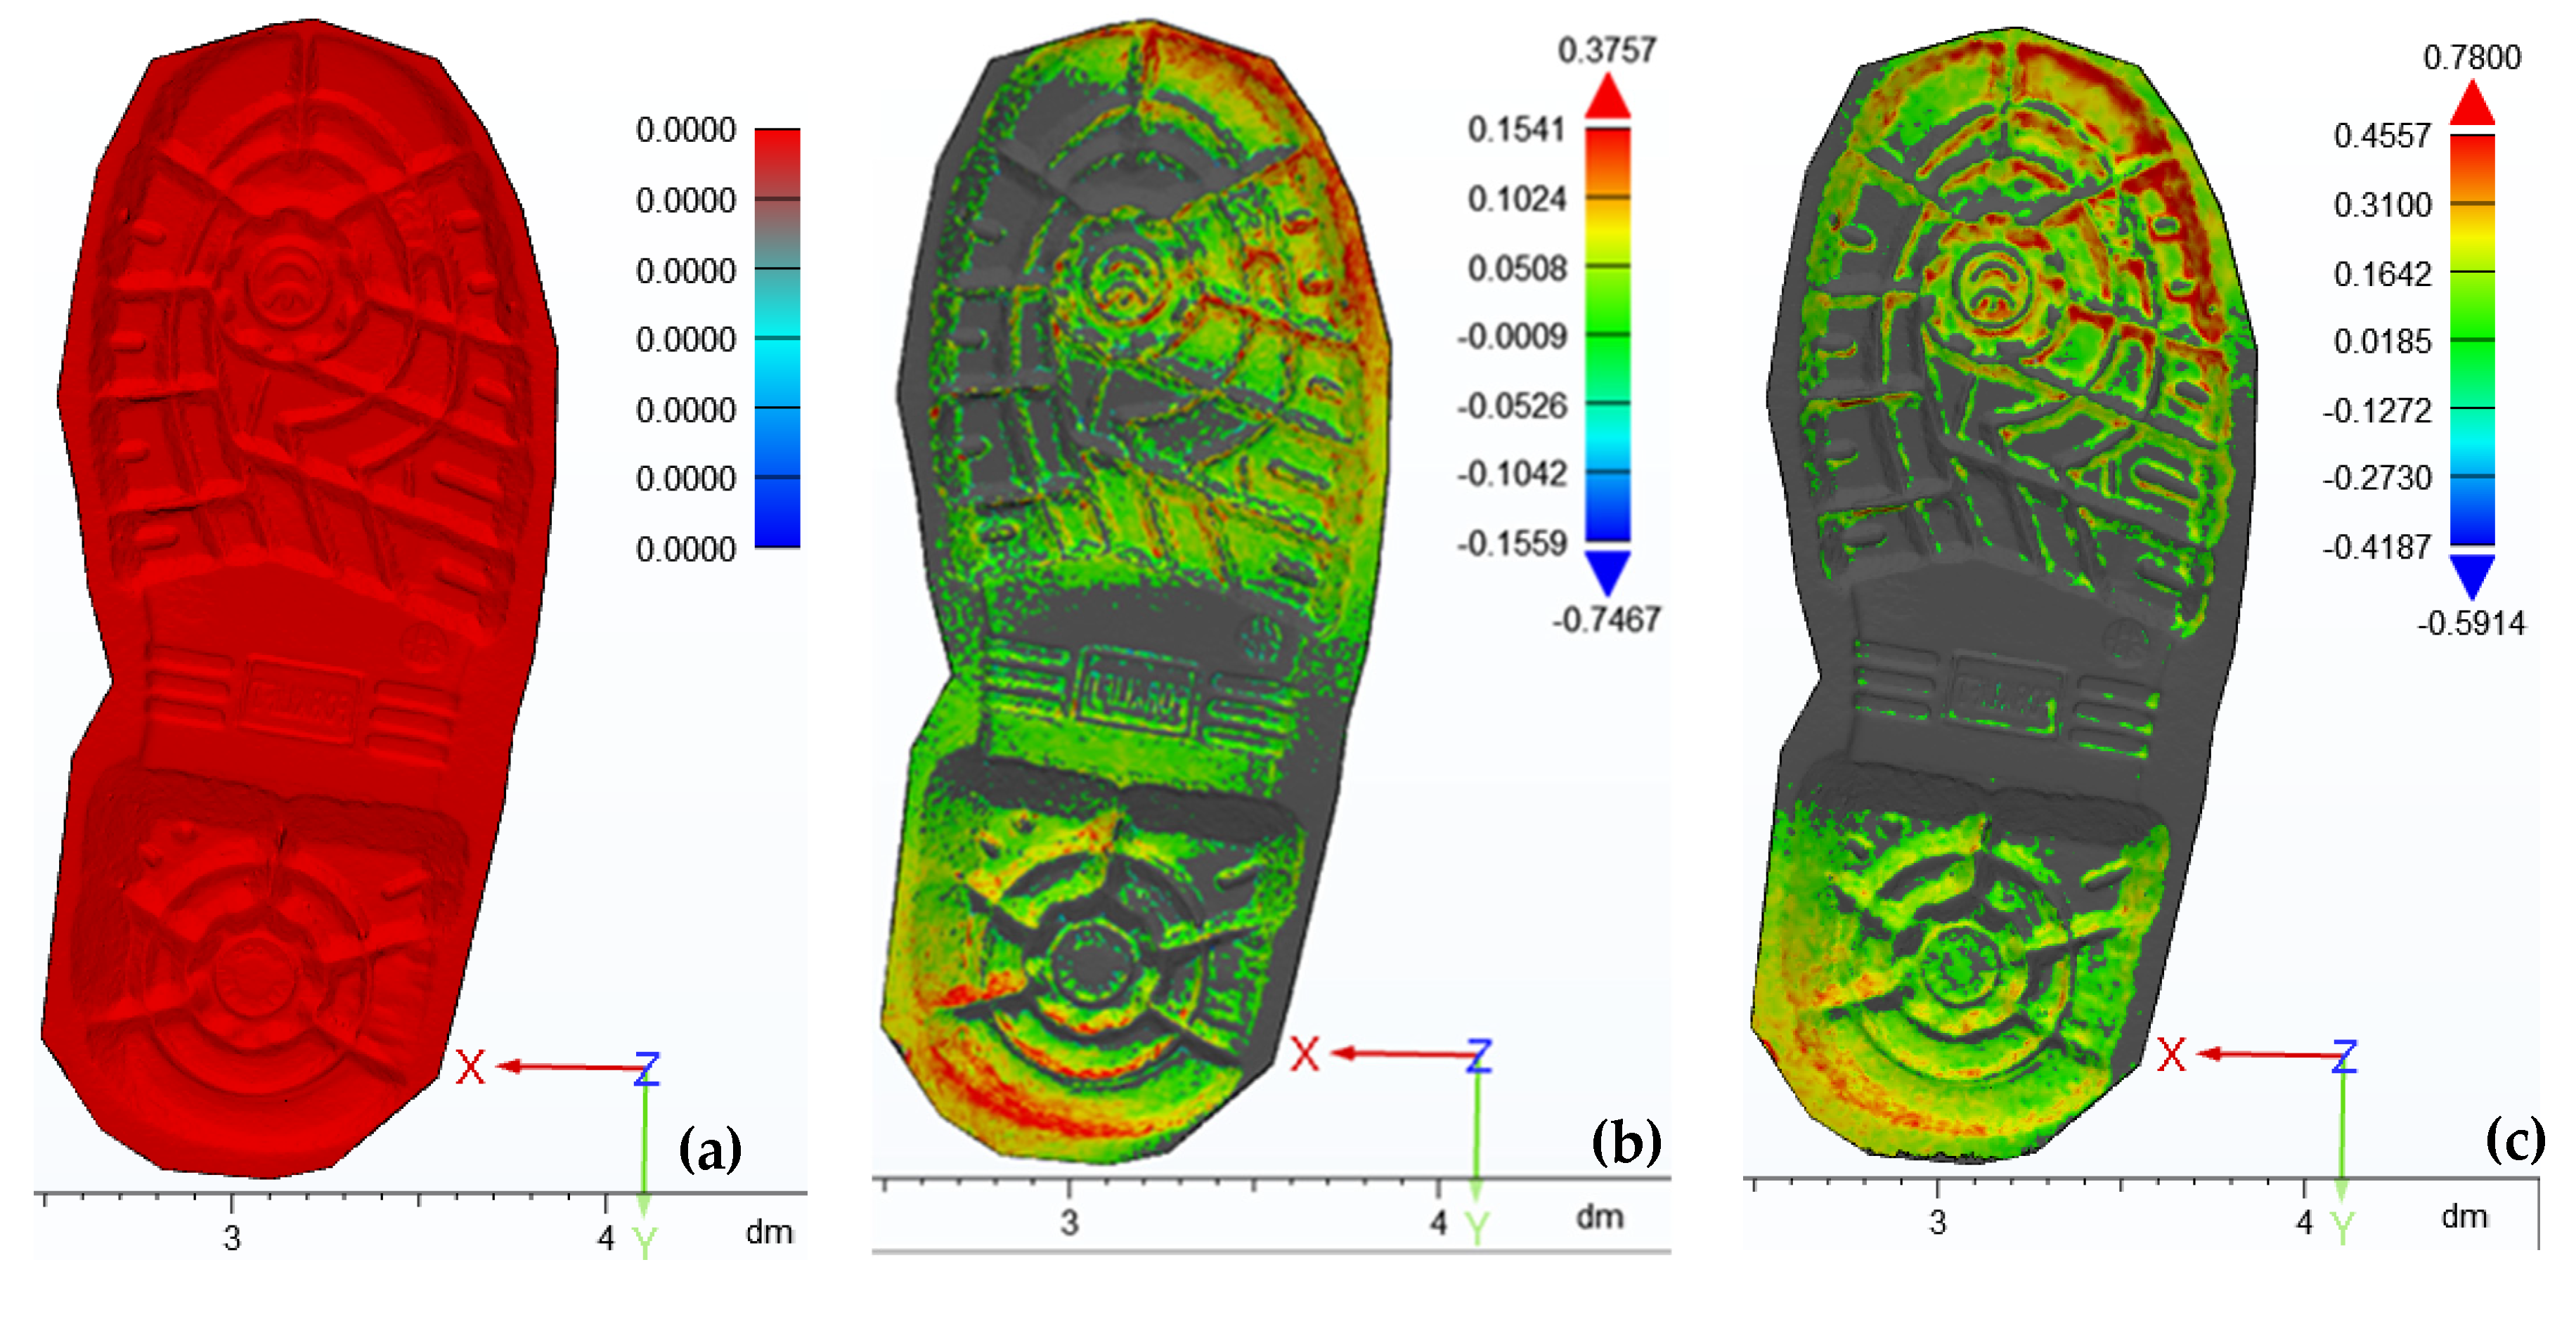
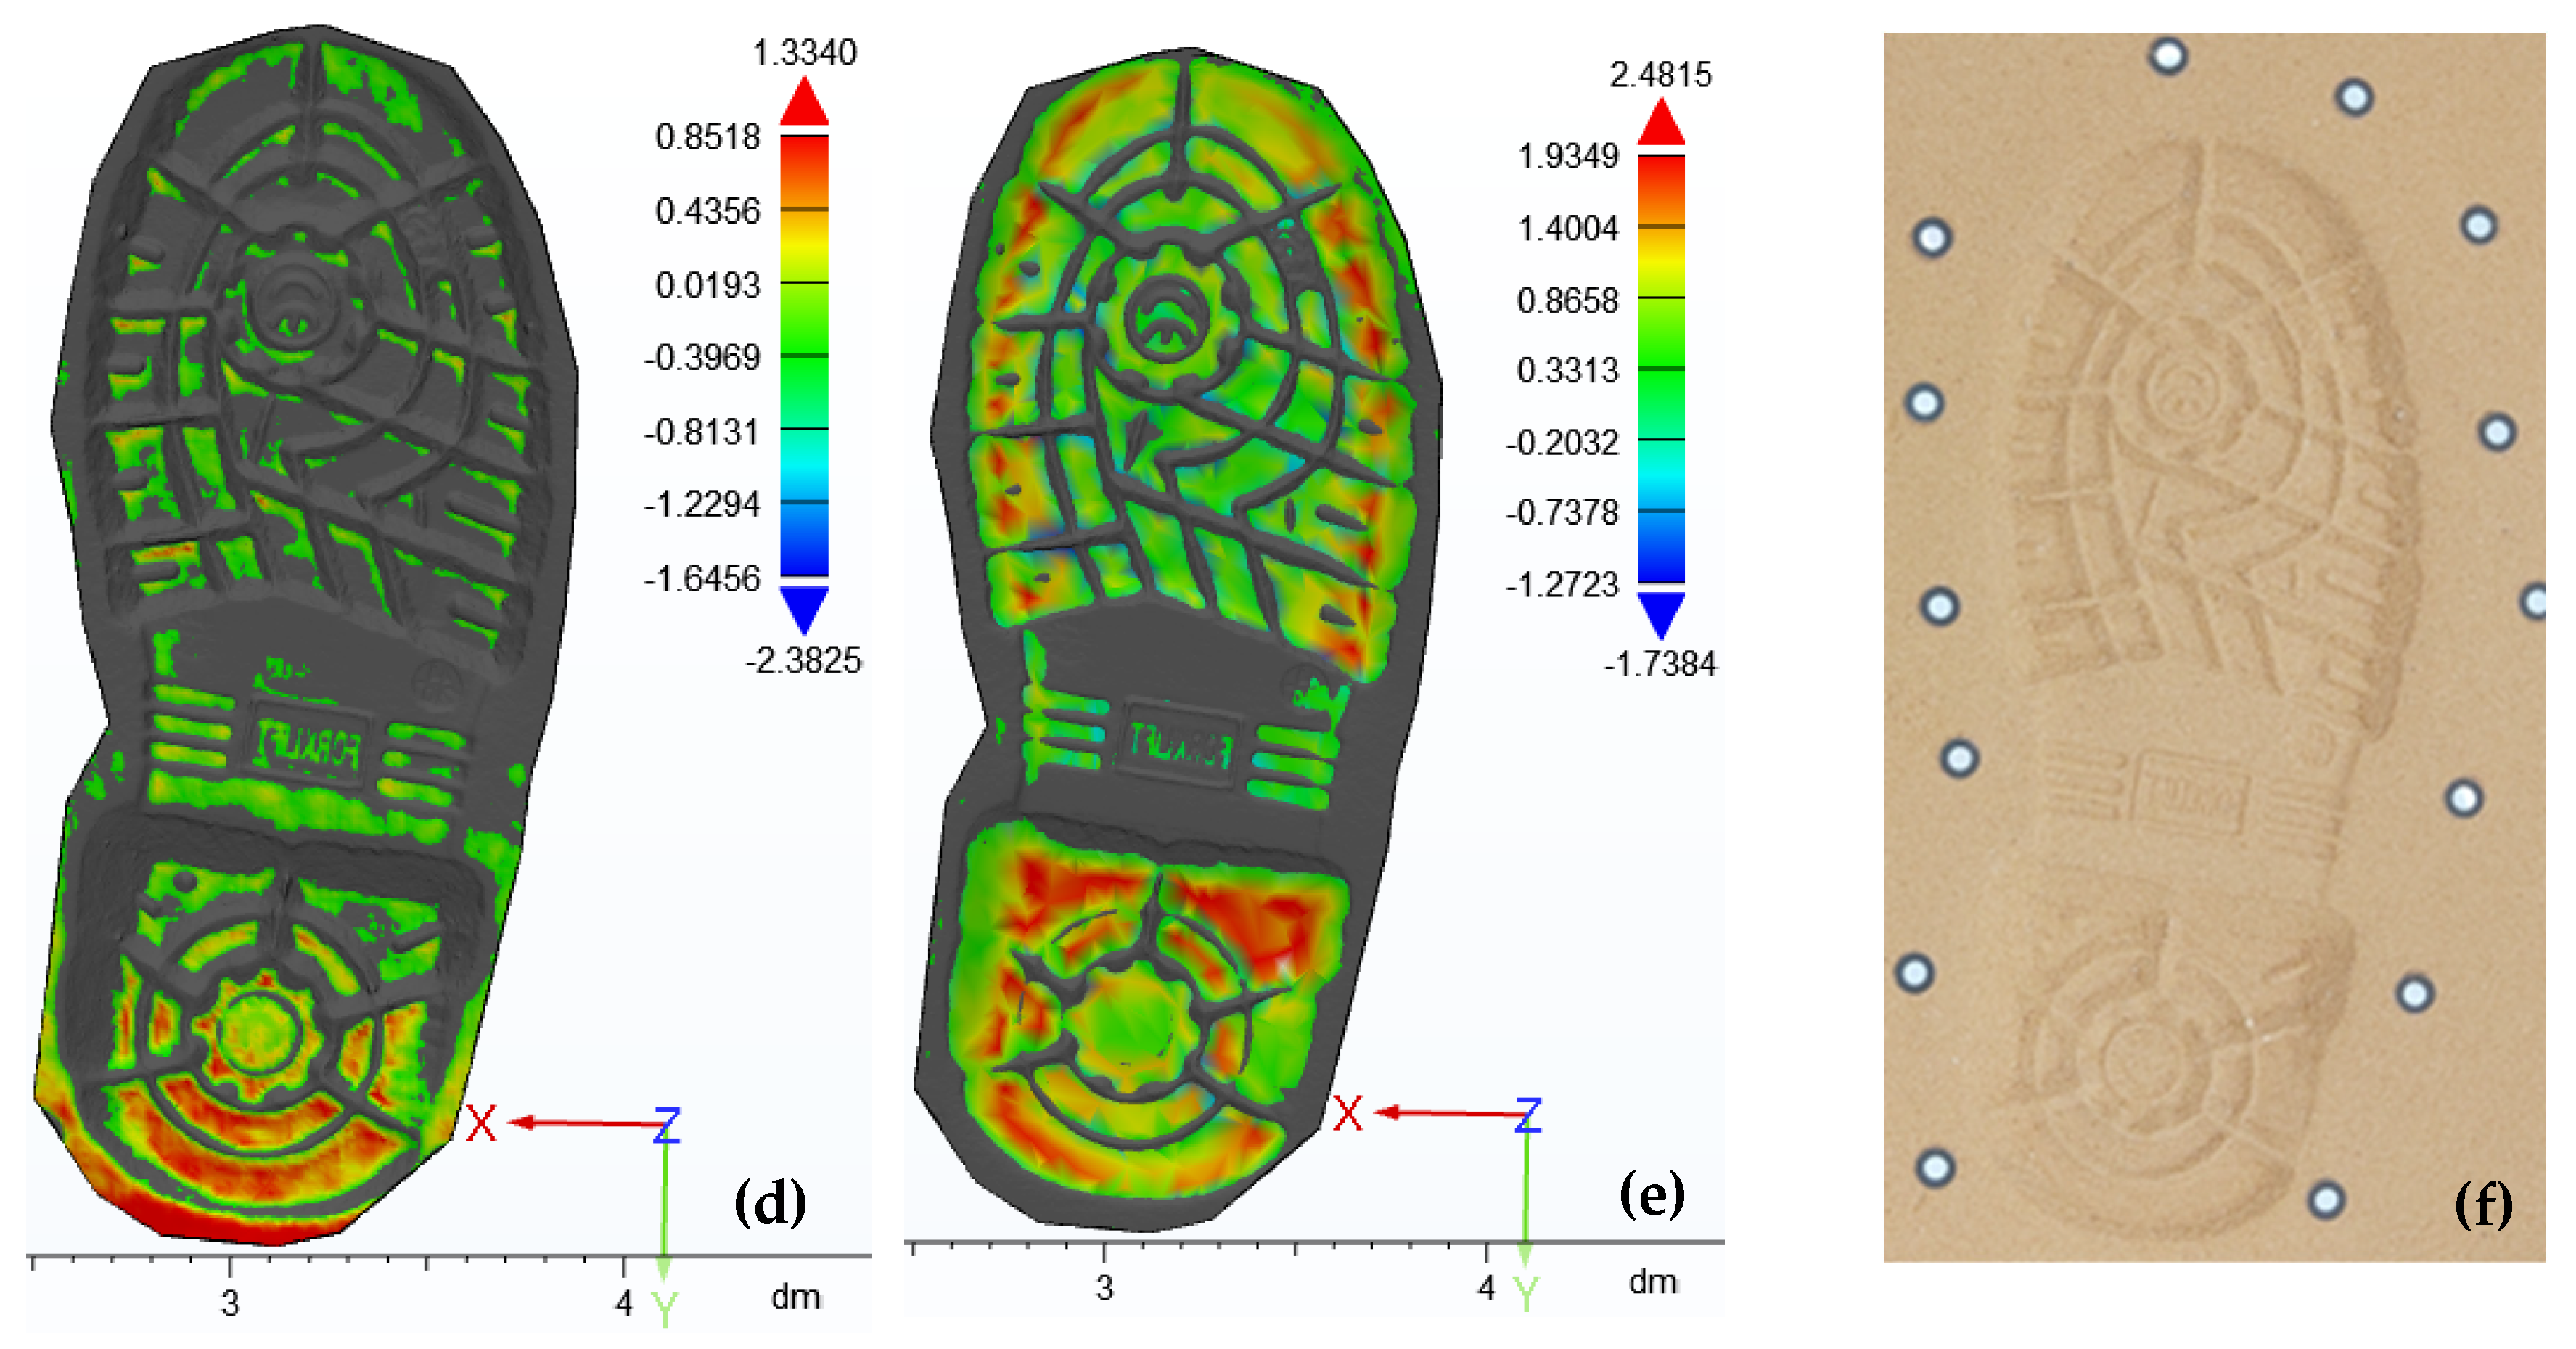
Figure 20 illustrates color maps and distance plots of impression point clouds generated from the five scanning methods. The color scale is set to display the range of the deviation with colors saturation to dark red at max positive deviation and dark blue at max negative deviation. As color coded scales show, the largest absolute deviations occurred for iLiDAR (2.481 mm), followed by Kinect v2 RGB-D (2.382), due to their limited ability to precisely capture the full depth information of the impression compared to SL, LS and SP photogrammetry. Thus, their performance is deemed unsatisfactory.
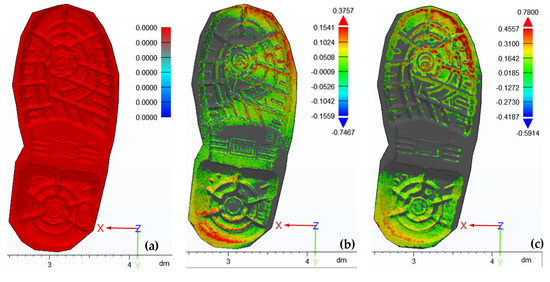
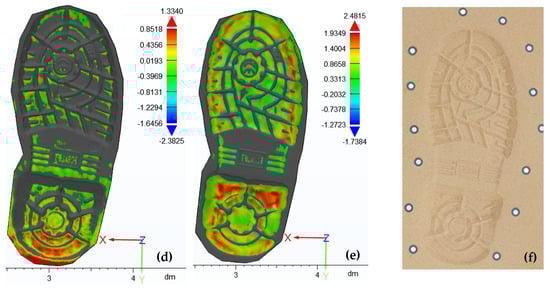
Figure 20.
Color maps and distance plots of the impression point clouds generated by: (a) EinScan-SP structured-light 3D scanner (reference mesh); (b) HandySCAN 3D handheld laser scanner; (c) smartphone photogrammetry; (d) MS Kinect v2 RGB-D sensor; and (e) iPhone’s LiDAR sensor, contracted against a photograph of the plastic footwear impression in dry sand (f). Distance values are in millimeters.
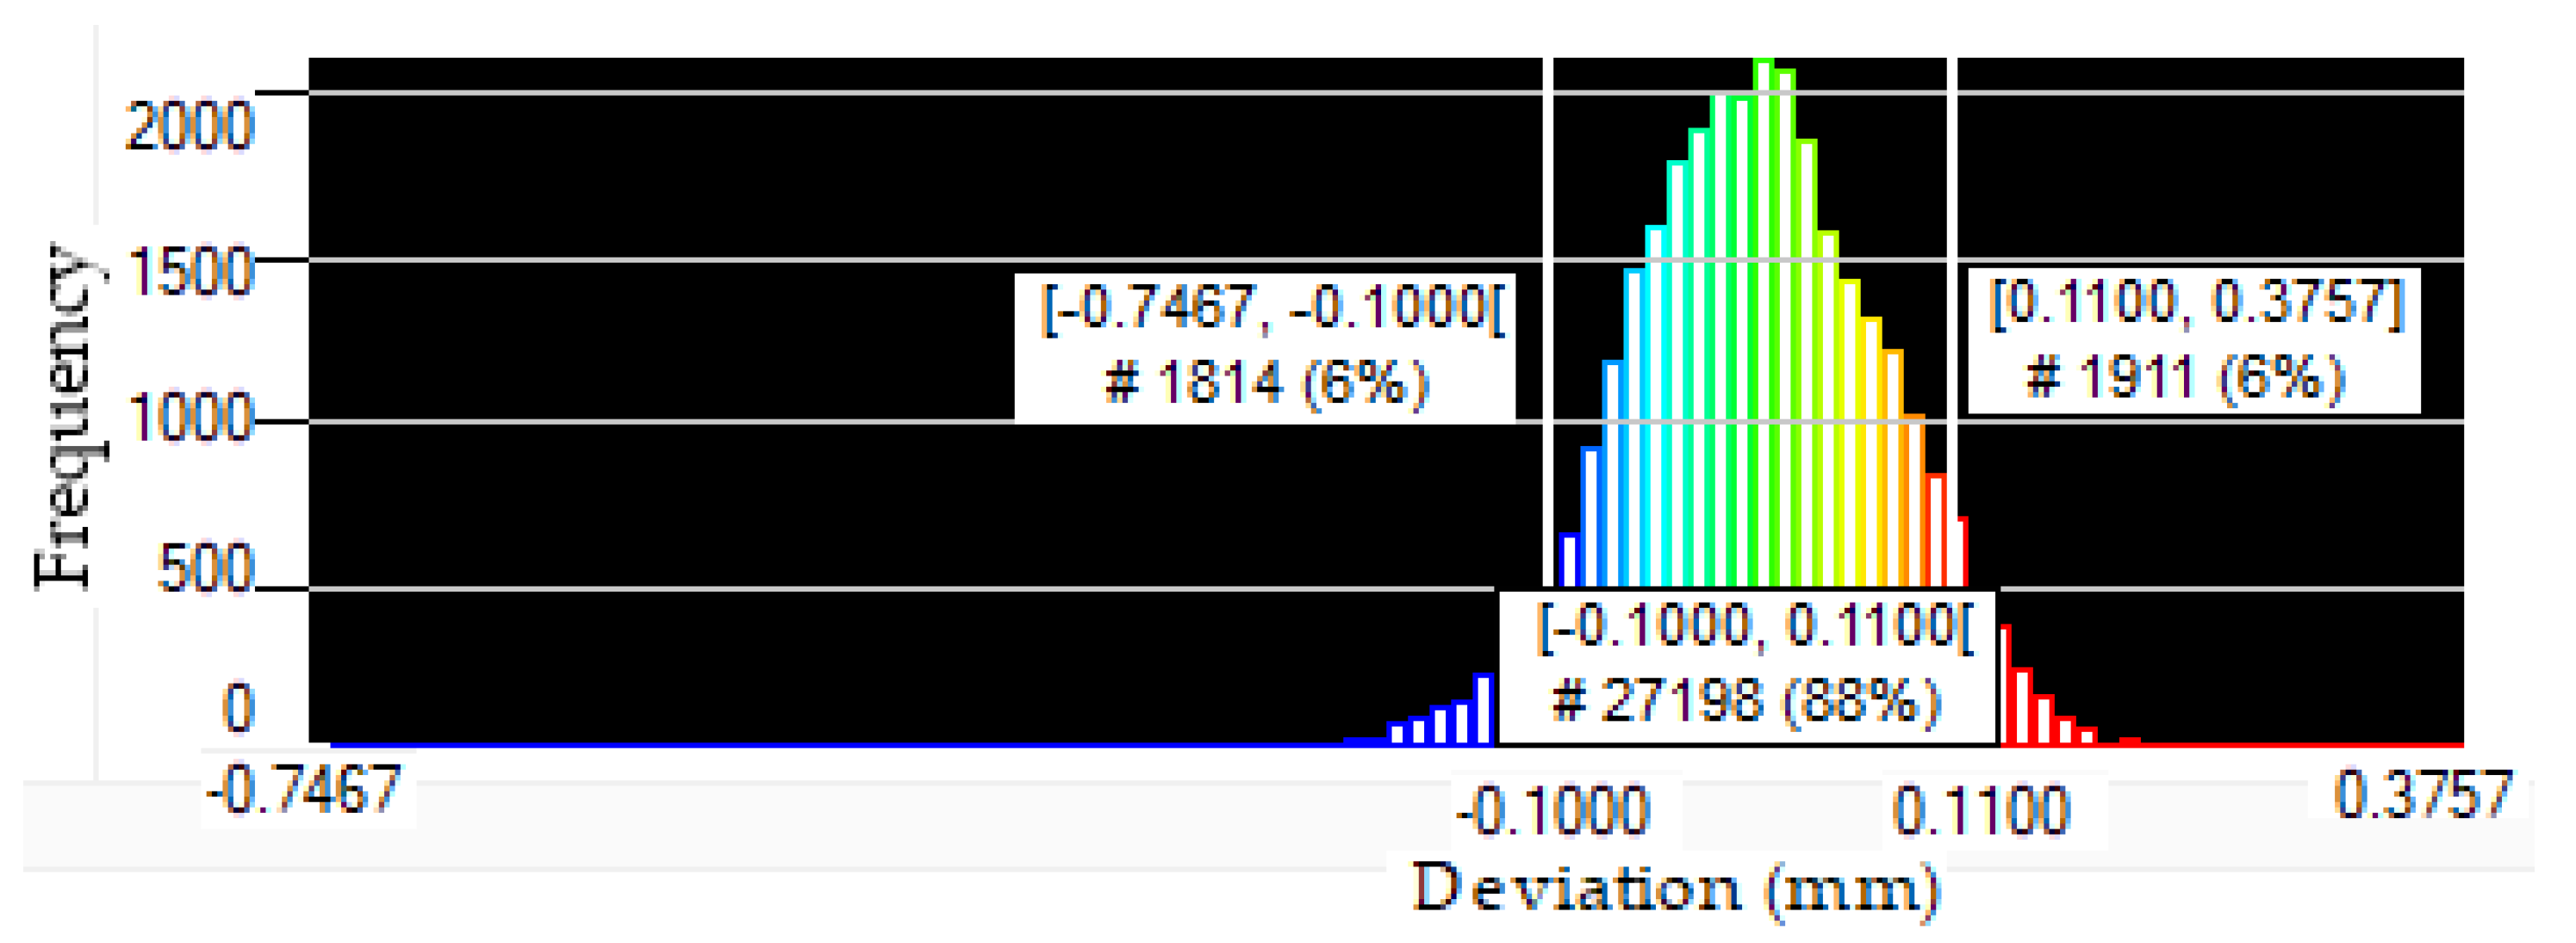
A histogram showing a global overview of the comparison analysis results for impression model acquired by HandySCAN 3D handheld LS is shown in Figure 21 as a representative example. In this instance, 88% of the CAD model acquired by the scanner is within 0.1 mm compared to the reference structured-light model. The blue color on the left side of the histogram represents data points with negative deviation, while the red color on the right side of the histogram indicates data points with positive deviation.
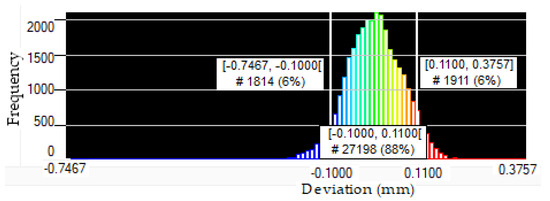
Figure 21.
A histogram of the comparison analysis results for impression model acquired by HandySCAN 3D handheld laser scanner.
In contrast to traditional POP casts which are bulky to store and difficult to carry out and compare geometrical measurements on its surface, not only deviation analysis can be carried out on digital files but also 3D local topographical analysis, wear amount quantifying, digital biometric measurements, and advanced 3D visualization. Furthermore, the requirement for creating multiple test impressions of one shoe, maybe under various circumstances, must be a part of the forensic procedure for making test impressions and this is very exhaustive to be created by casting [38]. Therefore, 3D models can also be easily compared to 3D model of a test impression made with either a known suspect’s footwear or directly to an 3D model of the outsole of a suspect’s footwear especially remotely. These operational differences make portable SL and LS scanners as strong proposals as alternative to traditional casting.
3.1.4. 3D Printed Impression Models
As-built FDM-printed impression replicas varied in build time, taking 19.5 h for the handheld LS model to 17.15 h for the iLiDAR model, reflecting differences in geometrical complexity. A layer thickness of 0.1 mm was chosen for detailed accuracy, albeit resulting in longer print times. Estimated printing costs averaged approximately USD 10 per 3D printed model. Conventional POP casting, in contrast, took 30 h and costed USD 5.
Figure 22 depicts a comparative view of 3D printed impression replicas from models obtained by the five scanning techniques alongside a reference photo of the reference footwear outsole (Figure 22a), photo of the impression (Figure 22b), and the POP cast (Figure 22c). The surface quality of 3D printed models varied depending on the quality of the master CAD model file, mirroring the geometric clarity of the corresponding scan model. In Figure 22d, the FDMed SL scanner model exhibited superior detail levels, with clear class and individual characteristics in the 3D impression, providing confidence in correlating them with those of the reference footwear outsole.
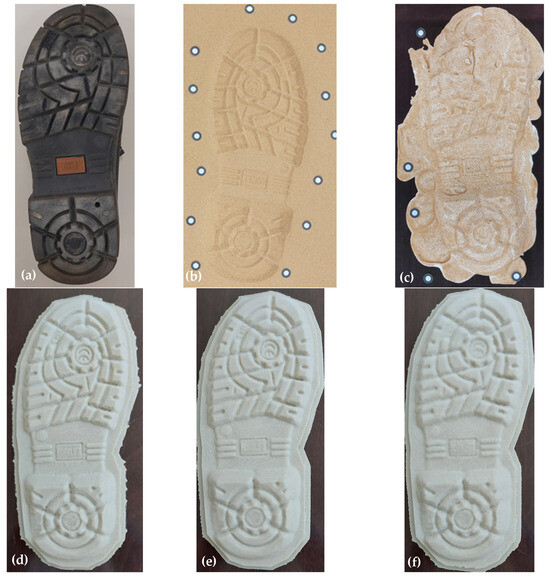
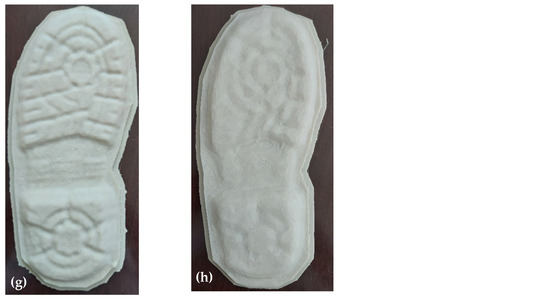
Figure 22.
A side-by-side comparison of 3D printed impression replicas build from models acquired by: (d) EinScan-SP structured-light 3D scanner; (e) HandySCAN 3D handheld laser scanner; (f) smartphone photogrammetry; (g) MS Kinect v2 RGB-D sensor; and (h) iPhone’s LiDAR sensor contrasted against (a) the reference footwear outsole; (b) the impression; and (c) the POP cast.
The 3D printed impression from the handheld LS model (Figure 22e) effectively captured characteristics with clear depth and shape. However, the photogrammetry model (Figure 22f) displayed limited clarity in detail, though maintaining the same characteristic presence and position as the reference footwear. The 3D printed Kinect v2 replica (Figure 22g) struggled to distinguish characteristics beyond the tread design. Due to the limited resolution of FDM compared to other AM techniques like SLA and SLS, and the low geometric detail of the original iLiDAR model, the 3D printed impression replica from the iLiDAR model performed the poorest (Figure 22h). Conversely, the casted replica (Figure 22c) could not replicate all geometric features, as it suffered from characteristic loss during the evidence recovery process, attributed to destructive pouring effects, POP properties, artifacts, and surface porosity, as previously mentioned.
In addition to their non-destructive nature and high geometric accuracy, 3D printed impressions offer the advantage of easily remanufacturing the model many times at various scales upon request and facilitating data sharing for remote 3D printing.
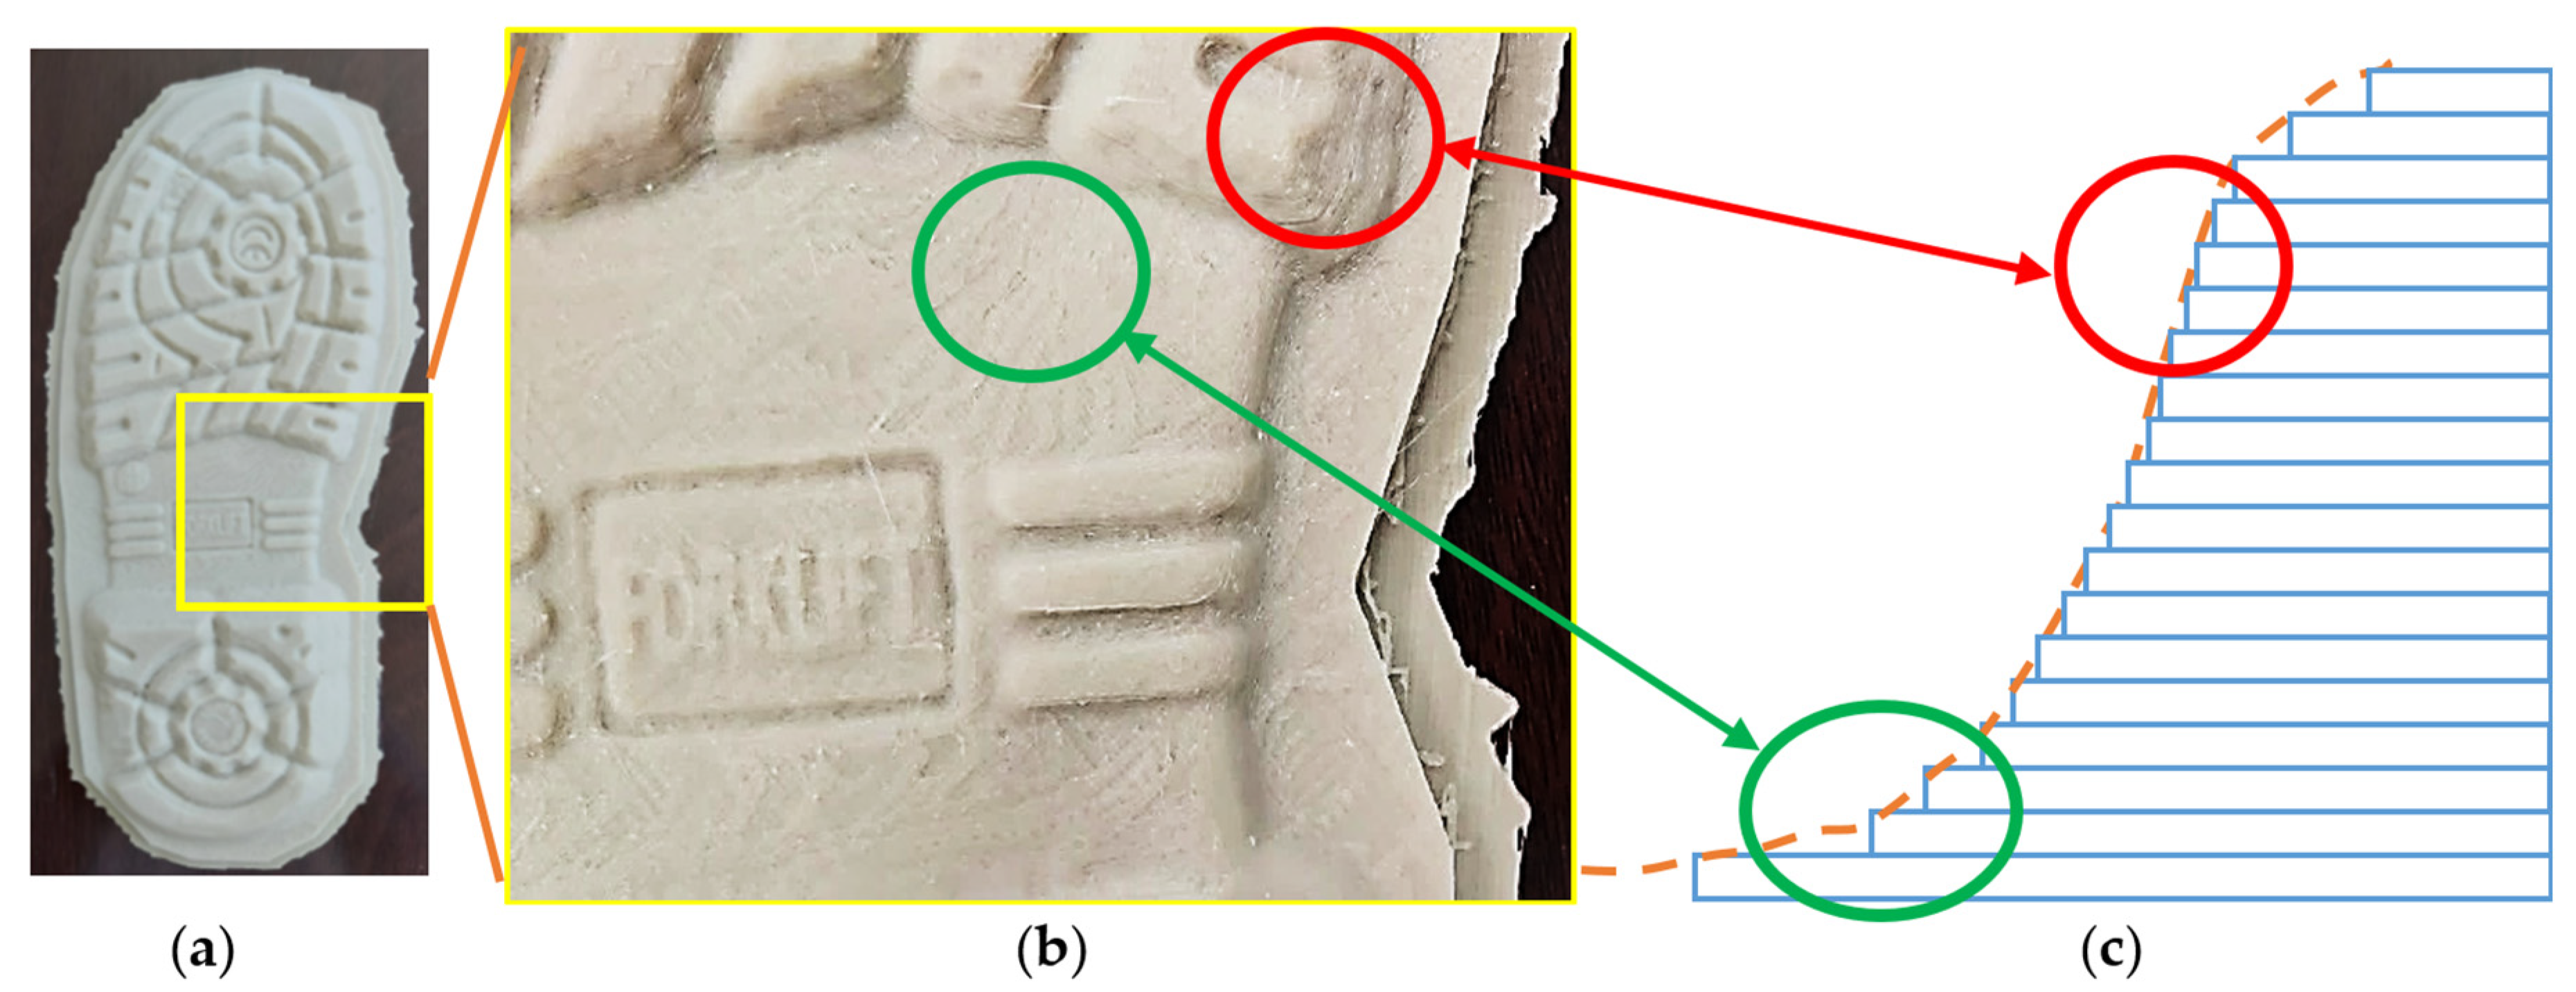
On the other hand, while FDM is often the most affordable and easy to source its materials, it is also the slowest method and tends to have higher surface roughness compared to other 3D printing processes like SLA or SLS (e.g., FDM production rate per hour ≈1.11, SLA ≈ 7.09, SLS ≈ 17.66). Plastic impressions are freeform, featuring tread elements with varying depths and wall angles. The freeform nature of plastic impression surfaces coupled with the inherent stair-step effect of the FDM technique contributes significantly to the surface roughness. Figure 23b provides a magnified view of a region with differing angles, highlighting distinct layer lines and contour intervals. Figure 23c shows a representation of corresponding stair-step effect inherent to FDM at different build inclinations. Stair-steps with high build inclination was represented by red circles, while stair-steps with low build inclination are denoted by green circles.
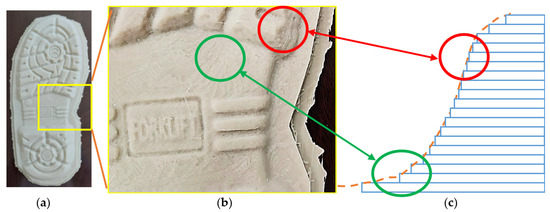
Figure 23.
Surface quality of the as-built FDMed plastic impressions: (a) 3D printed outsole plastic impression; (b) Enlarged view showing the free-form nature of 3D printed outsole impression surface with different inclination of the sidewall and near-flat surfaces; and (c) representation of corresponding stair-step effect inherent to FDM at different build inclinations.
3.2. 3D Reconstruction of 2D Latent and Visible Impressions
2D photography has always been the most important tool for documentation and analysis of forensic 2D latent and visible impressions. However, transforming 2D forensic images into 3D digital and 3D printed physical reconstructions is a new approach to forensic data representation. A 3D digital reconstruction based on 2D photo can markedly enhance the available data for evidence analysis and better visualization. Solid modeling tools such as interactive cut planes, zooming, rotation, mirroring, scalable captions, labels, grids, marking, measurement of spatial distances, area and volume measurements, animation, rendering, coloring, and texturing enables qualitative and qualitative comparisons of 2D impressions and also enable the usage of reconstructed models in virtual reality visualization and related technology in fast and accurate manner. Moreover, the physical reconstruction of 2D impressions using 3D printing offers a realistic visual representation of the object and facilitates tactile exploration. This aids in evaluating the similarity between impression evidence and corresponding known prints or footwear.
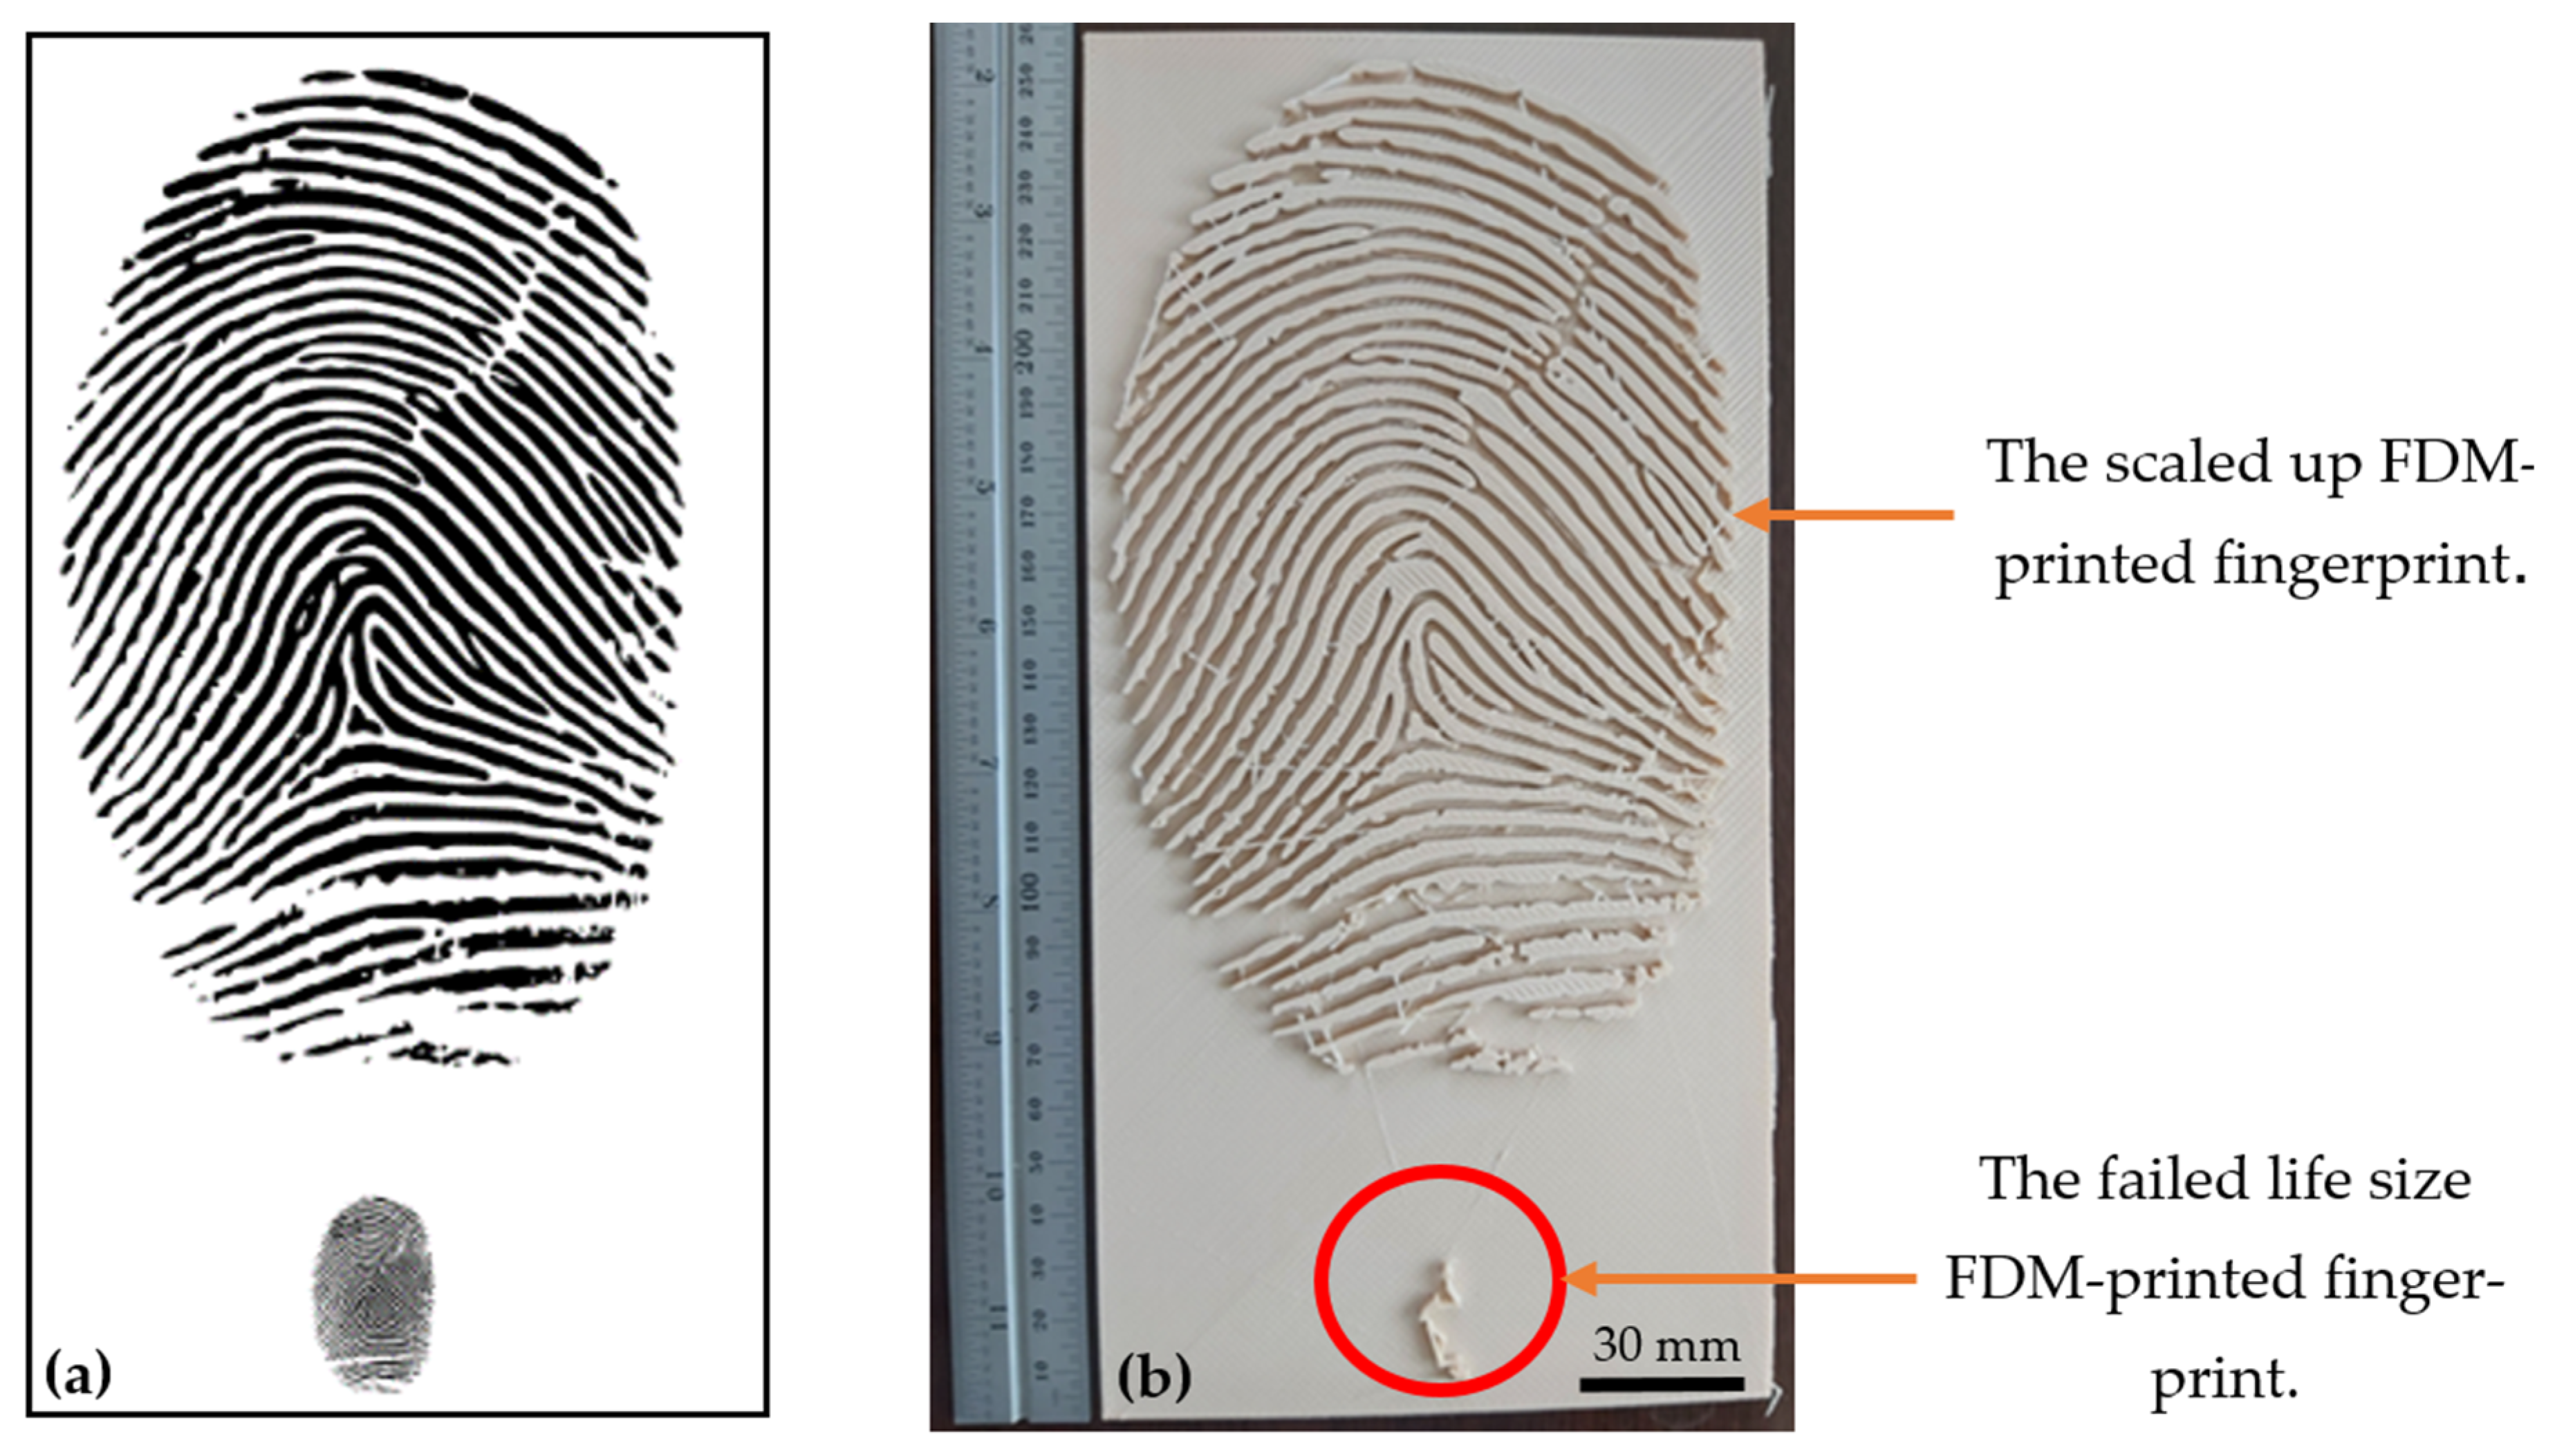
For latent impression reconstruction, the FDM-printed latent fingerprint impression are illustrated in Figure 24. It was observed that, the three mean fingerprint features including ridge ending, bifurcation, and the island in addition to other individual characteristics including islands, delta, scratch and core are successfully reproduced in the scaled up FDM-printed fingerprint (Figure 24b). However, all features failed to be reproduced in life size (see red circle in Figure 24b), due to the limitation in x-y resolution of the FDM technique in capturing small details, in addition to the stair-case phenomenon inherent with FDM which increase the surface roughness of the replica as discussed earlier. One solution of the resolution drawback of FDM in reproducing real scale fingerprint impression is to use other high resolution 3D printing technologies like SLA, DLP and polyjet. Another solution is the indirect printing of fingerprints through printing the 3D thumb model and use it as a pattern for casting process. Further, next generation contactless 3D fingerprint scanners can now generate high accurate real size 3D model enabling the 3D printing of actual topography of the 3D fingerprint intricate morphological features such as pores, lakes, ridges and valleys. using of advanced micro- and nano-3D printing techniques.
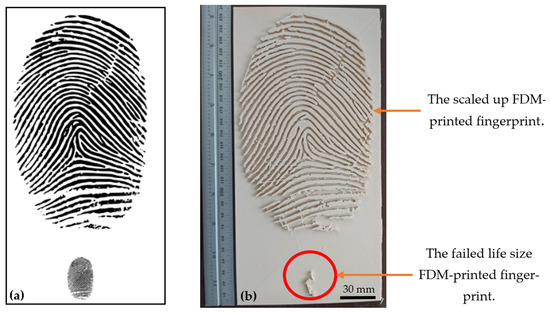
Figure 24.
FDM-printed latent fingerprint impression: (a) fingerprint reference image (adopted from Priesnitz et al. [29] with permission from Elsevier); (b) corresponding FDM-printed fingerprint replica in scaled up and life sizes. (Scale bar: 30 mm).
Although only fingerprints are used here as a representative example of latent prints, other latent prints can be used in the proposed pipeline.
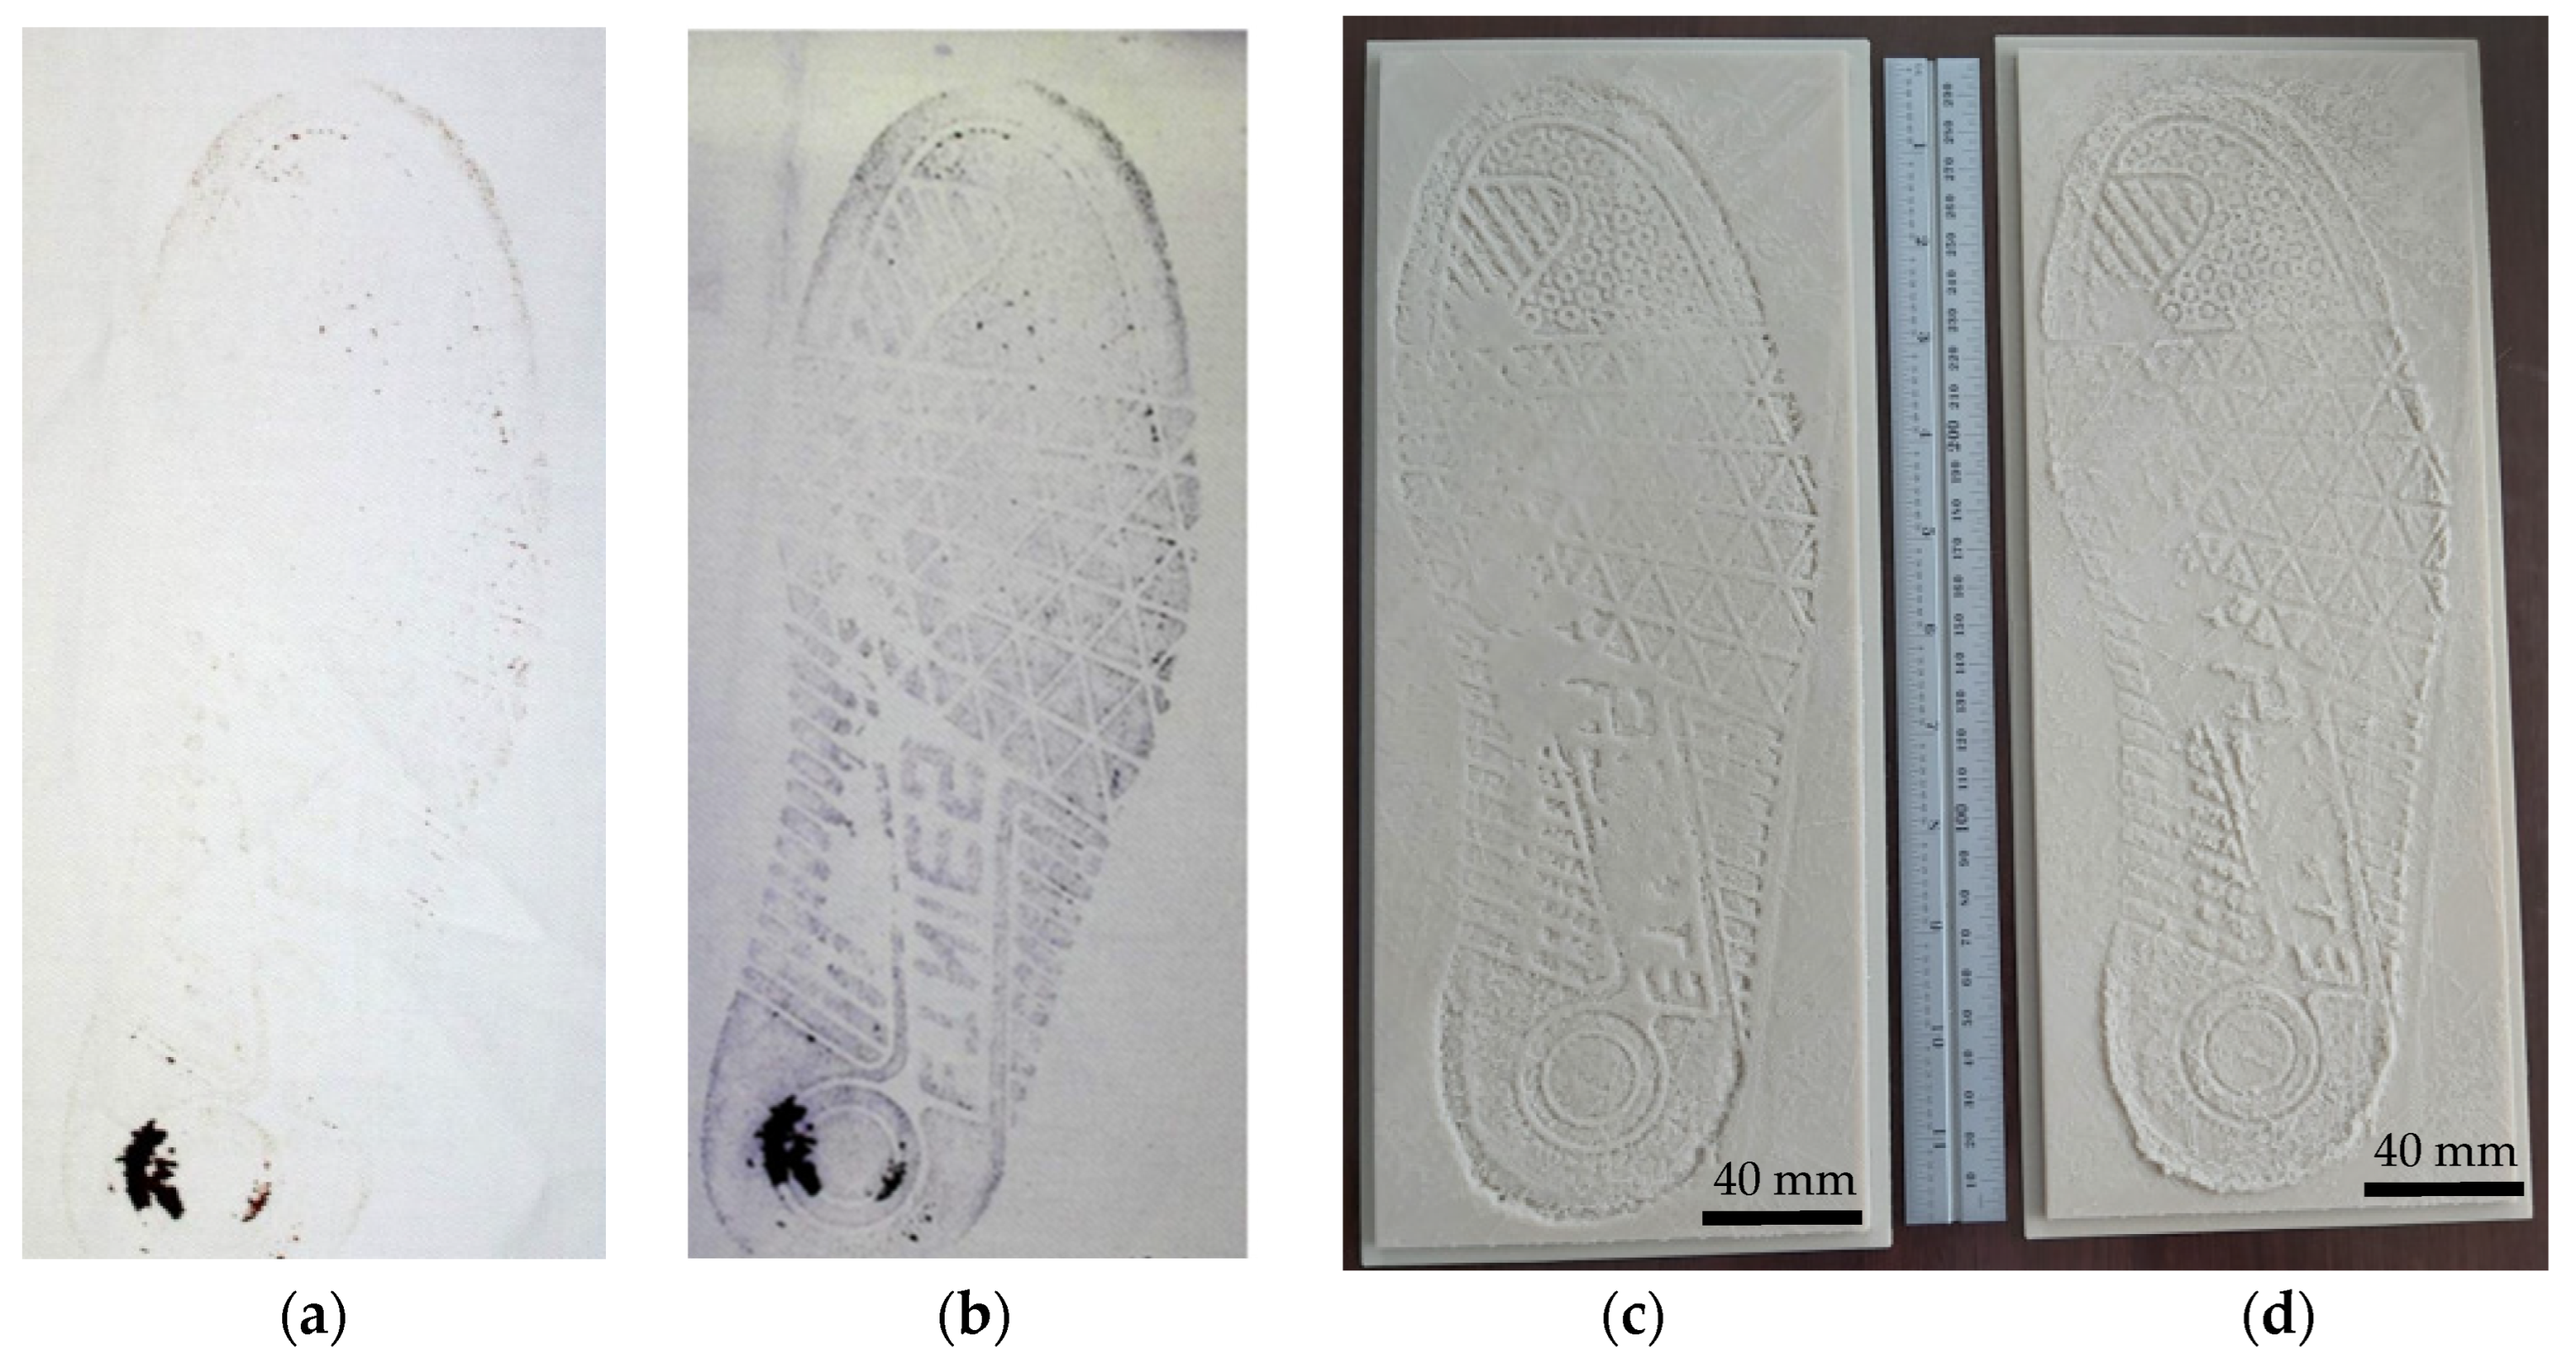
For 2D visible impression, Figure 25 shows an FDM-printed model of 2D visible impression of a known footwear in real size. Both main structural features and pressure and wear areas of the outsole are clearly replicated. Luminance of each pixel in the impression image which represents the intensity pattern of impression-substrate contact areas are interpreted as local depth of the 3D printed pattern. Another case of FDM-printed model of 2D visible impression of unknown footwear is illustrated in Figure 26. Details also were successfully reproduced. Inverted 3D morphology of the insole may increase rendering efficiency and are also its corresponding 3D printed can be use as additional visualization aid as shown in Figure 26d.
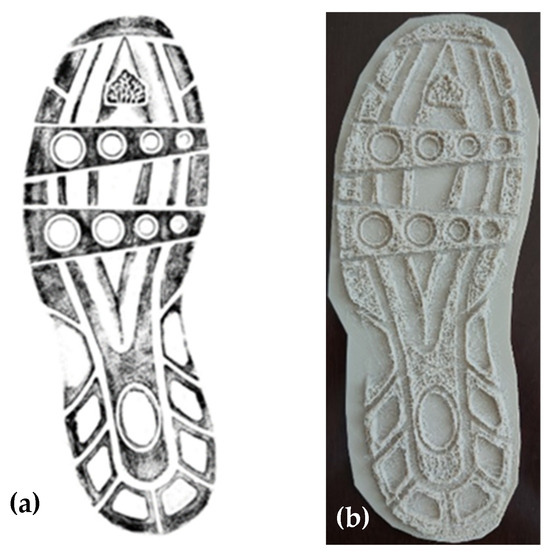
Figure 25.
FDM-printed model of 2D visible impression of a known footwear: (a) Reference 2D visible impression (adopted from [30], with permission from Elsevier); (b) corresponding FDM-printed model of the 2D visible impression of the known footwear outsole.
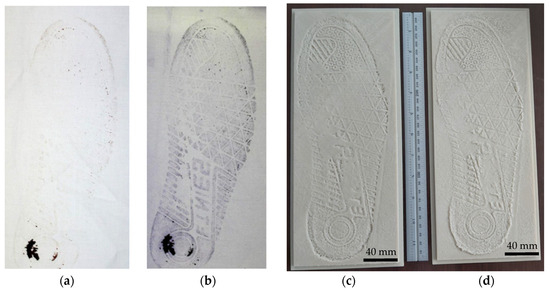
Figure 26.
FDM-printed models of 2D visible impression of an unknown footwear: footwear im-pression in blood on white cotton before enhancement (a) and after enhancement (b) (both adopted from [32], with permission from Elsevier); (c) corresponding FDM-printed replica; (d) corresponding inverted FDM-printed replica for extra visualization. (Scale bar: 40 mm).
In this methodology, although FDM is clearly replicated both structural features and pressure areas of the outsole based the investigated image samples, FDM will not result in sufficient quality replicas for insoles with fine features of the questioned impression due to the limited resolution. However, other 3D printing technologies such as SLA/DLP may provide more accurate replicas in such case. In addition to the FDM resolution limitation, inaccuracy originates from the reference data itself is another factor should be considered.
Traditional 2D inked prints and 3D printed test impression of suspect’s barefoot or footwear outsole can be compared with the 3D printed model made by the introduced workflow. The methodology in the current stage can be used in constructing educational models in forensic classrooms. Future effort is still needed to evaluate feasibility of the introduced workflow in real forensic cases.
4. Conclusions
Currently, forensic reconstruction is moving towards digital transformation through the integration of reverse engineering and additive manufacturing technologies for the documentation, analysis, and presentation in the operational methodology. The use of 3D digital and 3D printed impression models in real and enlarged sizes to convey certain observations and findings may provide invaluable resources for detailed explanation of the evidence analysis results in the court, in addition to other forensic educational and forensic related practices. For this reason, it is important to evaluate the potential capabilities and limitations of the available 3D techniques in forensic reconstruction. To date, comprehensive studies on both qualitative and quantitative evaluation and comparing of the geometric quality of impression evidence acquired by different types of 3D scanning systems have been limited. In the first part of this research, five non-destructive 3D scanning technologies involving HandySCAN 3D handheld laser scanner, EinScan-SP structured-light 3D scanner, smartphone photogrammetry, MS Kinect v2 RGB-D camera and iPhone’s LiDAR Sensor were qualitatively and quantitatively evaluated for appropriateness in digital reconstruction of 3D forensic impression evidence. In the second part, two methodologies for 3D reconstructions of 2D latent impression and visible impression evidence from a single 2D image were proposed. Finally, the FDM additive manufacturing technique was used in building the 3D reconstructed models created from each part.
For digital reconstruction of 3D forensic impression evidence, the results reveal that structured-light 3D scanning has provided the highest accuracy to capture full features of the footwear outsole impression, highest amount of acquired points, moderate budget, although demonstrated longest acquiring time, with handheld laser scanning being the second system, which provided slightly lower accuracy (max absolute deviation of 0.7 mm and RMS of 0.0684), but with higher cost. Despite the methodological choice of using a ruler to establish the correct scale of the reconstructed 3D model which may introduce limitations in accuracy, SP photogrammetry ranked the third in accuracy as its impression’s clarity was less than the laser system with most individual characteristic nature and uniqueness is obvious. However, it is the best in terms of cost, portability maintenance and power requirements which are major concern in low local and low budget forensic agencies. Although accuracy of SP photogrammetry models does not reach the SL and LS accuracies, the rapid development in SP photogrammetry is expected to offer a competitive scanning solution to the structured-light and the high-cost laser scanners in evidence reconstruction. Investigated RGB-D Kinect v2 camera and iPhone LiDAR technologies showed low accuracy in capturing the fine details of the impression with iLiDAR is the most unreliable one with the highest mean, RMS and Min/Max deviation between points at all levels of data percentages. Within the limits of the experiments performed here, this work recommends that both consumer handheld structured-light and laser 3D scanning modalities could be used for routine forensic practice in the recovery of 3D footwear impressions as new standalone/complimentary route to existing conventional casting, videography and 2D photography methods to offer the most persuasive evidence to the footwear examiner. However, SP photogrammetry, for now, offers only a compliment to traditional recovery methods. RGB-D Kinect v2 sensor and iLiDAR modalities are appropriate for only a rough reconstruction of large area crime scene, and it is not reliable for small scale ones such as impression evidence, especially for obtaining precise measurements.
FDM succeeded in replicating the impression models with sufficient quality but high-resolution 3D printing solution like SLS/DLP/SLA may provide more accurate replicas. In general, the dimensional accuracy of FDM is approximately ±0.5% with a lower limit of about ±0.2 mm. In contrast, SLS offers a better accuracy of ±0.3% with a lower limit of ±0.3 mm and DLP and SLA both provide high precision with a consistent accuracy of ±0.1 mm, catering to applications requiring detailed and precise models.
Conventional POP cast was not capable to reproduce all the detail that is present in an impression. the presence of remarkable artefacts with other defects within the plaster cast making the impressions features are not clearly distinguishable.
For digital and physical reconstruction of 2D latent and visible forensic impression evidence, the two developed workflows in this research provided a base to express the approach of adding depth information to 2D forensic images through assigning depth information for each pixel for effective 3D spatial visualization and possibility of quantifying the impression’s geometry. By providing such depth information, the enhanced perception permits a comprehensive analysis of evidence. However, there exist two challenges associated with the application of these methodologies to construct 2D impressions. Firstly, the resolution limitation of FDM. Secondly, undistorted, or low-quality image of the questioned unknown impression. Therefore, incorporating these procedures into existing 2D impression analysis workflows depend on enhancements in the quality of images, improvement in 3D printing technology, validation efforts, and successful use of the technology in court. The advances in image processing techniques and high-resolution 3D printing systems holds a huge potential for enhancement images and print quality which will allow the wide adoption of the proposed methodology.
5. Future Perspectives
3D technologies offer exciting opportunities in reconstruction of forensic impression evidence but still require significant research work for realization in standard forensic applications. The following topics of further research can be identified:
- It is expected that consumer RGB-D cameras and iLiDAR technology manufacturers like Apple and Microsoft will delve more into advanced virtual and augmented reality applications and perform technological innovations and upgrades to the studded versions. That will result in more accurate versions of such technologies soon. Therefore, the investigation of the potentiality of upgraded RGB-D cameras and iLiDAR technologies with updated software solutions for 3D reconstruction of forensic impression evidence is a future topic.
- In addition to considering the latest RGB-D camera and iLiDAR scanner versions, studying other emerging consumer scanners for impression reconstructions of outdoor real cases in ambient light and in different substrates is also a future topic.
- In a study by Kot et al. [39], they introduced a virtual scanning concept for automatic recognition of mechanical parts. In a similar approach, future research could study the establishment of an automated impression identification system based on the 3D scanned impression data in which the 3D scanning device itself can automatically identify the footwear by comparing the acquired data by the scanner with a footwear database.
- 3D printing in forensic impression evidence is an emerging topic. Therefore, further work should also explore the evaluation of the accuracy of different 3D printing techniques such as SLS and SLA/DLP and different materials for forensic impression printing, which is an important next step in optimizing AM processes and materials for forensic impression analysis and documentation.
- Further research into the establishment of methodological standardization and 3D public databases is needed for moving towards engaging 3D techniques in forensic practices.
- Another line of future study would be the use of 3D models and scenes in virtual/augmented reality environments, which may open new horizons for forensics decision making.
- 3D technologies have a high potential in undergraduate forensic education, especially in the case of distance learning. So, future research could investigate the design of classroom activities that integrate 3D digitally reconstructed and 3D printed impression models with active learning.
Author Contributions
Conceptualization, O.A. and S.A.A.; methodology, O.A. and S.A.A.; software, O.A. and S.A.A.; validation, O.A. and S.A.A.; formal analysis, O.A. and S.A.A.; investigation, O.A. and S.A.A.; resources, O.A. and S.A.A.; data curation, O.A. and S.A.A.; writing—original draft preparation, O.A. and S.A.A.; writing—review and editing, O.A. and S.A.A.; visualization, O.A. and S.A.A.; supervision, O.A. and S.A.A.; project administration, O.A. and S.A.A.; funding acquisition, O.A. and S.A.A. All authors have read and agreed to the published version of the manuscript.
Funding
This research was funded by the deputyship for Research & Innovation, Ministry of Education in Saudi Arabia through the project number (IFP-2020-163).
Institutional Review Board Statement
Not applicable.
Informed Consent Statement
Not applicable.
Data Availability Statement
The raw data supporting the conclusions of this article will be made available by the authors on request.
Acknowledgments
The authors extend their appreciation to the deputyship for Research & Innovation, Ministry of Education in Saudi Arabia for funding this research work through the project number (IFP-2020-163). The authors acknowledge resources and support from the Engineering and Applied Sciences Research Center, Majmaah University, Kingdom of Saudi Arabia.
Conflicts of Interest
The authors declare no conflicts.
References
- Robertson, B.; Vignaux, G.A.; Berger, C.E.H. Interpreting Evidence: Evaluating Forensic Science in the Courtroom, 2nd ed.; John Wiley & Sons: Hoboken, NJ, USA, 2016. [Google Scholar]
- Bell, S. Forensic Science: An Introduction to Scientific and Investigative Techniques, 5th ed.; CRC Press: Boca Raton, FL, USA, 2019. [Google Scholar]
- Alizadeh, S.; Jond, H.B.; Nabiyev, V.V.; Kose, C. Automatic Retrieval of Shoeprints Using Modified Multi-Block Local Binary Pattern. Symmetry 2021, 13, 296. [Google Scholar] [CrossRef]
- Srihari, S.N.; Tang, Y. Computational Methods for the Analysis of Footwear Impression Evidence; Studies in Computational Intelligence; Springer: Cham, Switzerland, 2014; Volume 555. [Google Scholar] [CrossRef]
- Bodziak, W.J. Footwear Impression Evidence: Detection, Recovery and Examination; CRC Press: Boca Raton, FL, USA, 2017. [Google Scholar]
- Bennett, M.R.; Huddart, D.; Gonzalez, S. Preservation and Analysis of Three-Dimensional Footwear Evidence in Soils: The Application of Optical Laser Scanning. In Criminal and Environmental Soil Forensics; Springer: Dordrecht, The Netherlands, 2009. [Google Scholar]
- Guarnera, L.; Giudice, O.; Livatino, S.; Paratore, A.B.; Salici, A.; Battiato, S. Assessing Forensic Ballistics Three-Dimensionally through Graphical Reconstruction and Immersive VR Observation. Multimed. Tools Appl. 2023, 82, 20655–20681. [Google Scholar] [CrossRef]
- Kortylewski, A.; Vetter, T. Probabilistic Compositional Active Basis Models for Robust Pattern Recognition. In Proceedings of the British Machine Vision Conference 2016, York, UK, 19–22 September 2016. [Google Scholar]
- Kortylewski, A.; Albrecht, T.; Vetter, T. Unsupervised Footwear Impression Analysis and Retrieval from Crime Scene Data. In Proceedings of the Computer Vision-ACCV 2014 Workshops, Singapore, 1–2 November 2014. [Google Scholar]
- Aharchi, M.; Ait Kbir, M. A Review on 3D Reconstruction Techniques from 2D Images. In Lecture Notes in Intelligent Transportation and Infrastructure; Springer: Cham, Switzerland, 2020; Volume, Part F1409. [Google Scholar]
- Kumar, A. 3D Fingerprint Image Acquisition Methods. In Contactless 3D Fingerprint Identification; Kumar, A., Ed.; Springer International Publishing: Cham, Switzerland, 2018; pp. 17–27. ISBN 978-3-319-67681-4. [Google Scholar]
- Dhall, J.K.; Sodhi, G.S.; Kapoor, A.K. A Novel Method for the Development of Latent Fingerprints Recovered from Arson Simulation. Egypt. J. Forensic Sci. 2013, 3, 99–103. [Google Scholar] [CrossRef]
- Al Ali, T.; Alfulaiti, S.; Abuzour, M.; Almaqahami, S.; Ikuesan, R. Digital Forensic in a Virtual World: A Case of Metaverse and VR. In Proceedings of the 22nd European Conference on Cyber Warfare and Security, Athens, Greece, 22–23 June 2023. [Google Scholar]
- Ebert, L.C.; Franckenberg, S.; Sieberth, T.; Schweitzer, W.; Thali, M.; Ford, J.; Decker, S. A Review of Visualization Techniques of Post-Mortem Computed Tomography Data for Forensic Death Investigations. Int. J. Leg. Med. 2021, 135, 1855–1867. [Google Scholar] [CrossRef] [PubMed]
- Raneri, D. Enhancing Forensic Investigation through the Use of Modern Three-Dimensional (3D) Imaging Technologies for Crime Scene Reconstruction. Aust. J. Forensic Sci. 2018, 50, 697–707. [Google Scholar] [CrossRef]
- Rutty, G.N.; Brough, A.; Biggs, M.J.P.; Robinson, C.; Lawes, S.D.A.; Hainsworth, S.V. The Role of Micro-Computed Tomography in Forensic Investigations. Forensic Sci. Int. 2013, 225, 60–66. [Google Scholar] [CrossRef] [PubMed]
- Kottner, S.; Thali, M.J.; Gascho, D. Using the IPhone’s LiDAR Technology to Capture 3D Forensic Data at Crime and Crash Scenes. Forensic Imaging 2023, 32, 200535. [Google Scholar] [CrossRef]
- Thomsen, A.H.; Jurik, A.G.; Uhrenholt, L.; Vesterby, A. An Alternative Approach to Computerized Tomography (CT) in Forensic Pathology. Forensic Sci. Int. 2009, 183, 87–90. [Google Scholar] [CrossRef] [PubMed]
- Berezowski, V.; Mallett, X.; Moffat, I. Geomatic Techniques in Forensic Science: A Review. Sci. Justice 2020, 60, 99–107. [Google Scholar] [CrossRef] [PubMed]
- Carew, R.M.; Errickson, D. Imaging in Forensic Science: Five Years on. J. Forensic Radiol. Imaging 2019, 16, 24–33. [Google Scholar] [CrossRef]
- Galanakis, G.; Zabulis, X.; Evdaimon, T.; Fikenscher, S.E.; Allertseder, S.; Tsikrika, T.; Vrochidis, S. A Study of 3D Digitisation Modalities for Crime Scene Investigation. Forensic Sci. 2021, 1, 56–85. [Google Scholar] [CrossRef]
- Montgomerie, C.; Raneri, D.; Maynard, P. Validation Study of Three-Dimensional Scanning of Footwear Impressions. Aust. J. Forensic Sci. 2022, 54, 119–132. [Google Scholar] [CrossRef]
- Buck, U.; Albertini, N.; Naether, S.; Thali, M.J. 3D Documentation of Footwear Impressions and Tyre Tracks in Snow with High Resolution Optical Surface Scanning. Forensic Sci. Int. 2007, 171, 157–164. [Google Scholar] [CrossRef] [PubMed]
- Larsen, H.J.; Bennett, M.R. Empirical Evaluation of the Reliability of Photogrammetry Software in the Recovery of Three-Dimensional Footwear Impressions. J. Forensic Sci. 2020, 65, 1722–1729. [Google Scholar] [CrossRef] [PubMed]
- Amamra, A.; Amara, Y.; Boumaza, K.; Benayad, A. Crime Scene Reconstruction with RGB-D Sensors. In Proceedings of the Proceedings of the 2019 Federated Conference on Computer Science and Information Systems, FedCSIS 2019, Leipzig, Germany, 1–4 September 2019. [Google Scholar]
- ASTM F2792-12a; Standard Terminology for Additive Manufacturing Technologies. ASTM International: West Conshohocken, PA, USA, 2012.
- Carew, R.M.; French, J.; Morgan, R.M. 3D Forensic Science: A New Field Integrating 3D Imaging and 3D Printing in Crime Reconstruction. Forensic Sci. Int. Synerg. 2021, 3, 100205. [Google Scholar] [CrossRef] [PubMed]
- Jani, G.; Johnson, A.; Marques, J.; Franco, A. Three-Dimensional (3D) Printing in Forensic Science—An Emerging Technology in India. Ann. 3D Print. Med. 2021, 1, 100006. [Google Scholar] [CrossRef]
- Priesnitz, J.; Rathgeb, C.; Buchmann, N.; Busch, C.; Margraf, M. An Overview of Touchless 2D Fingerprint Recognition. EURASIP J. Image Video Process. 2021, 2021, 8. [Google Scholar] [CrossRef]
- Tang, Y.; Srihari, S.N. Likelihood Ratio Estimation in Forensic Identification Using Similarity and Rarity. Pattern Recognit. 2014, 47, 945–958. [Google Scholar] [CrossRef]
- Lin, E.; DeBat, T.; Speir, J.A. A Simulated Crime Scene Footwear Impression Database for Teaching and Research Purposes. J. Forensic Sci. 2022, 67, 726–734. [Google Scholar] [CrossRef]
- Farrugia, K.J.; Bandey, H.; Savage, K.; NicDaéid, N. Chemical Enhancement of Footwear Impressions in Blood on Fabric—Part 3: Amino Acid Staining. Sci. Justice 2013, 53, 8–13. [Google Scholar] [CrossRef]
- Yang, J.; Tao, J.L.; Franck, C. Smart Digital Image Correlation Patterns via 3D Printing. Exp. Mech. 2021, 61, 1181–1191. [Google Scholar] [CrossRef]
- Horowitz, S.S.; Schultz, P.H. Printing Space: Using 3D Printing of Digital Terrain Models in Geosciences Education and Research. J. Geosci. Educ. 2014, 62, 138–145. [Google Scholar] [CrossRef]
- Ma, M.; Zheng, H.; Lallie, H. Virtual Reality and 3D Animation in Forensic Visualization. J. Forensic Sci. 2010, 55, 1227–1231. [Google Scholar] [CrossRef]
- Buck, U.; Buße, K.; Campana, L.; Schyma, C. Validation and Evaluation of Measuring Methods for the 3d Documentation of External Injuries in the Field of Forensic Medicine. Int. J. Leg. Med. 2018, 132, 551–561. [Google Scholar] [CrossRef] [PubMed]
- Kersten, T.P.; Omelanowsky, D.; Lindstaedt, M. Investigations of Low-Cost Systems for 3D Reconstruction of Small Objects. In Digital Heritage: Progress in Cultural Heritage: Documentation, Preservation, and Protection, Proceedings of the 6th International Conference, EuroMed 2016, Nicosia, Cyprus, 31 October–5 November 2016; Lecture Notes in Computer Science; Springer: Cham, Switzerland, 2016; Volume 10058. [Google Scholar]
- Shor, Y.; Wiesner, S.; Tsach, T.; Gurel, R.; Yekutieli, Y. Inherent Variation in Multiple Shoe-Sole Test Impressions. Forensic Sci. Int. 2018, 285, 189–203. [Google Scholar] [CrossRef]
- Kot, T.; Bobovský, Z.; Heczko, D.; Vysocký, A.; Virgala, I.; Prada, E. Using Virtual Scanning to Find Optimal Configuration of a 3D Scanner Turntable for Scanning of Mechanical Parts. Sensors 2021, 21, 5343. [Google Scholar] [CrossRef]


Disclaimer/Publisher’s Note: The statements, opinions and data contained in all publications are solely those of the individual author(s) and contributor(s) and not of MDPI and/or the editor(s). MDPI and/or the editor(s) disclaim responsibility for any injury to people or property resulting from any ideas, methods, instructions or products referred to in the content. |
© 2024 by the authors. Licensee MDPI, Basel, Switzerland. This article is an open access article distributed under the terms and conditions of the Creative Commons Attribution (CC BY) license (https://creativecommons.org/licenses/by/4.0/).