Abstract
The article presents a method for tuning PI/PID regulators controlling inertial time-delayed plants. The method was formulated on the basis of direct synthesis using the FOPDT (First-Order Plus Dead-Time) and the SOPDT (Second-Order Plus Dead-Time) models to represent the dynamics of the object. The performance objective is to achieve the non-oscillatory response of the system in the shortest time possible while set-point tracking. By employing a novel approach to the synthesis of the control systems with a time delay based on a root-locus analysis, the method eliminates errors resulting from the omission of high-order terms in the Taylor series expansion or the Padé approximation in simplified mathematical descriptions of the process. Consequently, the proposed method makes it possible to precisely determine controller settings to achieve the set control objective. The method was tested with a computer simulation, and the results obtained were compared with those of other methods designed to ensure specific system responses in the designed control systems. The comparisons confirm the proposed method’s ability to achieve the desired reference response and demonstrate its effectiveness in overcoming the limitation of permissible time delays present in other similar methods.
1. Introduction
In spite of innovations in predictive and advanced control techniques, PID controllers are widely used in industries. Due to the introduced extensions and optimal tuning, they can meet even the highest requirements of the user. These controllers can use their inherent capabilities according to the dynamics of the processes and the requirements of the control systems. Depending on the control objective and the tools used, they can be classified into several groups based on response characteristics, ensuring the required stability margin, minimizing an appropriate performance criterion. Methods making use of the internal model control approach or the direct synthesis method should also be included in this list.
The descriptions of such methods are available in the literature. Probably the best-known method, developed by Ziegler and Nichols [], was directed at the adequate stability margin and maintained similar properties via set-point tracking and disturbance rejection. A ¼ decay ratio is considered to be a design criterion for this method. Some tuning methods are based on the process reaction curve [,,]. Riviera et al. [] and Zhuang and Atherton [] discussed tuning based on performance minimization criteria.
The development of an internal model controller (IMC) by Morari and Zafiriou [] paved the way for the formulation of PID controller settings that would be the equivalent of an adequate first- or second-order IMC controller [,,,].
When a control system is primarily intended to follow set-point changes, it is often expected to reach new set-points without overshooting and preferably in the shortest possible time. The requirements formulated above also take into account the economic aspect of the control process, as their required control costs are low, as opposed to time-optimal control systems. Several methods of tuning PI/PID controllers have been developed with the goal of set-point tracking with the minimum settling time and without overshooting. The first to be mentioned is the method proposed by Chien, Hrones, and Reswick (CHR) [], in which proportional, integral, and derivative values of the controller settings depend on the parameters of the First-Order Plus Dead-Time (FOPDT) model.
Tuning methods based on heuristic methods can be very helpful in the controller design process. Controller parameters similar to the CHR method can be determined on the basis of the so-called nomograms, which graphically represent the controller parameter dependencies, such as a function of the ratio of the time delay (θ) and the time constant (T). A certain inconvenience in using nomograms is the logarithmic scale of both the axes of these plots.
By their nature, however, these methods are only approximate. A clearer approach to this issue is provided by the direct synthesis method. If the expected requirements illustrating the control objective are reflected in the form of the desired closed-loop transfer function, it is sufficient to know only the model in order to design the controller. The use of this method for tuning controllers was presented by Dahlin [], Smith and Corripio [], and Chen and Seborg []. In this case, too, a significant difficulty in determining the correct regulator settings is the time delay occurring in the control process.
The lack of an analytical method for tuning controllers of time-delayed processes allowed for determining such regulator settings, which would ensure the desired but also achievable response of the system. This, in turn, generated motivation to undertake research in this area of knowledge.
The paper is organized as follows: The next chapter, which is Section 2, describes the controller design method using direct synthesis for typical inertial objects, including inertia without delay as an important reference point for further arguments. The derivation and the description of the proposed method are included in Section 3. The simulation results are given in Section 4. Section 5 is devoted to the comparison of the proposed method with other controller tuning methods aimed at achieving similar control goals. Section 6 contains a short summary of the obtained research results.
2. Direct Synthesis Method
The most convenient application area of direct synthesis is the design of open-loop control systems, which has also been applied in the internal model control []. It can also be used for controller tuning in closed-loop systems with feedback [,,]. In the direct synthesis (DS) approach, an analytical expression for the feedback controller is derived from a process model and a desired closed-loop response. In most of the DS literature, the desired closed-loop response is expressed as a closed-loop transfer function for set-point changes. This transfer function can be formulated based on the pole-placement approach or on the basis of the predicted system response calculated using the inverse Laplace transform.
The transfer function with a unity feedback loop involving a controller and a plant is equal to
where Gc—closed-loop transfer function, Gr—regulator transfer function, Gp—plant transfer function.
The open-loop transfer function Go(s) = Gr(s)·Gp(s) can also be expressed as
where Go—open-loop transfer function.
From Equation (2), we can obtain the transfer function of the controller:
After inserting in place of the desired transfer function of the closed-loop system Gdc(s) and generally replacing the unknown transfer function of the plant with the model Gm(s), the controller capable of achieving the control objective can be derived from the following relationship:
As a result of synthesizing a controller using the direct method, its structure may be different from that of a PI or PID controller. On the other hand, based on the simplest models of the process and after selecting the appropriate form of the desired transfer function for the closed loop, it is possible to obtain one of the classic controllers and determine its required settings along the design process. The direct synthesis method was the subject of an extensive article by Chen and Seborg published in 2002 [], later cited multiple times in papers regarding the subject. Their authors derived analytical expressions for PI and PID controllers for typical processes.
2.1. First Inertial Order Model
We considered first the case, which, although trivial, provides a reference point for time-delayed processes. Certain processes can be described with a simple first-order model:
where K—static gain, T—time constant.
When using a PI controller with an “ideal” structure,
where Kp—proportional gain, Ti—integral time constant.
With an integral time constant Ti = T, the closed-loop transfer function is equal to
We shall assume that the desired transfer function of the closed-loop system is to be equal to
which would provide a response without overshooting with inertia equal to τc.
From (7) and (8), it can be seen that by selecting the proportional gain
we can obtain the desired transfer function of the system (7).
The overshoot in the response of such a system will be zero. The time constant of the closed-loop transfer function determines the settling time ts, i.e., the time after which the response will be permanently contained in the assumed error band Δ.
where r—reference signal.
The response of the system after a time equal to the settling time should reach a value of
If we take the error band Δ equal to 2%, then by comparing (10) to (11), we calculate the formula for the expected settling time.
τc—closed-loop time constant.
2.2. First-Order plus Dead-Time (FOPDT) Model
For time-delayed processes, the dynamics of a simple plant similar to (5) is better reflected in the FOPDT model. With the help of the dead time term, we can also model the high-frequency part of its dynamic.
where θ—time delay.
When applying this model to determine PI controller settings, the recommended integral time constant Ti of the designed PI controller remains unchanged, but the calculation of the appropriate proportional gain Kp already encounters an additional difficulty.
Dahlin [] and later Pannil [] adopted the desired transfer function of a closed-loop system as in (8) but only considered the dead time introduced by the plant itself:
Then, according to (2), the desired transfer function of the open-loop system should be equal to
Thus, the transfer function of the PI controller is as follows:
To make this transfer function realizable, Dahlin approximated the exponential term by a Taylor series expansion:
reaching for only its first two terms
and he obtained a relationship for the controller transfer function:
Comparing it to a PI regulator (6), its settings should be equal to
Although the course of Smith and Corripio’s [] as well as Chen and Seborg’s [] considerations was a little different, as they applied the first-order Taylor approximation already at the stage of defining the desired closed-loop transfer function, inserting (18) into (14), which gave
they obviously obtained the same results (19,20).
Also, Kumar, Singh [], and Panda, Yu, and Huang [] approximated the exponential term by Taylor’s series expansion only up to the 2nd order term. In the next step, they obtained the ideal form of the PID controller, applying the Maclaurin series expansion theorem. On the other hand, in relationship (15), Abbas [], Ajmeri and Ali [], and Rao, Rao, and Chidambaram [] replaced the exponential term using the Padé approximation, which according to Skogestad [] is more accurate:
Thus, Abbas derived the relations for the recommended settings of the PI controller:
2.3. Second-Order plus Dead-Time (SOPDT) Model
If the inertial plant has a dominant time constant, it can be sufficiently well approximated using the FOPTD model. When this is not the case, the properties of the plant can be better approximated using the SOPDT model, with a transfer function in the following general form:
where K—static gain, T—time constant, ξ—non-dimensional damping factor, θ—time delay.
If ξ ≥ 1, the SOPDT model can be represented as follows:
where T1, T2—time constants.
A PID controller can also be used to control a second-order process. Let us now determine the simplified transfer function of the open-loop system, assuming that the plant (26) is controlled by an ideal PID controller:
where Kp proportional gain, Ti—integral time constant, Td—derivative time constant.
Chen and Seborg assumed that the desired closed-loop transfer function is to be the same as that of the first-order plant (13). To achieve this goal, after carrying out the derivation as in the previous section, they recommend the following settings:
Identical PI/PID settings were obtained by Riviera, Morari, and Skogestad using the IMC approach [].
The Chien method [] belongs to the methods of tuning PID controllers based on direct synthesis dedicated to control the processes described by Equation (2). These settings should be equal to
The tuning parameter τc is almost equivalent to the closed-loop time constant .
3. Description of the Modified Method
Typically, it is accepted that the main problem in deriving the regulator by this (DS) method when dealing with time-delayed processes lies in the approximation of the time delay, while it is overlooked that the very assumption of the desired closed-loop transfer function in the form of (13) or (21) constitutes a certain pitfall. If we analyze the presented tuning methods, it becomes clear that the determined controller settings will not allow for the response defined by these transfer functions. From (21), it would follow that the controller output at the instant when changing the reference is y(t = 0+) = −θ/τc, which, after all, is not true. Although the used approximations of the exponential term are correct, by using only the first two or three terms, they can provide a relatively good approximation only for law values of the delay, but then, the set values (20) will be only slightly different from those given in formulas (7) and (8). In general, the longer the dead time, the more significant the effects of omitting the higher order terms will be.
Dahlin followed by Pannil and all [] point out this limitation and recommend that the θ/T ratio should not exceed ¼.
Suppose that the open-loop system contains a significant transport delay; the desired transfer function of the closed-loop shall be equal to
To avoid the mentioned drawbacks, the tuning of the regulator, which is calculated to provide a non-oscillatory transient in the shortest time possible, will be carried out differently.
In the first-order system described by (6), the proportional gain of the controller (8) under assumption (7) only affects rise and settling time. In time-delayed first-order systems, an increase in Kp leads to oscillations of the controlled variable, which is characteristic of systems with complex poles. To avoid them and at the same time ensure the shortest settling time, the proportional gain of an open-loop system should be chosen so that the closed-loop system is critically damped. To determine it, the root-locus method was used.
3.1. Root-Locus Method
The block diagram of a closed-loop control system with an ideal PI regulator (18) controlling the plant Gp(s) is shown in Figure 1.

Figure 1.
The block diagram of a closed-loop control system.
A root-locus plot will be used to analyze this system. Thanks to it we can find the values of the design parameter Kp for specific pole locations along the root-loci. These are used to show movement of the roots of the characteristic equation for all the values of a system parameter. We plot the roots of the closed-loop characteristic equation:
where Go(s)—open-loop transfer function.
1 + Go(s) = 0
The characteristic polynomial of the closed-loop system after extracting the proportional gain Kp from Go(s) will take the following form:
where .
1 + Kp · Go1(s)=0
This transfer function can be represented as the quotient of the polynomials of a numerator N and a denominator D:
Go1(s) = N(s)/D(s)
The root-locus plot depicts the trajectories of closed-loop poles when the feedback gain Kp varies from 0 to infinity. It can be treated as a set of a functions:
where sj(Kp), j = 1,…,n is the j-th root of Equation (32), and after taking into account (33), we can transform it to the following form:
D(s) + Kp · N(s)=0
One of the rules of the root-locus method says that the common points correspond to multiple elements of the characteristic equation of a closed-loop system and belong to the set of solutions of the equation
where D’(s) and N’(s) denote the derivatives of the polynomial denominator and numerator.
N(s)D’(s) − N’(s)D(s) = 0
This condition is a necessary condition for a given complex number s ∈ C to be a multiple element of the characteristic polynomial of the closed-loop system under consideration. Break-away (and break-in) points exist only on the real axis root-locus branches. If there exists a real axis root-locus branch between two open-loop poles, then there will be a break-away point in between these two open-loop poles. The branching point of the elemental lines corresponds to a critically damped system, i.e., one that meets the stated requirements.
3.2. FOPDT under PI Control
Assuming the simplest case, when the PI regulator (6) controls the FOPDT plant (13), the transfer functions of the open-loop and closed-loop system with unitary feedback (H(s) = 1) will be then equal to, respectively,
If the transient response is to be without overshoot, the zero of the closed loop should be compensated with the same pole. This will happen when the integral time constant is equal to the time constant of the model.
Then, the Equation (38) will be simplified to the form
which can then be transformed to (30).
The second-order system will be critically damped when both of its poles are located at the branch point of the root-locus plot, i.e., as follows from (36), when two conditions are satisfied, that is when the denominator of the transfer function of the closed-loop system D(s) and its derivative are equal to zero.
From this second relationship, we derive
Inserting the right-hand side of Equation (43) into (41) in place of the expression e−θs, we derive the following solution:
Inserting the value of the poles (44) into the characteristic Equation (41), it is possible to determine the proportional gain of the PI controller, at which the system will have double real poles, which means that it will be critically damped. Taking into account (39), this gain should be equal to
Minimization of Settling Time
In a control system with such calculated settings as (39) and (45), the settling time by assuming a 2% error band can be estimated from the following relationship:
If we assume that a very small overshoot is acceptable as long as it does not exceed the width of the error band, then the gain can be higher but should not exceed the value
Although such a control system will no longer be formally critically damped, it will allow for further reduction of the rise time and also the settling time, the latter to the value
3.3. SOPDT under PID Control
Carrying out a similar derivation as in Section 3.2, after determining the simplified open-loop transfer function (27), we derive the relation for the closed-loop system with unitary feedback:
If we assume that the integral time constant of the PID controller is equal to the sum of the time constants of the model
and derivative time constant has a value
then after simplifying (49), we derive
In order for the transfer function of the closed-loop system (52) to be equal to the one desired (30), in addition to the assumed conditions (50) and (51), the proportional gain of the controller should be equal to
If Kp, similarly considered in Section Minimization of Settling Time, will be increased to a value
then the overshoot χ will remain smaller than the width of the error band equal to 2% of the set-point change, and the settling time will be shorter than it is in a critically damped system.
Control of a Critical Damped SOPDT Object
There are quite a few methods in the literature for determining the SOPDT model (26) [,,,], but generally, these are very complicated procedures. It is much simpler to create a critical damped SOPDT model, which can be representative of many inertial plants with fairly high accuracy. A model of this class described by the transfer function
can be obtained using the Åström–Hägglund relay method [].
The control objective given by the desired closed-loop transfer function (30) remains unchanged; that is, by set-point tracking, the non-oscillatory response of the system should be ensured in the shortest possible time. If a PID controller is included in the loop, the closed-loop transfer function will then be equal to
If the priority of the designed control system is the set-point tracking, then we can tune the system so that the poles compensate the zeros introduced by the controller into the system. If we assume that the integral and the derivative time constants will be equal to, respectively,
then the closed-loop transfer function will take the following form:
For a closed-loop system to be critically damped, the proportional gain of the PID controller should be equal to
If while maintaining the condition of overshoot of the response, the settling time was to be the shortest possible, the proportional gain can be increased to the value of
4. Simulations Results
To check the theoretical performance of controllers tuned on the basis of the given relationships, simulation studies were carried out using the Matlab/Simulink 2023b software. First of all, it was demonstrated to what extent the proposed controller tuning method is capable of achieving the desired transfer function of a closed-loop system when a PI controller or a PID controller is used. In addition, the performance obtained was compared with the control quality of systems with conventional controllers that were tuned based on other known rules, including those formulated also using the direct synthesis method, to control the same plants and that were aimed at achieving the same objectives. Simulation studies also included cases where the transfer function of the model differs from that of the plant.
4.1. FOPDT
- Example 1
The plant is described by the following transfer function:
If we want to obtain a non-oscillatory response in the critical damped system in the shortest time possible, we have to calculate the PI controller settings based on (39) and (45), obtaining Ti = 4, Kp = 0.3679. When the model accurately reflects the object, the shortest settling time with the assumed time constant will be obtained when Kp1 = 0.4598. Then, the overshoot will remain less than 2% of the error band, and the settling time will be shortened to the estimated value of (46).
The obtained system responses for the both proportional gains as well as the reference response of the critically damped system (26) are shown in Figure 2.
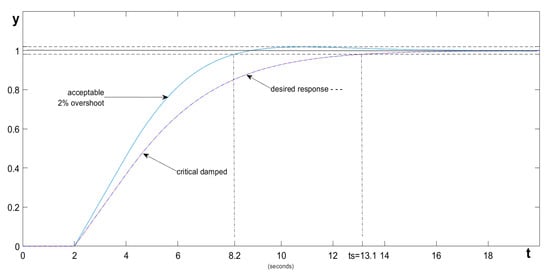
Figure 2.
System responses.
4.2. Overdamped SOPDT
- Example 2
We consider a second-order plant with a dead time
The ideal PID controller settings calculated from (50), (51), and (53) are equal to Kp = 1.103, Ti = 12 s, Td = 2.667 s. The proportional gain providing the shortest settling time (54) should be equal to Kp2 = 1.3795. The systems responses are shown in Figure 3. As can be seen from it, the controlled variable coinciding with the desired closed-loop response while increasing the proportional gain to (54) reduced the settling time ts without exceeding the permissible error band.
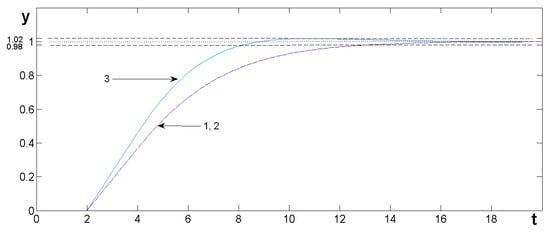
Figure 3.
System responses: 1—desired closed loop, 2—critically damped closed loop, 3—overshoot less than 2%, minimum settling time.
4.3. Critical Damped SOPDT
- Example 3
The transfer function of the considered plant is equal to
If we use a PID controller, its settings calculated according to the described method (57) and (59) will be equal to Kp = 0.7358, Ti = 8 s, Td = 2 s. If we wanted to derive the shortest settling time without exceeding the 2% error band, the proportional gain calculated from the relationship (60) would have to be Kp2 = 0.9197. Both systems’ responses are presented in Figure 4. The achieved settling times correspond to the values estimated in the relations (46) and (48).
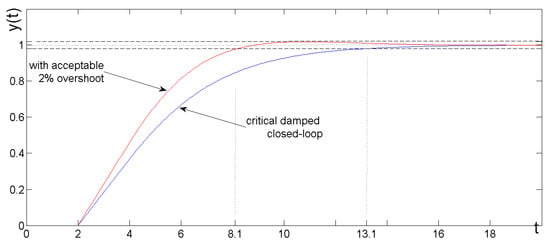
Figure 4.
The response of a system controlled by a PID controller.
4.4. Sensitivity and Robustness Testing
Often, robustness tests test hypotheses of the format H0–H1: H0 if the assumption made in the analysis is true and H1 if the assumption made in the analysis is false. Examples 1–3 confirm the thesis that the presented method of tuning PI/PID controllers allows us to determine such settings that ensure the compliance with the requirements for transient processes in the designed control system. This will be the case (H0) when the control plant has the assumed dynamics.
When the models do not fully reflect the dynamic properties of the control process, the transient time series may not be as expected.
4.4.1. Models with Inaccuracy
This subsection contains the results of the tests aimed at checking how sensitive the designed control system is to such parameter changes. If the model and plant parameters K and θ differ, their influence on the PI and PID controller settings only applies to the proportional gain Kp (45). If their product K·θ decreases by no more than 20%, the overshoot will remain as less than 2% error bands, which result from (47). However, as this product increases, the system will become overdamped, and the settling time will also increase. The inaccuracy due to the determination of the time constant T affects all the PID controller settings proportionally, which with an ideal structure results in a change in the relationship between the integrating part on the one hand and the proportional and derivative part on the other. Moreover, the zeros of the controller will no longer compensate the poles of the closed system. The time series of the output variable for both cases are shown in Figure 5.
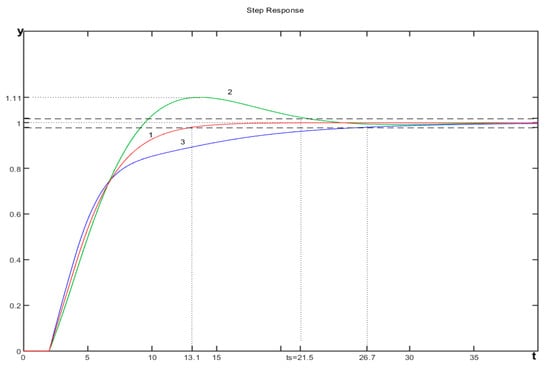
Figure 5.
Time series of controlled value 1—by model accuracy; 2—with the time constant T 20% larger; 3—with the time constant T 20% lower.
4.4.2. Models with Uncertainty
This section tests whether the control system is sufficiently robust to uncertainties in its mathematical model. Further examples concern cases when the models do not fully reflect the dynamic properties of the control process, and therefore, this assumption will not be met. It is clear that when the model uncertainty is large, it will not be possible to meet the requirements set for the control system. On the other hand, such studies are expedient because if it were to turn out that the developed design method is too sensitive to model uncertainty, it should not be recommended.
- Example 4
If the plant, despite being a higher-order object, has a dominant time constant, then its model can be fairly accurately represented by a first-order transfer function with a time delay (12).
These conditions are met by the process
whose model
can be used to determine the PI controller settings. Based on relationships (39) and (45), it was calculated that Ti = 8.15 and Kp = 2. A comparison of the system response with the reference response is shown in Figure 6.
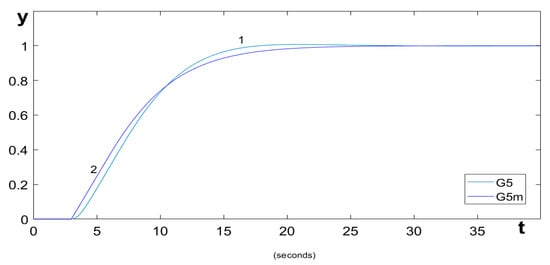
Figure 6.
1—Response of the system described by the transfer function G5(s). 2—Response of the reference signal (desired response) calculated for its model G5m(s).
- Example 5
We consider an example taken from []:
The FOPDT model of the plant
is unable to adequately cover the dynamics of the process accurately. The controller settings calculated from this model are Kp = 0.5309 and Ti = 8.3 s. As a result of the high model uncertainty, the response of the system (Figure 7, (1)) already shows a slight overshoot, which also increased, and referred to (42), the settling time is ts = 94.3 s. In this case, however, the SOPDT model has much less model uncertainty:

Figure 7.
Responses of the control system obtained in Example 5. 1—PI with settings calculated based on the FOPDT model; 2—reference response; 3—PID with settings calculated based on the SOPDT model.
Using the described method on the basis of the adequate relationships for such models, (49), (50), and (53), the PID controller settings Kp = 0.7516, Ti = 8.15, and Td = 5.1663 were obtained. The controller designed in this way allowed us to achieve the expected control performance, as indicated by the comparison of the system response (Figure 7, (3)) with the reference response (2).
5. Comparison with Other Known Methods
The comparison with other methods of tuning PI/PID controllers was carried out in terms of meeting the requirements set for the control system. The control task was to obtain the response of the system without overshooting in the shortest time possible and, obviously, the steady state error equal to zero. The proposed method was compared with the CHR method. In the latter case, the time constant of the desired closed-loop transfer function was required, which is essential for the obtained waveforms. The comparison is therefore between the two cases. The first assumes that the desired time constant will coincide with the parameter τc, while the other assumes that it will be chosen so as to provide the settling time determined as in (12), except that it will be additionally extended by the dead time of the system response equal to θ.
The settling time tsd of system (13) at can be estimated from the relationship
5.1. Chien Hrones Reswick Method
To control plant G2 (Ex.1) for set-point tracking, the PI controller (6) settings were also calculated using the CHR method [].
The time series of the controlled variable y(t) obtained with controllers tuned by the two compared methods are shown in Figure 8.
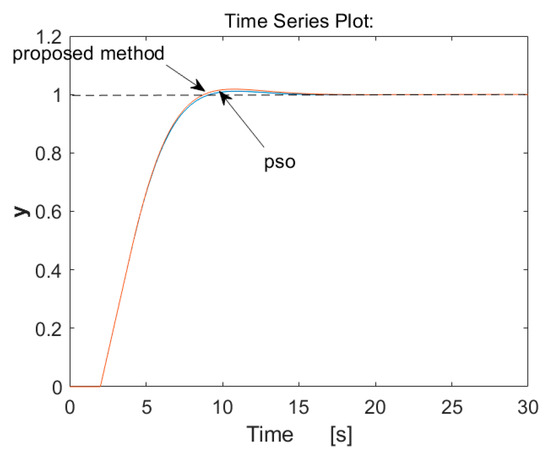
Figure 8.
Responses of the system with the PI regulator controlling the G2 plant, designed according to the proposed method and CHR method.
5.2. Chen–Seborg Method
In this section, we shall compare the control performance obtained in Example 1 with the increased gain Kp1 (54), allowing for a reduction in settling time with the regulator designed by the Chen–Seborg method. The required time constant of the closed-loop system τc is chosen so that the settling time of the reference response (14) is the same as that obtained by the proposed method in the considered example. Then, in order to obtain the non-oscillatory response in time ts achieved in Example 1, the required settling time tsd, taking into account the output delay of θ = 2 s (61), would be 6.17 s, and thus, the inertia time constant of the desired closed-loop system according to (12) should be equal to . However, the settings calculated with this method, , lead to an overly strong control action, resulting in overshooting, which further increases the settling time from the desired 8.17 to 12 s. I is clearly visible in Figure 9.
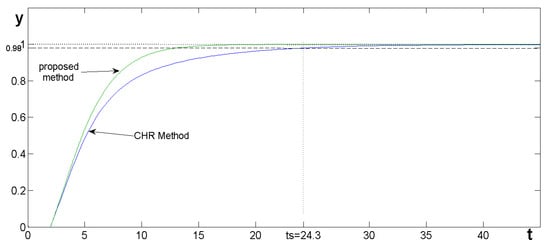
Figure 9.
Responses of a system with a PI controller, controlling the G2 plant designed according to the proposed method and the method described by Chen and Seborg. 1—the desired response of the proposed method for minimum settling time, 2—the desired response assumed in the Chen–Seborg method, 3—the output of the system.
5.3. Abbas Method
A comparison of the proposed method with the Abbas method was performed similarly to that described in Section 5.2. The required regulator settings calculated from the relationships (23) and (24) and adopting the τc values from the previous section should be equal to . The simulation of the operation of this system produced the results, which are illustrated in Figure 10.
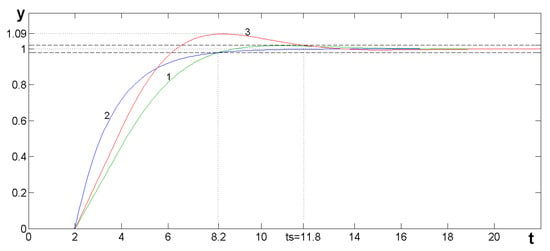
Figure 10.
Responses of the system with a PI controller controlling the plant from Example 1 tuned using the proposed method and the method described by Abbas [].
Of course, using a different desired transfer function of a closed-loop system with a longer time constant τc using this method, we can obtain a response with overshooting within a 2% error band and then also with the shorter settling time of 15.1 s, but the achieved response and the reference process response given by the authors will still differ.
To complete the comparison between the considered methods, integral indicators as:
ISE (Integral of Squared Error)
ITSE (Integral of Time-Squared Error)
IAE (Integral of Absolute Error)
ITAE (Integral of Time-Absolute Error).
where e(t) is the difference between the set-point input and controlled variable, were measured during the testing. The obtained results are summarized in Table 1.

Table 1.
Values of integral indicators.
In general, the smallest values of integrals were measured for time series with the shortest rise times.
5.4. Comparison with Tuning Methods Using the SOPDT Model
We shall assume that the plant is controlled by a PID regulator tuned using the described method and Chien’s method [] when K = 1, ξ = 1, T = 5, θ = 2. The PID controller settings calculated using the proposed method from the recommended relationships (57), (59), and (60) should have values of
The resulting response of the system is shown in Figure 11. The achieved settling time was 13.3 s. Since the proportional gain of the PID controller recommended by Chien depends on the assumed value of the parameter corresponding to the time constant of the desired response τc, in order for it to allow the system so tuned to achieve a similar settling time, that is, 13.3 s, it is necessary to determine the parameter τc from the following relationships:
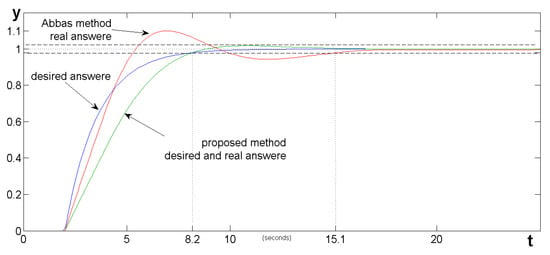
Figure 11.
Responses of the control system with a PI regulator controlling the G7 plant designed using the proposed method and Chien’s method.
Then, the desired closed-loop transfer function will be equal to .
Really, such Laplace transfer function Gc(s) will provide the response of the system at a settling time of 13.3 s. Then, the required regulator settings determined by the Chien methods should be equal to
Figure 11 compares the desired and actual responses obtained when tuning the PID controller using both methods.
Also, the controller tuned using Chien’s method does not allow for achieving the expected response that ensures the settling time, which is achieved in this control system but using the proposed method. If one were to take into account the recommendations given by Chien for the parameter τc, one would have to assume an even smaller time constant:
which would lead to even greater overshooting (χ = 20%) and a longer settling time (ts = 15 s).
5.5. Optimal Settings
A particle swarm optimization PSO algorithm [] was used to determine the optimal settings of a PID controller with a parallel structure controlling the plant of Example 2. The population of the candidate solution was assumed to be 16 particles. The objective function to be minimized was taken as follows:
where w1, w2—weight factors, e—error, u—control signal, T—time of the measurement.
The cost function takes a candidate solution as an argument in the form of a vector of real numbers [Kp Ki Kd] and produces a real number as the output, which indicates the objective function value of the given candidate solution Jc.
The constraints of the search space and the velocity vi ∈ Rn. were adopted arbitrarily, while the initial values were chosen randomly. The weight coefficients w1, w2 were assumed to be equal to 1 and 0.075, respectively. Parameters of the optimal, with respect to (62), controller were tuned, and after 90 iterations of the PSO algorithm, a vector [1.3653, 0.1132, 3.6896] was obtained, which minimizes the adopted objective function, taking into account control costs. The tuning process of optimal controller settings is shown in the Figure 12.
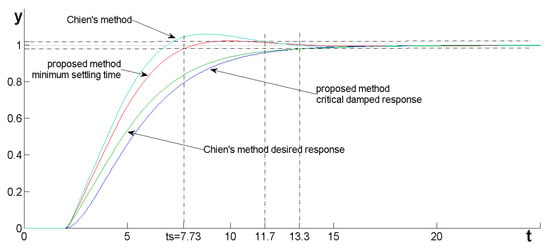
Figure 12.
Tuning process of optimal controller settings.
Meanwhile, the process of finding the minimum of the objective function is presented in Figure 13.
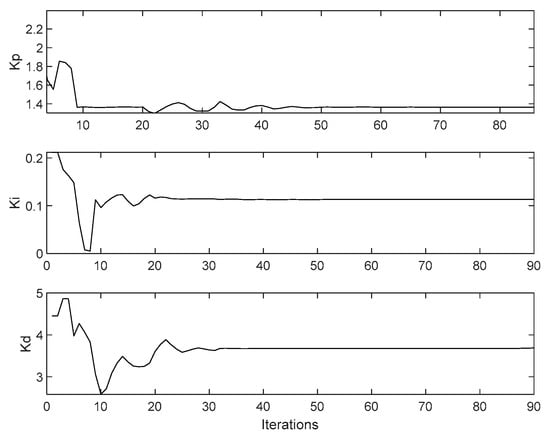
Figure 13.
The convergence curve of the designed controller on the PSO.
Figure 14 shows the responses of a system controlled by a PID controller with the settings determined by the proposed method and those determined by the PSO algorithm.
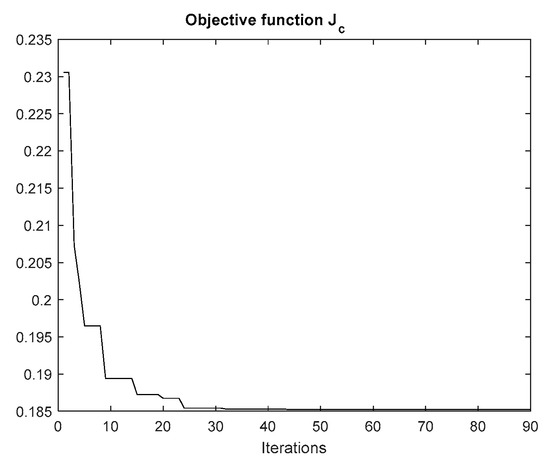
Figure 14.
Comparison with the optimally tuned PID controller.
In comparison, the measured value of the objective function Jc during control in the indicated time interval was 0.0013 higher than the one achieved during the last iterations (Figure 13). However, the value of Jc in the case of tuning the PID controller according to the proposed method was equal to 0.1826.
6. Conclusions
The presented method of tuning classical regulators based on direct synthesis makes it possible to precisely determine such regulator settings, controlling time-delayed processes, which will allow for achieving a critically damped response and, optionally, a non-oscillatory transition to a new set-point in the shortest time possible. The minimum settling time is limited by the dead time of the open loop. Unlike other methods, it can provide a pre-formulated desired system response, and most importantly, it can be used to control plants with long time delays. Its effectiveness in the presence of the model uncertainty depends on the quality of the adopted model. A controller tuned using it, as is the case with other methods based on dominant pole compensation, performs not so well in disturbance rejection affecting the control process.
Funding
This research was funded as part of a research project in the Marine Electrical Engineering Faculty, Gdynia Maritime University, Poland, grant No. WE/2024/PZ/03, entitled “New methods of controlling the motion of an autonomous ship in open and restricted waters”.
Institutional Review Board Statement
Not applicable.
Informed Consent Statement
Not applicable.
Data Availability Statement
Data and the calculations are contained in the article.
Conflicts of Interest
The authors declare no conflict of interest.
Nomenclature
| Abbreviations and Symbols | |
| IMC | Internal model control |
| FOPDT | First-Order Plus Dead-Time model |
| PSO | Particle swarm optimization |
| SOPDT | Second-Order Plus Dead-Time model |
| D(s) | Polynomial of a denominator |
| e | Error between the reference signal and the actual output value. |
| Gc | Closed-loop transfer function |
| Gdc | Desired closed-loop transfer function |
| Go | Open-loop transfer function |
| Gp | Transfer function of the plant |
| Gr | Controller transfer function |
| K | Static gain of the plant |
| Kp | Controller parameter, proportional gain |
| N(s) | Polynomial of a numerator |
| r | Reference signal |
| ts | Settling time |
| T, T1, T2 | Time constants |
| Td | Derivative time constant |
| Ti | Integral time constant |
| u | Control signal |
| w1, w2 | Weight factors |
| Δ | Error band |
| χ | Overshoot |
| θ | Dead time |
| τc | Closed-loop time constant |
References
- Ziegler, J.G.; Nichols, N.B. Optimum settings for automatic controllers. Trans. Am. Soc. Mech. Eng. 1942, 64, 759–768. [Google Scholar] [CrossRef]
- Åström, K.J.; Hägglund, T. PID Controllers: Theory, Design and Tuning, 2nd ed.; Instrument Society of America: Research Triangle Park, NC, USA, 1995. [Google Scholar]
- Cohen, G.H.; Coon, G.A. Theoretical considerations of retarded control. Trans. Am. Soc. Mech. Eng. 1953, 75, 827–834. [Google Scholar] [CrossRef]
- Tyreus, B.D.; Luyben, W.L. Tuning PI controllers for integrator/dead-time process. Ind. Eng. Chem. Res. 1992, 31, 2625–2628. [Google Scholar] [CrossRef]
- Rivera, D.E.; Morari, M.; Skogestad, S. Internal model control, 4. PID controller design. Ind. Eng. Chem. Process Des. Dev. 1986, 25, 252–265. [Google Scholar] [CrossRef]
- Zhuang, M.; Atherton, D.P. Automatic tuning of optimum PID controllers. IEE Proc. D Control Theory Appl. 1986, 140, 216–224. [Google Scholar] [CrossRef]
- Morari, M.; Zafiriou, E. Robust Process Control; Prentice Hall: Englewood Cliffs, NJ, USA, 1989. [Google Scholar]
- Chien, I.-L. IMC-PID controller design—An extension. In Proceedings of the IFAC Adaptive Control of Chemical Processes Conference, Copenhagen, Denmark, 17–19 August 1988; pp. 147–152. [Google Scholar]
- Shamsuzzoha, M.; Lee, M. IMC Filter Design for PID Controller Tuning of Time Delayed Processes, PID Controller Design Approaches; IntechOpen: London, UK, 2012; pp. 253–286. ISBN 978-953-51-0405-6. [Google Scholar] [CrossRef]
- Wang, Q.-G.; Hang, C.C.; Yang, X.-P. Single-loop controller design via IMC principles. Automatica 2001, 37, 2041–2048. [Google Scholar] [CrossRef]
- Chien, K.L.; Hrones, J.A.; Reswick, J.B. On the automatic control of generalized passive systems. Trans. Am. Soc. Mech. Eng. 1952, 74, 175–183. [Google Scholar] [CrossRef]
- Dahlin, E.B. Designing and Tuning Digital Controllers. Instrum. Control. Syst. 1968, 41, 77. [Google Scholar]
- Smith, C.A.; Corripio, A.B. Principle and Practices of Automatic Process Control, 2nd ed.; John Wiley & Sons: Hoboken, NJ, USA, 1997; pp. 303–355. [Google Scholar]
- Chen, D.; Seborg, D.E. PI/PID controller design based on direct synthesis and disturbance rejection. Ind. Eng. Chem. Res. 2002, 41, 4807–4822. [Google Scholar] [CrossRef]
- Anwar, M.N.; Shamsuzzoha, M.; Pan, S. A Frequency Domain PID Controller Design Method Using Direct Synthesis Approach. Arab. J. Sci. Eng. 2015, 40, 995–1004. [Google Scholar] [CrossRef]
- Kumar, M.; Singh, R.S. PID Controller Design for SOPDT using Direct Synthesis Method. Int. J. Intell. Syst. Appl. 2019, 9, 56–64. [Google Scholar] [CrossRef]
- Seborg, D.E.; Edgar TFMellichamp, D.A. Process Dynamics and Control; John Wiley & Sons: New York, NY, USA, 1989. [Google Scholar]
- Pannil, P.; Julsereewong, P.; Ukakimaparn, P.; Tiraseath, K. Automatic PID Controller Parameter Analyzer. KoreaScience 1999, 288–291. Available online: https://koreascience.kr/article/CFKO199911921876039.page (accessed on 20 June 2024).
- Panda, R.C.; Yu, C.C.; Huang, H.-P. PID tuning rules for SOPDT systems: Review and some new results. ISA Trans. 2004, 43, 283–295. [Google Scholar] [CrossRef]
- Abbas, A. A new set of controller tuning relations. ISA Trans. 1997, 36, 183–187. [Google Scholar] [CrossRef]
- Ajmeri, M.; Ali, A. Direct synthesis based tuning of the parallel control structure for integrating processes. Int. J. Syst. Sci. 2015, 46, 2461–2473. [Google Scholar] [CrossRef]
- Rao, A.S.; Rao, V.S.R. Chidambaram M. Direct synthesis-based controller design for integrating processes with time delay. J. Frankl. Inst. 2009, 346, 38–56. [Google Scholar]
- Skogestad, S. Probably the best simple PID tuning rules in the world. J. Process Control. 2001, 77, 276h. [Google Scholar]
- Kula, K.S. Online SOPDT model identification method using a relay. Appl. Sci. 2023, 13, 632. [Google Scholar] [CrossRef]
- Bajarangbali, R.; Majhi, S.; Pandey, S. Identification of FOPDT and SOPDT Process Dynamics Using Closed Loop Test. ISA Trans. 2014, 53, 1223–1231. [Google Scholar] [CrossRef]
- Kasi, V.R.; Majhi, S.; Gogoi, A.K. Identification and PID tuning techniques for stable and unstable SOPDT processes. Int. J. Dynam. Control 2018, 6, 1194–1206. [Google Scholar] [CrossRef]
- Ramakrishnan, V.; Chidambaram, M. Estimation of a SOPTD transfer function model using a single asymmetrical relay feedback test. Comput. Chem. Eng. 2003, 27, 1779–1784. [Google Scholar] [CrossRef]
- Sibalija, T.V. Particle swarm optimization in designing parameters of manufacturing processes. Appl. Soft Comput. J. 2019, 84, 105743. [Google Scholar] [CrossRef]
Disclaimer/Publisher’s Note: The statements, opinions and data contained in all publications are solely those of the individual author(s) and contributor(s) and not of MDPI and/or the editor(s). MDPI and/or the editor(s) disclaim responsibility for any injury to people or property resulting from any ideas, methods, instructions or products referred to in the content. |
© 2024 by the author. Licensee MDPI, Basel, Switzerland. This article is an open access article distributed under the terms and conditions of the Creative Commons Attribution (CC BY) license (https://creativecommons.org/licenses/by/4.0/).