Abstract
In order to achieve the International Air Transport Association’s (IATA) goal of achieving net-zero emissions in the aviation industry by 2050, there has been a growing emphasis globally on the technological development and practical application of sustainable aviation fuels (SAFs). Discrepancies in feedstock and production processes result in differences in composition between SAFs and traditional aviation fuels, ultimately affecting the emission performance of the two types of fuel. This paper discusses the impact of CO2/NOx/SO2/CO/PM/UHC emissions from the aviation industry on the natural environment and human health by comparing the two types of fuel under the same conditions. Fuel combustion is a complex process in the combustor of an engine, which transfers chemical energy into heat energy. The completeness of combustion is related to the fuel properties, including spray, evaporation, and flammability. Therefore, engine performance is not only affected by fuel performance, but also interacts with engine structure and control laws. The CO2 emissions of SAFs differ significantly from traditional aviation fuels from a lifecycle analysis perspective, and most SAFs can reduce CO2 emissions by 41–89%. Compared with traditional aviation fuels, SAFs and blended fuels can significantly reduce SO2 and PM emissions. Pure Fischer–Tropsch hydroprocessed synthesized paraffinic kerosine (FT-SPK) can reduce SO2 and PM emissions by 92% and 70–95% respectively, owing to its extremely low sulfur and aromatic compound content. In contrast, the differences in NOx emissions between the two types of fuel are not significant, as their generation mechanisms largely stem from thermal drive and turbulent flow in the combustor, with emissions performance being correlated to power output and flame temperature profile in engine testing. CO and UHC emissions are related to engine operating conditions and the physical/chemical properties of the SAFs, with no significant upward or downward trend. Therefore, SAFs have significant advantages over conventional aviation fuels in terms of CO2, SO2, and PM emissions, and can effectively reduce the hazards of aviation to the environment and human health.
1. Introduction
The reduction of carbon emissions is paramount for ensuring the sustainable development of the aviation industry [1,2]. According to the 77th IATA Annual General Meeting, IATA has committed itself to achieving Fly Net Zero by 2050. Among the various methods supporting sustainable development in the aviation industry, SAF technology contributes the most to carbon reduction. The Air Transport Action Group (ATAG) predicts, in its Waypoint 2050 report, that SAFs, aviation technology innovation, operational measures, and upgrades to technical infrastructure, as well as other measures (such as market mechanisms), will contribute 71%, 12%, 9%, and 8%, respectively, to the Fly Net Zero plan. Compared with other methods of reducing carbon emissions in the aviation industry, such as engine technology upgrades, operations and infrastructure measure improvements, there is significant room for progress in the development of SAF technology [3,4]. Technologies such as electric, hybrid, and hydrogen-powered aircraft face numerous technical barriers, including powerplant innovation, hydrogen storage and transportation, and airport infrastructure redevelopment, making widespread adoption by 2050 challenging. The advantage of SAFs lies in their ability to serve as a “drop-in” replacement, without requiring changes to existing engine and combustion chamber designs. SAF production in 2024 is expected to triple compared with 2023, reaching 1.5 million tons (0.53% of 2024 aviation fuel demand), with a projected increase to 62 million tons globally by 2030 [5]. Reports indicate that the global airline market will grow at a compound annual growth rate (CAGR) of 9.3% from 2022 to 2030, with China’s CAGR at 11.2% [6]. Given the aviation industry’s rapid growth and the significant volume of traditional aviation fuel usage, detailed understanding of the emission performance of SAFs is crucial to achieving Fly Net Zero.
Unlike conventional, petroleum-based aviation fuels, SAFs can be derived from energy crop biomass, waste oils, or solid agricultural residues [7,8,9]. These renewable materials can capture and sequester atmospheric CO2 during their growth, creating a closed-loop carbon cycle upon combustion and thereby reducing net carbon emissions. From the perspectives of raw materials and preparation processes, nine bio-jet fuel production pathways have been certified according to ASTM D7566. Consequently, the composition of SAFs differs from traditional aviation fuels. For instance, the maximum mass fraction of aromatics in SAFs such as Fischer–Tropsch hydroprocessed synthesized paraffinic kerosene (FT-SPK), synthesized paraffinic kerosene hydroprocessed esters and fatty acids (HEFA SPK), synthesized iso-paraffins (SIP), alcohol-to-jet synthetic paraffinic kerosene (ATJ-SPK), and hydroprocessed hydrocarbons, esters, and fatty acids (HC-HEFAs) cannot exceed 0.5%, while the sulfur content must be less than 15 ppm [10]. In contrast, according to ASTM D1655, Jet A or Jet A-1 fuel allows for maximum aromatic volume fractions and total sulfur mass fractions of 26.5% and 0.3%, respectively [11]. The composition of the fuel not only closely correlates with combustion performance within the combustion chamber but also influences engine exhaust emissions [12,13,14]. This is a critical concern for engine manufacturers [15]. The low aromatic and sulfur content of SAF will reduce particulate matter and sulfur dioxide emissions, promoting cleaner combustion behavior in aviation engines [16]. In addition to compositional differences, SAFs and conventional aviation fuels exhibit some differences in physical and chemical properties. For example, according to ASTM D7566, the final boiling points of Jet A or Jet A-1 fuel and SIP fuel are limited to 300 °C and 255 °C, respectively. The viscosity ranges at 15 °C for Jet A or Jet A-1 fuel and FT-SPK fuel are 775–840 kg/m3 and 730–770 kg/m3, respectively. Differences in volatility, thermal stability, and viscosity result in SAFs exhibiting different atomization and combustion performance in existing aircraft engines compared with conventional aviation fuels. This can affect pollutant emissions such as CO, NOx, and unburnt hydrocarbons (UHC) to some extent, although engine operating conditions have a greater influence.
Current research on SAF emissions has some shortcomings. Firstly, due to the high fuel consumption and costs during engine testing, there is limited research on fuel emissions performance at the engine level [17] and even at aircraft levels and reviews on engine-level pollutant emissions remain scarce. Secondly, compared with traditional aviation fuels, SAFs demonstrate significant advantages in emissions performance regarding SO2 and PM, which is widely acknowledged. However, there is controversy regarding the differences in emissions performance for CO and NOx between sustainable and petroleum-based aviation fuels. As CO and NOx emissions are partially attributed to engine properties rather than solely to fuel [18], it is necessary to conduct synthesis and analysis. Thirdly, the effects of various aviation pollutants on human health are less addressed and should be given significant attention. Air pollution, while contributing to climate change, is also the greatest environmental threat to global public health, causing an estimated 7 million premature deaths annually, with 20% of global newborn deaths attributed to air pollution exposure. Air pollution exposure is linked to many major global diseases; for instance, it is associated with 20% of global ischemic heart disease deaths, and PM2.5 air pollution can lead to stroke, heart disease, lung disease, lower respiratory diseases (e.g., pneumonia), and cancer [19]. Transportation is one of the largest sources of air pollution, with fossil fuel air pollution responsible for 18–21.5% of global deaths annually [20]. Studies indicate that excess mortality due to aviation emissions will be significantly higher in 2050 compared with 2006. However, considering improved fuel policies (widespread use of SAFs and technological and operational improvements), the number of deaths among adults aged 25 and older is projected to decrease by 72% in 2050 compared with a scenario with no fuel improvements [21].
According to simulation data on global commercial aviation emissions in 2020 and estimates of domestic aviation emissions in China from 2014 to 2019, the approximate order of pollutants from highest to lowest is CO2, NOX, CO, SO2, PM and UHC (the specific order may vary between the two data sets) [22,23]. This paper will systematically evaluate the impacts of six aviation pollutants on both the ecological environment and human health in Section 2.1, Section 2.2, Section 2.3, Section 2.4, Section 2.5 and Section 2.6, while also comparing the performance of sustainable and traditional petroleum-based fuels in corresponding pollutant emissions (a small portion of the fuels mentioned in the article belong to biofuels rather than SAFs and are here for reference). The emission of CO2 will be compared and elucidated using life cycle analysis (LCA), while the emissions of other pollutants will be contextualized at the engine level. A comprehensive comparison of emission performance between SAFs and traditional aviation fuels will be elaborated in Section 2.7. This paper may contribute to the understanding of SAF benefits on emissions performance.
2. Aviation Fuel Emissions
2.1. LCA of CO2 Emissions
In 2019, the aviation industry contributed approximately 3% of global CO2 emissions. Without swift technological advancements and enhanced policies, CO2 emissions from aviation could increase 2.5× from 2015 to 2050 [24]. However, projections suggest that, by mid-century, this figure could increase to 4.6–20.2%, due to a projected annual growth rate of 5% in aviation activities. Aviation and road transportation emit 560–867 g and 45–102 g of CO2/ton-km, respectively, with the former being approximately ten times higher than the latter [25]. CO2 emitted from aircraft engines during complete fuel combustion is released directly into the upper atmosphere, playing a significant role in climate change [26,27]. CO2, as the most prominent greenhouse gas (GHG), possesses the ability to absorb and re-emit thermal radiation (infrared radiation) and has a long atmospheric lifetime [28]. The increasing concentrations of CO2 and other GHGs in the atmosphere lead to the absorption and re-emission of more infrared radiation emitted from the Earth’s surface, resulting in an overall increase in the retention of heat in the Earth’s atmosphere [29,30]. This phenomenon contributes to global warming and associated climate change, such as sea level rise, extreme weather events, and disruption of ecosystems. In fact, both CO2 and non-CO2 emissions from the aviation industry collectively contribute to its impact on the global climate system, with their combined effects causing surface warming. Emissions of CO2, water vapor, NOx, and soot, along with contrail cirrus formation, result in net positive radiative forcing (RF), thereby inducing warming, whereas sulfate aerosol production results in negative RF, thus inducing cooling. Persistent contrail cirrus clouds interfere with the Earth’s incoming solar radiation and outgoing infrared radiation, with the net effect being climate warming. NOx emissions cause warming through short-term ozone increase and cooling through long-term reductions in ozone, methane, and stratospheric water vapor [31]. Lee et al. have found that the net effective radiative forcing (ERF) from aviation in 2018 was +100.9 mW/m2, with major contributions from contrail cirrus, CO2, and NOx at 57.4, 34.3, and 17.5 mW/m2, respectively. The CO2 term accounts for a net positive (warming) ERF, representing less than half (34%) of the aviation net ERF in 2018 [32]. In terms of human health, elevated levels of CO2 near the airport can lead to respiratory issues such as shortness of breath, exacerbation of asthma symptoms, and decreased cognitive function. Prolonged exposure to high concentrations of exhaust emissions may also contribute to cardiovascular problems and increased susceptibility to respiratory infections [33].
As described in the introduction, SAF stands as one of the pivotal methods for reducing carbon emissions in the aviation industry, albeit typically not achieved by altering fuel composition to lower CO2 generation during combustion. For instance, under comparable conditions, the CO2 emission indices (EI-CO2) for FT fuels derived from natural gas, coal, and JP-8 fuel are 3090, 3110, and 3160 g/kg, respectively, with marginal differences [34]. Conventionally, the comparison of CO2 emissions between SAFs and traditional aviation fuels is based on life cycle analysis (LCA), a method assessing the environmental impacts on human and ecological health caused by a system [35,36]. The system boundary of LCA is depicted in Figure 1, illustrating all inputs and outputs of various fuels (ATJ, HEFA, SIP, Jet A-1) throughout each process or stage in the well-to-wake (WTWa) phase. LCA aims to scientifically and systematically quantify the resource consumption, energy usage, emissions output, and potential ecological impacts of SAFs throughout its entire lifecycle [37]. The lifecycle inventory can be divided into five categories: Firstly, raw material acquisition and processing, which involves recording and quantifying the energy use, water consumption, land use changes, and related GHG emissions associated with the cultivation/collection and preprocessing of raw materials (e.g., plant oils, algae, waste biomass) used in SAF production. Secondly, there is fuel production, which includes analysis of the direct and indirect energy requirements, chemical inputs, and resultant emissions (including but not limited to CO₂, NOx, SOx, and particulate matter) associated with conversion technologies such as hydrotreating and Fischer–Tropsch synthesis/Thirdly, transportation and storage considers the logistics chain from SAF production sites to airports, including the energy consumption and emissions during transportation. Fourthly, there is the usage phase. Although the combustion emissions of SAF in aircraft are typically similar to conventional jet fuel, the net lifecycle emissions can be significantly reduced due to differences in feedstock and production methods. This phase requires the assessment of direct emissions from flight operations. Finally, there is waste management and recycling, which involves analysis of the treatment methods and environmental impacts of byproducts or waste generated after SAF use [38,39].
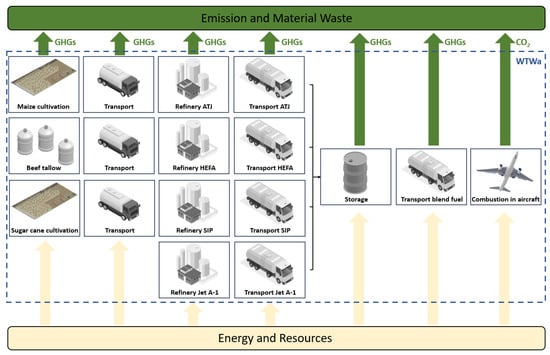
Figure 1.
Boundary analysis of LCA systems for SAFs and Jet A-1 fuel. The lifecycle inventory can be divided into five categories: raw material acquisition and processing, fuel production, transportation and storage, usage phase, and waste management and recycling. WTWa = well-to-wake.
Based on LCA findings, Staples et al. project that, by 2050, employing AJF could potentially reduce the life cycle greenhouse gases emission index (EI-GHGs) of aviation by up to 68.1%, with annual investments in AJF production capacity amounting to only about one-fifth of the global investment in pre-existing oil refining [40]. Moreover, research by Han et al. indicates that EI-GHGs of hydroprocessed renewable jet (HRJ), pyrolysis jet, and FTJ from corn stover could decrease by 41–63%, 68–76%, and 89%, respectively, compared with traditional aviation fuels. The GHG emissions of HRJ fuel in the WTWa phase are primarily influenced by fuel production activities, reflected in the consumption of H2 and natural gas (NG), with the second source being related to the choice and utilization rate of fertilizers [41]. Jong et al. have analyzed the GHG emission savings of different SAFs compared with traditional aviation fuels, ranging from highest to lowest, as follows: FT (86–104%), HTL (77–80%), pyrolysis (54–75%), UCO-based HEFA (68%), and sugarcane- (71–75%) and corn stover-based ATJ (60–75%) [42]. FT process jet fuel could achieve 50–90 wt% GHG reduction in life cycle and the potential reduction on PM [43]. Furthermore, selecting suitable raw materials and conversion technologies, utilizing sustainable hydrogen sources, and implementing carbon capture and storage technologies can further reduce the greenhouse gas emissions of SAFs throughout the life cycle [44,45]. Cox et al. have conducted LCA analyses on biojet fuels derived from microalgae, pongamia, and sugarcane molasses. While the fossil energy ratio (FER) and GHG reduction effect of microalgae-based biofuel (FER = 1.0, 53% lower than aviation kerosene) are inferior to sugarcane molasses (FER = 1.7, 73% lower than aviation kerosene), the former demonstrates advantages in nutrient avoidance, reduced water usage, and lower land utilization rates, highlighting the superiority of third-generation biofuel feedstocks [46]. Figure 2 summarizes the lifecycle GHG emissions of various aviation fuels, with traditional aviation fuel emitting 90 g CO2-eq/MJ. The CO2-eq emissions of SAFs produced via different pathways vary. Specifically, the emissions for HEFA, CH, FT, hydroprocessed depolymerized cellulosic jet (HDCJ), direct sugar to hydrocarbons (DSHC), and ATJ are 3.1–40.0, 21.2–39.3, −1.6–18.2, −2.7–49.5, 22.0–80.2, and −27.0–117.5 g CO2-eq/MJ, respectively. Additionally, SAFs produced using the same process but different feedstocks also exhibit varying CO2 emissions. For instance, ATJ fuels made from sugar cane, corn grain, switchgrass, and poplar emit −27.0–19.7, 47.5–117.5, 11.7–89.8, and 32.0–73.0 g CO2-eq/MJ, respectively [47].

Figure 2.
GHGs emissions over the full life cycle of SAFs. Data are sourced from [47]. The green dashed line represents 0 g CO2-eq/MJ, while the red dashed line indicates 90 g CO2-eq/MJ, corresponding with the GHG emissions of conventional aviation fuel. The six bar graphs depict the GHG emissions for HEFA, CH, FT, HDCJ, DSHC, and ATJ fuels.
2.2. Aviation NOX Emissions
The NOx emissions in the aviation industry typically originate from three reaction mechanisms: thermal-NOx, prompt-NOx, and fuel-NOx [48,49]. Thermal-NOx is primarily generated in high-temperature regions above 1800 K, influenced primarily by temperature, excess air ratio, and residence time in the high-temperature zone [50,51]. Prompt-NOx is minimally influenced by temperature. Its formation mechanism involves the decomposition of hydrocarbons during combustion, where CH radicals break the molecular bonds of nitrogen gas, generating the significant intermediate product HCN. Subsequently, HCN reacts with the radicals O and OH produced within the flame [52,53]. Fuel-NOx is produced through the combustion of nitrogen elements present in the fuel [54]. NOx emissions from aviation, along with CO2 emissions and aviation-induced cloudiness, are major contributors to RF [55]. The climatic impact of NOx takes complex forms. On one hand, it contributes to the production of ozone (O3), a positive climate forcing agent that leads to warming [56,57]. The O3 production efficiency from aviation NOx emissions is approximately four times higher than that from surface NOx emissions. On the other hand, O3 photolysis generates excited oxygen atoms that react with water vapor to produce OH radicals, which are the primary sink for methane (CH4) in the troposphere, thereby reducing methane concentration, a negative climate forcing agent that leads to cooling. The decrease in methane concentration, as a major precursor to O3 formation, results in a reduction in O3 concentration and stratospheric water vapor (SWV) levels. Despite the intricate interplay of reactions leading to uncertainties, it is generally believed that the net NOx response from aircraft leads to a positive, warming RF [58]. According to Skowron et al.’s predictions, aircraft NOx emissions in 2050 are expected to reach 2.17 Tg(N) year−1 under scenarios of low air traffic growth and optimistic technological development. Conversely, under high air traffic growth and low technological development scenarios, emissions could reach 5.59 Tg(N) year−1. This represents a significant increase from the 0.71 Tg(N) year−1 recorded in 2006. They also suggest that the net NOx RF of the aviation industry will vary greatly depending on background conditions. Reducing surface emissions and having a cleaner atmospheric background by 2050 could mitigate NOx RF to some extent. For example, if anthropogenic surface emissions remain at current levels, the net NOx RF under high air traffic growth in 2050 would be 17.5 mW m2. This is 48% higher than under the 2050 representative concentration pathway (RCP) 2.6 scenario, which represents the cleanest background, and 28% higher than under the 2050 RCP 8.5 background conditions [59]. NOx emissions in the aviation industry exhibit strong spatial variability, with aircraft emissions of NOx at cruising altitudes above 2000 ft increasing total RF by approximately 2 ± 1 mW m−2 through gas-phase photochemical reactions [60]. Short-lived NOx gases cause sensitive changes in RF in the local regions of emission, but long-lived methane and carbon dioxide counterbalance regionally, resulting in globally averaged RF [61]. Besides CO2, NOx emissions from aviation dominate the pollutants’ emission quantities and environmental impacts, with increasing influence primarily concentrated around emission-dense airports, such as those in economic zones or tourist destinations [62].
The majority of NOx emissions arise from thermal processes, such as engine testing typically controls power output, resulting in similar combustion temperatures. Consequently, differences in NOx emissions between SAFs and traditional aviation fuels are often minimal [63,64]. Reksowardojo et al. [65] found no difference in NOx emissions between medium-chain fatty acids to biojet (MBJ), produced via hydrogenation from coconut oil, and Jet A-1 fuel. This can be attributed to the nearly identical turbine-inlet temperatures (TIT) of different fuels burning in gas turbine engines at various power levels, suggesting similar combustion temperatures. Okai et al. [66], using a chemiluminescence detector (CLD) to measure NOx concentrations, observed minimal differences in NOx emissions between 100% aviation kerosene, FT-SPK fuel, and HEFA fuel, with no impact from variations in the proportion of SAFs in SAFs/aviation kerosene blend fuels. Wang et al. [67] reported NO emission levels between 2–2.5 ppm for HEFA-SPK and JP-8 fuels, as well as their mixtures, under colorless distributed combustion (CDC) conditions. This reduction of over 95% compared with traditional air combustion conditions was attributed to decreased thermal-NOx generation due to lower peak temperatures. Differences in NOx emissions between HEFA-SPK, JP-8, and four different blend ratios of mixed fuels were minimal under CDC conditions. Undavalli et al. [68] similarly found no significant trend in NOx emissions for HEFA and Jet A-1 fuels, as well as their mixtures. However, at ratios of 20:80 and 50:50, mixed fuel NOx emissions were slightly lower than those of pure fuels, supporting the 50:50 blend ratio as the drop-in proportion for HEFA fuels approved by ASTM D7566. These differences may be related to the adiabatic flame temperature of the mixed fuels. Boomadevi et al. [69] studied microalgae Spirulina biofuel, finding that, as the proportion of added Jet-A fuel increased, the variability in NOx emissions remained low. However, with an increase in engine speed, NOx emissions increased for all tested fuels. For instance, as the engine speed increased from 30,000 rpm to 80,000 rpm, NOx emissions for Jet-A fuel and a 20% biofuel blend increased from 0.2 and 0.18 g per kilogram of fuel to 1.2 and 1.15 g/kg of fuel, respectively. Harper et al. [70] conducted tests on a small-scale (<250 kW) non-proprietary RQL combustion system, evaluating emissions from three conventional aviation fuels, three SAFs (two ATJ and one CHJ fuel), and three blended fuels at pressures of 1.0, 1.5, 2.0, and 2.5 bar. Their results show minimal differences in NOx emissions among different fuels, followed by CO2 and CO, with the greatest disparity observed in UHC emissions. Feser et al. [71] evaluated the performance and emissions of four different drop-in aviation biofuels, including UOP HEFA-SPK, Gevo ATJ, Amyris Farnesane, and SB-JP-8. NOx emissions for all four fuels exhibited a similar trend with equivalence ratio variation, with the lowest and highest NO emissions occurring at equivalence ratios of around 0.6 and 1.0, respectively. The reason for this is that, when the equivalence ratio is less than 0.6, prompt NO has a greater impact as the equivalence ratio decreases. Conversely, when the equivalence ratio exceeds 0.6, combustion-induced temperature rise becomes the predominant factor in thermal-NOx generation. Compared with the other three fuels, UOP HEFA-SPK demonstrated a significant increase in NO emissions for equivalence ratios greater than 0.6. If biofuels exhibit higher NOx emissions, potential reasons include a high nitrogen content in the fuel composition or a low oxygen content, the latter of which can be addressed by incorporating pentanol or ethanol to increase oxygen content [72]. However, in the actual use of aviation fuel, oxygen content in the fuel is not permitted.
2.3. Aviation CO Emissions
In certain circumstances, such as insufficiently high temperatures, relative oxygen deficiency, and uneven fuel/air mixture, combustion of aviation fuel can produce the toxic gas CO [73]. CO exhibits approximately 250 times greater affinity to hemoglobin in the blood than oxygen (O2), hence, upon inhalation, the colorless and odorless CO tightly binds with the iron in hemoglobin, leading to oxygen displacement. Blood carrying CO circulates throughout the body, depositing in the myocardium, skeletal muscles, nervous system, and brain, with myoglobin demonstrating similarly elevated affinity to CO compared with O2 [74]. The most common symptoms following acute CO exposure include nausea, headache, dizziness, vomiting, altered consciousness, and subjective weakness. Severe poisoning symptoms encompass mental confusion, seizures, myocardial infarction, coma, and even death [75]. Auxiliary power units (APUs) and the main engines providing thrust are the primary sources of CO production on aircraft, with APUs predominantly utilized on the ground to supply the power needed to start the main engines, electrical systems, air conditioning, and compressed air. Elevated CO concentrations near airports or within cabins can lead to aerotoxic syndrome in individuals.
Under comparable conditions, SAFs exhibit only minor differences in CO emissions compared with traditional aviation fuels, far less than the disparities observed in SO2 and PM emissions between the two. According to Yang et al.’s review, various conventional aviation fuels exhibit minor changes or even reductions (within 10%) in CO emissions when blended with different SAFs [76]. Discrepancies in the emission index of CO (EI-CO) across different fuels may stem from factors such as viscosity, carbon content, Sauter mean diameter (SMD), and final boiling point. Higher viscosity may result in a greater cone angle and premature flame extinguishment near the combustion chamber walls, leading to incomplete combustion and increased CO generation, while larger hydrocarbons can contribute to an increase in EI-CO. Lower SMD and final boiling point facilitate combustion on one hand but, on the other, prematurely remove the fuel from the primary zone by increasing the cone angle and reducing residence time, resulting in reaction quenching [77]. Schripp conducted emissions tests on neat Jet A-1, ReadiJet, and ATJ using a CFM56-5C4 engine, ensuring a stable environmental condition with minimal variability in parameters affected by environmental factors. There were no significant differences in CO and NOx emissions among the three tested fuels. NOx emissions from all fuels showed nearly linear growth with combustion chamber inlet temperature and thrust setting, whereas carbon monoxide emissions predominantly occurred at low power settings [78]. Reksowardojo et al. [65] investigated the correlation between CO emissions and brake power of Jet A-1 blended with MBJ fuels, finding that the difference in EI-CO between blended fuels and Jet A-1 was negligible. The similarity in CO emissions could be attributed to the nearly identical viscosity of MJB and Jet A-1, with a viscosity difference of approximately 0.8% for J20 (MBJ volume blending ratio at 20%) and Jet A-1. In Timko et al.’s study [79], during ground idle and 7% idle periods, neat natural gas-derived FT fuels exhibited around a 20% reduction in EI-CO compared with Jet A/Jet A-1, while 50% FT fuel fell within the range of Jet A/Jet A-1. Blends of fatty acid methyl ester (FAME) with jet fuel at 20:80 and 40:60 ratios showed a 5–10% decrease in EI-CO compared with Jet A/Jet A-1. Corporan et al. [63] found that the application of neat SAFs and blend fuels resulted in a reduction in EI-CO of 0–20% compared with JP-8/Jet A-1, regardless of engine power. They have suggested that the theoretically lower carbon content in neat SAFs could contribute to lowering EI-CO, although the actual reduction is limited. Additionally, favorable physical properties, such as lower density, may also contribute to the reduction in EI-CO for SAFs. Klingshirn et al. [64] similarly concluded that CO emissions from SAFs are comparable to JP-8. Neat HRJs exhibited approximately a 20% reduction in EI-CO during idle and cruise compared with JP-8, attributed to their lower total carbon content. In contrast, the variation in EI-CO emissions for blends of HRJ and JP-8 fuels was minimal or negligible. Currently, there is insufficient literature support regarding the CO emission characteristics of SAFs, constituting a significant research gap. Given that elevated CO emissions may indicate suboptimal engine combustion conditions and pose risks of CO accumulation in aircraft cabins due to ventilation system malfunctions, alongside the feasibility of detecting CO along with other combustion exhaust gases (such as CO2 and NOx) using the same analytical instruments without substantial additional modifications or expenses [78], future research efforts should be directed towards investigating the emission performance of SAFs.
2.4. Aviation SO2 Emissions
The combustion of aviation fuels is linked to emissions in a complicated manner, with aircraft engine manufacturers consistently striving to develop machinery with high combustion efficiency and low pollution levels [80]. According to statistics, emissions from the aviation industry in 2019, including CO2, CO, HC, NOx, PM2.5, and SO2, amounted to 56,960,300.60 tons, 400,395.30 tons, 37,998.96 tons, 388,677.70 tons, 5,393,817.46 tons, and 68,719.92 tons, respectively, comprising a respective 98.42%, 0.7%, 0.07%, 0.68%, 0.01%, and 0.12% of the total emissions. Moreover, the average SO2 emissions from 2017 to 2019 increased by 12.98% compared with 2014–2016, ranking second among all pollutants emitted, following only NOx [23]. Figure 3 depicts the comprehensive emission trends of the six pollutants on China–foreign routes from 2014 to 2021 [81]. The figure illustrates a notable increase in the total emissions of six pollutants on China–foreign routes from 2014 to 2016, with the SO2 emissions rising from 34,505 tons to 56,301 tons. The introduction of emission reduction measures, such as the CNG2020 strategy, led to a gradual decrease in the growth rates of the six pollutants, some even turning negative. From 2017 to 2019, the average growth rates of CO2, HC, NOx, SO2, PM2.5, and CO were 1.19%, −1.43%, 2.51%, 1.19%, 4.34%, and −0.23%, respectively. The outbreak and spread of the COVID-19 pandemic in 2020–2021 resulted in a sharp reduction in the number of China–foreign routes, bringing the SO2 emissions to a low level. Most research on emissions has focused on CO2, NOx, and CO, with less attention given to SO2 emissions [82]. However, SO2 emissions from the aviation industry pose significant risks to human health and the natural environment. The sulfur element in SAF raw materials typically originates from the preprocessing process rather than the raw materials themselves [83]. Negligible sulfur elements and aromatic hydrocarbon content determine that the SO2 emissions from SAF differ significantly from petroleum-based fuels [84,85].
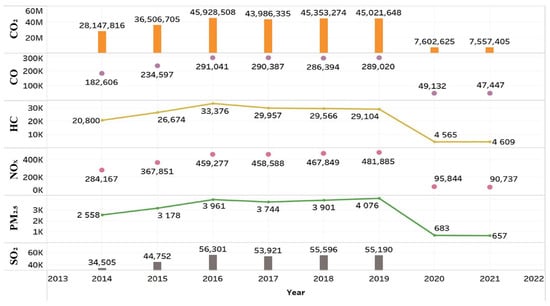
Figure 3.
Overall emissions of six pollutants in China–foreign routes from 2014 to 2021 [81]. The orange, purple, yellow, pink, green and grey icons represent CO2, CO, UHC, NOx, PM2.5 and SO2 emissions, respectively.
The distinctive aspect of aviation pollutants lies in their accumulation directly within the upper troposphere and lower stratosphere during cruising altitudes (8–12 km), exerting complex and potent influences on Earth’s ecosystem [86]. While sulfur in aviation fuel can mitigate fuel pump wear to some extent, emissions of sulfur oxides are directly associated with this sulfur [87]. Approximately 98% of sulfur in fuel converts to SO2, with the remainder appearing as SO3 in exhaust gases [88,89]. Lower combustion temperatures favor the generation of SO3 through reaction equilibrium, while metallic substances in the fuel or fuel system expedite the oxidation of SO2 to SO3 [90]. Oxides of sulfur combine with water to form sulfuric acid, which is absorbed on the surface of soot particles, creating volatile sulfate aerosol particles [91]. Under ice supersaturation conditions, these particles may serve as nuclei for ice crystals, leading to the formation of contrail cirrus clouds. Contrails enhance the uptake of sulfur oxides and subsequent conversion to sulfate aerosols, resulting in soot wet deposition and an eventual contribution to acid rain during deposition [92,93]. Contrail cirrus clouds alter the radiative properties and water budget of the upper troposphere, thereby affecting climate. Concurrently, acid rain inflicts severe damage on water sources, soil, vegetation, and other ecosystems.
Exposure to SO2 in the atmosphere increases the risk of respiratory system diseases among individuals, including asthma attacks, bronchiolitis, upper airway infections, and pneumonia [94]. Even in environments with low concentrations of SO2 (<200 ppb), asthmatic individuals exhibit sensitive and rapid airway constriction symptoms [95]. Short-term exposure to sulfur dioxide is positively correlated with respiratory system mortality and all-cause mortality rates [96]. Exposures to SO2 exceeding 500 μg/m3 for 10 min can stimulate the respiratory tract of susceptible individuals, leading to symptoms such as acute bronchial asthma, pulmonary edema, and respiratory distress [97].
Predictably, the sulfur content in fuel correlates directly with the emissions of SO2 after combustion. In the study by Corporan et al. [98], JP-8 and synthetic jet (synjet) fuel were blended at different volume ratios of 0%, 25%, 50%, and 75%. The mass fraction of sulfur elements in the fuel was 0.06, 0.05, 0.04, and 0.02, respectively. Combustion experiments with the T63 engine showed that the SO2 emissions from the four blending ratios of JP-8/synjet fuel were approximately 34, 23, 15, and 7 ppm, respectively, with equivalence ratios of 1.00, 1.05, and 1.10 exhibiting similar emission quantities and trends. In the Alternative Aviation Fuel Experiment (AAFEX), researchers employed a sulfate particulate analyzer (SPA) in conjunction with a trace-level pulsed fluorescence SO2 analyzer to measure SO2 gas emissions from a DC-8 aircraft equipped with a CFM56 engine. The results indicate that, under APU load, the SO2 emission indices (EI-SO2) for JP-8 were 1.5–1.8 g kg−1, while those for FT-2 were 0.13–0.15, suggesting a 92% reduction in aviation SO2 emissions with SAF use, albeit with minimal differences in CO and NOx emissions, as shown in Figure 4a. The SO2 emissions from a 50:50 volume blend of FT-1 (Shell) and FT-2 (Sasol) fuels were approximately half that of pure JP-8, attributed to the high FSC of JP-8 at around 1200 ppm compared with negligible sulfur in neat FT fuels. Additionally, compared with JP-8, FT-2 exhibited nearly a 100% reduction in EI-particle-bound sulfate emissions and a five-fold reduction in EI-particle-bound organics. As shown in Figure 4b,c, EI-SO2 remained relatively constant with increases in exhaust gas temperature (EGT) and power setting, while black carbon (BC) emissions decreased with rising EGT, with JP-8 exhibiting a greater reduction than FT-2. At varying EGT, the EI-SO2 for FT-2 fuel ranges from 0.12–0.14 g/kg fuel, while for JP-8, it ranges from 1.51–1.58 g/kg fuel. EI-SO2 shows a slight increase with increasing power. The EI-SO2 for blended fuels falls between that of the JP-8 and FT fuels. Figure 4a–c correspond with [34,99,100], respectively. Yakovlieva et al. [101] incorporated fatty acids ethyl esters (FAEE) derived from rapeseed oil (RO) as bio-additives into Jet A-1 fuel at proportions of 10% and 20%. The sulfur contents in Jet A-1 and modified FAEE were 0.025% and 0.0085%, respectively. Traditional aviation fuel and blends containing 10% and 20% modified FAEE generated respective SO2 pollution gases of 0.0367, 0.0158, and 0.0281 kg per landing-take-off (LTO) cycle, indicating that a 10% blend of modified FAEE effectively reduced SO2 emissions by nearly 57% compared with pure Jet A-1. Cican et al. [102] examined the combustion parameters and emission characteristics of Jet A and Jet A/biodiesel (BD) blends in a JETCAT P80 microengine, simulating idle, cruise, and max stages by setting throttle positions at 18.7%, 30%, and 94%, respectively (BD belongs to biofuel rather than SAF, and is here for reference). SO2 was detected using an MRU analyzer with a measurement range of 0–2000 ppm and an accuracy within ±10 ppm or 5% reading. As shown in Figure 4d, the EI-SO2 during the cruise phase was the highest among the three stages, but a 10% BD blend effectively reduced EI-SO2 in the exhaust gases during any stage, with EI-SO2 dropping to approximately 10 ppm when the blend reached 20%. Moreover, increasing the BD content in the fuel also improved thrust by around 5% and reduced EI-NOx by approximately 25%. This suggests that incorporating BD into aviation fuel does not require engine design modifications and does not significantly alter engine performance, making it a promising method for aviation fuel substitution. The sulfur content, methods/burning platform, and instrumentation of standard specification SAF and related fuels are shown in Table 1. According to ASTM specifications, Jet A or Jet A-1, as representative conventional aviation fuels, require sulfur content to be below 3000 ppm, whereas the maximum specification value for sulfur content in the seven ASTM-certified SAFs listed in the table is 15 ppm, with sulfur content in SIP fuel limited to below 2 ppm. Blending SAFs significantly reduces sulfur content in conventional aviation fuels across various tests and decreases SO2 emissions in engine tests, demonstrating the sustainability and environmental friendliness of SAFs.
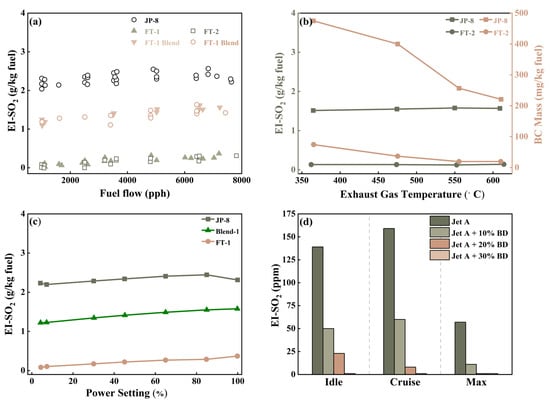
Figure 4.
EI-SO2 of different aviation fuels varying with (a) fuel flow [34], (b) exhaust gas temperature (EGC) [99], (c) power setting [100], and (d) regime [102]. The EI-SO2 of the same fuel shows minimal variation with changes in engine operating conditions and EGC. However, blending SAFs can effectively reduce the EI-SO2 of JP-8 and Jet A.

Table 1.
Information regarding the investigated SAF and fuels and the burning platforms and decline situation for SO2 emissions in literature.
2.5. Aviation PM Emissions
Compared with other sources of pollution in urban environments, aircraft engine PM emissions constitute a distinct pollution source [105]. Aviation PM emissions can be categorized into primary and secondary PM. Primary PM refers to solid and liquid particles emitted directly from the engine without undergoing chemical transformations in the atmosphere. Non-volatile particulate matter (nvPM) and volatile particulate matter (vPM) constitute the emissions of primary particulate matter (PM) in aviation activities [106]. BC, the primary component of nvPM, forms within aircraft engines under temperature and pressure conditions, where incompletely oxidized carbon atoms aggregate and condense into solid particles carried by airflow [107]. Additionally, metallic oxides (e.g., iron, copper, etc., originating from engine wear materials) and sulfates (combustion byproducts of sulfur-containing fuels) contribute directly to atmospheric particulate matter concentrations as they undergo minimal physical or chemical alterations in the atmosphere. Besides combustion processes, nvPM formation is influenced by factors such as engine design, combustion conditions, and aerodynamic effects. vPM comprises organic compound vapors, partial sulfides, and nitrides, which may initially exist in gaseous form during emissions but condense into solid or liquid particles during cooling, becoming part of particulate matter. vPM emissions occur at the engine exit, where hot combustion exhaust cools, sulfuric acid droplets act as representative condensation nuclei, and further condensation of water and organic substances occurs on the surface. During post-emission transport, the quantity and quality of particles undergo significant changes through processes like aggregation, condensation, and evaporation, forming vPM [108]. Secondary PM is not directly emitted but formed through complex chemical reactions in the atmosphere. When gaseous pollutants emitted by aircraft (such as nitrogen oxides (NOx), volatile organic compounds (VOCs), etc.) react with other components in the atmosphere (such as oxygen, water vapor), new solid or liquid particles are formed. These reactions can generate sulfate, nitrate, organic aerosols, etc., which constitute the primary components of secondary PM, significantly impacting long-distance transport and long-term air quality.
The physicochemical composition of nanoparticles emitted by aircraft engines resembles diesel exhaust particles, which are classified as mutagenic and carcinogenic agents [109]. Studies investigating the impact of LTO emissions from 99 airports on public health have shown that premature mortality increased from an estimated 75 cases per year in 2005 to 460 cases per year by 2025, with a 6.1-fold increase, of which 2.1 times were attributed to PM2.5-related emissions [110]. Emissions of sulfur dioxide and sulfate aerosols contribute to an increase in the concentration of fine particulate matter with a dry diameter of less than 2.5 µm (PM2.5). Prolonged exposure to high concentrations of PM2.5 increases the likelihood of respiratory and cardiovascular diseases, lung cancer, chronic physiological changes, and mortality [111,112,113,114]. PM2.5 emissions during aircraft takeoff and landing significantly impact human health around airports, causing approximately 3600 premature deaths annually with standard aviation fuel containing approximately 600 ppm of sulfur. This accounts for 0.1% of global premature deaths, with the highest mortality rates attributed to aviation in Europe, eastern North America, and eastern China. Aviation-related PM2.5 contributes approximately 1% to the total premature mortality attributed to PM2.5 exposure. It is estimated that in 2017, approximately 67,000 deaths occurred in China due to environmental PM2.5 and O3 emissions, with the densely populated coastal regions of eastern China experiencing the greatest impact due to intensive aviation activities [115]. Compared with standard aviation fuel with a fuel sulfur content (FSC) of around 600 ppm, the use of ultra-low sulfur jet fuel (ULSJ) with an FSC of 15 ppm effectively reduces surface PM2.5 concentrations, preventing approximately 620 deaths annually. Additionally, it increases the global average net radiative effect (RE) by reducing the aerosol cloud albedo effect (aCAE) by +7.0 mW m−2 [87].
Durdina et al. investigated the emission indices of nvPM mass and nvPM number from a CFM56-7B engine using a blend of Jet A-1 and 32% HEFA-SPK fuel. They found that blending fuels reduced the geometric mean diameter (GMD) and geometric standard deviation (GSD) of emissions at every point during ground idle and take-off, particularly with lower thrust levels, resulting in a relatively larger reduction in emissions. For instance, during ground idle, the SAF blend reduced nvPM number by 60%, while during take-off, the reduction was 10%. SAF blended fuel reduced the nvPM mass emission by 20% and the nvPM number emission by 25% over a standardized LTO cycle [116]. Schripp et al. conducted emissions tests on Jet A-1, a catalytic hydrothermolysis jet fuel (ReadiJet), and an ATJ fuel using a CFM56-5C4 engine. The hydrogen mass fractions in the three fuels were in the order of ATJ (15.5%) > Jet A-1 (14.1%) > ReadiJet (13.7%), while the aromatic content by volume was ReadiJet (20.9%) > Jet A-1 (15.6%) > ATJ (below 1%). ATJ fuel primarily consists of various branched aliphatic compounds such as iso-C12H26 and iso-C16H34. Aliphatic hydrocarbons, as opposed to aromatic compounds with the basic structure required for PM precursors, exhibit a lower tendency for PM formation. The PM formation tendency of hydrocarbons can be roughly ordered as follows: aromatics > cycloalkanes > branched alkanes > straight-chain alkanes. The results of this study confirm the above conclusions, showing a 70% reduction in particle mass for ATJ fuel compared with Jet A-1. ReadiJet fuel, with higher aromatic content and lower fuel hydrogen content, exhibited a significant increase in PM emissions [78]. Yu et al. [117] conducted a study on the PM emissions levels of the CF34-3A1 turbofan engine and the TPE331-6-252B turboprop engine. They found that, at different power settings, the EI-PM of the former was generally lower than that of the latter. However, both engines exhibited a minimum EI-PM at moderate power conditions, typically between 40–60% thrust. At high power settings, nvPM emissions such as black carbon or soot predominated, while with decreasing engine power, the mass fraction of vPM containing organic compounds and sulfur exceeded 50%. Kurzawska et al. [118] discovered that a 50:50 blend of ATJ/Jet A-1 fuel, under high engine load, could reduce total particle number and mass by approximately 18% and 53%, respectively, compared with Jet A-1. Chan et al. [119] found that, under all engine loads of the GE CF-700-2D-2 engine, Jet A-1 exhibited the highest EI-PM, with a moderate reduction of 7–25% for 100% CH-SKA fuel across the engine load range. For 50% HEFA-SPK and 100% FT-SPK fuels, EI-PM reductions were approximately 40–60% and 70–95%, respectively. The emission trends of BC were consistent across all fuels, but compared with Jet A-1, emissions from 100% CH-SKA, 50% HEFA-SPK, and 100% FT-SPK were reduced by 38–50%, 58–82%, and 70–95%, respectively. The EI-BC of Jet A-1 and three types of SAFs showed a strong correlation with changes in aromatic compounds and the H/C ratio in the fuels.
As widely recognized, the sulfur content in fuel has the greatest impact on the volatile aerosol fraction. Moore et al. [120] found that reducing FSC to near zero decreased the EI-aerosol number by 10–100 times, especially when the fuel flow rate was low (below 0.4 kg s−1), resulting in significant reductions in EI-total number and EI-non-volatile particulate matter (EI-nvPM), albeit with diminished benefits at high thrust settings. Tran et al. [103] conducted particle number emissions tests using a GE CF700-2D2 engine and observed that the EI-volatile particulate matter for Jet A1 fuel was higher than that for JP-5, while the trend reversed for EI-nvPM. This discrepancy stemmed from Jet A1’s higher FSC and JP-5’s higher aromatic content. The ATJ-SPK blend, with aromatic and sulfur contents of 8% vol and 0 ppm, respectively, significantly reduced total particle number emissions by up to 97% compared with Jet A-1. Voigt et al.’s study indicates that particulate matter can modulate the quantity of cirrus ice crystals at current emission levels. They utilized an Airbus A320 equipped with two IAE-V2527-A5 engines to compare the emission performance of neat Jet A1 and semisynthetic jet fuel blends (FT-SPK or HEFA-SPK with Jet A-1). Semisynthetic jet fuels with high hydrogen content and low aromatic hydrocarbon content can lead to a 50% to 70% reduction in both soot and ice number concentrations, along with an increase in ice crystal size. The reduction in ice crystal number results in decreased energy deposition in the atmosphere, thereby reducing warming. Dicyclic naphthalene is a more effective precursor of soot than monocyclic aromatic or aliphatic hydrocarbon structures [121]. Lobo et al. [122] investigated aircraft engine emissions using neat FT fuel, used cooking oil (UCO)-derived HEFA alternative fuel, and blends of these with traditional aviation fuel, revealing significant reductions in EI-nvPM and sulfur oxides after blending with SAF. Moore et al. [123] conducted pollutant emission tests on a DC-8 aircraft equipped with four CFM56-2-C1 engines using three types of fuel: medium-sulfur-content Jet A fuel, low-sulfur-content Jet A fuel, and a blend of 50:50 HEFA and low-sulfur-content Jet A fuel. Compared with medium-sulfur-content Jet A fuel, low-sulfur-content Jet A fuel and the blend fuel reduced volatile fine particle number by approximately 9% and 52%, respectively; the blend fuel decreased non-volatile fine particle number by approximately 45%, while, unexpectedly, low-sulfur-content Jet A fuel increased non-volatile fine particle number by 30%. The application of the blend fuel reduced volatile particle volume, non-volatile particle volume, and total particle volume by approximately 50%. Additionally, blend fuel exhibited varying degrees of reductions in BC, CO and NOx emissions, as shown in Figure 5. The NOx emissions of three fuels exhibit minimal variation, consistent with previous findings. However, low-sulfur-content Jet A fuel and the blend fuel respectively reduce CO emissions by 33% and 22%, which can potentially be attributed to combustion heat. Table 2 illustrates the aromatics content, burning platform/methods, and instrumentation of standard specification SAF and related fuels. As per ASTM regulations, Jet A or Jet A-1, representing conventional aviation fuels, require an aromatics content below 25/26.5 vol%. Among the seven ASTM-certified SAFs listed, five have maximum aromatics content specifications of 0.5 mass%, while FT-SPK/A and CHJ fuels have an aromatics content limited to below 20 and 21.2 mass%, respectively. Aromatics content in neat SAFs and their blends is notably lower than traditional aviation fuels, leading to reduced PM emissions in engine testing, thus affirming the sustainability and environmental friendliness of SAFs.
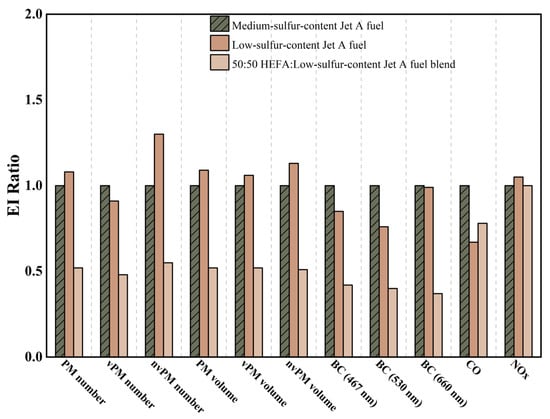
Figure 5.
EI ratio compared with medium-sulfur-content Jet A fuel under medium thrust at cruise conditions (PM = particulate matter, vPM = volatile particulate matter, nvPM = non-volatile particulate matter) [123]. The 50% HEFA blend fuel effectively reduced both the number and volume of vPM and nvPM. Additionally, blend fuel exhibited varying degrees of reductions in BC, CO and NOx emissions.
Table 2.
Information regarding the investigated SAF and fuels and the burning platforms and decline situation for PM emissions in literature.
2.6. Aviation UHC Emissions
The formation mechanisms of UHC in jet fuel combustion within aircraft engines typically involve the following aspects. Firstly, incomplete combustion, where, under certain engine operating conditions, such as low-speed flight, takeoff, landing, or when there is insufficient oxygen supply in the combustion chamber, fuel may not fully mix with oxygen or complete the oxidation reaction within the limited time, resulting in the partial combustion of hydrocarbons and the formation of UHC. In real combustion processes, rich fuel conditions can lead to the production of CO, aromatics, UHC, and soot, while lean conditions can release oxygen-rich substances like ketones, peroxides, and NOx [124]. Secondly, local low-temperature zones, where the combustion chamber may have regions of lower temperature, especially at the flame front edges or where fuel spray contacts the cold wall surface. Low temperatures can inhibit combustion reactions, causing some fuel molecules to exit with the exhaust before oxidizing. Thirdly, there is poor fuel atomization, where, if there are issues with the fuel nozzle or improper fuel pressure, the fuel may not atomize adequately into fine droplets, with larger droplets less likely to evaporate quickly and mix with air, increasing the likelihood of incomplete combustion. Finally, there is short residence time. Modern jet engines aim for high efficiency with compact combustion chambers, resulting in very short fuel residence times. This can prevent complete combustion of some fuel before it is expelled [125,126,127,128,129,130].
UHCs are a subset of volatile organic compounds (VOCs). A significant portion of VOC emissions from aircraft engines consists of UHCs [131,132]. These compounds undergo photochemical reactions with nitrogen oxides under sunlight, producing ozone and other secondary pollutants such as peroxyacetyl nitrates (PANs), which are primary contributors to photochemical smog and significantly impact air quality [133,134]. Although most UHCs have a short atmospheric lifespan, their involvement in various chemical reactions can lead to the formation of GHGs, like methane and carbon dioxide, indirectly contributing to global warming [124,135]. Over 8 million people fly on commercial airplanes daily, with approximately 5% suffering from respiratory diseases. Therefore, it is necessary to maintain high air quality onboard to protect the health of both crew and passengers. Formaldehyde, benzene, tetrachloroethylene, trichloromethane, 1,2-dichloroethane, and naphthalene are the six primary VOCs in the current cabin environment, posing risks to crew members that exceed the acceptable levels recommended by the US EPA [136]. Xylene in the cabin is significantly associated with irritation of the eyes, nose, and throat. Aldehydes, potential oxidation products of ozone, can also irritate human senses. Common symptoms among crew members and pilots include dry eyes and fatigue [137]. These VOCs may impact perceived indoor air quality and lead to passenger complaints. [138]. In air monitoring studies at Zurich Airport, a significant presence of reactive C2–C3 olefins and isoprene was found in engine exhaust. Isoprene was not detected in refueling emissions, and the benzene to toluene ratio in exhaust (1.7) was also higher than in kerosene refueling emissions (well below 1) [139]. Exposure to UHCs and VOCs poses health risks to humans. Inhalation of UHCs can irritate the eyes, nose, and throat, cause coughing, wheezing, and other respiratory issues, and increase the risk of chronic bronchitis and emphysema [140,141]. Long-term exposure to high VOC concentrations may raise the risk of cardiovascular diseases, including heart disease and hypertension. Polycyclic aromatic hydrocarbons (PAHs), which are highly toxic and potentially carcinogenic, can increase the risk of cancers such as skin and lung cancer through inhalation or skin contact [142,143,144]. High VOC concentrations can also affect the central nervous system, leading to headaches, dizziness, fatigue, and, in severe cases, impairing cognitive functions and behavior [145,146,147].
The comparison of UHC emissions between SAFs and traditional aviation fuels is controversial. Some scholars and engine manufacturers assert that both have similar UHC emission indices (EI-UHC), while others believe SAFs exhibit either lower or higher EI-UHC. The divergence in opinions arises from the interplay between engine conditions and fuel properties influencing UHC emissions. Undavalli et al. utilized a GTCP85 aircraft APU combustion platform and measured UHC emissions using the Signal 3000HM FID hydrocarbon analyzer. They discovered no significant trend in CO, UHC, and NOx emissions across 18 different blends of HEFA and Jet A-1 fuels, although there was an overall decline in UHC emissions compared with Jet A-1. The engine operating conditions yielding increasing UHC emissions were, in order: main engine start (MES), environmental control system (ECS), and no load (NL). In MES mode, the engine operates at minimum capacity with an air to fuel ratio (AFR) of approximately 50. The low pressures and combustor temperatures in MES mode contribute to lower UHC emissions [68]. Liu et al. found that, in the premixed pre-evaporated Bunsen burner (PPBB) tests, blends of hydrothermal-condensation-hydrotreating jet (HCHJ) biofuel with RP-3 significantly reduced PM2.5 and UHC emissions. In tests with the ZF850 jet engine, varying thrust from 48% to 97% showed no clear trend in EI-UHC for 0%, 5%, and 10% HCHJ blends with RP-3. Increasing AFR at low power reduced EI-UHC but prolonged combustion time due to lower temperatures. At high power, decreasing AFR increased EI-UHC due to higher fuel consumption, though higher combustion temperatures accelerated reactions. EI-UHC emissions were lowest in the 55–90% thrust range, with emission peaks at 48% and 95% thrust [148]. Badami et al. conducted studies on the SR-30 turbojet workbench using Jet-A, a synthetic gas to liquid (GTL) fuel, and a blend of 30% Jatropha methyl ester (JME) with 70% Jet-A. Similar to CO emissions, EI-UHC decreased with increasing angular speed. At 50,000–60,000 rpm, EI-UHC ranked from highest to lowest as GTL fuel, Jet-A, and the 30% JME blend. Above 70,000 rpm, the order shifted to Jet-A, GTL fuel, and the 30% JME blend, with differences in EI-UHC among the fuels diminishing as speed increased [149].
In addition to engine operating conditions, EI-UHC is also related to the properties of aviation fuel itself. Sundararaj et al.’s findings indicate that increasing the concentration of Camelina in blended fuels reduces EI-UHC, primarily due to the increase in primary zone temperature with higher Camelina concentration. Conversely, EI-UHC increases with higher concentrations of Jatropha in the blend, as Jatropha contains more carbon compounds and aromatics, leading to higher UHC emissions at low temperatures. Changes in the viscosity and density of fuel blends can alter spray characteristics, resulting in improper mixing in the combustion zone and subsequent UHC emissions. Moreover, EI-UHC is influenced by factors such as fuel residence time, evaporation time, and adiabatic flame temperature [77]. Ali et al.’s tests on the Olympus E-start HP turbojet engine show that for a 50% throttle valve position, 50% cotton methyl ester (CTME) blend fuel and 50% corn methyl ester (CRME) blend fuel reduce EI-UHC by 36.5% and 30.8%, respectively, compared with JetA-1. Additionally, EI-UHC decreases with increasing blend ratios of biodiesel, explained by the higher oxygen content in biofuels. The higher EI-UHC of JetA-1 may be due to its higher distillation points, leading to incomplete evaporation and combustion of the final fuel fraction [150]. Rehman et al. conducted emission tests on diesel and two different Jatropha biodiesel blends (15%, 25%) in an IS/60 Rovers gas turbine. The EI-UHC of both blends was lower than that of diesel and decreased with higher blend ratios, attributed to the higher fuel oxygen content in biodiesel. They also note that engine load/brake power had a greater impact on EI-UHC than biodiesel blending [151].
In a test report by engine and aircraft manufacturers [152], GE found that adding Bio-SPK to conventional aviation fuel slightly reduces NOx emissions (1–5%) but increases CO and UHC emissions by 5–9% and 20–45%, respectively. The increase in CO and UHC emissions is primarily due to changes in the carbon-to-hydrogen ratio of the fuel, which lowers peak flame temperature, as well as changes in spray quality and flame position. Rolls Royce’s tests in the annular rig indicated that CO, NOx, and UHC emissions from Syntroleum Fischer–Tropsch fully synthetic aviation kerosene and JP-8 fuel are similar. Pratt and Whitney’s tests on a Pratt and Whitney Canada small turbofan engine showed no significant differences in UHC, CO, and NOx emissions between Jet A-1, 100% Neste oil, and their 50:50 blend. Table 3, below, summarizes information and comparative conclusions on UHC emissions from these studies. The UHC emission performance of fuel is determined by both engine conditions and fuel properties. EI-UHC is predominantly influenced by engine conditions, with the main point of contention being the composition and properties of SAFs. The closer SAFs are to conventional aviation fuels, the smaller the differences in EI-UHC. Otherwise, the physical and chemical properties of SAFs will complexly affect the entire process of atomization, combustion, and emissions, leading to either lower or higher EI-UHC.
Table 3.
Information regarding the investigated SAF and fuels and for burning platforms and changes for UHC emissions in literature.
2.7. Comprehensive Comparison of Emissions Performance between SAFs and Conventional Aviation Fuels
This study conducts a comparative analysis of CO2/NOx/SO2/CO/PM/UHC emissions between traditional aviation fuels and SAFs. Overall, SAFs exhibit significantly lower emissions of SO2 and PM from aviation engine exhaust compared with traditional fuels. SAFs offer no obvious advantages in CO2, CO, NOx and UHC emissions compared with conventional petroleum-based aviation fuels during engine combustion. However, from an LCA perspective, SAFs demonstrate a significant advantage in CO2 emissions, thus positioning them as a key strategy for addressing carbon emissions challenges in the aviation industry. CO, NOx and UHC emissions are determined by both the nature of the fuel and the operating conditions of the engine, which would explain the controversy over the strength of the two fuels in terms of the emissions of these pollutants. The comprehensive comparison of emission performance between SAFs and traditional aviation fuels is presented below.
From a combustion and emission perspective, the difference in CO2 generation between SAFs and traditional aviation fuels is negligible. However, from an LCA perspective, SAFs derived from different processes and feedstocks, such as FT, HEFA, ATJ, and pyrolysis, can significantly reduce GHG emissions in the aviation industry by 41–89%. Due to the direct correlation between SO2 emissions and sulfur content in fuels, SAFs have extremely low sulfur content, enabling pure FT fuel to reduce SO2 emissions from pure JP-8 by 92%. Blending various types of SAFs with traditional aviation fuels can also reduce SO2 emissions to varying degrees, depending on the blending ratio. The aviation industry’s PM emissions are closely related to sulfur and aromatic compound content in fuels, showcasing the advantages of SAFs. Compared with Jet A-1, fuels such as 100% CH-SKA, 50% HEFA-SPK, and 100% FT-SPK can reduce EI-PM by 7–25%, 40–60%, and 70–95%, respectively, while ATJ-SPK significantly reduces total particle number emissions by up to 97%. In contrast, NOx emissions mostly originate from thermal drive, as engine tests control power output, maintaining similar combustion temperatures. Hence, the difference in NOx emissions between SAFs and traditional aviation fuels is minimal. Similarly, under identical conditions, SAFs and traditional aviation fuels exhibit minor differences in CO emissions, with variations in EI-CO among different fuels possibly stemming from viscosity, carbon content, SMD, and final boiling point. EI-UHC is influenced by both engine operating conditions and fuel properties. When the composition and properties of SAFs are similar to conventional aviation fuels, the difference in EI-UHC is minimal. SAFs with lower aromatic hydrocarbon content, and lower distillation points are advantageous for reducing UHC emissions. However, if some properties of the SAFs, such as viscosity, density, residence time, etc., do not align with the design of the engine’s atomization and combustion systems, then incomplete fuel combustion result, with a concomitant tendency for increased UHC emissions.
3. Conclusions
SAFs represent a primary tool for achieving net-zero emissions in the aviation industry by 2050. Their combustion performance must be capable of seamlessly replacing traditional aviation fuels, considering both usability and safety. Equally important is the requirement for SAFs to mitigate the adverse effects of aviation emissions on ecological environments and human health while reducing GHG emissions.
From an LCA perspective SAFs have much lower CO2 emissions than conventional aviation fuels. In an aeroengine, fuel combustion is a complex process in the combustor of the engine, which transfers chemical energy into heat energy. The completeness of combustion is related to a fuel’s composition and properties, including spray, evaporation, and flammability. Therefore, engine performance is not only affected by fuel performance, but also interacts with engine structure and control laws. The SO2 and PM emissions from SAFs have a clear advantage due to less sulfur and aromatic hydrocarbon content. CO/UHC emission parameters are controlled by both the engine and the fuel properties, while NOx emission parameters are mainly influenced by the engine. To sum up, SAFs offer substantial advantages in CO2, SO2, and PM emissions compared with conventional petroleum-based aviation fuels.
There are technical gaps in comparing the emission performance of SAFs and traditional aviation fuels. For instance, there is a need to intensify research on the emission performance of SAFs at the engine and even aircraft level. Comprehensive studies on the emissions performance of ASTM-approved and non-approved SAFs are lacking. The variability in SAF compositions due to different feedstocks and production processes complicates uniform analysis. Differences in experimental application engines, detection equipment, and human error prevent cross-comparison of results. Moreover, there is a paucity of research on the CO emission performance of SAFs.
In the future, more research should be directed towards the physicochemical properties, atomization and combustion performance of SAFs and their components, as well as their performance in engines and aircraft levels. The development and application of SAF technology will be promoted to accelerate the process of realizing net-zero emissions in the aviation industry.
Author Contributions
Z.S.: writing—original draft, and methodology; Z.L. (Zekai Li): data analysis; Z.L. (Ziyu Liu): supervision, methodology. All authors have read and agreed to the published version of the manuscript.
Funding
This paper was supported by Sino-Europe ALTERNATE Research Program-China (MJ-2020-D-09).
Conflicts of Interest
The authors declare no conflicts of interest.
Abbreviations
| IATA | International Air Transport Association |
| SAFs | Sustainable aviation fuels |
| FT-SPK | Fischer–Tropsch hydroprocessed synthesized paraffinic kerosine |
| ATAG | Air Transport Action Group |
| CAGR | Compound annual growth rate |
| HEFA SPK | Synthesized paraffinic kerosene hydroprocessed esters and fatty acids |
| SIP | Synthesized iso-paraffins |
| ATJ-SPK | Alcohol-to-jet synthetic paraffinic kerosene |
| HC-HEFAs | Hydroprocessed hydrocarbons, esters, and fatty acids |
| APUs | Auxiliary power units |
| LCA | Life cycle analysis |
| RF | Radiative forcing |
| ERF | Effective radiative forcing |
| EI-CO2 | CO2 emission indices |
| EI-NOx | NOX emission indices |
| EI-CO | CO emission indices |
| EI-SO2 | SO2 emission indices |
| PM/EI-PM | Particulate matter/PM emission indices |
| GHGs/EI-GHGs | Greenhouse gases/GHGs emission index |
| UHC/EI-UHC | Unburnt hydrocarbons/UHC emission indices |
| WTWa | Well-to-wake |
| HRJ | Hydroprocessed renewable jet |
| NG | Natural gas |
| FER | Fossil energy ratio |
| HDCJ | Hydroprocessed depolymerized cellulosic jet |
| DSHC | Direct sugar to hydrocarbons |
| O3 | Ozone |
| CH4 | Methane |
| SWV | Stratospheric water vapor |
| RCP | Representative concentration pathways |
| MBJ | Medium-chain fatty acids to biojet |
| TTT | Turbine-inlet temperatures |
| CLD | Chemiluminescence detector |
| CDC | Colorless distributed combustion |
| SMD | Sauter mean diameter |
| FAME | Fatty acid methyl ester |
| AAFX | Alternative Aviation Fuel Experiment |
| BC | Black carbon |
| EGT | Exhaust gas temperature |
| FAEE | Fatty acids ethyl esters |
| LTO | Landing-take-off |
| BD | Biodiesel |
| nvPM | Non-volatile particulate matter |
| vPM | Volatile particulate matter |
| PM2.5 | Particulate matter with a dry diameter less than 2.5 µm |
| aCAE | Aerosol cloud albedo effect |
| FSC | Fuel sulfur content |
| ULSJ | Ultra-low sulfur jet fuel |
| RE | Radiative effect |
| GMD | Geometric mean diameter |
| GSD | Geometric standard deviation |
| VOCs | Volatile organic compounds |
| PAHs | Polycyclic aromatic hydrocarbons |
| MES | Main engine start |
| ECS | Environmental control system |
| NL | No load |
| HCHJ | Hydrothermal-condensation-hydrotreating jet |
| AFR | Air to fuel ratio |
| PPBB | Premixed pre-evaporated Bunsen burner |
| GTL | Gas to liquid |
| JME | Jatropha methyl ester |
| CTME | Cotton methyl ester |
| CRME | Corn methyl ester |
References
- Liu, Y.; Gu, W.; Wang, J.; Rao, D.; Chen, X.; Ma, H.; Zeng, W. Study on the Laminar Burning Velocity of Ethanol/RP-3 Aviation Kerosene Premixed Flame. Combust. Flame 2022, 238, 111921. [Google Scholar] [CrossRef]
- Bauen, A.; Harris, A.; Sim, C.; Gudde, N.; Prussi, M.; Scarlat, N. CORSIA Lower Carbon Aviation Fuels: An Assessment of the Greenhouse Gas Emission Reduction Potential. Appl. Sci. 2022, 12, 11818. [Google Scholar] [CrossRef]
- Zengerling, Z.L.; Linke, F.; Weder, C.M.; Dahlmann, K. Climate-Optimised Intermediate Stop Operations: Mitigation Potential and Differences from Fuel-Optimised Configuration. Appl. Sci. 2022, 12, 12499. [Google Scholar] [CrossRef]
- Silberhorn, D.; Dahlmann, K.; Görtz, A.; Linke, F.; Zanger, J.; Rauch, B.; Methling, T.; Janzer, C.; Hartmann, J. Climate Impact Reduction Potentials of Synthetic Kerosene and Green Hydrogen Powered Mid-Range Aircraft Concepts. Appl. Sci. 2022, 12, 5950. [Google Scholar] [CrossRef]
- IATA SAF Production to Triple in 2024 but More Opportunities for Diversification Needed. Available online: https://www.iata.org/en/pressroom/2024-releases/2024-06-02-03/ (accessed on 14 June 2024).
- Research and Markets Global Airlines Strategic Market Report 2023–2030: Air Passenger Traffic and Demand for Modern Aircraft Present Long-Term Growth Opportunities. Available online: https://www.globenewswire.com/en/news-release/2023/11/29/2787584/28124/en/Global-Airlines-Strategic-Market-Report-2023-2030-Air-Passenger-Traffic-and-Demand-for-Modern-Aircraft-Present-Long-term-Growth-Opportunities.html (accessed on 14 June 2024).
- Hocko, M.; Al-Rabeei, S.; Koščáková, M. Effects of FAME Biofuel and Jet A-1 Aviation Kerosene Blends on the Operating Characteristics of Aircraft Jet Engines. Appl. Sci. 2023, 13, 971. [Google Scholar] [CrossRef]
- Prussi, M.; Panoutsou, C.; Chiaramonti, D. Assessment of the Feedstock Availability for Covering EU Alternative Fuels Demand. Appl. Sci. 2022, 12, 740. [Google Scholar] [CrossRef]
- Stanton, B.J.; Gustafson, R.R. Advanced Hardwood Biofuels Northwest: Commercialization Challenges for the Renewable Aviation Fuel Industry. Appl. Sci. 2019, 9, 4644. [Google Scholar] [CrossRef]
- ASTM D7566; Standard Specification for Aviation Turbine Fuel Containing Synthesized Hydrocarbons. ASTM International: West Conshohocken, PA, USA, 2024.
- ASTM D1655; Standard Specification for Aviation Turbine Fuels 1. ASTM International: West Conshohocken, PA, USA, 2024. [CrossRef]
- Hwang, B.J.; Kang, S.; Lee, H.J.; Min, S. Measurement of Laminar Burning Velocity of High Performance Alternative Aviation Fuels. Fuel 2020, 261, 116466. [Google Scholar] [CrossRef]
- Mirea, R.; Cican, G. Lab Scale Investigation of Gaseous Emissions, Performance and Stability of an Aviation Turbo-Engine While Running on Biodiesel Based Sustainable Aviation Fuel. Inventions 2024, 9, 16. [Google Scholar] [CrossRef]
- Cican, G.; Mirea, R.; Rimbu, G. Experimental Evaluation of Methanol/Jet-A Blends as Sustainable Aviation Fuels for Turbo-Engines: Performance and Environmental Impact Analysis. Fire 2024, 7, 155. [Google Scholar] [CrossRef]
- Comandini, A.; Dubois, T.; Chaumeix, N. Laminar Flame Speeds of N-Decane, n-Butylbenzene, and n-Propylcyclohexane Mixtures. Proc. Combust. Inst. 2015, 35, 671–678. [Google Scholar] [CrossRef]
- Wang, Z.; Alswat, M.; Yu, G.; Allehaibi, M.O.; Metghalchi, H. Flame Structure and Laminar Burning Speed of Gas to Liquid Fuel Air Mixtures at Moderate Pressures and High Temperatures. Fuel 2017, 209, 529–537. [Google Scholar] [CrossRef]
- Liu, Z.; Yang, X.; Ding, S. Assessment the Safety of Alternative Aviation Fuels in Aero-Engine. In Proceedings of the ASME 2016 Power Conference, Charlotte, NC, USA, 26 June 2016; American Society of Mechanical Engineers: New York, NY, USA, 2016. [Google Scholar]
- Liu, Z.Y.; Yang, X.Y. Engine Performance and Emission Characteristics of Cellulosic Jet Biofuel Blends. China Pet. Process. Petrochem. Technol. 2023, 3, 29–36. [Google Scholar]
- UN Environment Programme Pollution Action Note–Data You Need to Know. Available online: https://www.unep.org/interactives/air-pollution-note/ (accessed on 14 June 2024).
- Harvard, T.H. Chan School of Public Health Fossil Fuel Air Pollution Responsible for 1 in 5 Deaths Worldwide. Available online: https://www.hsph.harvard.edu/c-change/news/fossil-fuel-air-pollution-responsible-for-1-in-5-deaths-worldwide/ (accessed on 14 June 2024).
- Morita, H.; Yang, S.; Unger, N.; Kinney, P.L. Global Health Impacts of Future Aviation Emissions Under Alternative Control Scenarios. Environ. Sci. Technol. 2014, 48, 14659–14667. [Google Scholar] [CrossRef]
- Quadros, F.D.A.; Snellen, M.; Sun, J.; Dedoussi, I.C. Global Civil Aviation Emissions Estimates for 2017–2020 Using ADS-B Data. J. Aircr. 2022, 59, 1394–1405. [Google Scholar] [CrossRef]
- Cui, Q.; Chen, B.; Lei, Y.L. Accounting for the Aircraft Emissions of China’s Domestic Routes during 2014–2019. Sci. Data 2022, 9, 383. [Google Scholar] [CrossRef]
- Ouyang, Z.; Nikolaidis, T.; Jafari, S. Integrated Power and Thermal Management Systems for Civil Aircraft: Review, Challenges, and Future Opportunities. Appl. Sci. 2024, 14, 3689. [Google Scholar] [CrossRef]
- Ovdiienko, O.; Hryhorak, M.; Marchuk, V.; Bugayko, D. An Assessment of the Aviation Industry’s Impact on Air Pollution from Its Emissions: Worldwide and the Ukraine. Environ. Socio-Econ. Stud. 2021, 9, 1–10. [Google Scholar] [CrossRef]
- Boucher, O.; Borella, A.; Gasser, T.; Hauglustaine, D. On the Contribution of Global Aviation to the CO2 Radiative Forcing of Climate. Atmos Environ. 2021, 267, 118762. [Google Scholar] [CrossRef]
- Shan, W.; Zhou, H.; Mao, J.; Ding, Q.; Cui, Y.; Zhao, F.; Xiong, C.; Li, H. Effect of Combustion Conditions and Blending Ratio on Aero-Engine Emissions. Energies 2023, 16, 7060. [Google Scholar] [CrossRef]
- She, Y.; Deng, Y.; Chen, M. From Takeoff to Touchdown: A Decade’s Review of Carbon Emissions from Civil Aviation in China’s Expanding Megacities. Sustainability 2023, 15, 16558. [Google Scholar] [CrossRef]
- Lashof, D.A.; Ahuja, D.R. Relative Contributions of Greenhouse Gas Emissions to Global Warming. Nature 1990, 344, 529–531. [Google Scholar] [CrossRef]
- Meinshausen, M.; Meinshausen, N.; Hare, W.; Raper, S.C.B.; Frieler, K.; Knutti, R.; Frame, D.J.; Allen, M.R. Greenhouse-Gas Emission Targets for Limiting Global Warming to 2 °C. Nature 2009, 458, 1158–1162. [Google Scholar] [CrossRef] [PubMed]
- Grewe, V.; Gangoli Rao, A.; Grönstedt, T.; Xisto, C.; Linke, F.; Melkert, J.; Middel, J.; Ohlenforst, B.; Blakey, S.; Christie, S.; et al. Evaluating the Climate Impact of Aviation Emission Scenarios towards the Paris Agreement Including COVID-19 Effects. Nat. Commun. 2021, 12, 3841. [Google Scholar] [CrossRef] [PubMed]
- Lee, D.S.; Fahey, D.W.; Skowron, A.; Allen, M.R.; Burkhardt, U.; Chen, Q.; Doherty, S.J.; Freeman, S.; Forster, P.M.; Fuglestvedt, J.; et al. The Contribution of Global Aviation to Anthropogenic Climate Forcing for 2000 to 2018. Atmos Environ. 2021, 244, 117834. [Google Scholar] [CrossRef]
- Gualtieri, M.; Berico, M.; Grollino, M.; Cremona, G.; La Torretta, T.; Malaguti, A.; Petralia, E.; Stracquadanio, M.; Santoro, M.; Benassi, B.; et al. Emission Factors of CO2 and Airborne Pollutants and Toxicological Potency of Biofuels for Airplane Transport: A Preliminary Assessment. Toxics 2022, 10, 617. [Google Scholar] [CrossRef]
- Anderson, B.E.; Beyersdorf, A.J.; Hudgins, C.H.; Plant, J.V.; Thornhill, K.L.; Winstead, E.L.; Ziemba, L.D.; Howard, R.; Afb, A.; Corporan, T.E.; et al. Alternative Aviation Fuel Experiment (AAFEX); NASA: Greenbelt, MD, USA, 2011. [Google Scholar]
- Abrantes, I.; Ferreira, A.F.; Silva, A.; Costa, M. Sustainable Aviation Fuels and Imminent Technologies-CO2 Emissions Evolution towards 2050. J. Clean. Prod. 2021, 313, 127937. [Google Scholar] [CrossRef]
- Oehmichen, K.; Majer, S.; Müller-Langer, F.; Thrän, D. Comprehensive LCA of Biobased Sustainable Aviation Fuels and JET A-1 Multiblend. Appl. Sci. 2022, 12, 3372. [Google Scholar] [CrossRef]
- Liu, Z.; Liu, C.; Han, S.; Yang, X. The Balance of Contradictory Factors in the Selection of Biodiesel and Jet Biofuels on Algae Fixation of Flue Gas. Energy AI 2022, 9, 100156. [Google Scholar] [CrossRef]
- Liu, Z.; Liu, H.; Yang, X. Life Cycle Assessment of the Cellulosic Jet Fuel Derived from Agriculture Residue. Aerospace 2023, 10, 129. [Google Scholar] [CrossRef]
- Liu, Z.; Yang, X. The Potential GHGs Reduction of Co-Processing Aviation Biofuel in Life Cycle. Bioresour. Bioprocess. 2023, 10, 57. [Google Scholar] [CrossRef] [PubMed]
- Staples, M.D.; Malina, R.; Suresh, P.; Hileman, J.I.; Barrett, S.R.H. Aviation CO2 Emissions Reductions from the Use of Alternative Jet Fuels. Energy Policy 2018, 114, 342–354. [Google Scholar] [CrossRef]
- Han, J.; Elgowainy, A.; Cai, H.; Wang, M.Q. Life-Cycle Analysis of Bio-Based Aviation Fuels. Bioresour. Technol. 2013, 150, 447–456. [Google Scholar] [CrossRef] [PubMed]
- De Jong, S.; Antonissen, K.; Hoefnagels, R.; Lonza, L.; Wang, M.; Faaij, A.; Junginger, M. Life-Cycle Analysis of Greenhouse Gas Emissions from Renewable Jet Fuel Production. Biotechnol. Biofuels 2017, 10, 64. [Google Scholar] [CrossRef] [PubMed]
- Liu, Z.; Yang, X. Thermal Stability Enhancement and Prediction by ANN Model. Energy AI 2024, 16, 100348. [Google Scholar] [CrossRef]
- Jerng, S.E.; Park, Y.J.; Li, J. Machine Learning for CO2 Capture and Conversion: A Review. Energy AI 2024, 16, 100361. [Google Scholar] [CrossRef]
- Jiang, H.; Wang, S.; Xing, L.; Pinfield, V.J.; Xuan, J. Machine Learning Based Techno-Economic Process Optimisation for CO2 Capture via Enhanced Weathering. Energy AI 2023, 12, 100234. [Google Scholar] [CrossRef]
- Cox, K.; Renouf, M.; Dargan, A.; Turner, C.; Klein-Marcuschamer, D. Environmental Life Cycle Assessment (LCA) of Aviation Biofuel from Microalgae, Pongamia Pinnata, and Sugarcane Molasses. Biofuels Bioprod. Biorefin. 2014, 8, 579–593. [Google Scholar] [CrossRef]
- Wei, H.; Liu, W.; Chen, X.; Yang, Q.; Li, J.; Chen, H. Renewable Bio-Jet Fuel Production for Aviation: A Review. Fuel 2019, 254, 115599. [Google Scholar] [CrossRef]
- Dennis, R.; Long, H.A.; Jesionowski, G. A Literature Review of NOx Emissions in Current and Future State-of-the-Art Gas Turbines. In Volume 6: Education, Electric Power, Energy Storage, Fans and Blowers, Proceedings of the ASME Turbo Expo 2023: Turbomachinery Technical Conference and Exposition, Boston, MA, USA, 26 June 2023; American Society of Mechanical Engineers: New York, NY, USA, 2023. [Google Scholar]
- Stiehl, B.; Genova, T.; Otero, M.; Reyes, J.; Ahmed, K.A.; Martin, S.M. NOx Emission of an Axial-Staged Combustor at High-Pressure. In Proceedings of the AIAA Propulsion and Energy 2020 Forum, Virtual Event, 24 August 2020; American Institute of Aeronautics and Astronautics: Reston, VA, USA, 2020. [Google Scholar]
- Filippov, P.S.; Khudyakov, P.Y.; Ryzhkov, A.F. Validation of the Thermal NOx Emissions Model from a Gas Fuel Combustor under Atmospheric Pressure. In Journal of Physics: Conference Series; IOP Publishing: Bristol, UK, 2017; Volume 899, p. 092005. [Google Scholar] [CrossRef]
- Iyer, K.M.; Singh, A.V. NOx Emissions from Jet A-Air Detonations. In Proceedings of the AIAA Propulsion and Energy 2021 Forum, Online, 9 August 2021; American Institute of Aeronautics and Astronautics: Reston, VA, USA, 2021. [Google Scholar]
- Durocher, A.; Versailles, P.; Bourque, G.; Bergthorson, J.M. Uncertainty Quantification of NOx Emissions Induced Through the Prompt Route in Premixed Alkane Flames. In Volume 4A: Combustion, Fuels, and Emissions, Proceedings of the ASME Turbo Expo 2018: Turbomachinery Technical Conference and Exposition, Oslo, Norway, 11 June 2018; American Society of Mechanical Engineers: New York, NY, USA, 2018. [Google Scholar]
- Toof, J.L. A Model for the Prediction of Thermal, Prompt, and Fuel NOx Emissions From Combustion Turbines. J. Eng. Gas. Turbine Power 1986, 108, 340–347. [Google Scholar] [CrossRef]
- Shimokuri, D.; Fukuba, S.; Ishizuka, S. Fundamental Investigation on the Fuel-NO Emission of the Oxy-Fuel Combustion with a Tubular Flame Burner. Proc. Combust. Inst. 2015, 35, 3573–3580. [Google Scholar] [CrossRef]
- Khodayari, A.; Olsen, S.C.; Wuebbles, D.J. Evaluation of Aviation NOx-Induced Radiative Forcings for 2005 and 2050. Atmos. Environ. 2014, 91, 95–103. [Google Scholar] [CrossRef]
- Beck, J.P.; Reeves, C.E.; de Leeuw, F.A.A.M.; Penkett, S.A. The Effect of Aircraft Emissions on Tropospheric Ozone in the Northern Hemisphere. Atmos. Environ. Part A Gen. Top. 1992, 26, 17–29. [Google Scholar] [CrossRef]
- Skowron, A.; Lee, D.S.; De León, R.R. The Assessment of the Impact of Aviation NOx on Ozone and Other Radiative Forcing Responses—The Importance of Representing Cruise Altitudes Accurately. Atmos. Environ. 2013, 74, 159–168. [Google Scholar] [CrossRef]
- Skowron, A.; Lee, D.S.; De León, R.R. Variation of Radiative Forcings and Global Warming Potentials from Regional Aviation NOx Emissions. Atmos. Environ. 2015, 104, 69–78. [Google Scholar] [CrossRef]
- Skowron, A.; Lee, D.S.; De León, R.R.; Lim, L.L.; Owen, B. Greater Fuel Efficiency Is Potentially Preferable to Reducing NOx Emissions for Aviation’s Climate Impacts. Nat. Commun. 2021, 12, 564. [Google Scholar] [CrossRef] [PubMed]
- Søvde, O.A.; Matthes, S.; Skowron, A.; Iachetti, D.; Lim, L.; Owen, B.; Hodnebrog, Ø.; Di Genova, G.; Pitari, G.; Lee, D.S.; et al. Aircraft Emission Mitigation by Changing Route Altitude: A Multi-Model Estimate of Aircraft NOx Emission Impact on O3 Photochemistry. Atmos. Environ. 2014, 95, 468–479. [Google Scholar] [CrossRef]
- Köhler, M.O.; Rädel, G.; Shine, K.P.; Rogers, H.L.; Pyle, J.A. Latitudinal Variation of the Effect of Aviation NOx Emissions on Atmospheric Ozone and Methane and Related Climate Metrics. Atmos. Environ. 2013, 64, 1–9. [Google Scholar] [CrossRef]
- Bo, X.; Xue, X.; Xu, J.; Du, X.; Zhou, B.; Tang, L. Aviation’s Emissions and Contribution to the Air Quality in China. Atmos. Environ. 2019, 201, 121–131. [Google Scholar] [CrossRef]
- Corporan, E.; DeWitt, M.J.; Klingshirn, C.D.; Anneken, D.; Shafer, L.; Streibich, R. Comparisons of Emissions Characteristics of Several Turbine Engines Burning Fischer-Tropsch and Hydroprocessed Esters and Fatty Acids Alternative Jet Fuels. In Volume 2: Combustion, Fuels and Emissions, Parts A and B, Proceedings of the ASME Turbo Expo 2012: Turbine Technical Conference and Exposition, Copenhagen, Denmark, 11 June 2012; American Society of Mechanical Engineers: New York, NY, USA, 2012; pp. 425–436. [Google Scholar]
- Klingshirn, C.D.; Dewitt, M.; Striebich, R.; Anneken, D.; Shafer, L.; Corporan, E.; Wagner, M.; Brigalli, D. Hydroprocessed Renewable Jet Fuel Evaluation, Performance, and Emissions in a T63 Turbine Engine. J. Eng. Gas. Turbine Power 2012, 134, 051506. [Google Scholar] [CrossRef]
- Reksowardojo, I.K.; Duong, L.H.; Zain, R.; Hartono, F.; Marno, S.; Rustyawan, W.; Putri, N.; Jatiwiramurti, W.; Prabowo, B. Performance and Exhaust Emissions of a Gas-Turbine Engine Fueled with Biojet/Jet a-1 Blends for the Development of Aviation Biofuel in Tropical Regions. Energies 2020, 13, 6570. [Google Scholar] [CrossRef]
- Okai, K.; Mizuno, T.; Fujiwara, H.; Makida, M.; Shimodaira, K.; Oinuma, H.; Enomoto, S.; Nozaki, O.; Shinoda, K.; Fujii, A.; et al. Emission and Engine Operation with SAF (Sustainable Aviation Fuel) Produced through Integrated Process of Woody Biomass Gasification and Fischer-Tropsch Synthesis. In Proceedings of the AIAA Propulsion and Energy Forum, Virtual Event, 9–11 August 2021; American Institute of Aeronautics and Astronautics Inc., AIAA: Reston, VA, USA, 2021. [Google Scholar]
- Wang, Z.; Feser, J.S.; Lei, T.; Gupta, A.K. Performance and Emissions of Camelina Oil Derived Jet Fuel Blends under Distributed Combustion Condition. Fuel 2020, 271, 117685. [Google Scholar] [CrossRef]
- Undavalli, V.; Hamilton, J.; Ubogu, E.; Ahmed, I.; Khandelwal, B. Impact of Heaf Fuel Properties on Gaseous Emissions and Somke Number in a Gas Turbine Engine. In Proceedings of the ASME Turbo Expo 2022: Turbomachinery Technical Conference and Exposition, Rotterdam, The Netherlands, 13–17 June 2022. [Google Scholar]
- Boomadevi, P.; Paulson, V.; Samlal, S.; Varatharajan, M.; Sekar, M.; Alsehli, M.; Elfasakhany, A.; Tola, S. Impact of Microalgae Biofuel on Microgas Turbine Aviation Engine: A Combustion and Emission Study. Fuel 2021, 302, 121155. [Google Scholar] [CrossRef]
- Harper, J.; Durand, E.; Bowen, P.; Pugh, D.; Johnson, M.; Crayford, A. Influence of Alternative Fuel Properties and Combustor Operating Conditions on the NvPM and Gaseous Emissions Produced by a Small-Scale RQL Combustor. Fuel 2022, 315, 123045. [Google Scholar] [CrossRef]
- Feser, J.; Gupta, A. Performance and Emissions of Drop-in Aviation Biofuels in a Lab-Scale Gas Turbine Combustor. J. Energy Resour. Technol. Trans. ASME 2021, 143, 042103. [Google Scholar] [CrossRef]
- Devi, B.; Venkatesh, S.; Vimal, R.; Praveenkumar, T.R. Influence of High Oxygenated Biofuels on Micro-Gas Turbine Engine for Reduced Emission. Aircr. Eng. Aerosp. Technol. 2020, 93, 508–513. [Google Scholar] [CrossRef]
- Santoni, G.W.; Lee, B.H.; Wood, E.C.; Herndon, S.C.; Miake-Lye, R.C.; Wofsy, S.C.; McManus, J.B.; Nelson, D.D.; Zahniser, M.S. Aircraft Emissions of Methane and Nitrous Oxide during the Alternative Aviation Fuel Experiment. Environ. Sci. Technol. 2011, 45, 7075–7082. [Google Scholar] [CrossRef] [PubMed]
- Lind, J.M. Anatomy of an Occupational Hazard Cabin Air Contamination in the Air Transportation. J. Biol. Phys. Chem. 2023, 23, 81–88. [Google Scholar] [CrossRef]
- Hageman, G.; van Broekhuizen, P.; Nihom, J. The Role of Carbon Monoxide in Aerotoxic Syndrome. Neurotoxicology 2024, 100, 107–116. [Google Scholar] [CrossRef]
- Yang, J.; Xin, Z.; He, Q.; Corscadden, K.; Niu, H. An Overview on Performance Characteristics of Bio-Jet Fuels. Fuel 2019, 237, 916–936. [Google Scholar] [CrossRef]
- Sundararaj, R.H.; Kumar, R.D.; Raut, A.K.; Sekar, T.C.; Pandey, V.; Kushari, A.; Puri, S.K. Combustion and Emission Characteristics from Biojet Fuel Blends in a Gas Turbine Combustor. Energy 2019, 182, 689–705. [Google Scholar] [CrossRef]
- Schripp, T.; Herrmann, F.; Oßwald, P.; Köhler, M.; Zschocke, A.; Weigelt, D.; Mroch, M.; Werner-Spatz, C. Particle Emissions of Two Unblended Alternative Jet Fuels in a Full Scale Jet Engine. Fuel 2019, 256, 115903. [Google Scholar] [CrossRef]
- Timko, M.T.; Herndon, S.C.; De La Rosa Blanco, E.; Wood, E.C.; Yu, Z.; Miake-Lye, R.C.; Knighton, W.B.; Shafer, L.; Dewitt, M.J.; Corporan, E. Combustion Products of Petroleum Jet Fuel, a Fischer-Tropsch Synthetic Fuel, and a Biomass Fatty Acid Methyl Ester Fuel for a Gas Turbine Engine. Combust. Sci. Technol. 2011, 183, 1039–1068. [Google Scholar] [CrossRef]
- Masiol, M.; Harrison, R.M. Aircraft Engine Exhaust Emissions and Other Airport-Related Contributions to Ambient Air Pollution: A Review. Atmos Environ. 2014, 95, 409–455. [Google Scholar] [CrossRef] [PubMed]
- Cui, Q.; Lei, Y. Pathways Analysis to Reducing Aircraft Emissions for China-Foreign Routes. NPJ Clim. Action. 2023, 2, 15. [Google Scholar] [CrossRef]
- Habib, Z.; Parthasarathy, R.; Gollahalli, S. Performance and Emission Characteristics of Biofuel in a Small-Scale Gas Turbine Engine. Appl. Energy 2010, 87, 1701–1709. [Google Scholar] [CrossRef]
- Wang, W.C.; Tao, L. Bio-Jet Fuel Conversion Technologies. Renew. Sustain. Energy Rev. 2016, 53, 801–822. [Google Scholar] [CrossRef]
- Zhang, C.; Chen, L.; Ding, S.; Zhou, X.; Chen, R.; Zhang, X.; Yu, Z.; Wang, J. Mitigation Effects of Alternative Aviation Fuels on Non-Volatile Particulate Matter Emissions from Aircraft Gas Turbine Engines: A Review. Sci. Total Environ. 2022, 820, 153233. [Google Scholar] [CrossRef] [PubMed]
- Riebl, S.; Braun-Unkhoff, M.; Riedel, U. A Study on the Emissions of Alternative Aviation Fuels. J. Eng. Gas. Turbine Power 2017, 139, 081503. [Google Scholar] [CrossRef]
- Unger, N. Global Climate Impact of Civil Aviation for Standard and Desulfurized Jet Fuel. Geophys. Res. Lett. 2011, 38, L20803. [Google Scholar] [CrossRef]
- Kapadia, Z.Z.; Spracklen, D.V.; Arnold, S.R.; Borman, D.J.; Mann, G.W.; Pringle, K.J.; Monks, S.A.; Reddington, C.L.; Benduhn, F.; Rap, A.; et al. Impacts of Aviation Fuel Sulfur Content on Climate and Human Health. Atmos. Chem. Phys. 2016, 16, 10521–10541. [Google Scholar] [CrossRef]
- Jurkat, T.; Voigt, C.; Arnold, F.; Schlager, H.; Kleffmann, J.; Aufmhoff, H.; Schäuble, D.; Schaefer, M.; Schumann, U. Measurements of HONO, NO, NOy and SO2 in Aircraft Exhaust Plumes at Cruise. Geophys. Res. Lett. 2011, 38, L10807. [Google Scholar] [CrossRef]
- Hunton, D.E.; Ballenthin, J.O.; Borghetti, J.F.; Federico, G.S.; Miller, T.M.; Thorn, W.F.; Viggiano, A.A.; Anderson, B.E.; Cofer, W.R.; McDougal, D.S.; et al. Chemical Ionization Mass Spectrometric Measurements of SO2 Emissions from Jet Engines in Flight and Test Chamber Operations. J. Geophys. Res. Atmos. 2000, 105, 26841–26855. [Google Scholar] [CrossRef]
- Korres, D.M.; Lois, E.; Karonis, D. Use of JP-8 Aviation Fuel and Biodiesel on a Diesel Engine. SAE Trans. 2004, 113, 2027–2037. [Google Scholar]
- Curtius, J.; Sierau, B.; Arnold, F.; Baumann, R.; Busen, R.; Schulte, P.; Schumann, U. First Direct Sulfuric Acid Detection in the Exhaust Plume of a Jet Aircraft in Flight. Geophys. Res. Lett. 1998, 25, 923–926. [Google Scholar] [CrossRef]
- Faber, J.; Király, J.; Lee, D.; Bethan, O. Potential for Reducing Aviation Non-CO2 Emissions through Cleaner Jet Fuel; CE Delft: Delft, The Netherlands, 2022. [Google Scholar]
- Shonija, N.K.; Popovicheva, O.B.; Persiantseva, N.M.; Savel’ev, A.M.; Starik, A.M. Hydration of Aircraft Engine Soot Particles under Plume Conditions: Effect of Sulfuric and Nitric Acid Processing. J. Geophys. Res. Atmos. 2007, 112, D02208. [Google Scholar] [CrossRef]
- Nascimento, A.P.; Santos, J.M.; Mill, J.G.; Toledo de Almeida Albuquerque, T.; Reis Júnior, N.C.; Reisen, V.A.; Pagel, É.C. Association between the Incidence of Acute Respiratory Diseases in Children and Ambient Concentrations of SO2, PM10 and Chemical Elements in Fine Particles. Environ. Res. 2020, 188, 109619. [Google Scholar] [CrossRef] [PubMed]
- Carlsen, H.K.; Ilyinskaya, E.; Baxter, P.J.; Schmidt, A.; Thorsteinsson, T.; Pfeffer, M.A.; Barsotti, S.; Dominici, F.; Finnbjornsdottir, R.G.; Jóhannsson, T.; et al. Increased Respiratory Morbidity Associated with Exposure to a Mature Volcanic Plume from a Large Icelandic Fissure Eruption. Nat. Commun. 2021, 12, 2161. [Google Scholar] [CrossRef] [PubMed]
- Orellano, P.; Reynoso, J.; Quaranta, N. Short-Term Exposure to Sulphur Dioxide (SO2) and All-Cause and Respiratory Mortality: A Systematic Review and Meta-Analysis. Environ. Int. 2021, 150, 106434. [Google Scholar] [CrossRef]
- Carlsen, H.K.; Valdimarsdóttir, U.; Briem, H.; Dominici, F.; Finnbjornsdottir, R.G.; Jóhannsson, T.; Aspelund, T.; Gislason, T.; Gudnason, T. Severe Volcanic SO2 Exposure and Respiratory Morbidity in the Icelandic Population—A Register Study. Environ. Health 2021, 20, 23. [Google Scholar] [CrossRef]
- Corporan, E.; DeWitt, M.J.; Belovich, V.; Pawlik, R.; Lynch, A.C.; Gord, J.R.; Meyer, T.R. Emissions Characteristics of a Turbine Engine and Research Combustor Burning a Fischer-Tropsch Jet Fuel. Energy Fuels 2007, 21, 2615–2626. [Google Scholar] [CrossRef]
- Bulzan, D.; Anderson, B.; Wey, C.; Howard, R.; Winstead, E.; Beyersdorf, A.; Corporan, E.; DeWitt, M.J.; Klingshirn, C.; Herndon, S.; et al. Gaseous and Particulate Emissions Results of the NASA Alternative Aviation Fuel Experiment (AAFEX). In Proceedings of the ASME Turbo Expo: Power for Land, Sea, and Air, Glasgow, UK, 14–18 June 2010; Volume 2, pp. 1195–1207. [Google Scholar]
- Beyersdorf, A.J.; Timko, M.T.; Ziemba, L.D.; Bulzan, D.; Corporan, E.; Herndon, S.C.; Howard, R.; Miake-Lye, R.; Thornhill, K.L.; Winstead, E.; et al. Reductions in Aircraft Particulate Emissions Due to the Use of Fischer–Tropsch Fuels. Atmos. Chem. Phys. 2014, 14, 11–23. [Google Scholar] [CrossRef]
- Yakovlieva, A.V.; Boichenko, S.V.; Zaremba, J. Improvement of Air Transport Environmental Safety by Implementing Alternative Jet Fuels. In Proceedings of the 2019 Modern Safety Technologies in Transportation (MOSATT), Kosice, Slovakia, 28–29 November 2019; IEEE: Washington, DC, USA, 2019; pp. 146–151. [Google Scholar]
- Cican, G.; Plesu, V.; Deaconu, M.; Toma, A.; Cretu, M. Performances and Emissions Evaluation of a Microturbojet Engine Running on Biodiesel Blends. J. Energy Resour. Technol. Trans. ASME 2019, 141, 072003. [Google Scholar] [CrossRef]
- Tran, S.; Brown, A.; Olfert, J.S. Comparison of Particle Number Emissions from In-Flight Aircraft Fueled with Jet A1, JP-5 and an Alcohol-to-Jet Fuel Blend. Energy Fuels 2020, 34, 7218–7222. [Google Scholar] [CrossRef]
- Corporan, E.; Dewitt, M.J.; Klingshirn, C.D.; Anneken, D. Alternative Fuels Tests on a C-17 Aircraft: Emissions Characteristics; University of Dayton Research Institute: Dayton, OH, USA, 2010. [Google Scholar]
- Lobo, P.; Durdina, L.; Brem, B.T.; Crayford, A.P.; Johnson, M.P.; Smallwood, G.J.; Siegerist, F.; Williams, P.I.; Black, E.A.; Llamedo, A.; et al. Comparison of Standardized Sampling and Measurement Reference Systems for Aircraft Engine Non-Volatile Particulate Matter Emissions. J. Aerosol Sci. 2020, 145, 105557. [Google Scholar] [CrossRef]
- Jasiński, R.; Przysowa, R. Evaluating the Impact of Using HEFA Fuel on the Particulate Matter Emissions from a Turbine Engine. Energies 2024, 17, 1077. [Google Scholar] [CrossRef]
- Corbin, J.C.; Schripp, T.; Anderson, B.E.; Smallwood, G.J.; Leclercq, P.; Crosbie, E.C.; Achterberg, S.; Whitefield, P.D.; Miake-Lye, R.C.; Yu, Z.; et al. Aircraft-Engine Particulate Matter Emissions from Conventional and Sustainable Aviation Fuel Combustion: Comparison of Measurement Techniques for Mass, Number, and Size. Atmos. Meas. Tech. 2022, 15, 3223–3242. [Google Scholar] [CrossRef]
- Owen, B.; Anet, J.G.; Bertier, N.; Christie, S.; Cremaschi, M.; Dellaert, S.; Edebeli, J.; Janicke, U.; Kuenen, J.; Lim, L.; et al. Review: Particulate Matter Emissions from Aircraft. Atmosphere 2022, 13, 1230. [Google Scholar] [CrossRef]
- Bendtsen, K.M.; Bengtsen, E.; Saber, A.T.; Vogel, U. A Review of Health Effects Associated with Exposure to Jet Engine Emissions in and around Airports. Environ. Health 2021, 20, 10. [Google Scholar] [CrossRef] [PubMed]
- Levy, J.I.; Woody, M.; Baek, B.H.; Shankar, U.; Arunachalam, S. Current and Future Particulate-Matter-Related Mortality Risks in the United States from Aviation Emissions During Landing and Takeoff. Risk Anal. 2012, 32, 237–249. [Google Scholar] [CrossRef]
- Jalali, S.; Karbakhsh, M.; Momeni, M.; Taheri, M.; Amini, S.; Mansourian, M.; Sarrafzadegan, N. Long-Term Exposure to PM2.5 and Cardiovascular Disease Incidence and Mortality in an Eastern Mediterranean Country: Findings Based on a 15-Year Cohort Study. Environ. Health 2021, 20, 112. [Google Scholar] [CrossRef] [PubMed]
- Guo, C.; Hoek, G.; Chang, L.; Bo, Y.; Lin, C.; Huang, B.; Chan, T.; Tam, T.; Lau, A.K.H.; Lao, X.Q. Long-Term Exposure to Ambient Fine Particulate Matter (PM2.5) and Lung Function in Children, Adolescents, and Young Adults: A Longitudinal Cohort Study. Environ. Health Perspect. 2019, 127, 127008. [Google Scholar] [CrossRef] [PubMed]
- Wyzga, R.E.; Rohr, A.C. Long-Term Particulate Matter Exposure: Attributing Health Effects to Individual PM Components. J. Air Waste Manag. Assoc. 2015, 65, 523–543. [Google Scholar] [CrossRef]
- Chen, J.; Hoek, G. Long-Term Exposure to PM and All-Cause and Cause-Specific Mortality: A Systematic Review and Meta-Analysis. Environ. Int. 2020, 143, 105974. [Google Scholar] [CrossRef] [PubMed]
- Zhang, J.; Jiang, Y.; Wang, Y.; Zhang, S.; Wu, Y.; Wang, S.; Nielsen, C.P.; McElroy, M.B.; Hao, J. Increased Impact of Aviation on Air Quality and Human Health in China. Environ. Sci. Technol. 2023, 57, 19575–19583. [Google Scholar] [CrossRef] [PubMed]
- Durdina, L.; Brem, B.T.; Elser, M.; Schönenberger, D.; Siegerist, F.; Anet, J.G. Reduction of Nonvolatile Particulate Matter Emissions of a Commercial Turbofan Engine at the Ground Level from the Use of a Sustainable Aviation Fuel Blend. Environ. Sci. Technol. 2021, 55, 14576–14585. [Google Scholar] [CrossRef]
- Yu, Z.; Liscinsky, D.S.; Fortner, E.C.; Yacovitch, T.I.; Croteau, P.; Herndon, S.C.; Miake-Lye, R.C. Evaluation of PM Emissions from Two In-Service Gas Turbine General Aviation Aircraft Engines. Atmos Environ. 2017, 160, 9–18. [Google Scholar] [CrossRef]
- Kurzawska, P.; Jasiński, R. Overview of Sustainable Aviation Fuels with Emission Characteristic and Particles Emission of the Turbine Engine Fueled ATJ Blends with Different Percentages of ATJ Fuel. Energies 2021, 14, 1858. [Google Scholar] [CrossRef]
- Chan, T.W.; Chishty, W.A.; Canteenwalla, P.; Buote, D.; Davison, C.R. Characterization of Emissions from the Use of Alternative Aviation Fuels. J. Eng. Gas. Turbine Power 2016, 138, 011506. [Google Scholar] [CrossRef]
- Moore, R.H.; Shook, M.; Beyersdorf, A.; Corr, C.; Herndon, S.; Knighton, W.B.; Miake-Lye, R.; Thornhill, K.L.; Winstead, E.L.; Yu, Z.; et al. Influence of Jet Fuel Composition on Aircraft Engine Emissions: A Synthesis of Aerosol Emissions Data from the NASA APEX, AAFEX, and ACCESS Missions. Energy Fuels 2015, 29, 2591–2600. [Google Scholar] [CrossRef]
- Voigt, C.; Kleine, J.; Sauer, D.; Moore, R.H.; Bräuer, T.; Le Clercq, P.; Kaufmann, S.; Scheibe, M.; Jurkat-Witschas, T.; Aigner, M.; et al. Cleaner Burning Aviation Fuels Can Reduce Contrail Cloudiness. Commun. Earth Environ. 2021, 2, 114. [Google Scholar] [CrossRef]
- Lobo, P.; Christie, S.; Khandelwal, B.; Blakey, S.G.; Raper, D.W. Evaluation of Non-Volatile Particulate Matter Emission Characteristics of an Aircraft Auxiliary Power Unit with Varying Alternative Jet Fuel Blend Ratios. Energy Fuels 2015, 29, 7705–7711. [Google Scholar] [CrossRef]
- Moore, R.H.; Thornhill, K.L.; Weinzierl, B.; Sauer, D.; D’Ascoli, E.; Kim, J.; Lichtenstern, M.; Scheibe, M.; Beaton, B.; Beyersdorf, A.J.; et al. Biofuel Blending Reduces Particle Emissions from Aircraft Engines at Cruise Conditions. Nature 2017, 543, 411–415. [Google Scholar] [CrossRef] [PubMed]
- Braun-Unkhoff, M.; Riedel, U.; Wahl, C. About the Emissions of Alternative Jet Fuels. CEAS Aeronaut. J. 2017, 8, 167–180. [Google Scholar] [CrossRef]
- Meng, X.; Tian, H.; Tian, J.; Long, W.; Bi, M. Study of Jet Pressure and Timing on Emission Formation for High-Pressure Air Jet Controlled Premixed Combustion. Fuel 2021, 283, 119323. [Google Scholar] [CrossRef]
- El-Zoheiry, R.M.; EL-Seesy, A.I.; Attia, A.M.A.; He, Z.; El-Batsh, H.M. Combustion and Emission Characteristics of Jojoba Biodiesel-Jet A1 Mixtures Applying a Lean Premixed Pre-Vaporized Combustion Techniques: An Experimental Investigation. Renew. Energy 2020, 162, 2227–2245. [Google Scholar] [CrossRef]
- Tang, Q.; Liu, X.; Raman, V.; Shi, H.; Chang, J.; Im, H.G.; Johansson, B. Effects of Fuel Trapping in Piston Crevice on Unburned Hydrocarbon Emissions in Early-Injection Compression Ignition Engines. Combust. Flame 2021, 231, 111496. [Google Scholar] [CrossRef]
- Shao, L.; Zhou, Y.; Geng, T.; Zhao, S.; Zhu, K.; Zhong, Z.; Yan, H.; Yu, T.; Xu, Z.; Ding, S. Advanced Combustion in Heavy Fuel Aircraft Piston Engines: A Comprehensive Review and Future Directions. Fuel 2024, 370, 131771. [Google Scholar] [CrossRef]
- Tang, Q.; Johansson, B. A Review on Combustion Rate Control, Spray-Wall Impingement, and CO/UHC Formation of the Gasoline Compression Ignition Engines. In Gasoline Compression Ignition Technology: Future Prospects; Springer: Singapore, 2022; pp. 73–97. [Google Scholar]
- Pandey, V.; Badruddin, I.A.; Terfasa, T.T.; Tesfamariam, B.B.; Sayeed Ahmed, G.M.; Ahamed Saleel, C.; Alrobei, H. Experimental Investigation of the Impact of CeO2 Nanoparticles in Jet-A and Jatropha-SPK Blended Fuel in an Aircraft Can-Combustor at Flight Conditions. Fuel 2022, 317, 123393. [Google Scholar] [CrossRef]
- Anneken, D.; Striebich, R.; DeWitt, M.J.; Klingshirn, C.; Corporan, E. Development of Methodologies for Identification and Quantification of Hazardous Air Pollutants from Turbine Engine Emissions. J. Air Waste Manag. Assoc. 2015, 65, 336–346. [Google Scholar] [CrossRef]
- Barbosa, F.C. Aircraft Emissions and Noise Review—Technological Paths for Pursuing Sustainability in the Aviation Industry; SAE Technical Paper: Warrendale, PA, USA, 2021. [Google Scholar]
- Altuntas, O. Designation of Environmental Impacts and Damages of Turbojet Engine: A Case Study with GE-J85. Atmosphere 2014, 5, 307–323. [Google Scholar] [CrossRef]
- Kärcher, B. Aviation-Produced Aerosols and Contrails. Surv. Geophys. 1999, 20, 113–167. [Google Scholar] [CrossRef]
- Balli, O.; Caliskan, H. Environmental Impact Assessments of Different Auxiliary Power Units Used for Commercial Aircraft by Using Global Warming Potential Approach. Environ. Sci. Pollut. Res. 2022, 29, 87334–87346. [Google Scholar] [CrossRef] [PubMed]
- Yin, Y.; He, J.; Zhao, L.; Pei, J.; Yang, X.; Sun, Y.; Cui, X.; Lin, C.-H.; Wei, D.; Chen, Q. Identification of Key Volatile Organic Compounds in Aircraft Cabins and Associated Inhalation Health Risks. Environ. Int. 2022, 158, 106999. [Google Scholar] [CrossRef] [PubMed]
- Wolkoff, P.; Crump, D.R.; Harrison, P.T.C. Pollutant Exposures and Health Symptoms in Aircrew and Office Workers: Is There a Link? Environ. Int. 2016, 87, 74–84. [Google Scholar] [CrossRef] [PubMed]
- Lou, X.; Sun, Y.; Lv, D.; Yin, Y.; Pei, J.; He, J.; Yang, X.; Cui, X.; Liu, Y.; Norback, D.; et al. A Study on Human Perception in Aircraft Cabins and Its Association with Volatile Organic Compounds. Build Environ. 2022, 219, 109167. [Google Scholar] [CrossRef]
- Schürmann, G.; Schäfer, K.; Jahn, C.; Hoffmann, H.; Bauerfeind, M.; Fleuti, E.; Rappenglück, B. The Impact of NOx, CO and VOC Emissions on the Air Quality of Zurich Airport. Atmos. Environ. 2007, 41, 103–118. [Google Scholar] [CrossRef]
- Hong, J.Y.; Yu, S.Y.; Kim, G.W.; Ahn, J.J.; Kim, Y.; Lim, S.; Son, S.W.; Hwang, S.Y. Identification of Time-dependent Biomarkers and Effects of Exposure to Volatile Organic Compounds Using High-throughput Analysis. Environ. Toxicol. 2016, 31, 1563–1570. [Google Scholar] [CrossRef] [PubMed]
- Adgate, J.L.; Church, T.R.; Ryan, A.D.; Ramachandran, G.; Fredrickson, A.L.; Stock, T.H.; Morandi, M.T.; Sexton, K. Outdoor, Indoor, and Personal Exposure to VOCs in Children. Environ. Health Perspect. 2004, 112, 1386–1392. [Google Scholar] [CrossRef]
- Soni, V.; Singh, P.; Shree, V.; Goel, V. Effects of VOCs on Human Health. In Air Pollution and Control; Springer: Singapore, 2018; pp. 119–142. [Google Scholar]
- Samadi, M.T.; Shakerkhatibi, M.; Poorolajal, J.; Rahmani, A.; Rafieemehr, H.; Hesam, M. Association of Long Term Exposure to Outdoor Volatile Organic Compounds (BTXS) with pro-Inflammatory Biomarkers and Hematologic Parameters in Urban Adults: A Cross-Sectional Study in Tabriz, Iran. Ecotoxicol. Environ. Saf. 2019, 180, 152–159. [Google Scholar] [CrossRef]
- Hesam, M.; Shakerkhatibi, M.; Samadi, M.T.; Poorolajal, J.; Rahmani, A.; Rafieemehr, H. Long-Term Exposure to Outdoor VOCs and Lung Function in Urban Adults: A Cross-Sectional Study in Tabriz an Industrialized City in the Northwest of Iran. Hum. Ecol. Risk Assess. Int. J. 2020, 26, 1512–1528. [Google Scholar] [CrossRef]
- Oros, D.R.; Collier, R.W.; Simoneit, B.R.T. The Extent and Significance of Petroleum Hydrocarbon Contamination in Crater Lake, Oregon. In Long-Term Limnological Research and Monitoring at Crater Lake, Oregon; Springer: Dordrecht, The Netherlands, 2007; pp. 85–105. [Google Scholar]
- Li, W.; Park, R.; Alexandrou, N.; Dryfhout-Clark, H.; Brice, K.; Hung, H. Multi-Year Analyses Reveal Different Trends, Sources, and Implications for Source-Related Human Health Risks of Atmospheric Polycyclic Aromatic Hydrocarbons in the Canadian Great Lakes Basin. Environ. Sci. Technol. 2021, 55, 2254–2264. [Google Scholar] [CrossRef] [PubMed]
- Connellan, S.J. Lung Diseases Associated with Hydrocarbon Exposure. Respir. Med. 2017, 126, 46–51. [Google Scholar] [CrossRef] [PubMed]
- Liu, Z.; Wang, Z.; Yang, X. Emission Characteristics of Cellulosic Jet Biofuel Blend under Laminar and Turbulent Combustion. Biotechnol. Biofuels Bioprod. 2023, 16, 196. [Google Scholar] [CrossRef] [PubMed]
- Badami, M.; Nuccio, P.; Pastrone, D.; Signoretto, A. Performance of a Small-Scale Turbojet Engine Fed with Traditional and Alternative Fuels. Energy Convers. Manag. 2014, 82, 219–228. [Google Scholar] [CrossRef]
- Ali, A.H.H.; Ibrahim, M.N. Performance and Environmental Impact of a Turbojet Engine Fueled by Blends of Biodiesels. Int. J. Environ. Sci. Technol. 2017, 14, 1253–1266. [Google Scholar] [CrossRef]
- Rehman, A.; Phalke, D.R.; Pandey, R. Alternative Fuel for Gas Turbine: Esterified Jatropha Oil–Diesel Blend. Renew. Energy 2011, 36, 2635–2640. [Google Scholar] [CrossRef]
- International Coordinating Council of Aerospace Industries Associations (Ed.) Impact of Alternative Fuels on Aircraft Engine Emissions. In Proceedings of the Conference on Aviation and Alternative Fuels, Rio de Janeiro, Brazil, 16 November 2009; ICAO Conference on Aviation and Alternative Fuels: Rio de Janeiro, Brazil, 2009; pp. 1–10. [Google Scholar]

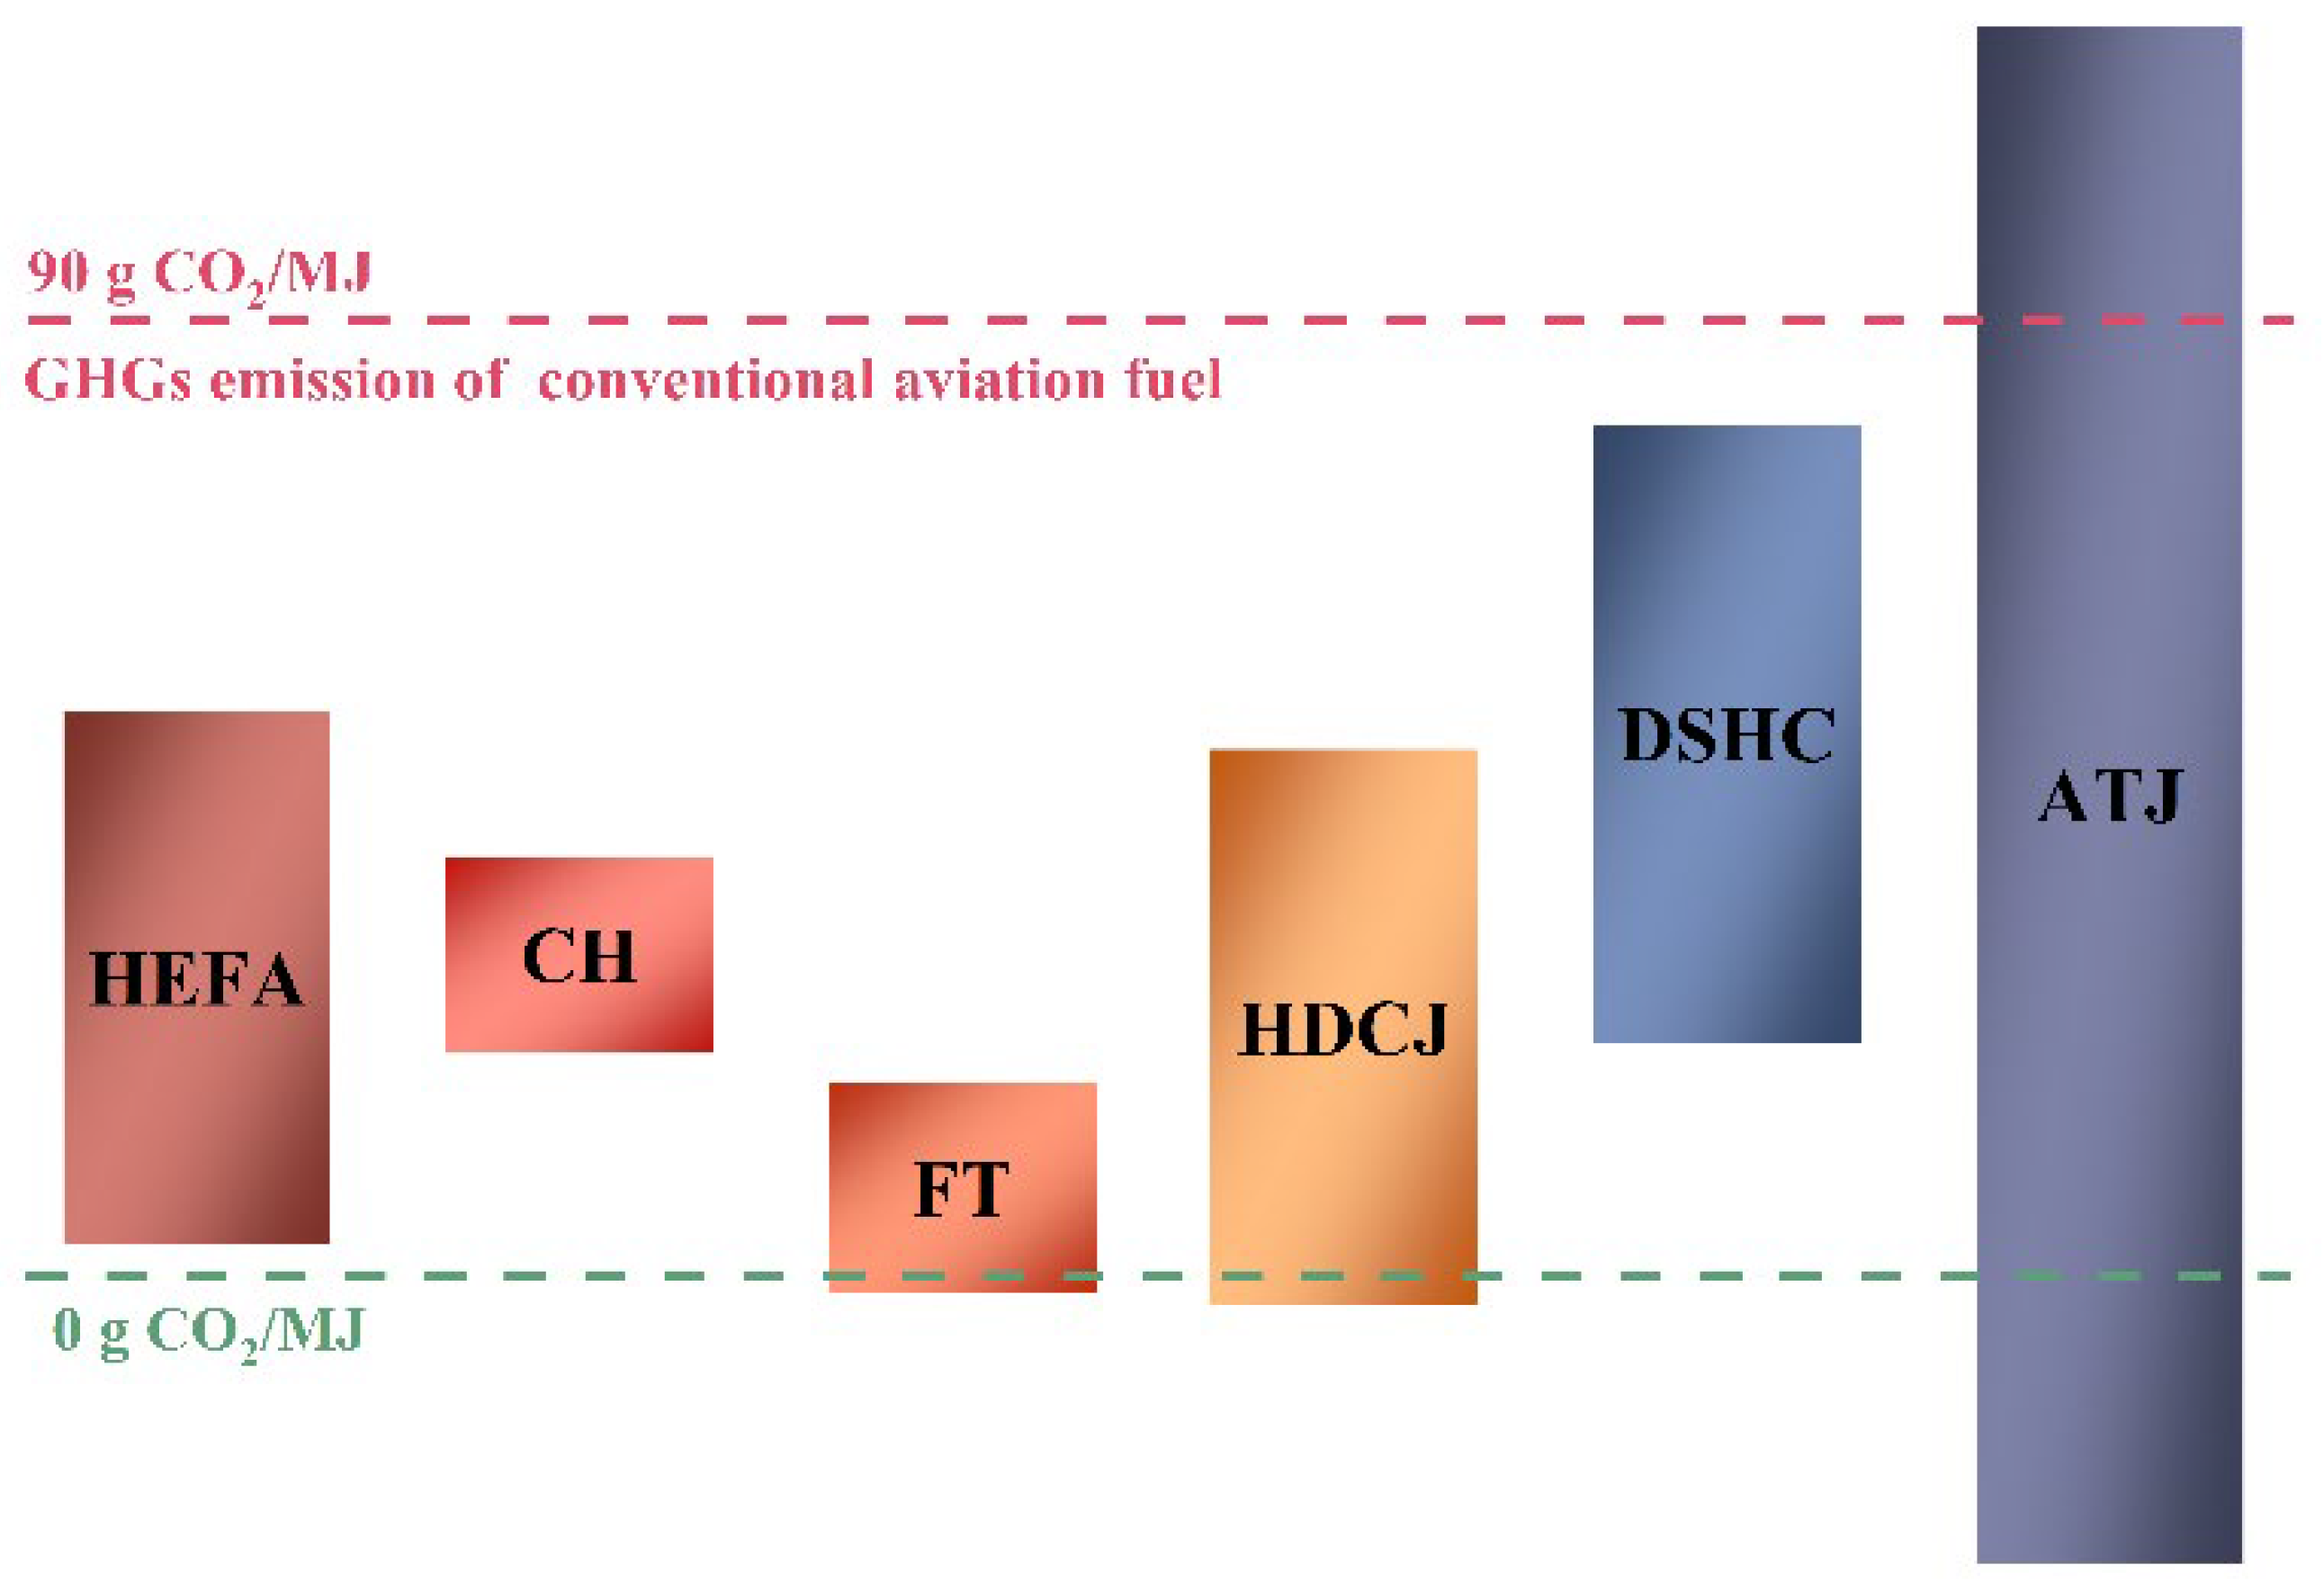
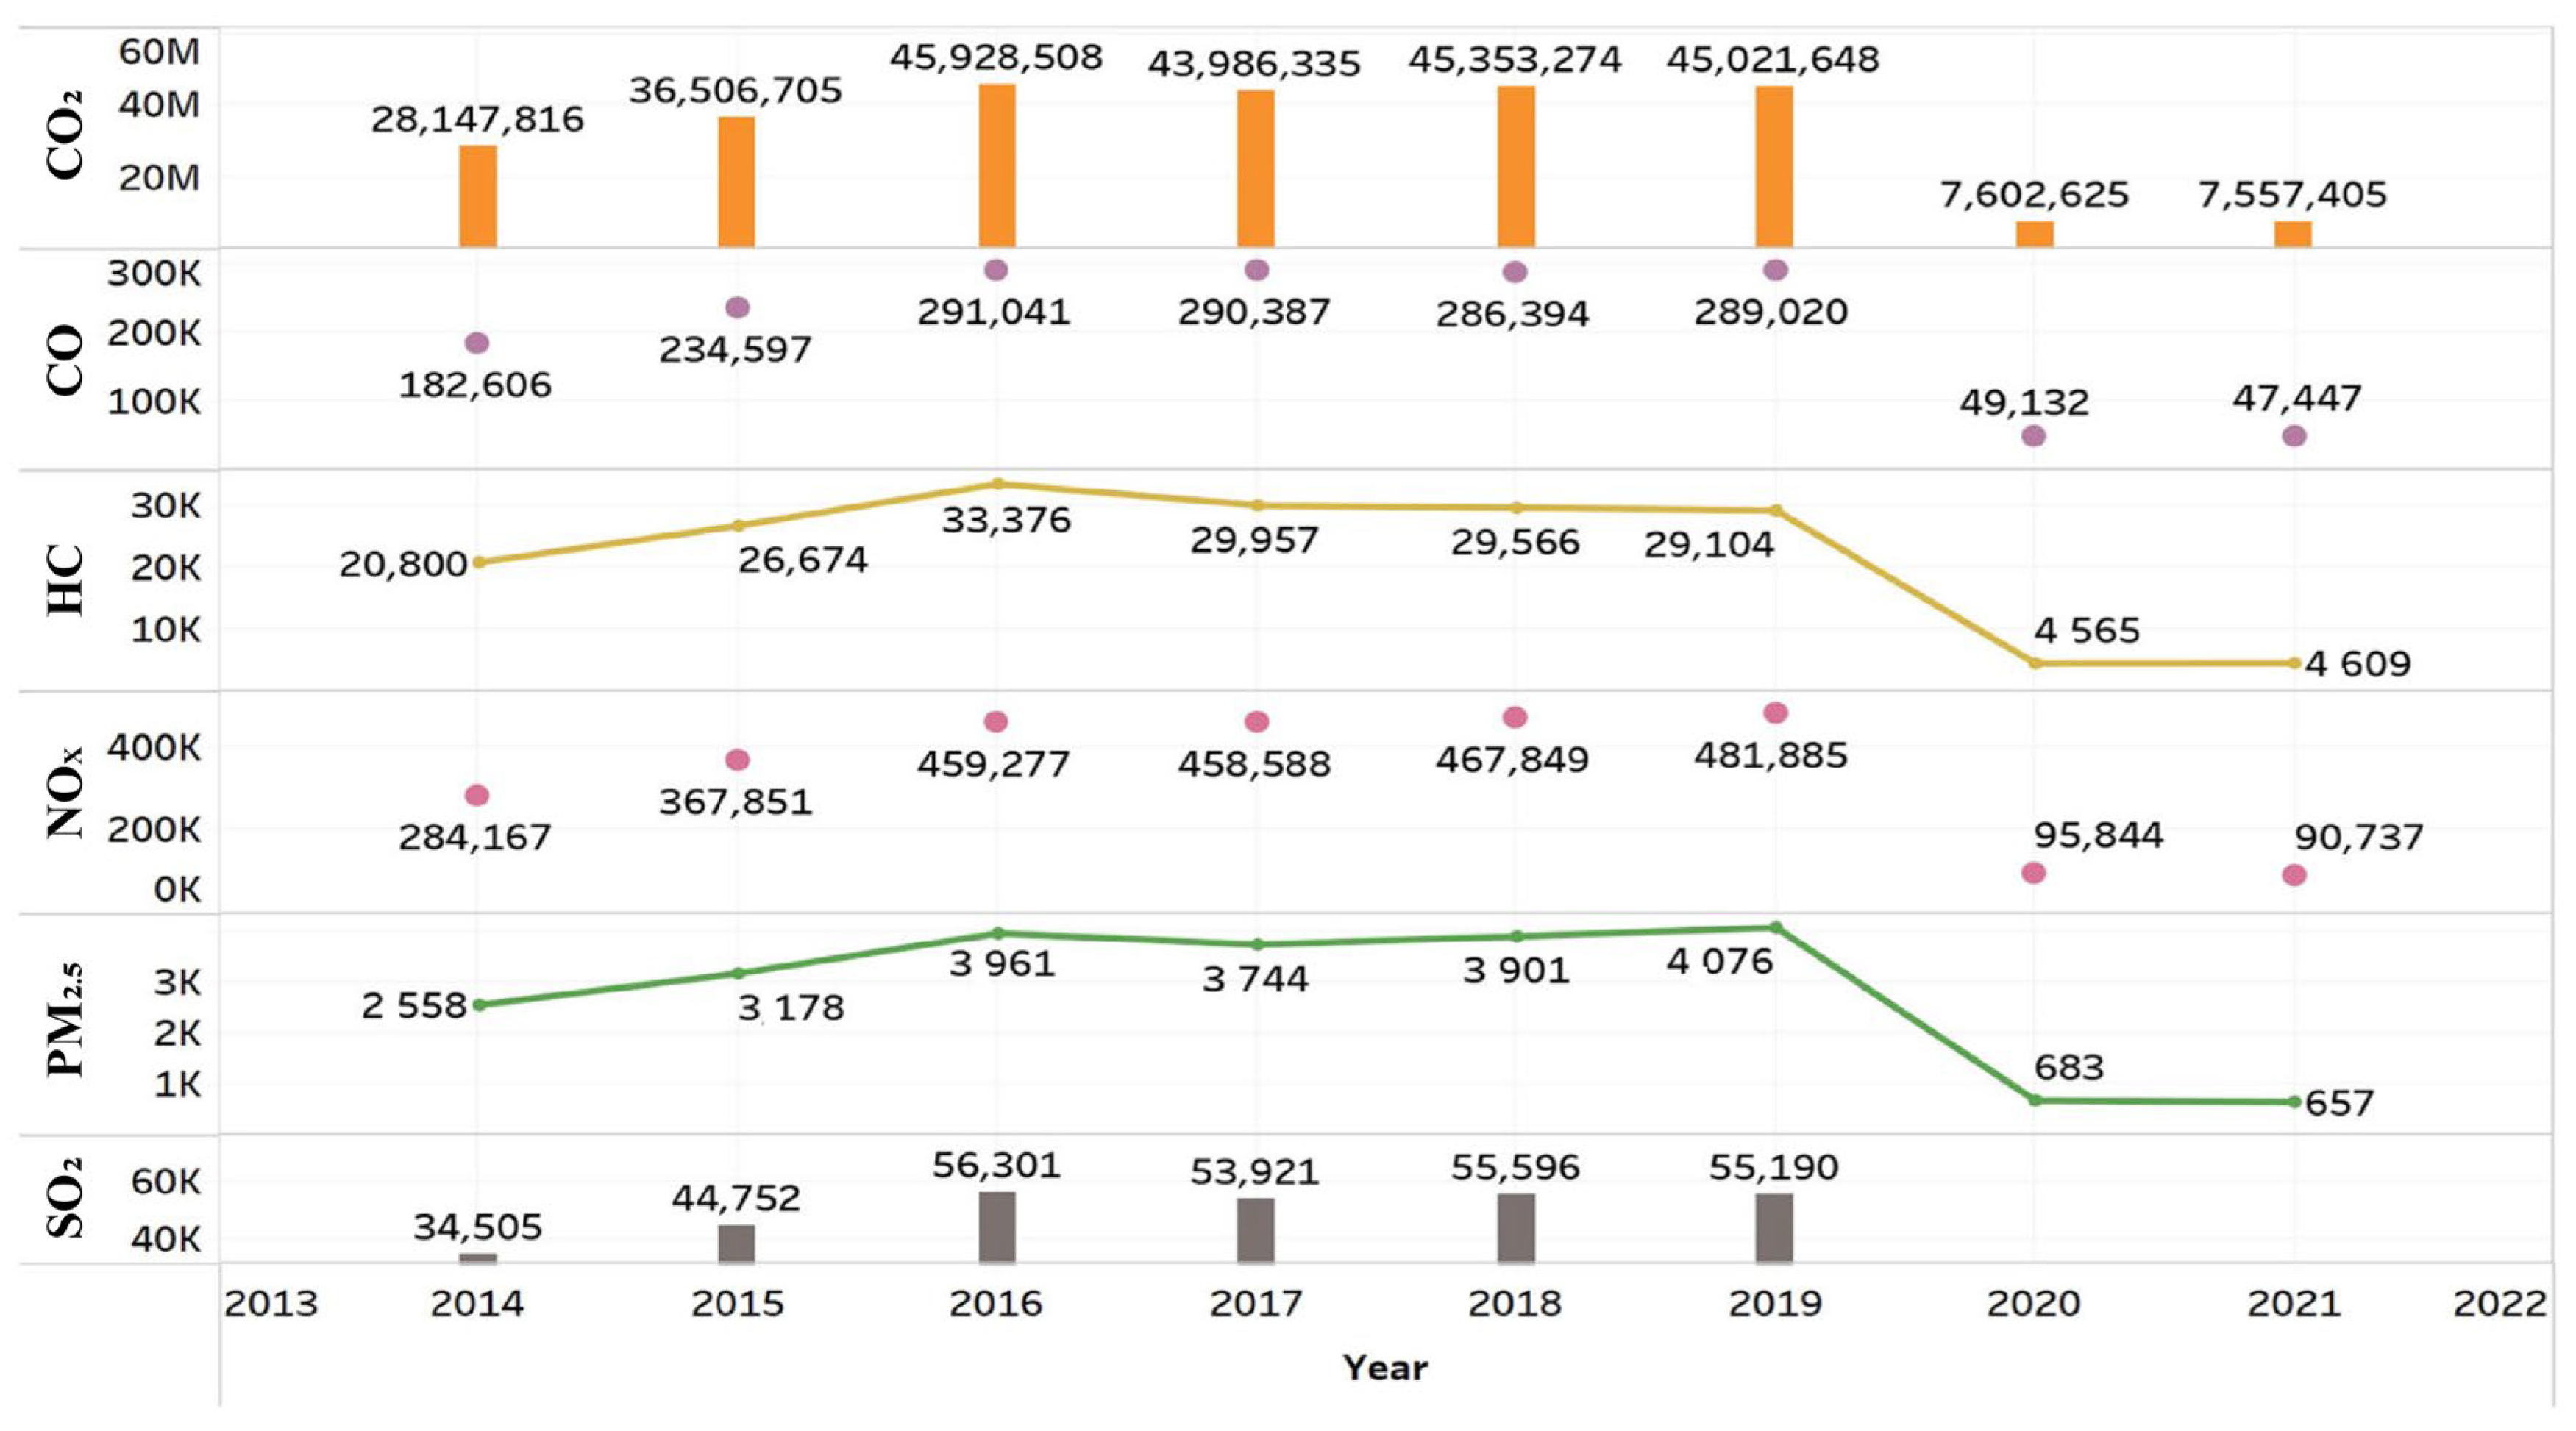
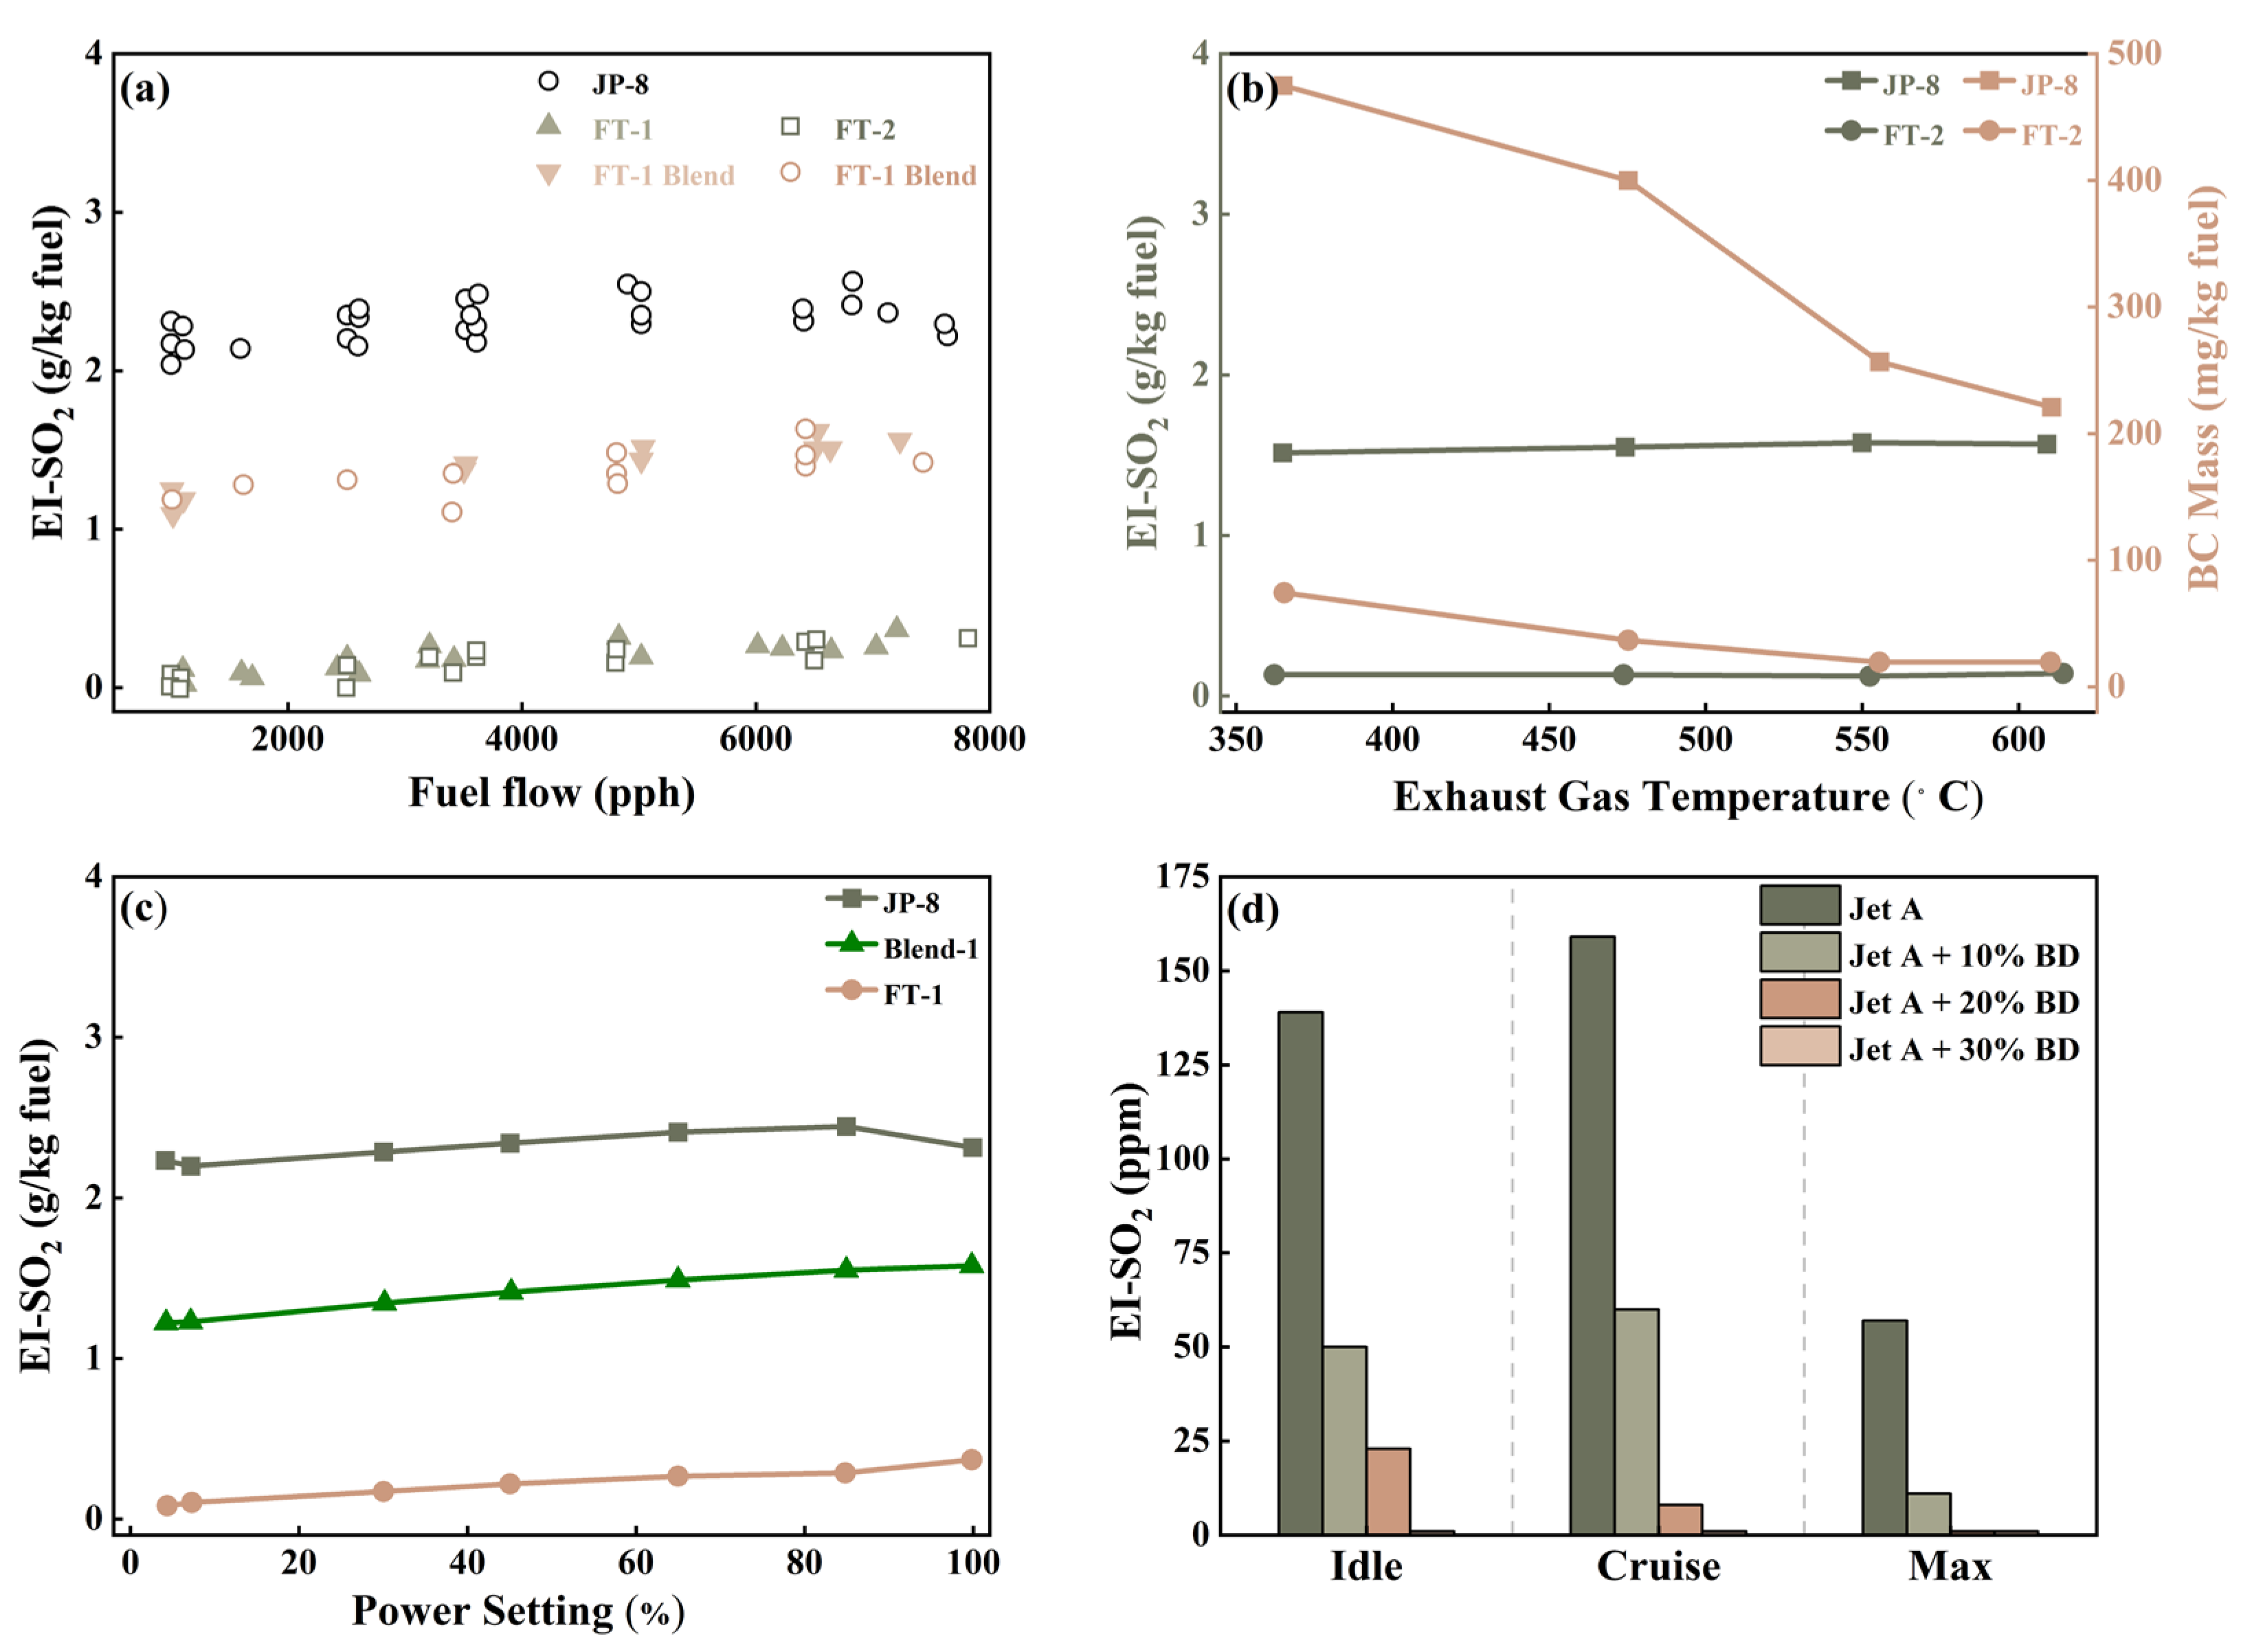
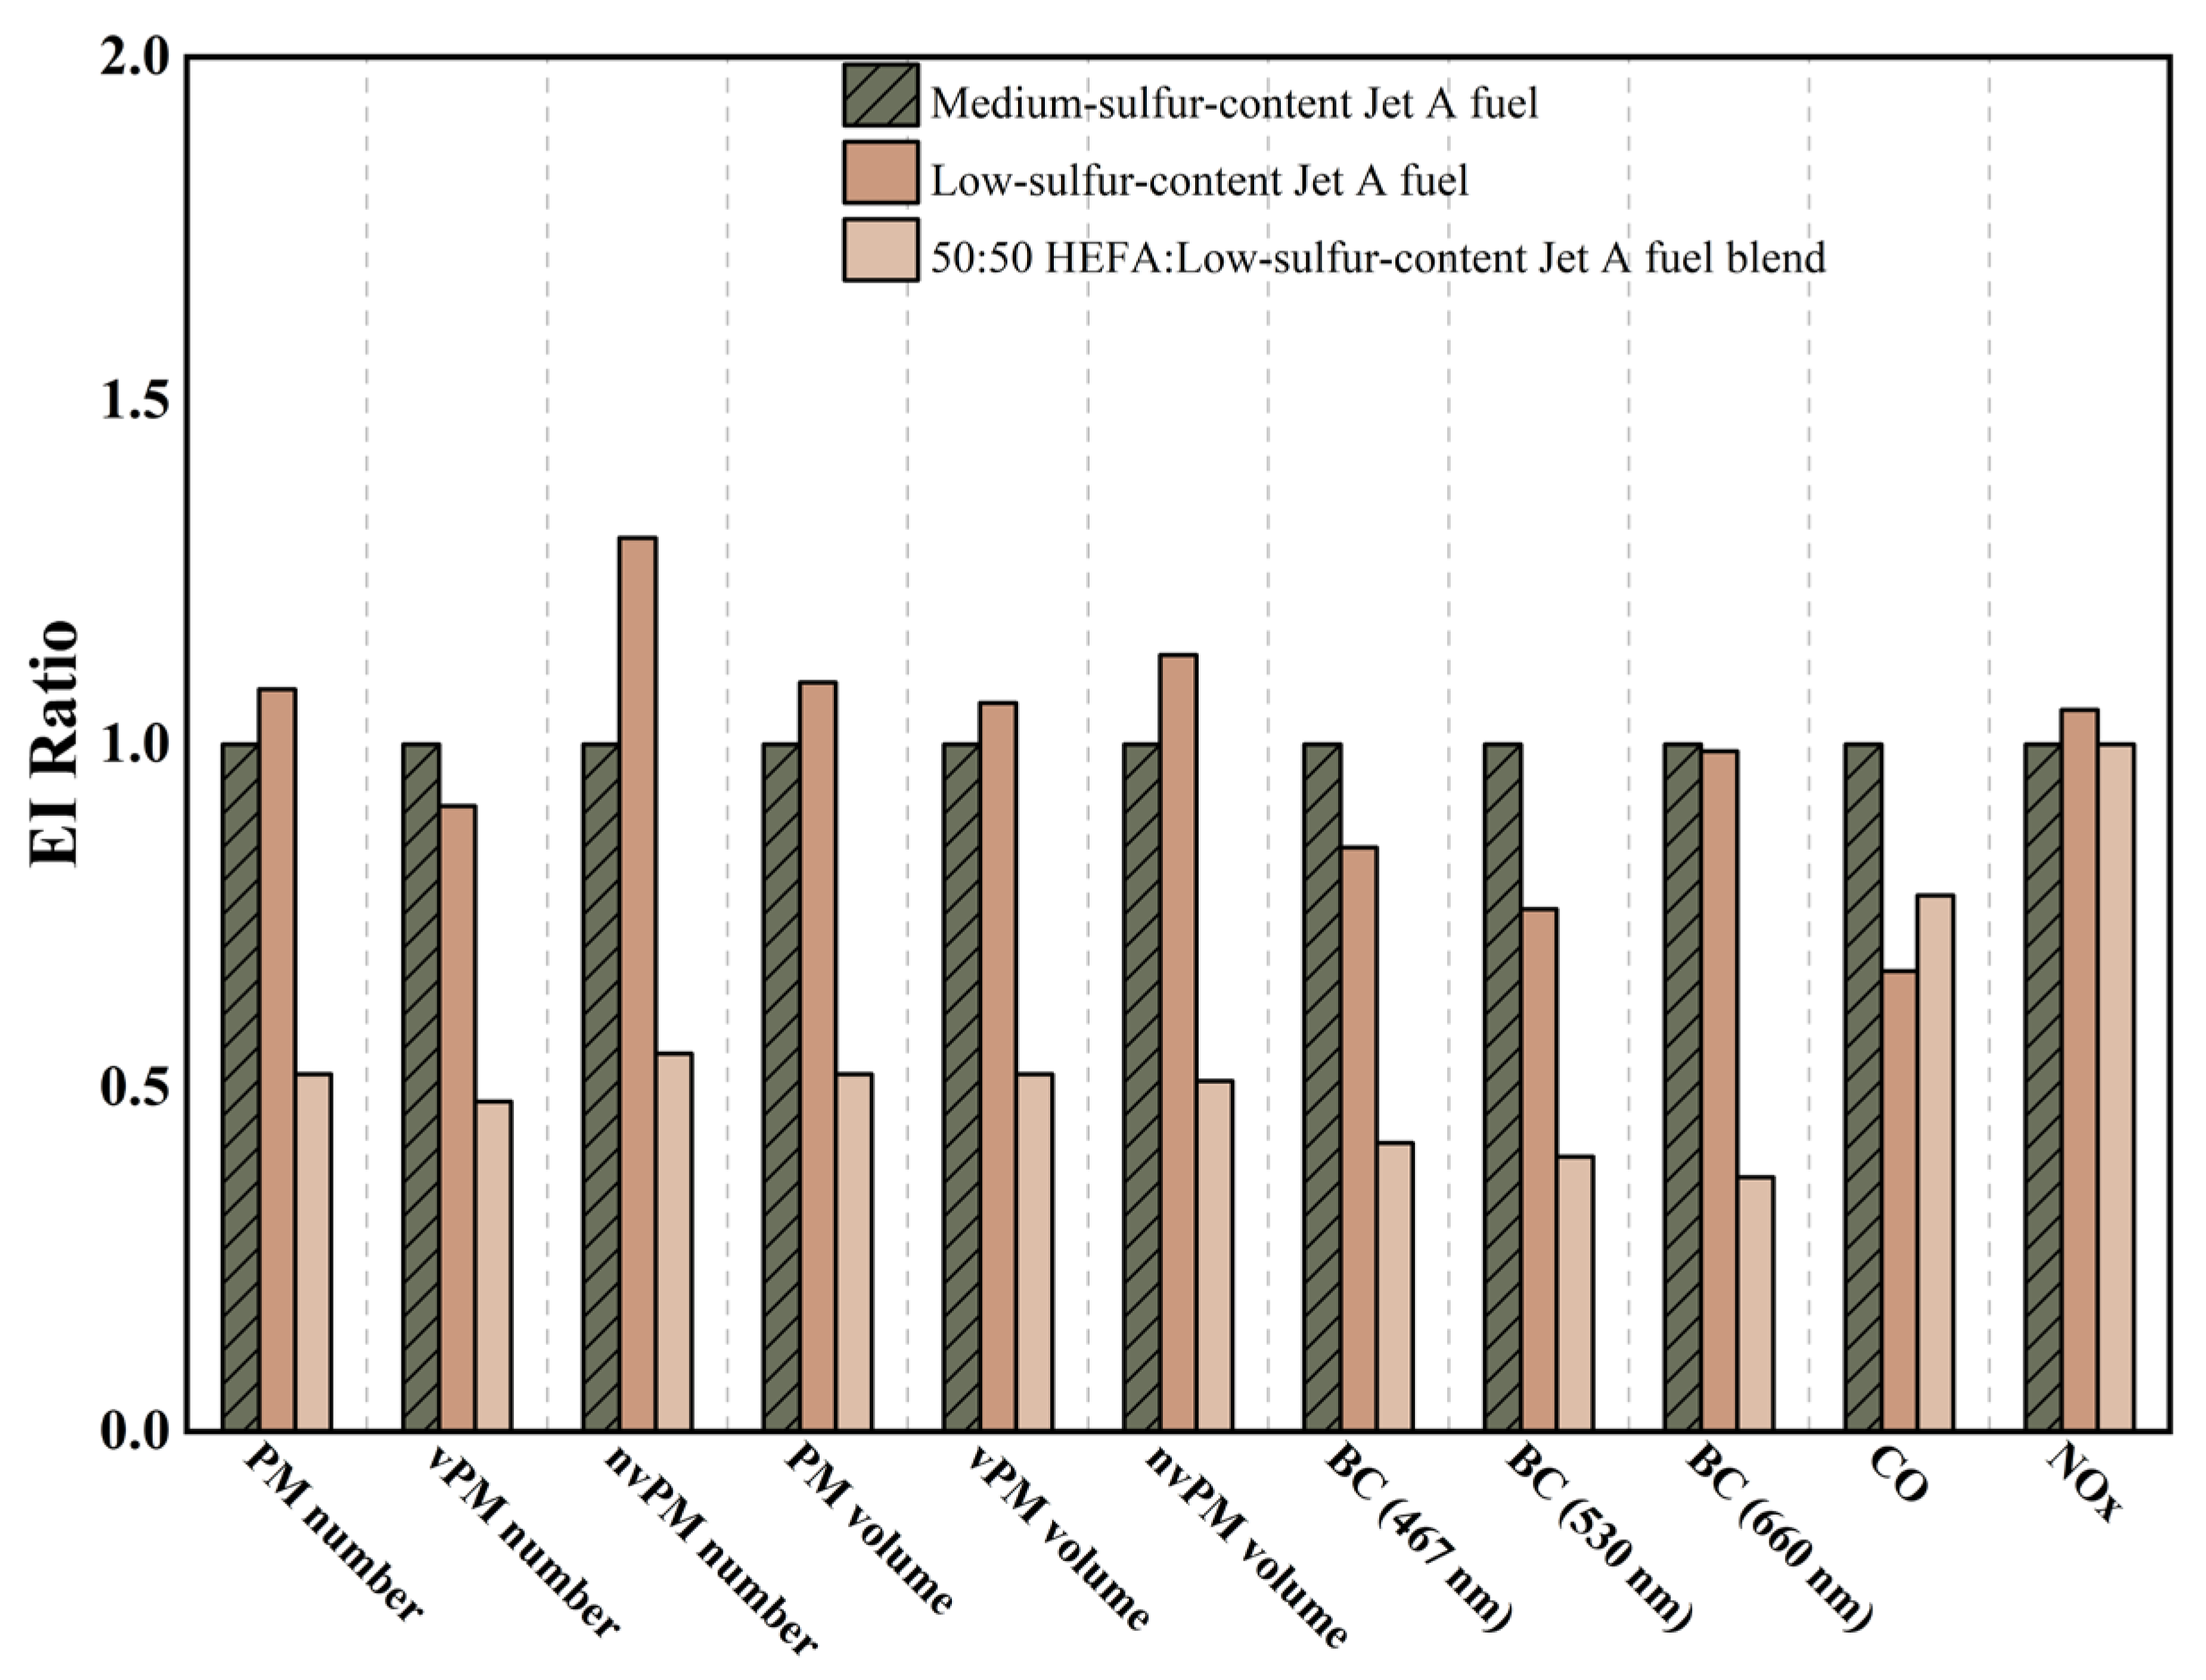
Disclaimer/Publisher’s Note: The statements, opinions and data contained in all publications are solely those of the individual author(s) and contributor(s) and not of MDPI and/or the editor(s). MDPI and/or the editor(s) disclaim responsibility for any injury to people or property resulting from any ideas, methods, instructions or products referred to in the content. |
© 2024 by the authors. Licensee MDPI, Basel, Switzerland. This article is an open access article distributed under the terms and conditions of the Creative Commons Attribution (CC BY) license (https://creativecommons.org/licenses/by/4.0/).