
Wireless Data Acquisition System with Feedback Function

Abstract
:1. Introduction
- -
- Due to the timely prevention of the consequences of emergency conditions by organizing an automatic feedback response of the data collection system to the incorrect operation of the standard equipment of the SWPP;
- -
- By automatically switching, using feedback, part of the SWPP loads from power from the public electrical network to power from natural energy when there is an excess of it and vice versa when there is a lack of it;
- -
- By identifying abnormal and ineffective operating modes of equipment by analyzing the results of monitoring the main parameters of the functioning of the SWPP.
- (1)
- Wired channels, which have two subcategories:
- (2)
- (3)
2. Materials and Methods
2.1. Analysis of Existing Concepts for Building a Wireless DAS for Low-Power GEPPs
2.2. Improved DAS Design Concept for Low-Power GEPPs
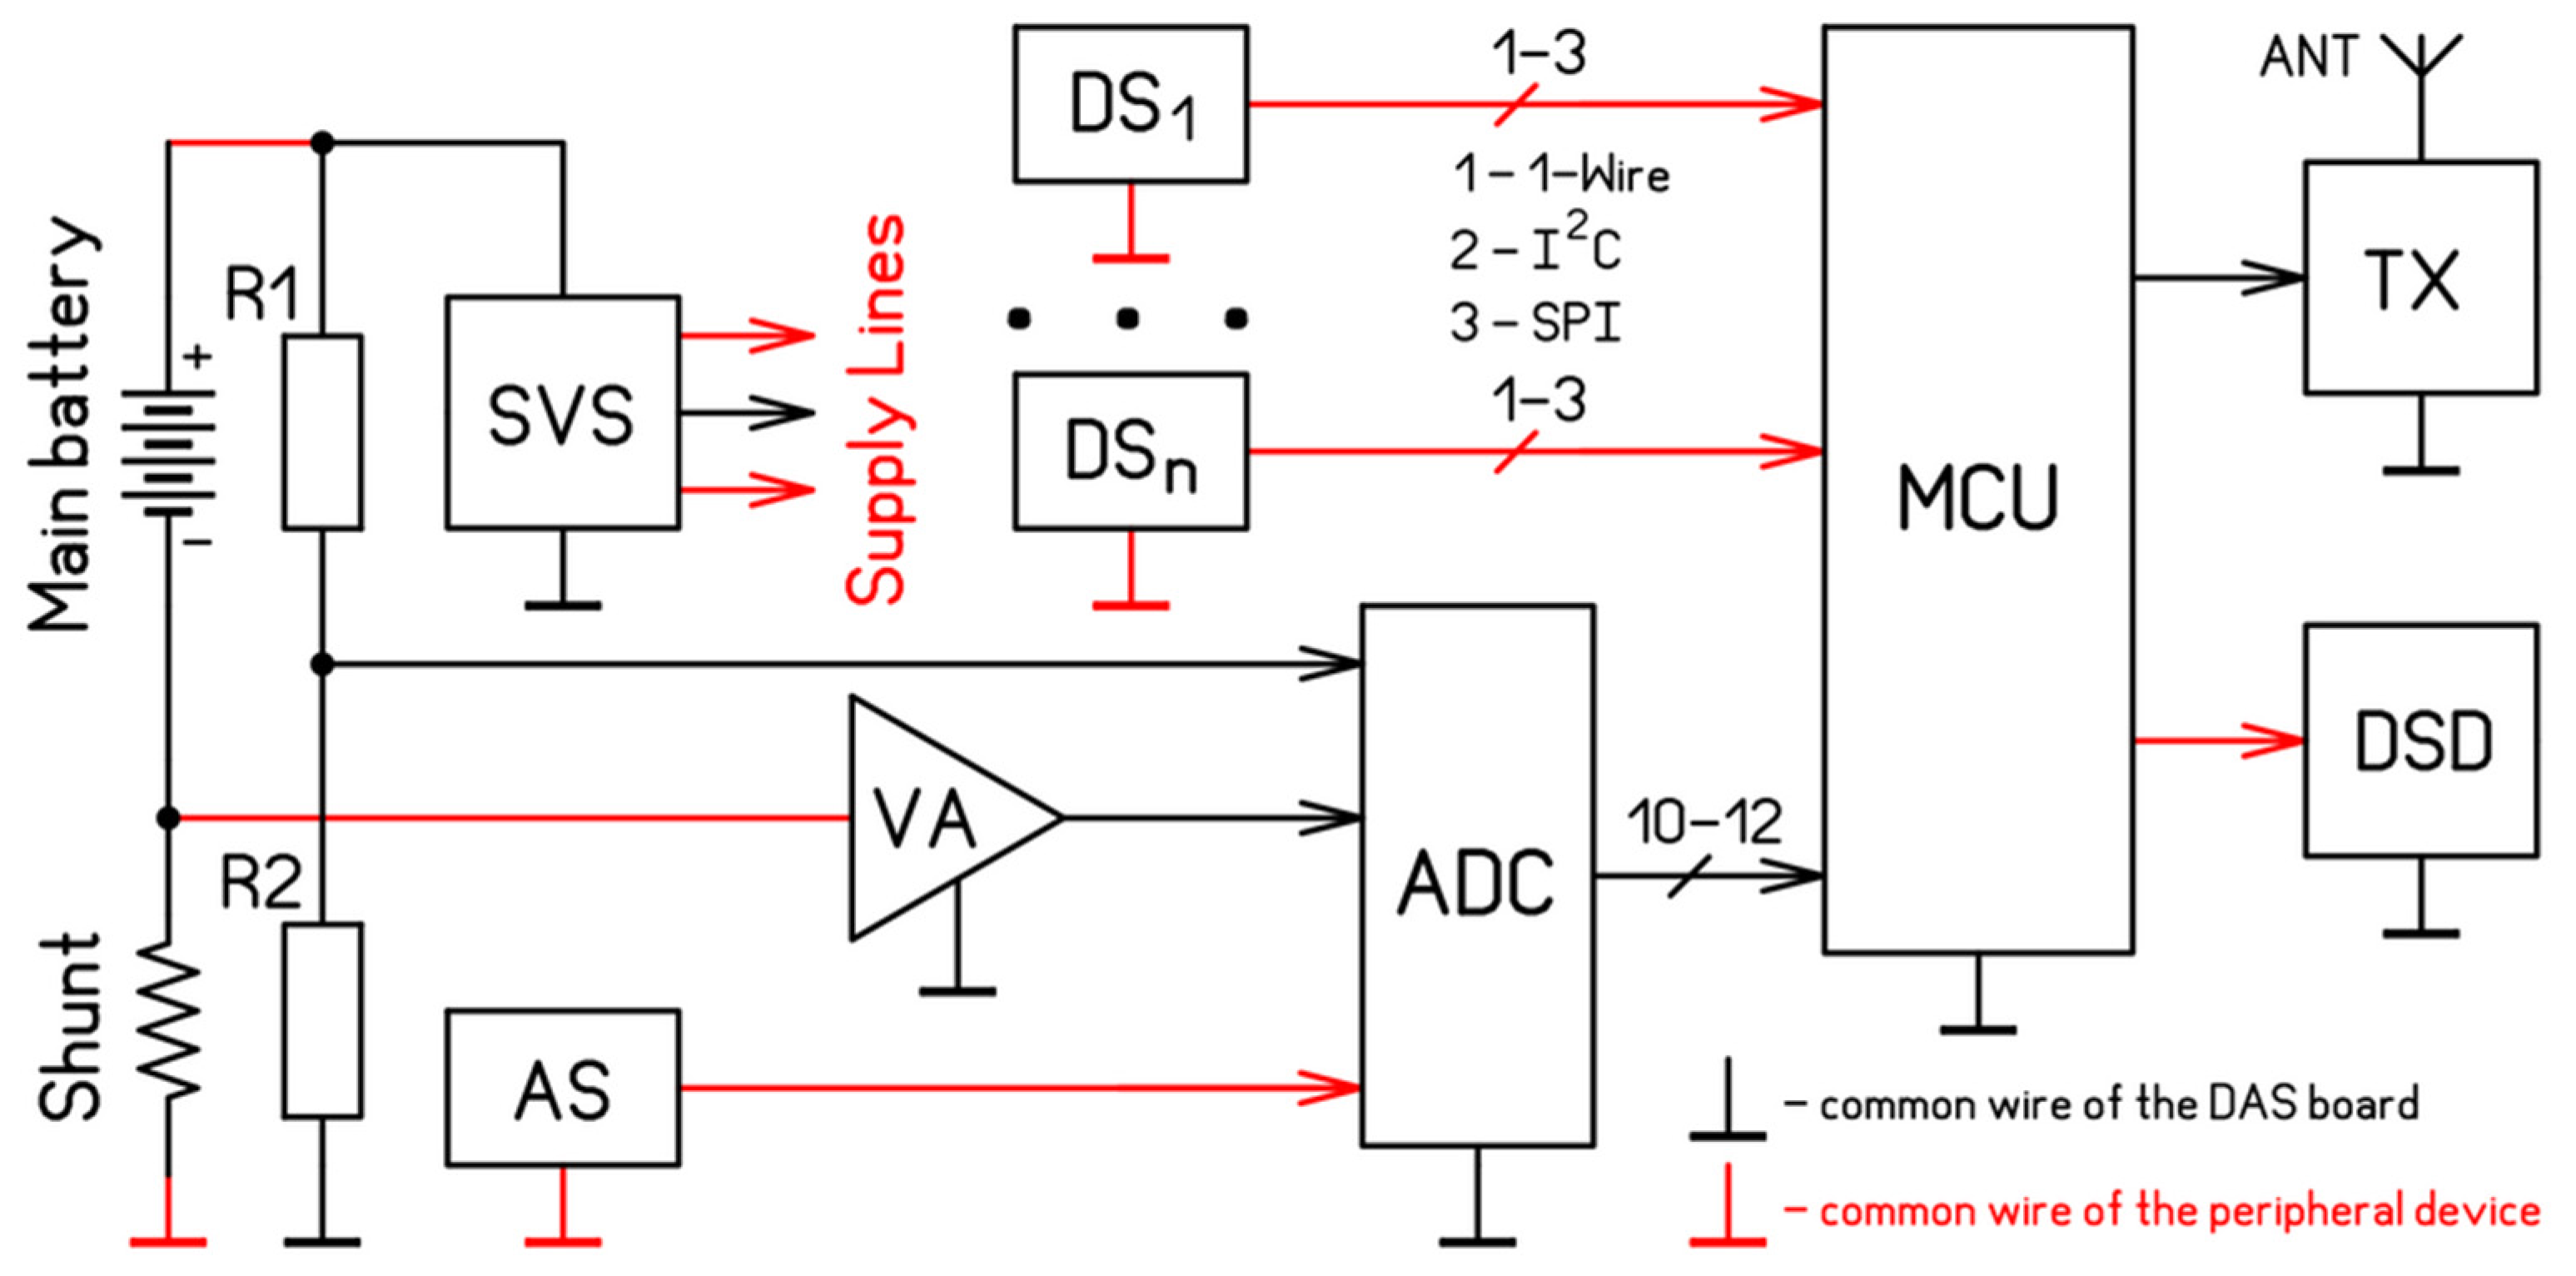
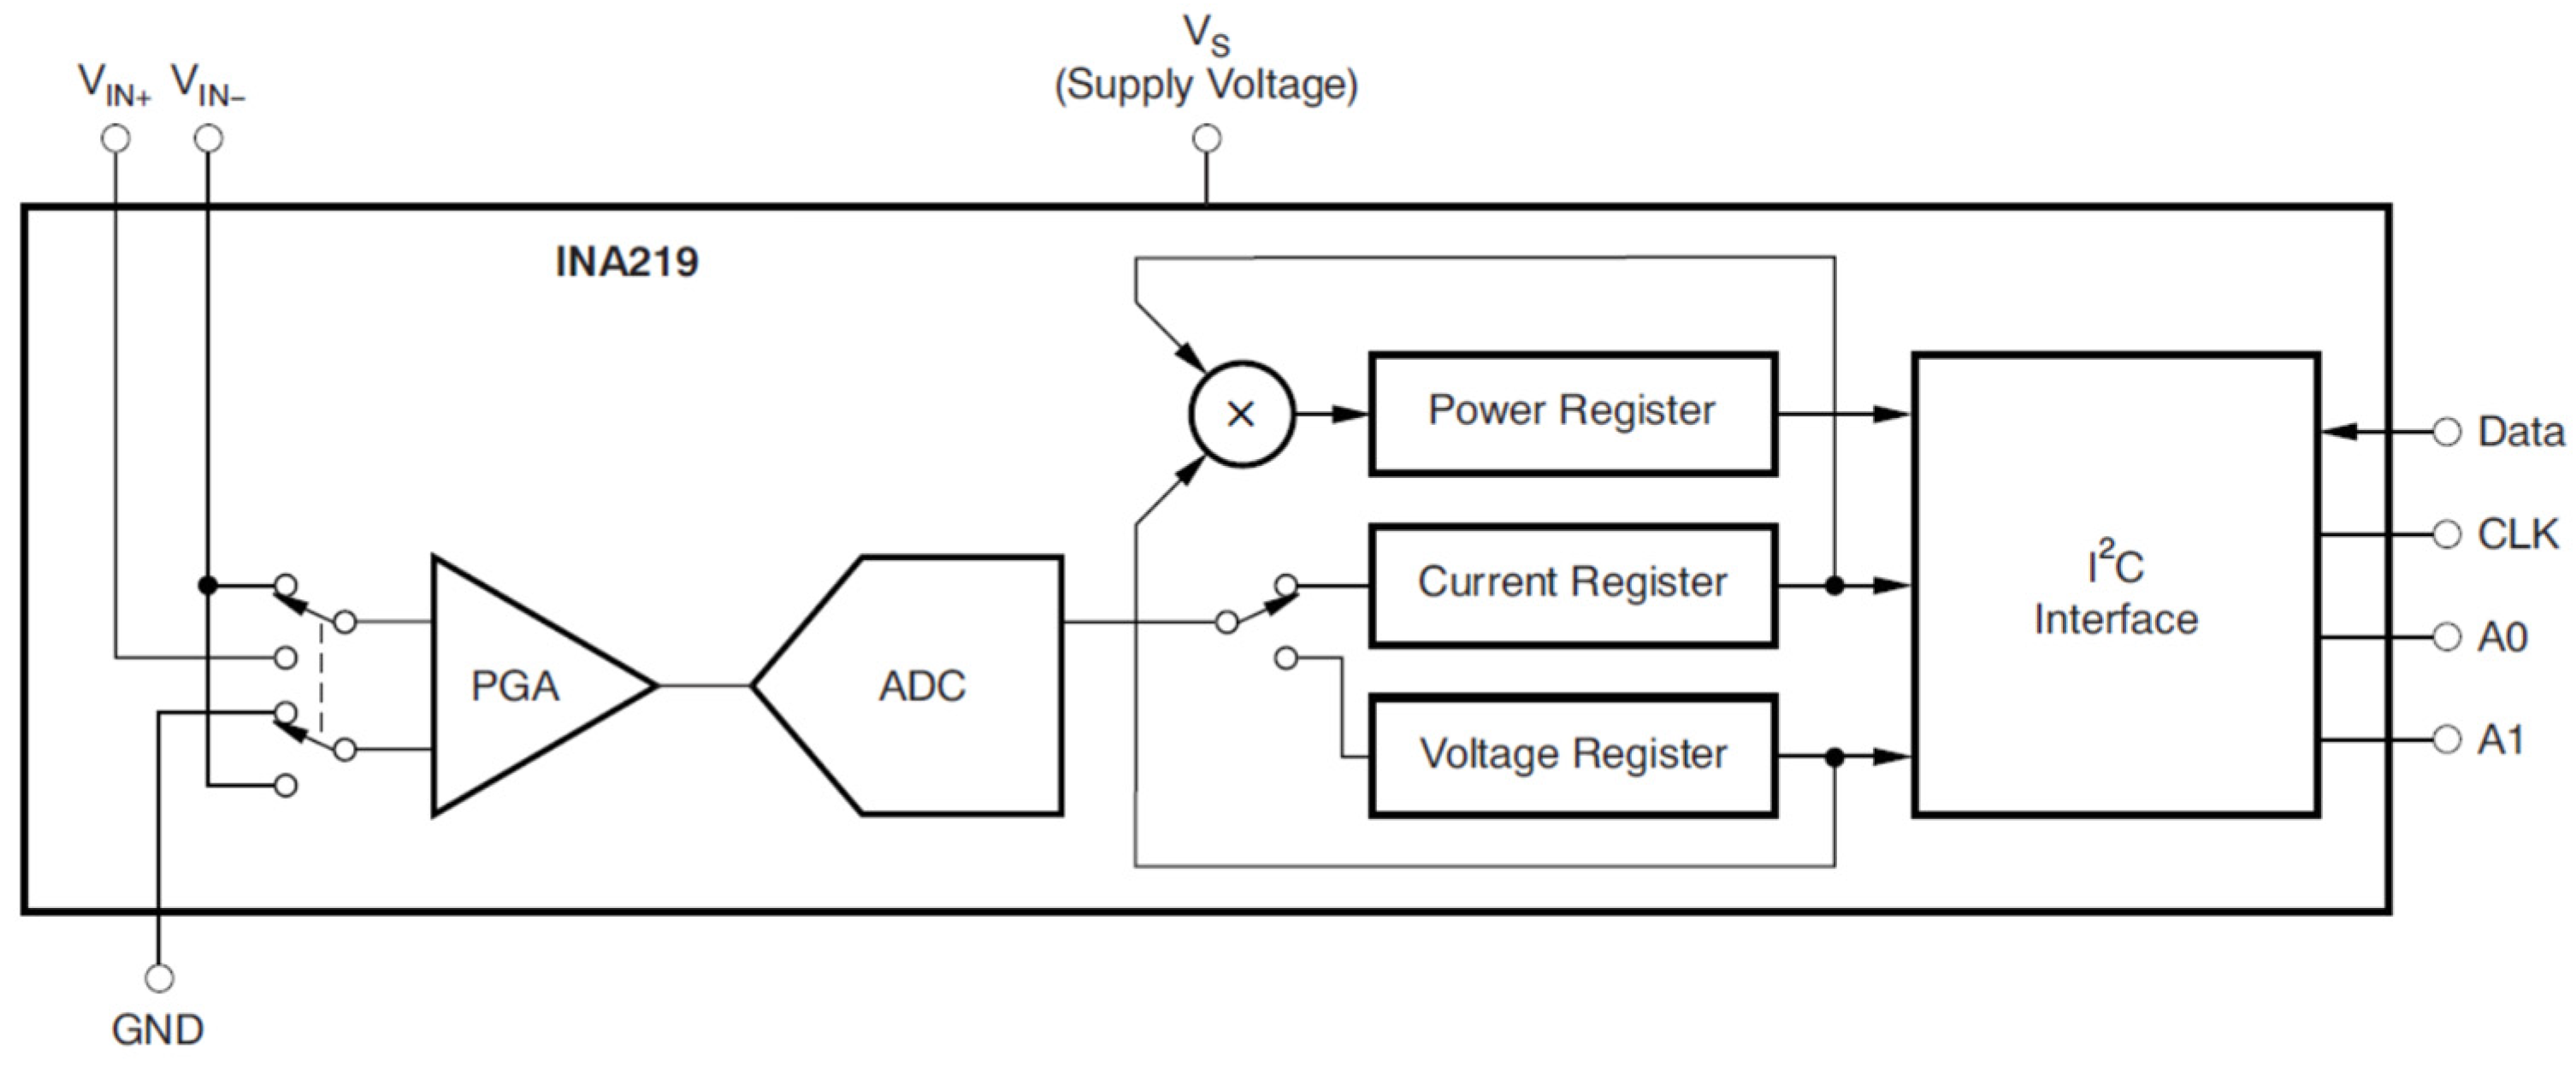
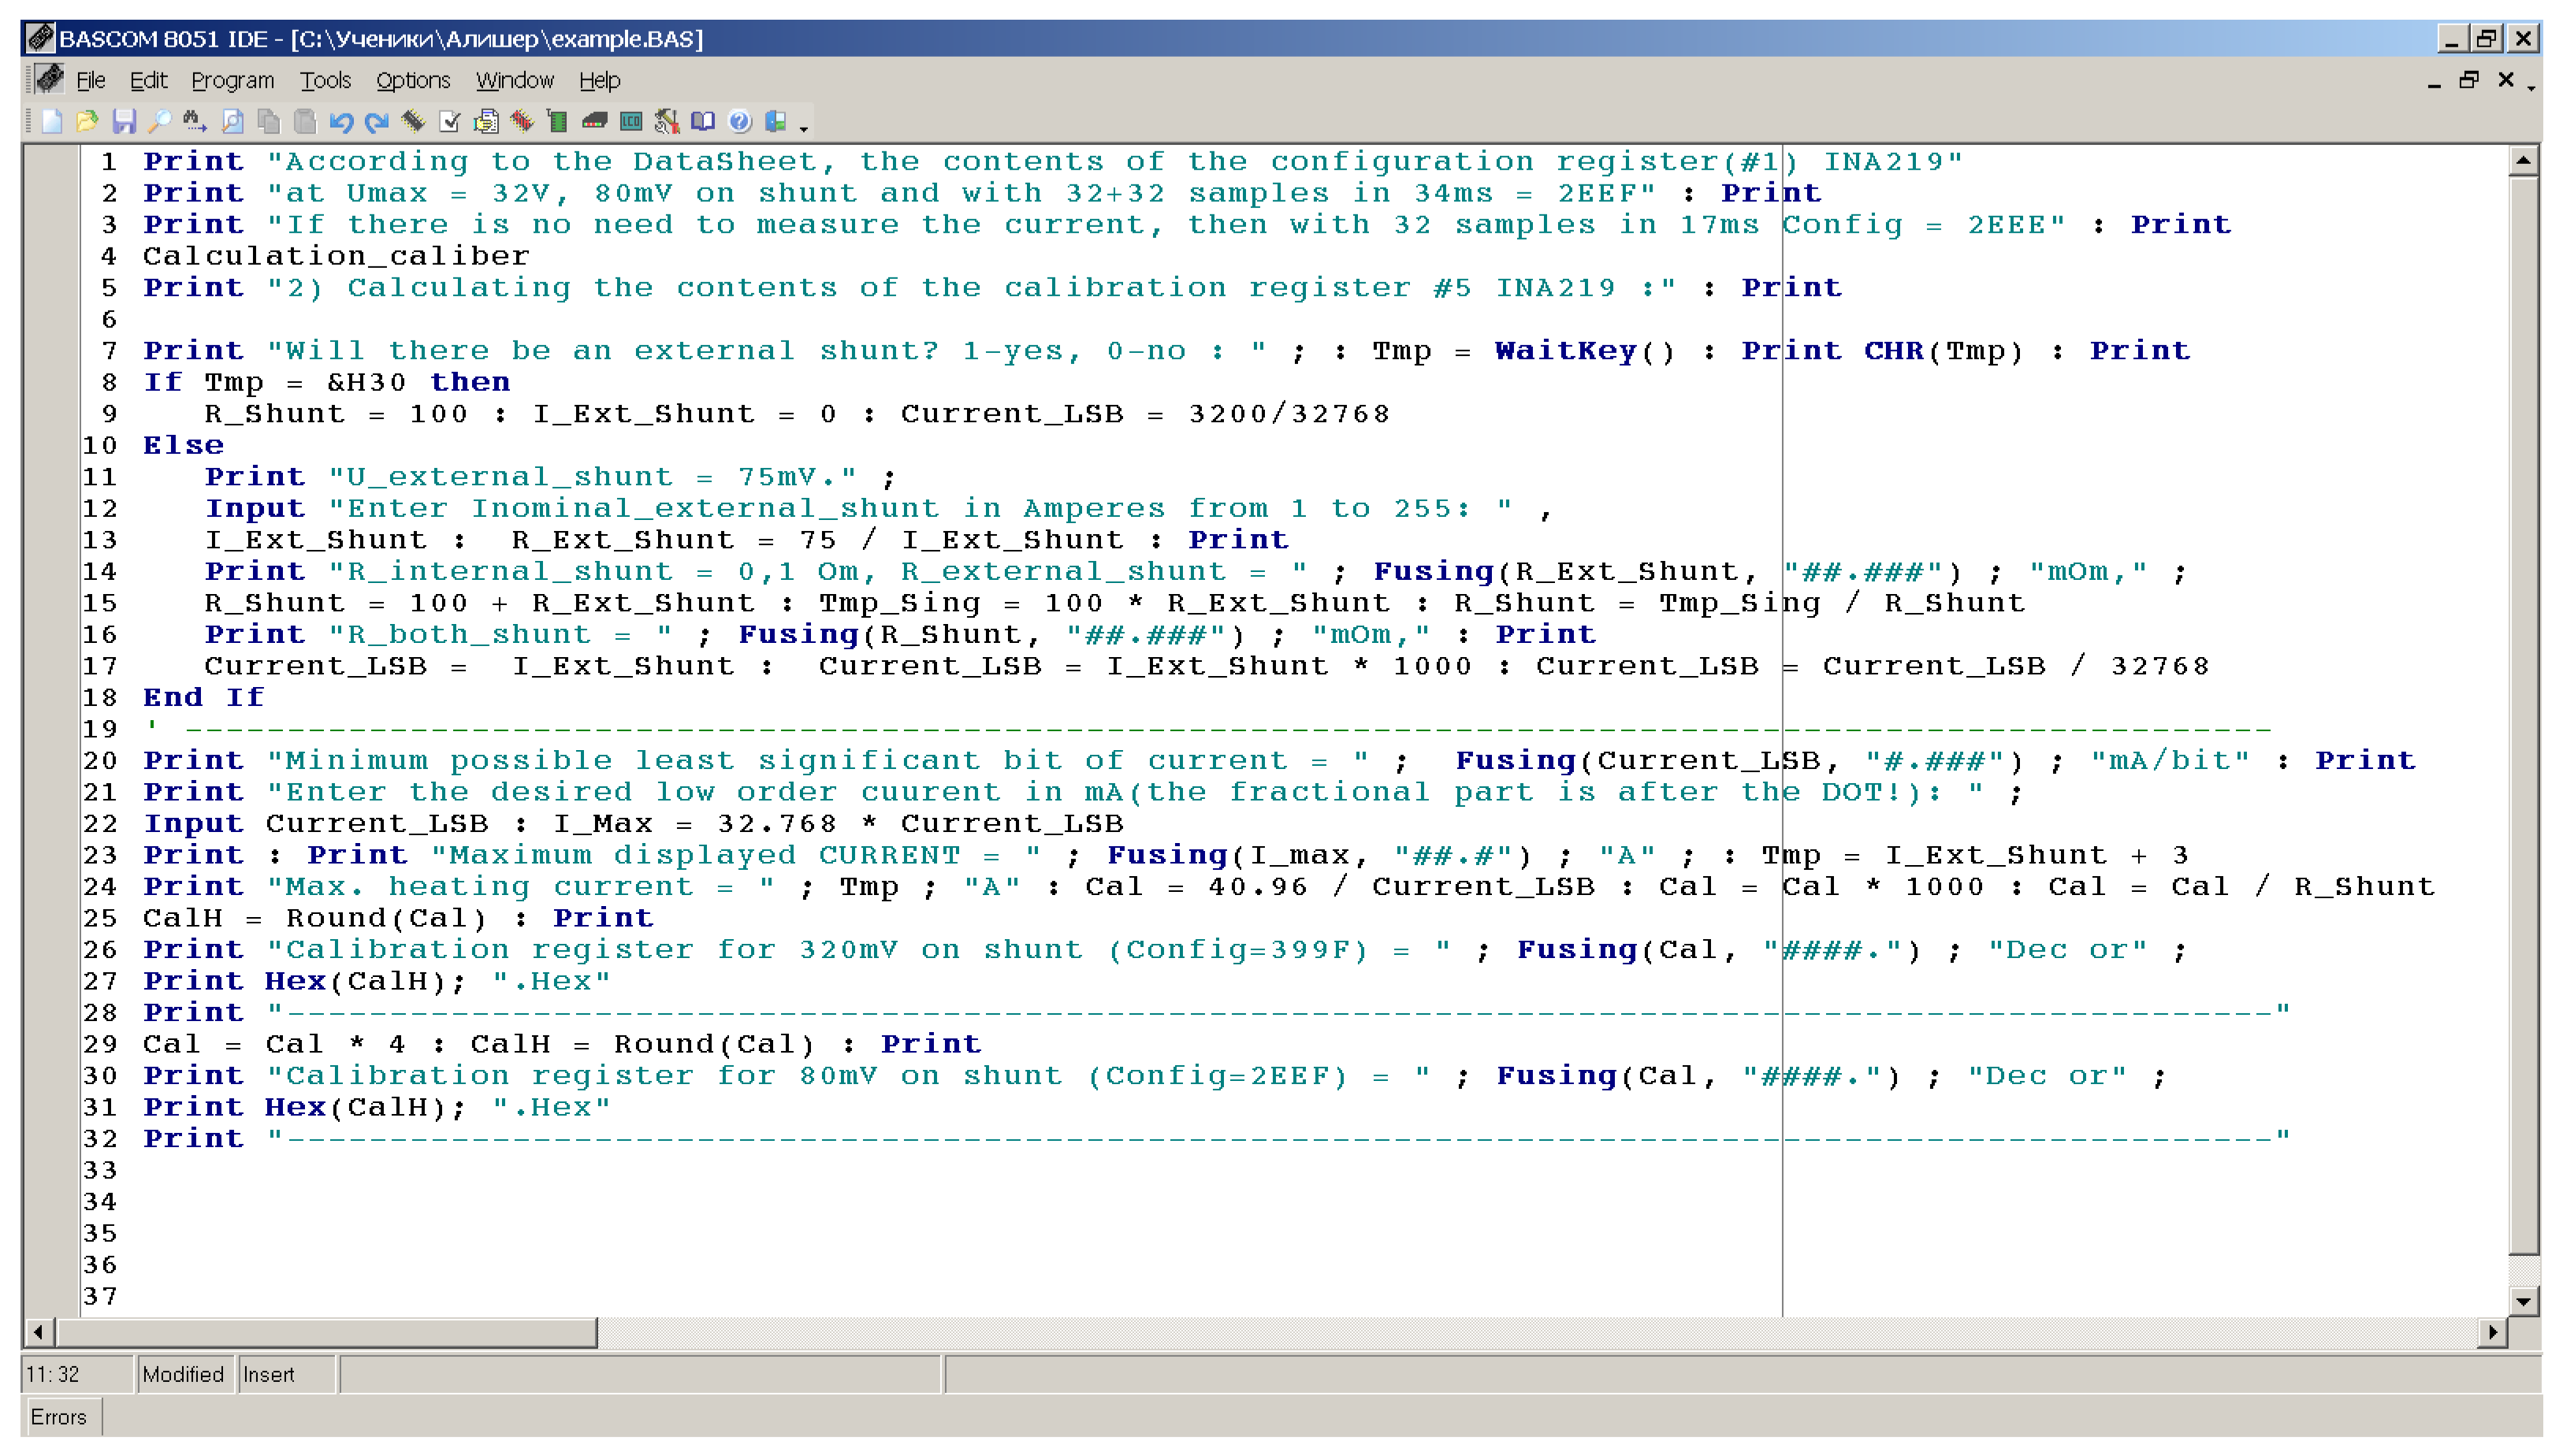
2.3. Obtaining Initial Information about Current and Voltage
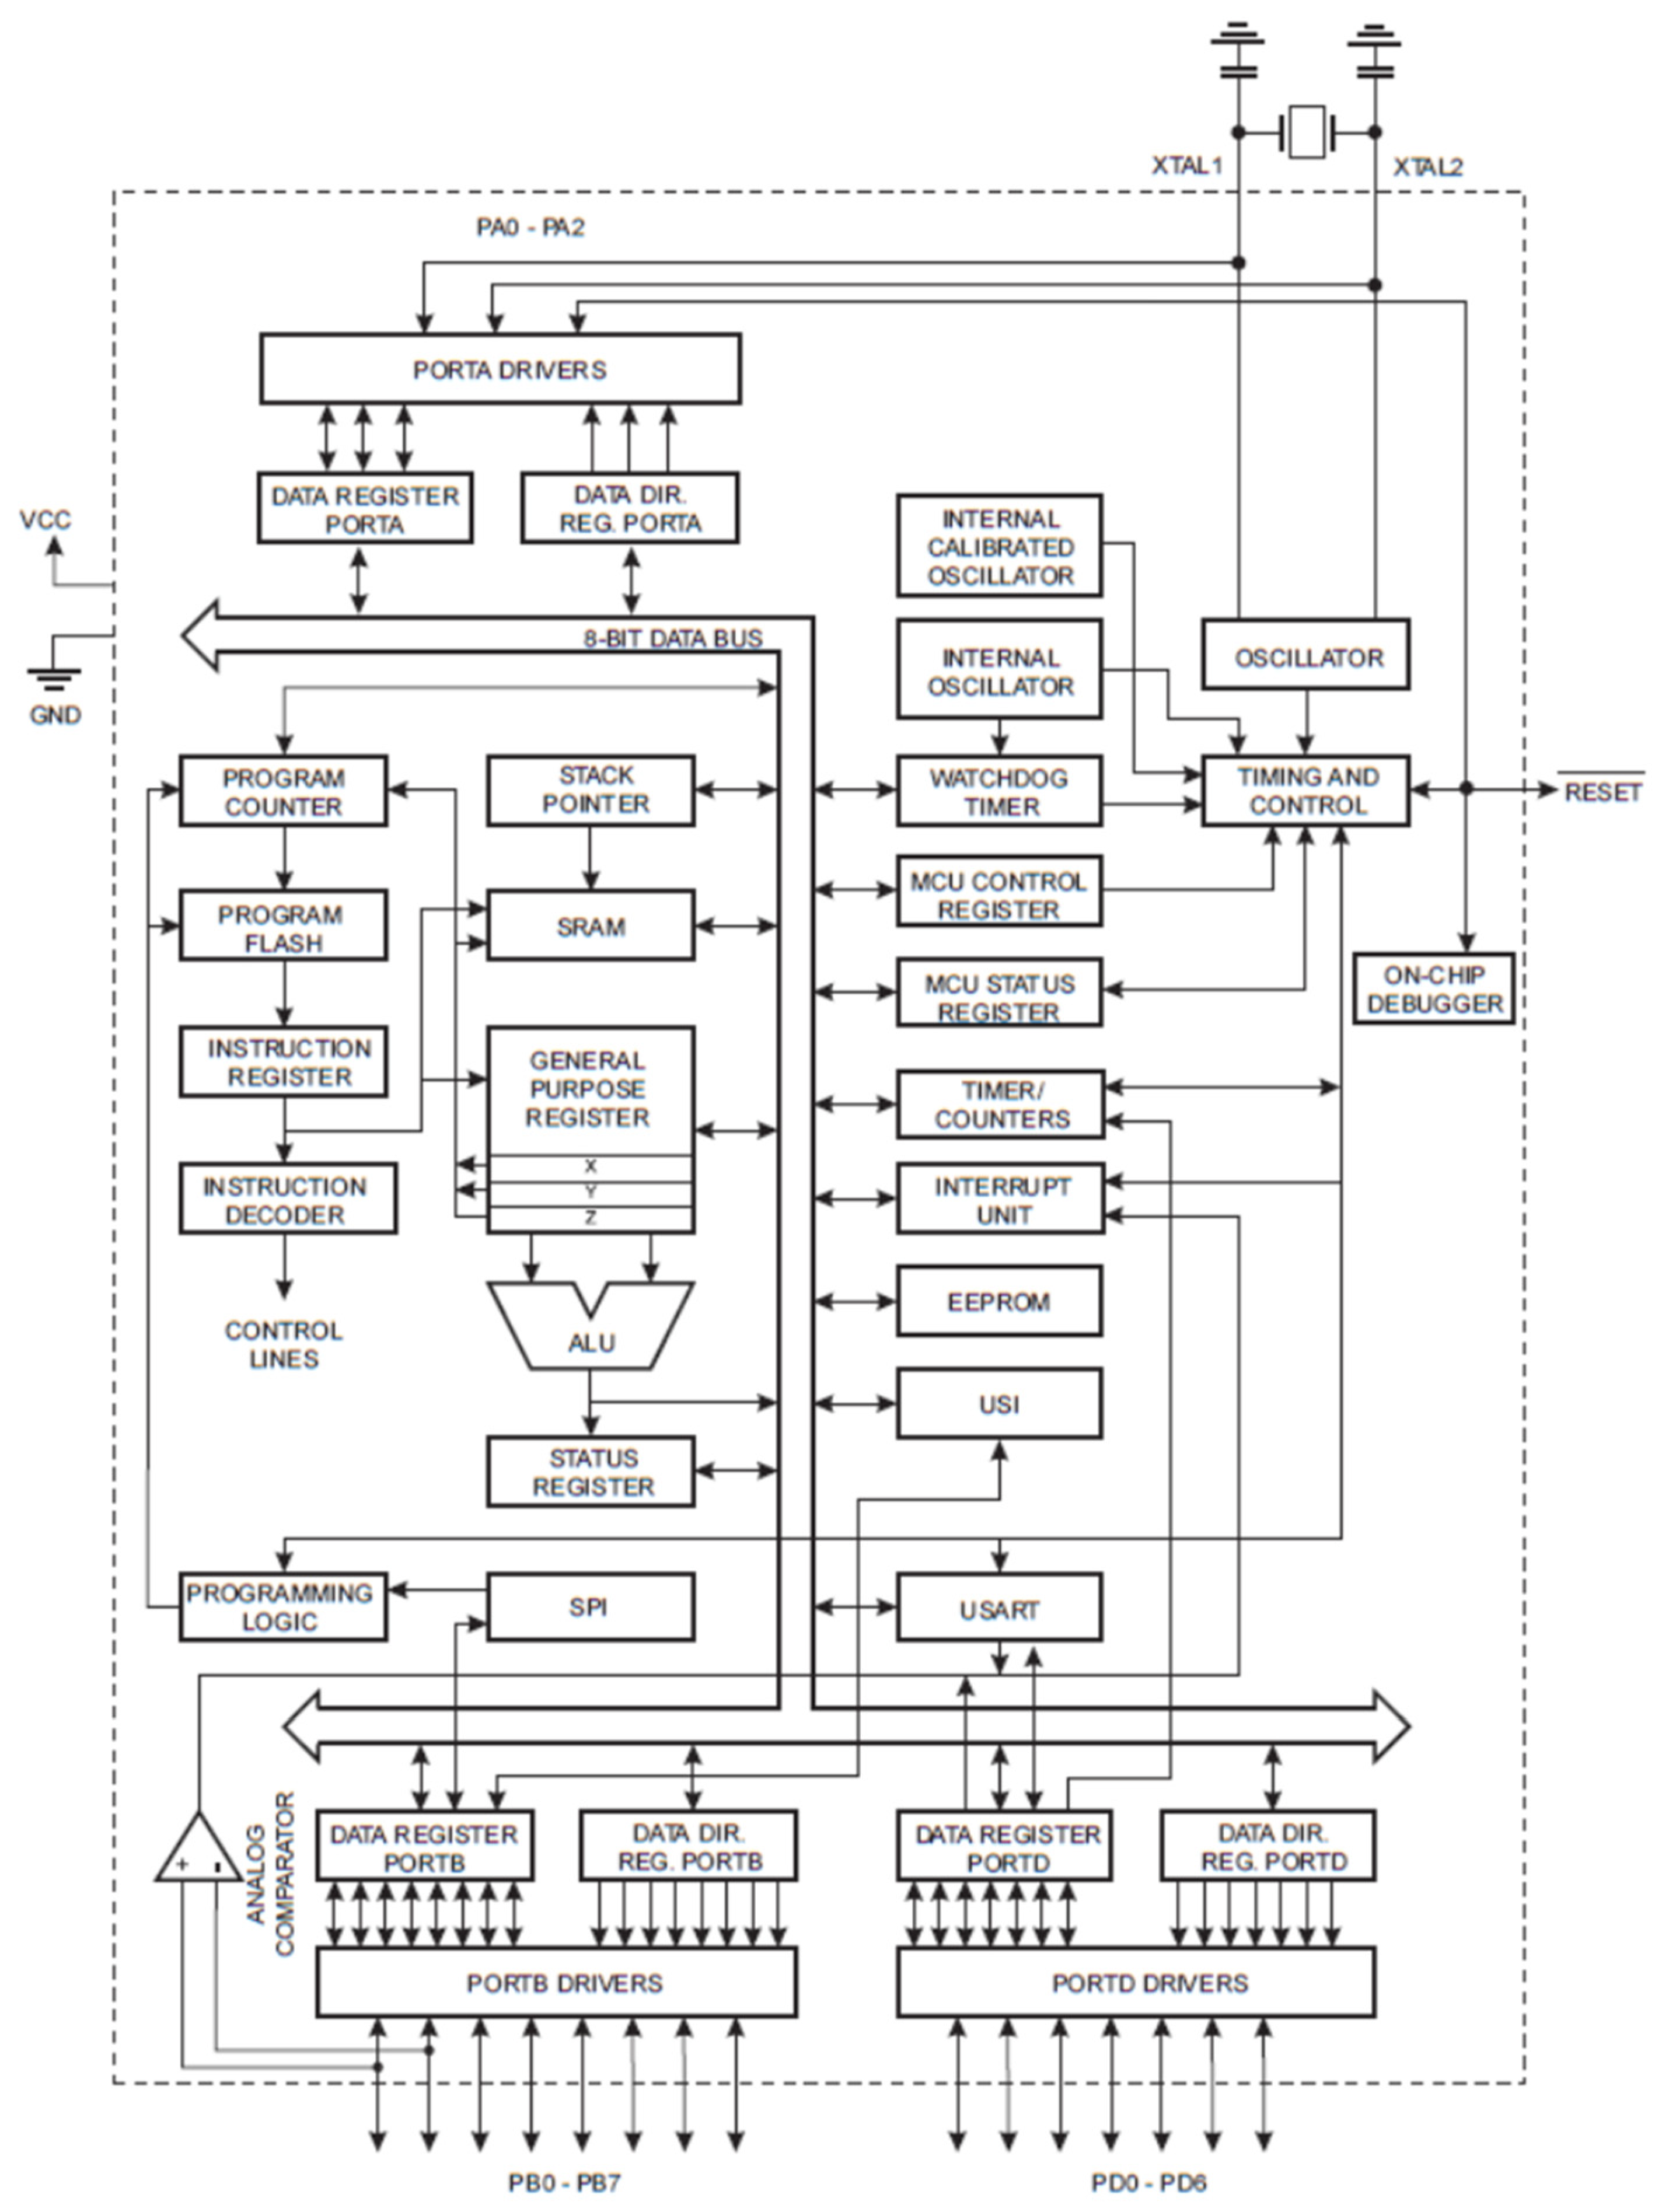
2.4. Selecting Components for a Smart Wireless Sensor
2.5. Description of the Developed Smart Wireless Sensor
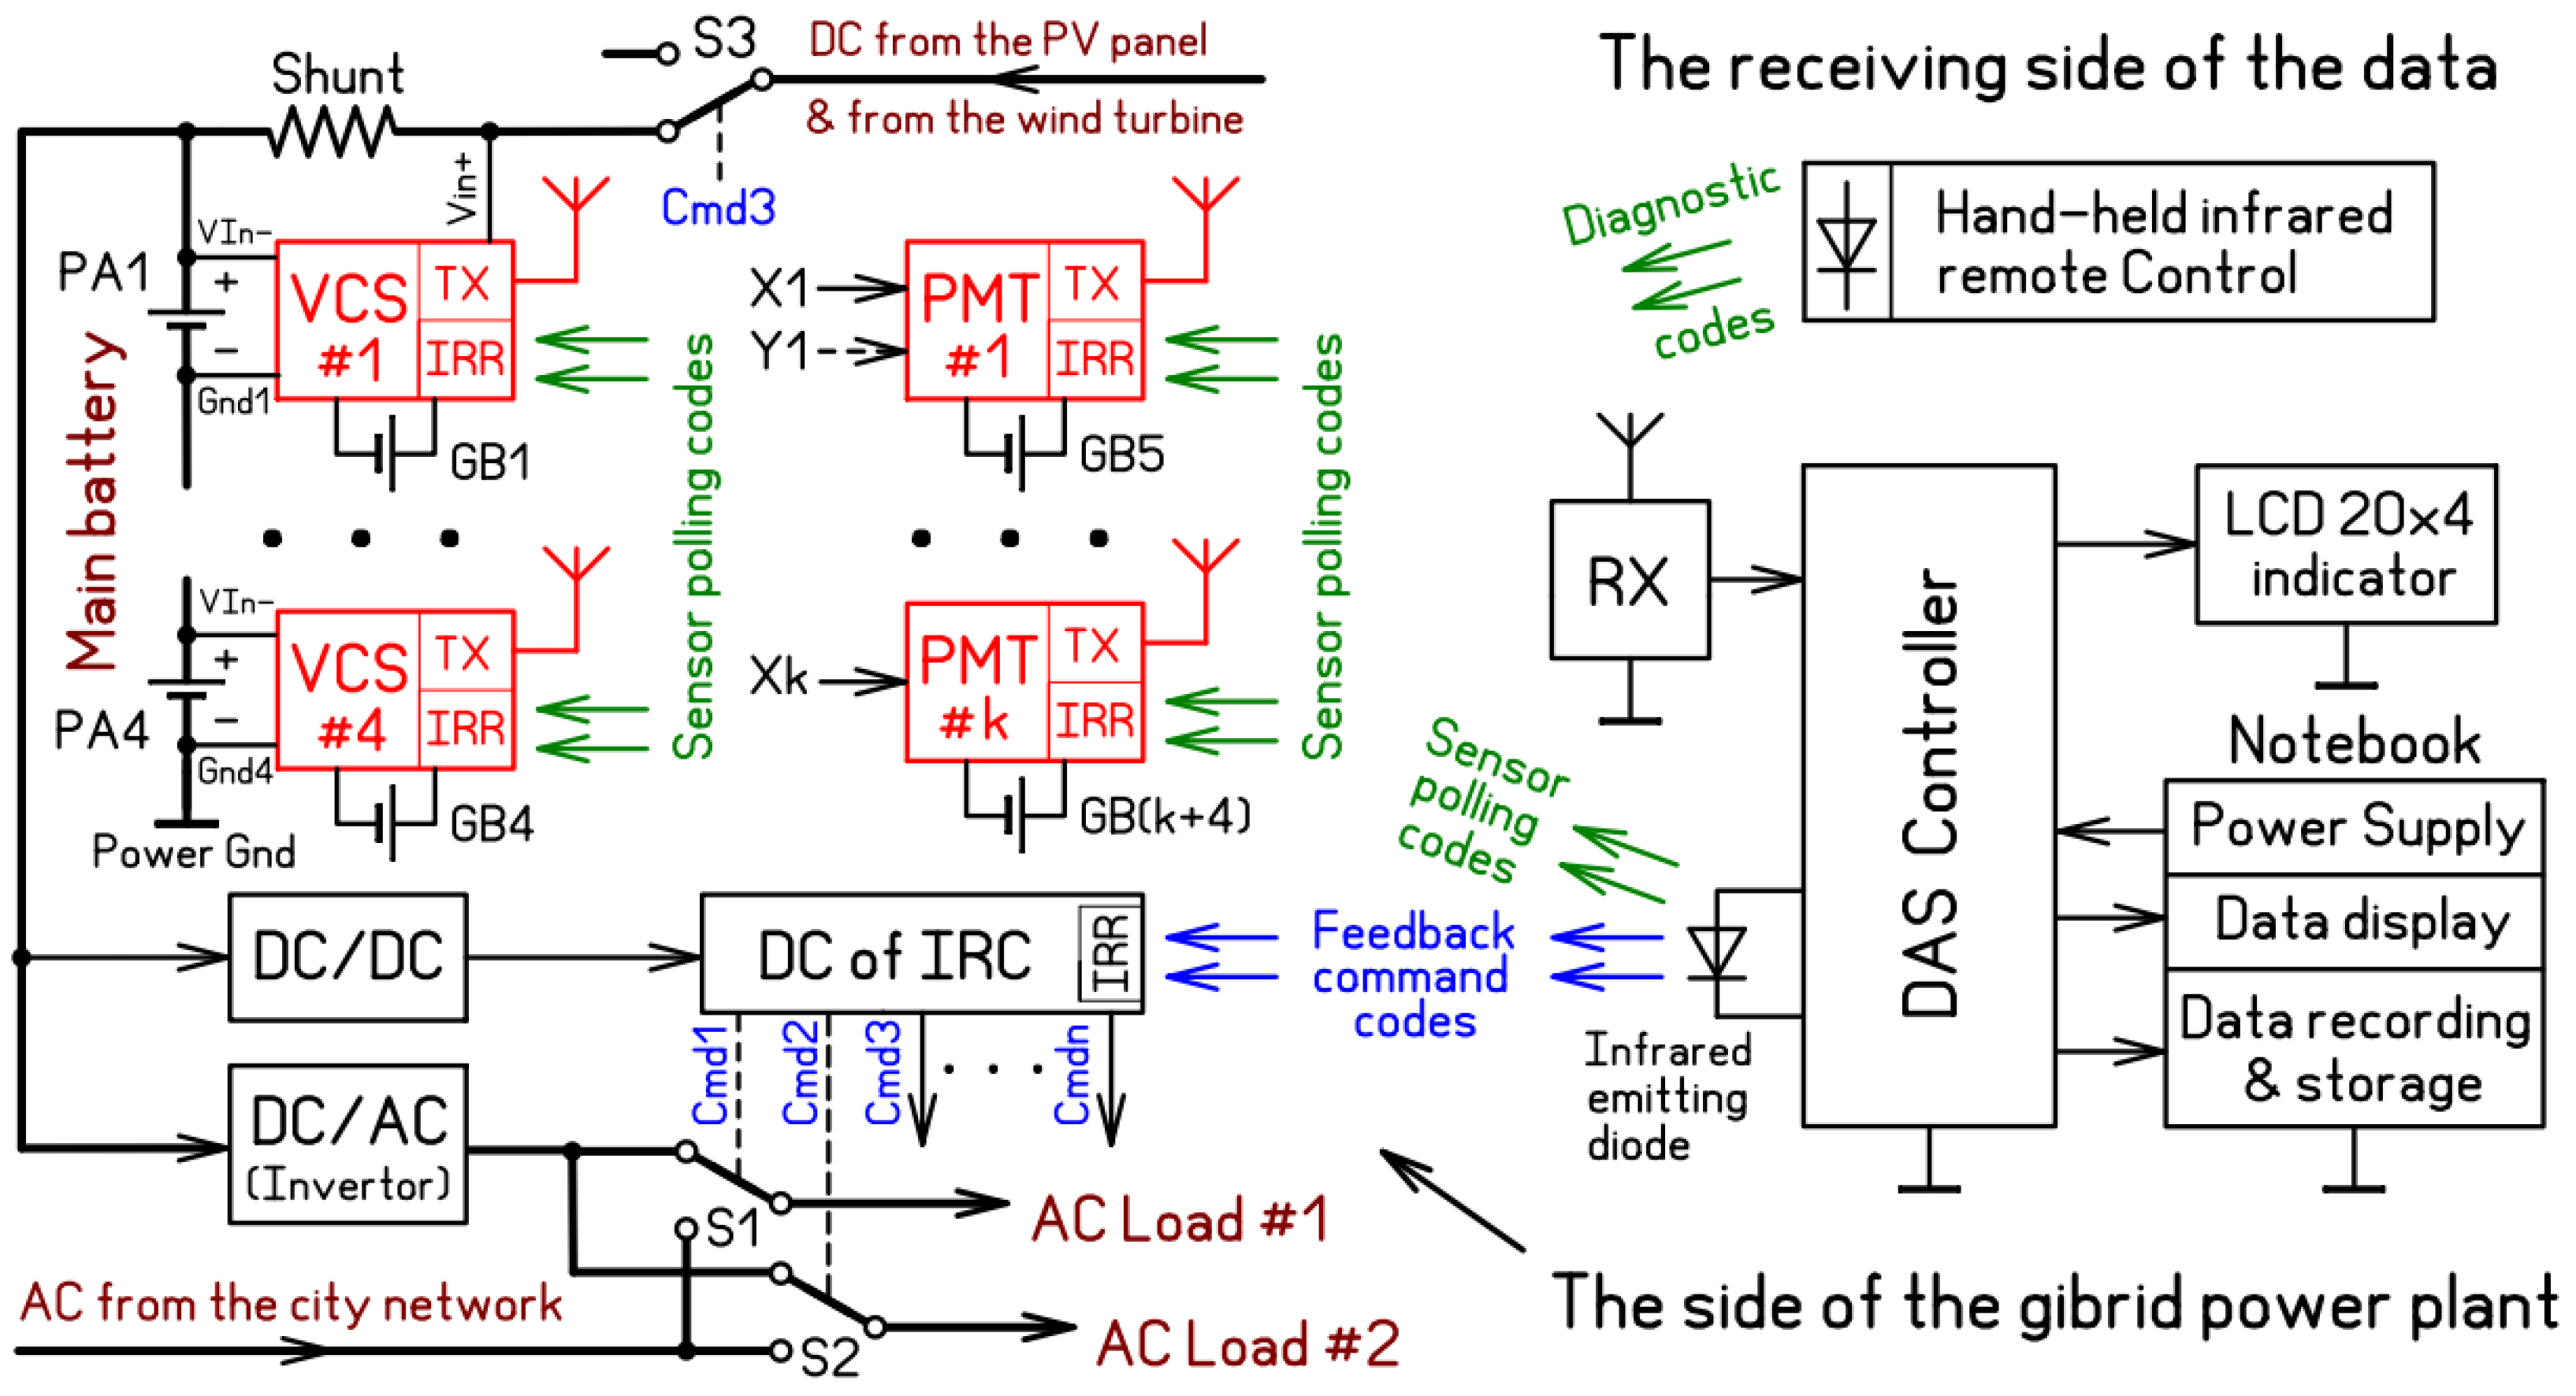
2.6. Description of the Receiving Part of the Data Acquisition System
3. Results and Discussion
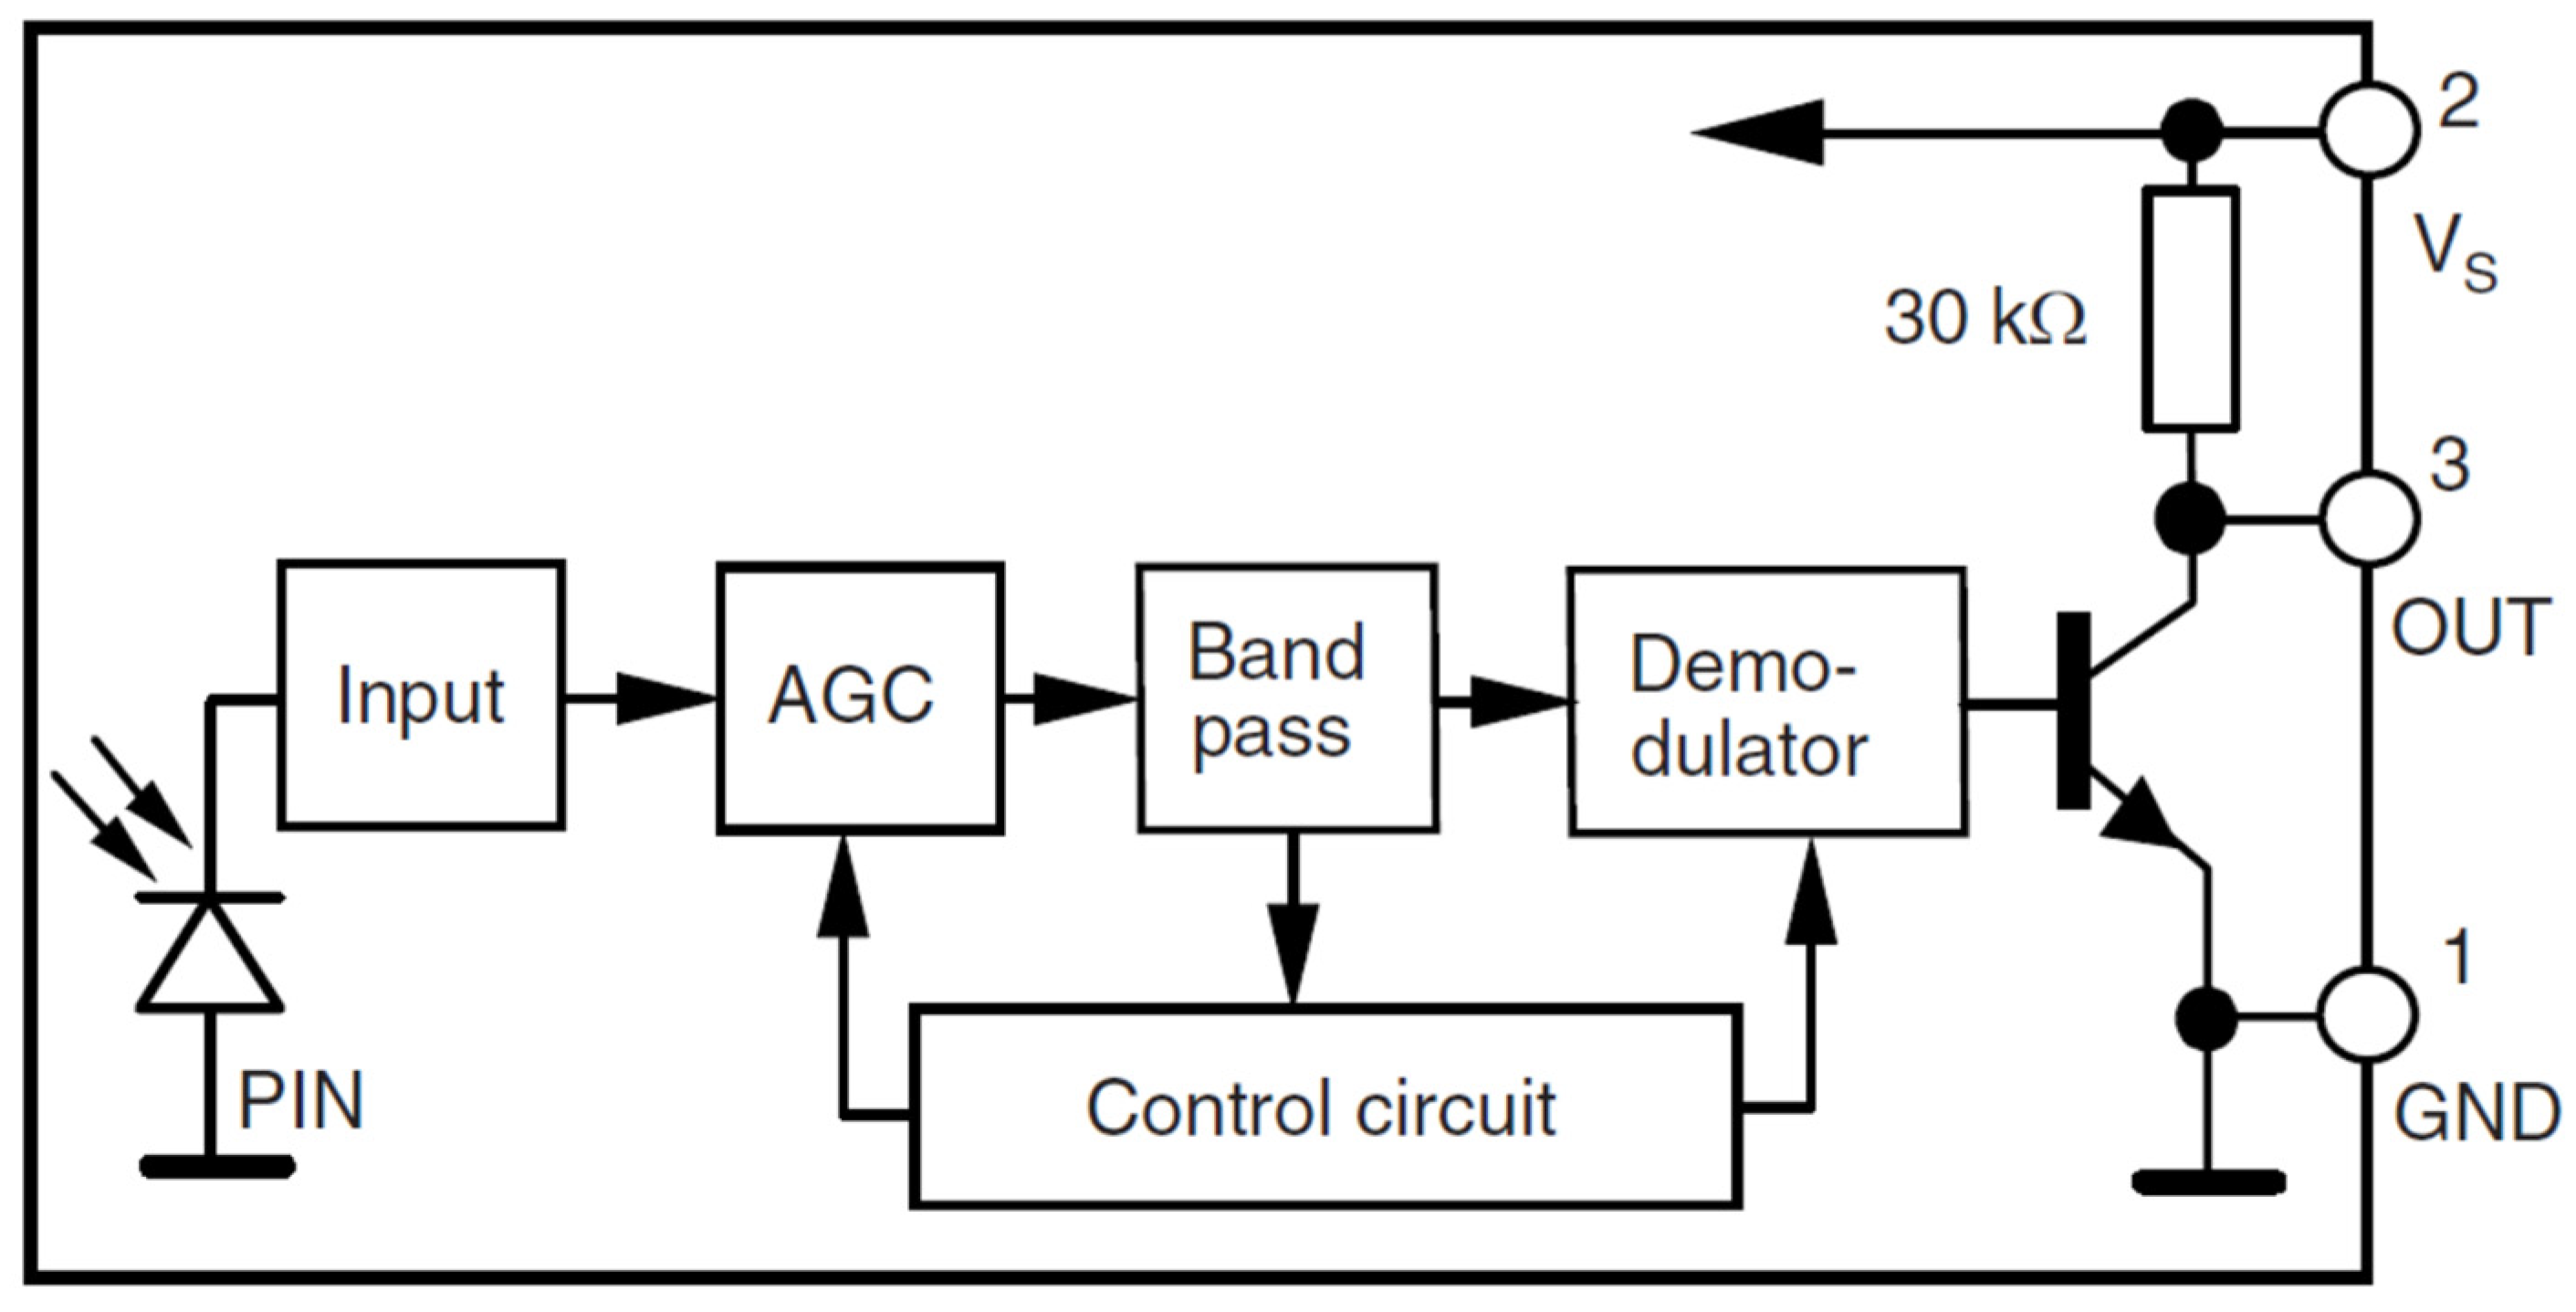
- The use of an infrared communication channel in the described DAS in addition to the radio channel makes it possible not only to organize a feedback channel with SWPP equipment protected from outside interference, but also to implement on this basis backup protection of SWPP equipment from damage and abnormal operating conditions (PDAOCs). In the future, this will make it possible to transform the data collection system into a full-fledged automatic control system (ACS) for the operation of the SWPP with relay protection functions for all of the main elements of the SWPP.
- The construction of sensors and other equipment based on mass-produced, widely available electronic components and modules facilitates the organization of their mass production.
- Powering the sensors from autonomous sources that are not galvanically connected to power circuits, as well as the wireless method of transmitting information, makes it possible to avoid a “web” of wires near the power circuits of the SWPP and thus minimizes their influence on the measuring circuits and recording equipment.
- The use of autonomous power supplies for sensors significantly expands the freedom of choice of their installation locations in the power circuits of the SWPP, which are at different potentials in relation to the common wire, which is especially important, for example, for series-connected SWPP batteries.
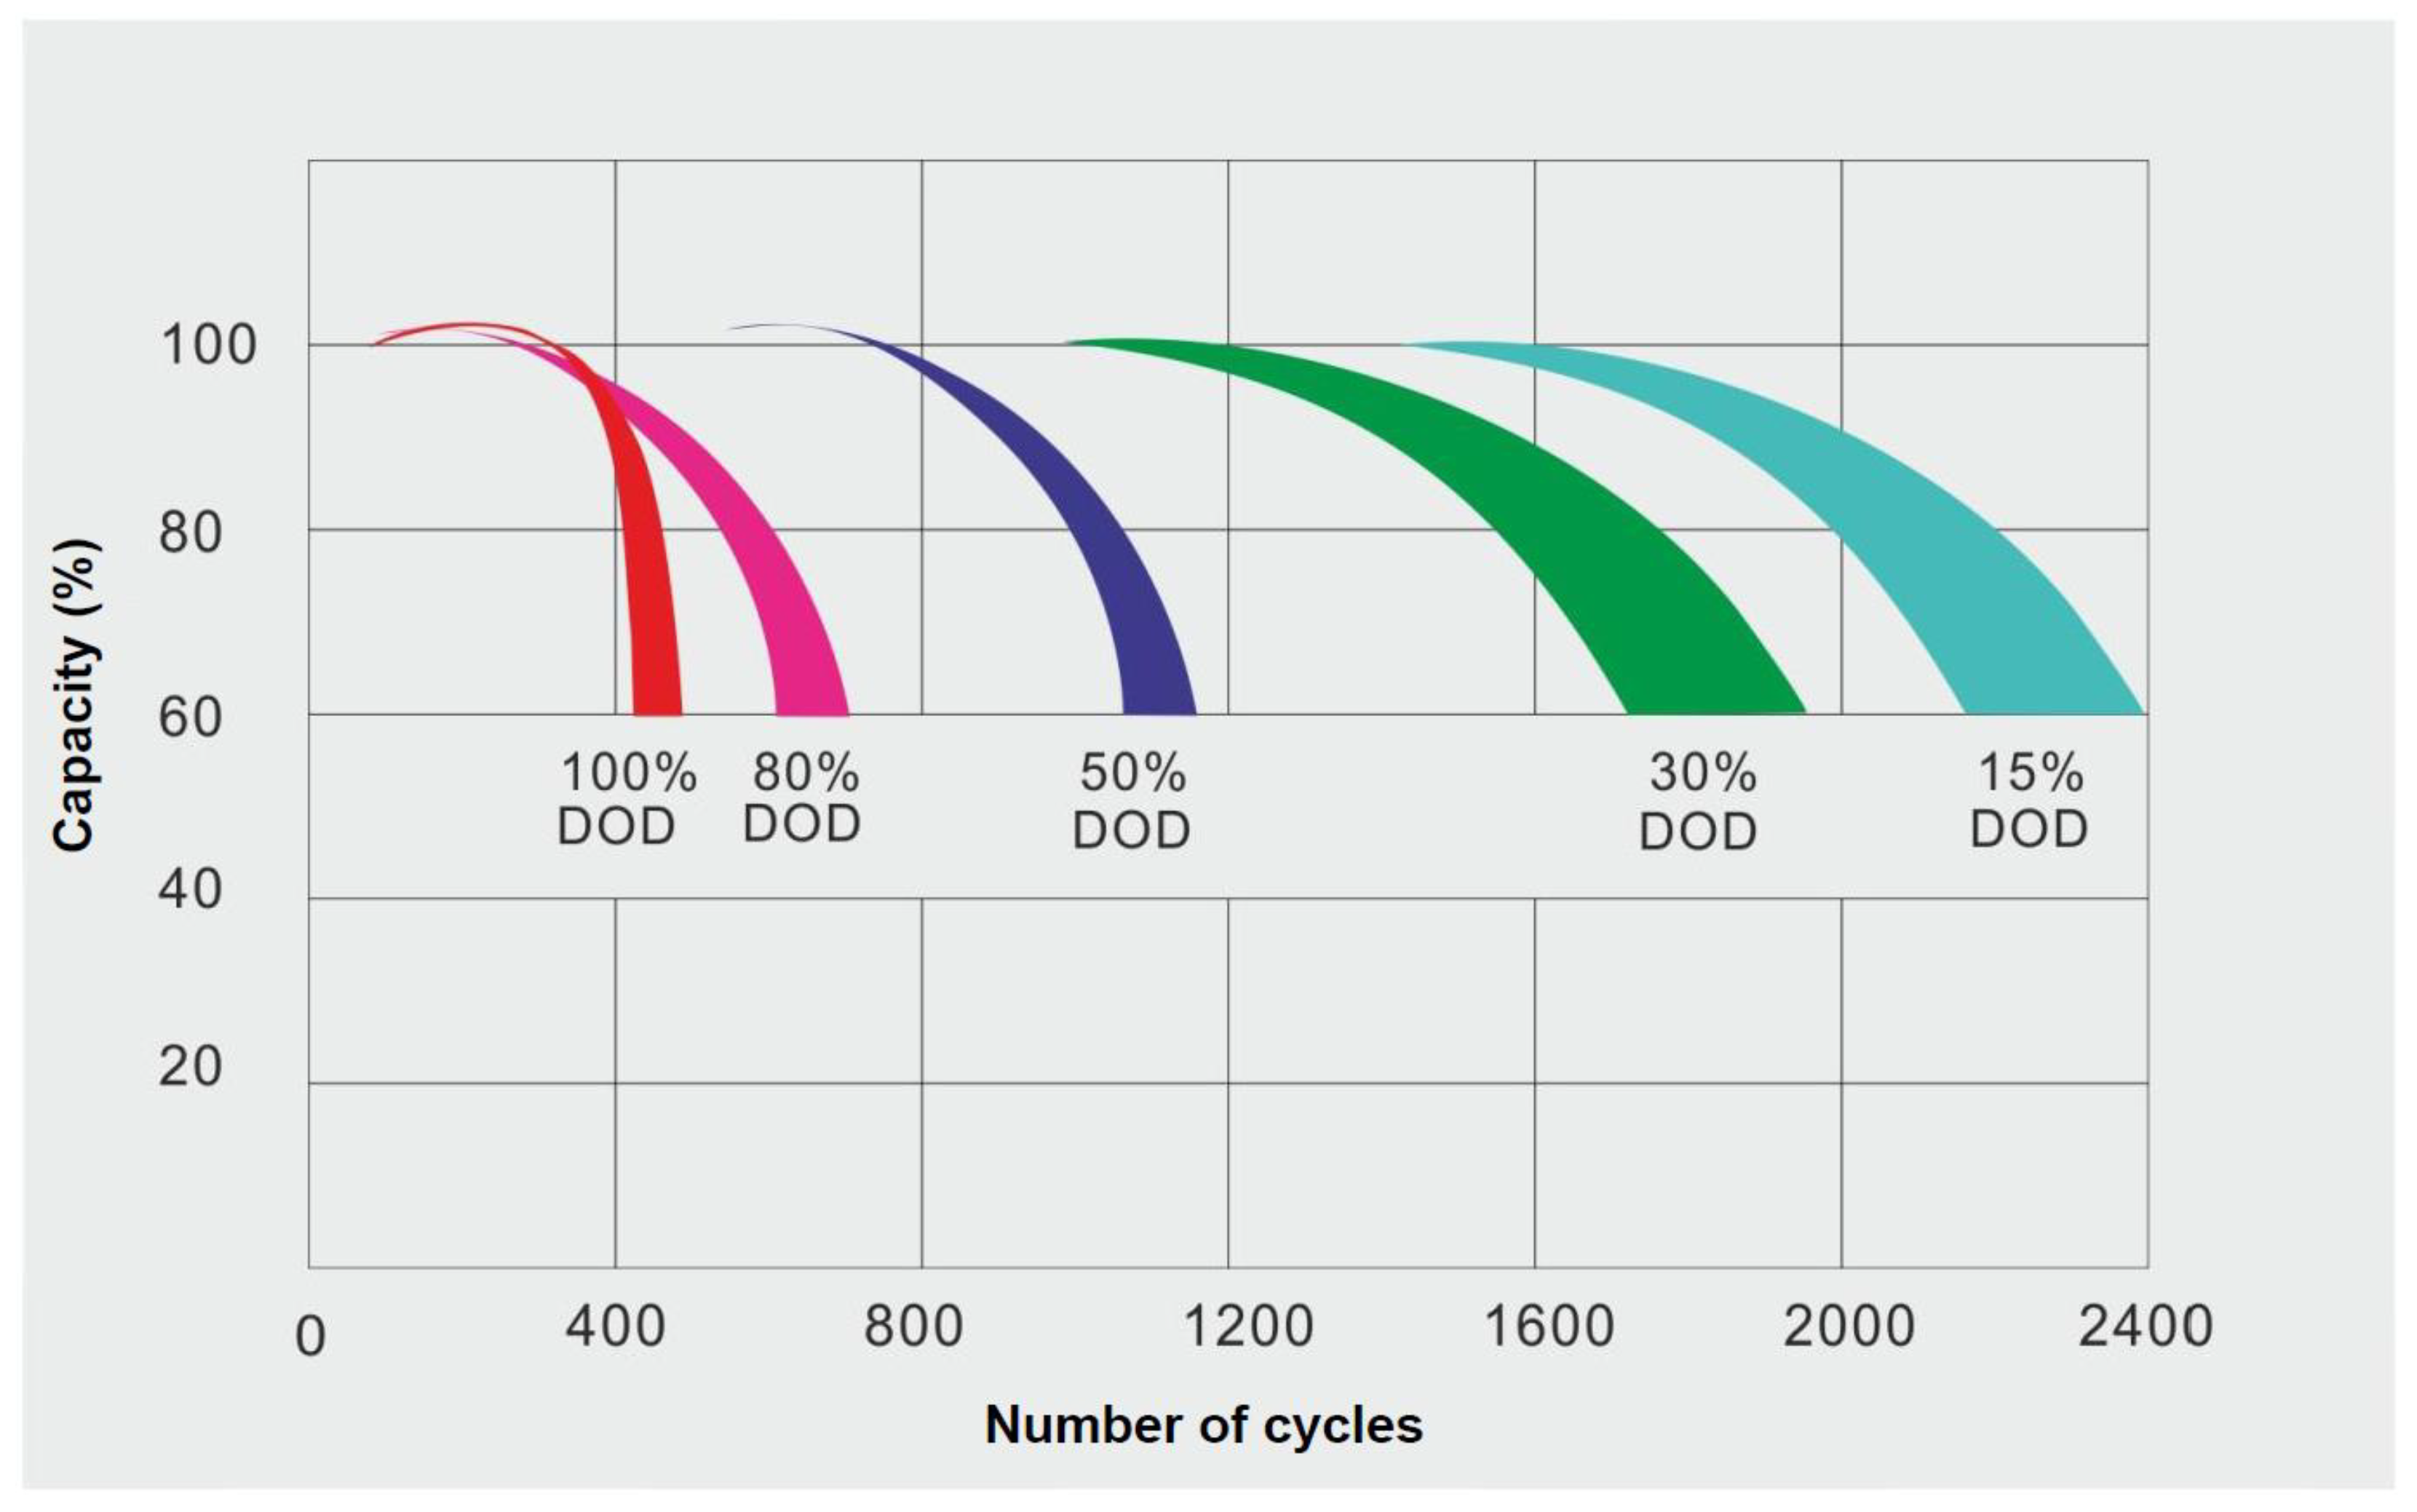
- Connecting the voltage measuring circuits of the sensors to the batteries only for the duration of the measurement automatically eliminates the problem of preventing damage to the SWPP batteries due to their deep discharge during a long-term shortage of solar and wind energy or during temporary conservation of the SWPP. This is particularly relevant for GEPPs with low-capacity batteries. The resource of reed relays allows us in our case to carry out such switching for several decades [45].
- The hardware anti-freeze protection built into the sensors and the DAS receiver prevents disruptions to the monitoring processes and operation of the ACS and PDAOC due to interference that occurs during switching in the power circuits of the SWPP or in the supply network.
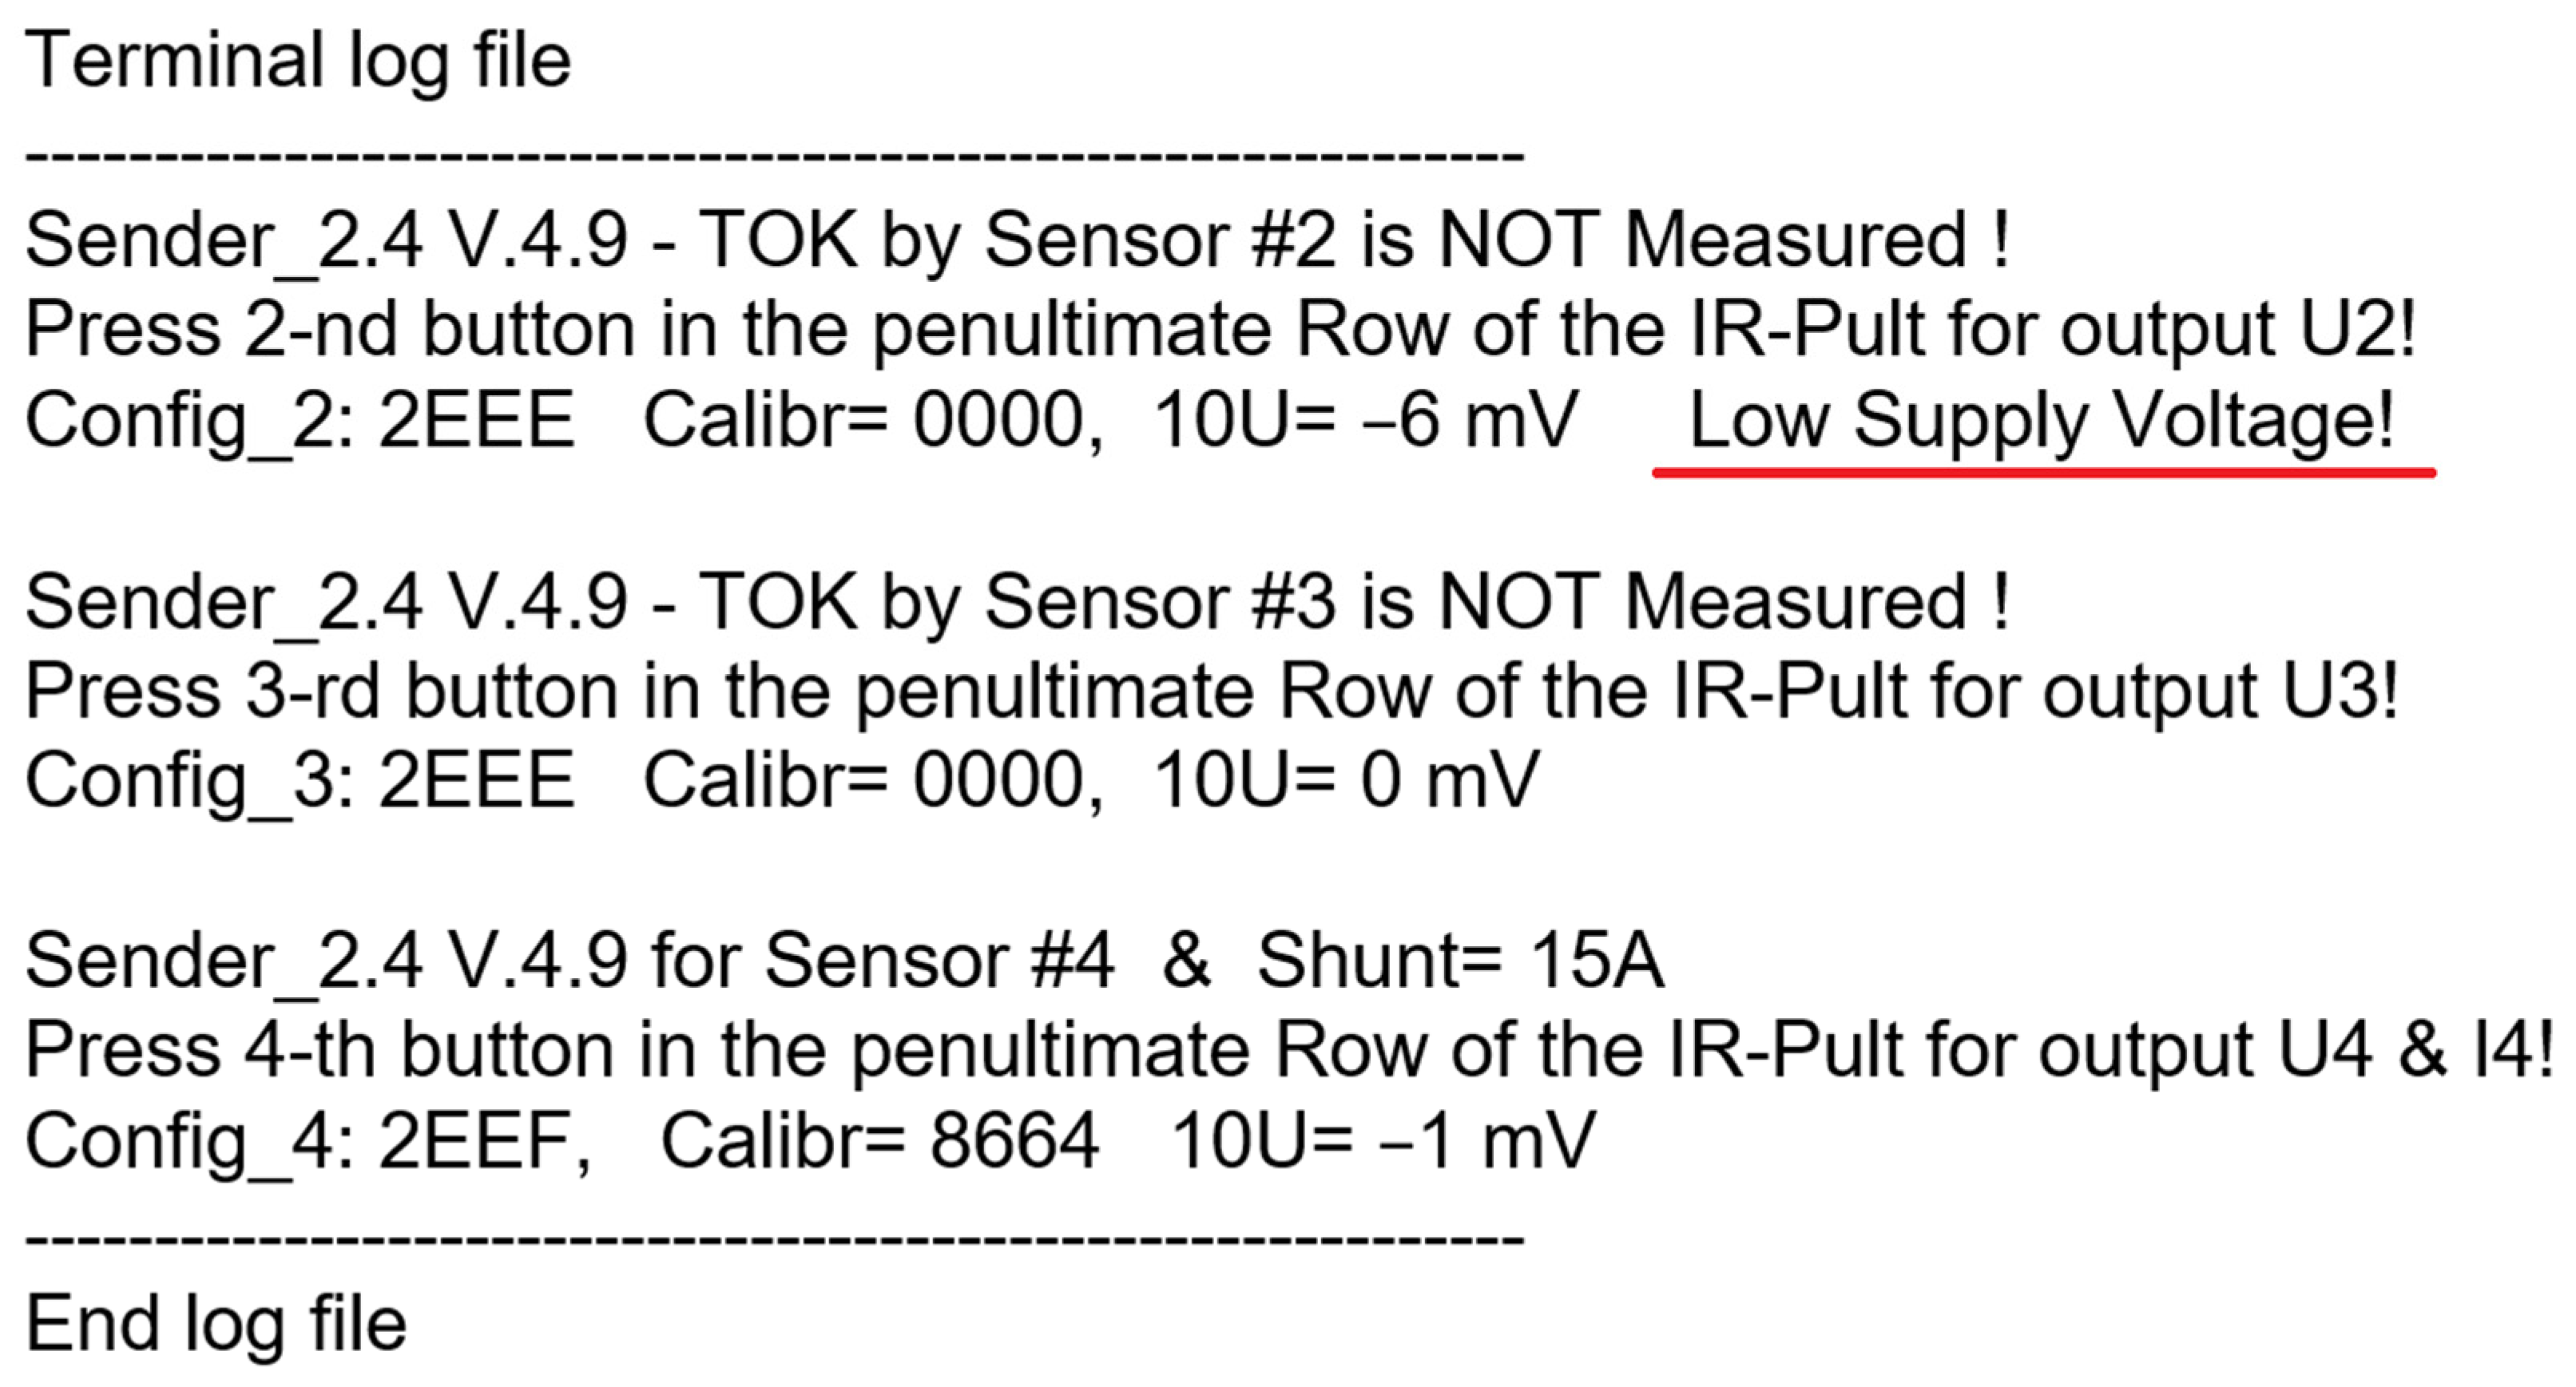
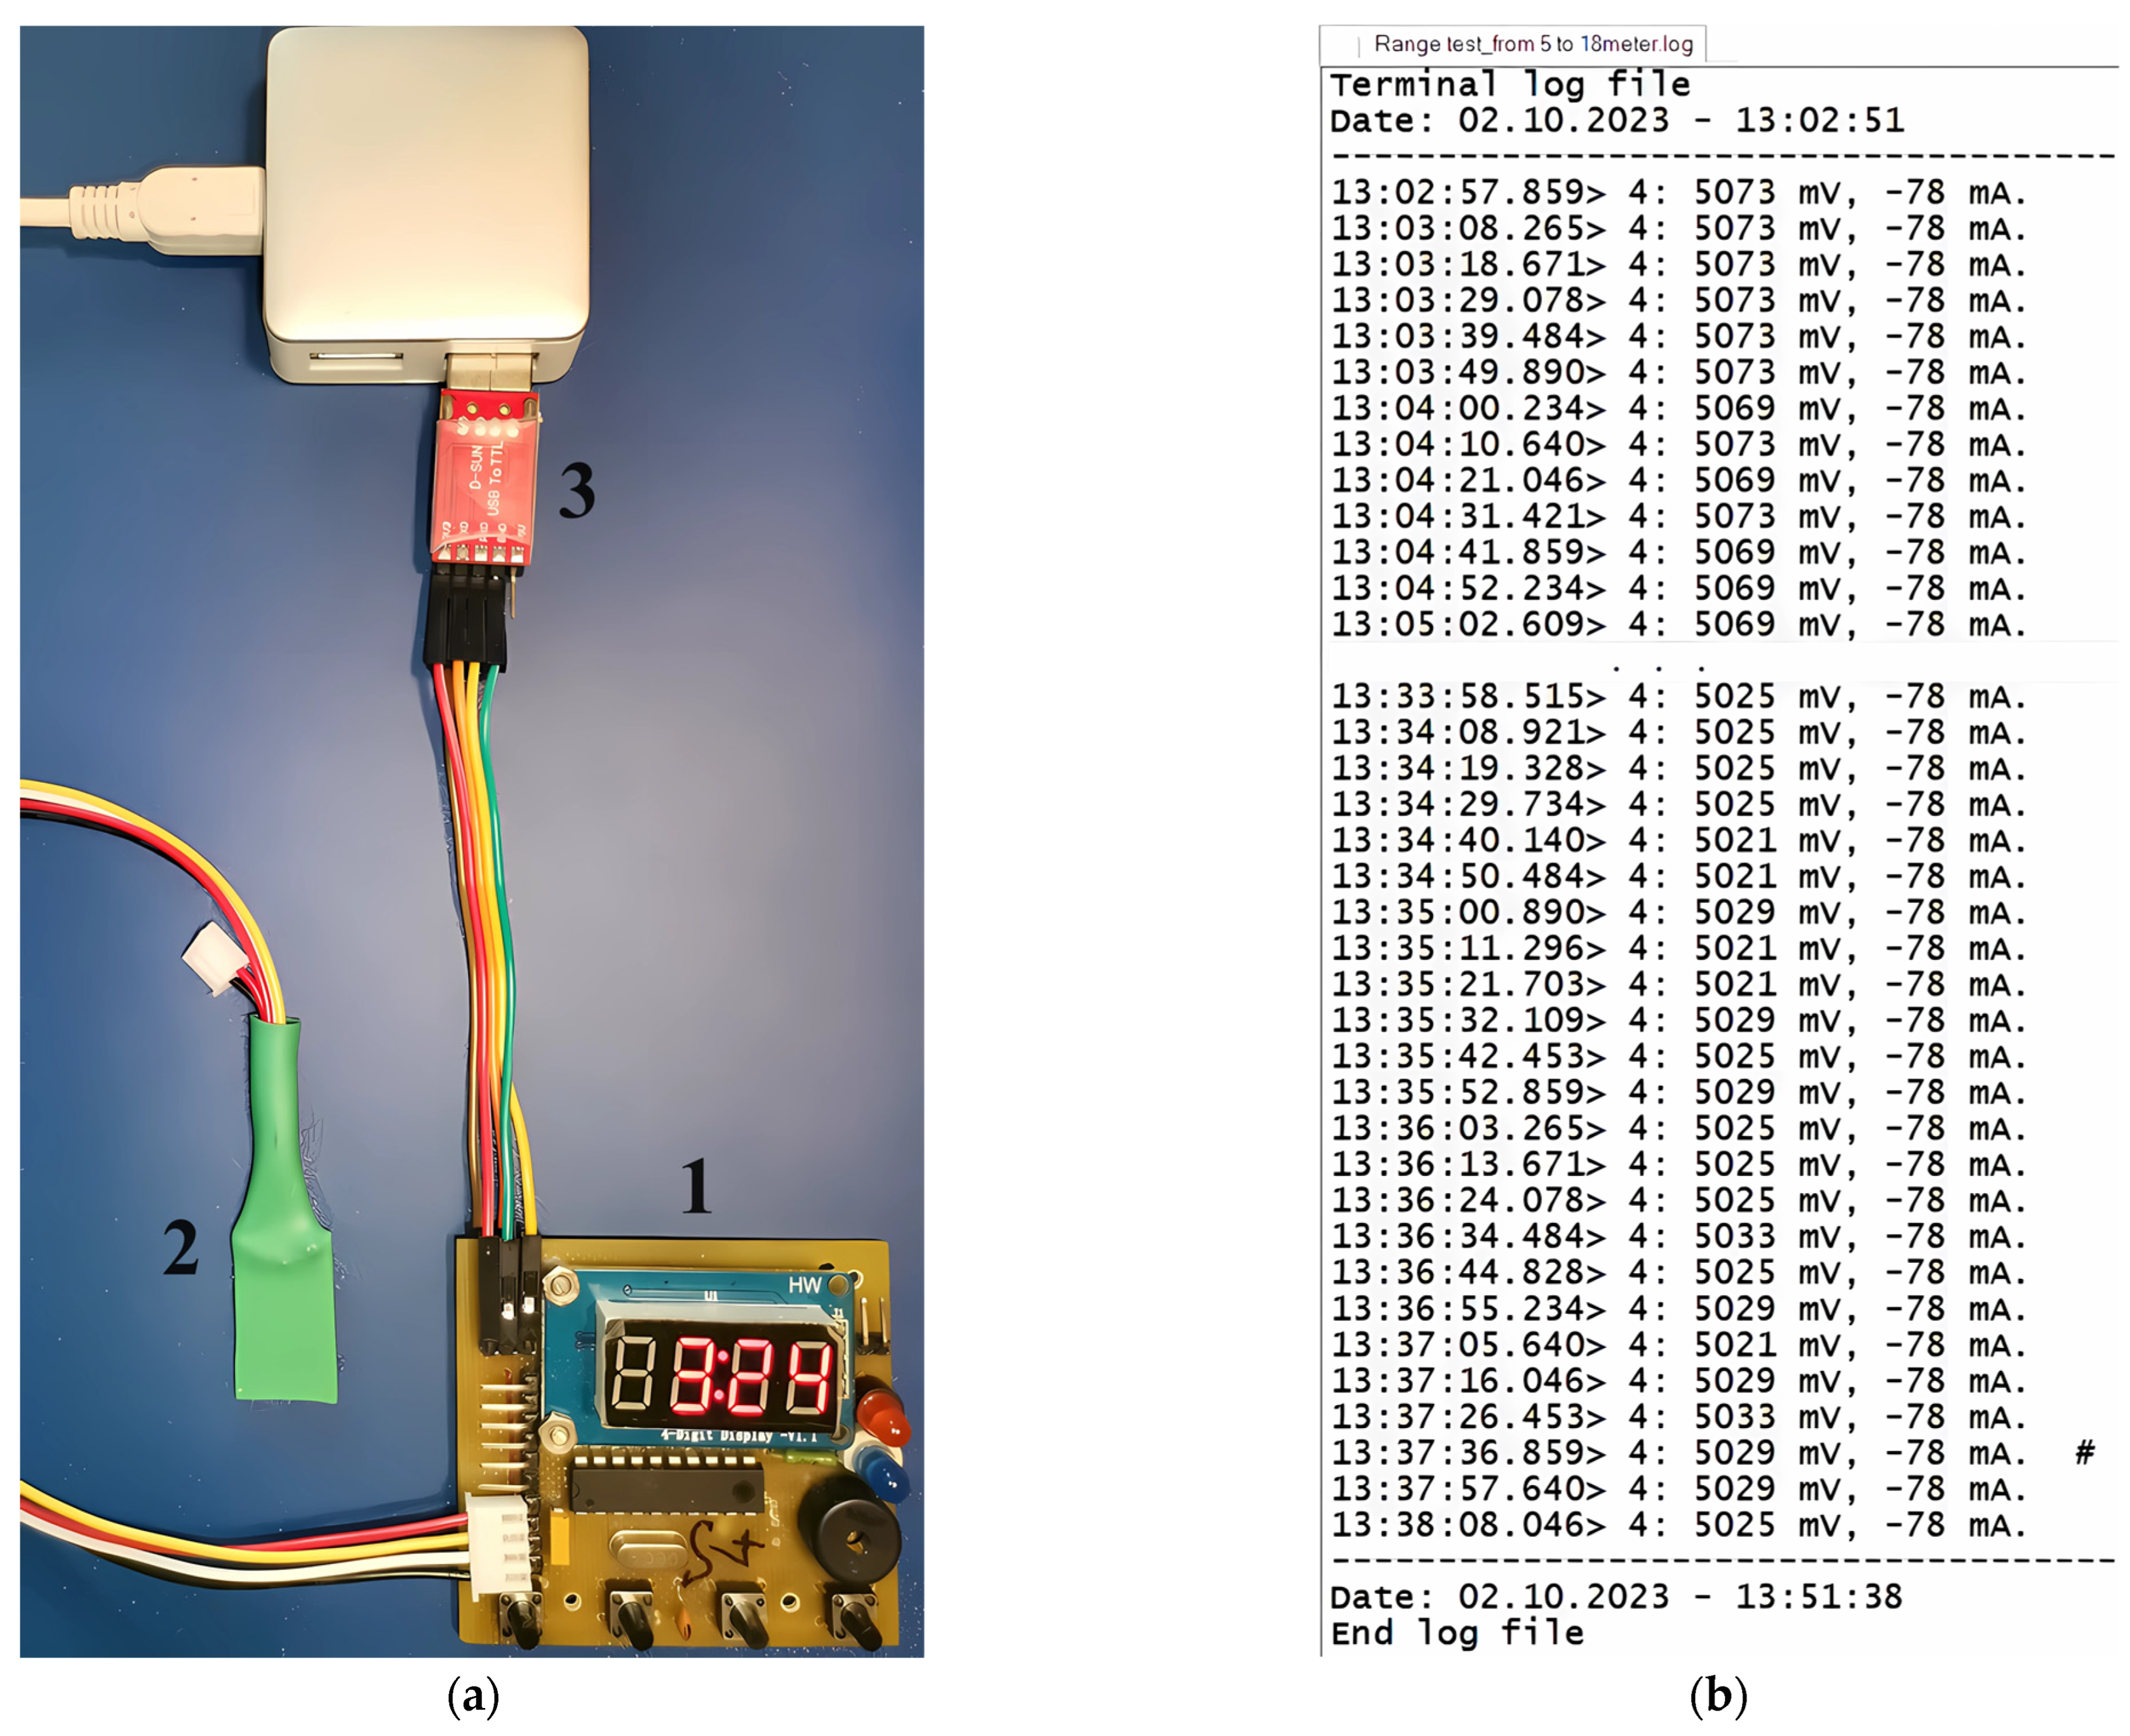
- The developed sensors contain tools for rapid diagnoses of their serviceability and control of the main parameters of their settings. The diagnostic process can be initiated at almost any time using the hand-held IR remote control. This does not require disconnecting the sensors from the SWPP circuits and connecting additional wires to them.
4. Conclusions
- (1)
- Implement backup protection of SWPP batteries from overcharge and overdischarge;
- (2)
- Introduce into the system elements to increase the efficiency of natural energy use by automatically switching part of the SWPP loads from power from the public power grid to power from natural energy when there is an excess of it and vice versa when there is a lack of it;
- (3)
- Organize prompt remote diagnostics of the status of sensors without connecting additional wires.
Supplementary Materials
Author Contributions
Funding
Institutional Review Board Statement
Informed Consent Statement
Data Availability Statement
Conflicts of Interest
Appendix A
Appendix B
Appendix C

| BIT # | D15 | D14 | D13 | D12 | D11 | D10 | D9 | D8 | D7 | D6 | D5 | D4 | D3 | D2 | D1 | D0 |
|---|---|---|---|---|---|---|---|---|---|---|---|---|---|---|---|---|
| BIT NAME | RST | — | BRNG | PG1 | PG0 | BADC4 | BADC3 | BADC2 | BADC1 | SADC4 | SADC3 | SADC2 | SADC1 | MODE3 | MODE2 | MODE1 |
| POR VALUE | 0 | 0 | 1 | 0 | 1 | 1 | 1 | 0 | 1 | 1 | 1 | 0 | 1 | 1 | 1 | 1 |
| RST: | Reset Bit |
|---|---|
| Bit 15 | Setting this bit to ‘1’ generates a system reset that is the same as power-on reset. This resets all registers to default values; this bit self-clears. |
| BRNG: | Bus Voltage Range |
| Bit13 | 0 = 16 V FSR 1 = 32 V FSR (default value) |
| PG: | PGA (Shunt Voltage Only) |
| Bits 11, 12 | This sets PGA gain and range. Note that the PGA defaults to ÷8 (320 mV range). Table A3 shows the gain and range for the various product gain settings. |
| BADC: | BADC BusADC Resolution/Averaging |
| Bits 7–10 | These bits adjust the Bus ADC resolution (9-, 10-, 11-, or 12-bit) or set the number of samples used when averaging the results for the Bus Voltage Register (02h). |
| SADC: | SADC Shunt ADC Resolution/Averaging |
| Bits 3–6 | These bits adjust the shunt ADC resolution (9-, 10-, 11-, or 12-bit) or set the number of samples used when averaging the results for the Shunt Volage Register (01h). BADC (Bus)and SADC (Shunt) ADC resolution/averaging and conversion time settings are shown in Table A4. |
| MODE: | Operating Mode |
| Bits 0–2 | This selects continuous, triggered, or power-down mode of operation. These bits default to continuous shunt and bus measurement mode. The mode settings are shown in Table A5. |
| PG1 | PG0 | GAIN | RANGE |
|---|---|---|---|
| 0 | 0 | 1 | ±40 MV |
| 0 | 1 | +2 | ±80 MV |
| 1 | 0 | +4 | ±160 MV |
| 1 | 1 | +8 | ±320 MV |
| ADC4 | ADC3 | ADC2 | ADC1 | Mode/Samples | Conversion Time |
|---|---|---|---|---|---|
| 0 | X (2) | 0 | 0 | 9-bit | 84 µs |
| 0 | X (2) | 0 | 1 | 10-bit | 148 µs |
| 0 | X (2) | 1 | 0 | 11-bit | 276 µs |
| 0 | X (2) | 1 | 1 | 12-bit | 532 µs |
| 1 | 0 | 0 | 0 | 12-bit | 532 µs |
| 1 | 0 | 0 | 1 | 2 | 1.06 ms |
| 1 | 0 | 1 | 0 | 4 | 2.13 ms |
| 1 | 0 | 1 | 1 | 8 | 4.26 ms |
| 1 | 1 | 0 | 0 | 16 | 8.51 ms |
| 1 | 1 | 0 | 1 | 32 | 17.02 ms |
| 1 | 1 | 1 | 0 | 64 | 34.05 ms |
| 1 | 1 | 1 | 1 | 128 | 68.10 ms |
| Mode 3 | Mode 2 | Mode 1 | Mode |
|---|---|---|---|
| 0 | 0 | 0 | Power-Down |
| 0 | 0 | 1 | Shunt Voltage, Triggered |
| 0 | 1 | 0 | Bus Voltage, Triggered |
| 0 | 1 | 1 | Shunt and Bus, Triggered |
| 1 | 0 | 0 | ADC Off (disabled) |
| 1 | 0 | 1 | Shunt Voltage, Continuous |
| 1 | 1 | 0 | Bus Voltage, Continuous |
| 1 | 1 | 1 | Hunt and Bus, Continuous |
Appendix D
References
- Jaen-Cuellar, A.Y.; Elvira-Ortiz, D.A.; Osornio-Rios, R.A.; Antonino-Daviu, J.A. Advances in Fault Condition Monitoring for Solar Photovoltaic and Wind Turbine Energy Generation: A Review. Energies 2022, 15, 5404. [Google Scholar] [CrossRef]
- Roy, P.; He, J.; Zhao, T.; Singh, Y.V. Recent Advances of Wind-Solar Hybrid Renewable Energy Systems for Power Generation: A Review. IEEE Open J. Ind. Electron. Soc. 2022, 3, 81–104. [Google Scholar] [CrossRef]
- Antonio Barrozo Budes, F.; Valencia Ochoa, G.; Obregon, L.G.; Arango-Manrique, A.; Ricardo Núñez Álvarez, J. Energy, Economic, and Environmental Evaluation of a Proposed Solar-Wind Power On-Grid System Using HOMER Pro®: A Case Study in Colombia. Energies 2020, 13, 1662. [Google Scholar] [CrossRef]
- Sovacool, B.K. The Intermittency of Wind, Solar, and Renewable Electricity Generators: Technical Barrier or Rhetorical Excuse? Util Policy 2009, 17, 288–296. [Google Scholar] [CrossRef]
- Madeti, S.R.; Singh, S.N. A Comprehensive Study on Different Types of Faults and Detection Techniques for Solar Photovoltaic System. Sol. Energy 2017, 158, 161–185. [Google Scholar] [CrossRef]
- Bharath Kurukuru, V.S.; Blaabjerg, F.; Khan, M.A.; Haque, A. A Novel Fault Classification Approach for Photovoltaic Systems. Energies 2020, 13, 308. [Google Scholar] [CrossRef]
- Manukovskii, A.V.; Sagyndyk, A.B. Selection of Current Sensors for Monitoring of Working of Solar-Wind Power Plants. Bull. Toraighyrov Univ. Energetics Ser. 2022, 212–225. [Google Scholar] [CrossRef]
- Manukovskii, A.V.; Zhakupov, N.R.; Begancova, M.; Zhumabaj, N. Increasing the Efficiency of Using Renewable Energy Mini-Power Plants. Molod. Uchenyj 2018, 33, 19–22. [Google Scholar]
- Henze, N.; Bendel, C.; Fruchting, A.; Kirchhof, J. Application of photovoltaic solar cells in planar antenna structures. In Proceedings of the 3rd World Conference on Photovoltaic Energy Conversion, Osaka, Japan, 11–18 May 2003; Volume 1, pp. 220–223. [Google Scholar]
- Wang, W.; Xu, Y.; Khanna, M. A Survey on the Communication Architectures in Smart Grid. Comput. Netw. 2011, 55, 3604–3629. [Google Scholar] [CrossRef]
- Eke, R.; Sertap Kavasoglu, A.; Kavasoglu, N. Design and Implementation of a Low-Cost Multi-Channel Temperature Measurement System for Photovoltaic Modules. Measurement 2012, 45, 1499–1509. [Google Scholar] [CrossRef]
- Carullo, A.; Vallan, A. Outdoor Experimental Laboratory for Long-Term Estimation of Photovoltaic-Plant Performance. IEEE Trans. Instrum. Meas. 2012, 61, 1307–1314. [Google Scholar] [CrossRef]
- Zidani, C.; Benyoucef, B.; Madini, N. Exergetic Assessment of Transmission-Concentrated Solar Energy Systems via Optical Fibres for Building Applications. Int. J. Exergy 2012, 11, 216. [Google Scholar] [CrossRef]
- Kribus, A.; Zik, O.; Karni, J. Optical Fibers and Solar Power Generation. Sol. Energy 2000, 68, 405–416. [Google Scholar] [CrossRef]
- Kandilli, C.; Ulgen, K. Review and Modelling the Systems of Transmission Concentrated Solar Energy via Optical Fibres. Renew. Sustain. Energy Rev. 2009, 13, 67–84. [Google Scholar] [CrossRef]
- Han, J.; Choi, C.; Park, W.; Lee, I.; Kim, S. PLC-Based Photovoltaic System Management for Smart Home Energy Management System. IEEE Trans. Consum. Electron. 2014, 60, 184–189. [Google Scholar] [CrossRef]
- Han, J.; Jeong, J.-D.; Lee, I.; Kim, S.-H. Low-Cost Monitoring of Photovoltaic Systems at Panel Level in Residential Homes Based on Power Line Communication. IEEE Trans. Consum. Electron. 2017, 63, 435–441. [Google Scholar] [CrossRef]
- Tejwani, R.; Kumar, G.; Solanki, C. Remote Monitoring for Solar Photovoltaic Systems in Rural Application Using GSM Voice Channel. In Proceedings of the Energy Procedia; Elsevier Ltd.: Amsterdam, The Netherlands, 2014; Volume 57, pp. 1526–1535. [Google Scholar]
- Mahjoubi, A.; Fethi Mechlouch, R.; Ben Brahim, A. A Low Cost Wireless Data Acquisition System for a Remote Photovoltaic (PV) Water Pumping System. Energies 2011, 4, 68–89. [Google Scholar] [CrossRef]
- Nkoloma, M.; Zennaro, M.; Bagula, A. SM2: Solar monitoring system in Malawi. In Proceedings of the ITU Kaleidoscope 2011: The Fully Networked Human?-Innovations for Future Networks and Services (K-2011), Cape Town, South Africa, 12–14 December 2011; pp. 1–6. [Google Scholar]
- Shariff, F.; Rahim, N.A.; Hew, W.P. Zigbee-Based Data Acquisition System for Online Monitoring of Grid-Connected Photovoltaic System. Expert Syst. Appl. 2015, 42, 1730–1742. [Google Scholar] [CrossRef]
- Batista, N.C.; Melício, R.; Matias, J.C.O.; Catalão, J.P.S. Photovoltaic and Wind Energy Systems Monitoring and Building/Home Energy Management Using ZigBee Devices within a Smart Grid. Energy 2013, 49, 306–315. [Google Scholar] [CrossRef]
- Anwari, M.; Hidayat, A.; Hamid, M.I. Taufik Wireless Data Acquisition for Photovoltaic Power System. In Proceedings of the INTELEC 2009—31st International Telecommunications Energy Conference, Incheon, Republic of Korea, 18–22 October 2009; IEEE: Piscataway, NJ, USA, 2009; pp. 1–4. [Google Scholar]
- Prasanna Rani, D.D.; Suresh, D.; Rao Kapula, P.; Mohammad Akram, C.H.; Hemalatha, N.; Kumar Soni, P. IoT Based Smart Solar Energy Monitoring Systems. Mater. Today Proc. 2023, 80, 3540–3545. [Google Scholar] [CrossRef]
- Pulungan, A.B.; Risfendra, R.; Purwanto, W.; Maksum, H.; Setiawan, O. Design and development of real time monitoring single axis solar tracker by using internet of things. Int. J. GEOMATE 2020, 18, 81–87. [Google Scholar] [CrossRef]
- Hasib Cheragee, S.; Hassan, N.; Ahammed, S.; Touhidul Islam, A.Z. A Study of IoT Based Real-Time Solar Power Remote Monitoring System. Int. J. Ambient Syst. Appl. 2021, 9, 27–36. [Google Scholar] [CrossRef]
- Barka, C.; Messaoudi-Abid, H.; Setthom, H.B.A.; Bennani-Ben Abdelghani, A.; Slama-Belkhodja, I.; Sammoud, H. A Real Time, Wireless and Low Cost Data Acquisition System for Residential PV Modules. In Proceedings of the 6th IEEE International Energy Conference (ENERGYCon), Gammarth, Tunisia, 28 September–1 October 2020; Institute of Electrical and Electronics Engineers Inc.: Piscataway, NJ, USA, 2020; pp. 417–422. [Google Scholar]
- Wang, Y.; Wen, H.; Hou, X.; Tang, H.; Sun, H.; Zheng, K.; Li, S. Comparison of Differential-Mode and Mixed-Mode Conducted Emission for Household Appliances in Power-Line Communication System. IEEE Trans. Electromagn. Compat. 2017, 59, 2023–2028. [Google Scholar] [CrossRef]
- Card, J. TS 151 013—V18.0.0—Digital Cellular Telecommunications System (Phase 2+) (GSM); Test Specification for Subscriber Identity Module (SIM) Application Programming Interface (API) for Java Card (3GPP TS 51.013 Version 18.0.0 Release 18); 2024. Available online: https://cdn.standards.iteh.ai/samples/71720/5e17ba0d49d241a4aafcf9a5a36e1875/ETSI-TS-151-013-V18-0-0-2024-05-.pdf (accessed on 29 May 2024).
- ZigBee Modules Cut Development of ZigBee Compatible Products in Half. Available online: https://wireless-e.ru/radiomoduli/moduli-zigbee/ (accessed on 25 May 2024).
- HC-12 Datasheet(PDF) 5 Page—List of Unclassifed Manufacturers. Available online: https://html.alldatasheet.com/html-pdf/1242982/ETC1/HC-12/573/5/HC-12.html (accessed on 25 May 2024).
- How Tonight’s Geomagnetic Storm Could Send GPSs Haywire and Cause Havoc for Airplanes—Here’s What Could Happen to Cell Phones or Other Electronics. Available online: https://www.dailymail.co.uk/sciencetech/article-13404635/what-happen-geomagnetic-storm-hits-TODAY-US.html (accessed on 21 May 2024).
- Russia: Telegram Block Leads to Widespread Assault on Freedom of Expression Online. Available online: https://www.pen-international.org/news/russia-telegram-block-leads-to-widespread-assault-on-freedom-of-expression-online (accessed on 22 May 2024).
- How a Smart Home Works in Russia after Sanctions. Lots of Restrictions. Available online: https://www.iphones.ru/iNotes/kak-rabotaet-umnyy-dom-v-rossii-posle-sankciy-08-09-2022 (accessed on 22 May 2024).
- BMP280 Datasheet (PDF)—Bosch Sensortec GmbH. Available online: https://www.alldatasheet.com/datasheet-pdf/pdf/1132069/BOSCH/BMP280.html (accessed on 30 May 2024).
- Madeti, S.R.; Singh, S.N. Monitoring System for Photovoltaic Plants: A Review. Renew. Sustain. Energy Rev. 2017, 67, 1180–1207. [Google Scholar] [CrossRef]
- Sensors and Microcontrollers. Available online: https://habr.com/ru/post/260639/ (accessed on 25 May 2024).
- SOT23 INA219 Bi-Directional DC Current Power Supply Sensor Breakout Module Original DIY 3V-5V IIC I2C Power Monitoring Sensor. Available online: https://aliexpress.ru/item/1005003041425999.html?spm=a2g2w.orderdetail.0.0.4b3b4aa6Zk74w0&sku_id=12000023402820342 (accessed on 25 May 2024).
- INA219 Datasheet (PDF)—Texas Instruments. Available online: https://www.alldatasheet.com/datasheet-pdf/pdf/249609/TI/INA219.html (accessed on 25 May 2024).
- 8-Bit Microcontroller with 2/4K Bytes In-System Programmable Flash. Available online: https://www.keysemi.com/upload/data_sheet/attiny2313a-pu.pdf (accessed on 25 May 2024).
- TSOP31236 Datasheet (PDF)—Vishay Siliconix. Available online: https://www.alldatasheet.com/datasheet-pdf/pdf/252281/VISHAY/TSOP31236.html (accessed on 25 May 2024).
- JDY-40-Datasheet. Available online: https://www.rcscomponents.com/datasheets/JDY-40-datasheet.pdf (accessed on 25 May 2024).
- NI-ZN BATTERY SPECIFICATION. Available online: https://docviewer.yandex.kz/view/0/?page=1&*=hin5imxayp61e9MN43T2Rlw2XVd7InVybCI6Imh0dHA6Ly93d3cuZmlsbXByb2Nlc3MucnUvaW1hZ2VzL290aGVycy9peGJ0L25pem4vY29ucmFkXzI1MDAucGRmIiwidGl0bGUiOiJjb25yYWRfMjUwMC5wZGYiLCJub2lmcmFtZSI6dHJ1ZSwidWlkIjoiMCIsInRzIjoxNzE2ODY4NjE4MTYxLCJ5dSI6IjgzMjczODU5MzE2NzY5OTA2NTciLCJzZXJwUGFyYW1zIjoidG09MTcxNjg2ODYxMiZ0bGQ9a3ombGFuZz1lbiZuYW1lPWNvbnJhZF8yNTAwLnBkZiZ0ZXh0PU5JLVpOKzI1MDArbVdIKyVEMCVCNCVEMCVCMCVEMSU4MiVEMCVCMCVEMSU4OCVEMCVCOCVEMSU4MiZ1cmw9aHR0cCUzQS8vd3d3LmZpbG1wcm9jZXNzLnJ1L2ltYWdlcy9vdGhlcnMvaXhidC9uaXpuL2NvbnJhZF8yNTAwLnBkZiZscj0xOTAmbWltZT1wZGYmbDEwbj1ydSZzaWduPWYyMTlhNjliZmYwMTc5N2E3YmVmNDlhYmVjNzg3ZWM3JmtleW5vPTAifQ%3D%3D&lang=en (accessed on 28 May 2024).
- Manukovsky, A.V.; Sagyndyk, A.B.; Talipov, O.M. Development of an Interference-Resistant Radio Channel to Organize Monitoring of the Operation of the «green Energy» Power Plant. Bull. Toraighyrov Univ. Energetics Ser. 2023, 184–196. [Google Scholar] [CrossRef]
- Kletsel, M.Y.A.; Alishev, Z.H.R.; Musin, V.V.; Manukovskij, A.V. Properties of reed switches used in relay protection. Elektrichestvo 1993, 9, 18–21. [Google Scholar]


| Monitoring Functions | Possibility of Measuring the Voltage of Each of the Series-Connected Batteries | Automatic Response to Malfunctions and Abnormal Operating Modes of GEPPs | Independence of DAS from the Quality of the Internet and Cyber-Attacks | Automatic Connection of Additional Load in Case of Excess Natural Energy | Availability of Online Remote Diagnostics of the State of SSD Components | Absence of a “Web of Wires” near GEPP Power Circuits | |
|---|---|---|---|---|---|---|---|
| Types of GEPP Monitoring Systems | |||||||
| Monitoring of GEPP using GSM | − | − | +/− | − | − | − | |
| Monitoring of GEPP based on Zigbee | + | − | +/− | − | − | + | |
| Monitoring of GEPP based on Internet of Things | +/− | − | − | − | − | − | |
| Monitoring of GEPP using Bluetooth | − | − | + | − | − | − | |
| Monitoring of GEPP using Wi-Fi | − | − | − | − | − | − | |
| Monitoring of GEPP using radio and IR channels | + | + | + | + | + | + | |
Disclaimer/Publisher’s Note: The statements, opinions and data contained in all publications are solely those of the individual author(s) and contributor(s) and not of MDPI and/or the editor(s). MDPI and/or the editor(s) disclaim responsibility for any injury to people or property resulting from any ideas, methods, instructions or products referred to in the content. |
© 2024 by the authors. Licensee MDPI, Basel, Switzerland. This article is an open access article distributed under the terms and conditions of the Creative Commons Attribution (CC BY) license (https://creativecommons.org/licenses/by/4.0/).
Share and Cite
Manukovsky, A.; Sagyndyk, A.; Kislov, A.; Talipov, O.; Manukovsky, A. Wireless Data Acquisition System with Feedback Function. Appl. Sci. 2024, 14, 5553. https://doi.org/10.3390/app14135553
Manukovsky A, Sagyndyk A, Kislov A, Talipov O, Manukovsky A. Wireless Data Acquisition System with Feedback Function. Applied Sciences. 2024; 14(13):5553. https://doi.org/10.3390/app14135553
Chicago/Turabian StyleManukovsky, Anatoliy, Aigerim Sagyndyk, Aleksandr Kislov, Olzhas Talipov, and Alexey Manukovsky. 2024. "Wireless Data Acquisition System with Feedback Function" Applied Sciences 14, no. 13: 5553. https://doi.org/10.3390/app14135553