
Recent Innovations Brought about by Weight-Bearing CT Imaging in the Foot and Ankle: A Systematic Review of the Literature

 , ,
, ,  , and
, and 
Abstract
:1. Introduction
2. Materials and Methods
3. Results
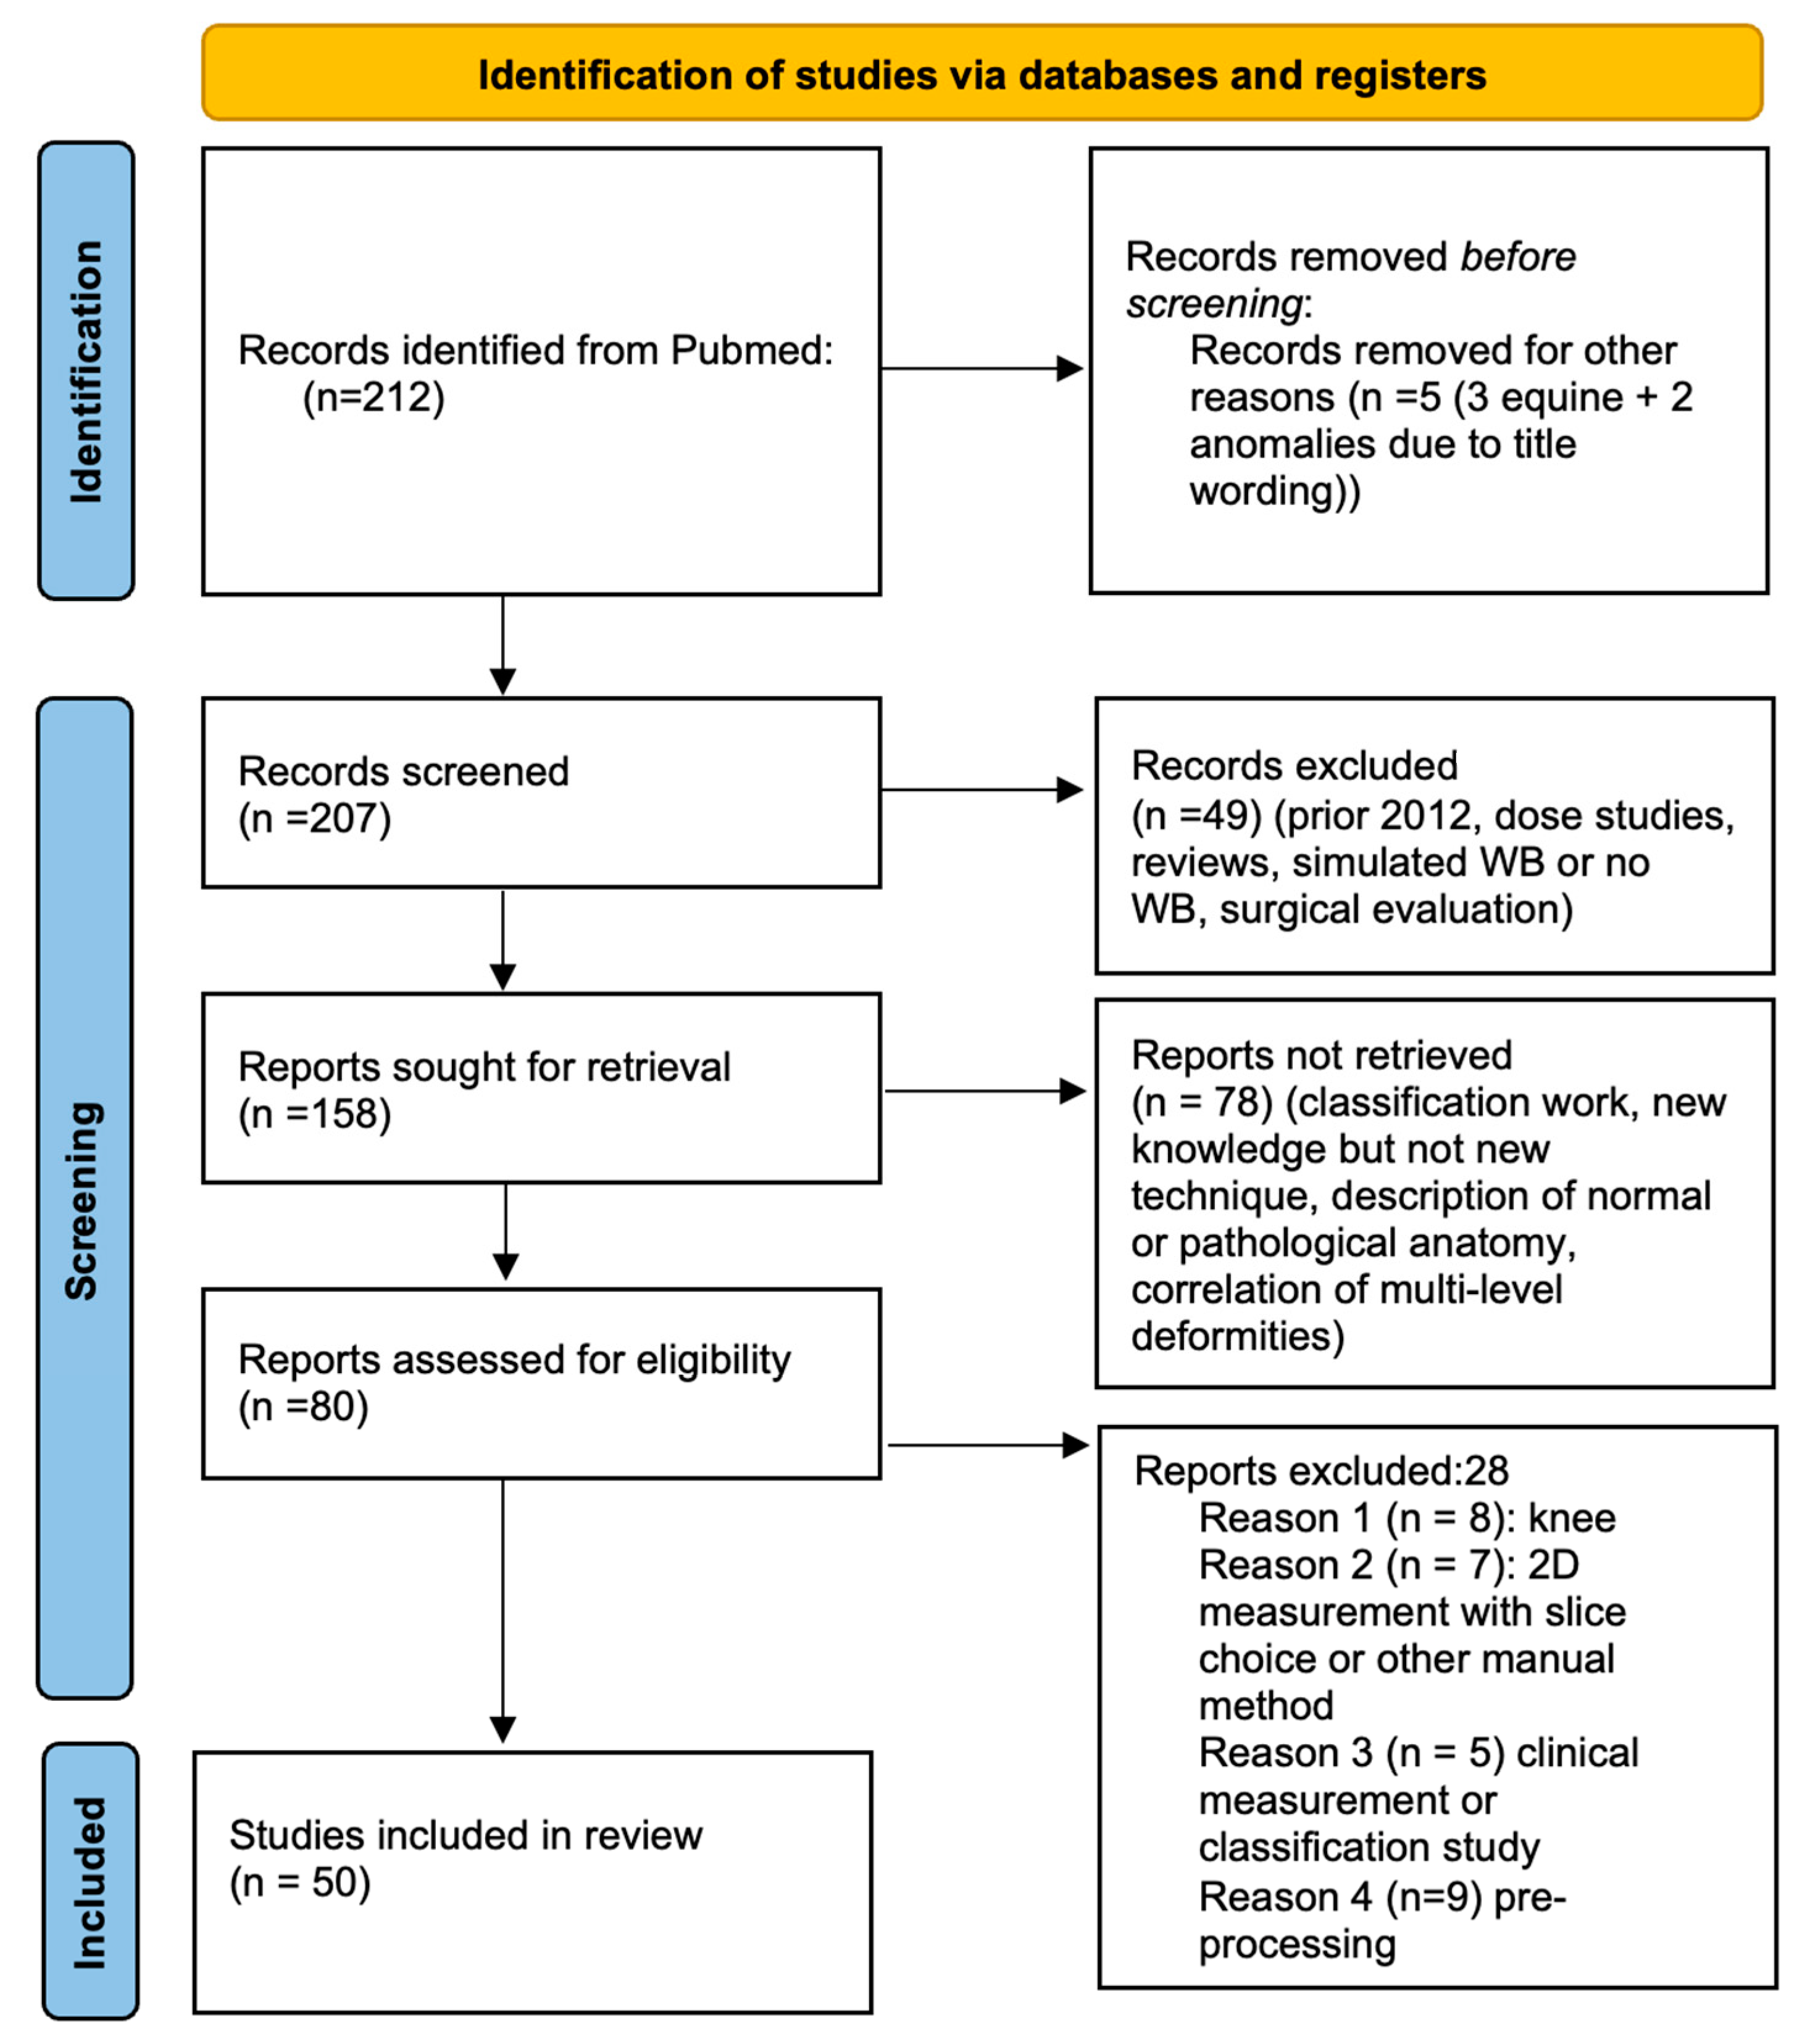
3.1. Pre-Screening
3.2. Screening
- Studies prior to 2012
- Studies of radiation dosage
- Simulated weight-bearing or absence thereof
- Use of WBCT for evaluation of surgical results without innovative methods
- WBCT classifications
- New knowledge but absence of an innovative technique
- Description of normal or pathological anatomy
- Multi-level biomechanical investigation
- Innovative WBCT techniques; study concerning the knee (8 studies)
- Two-dimensional method performed within 3D volume (7 studies)
- Clinical measurement or classification study (5 studies)
- Pre-processing techniques (9 studies)
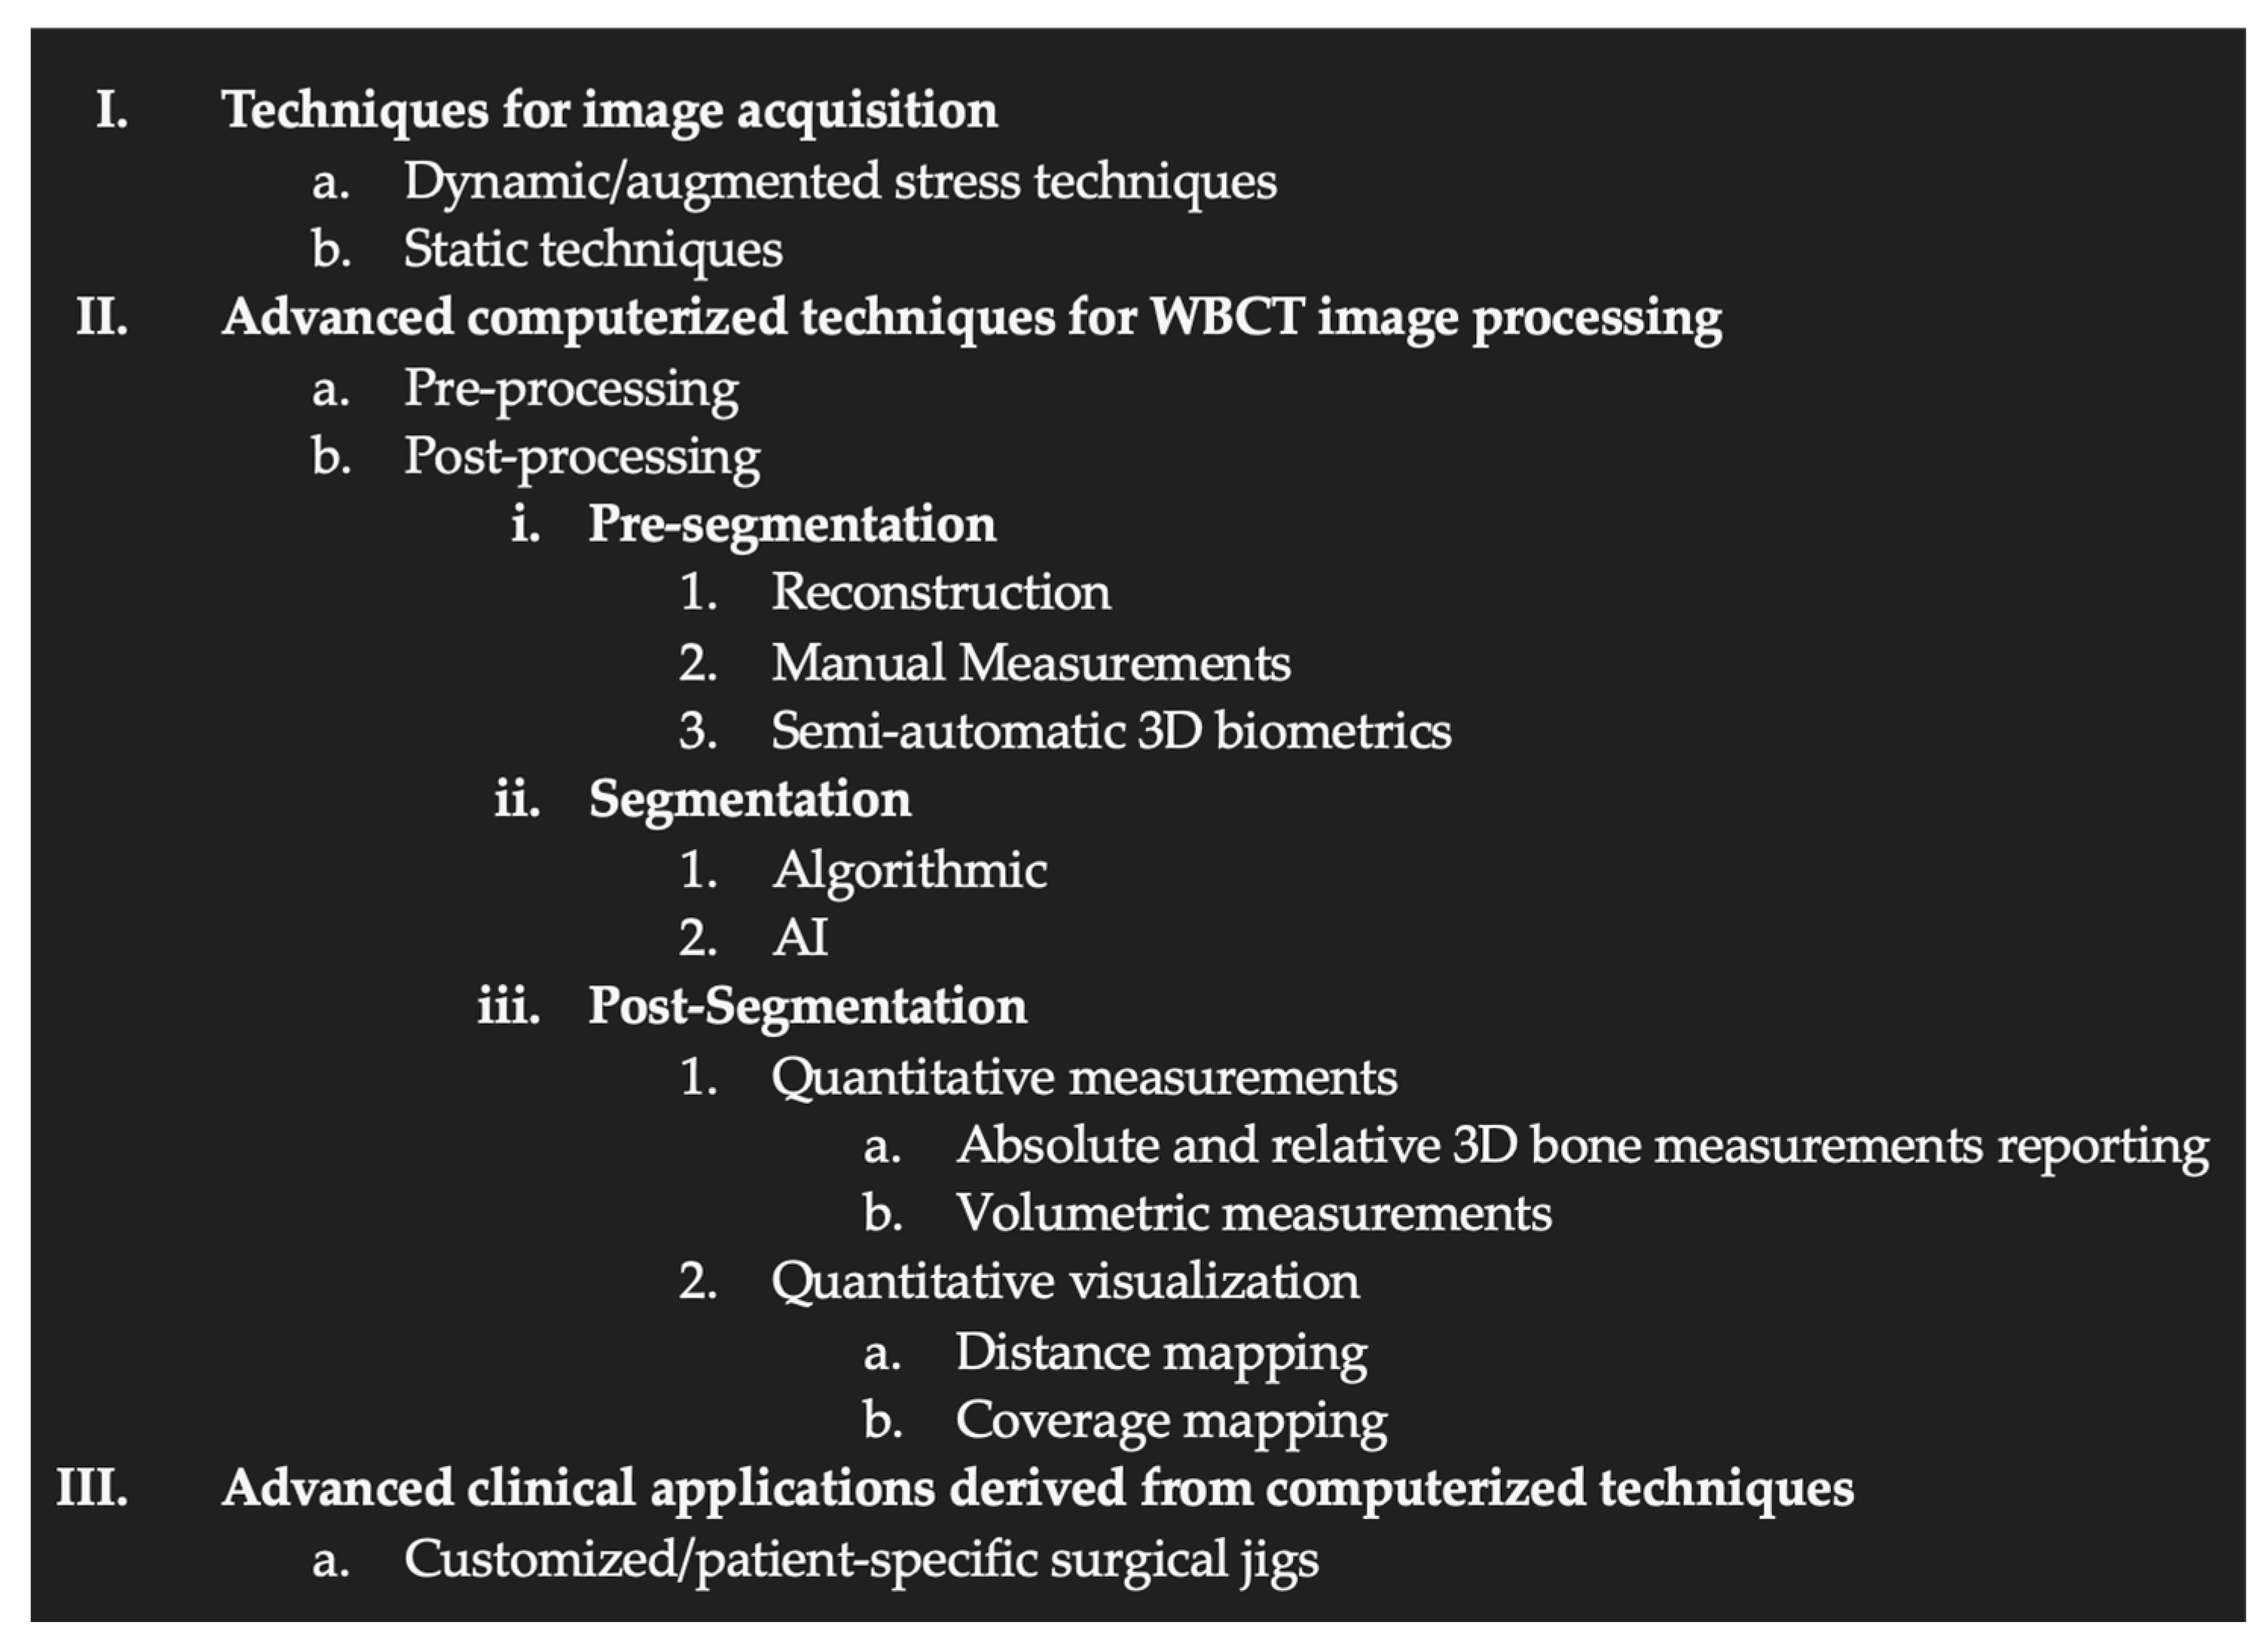
3.3. Organization of the WBCT Workflow: Proposal for a Classification of Recent Innovations
- Techniques for image acquisition
- Computerized techniques for image processing
- ◦
- Pre-processing (processing of the raw data before image rendering)
- ▪
- Metal artifact reduction
- ▪
- Movement Artifact reduction
- ◦
- Post-processing
- ▪
- 3D biometric techniques without segmentation
- ▪
- 3D biometric techniques with segmentation (manual, semi-auto or auto)
- Advanced clinical applications derived from computerized techniques
4. Discussion
4.1. Limits
4.2. Literature Analysis
4.2.1. Description of Techniques for Image Acquisition
4.2.2. Description of Advanced Computerized Techniques for Image Processing
Pre-Processing
Post-Processing
- Pre-Segmentation
- Reconstruction
- 3.
- Manual Measurements
- 4.
- Semi-Automatic 3D Biometrics
- 5.
- Segmentation
Post-Segmentation
- Absolute and Relative 3D Bone Measurement Reporting
- 2.
- Distance Mapping or 3D-JSW, surface and volume measurements
- 3.
- Coverage Mapping
- 4.
- Surface and Volumetric Measurements
- 5.
- Centre of Rotation Assessment.
4.2.3. Description of Techniques for Advanced Clinical Applications Derived from WBCT Computerized Techniques
4.2.4. Current Limitations of the Technique
5. Conclusions
Author Contributions
Funding
Institutional Review Board Statement
Informed Consent Statement
Data Availability Statement
Acknowledgments
Conflicts of Interest
References
- Mozzo, P.; Procacci, C.; Tacconi, A.; Martini, P.T.; Andreis, I.A. A new volumetric CT machine for dental imaging based on the cone-beam technique: Preliminary results. Eur. Radiol. 1998, 8, 1558–1564. [Google Scholar] [CrossRef] [PubMed]
- Minerbo, G. Maximum entropy reconstruction from cone-beam projection data. Comput. Biol. Med. 1979, 9, 29–37. [Google Scholar] [CrossRef] [PubMed]
- Robert, N.; Peyrin, F.; Yaffe, M.J. Binary vascular reconstruction from a limited number of cone beam projections. Med. Phys. 1994, 21, 1839–1851. [Google Scholar] [CrossRef] [PubMed]
- Ambrose, J.; Hounsfield, G. Computerized transverse axial tomography. Br. J. Radiol. 1973, 46, 148–149. [Google Scholar] [CrossRef]
- Feldkamp, L.A.; Davis, L.C.; Kress, J.W. Practical cone-beam algorithms. J. Opt. Soc. Am. 1984, 1, 612–619. [Google Scholar] [CrossRef]
- Bab, R.; Ueda, K.; Kuba, A.; Kohda, E.; Shiraga, N.; Sanmiya, T. Development of a subject-standing-type cone-beam computed tomography for chest and orthopedic imaging. Front. Med. Biol. Eng. 2001, 11, 177–189. [Google Scholar] [PubMed]
- Zbijewski, W.; De Jean, P.; Prakash, P.; Ding, Y.; Stayman, J.W.; Packard, N.; Senn, R.; Yang, D.; Yorkston, J.; Machado, A.; et al. A dedicated cone-beam CT system for musculoskeletal extremities imaging: Design, optimization, and initial performance characterization. Med. Phys. 2011, 38, 4700–4713. [Google Scholar] [CrossRef] [PubMed]
- Muhit, A.; Zbijewski, W.; Stayman, J.; Thawait, G.; Yorkston, J.; Foos, D.; Packard, N.; Yang, D.; Senn, R.; Carrino, J.; et al. WE-G-217BCD-04: Diagnostic Image Quality Evaluation of a Dedicated Extremity Cone- Beam CT Scanner: Pre-Clinical Studies and First Clinical Results. Med. Phys. 2012, 39, 3973. [Google Scholar] [CrossRef] [PubMed]
- Tuominen, E.K.J.; Kankare, J.; Koskinen, S.K.; Mattila, K.T. Weight-bearing CT imaging of the lower extremity. AJR Am. J. Roentgenol. 2013, 200, 146–148. [Google Scholar] [CrossRef] [PubMed]
- Ferri, M.; Scharfenberger, A.V.; Goplen, G.; Daniels, T.R.; Pearce, D. Weightbearing CT scan of severe flexible pes planus deformities. Foot Ankle Int. 2008, 29, 199–204. [Google Scholar] [CrossRef] [PubMed]
- Collan, L.; Kankare, J.A.; Mattila, K. The biomechanics of the first metatarsal bone in hallux valgus: A preliminary study utilizing a weight bearing extremity CT. Foot Ankle Surg. 2013, 19, 155–161. [Google Scholar] [CrossRef]
- Richter, M.; Seidl, B.; Zech, S.; Hahn, S. PedCAT for 3D-imaging in standing position allows for more accurate bone position (angle) measurement than radiographs or CT. Foot Ankle Surg. 2014, 20, 201–207. [Google Scholar] [CrossRef]
- Alexander, N.B.; Sarfani, S.; Strickland, C.D.; Richardson, D.R.; Murphy, G.A.; Grear, B.J.; Bettin, C.C. Cost Analysis and Reimbursement of Weightbearing Computed Tomography. Foot Ankle Orthop. 2023, 8, 24730114231164143. [Google Scholar] [CrossRef]
- Arena, C.B.; Sripanich, Y.; Leake, R.; Saltzman, C.L.; Barg, A. Assessment of Hindfoot Alignment Comparing Weightbearing Radiography to Weightbearing Computed Tomography. Foot Ankle Int. 2021, 42, 1482–1490. [Google Scholar] [CrossRef]
- Brinch, S.; Wellenberg, R.H.H.; Boesen, M.P.; Maas, M.; Johannsen, F.E.; Nybing, J.U.; Turmezei, T.; Streekstra, G.J.; Hansen, P. Weight-bearing cone-beam CT: The need for standardised acquisition protocols and measurements to fulfill high expectations—A review of the literature. Skeletal Radiol. 2022, 52, 1073–1088. [Google Scholar] [CrossRef]
- Broos, M.; Berardo, S.; Dobbe, J.G.G.; Maas, M.; Streekstra, G.J.; Wellenberg, R.H.H. Geometric 3D analyses of the foot and ankle using weight-bearing and non weight-bearing cone-beam CT images: The new standard? Eur. J. Radiol. 2021, 138, 109674. [Google Scholar] [CrossRef]
- Campbell, T.; Mok, A.; Wolf, M.R.; Tarakemeh, A.; Everist, B.; Vopat, B.G. Augmented stress weightbearing CT for evaluation of subtle tibiofibular syndesmotic injuries in the elite athlete. Skeletal Radiol. 2023, 52, 1221–1227. [Google Scholar] [CrossRef]
- Faict, S.; Burssens, A.; Van Oevelen, A.; Maeckelbergh, L.; Mertens, P.; Buedts, K. Correction of ankle varus deformity using patient-specific dome-shaped osteotomy guides designed on weight-bearing CT: A pilot study. Arch. Orthop. Trauma Surg. 2023, 143, 791–799. [Google Scholar] [CrossRef]
- Foran, I.M.; Mehraban, N.; Jacobsen, S.K.; Bohl, D.D.; Lin, J.; Hamid, K.S.; Lee, S. Impact of Coleman Block Test on Adult Hindfoot Alignment Assessed by Clinical Examination, Radiography, and Weight-Bearing Computed Tomography. Foot Ankle Orthop. 2020, 5, 2473011420933264. [Google Scholar] [CrossRef]
- Fritz, B.; Fritz, J.; Fucentese, S.F.; Pfirrmann, C.W.A.; Sutter, R. Three-dimensional analysis for quantification of knee joint space width with weight-bearing CT: Comparison with non-weight-bearing CT and weight-bearing radiography. Osteoarthritis Cartilage 2022, 30, 671–680. [Google Scholar] [CrossRef]
- Kvarda, P.; Krähenbühl, N.; Susdorf, R.; Burssens, A.; Ruiz, R.; Barg, A.; Hintermann, B. High Reliability for Semiautomated 3D Measurements Based on Weightbearing CT Scans. Foot Ankle Int. 2022, 43, 91–95. [Google Scholar] [CrossRef]
- Ortolani, M.; Leardini, A.; Pavani, C.; Scicolone, S.; Girolami, M.; Bevoni, R.; Lullini, G.; Durante, S.; Berti, L.; Belvedere, C. Angular and linear measurements of adult flexible flatfoot via weight-bearing CT scans and 3D bone reconstruction tools. Sci. Rep. 2021, 11, 16139. [Google Scholar] [CrossRef]
- Pavani, C.; Belvedere, C.; Ortolani, M.; Girolami, M.; Durante, S.; Berti, L.; Leardini, A. 3D measurement techniques for the hindfoot alignment angle from weight-bearing CT in a clinical population. Sci. Rep. 2022, 12, 16900. [Google Scholar] [CrossRef]
- Richter, M.; Zech, S.; Naef, I.; Duerr, F.; Schilke, R. Automatic software-based 3D-angular measurement for weight-bearing CT (WBCT) is valid. Foot Ankle Surg. 2024. [Google Scholar] [CrossRef]
- Tazegul, T.E.; Anderson, D.D.; Barbachan Mansur, N.S.; Kajimura Chinelati, R.M.; Iehl, C.; VandeLune, C.; Ahrenholz, S.; Lalevee, M.; de Cesar Netto, C. An Objective Computational Method to Quantify Ankle Osteoarthritis From Low-Dose Weightbearing Computed Tomography. Foot Ankle Orthop. 2022, 7, 24730114221116805. [Google Scholar] [CrossRef]
- Zaidi, R.; Sangoi, D.; Cullen, N.; Patel, S.; Welck, M.; Malhotra, K. Semi-automated 3-dimensional analysis of the normal foot and ankle using weight bearing CT—A report of normal values and bony relationships. Foot Ankle Surg. 2023, 29, 111–117. [Google Scholar] [CrossRef]
- Zhong, Z.; Zhang, P.; Duan, H.; Yang, H.; Li, Q.; He, F. A Comparison Between X-ray Imaging and an Innovative Computer-aided Design Method Based on Weightbearing CT Scan Images for Assessing Hallux Valgus. J. Foot Ankle Surg. 2021, 60, 6–10. [Google Scholar] [CrossRef]
- Mys, K.; Varga, P.; Stockmans, F.; Gueorguiev, B.; Neumann, V.; Vanovermeire, O.; Wyers, C.E.; van den Bergh, J.P.W.; van Lenthe, G.H. High-Resolution Cone-Beam Computed Tomography is a Fast and Promising Technique to Quantify Bone Microstructure and Mechanics of the Distal Radius. Calcif. Tissue Int. 2021, 108, 314–323. [Google Scholar] [CrossRef]
- Hirschmann, A.; Pfirrmann, C.W.A.; Klammer, G.; Espinosa, N.; Buck, F.M. Upright cone CT of the hindfoot: Comparison of the non-weight-bearing with the upright weight-bearing position. Eur. Radiol. 2014, 24, 553–558. [Google Scholar] [CrossRef]
- Borel, C.; Larbi, A.; Delclaux, S.; Lapegue, F.; Chiavassa-Gandois, H.; Sans, N.; Faruch-Bilfeld, M. Diagnostic value of cone beam computed tomography (CBCT) in occult scaphoid and wrist fractures. Eur. J. Radiol. 2017, 97, 59–64. [Google Scholar] [CrossRef]
- Dartus, J.; Jacques, T.; Martinot, P.; Pasquier, G.; Cotten, A.; Migaud, H.; Morel, V.; Putman, S. The advantages of cone-beam computerised tomography (CT) in pain management following total knee arthroplasty, in comparison with conventional multi-detector CT. Orthop. Traumatol. Surg. Res. 2021, 107, 102874. [Google Scholar] [CrossRef]
- Jacques, T.; Morel, V.; Dartus, J.; Badr, S.; Demondion, X.; Cotten, A. Impact of introducing extremity cone-beam CT in an emergency radiology department: A population-based study. Orthop. Traumatol. Surg. Res. 2021, 107, 102834. [Google Scholar] [CrossRef]
- Ricci, P.M.; Boldini, M.; Bonfante, E.; Sambugaro, E.; Vecchini, E.; Schenal, G.; Magnan, B.; Montemezzi, S. Cone-beam computed tomography compared to X-ray in diagnosis of extremities bone fractures: A study of 198 cases. Eur. J. Radiol. Open 2019, 6, 119–121. [Google Scholar] [CrossRef]
- Doan, M.K.; Long, J.R.; Verhey, E.; Wyse, A.; Patel, K.; Flug, J.A. Cone-Beam CT of the Extremities in Clinical Practice. Radiographics 2024, 44, e230143. [Google Scholar] [CrossRef]
- Richter, M.; Lintz, F.; de Cesar Netto, C.; Barg, A.; Burssens, A. Results of more than 11,000 scans with weightbearing CT—Impact on costs, radiation exposure, and procedure time. Foot Ankle Surg. 2020, 26, 518–522. [Google Scholar] [CrossRef]
- Koivisto, J.; Kiljunen, T.; Kadesjö, N.; Shi, X.Q.; Wolff, J. Effective radiation dose of a MSCT, two CBCT and one conventional radiography device in the ankle region. J. Foot Ankle Res. 2015, 8, 8. [Google Scholar] [CrossRef]
- Mettler, F.A.; Huda, W.; Yoshizumi, T.T.; Mahesh, M. Effective doses in radiology and diagnostic nuclear medicine: A catalog. Radiology 2008, 248, 254–263. [Google Scholar] [CrossRef]
- Pugmire, B.S.; Shailam, R.; Sagar, P.; Liu, B.; Li, X.; Palmer, W.E.; Huang, A.J. Initial Clinical Experience With Extremity Cone-Beam CT of the Foot and Ankle in Pediatric Patients. AJR Am. J. Roentgenol. 2016, 206, 431–435. [Google Scholar] [CrossRef]
- Day, J.; de Cesar Netto, C.; Burssens, A.; Bernasconi, A.; Fernando, C.; Lintz, F. A Case-Control Study of 3D vs 2D Weightbearing CT Measurements of the M1-M2 Intermetatarsal Angle in Hallux Valgus. Foot Ankle Int. 2022, 43, 1049–1052. [Google Scholar] [CrossRef]
- Moore, C.S.; Wood, T.J.; Saunderson, J.R.; Beavis, A.W. A method to incorporate the effect of beam quality on image noise in a digitally reconstructed radiograph (DRR) based computer simulation for optimisation of digital radiography. Phys. Med. Biol. 2017, 62, 7379–7393. [Google Scholar] [CrossRef]
- de Cesar Netto, C.; Schon, L.C.; Thawait, G.K.; da Fonseca, L.F.; Chinanuvathana, A.; Zbijewski, W.B.; Siewerdsen, J.H.; Demehri, S. Flexible Adult Acquired Flatfoot Deformity: Comparison Between Weight-Bearing and Non-Weight-Bearing Measurements Using Cone-Beam Computed Tomography. J. Bone Jt. Surg. Am. 2017, 99, e98. [Google Scholar] [CrossRef]
- Page, M.J.; McKenzie, J.E.; Bossuyt, P.M.; Boutron, I.; Hoffmann, T.C.; Mulrow, C.D.; Shamseer, L.; Tetzlaff, J.M.; Akl, E.A.; Brennan, S.E.; et al. The PRISMA 2020 statement: An updated guideline for reporting systematic reviews. Syst. Rev. 2021, 10, 89. [Google Scholar] [CrossRef]
- Lintz, F.; Bernasconi, A.; Ferkel, E.I. Can Weight-Bearing Computed Tomography Be a Game-Changer in the Assessment of Ankle Sprain and Ankle Instability? Foot Ankle Clin. 2023, 28, 283–295. [Google Scholar] [CrossRef]
- Richter, M.; Lintz, F.; Zech, S.; Meissner, S.A. Combination of PedCAT Weightbearing CT With Pedography Assessment of the Relationship Between Anatomy-Based Foot Center and Force/Pressure-Based Center of Gravity. Foot Ankle Int. 2018, 39, 361–368. [Google Scholar] [CrossRef]
- de Cesar Netto, C.; Godoy-Santos, A.L.; Saito, G.H.; Lintz, F.; Siegler, S.; O’Malley, M.J.; Deland, J.T.; Ellis, S.J. Subluxation of the Middle Facet of the Subtalar Joint as a Marker of Peritalar Subluxation in Adult Acquired Flatfoot Deformity: A Case-Control Study. J. Bone Jt. Surg. Am. 2019, 101, 1838–1844. [Google Scholar] [CrossRef]
- de Cesar Netto, C.; Myerson, M.S.; Day, J.; Ellis, S.J.; Hintermann, B.; Johnson, J.E.; Sangeorzan, B.J.; Schon, L.C.; Thordarson, D.B.; Deland, J.T. Consensus for the Use of Weightbearing CT in the Assessment of Progressive Collapsing Foot Deformity. Foot Ankle Int. 2020, 41, 1277–1282. [Google Scholar] [CrossRef]
- Lintz, F.; Bernasconi, A.; Baschet, L.; Fernando, C.; Mehdi, N.; Weight Bearing CT International Study Group; de Cesar Netto, C. Relationship Between Chronic Lateral Ankle Instability and Hindfoot Varus Using Weight-Bearing Cone Beam Computed Tomography. Foot Ankle Int. 2019, 40, 1175–1181. [Google Scholar] [CrossRef]
- Lintz, F.; Welck, M.; Bernasconi, A.; Thornton, J.; Cullen, N.P.; Singh, D.; Goldberg, A. 3D Biometrics for Hindfoot Alignment Using Weightbearing CT. Foot Ankle Int. 2017, 38, 684–689. [Google Scholar] [CrossRef]
- Peiffer, M.; Burssens, A.; De Mits, S.; Heintz, T.; Van Waeyenberge, M.; Buedts, K.; Victor, J.; Audenaert, E. Statistical shape model-based tibiofibular assessment of syndesmotic ankle lesions using weight-bearing CT. J. Orthop. Res. 2022, 40, 2873–2884. [Google Scholar] [CrossRef]
- Burssens, A.; Krähenbühl, N.; Lenz, A.L.; Howell, K.; Zhang, C.; Sripanich, Y.; Saltzman, C.L.; Barg, A. Interaction of loading and ligament injuries in subtalar joint instability quantified by 3D weightbearing computed tomography. J. Orthop. Res. 2022, 40, 933–944. [Google Scholar] [CrossRef]
- Burssens, A.; Vermue, H.; Barg, A.; Krähenbühl, N.; Victor, J.; Buedts, K. Templating of Syndesmotic Ankle Lesions by Use of 3D Analysis in Weightbearing and Nonweightbearing CT. Foot Ankle Int. 2018, 39, 1487–1496. [Google Scholar] [CrossRef]
- Day, J.; de Cesar Netto, C.; Richter, M.; Mansur, N.S.; Fernando, C.; Deland, J.T.; Ellis, S.J.; Lintz, F. Evaluation of a Weightbearing CT Artificial Intelligence-Based Automatic Measurement for the M1-M2 Intermetatarsal Angle in Hallux Valgus. Foot Ankle Int. 2021, 42, 1502–1509. [Google Scholar] [CrossRef]
- Richter, M.; Duerr, F.; Schilke, R.; Zech, S.; Meissner, S.A.; Naef, I. Semi-automatic software-based 3D-angular measurement for Weight-Bearing CT (WBCT) in the foot provides different angles than measurement by hand. Foot Ankle Surg. 2022, 28, 919–927. [Google Scholar] [CrossRef]
- Sangoi, D.; Ranjit, S.; Bernasconi, A.; Cullen, N.; Patel, S.; Welck, M.; Malhotra, K. 2D Manual vs 3D Automated Assessment of Alignment in Normal and Charcot-Marie-Tooth Cavovarus Feet Using Weightbearing CT. Foot Ankle Int. 2022, 43, 973–982. [Google Scholar] [CrossRef]
- de Carvalho, K.A.M.; Walt, J.S.; Ehret, A.; Tazegul, T.E.; Dibbern, K.; Mansur, N.S.B.; Lalevée, M.; de Cesar Netto, C. Comparison between Weightbearing-CT semiautomatic and manual measurements in Hallux Valgus. Foot Ankle Surg. 2022, 28, 518–525. [Google Scholar] [CrossRef]
- Krähenbühl, N.; Kvarda, P.; Susdorf, R.; Burssens, A.; Ruiz, R.; Barg, A.; Hintermann, B. Assessment of Progressive Collapsing Foot Deformity Using Semiautomated 3D Measurements Derived from Weightbearing CT Scans. Foot Ankle Int. 2022, 43, 363–370. [Google Scholar] [CrossRef]
- Mens, M.A.; Bouman, C.M.B.; Dobbe, J.G.G.; Bus, S.A.; Nieuwdorp, M.; Maas, M.; Wellenberg, R.H.H.; Streekstra, G.J. Metatarsophalangeal and interphalangeal joint angle measurements on weight-bearing CT images. Foot Ankle Surg. 2023, 29, 538–543. [Google Scholar] [CrossRef]
- Rowe, N.; Robertson, C.E.; Singh, S.; Campbell, J.T.; Jeng, C.L. Weightbearing CT Analysis of the Transverse Tarsal Joint During Eversion and Inversion. Foot Ankle Int. 2022, 43, 123–130. [Google Scholar] [CrossRef]
- Bernasconi, A.; Cooper, L.; Lyle, S.; Patel, S.; Cullen, N.; Singh, D.; Welck, M. Pes cavovarus in Charcot-Marie-Tooth compared to the idiopathic cavovarus foot: A preliminary weightbearing CT analysis. Foot Ankle Surg. 2021, 27, 186–195. [Google Scholar] [CrossRef]
- Carrara, C.; Belvedere, C.; Caravaggi, P.; Durante, S.; Leardini, A. Techniques for 3D foot bone orientation angles in weight-bearing from cone-beam computed tomography. Foot Ankle Surg. 2021, 27, 168–174. [Google Scholar] [CrossRef]
- Sripanich, Y.; Weinberg, M.; Krähenbühl, N.; Rungprai, C.; Saltzman, C.L.; Barg, A. Change in the First Cuneiform-Second Metatarsal Distance After Simulated Ligamentous Lisfranc Injury Evaluated by Weightbearing CT Scans. Foot Ankle Int. 2020, 41, 1432–1441. [Google Scholar] [CrossRef]
- Burssens, A.; Peeters, J.; Peiffer, M.; Marien, R.; Lenaerts, T.; WBCT ISG; Vandeputte, G.; Victor, J. Reliability and correlation analysis of computed methods to convert conventional 2D radiological hindfoot measurements to a 3D setting using weightbearing CT. Int. J. Comput. Assist. Radiol. Surg. 2018, 13, 1999–2008. [Google Scholar] [CrossRef]
- Richter, M.; Zech, S.; Hahn, S.; Naef, I.; Merschin, D. Combination of pedCAT® for 3D Imaging in Standing Position With Pedography Shows No Statistical Correlation of Bone Position With Force/Pressure Distribution. J. Foot Ankle Surg. 2016, 55, 240–246. [Google Scholar] [CrossRef]
- Kleipool, R.P.; Dahmen, J.; Vuurberg, G.; Oostra, R.J.; Blankevoort, L.; Knupp, M.; Stufkens, S.A.S. Study on the three-dimensional orientation of the posterior facet of the subtalar joint using simulated weight-bearing CT. J. Orthop. Res. 2019, 37, 197–204. [Google Scholar] [CrossRef]
- Turmezei, T.D.; Malhotra, K.; MacKay, J.W.; Gee, A.H.; Treece, G.M.; Poole, K.E.S.; Welck, M.J. 3-D joint space mapping at the ankle from weight-bearing CT: Reproducibility, repeatability, and challenges for standardisation. Eur. Radiol. 2023, 33, 8333–8342. [Google Scholar] [CrossRef]
- Bernasconi, A.; De Cesar Netto, C.; Siegler, S.; Jepsen, M.; Lintz, F.; International Weight-Bearing CT Society. Weightbearing CT assessment of foot and ankle joints in Pes Planovalgus using distance mapping. Foot Ankle Surg. 2022, 28, 775–784. [Google Scholar] [CrossRef]
- Lintz, F.; Jepsen, M.; De Cesar Netto, C.; Bernasconi, A.; Ruiz, M.; Siegler, S.; International Weight-Bearing CT Society. Distance mapping of the foot and ankle joints using weightbearing CT: The cavovarus configuration. Foot Ankle Surg. 2021, 27, 412–420. [Google Scholar] [CrossRef]
- Day, M.A.; Ho, M.; Dibbern, K.; Rao, K.; An, Q.; Anderson, D.D.; Marsh, J.L. Correlation of 3D Joint Space Width From Weightbearing CT With Outcomes After Intra-articular Calcaneal Fracture. Foot Ankle Int. 2020, 41, 1106–1116. [Google Scholar] [CrossRef]
- Peiffer, M.; Ghandour, S.; Nassour, N.; Taseh, A.; Burssens, A.; Waryasz, G.; Bejarano-Pineda, L.; Audenaert, E.; Ashkani-Esfahani, S.; DiGiovanni, C.W. Normative contact mechanics of the ankle Joint: Quantitative assessment utilizing bilateral weightbearing CT. J. Biomech. 2024, 168, 112136. [Google Scholar] [CrossRef]
- Behrens, A.; Dibbern, K.; Lalevée, M.; Alencar Mendes de Carvalho, K.; Lintz, F.; Barbachan Mansur, N.S.; de Cesar Netto, C. Coverage maps demonstrate 3D Chopart joint subluxation in weightbearing CT of progressive collapsing foot deformity. Sci. Rep. 2022, 12, 19367. [Google Scholar] [CrossRef]
- Bhimani, R.; Sornsakrin, P.; Ashkani-Esfahani, S.; Lubberts, B.; Guss, D.; De Cesar Netto, C.; Waryasz, G.R.; Kerkhoffs, G.M.M.J.; DiGiovanni, C.W. Using area and volume measurement via weightbearing CT to detect Lisfranc instability. J. Orthop. Res. 2021, 39, 2497–2505. [Google Scholar] [CrossRef]
- Ashkani Esfahani, S.; Bhimani, R.; Lubberts, B.; Kerkhoffs, G.M.; Waryasz, G.; DiGiovanni, C.W.; Guss, D. Volume measurements on weightbearing computed tomography can detect subtle syndesmotic instability. J. Orthop. Res. 2022, 40, 460–467. [Google Scholar] [CrossRef]
- Bhimani, R.; Ashkani-Esfahani, S.; Lubberts, B.; Guss, D.; Hagemeijer, N.C.; Waryasz, G.; DiGiovanni, C.W. Utility of Volumetric Measurement via Weight-Bearing Computed Tomography Scan to Diagnose Syndesmotic Instability. Foot Ankle Int. 2020, 41, 859–865. [Google Scholar] [CrossRef]
- Ashkani-Esfahani, S.; Lucchese, O.; Bhimani, R.; Taseh, A.; Waryasz, G.; Kerkhoffs, G.M.M.; Maas, M.; DiGiovanni, C.W.; Guss, D. Automation improves the efficiency of weightbearing CT scan 3D volumetric assessments of the syndesmosis. Foot Ankle Surg. 2024, in press. [Google Scholar] [CrossRef]
- Peña Fernández, M.; Hoxha, D.; Chan, O.; Mordecai, S.; Blunn, G.W.; Tozzi, G.; Goldberg, A. Centre of Rotation of the Human Subtalar Joint Using Weight-Bearing Clinical Computed Tomography. Sci. Rep. 2020, 10, 1035. [Google Scholar] [CrossRef]
- Zeitlin, J.; Henry, J.; Ellis, S. Preoperative Guidance With Weight-Bearing Computed Tomography and Patient-Specific Instrumentation in Foot and Ankle Surgery. HSS J. 2021, 17, 326–332. [Google Scholar] [CrossRef]
- Thompson, M.J.; Consul, D.; Umbel, B.D.; Berlet, G.C. Accuracy of Weightbearing CT Scans for Patient-Specific Instrumentation in Total Ankle Arthroplasty. Foot Ankle Orthop. 2021, 6, 24730114211061493. [Google Scholar] [CrossRef]
- Segal, N.A.; Nevitt, M.C.; Lynch, J.A.; Niu, J.; Torner, J.C.; Guermazi, A. Diagnostic performance of 3D standing CT imaging for detection of knee osteoarthritis features. Phys. Sportsmed. 2015, 43, 213–220. [Google Scholar] [CrossRef]
- Krähenbühl, N.; Bailey, T.L.; Weinberg, M.W.; Davidson, N.P.; Hintermann, B.; Presson, A.P.; Allen, C.M.; Henninger, H.B.; Saltzman, C.L.; Barg, A. Impact of Torque on Assessment of Syndesmotic Injuries Using Weightbearing Computed Tomography Scans. Foot Ankle Int. 2019, 40, 710–719. [Google Scholar] [CrossRef]
- Krähenbühl, N.; Bailey, T.L.; Presson, A.P.; Allen, C.M.; Henninger, H.B.; Saltzman, C.L.; Barg, A. Torque application helps to diagnose incomplete syndesmotic injuries using weight-bearing computed tomography images. Skeletal Radiol. 2019, 48, 1367–1376. [Google Scholar] [CrossRef]
- de Cesar Netto, C.; Day, J.; Godoy-Santos, A.L.; Roney, A.; Barbachan Mansur, N.S.; Lintz, F.; Ellis, S.J.; Demetracopoulos, C.A. The use of three-dimensional biometric Foot and Ankle Offset to predict additional realignment procedures in total ankle replacement. Foot Ankle Surg. 2022, 28, 1029–1034. [Google Scholar] [CrossRef]
- Lintz, F.; Mast, J.; Bernasconi, A.; Mehdi, N.; de Cesar Netto, C.; Fernando, C.; International Weight-Bearing CT Society; Buedts, K. 3D, Weightbearing Topographical Study of Periprosthetic Cysts and Alignment in Total Ankle Replacement. Foot Ankle Int. 2020, 41, 1–9. [Google Scholar] [CrossRef]
- Colin, F.; Horn Lang, T.; Zwicky, L.; Hintermann, B.; Knupp, M. Subtalar joint configuration on weightbearing CT scan. Foot Ankle Int. 2014, 35, 1057–1062. [Google Scholar] [CrossRef]
- Sandberg, O.H.; Kärrholm, J.; Olivecrona, H.; Röhrl, S.M.; Sköldenberg, O.G.; Brodén, C. Computed tomography-based radiostereometric analysis in orthopedic research: Practical guidelines. Acta Orthop. 2023, 94, 373–378. [Google Scholar] [CrossRef]
- Kaptein, B.L.; Pijls, B.; Koster, L.; Kärrholm, J.; Hull, M.; Niesen, A.; Heesterbeek, P.; Callary, S.; Teeter, M.; Gascoyne, T.; et al. Guideline for RSA and CT-RSA implant migration measurements: An update of standardizations and recommendations. Acta Orthop. 2024, 95, 256–267. [Google Scholar] [CrossRef]
- Burssens, A.; Peeters, J.; Buedts, K.; Victor, J.; Vandeputte, G. Measuring hindfoot alignment in weight bearing CT: A novel clinical relevant measurement method. Foot Ankle Surg. 2016, 22, 233–238. [Google Scholar] [CrossRef]
- Lenz, A.L.; Strobel, M.A.; Anderson, A.M.; Fial, A.V.; MacWilliams, B.A.; Krzak, J.J.; Kruger, K.M. Assignment of local coordinate systems and methods to calculate tibiotalar and subtalar kinematics: A systematic review. J. Biomech. 2021, 120, 110344. [Google Scholar] [CrossRef]
- Bernasconi, A.; Cooper, L.; Lyle, S.; Patel, S.; Cullen, N.; Singh, D.; Welck, M. Intraobserver and interobserver reliability of cone beam weightbearing semi-automatic three-dimensional measurements in symptomatic pes cavovarus. Foot Ankle Surg. 2020, 26, 564–572. [Google Scholar] [CrossRef]
- Turmezei, T.D.; Low, S.B.; Rupret, S.; Treece, G.M.; Gee, A.H.; MacKay, J.W.; Lynch, J.A.; Poole, K.E.; Segal, N.A. Multiparametric 3-D analysis of bone and joint space width at the knee from weight bearing computed tomography. Osteoarthr. Imaging 2022, 2, 100069. [Google Scholar] [CrossRef]
- Kothari, M.D.; Rabe, K.G.; Anderson, D.D.; Nevitt, M.C.; Lynch, J.A.; Segal, N.A.; Franz, H. The Relationship of Three-Dimensional Joint Space Width on Weight Bearing CT With Pain and Physical Function. J. Orthop. Res. 2019, 38, 1333–1339. [Google Scholar] [CrossRef]
- Probasco, W.; Haleem, A.M.; Yu, J.; Sangeorzan, B.J.; Deland, J.T.; Ellis, S.J. Assessment of coronal plane subtalar joint alignment in peritalar subluxation via weight-bearing multiplanar imaging. Foot Ankle Int. 2015, 36, 302–309. [Google Scholar] [CrossRef]
- Ananthakrisnan, D.; Ching, R.; Tencer, A.; Hansen, S.T.J.; Sangeorzan, B.J. Subluxation of the talocalcaneal joint in adults who have symptomatic flatfoot. J. Bone Jt. Surg. Am. 1999, 81, 1147–1154. [Google Scholar] [CrossRef]
- Dibbern, K.N.; Li, S.; Vivtcharenko, V.; Auch, E.; Lintz, F.; Ellis, S.J.; Femino, J.E.; de Cesar Netto, C. Three-Dimensional Distance and Coverage Maps in the Assessment of Peritalar Subluxation in Progressive Collapsing Foot Deformity. Foot Ankle Int. 2021, 42, 757–767. [Google Scholar] [CrossRef]
- Krähenbühl, N.; Akkaya, M.; Dodd, A.E.; Hintermann, B.; Dutilh, G.; Lenz, A.L.; Barg, A.; International Weight Bearing CT Society. Impact of the rotational position of the hindfoot on measurements assessing the integrity of the distal tibio-fibular syndesmosis. Foot Ankle Surg. 2020, 26, 810–817. [Google Scholar] [CrossRef]
- de Cesar Netto, C. CORR Insights®: Can Weightbearing Cone-beam CT Reliably Differentiate Between Stable and Unstable Syndesmotic Ankle Injuries? A Systematic Review and Meta-Analysis. Clin. Orthop. Relat. Res. 2022, 480, 1563–1565. [Google Scholar] [CrossRef]
- Shakoor, D.; Osgood, G.M.; Brehler, M.; Zbijewski, W.B.; de Cesar Netto, C.; Shafiq, B.; Orapin, J.; Thawait, G.K.; Shon, L.C.; Demehri, S. Cone-beam CT measurements of distal tibio-fibular syndesmosis in asymptomatic uninjured ankles: Does weight-bearing matter? Skeletal Radiol. 2019, 48, 583–594. [Google Scholar] [CrossRef]
- Auch, E.; Barbachan Mansur, N.S.; Alexandre Alves, T.; Cychosz, C.; Lintz, F.; Godoy-Santos, A.L.; Baumfeld, D.S.; de Cesar Netto, C. Distal Tibiofibular Syndesmotic Widening in Progressive Collapsing Foot Deformity. Foot Ankle Int. 2021, 42, 768–775. [Google Scholar] [CrossRef]


Disclaimer/Publisher’s Note: The statements, opinions and data contained in all publications are solely those of the individual author(s) and contributor(s) and not of MDPI and/or the editor(s). MDPI and/or the editor(s) disclaim responsibility for any injury to people or property resulting from any ideas, methods, instructions or products referred to in the content. |
© 2024 by the authors. Licensee MDPI, Basel, Switzerland. This article is an open access article distributed under the terms and conditions of the Creative Commons Attribution (CC BY) license (https://creativecommons.org/licenses/by/4.0/).
Share and Cite
Lintz, F.; de Cesar Netto, C.; Belvedere, C.; Leardini, A.; Bernasconi, A.; on behalf of the International Weight-Bearing CT Society. Recent Innovations Brought about by Weight-Bearing CT Imaging in the Foot and Ankle: A Systematic Review of the Literature. Appl. Sci. 2024, 14, 5562. https://doi.org/10.3390/app14135562
Lintz F, de Cesar Netto C, Belvedere C, Leardini A, Bernasconi A, on behalf of the International Weight-Bearing CT Society. Recent Innovations Brought about by Weight-Bearing CT Imaging in the Foot and Ankle: A Systematic Review of the Literature. Applied Sciences. 2024; 14(13):5562. https://doi.org/10.3390/app14135562
Chicago/Turabian StyleLintz, François, Cesar de Cesar Netto, Claudio Belvedere, Alberto Leardini, Alessio Bernasconi, and on behalf of the International Weight-Bearing CT Society. 2024. "Recent Innovations Brought about by Weight-Bearing CT Imaging in the Foot and Ankle: A Systematic Review of the Literature" Applied Sciences 14, no. 13: 5562. https://doi.org/10.3390/app14135562