Article

Impact of Prolonged Screening and COVID-19 Infection on Acquired Colour Vision Deficiencies Assessed by the Farnsworth–Munsell 100 Hue Test

by
María Moncho Santonja
*,
Jorge Jordán
,
Bárbara Micó
,
Daniel López
,
Ignacio Tortajada Montañana
and
Guillermo Peris-Fajarnés
Research Center in Graphical Technologies (CITG), Universitat Politècnica de València, 46022 Valencia, Spain
*
Author to whom correspondence should be addressed.
Appl. Sci. 2024, 14(13), 5563; https://doi.org/10.3390/app14135563
Submission received: 15 April 2024 / Revised: 20 May 2024 / Accepted: 21 June 2024 / Published: 26 June 2024

Abstract

:
Over the past decade, global screening time has increased, a trend intensified by the COVID-19 pandemic, leading to the integration of screens into daily life. Studies have documented the adverse effects of prolonged screening on ocular health and binocular vision, such as dry eye syndrome, blurry vision, headaches, myopia, and visual fatigue. However, it remains unclear if prolonged screening affects the development of colour vision defects. Objectives: This study aimed to determine the relationship between (a) prolonged screening and acquired colour vision deficiencies and (b) COVID-19 infection and acquired colour vision deficiencies. Methods: A population of 50 individuals with normal trichromatic vision, aged 20 to 30 years, with an average daily screening time of 516.7 min, was evaluated. Participants were initially screened using the Ishihara 32-plate Test to exclude those with congenital colour vision deficiencies. The Farnsworth–Munsell 100 Hue Test (FM100H) and Square Root Total Error Score (√TES) were used to evaluate acquired colour vision deficiencies under standardized conditions. The dataset underwent dual analysis: (1) detailed statistical scrutiny and (2) comparison of √TES values with historical data from 1982, 1991, 2001, and 2002. Results: The global group had a √TES (Mean ± SD) of 5.40 ± 1.58, the COVID-19 subgroup 5.46 ± 1.62, and the non-COVID-19 subgroup 5.32 ± 1.51. No significant differences were found between the √TES values from this population and those reported in previous studies. Statistical analysis showed no significant correlation between gender and COVID-19 infection with √TES values. Conclusions: Neither screening time nor COVID-19 infection appears to significantly impact the occurrence of permanently acquired colour vision deficiencies in individuals aged 20 to 30 years.

1. Introduction

It is logical to consider the 21st century as the cradle of the digital era. Over the last decade, the proliferation of data display screens has significantly transformed our patterns of work, study, consumption, leisure, and entertainment. The frequency and duration of screen use have escalated considerably over the years. The COVID-19 pandemic has further intensified the global reliance on digital screens across virtually all social sectors. This shift in behaviour and lifestyle habits has led to a substantial increase in daily screen time.
Numerous studies have quantified and characterised this rise in screen usage. For instance, Serra et al. [1] found that during the confinement period, 145 adolescents from an Italian region increased their smartphone use by 55%, exceeding four hours daily. In India, Priya et al. [2] observed that the average smartphone usage jumped from 2.4 h pre-pandemic to 6.9 h post-pandemic. Similarly, Sañudo et al. [3] noted a daily increase of over 120 min in smartphone usage among 22 students in Seville, aged 20 to 36, both before and after the pandemic. On a global scale, Olson et al. [4] highlighted a problematic and exponential increase in mobile device addiction across 24 countries.
With the surge in digital screen use, researchers and experts have explored whether prolonged screen time compromises ocular health and vision. Wang et al. [5], in their study of 27,000 individuals under 26, reported that excessive screen use could lead to increased myopia and blurry vision in children. Chidi-Egboka et al. [6] found a direct link between smartphone gaming and dry eye. Numerous other studies have reinforced the idea that excessive screen use can affect binocular vision, increase myopia, cause tear film instability, and induce ocular fatigue, among other issues [7,8,9,10,11].
Despite the substantial body of research linking screen time to ocular health, there have been no studies directly examining the impact of prolonged screen use on colour vision or the potential increase in acquired colour vision deficiencies. Additionally, the effects of COVID-19 infection on colour vision have not been a primary focus of research. While most studies on ocular manifestations of COVID-19 [12] do not address colour discrimination, Paramei et al. [13] noted a potential short-term effect on colour vision, which was transient and reversible.
There is a significant gap in the literature concerning the relationship between prolonged screen use and colour vision capacity, as well as the impact of COVID-19 infection on colour vision alterations. Therefore, this study aims to contribute to and expand the knowledge in these under-researched areas.
According to De Valois and Webster [14], colour vision is the ability to distinguish objects based on the wavelengths they emit or reflect. For colour vision to occur, interactions between several elements are essential: an object, a light source, and an observer (eye and brain) [15,16]. Understanding the anatomical, physiological, and functional aspects of normal human colour vision is particularly relevant to this study.
Normal human colour vision is trichromatic [17], meaning all colours can be created by mixing three primary colours. The photoreceptor cells responsible for trichromatic vision are cones [18]. The human eye has three types of cones: short-wavelength (S-), medium-wavelength (M-), and long-wavelength (L-) sensitive cones [19]. These cones have distinct spectral sensitivities, with peak sensitivities around 419 nm, 531 nm, and 558 nm for S, M, and L cones, respectively [20]. S-cones represent 7–10% of the total, while M and L cones vary widely, with M:L ratios ranging from 1:1 to 1:18 [21,22].
Each cone contains a type of photopigment that determines its spectral sensitivity. The proportions and types of photopigments are genetically encoded. M and L photopigments are encoded on the X chromosome, while S photopigments are encoded on chromosome 7 [23]. Alterations in the genetic coding of these photopigments result in colour vision deficiencies.
Colour vision defects are generally classified as congenital or acquired [19,24]. Congenital disabilities arise from genetic alterations of photopigments and are present from birth, remaining stable throughout life. These defects are binocular and predominantly affect M and L mechanisms, leading to red and green deficiencies [25]. Due to their X-linked inheritance, congenital disabilities are more common in males (8%) than in females (0.5%) [26].
Acquired colour vision defects typically affect the S mechanism, leading to blue-yellow deficiencies [27]. These defects can develop due to external factors and are not sex-dependent. They can vary over time and manifest monocularly or binocularly. Factors causing acquired colour vision deficiencies include diseases like Parkinson’s [28,29,30], Alzheimer’s [31], diabetes [32], immune system infections [33], retinal damage, antibiotic use, hypertension medications, optic neuropathies [34], exposure to industrial chemicals [35], and hypoxic environments [36].
Given the diverse aetiology of acquired colour vision deficiencies, it is plausible that COVID-19 infection and prolonged exposure to digital screens could increase their occurrence.
To identify and classify congenital and acquired vision deficiencies, various colour vision tests are available. These tests can be categorised into three groups: discrimination tests, matching tests, and detection tests [19].
Discrimination tests include:
Pseudoisochromatic Plates Tests: These use sets of plates with coloured figures that are perceived differently depending on the colour vision defect. They detect and differentiate various congenital colour vision deficiencies.
Arrangement or Hue Discrimination Tests: These involve arranging colours in a gradual progression, detecting both congenital and acquired colour vision defects, and assessing a subject’s ability to discriminate tones across different spectral ranges.
To assess congenital disabilities, the most commonly used test is the Ishihara-32 Plates Test [37,38,39]. This test accurately identifies congenital colour vision deficiencies, detecting total weakness and red-green deficiencies. Normal subjects see the indicated figure, while colour-deficient individuals see a different figure, identifying Protan (red deficiency) and Deutran (green deficiency) subjects.
For detecting acquired colour vision deficiencies and assessing chromatic discrimination ability, the Farnsworth-Munsell 100 Hue Test is highly recommended [19,40]. This test consists of 93 Munsell colour samples arranged in a sequence. Subjects arrange the caps by hue between fixed reference samples. The Total Error Score (TES) and its derivatives are used to evaluate outcomes [41]. The Square Root of the Total Error Score (√TES) provides a normal distribution of errors. A radial diagram chart represents individual cap scores [42]. √TES values categorise colour discrimination ability as Superior (0–16), Average (20–100), and Low (>100) [43]. The orientation of axes in the radial diagram determines the type (Protan, Deutran, or Tritan) and severity of the deficiency.
This study focused on analysing acquired colour vision deficiencies caused by prolonged screen use or COVID-19 infection, selecting only normal trichromats (without congenital disabilities). The Ishihara-32 Plates Test was used to exclude subjects with congenital colour vision defects, and the Farnsworth–Munsell 100 Hue Test was employed to detect acquired deficiencies.
A literature review of previous scientific studies on colour vision and international standards for colour vision assessment informed the selection of these tests. ASTM Standard E1499-16 provides robust procedures for selecting and evaluating observers, recommending the Ishihara Test for detecting congenital vision defects and the Farnsworth–Munsell 100 Hue Test for detailed colour discrimination measurement.
Both tests are widely used to assess colour vision abilities in various occupational groups [44] and to study the relationship between colour vision alterations and diseases such as hypothyroidism [45], pituitary adenoma [46], and prosopagnosia [47]. Data from previous studies [43,48,49,50] conducted before the rise of digital screens and the onset of COVID-19 will serve as control and comparison data for this research.

2. Materials and Methods

2.1. Participants

The study was conducted based on data collected through an anonymised questionnaire administered to final-year university students. A total of 50 subjects were recruited, comprising 29 males and 21 females, with 31 subjects reporting a history of COVID-19 infection and 19 reporting no history of COVID-19 infection.
Considering an infinite population (over 100,000 subjects), a risk level of 0.05 (Z = 1.645) is accepted, and a power of 90% (Z = 1.282) is established. The expected standard deviation, derived from previously published studies, is defined as 1.58. The event magnitude is set at 1.5. The minimum sample size obtained is 19 individuals.
None of the individuals tested had previously been examined using the Farnsworth–Munsell Test or the Ishihara Test.
In the questionnaire, participants provided their age and biological sex (XX, XY) at birth. The ages of the participants ranged from 21 to 30 years, with an average age of 22.12 years. Each participant also indicated whether they had any known congenital vision anomalies and if they had been infected with COVID-19. Additionally, participants recorded their average daily smartphone screen time, average daily laptop screen time, and estimated average daily screen time from other sources (e.g., TV). They also reported the number of hours slept on the day of the test.
The average daily smartphone screen time was found to be 276.7 min, while the average daily laptop screen time was 202.4 min. The average daily screen time from other sources was negligible, at 0.63 min. Consequently, the average total screening time per day across all devices was calculated to be 516.7 min.
No subject reported congenital colour vision anomalies, mostly because they were unaware if they had any. To further characterise and identify possible congenital anomalies, all participants underwent Ishihara’s Test 32 Plates Edition, but no congenital anomalies were detected. However, it should be noted that Ishihara’s Test may introduce a bias due to its limitations in detecting yellow-blue congenital deficiencies. Nevertheless, the introduced bias can be considered null since the incidence of congenital disabilities affecting blue-yellow vision is virtually nonexistent. Additionally, participants provided information regarding their myopia, astigmatism, or hyperopia status and if corrective glasses were used while being tested.
All participants were informed about the potential use of their data in the study. Before beginning the testing, all students provided written informed consent.

2.2. Tools for Testing

2.2.1. Ishihara 32 Plates Edition

For the detection and exclusion of subjects with congenital colour vision deficiencies, the Ishihara 32 Plates Edition was used.
It was administered to all subjects in both physical and digital formats. Data obtained from the physical format testing was used to decide subject inclusion or exclusion.
Data obtained from the digital format was used to validate the Online Ishihara Test’s usefulness as a tool for detecting congenital disabilities.
Physical format support: Ishihara Test for Colour Deficiency 32 Plates Edition, manufactured by Kanehara Trading Inc. (Tokyo, Japan), was employed in this study. Each plate measured 196 mm × 150 mm in dimensions.
Digital format support: The Ishihara’s 32 Plates CVD Test [51] (online), developed by Colblindor, featuring 32 plates, was used. Clear instructions for its administration were provided prior start of testing, and the results were duly recorded and made accessible for consultation. All subjects performed the test on an Apple iPad Mini 4 (Apple Inc., Cupertino, CA, USA) with the iOS 12 operating system. The device orientation was vertical, and it did not have any screen protector. Battery-saving mode was disabled. The screen was a 7.9-inch backlit LED LCD with a resolution of 324 pixels per inch. The screen settings and brightness were set to a clear appearance, maximum brightness, no increased contrast, no colour filters, no reduction of bright colour intensity, and no automatic brightness adjustment. The colour depth was 24 bits. The device was connected to a power source throughout the entire test. As described by Almustanyir et al. [52], iPad devices could be used to evaluate Colour Vision Tests.

2.2.2. Farnsworth–Munsell 100 Hue Test

The Farnsworth–Munsell 100-Hue Test, developed by Munsell Colour Inc. (Boston, MA, USA), was utilised in this study. It comprises four boxes with a matte black background, each corresponding to four ranges of cap arrangement.

2.3. Environment Conditions and Testing Procedures

Both the Ishihara Test and the Farnsworth–Munsell 100-Hue Test were evaluated under controlled lighting and geometric conditions. The instructions outlined in the Farnsworth–Munsell 100-Hue Test manual [40] and the recommendations specified in ISO 23603 [53] were strictly followed in all testing procedures.
The laboratory setting featured a windowless environment devoid of uncontrolled light sources. A VeriVide VL120 lighting screen (VeriVide Limited, Leicester, UK) served as the illuminant for conducting the tests. This screen was equipped with D65 light sources, boasting a colour temperature of 6500 K and a Colour Rendering Index > 95. D65 lighting mimics the spectral energy distribution of average daylight.
The lighting screen measured 1335 mm × 740 mm, covering the entirety of the working field. Photometric conditions, specifically illuminance, were meticulously measured, recorded, and adjusted in accordance with the technical usage guide of the Illuminometer Model 5200 (Kyoritsu Electrical Instruments Works, Ltd., Tokyo, Japan). The lighting level remained consistently between 1250 lx and 1320 lx across the working area throughout the testing process. Surrounding and ambient conditions were meticulously maintained to meet specifications, with all adjacent walls painted in a neutral grey equivalent to Munsell N5–N7.
To ensure optimal standardisation, the lighting screen was positioned 80 cm (32″) above the viewing surface, parallel to it (creating an illumination angle of 90°). The working area was centrally located on the lighting screen and covered with a matte black surface to eliminate any reflections.
For test execution, subjects were seated on a rigid grey chair that provided an optimal distance of approximately 50 cm between their eyes and the Farnsworth-Munsell Test. This setup ensured an ideal viewing angle of the colour samples.
All subjects underwent testing on the same date in March, within the time interval of 15:00–18:00, in Spain (Europe). An anonymised questionnaire was simultaneously distributed to collect the required data and test results.
In order to minimise performance bias, the same testing protocol described in the studies with which the obtained results will be compared has been followed, along with the recommendations specified in international standards.
The testing sequence commenced with the administration of Ishihara’s Tests for Colour Deficiency 32 Plates Edition. Subjects were seated in a chair and positioned the book approximately 80 cm from their eyes. They verbally communicated the result for each plate, which was then recorded by an assistant. Following this, subjects proceeded to undertake the online Ishihara Test, with self-recording of results in the questionnaire.
A 10-min interval, during which subjects refrained from viewing screens or coloured surfaces, was observed after the completion of the online test. Subsequently, subjects were prepared for the Farnsworth–Munsell 100 Hue Test. The four boxes containing unordered chips on the top and fixed samples on the bottom were opened. Subjects arranged the chips without a time constraint and recorded the result for each box in the questionnaire.
The data (caps order) recorded for each test were input into the Farnsworth–Munsell 100 Hue Test Scoring Software (unique version) developed by Munsell Colour Services Laboratory (Greatmacbeth, New York, NY, USA). Data entry included cap order, subject gender, illumination type (D65), location (Europe), job function, and industry (unspecified). The software provided results such as Total Error Score (TES), Square Root of Total Error Score (√TES), classification as Low, Average, or Superior discriminators, and a scoring plot available in polar and linear styles. All results could be exported as .pdf or .csv files.

2.4. Data Analysis

All data recorded and obtained in the study underwent both internal and external validation to ensure the quality and validity of the study’s final results. In the internal validation process, the data underwent thorough statistical analysis. External validation was performed by comparing the values of certain parameters with those reported in several studies.

2.4.1. Internal Statistical Analysis of the Data Obtained in the Study

A comprehensive statistical analysis will be conducted for the complete dataset obtained in the study, enabling the determination of possible relationships among the recorded variables. Various methodologies for statistical analysis of data are being applied.
1
Correlation Matrix: A correlation matrix has been generated to examine pairwise relationships between variables.
The correlation values are interpreted using the following criteria:
0:0.4—No significant relationship exists between the variable pair.
0.4.0.7—A moderate relationship is observed between the variables.
0.7:1—A strong relationship exists between the variables.
Positive correlation values indicate a direct relationship, while negative values indicate an indirect relationship.
2
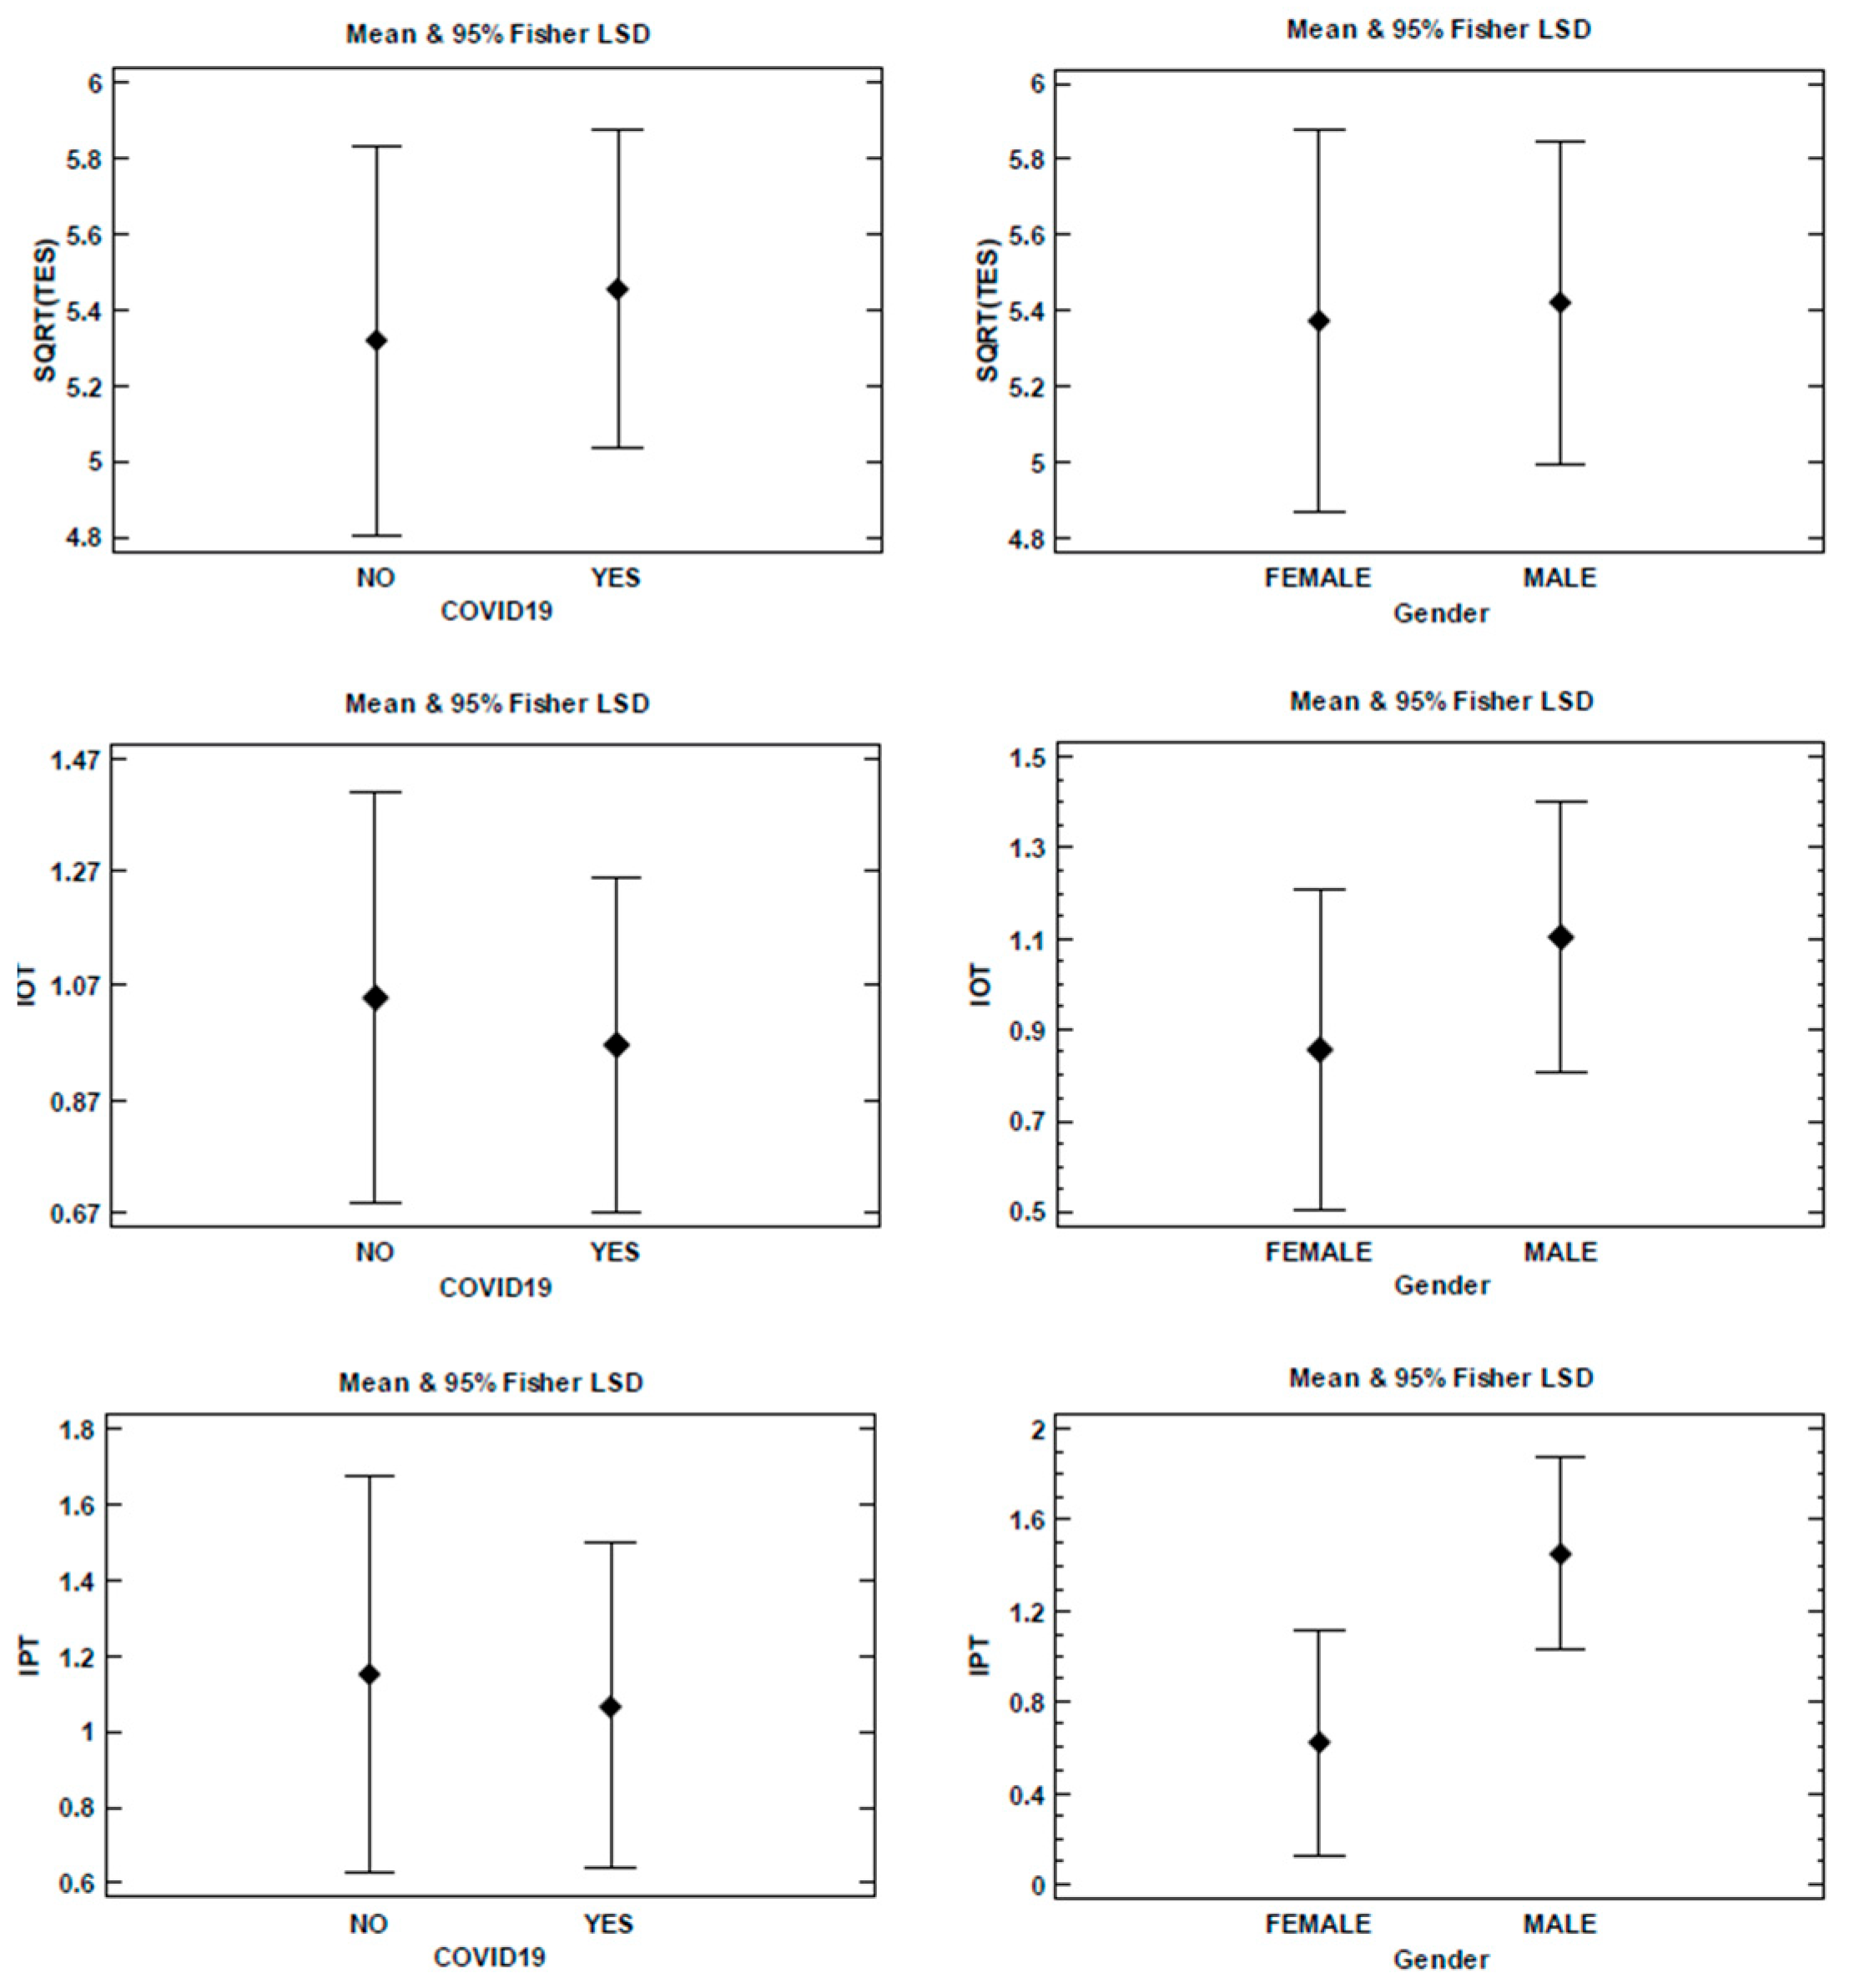
A qualitative analysis using ANOVA (Analysis of Variance) was performed to examine the relationships between test results and gender (male or female), as well as between test results and COVID-19 infection status. Fisher’s LSD intervals at the 95% confidence level were calculated and presented to ensure that the analysed factors did not affect the mean values. It is essential to note that the LSD interval is employed exclusively for the comparison of means. A significant difference between the means of the two groups is indicated if their LSD intervals do not overlap.
The √TES is being used as the outcome measure for the FM100H test, while the number of errors is being utilised for both the online and physical Ishihara Tests.
For the statistical analysis of the data, Statgraphics Centurion 18 software (Statgraphics Technologies Inc., The Plains, VA, USA) has been employed.

2.4.2. Analysis through Comparison with Previous Studies

The results obtained from processing the Farnsworth–Munsell Test data with the above-mentioned software (TES and √TES) are being compared to those of the Farnsworth–Munsell Test published before 2003, when neither screening nor COVID-19 had influenced the studied subjects. These data are being compared to those published for population groups comprising healthy individuals aged between 20 and 30 years. Four studies [43,48,49,50] were used to compare data and values obtained.

3. Results

3.1. Results Obtained from Statistical Data Analysis

3.1.1. Correlation Matrix

The correlation matrix presented in Table 1 elucidates several variables exhibiting moderate correlation coefficients. This observation suggests that there is no exigency to eliminate any variables owing to multicollinearity in subsequent regression analyses, nor does it necessitate the implementation of a principal component analysis.
Specifically, a moderate positive correlation coefficient of +0.44 is discerned between the number of errors in the Ishihara Test conducted on the iPad (IOT) and the Ishihara Test administered via physical media (IPT). This moderate positive correlation, in conjunction with corroborating evidence from pertinent literature [8,9], bolsters the validity of utilising the Ishihara Test on digital devices for the detection of congenital colour vision anomalies.

3.1.2. ANOVA Analysis

As demonstrated in Figure 1, the LSD intervals for gender and COVID-19 status for each type of error overlap, indicating no significant differences between the analysed variables for each type of error. This suggests that neither gender nor COVID-19 infection status has an impact on the test results. Overall, the analysis reveals no statistically significant differences in test results when considering either gender or COVID-19 infection status, as illustrated in Figure 1.
Therefore, the comprehensive statistical analysis solidifies the conclusion that the FM100-H Test, Online Ishihara Test, and Physical Ishihara Test remain resilient to the influences of gender and COVID-19 infection. These findings contribute to a deeper understanding of the robustness and reliability of these screening tools, emphasising their utility across diverse demographic and health contexts.

3.2. Obtained by Analysis through Comparison with Previous Studies

All the subjects included in the study identified more than 16 plates when performing the Ishihara test. It was thus determined that no subject had any deficiencies in colour vision (congenital in the red–green range). As a result, it was included the data obtained by the 50 subjects in the Farnsworth–Munsell 100-Hue Test.
For the total results obtained in the Farnsworth–Munsell 100-Hue Test, the following has been calculated and shown in Table 2:
  • The average value of TES and its standard deviation (SD) for the entire set of all 50 subjects;
  • The average value of TES and its SD for the subset of 31 subjects who had previously experienced a COVID-19 infection;
  • The average value of TES and its SD for the subset of 19 subjects who had not experienced a COVID-19 infection.
Comparing the above-described values, no significant differences were observed between the values obtained for the group of subjects who had COVID-19 and the group of subjects who had not been infected. This result is an initial indication that being infected with COVID-19 does not cause alterations in colour discrimination ability. As explained, four previous studies’ data (shown in Table 3) were used for comparing results.
We found a concordance between the value of the TES obtained in the study, and the value of the TES reported in four studies for the same age range (20–30 years) in health viewers. The four above-described studies were performed in 1982, 1991, 2001 and 2002. For those years, it could be considered insignificant screening habits in the population, and these were also pre-pandemic ages.
Thus, it can be stated that in subjects without congenital visual defects, based on the results of the TES of the Farnsworth-Munsell 100-Hue Test, the ability of colour vision and discrimination is not affected by having had the disease or by prolonged use of digital screens.

4. Discussion

The aim of this study was to analyse whether excessive screen usage and COVID-19 infection correlate or influence the occurrence of acquired colour vision deficiencies in individuals with normal trichromatic vision. The Farnsworth–Munsell 100 Hue Test was employed to assess the colour vision capacity of the individuals. Furthermore, to ensure that the analysed population consisted solely of subjects without congenital colour vision deficiencies, the entire group was pre-evaluated with the Ishihara 32 Plates Test, which detects congenital colour vision defects. No subjects were excluded from the study as no congenital disabilities were detected in the group. The screening conducted using the Ishihara Test ensures that the data obtained and analysed solely represent potential acquired colour vision defects.
Moreover, the screening patterns exhibited by the analysed subjects (average daily screen usage time) are consistent with the patterns of digital device usage reported in previous literature and are, therefore, representative and comparable.
To ensure the robustness of the presented results and to assert robust conclusions, all data obtained in the study have been doubly validated. This dual approach to result comparison ensures the reliability of the study and its conclusions.
Firstly, a comparison was made between the obtained data and external data from other studies. The data were compared with data obtained in previous studies for populations of subjects within the same age range and with a very similar population size (around 50 subjects). The mean value of √TES obtained was compared with the mean value of √TES from subjects within the same age range in four previously published works. It is crucial to note that the comparison was conducted with studies from years (before 2003) in which the subjects were not affected by COVID-19 and did not undergo regular screening. Therefore, the comparison data can be considered as an optimal reference group.
Secondly, an exhaustive internal analysis of the collected dataset was performed. On the one hand, the mean value of √TES was calculated for the analysed subjects, distinguishing between those who had experienced COVID-19 and those who had not. Both values showed no significant differences. On the other hand, a comprehensive statistical analysis of the dataset was conducted, examining both quantitative and qualitative aspects. This analysis of the relationships between the variables studied reveals that neither gender, COVID-19 infection, nor digital screen usage time are related to the occurrence of acquired colour vision defects. From the statistical analysis, we also addressed the effect of conducting the Ishihara Test on physical and digital supports, thus validating the use of digital support for administering the Ishihara Test.
It is worth noting and emphasising the novelty of the study conducted as it is the first to comprehensively analyse whether excessive screen usage can be related to the increase in acquired colour vision deficiencies.
Furthermore, in line with the only pre-published study on the relationship between colour vision and COVID-19 [13], it can be affirmed that COVID-19 infection is not related to the acquisition and development of defects in colour vision. This conclusion is of great significance because if there had been a relationship, the colour vision of the global population could have been affected.
It is important to consider that the current study has several limitations that warrant further examination. Although the sample size appears to be sufficient, continuous and additional testing of new subjects is necessary to strengthen the obtained results. The testing was conducted on Western individuals, making it essential to analyse similar populations from other geographical regions. The study did not record or analyse the time elapsed between COVID-19 infection and the testing. Additional studies are needed to investigate the potential influence of COVID-19 on colour vision at various stages of recovery from the disease.

5. Conclusions

Our study has provided comprehensive insights into various facets of colour vision and its association with digital device usage and COVID-19 infection. Here, we present a detailed summary of our key findings and their implications:
Absence of Relationship with COVID-19: Our investigation revealed no discernible link between COVID-19 infection status and the development of acquired colour vision deficiencies. This finding contributes to the growing body of knowledge regarding the diverse manifestations and sequelae of COVID-19.
Digital Device Screening and Colour Vision Deficiencies: Contrary to concerns regarding prolonged screen exposure, our study found no significant relationship between the duration of digital device screening and the incidence of acquired colour vision deficiencies. This finding allays concerns regarding the potential adverse effects of excessive screen time on colour vision health. This study marks a pioneering effort in investigating the relationship between screening time and colour vision capacity. While our initial findings suggest no detrimental effects of prolonged digital device usage on colour perception, further research is warranted to validate and elucidate these preliminary observations.
Gender Neutrality in Acquired Colour Vision Deficiencies: Gender-based differences in the colour vision capacity of normal trichromats were not observed in our study, highlighting the uniformity of colour perception abilities across genders.
Validation of Digital Ishihara Test: The comparable performance of the Ishihara Test administered on physical and digital platforms validates the utility of online Ishihara testing, particularly on devices such as the iPad 12 mini, for detecting congenital colour vision defects. This validation expands the accessibility and convenience of colour vision screening methods.
Confirmation of Smartphone Usage Patrons: Our study corroborates existing literature documenting the exponential increase in smartphone usage among young adults. By quantifying the average smartphone usage time within our study cohort, we provide empirical evidence of this prevailing trend, emphasising the need for continued research into the potential implications of extensive digital device use on various aspects of health and well-being.
Population Representation and Generalizability: The studied population, comprising healthy individuals aged 20 to 30 years, offers a representative sample for examining colour vision phenomena within this demographic segment. The inclusion of both the Ishihara Test and the Farnsworth–Munsell 100-Hue Test enhances the robustness and applicability of our findings within this population subset.
In summary, the study contributes valuable insights into the multifaceted interplay between digital device usage, COVID-19 infection, and colour vision health. These findings hold implications for public health initiatives, clinical practice, and future research endeavours aimed at elucidating the complex mechanisms underlying colour vision acquired deficiencies and its modulation by mentioned environmental factors.

Author Contributions

Conceptualization, M.M.S. and I.T.M.; methodology, M.M.S.; software, J.J. and B.M.; validation, D.L. and G.P.-F.; formal analysis, M.M.S.; investigation, M.M.S. and I.T.M.; resources, I.T.M.; data curation, B.M. and D.L.; writing—original draft preparation, M.M.S.; writing—review and editing, M.M.S.; visualization, G.P.-F.; supervision, I.T.M.; project administration, M.M.S. All authors have read and agreed to the published version of the manuscript.

Funding

This research received no external funding.

Informed Consent Statement

Informed consent was obtained from all subjects involved in the study.

Data Availability Statement

All the data analyzed in the study can be found published in the papers included in the bibliography and references. It is not necessary to consult additional data sources to obtain it.

Conflicts of Interest

The authors declare no conflicts of interest.

References

  1. Serra, G.; Lo Scalzo, L.; Giuffrè, M.; Ferrara, P.; Corsello, G. Smartphone Use and Addiction during the Coronavirus Disease 2019 (COVID-19) Pandemic: Cohort Study on 184 Italian Children and Adolescents. Ital. J. Pediatr. 2021, 47, 150. [Google Scholar] [CrossRef]
  2. Priya, D.B.; Subramaniyam, M. Fatigue Due to Smartphone Use? Investigating Research Trends and Methods for Analysing Fatigue Caused by Extensive Smartphone Usage: A Review. Work 2022, 72, 637–650. [Google Scholar] [CrossRef] [PubMed]
  3. Sañudo, B.; Fennell, C.; Sánchez-Oliver, A.J. Objectively-Assessed Physical Activity, Sedentary Behavior, Smartphone Use, and Sleep Patterns Pre- and during-COVID-19 Quarantine in Young Adults from Spain. Sustainability 2020, 12, 5890. [Google Scholar] [CrossRef]
  4. Olson, J.A.; Sandra, D.A.; Colucci, É.S.; Al Bikaii, A.; Chmoulevitch, D.; Nahas, J.; Raz, A.; Veissière, S.P.L. Smartphone Addiction Is Increasing across the World: A Meta-Analysis of 24 Countries. Comput. Hum. Behav. 2022, 129, 107138. [Google Scholar] [CrossRef]
  5. Wang, J.; Li, M.; Zhu, D.; Cao, Y. Smartphone Overuse and Visual Impairment in Children and Young Adults: Systematic Review and Meta-Analysis. J. Med. Internet Res. 2020, 22, e21923. [Google Scholar] [CrossRef] [PubMed]
  6. Chidi-Egboka, N.C.; Jalbert, I.; Golebiowski, B. Smartphone Gaming Induces Dry Eye Symptoms and Reduces Blinking in School-Aged Children. Eye 2023, 37, 1342–1349. [Google Scholar] [CrossRef] [PubMed]
  7. Iqbal, M.; Said, O.; Ibrahim, O.; Soliman, A. Visual Sequelae of Computer Vision Syndrome: A Cross-Sectional Case-Control Study. J. Ophthalmol. 2021, 2021, 6630286. [Google Scholar] [CrossRef] [PubMed]
  8. Golebiowski, B.; Long, J.; Harrison, K.; Lee, A.; Chidi-Egboka, N.; Asper, L. Smartphone Use and Effects on Tear Film, Blinking and Binocular Vision. Curr. Eye Res. 2020, 45, 428–434. [Google Scholar] [CrossRef] [PubMed]
  9. Mccrann, S.; Loughman, J.; Butler, J.S.; Paudel, N.; Flitcroft, D.I. Smartphone Use as a Possible Risk Factor for Myopia. Clin. Exp. Optom. 2021, 104, 35–41. [Google Scholar] [CrossRef] [PubMed]
  10. Foreman, J.; Salim, A.T.; Praveen, A.; Fonseka, D.; Ting, D.S.W.; He, M.G.; Bourne, R.R.A.; Crowston, J.; Wong, T.Y.; Dirani, M. Association between Digital Smart Device Use and Myopia: A Systematic Review and Meta-Analysis. Lancet Digit. Health 2021, 3, e806–e818. [Google Scholar] [CrossRef]
  11. Mehra, D.; Galor, A. Digital Screen Use and Dry Eye: A Review. Asia-Pac. J. Ophthalmol. 2020, 9, 491–497. [Google Scholar] [CrossRef] [PubMed]
  12. Nasiri, N.; Sharifi, H.; Bazrafshan, A.; Noori, A.; Karamouzian, M.; Sharifi, A. Ocular Manifestations of COVID-19: A Systematic Review and Meta-Analysis. J. Ophthalmic. Vis. Res. 2021, 16, 103–112. [Google Scholar] [CrossRef] [PubMed]
  13. Paramei, G.; Griber, Y. Colour Discrimination in Post-COVID-19 Observers Assessed by the Farnsworth-Munsell 100-Hue Test. Res. Sq. 2023. [Google Scholar] [CrossRef]
  14. DeValois, K.; Webster, M. Color Vision. Scholarpedia 2011, 6, 3073. [Google Scholar] [CrossRef]
  15. Solomon, S.G.; Lennie, P. The Machinery of Colour Vision. Nat. Rev. Neurosci. 2007, 8, 276–286. [Google Scholar] [CrossRef]
  16. Gegenfurtner, K.R. Cortical Mechanisms of Colour Vision. Nat. Rev. Neurosci. 2003, 4, 563–572. [Google Scholar] [CrossRef]
  17. Mollon, J.D. Color Vision: Opsins and Options. Proc. Natl. Acad. Sci. USA 1999, 96, 4743–4745. [Google Scholar] [CrossRef] [PubMed]
  18. SWANSON, W.; COHEN, J. Color Vision. Ophthalmol. Clin. N. Am. 2003, 16, 179–203. [Google Scholar] [CrossRef] [PubMed]
  19. Simunovic, M.P. Acquired Color Vision Deficiency. Surv. Ophthalmol. 2016, 61, 132–155. [Google Scholar] [CrossRef]
  20. Bowmaker, J.K.; Dartnall, H.J.; Mollon, J.D. Microspectrophotometric Demonstration of Four Classes of Photoreceptor in an Old World Primate, Macaca Fascicularis. J. Physiol. 1980, 298, 131–143. [Google Scholar] [CrossRef]
  21. Ahnelt, P.K.; Kolb, H.; Pflug, R. Identification of a Subtype of Cone Photoreceptor, Likely to Be Blue Sensitive, in the Human Retina. J. Comp. Neurol. 1987, 255, 18–34. [Google Scholar] [CrossRef]
  22. Hofer, H.; Carroll, J.; Neitz, J.; Neitz, M.; Williams, D.R. Organization of the Human Trichromatic Cone Mosaic. J. Neurosci. 2005, 25, 9669–9679. [Google Scholar] [CrossRef] [PubMed]
  23. Nathans, J.; Merbs, S.L.; Sung, C.-H.; Weitz, C.J.; Wang, Y. Molecular genetics of human visual pigments. Annu. Rev. Genet. 1992, 26, 403–424. [Google Scholar] [CrossRef]
  24. Hart, W.M. Acquired Dyschromatopsias. Surv. Ophthalmol. 1987, 32, 10–31. [Google Scholar] [CrossRef]
  25. Simunovic, M.P. Colour Vision Deficiency. Eye 2010, 24, 747–755. [Google Scholar] [CrossRef] [PubMed]
  26. Modarres, M.; Mirsamadi, M.; Peyman, G.A. Prevalence of Congenital Color Deficiencies in Secondary-School Students in Tehran. Int. Ophthalmol. 1996, 20, 221–222. [Google Scholar] [CrossRef] [PubMed]
  27. Verriest, G. Further Studies on Acquired Deficiency of Color Discrimination. J. Opt. Soc. Am. 1963, 53, 185–195. [Google Scholar] [CrossRef]
  28. Oh, Y.-S.; Kim, J.-S.; Chung, S.-W.; Song, I.-U.; Kim, Y.-D.; Kim, Y.-I.; Lee, K.-S. Color Vision in Parkinson’s Disease and Essential Tremor. Eur. J. Neurol. 2011, 18, 577–583. [Google Scholar] [CrossRef]
  29. Pieri, V.; Diederich, N.J.; Raman, R.; Goetz, C.G. Decreased Color Discrimination and Contrast Sensitivity in Parkinson’s Disease. J. Neurol. Sci. 2000, 172, 7–11. [Google Scholar] [CrossRef]
  30. Müller, T.; Kuhn, W.; Büttner, T.; Przuntek, H. Distorted Colour Discrimination in Parkinson’s Disease Is Related to Severity of the Disease. Acta Neurol. Scand. 1997, 96, 293–296. [Google Scholar] [CrossRef]
  31. Kim, H.J.; Ryou, J.H.; Choi, K.T.; Kim, S.M.; Kim, J.T.; Han, D.H. Deficits in Color Detection in Patients with Alzheimer Disease. PLoS ONE 2022, 17, e0262226. [Google Scholar] [CrossRef] [PubMed]
  32. Barton, F.B.; Fong, D.S.; Knatterud, G.L. Classification of Farnsworth-Munsell 100-Hue Test Results in the Early Treatment Diabetic Retinopathy Study. Am. J. Ophthalmol. 2004, 138, 119–124. [Google Scholar] [CrossRef] [PubMed]
  33. Quiceno, J.I.; Capparelli, E.; Sadun, A.A.; Munguia, D.; Grant, I.; Listhaus, A.; Crapotta, J.; Lambert, B.; Freeman, W.R. Visual Dysfunction Without Retinitis in Patients with Acquired Immunodeficiency Syndrome. Am. J. Ophthalmol. 1992, 113, 8–13. [Google Scholar] [CrossRef]
  34. Cruysberg, J.R.M.; Pinckers, A. Acquired Color Vision Defects in Compressive Optic Neuropathy. Neuro-Ophthalmology 1982, 2, 169–181. [Google Scholar] [CrossRef] [PubMed]
  35. Iregren, A.; Andersson, M.; Nylén, P. Color Vision and Occupational Chemical Exposures: I. An Overview of Tests and Effects. Neurotoxicology 2002, 23, 719–733. [Google Scholar] [CrossRef] [PubMed]
  36. Willmann, G.; Ivanov, I.V.; Fischer, M.D.; Lahiri, S.; Pokharel, R.K.; Werner, A.; Khurana, T.S. Effects on Colour Discrimination during Long Term Exposure to High Altitudes on Mt Everest. Br. J. Ophthalmol. 2010, 94, 1393–1397. [Google Scholar] [CrossRef] [PubMed]
  37. Almustanyir, A.; Hovis, J.K.; Alduhayan, R.; Alhassan, M.; Bokhary, K.; Alabdulkader, B. Evaluation of the Third Edition of the City University Colour Vision Test. Ophthalmic Physiol. Opt. 2022, 42, 123–132. [Google Scholar] [CrossRef] [PubMed]
  38. Birch, J. Worldwide Prevalence of Red-Green Color Deficiency. J. Opt. Soc. Am. A 2012, 29, 313–320. [Google Scholar] [CrossRef] [PubMed]
  39. Hardy, L.H.; Rand, G.; Rittler, M.C. Tests for the Detection and Analysis of Color-Blindness I The Ishihara Test: An Evaluation. J. Opt. Soc. Am. 1945, 35, 268–275. [Google Scholar] [CrossRef]
  40. Farnsworth, D. The Farnsworth-Munsell 100-Hue Test for the Examination of Color Discrimination; Manual; Munsell Color, Macbeth, Division of Kollmorgen Instruments Corp.: New Windsor, NY, USA, 1957. [Google Scholar]
  41. Kinnear, P.R. Proposals for Scoring and Assessing the 100-HUE Test. Vis. Res. 1970, 10, 423–433. [Google Scholar] [CrossRef]
  42. Knoblauch, K.; Saunders, F.; Kusuda, M.; Hynes, R.; Higgins, K.E.; de Monasterio, F.M. Quantitative Comparison of Farnsworth and Kinnear Plots of the Farnsworth-Munsell 100-Hue Test. In Colour Vision Deficiencies IX; Springer: Dordrecht, The Netherlands, 1989; pp. 413–416. [Google Scholar]
  43. Mäntyjärvi, M. Normal Test Scores in the Farnsworth–Munsell 100 Hue Test. Doc. Ophthalmol. 2001, 102, 73–80. [Google Scholar] [CrossRef] [PubMed]
  44. Kaur, K.; Gurnani, B. Revisiting Color Vision Standards and Testing Methods in Various Occupational Groups. Indian J. Ophthalmol. 2022, 70, 329–331. [Google Scholar] [CrossRef] [PubMed]
  45. Racheva, K.; Totev, T.; Natchev, E.; Bocheva, N.; Beirne, R.; Zlatkova, M. Color Discrimination Assessment in Patients with Hypothyroidism Using the Farnsworth–Munsell 100 Hue Test. J. Opt. Soc. Am. A 2020, 37, A18–A25. [Google Scholar] [CrossRef] [PubMed]
  46. Kasputytė, R.; Slatkevičienė, G.; Liutkevičienė, R.; Glebauskienė, B.; Bernotas, G.; Tamašauskas, A. Changes of Visual Functions in Patients with Pituitary Adenoma. Medicina 2013, 49, 132–137. [Google Scholar] [CrossRef] [PubMed]
  47. Smith, C.; Susilo, T. Normal Colour Perception in Developmental Prosopagnosia. Sci. Rep. 2021, 11, 13741. [Google Scholar] [CrossRef] [PubMed]
  48. Roy, M.S.; Podgor, M.J.; Collier, B.; Gunkel, R.D. Color Vision and Age in a Normal North American Population. Graefe’s Arch. Clin. Exp. Ophthalmol. 1991, 229, 139–144. [Google Scholar] [CrossRef] [PubMed]
  49. Kinnear, P.R. New Farnsworth-Munsell 100 Hue Test Norms of Normal Observers for Each Year of Age 5-22 and for Age Decades 30–70. Br. J. Ophthalmol. 2002, 86, 1408–1411. [Google Scholar] [CrossRef] [PubMed]
  50. Verriest, G.; Van Laethem, J.; Uvijls, A. A New Assessment of the Normal Ranges of the Farnsworth-Munsell 100-Hue Test Scores. Am. J. Ophthalmol. 1982, 93, 635–642. [Google Scholar] [CrossRef]
  51. Blindor, C. Ishihara 38 Plates CVD Test. Available online: https://www.color-blindness.com/ishihara-38-plates-cvd-test/ (accessed on 20 April 2023).
  52. Almustanyir, A.; Alduhayan, R.; Alhassan, M.; Bokhary, K.; Alabdulkader, B. Evaluation of the Waggoner Computerized D15 Color Vision Test Using an IPad Device. J. Opt. Soc. Am. A 2021, 38, 1647–1655. [Google Scholar] [CrossRef]
  53. ISO-CIE ISO/CIE DIS 23603.2; Standard Method of Assessing the Spectral Quality of Daylight Simulators for Visual Appraisal and Measurement of Colour. ICS: 17.180.20—Colours and Measurement of Light 2018. ISO: Geneva, Switzerland, 2018.
Figure 1. ANOVA and LSD Intervals for FM100-H Test, Ishihara Physical Test, and Ishihara Online Test.
Applsci 14 05563 g001
Table 1. Correlation Matrix.
SMDPCMDOMDSHTTESTHDIPTIOTOLD
SMD a1.00−0.270.110.000.260.49−0.06−0.21−0.22
PCMD b−0.271.00−0.18−0.270.090.540.460.220.34
OMD c0.11−0.181.000.060.400.45−0.240.260.02
SHT d0.00−0.270.061.00−0.22−0.190.00−0.12−0.23
TES e0.260.090.40−0.221.000.460.050.270.12
THD f0.490.540.45−0.190.461.000.210.180.14
IPT g−0.060.46−0.240.000.050.211.000.440.20
IOT h−0.210.220.26−0.120.270.180.441.000.14
OLD i−0.220.340.02−0.230.120.140.200.141.00
SMD a: Smartphone Minutes per Day, PCMD b: PC Minutes per Day, OMD c: Other Minutes per Day, SHT d: Sleep Hours per Day, TES e: Total Error Score, THD f: Total screening Hours per Day, IPT g: Ishihara Physical Test, IOT h: Ishihara Online Test, OLD i: years Old.
Table 2. Values of √TES (Mean ± SD) obtained for the complete group of subjects, for those who had contracted COVID-19, and for those who had not been infected by COVID-19.
All SubjectsSubjects with COVID-19Subjects No COVID-19
5.40 ± 1.585.46 ± 1.625.32 ± 1.51
Table 3. Results obtained for √TES in previous works are to be compared with those obtained in previous works.
StudyYear of PublicationNumber of
Subjects Included
TES (Mean ± SD)
[50]1982295.69 ± 2.07
[48]1991256.0 ± 2.4
[43]2001307.50 ± 2.41
[49]2002356.73 ± 1.58
Disclaimer/Publisher’s Note: The statements, opinions and data contained in all publications are solely those of the individual author(s) and contributor(s) and not of MDPI and/or the editor(s). MDPI and/or the editor(s) disclaim responsibility for any injury to people or property resulting from any ideas, methods, instructions or products referred to in the content.

