Article

Coaxial Fibres Incorporated with Phase Change Materials for Thermoregulation Applications

by
Nathalia Hammes
1,*,
Claver Pinheiro
1,
Iran Rocha Segundo
1,*,
Natália Cândido Homem
2,
M. M. Silva
3,
Helena P. Felgueiras
2,
Graça M. B. Soares
2,
Elisabete Freitas
4,
Manuel F. M. Costa
5 and
Joaquim Alexandre O. Carneiro
1,*
1
Centre of Physics of Minho and Porto Universities (CF-UM-UP), University of Minho, Av. da Universidade, 4800-058 Guimarães, Portugal
2
Centre for Textile Science and Technology (2C2T-UMinho), University of Minho, Av. da Universidade, 4800-058 Guimarães, Portugal
3
Centre of Chemistry of University of Minho (CQ-UMinho), Gualtar Campus, University of Minho, R. da Universidade, 4710-057 Braga, Portugal
4
ARISE, Department of Civil Engineering (ISISE-UMinho), University of Minho, Av. da Universidade, 4800-058 Guimarães, Portugal
5
Centre of Physics of Minho and Porto Universities (CF-UM-UP), Gualtar Campus, University of Minho, R. da Universidade, 4710-057 Braga, Portugal
*
Authors to whom correspondence should be addressed.
Appl. Sci. 2024, 14(6), 2473; https://doi.org/10.3390/app14062473
Submission received: 21 February 2024 / Revised: 9 March 2024 / Accepted: 12 March 2024 / Published: 15 March 2024

Abstract

:
Nowadays, the growing concern about improving thermal comfort in different structures (textiles, buildings, and pavements, among others) has stimulated research into phase change materials (PCMs). The direct incorporation of PCMs into composite materials can cause mechanical impacts. Therefore, this study focuses on the design of phase change coaxial fibres (PCFs), using commercial cellulose acetate (CA) or recycled CA obtained from cotton fabrics (CAt) as the sheath and polyethylene glycol (PEG) 2000 as the core, via the wet spinning method; the fibres vary in molecular weight, concentration and ejection velocity. The fibres were assessed for their optical, chemical, thermal, and mechanical properties. The presence of PEG2000 is confirmed in the core of the fibres. Thermal analyses revealed a mass loss at high temperatures, attributable to the presence of PEG2000. Notably, the fibres with CA (Mn 30,000) showed superior thermal and mechanical performance. The melting point of PEG2000 incorporated into these PCFs coincided with the melting point of pure PEG2000 (about 55 °C), with a slight deviation, indicating that PCFs were obtained. Finally, the results point to the application of the fibres in civil engineering materials requiring a phase change between 50 and 60 °C, providing promising prospects for their use in applications requiring thermoregulatory properties.

1. Introduction

Civil engineering materials such as cement and asphalt concretes absorb a large amount of solar thermal energy in the form of heat, thus contributing to heat retention far more than the natural elements in rural landscapes [1,2]. As a result, city areas often record higher air temperatures than their rural counterparts, leading to significant consequences for the environment, economy, and society [3]. Called the urban heat island (UHI), this phenomenon becomes more pronounced with urbanization through the construction of asphalt pavements and built structures [4,5]. It is important to emphasize that the world’s population is expected to increase at least 60% in the second half of this century, and this excessive growth will aggravate urbanization [1,6]. Thus, the thermoregulation of these structures is essential.
As an alternative, researchers have been studying the application of latent heat thermal energy storage (LHTS) materials or, more simply, phase change materials (PCMs) within civil engineering materials in order to mitigate and prevent the effects of the UHI. According to this approach, the integration of PCMs is a promising solution because they have dual benefits: the ability to store and release thermal energy latently, coupled with an isothermal nature during storage, thus reducing temperature fluctuations [7,8]. However, their direct application can affect the mechanical properties of the composite material.
PCMs have gained significance in thermoregulating environments since their introduction in the 1980s [9]. With their high latent heat capacity, PCMs are excellent for storing energy from cooling systems or lower night-time temperatures to be released during peak heat periods, improving thermal comfort [10]. Pinheiro et al. [11] adopted an approach to study PCMs and observed that they differ significantly from high-albedo materials. While high-albedo materials focus on reflecting solar radiation to reduce heat gain and cooling loads [11], PCMs adopt a more dynamic strategy. They absorb excess heat during periods of high temperature (such as during the day) and release it during cooler periods (such as at night) [12]. This phase change allows PCMs to store and release thermal energy efficiently. So, unlike high-albedo materials that passively prevent heating by reflecting solar radiation, PCMs actively balance thermal energy, absorbing and releasing heat as needed [13]. This ability to actively adjust surface temperatures makes PCMs a more versatile solution for climate control in different applications, adapting to thermal variations in the environment throughout the day.
PCMs are versatile in their applications within the civil engineering [7], encompassing areas such as air conditioning systems [14], solar energy storage [15], and more broad integration in various construction materials [16]. Their primary purpose in these applications is to prevent damage caused by abrupt temperature changes, thus lowering the energy per area needed for heating/cooling these materials. PCMs can be incorporated directly [17,18] or encapsulated [19,20]. Drissi et al. [21] carried out various studies with PCMs applied directly or encapsulated and, in response, the direct application method caused the PCMs to leak, thus inhibiting water migration and interfering with the hydration process, thereby negatively affecting the development of the materials’ strength [22]. Therefore, in order to achieve stable PCM incorporation so that their phase change occurs without leakage, different methods can be used to protect and encapsulate them, such as microencapsulation by sol-gel, electrospinning [23], and wet spinning [24].
Ozipek et al. [25] explained that the wet spinning technique is a widely used commercial process that allows the manufacture of mono- or multi-structured fibres using polymers dissolved in solvents that are extruded through small holes, forming continuous filaments in a liquid medium (coagulation bath), i.e., as the extruded filaments pass through the coagulation bath, the polymer solidifies, resulting in the formation of fibres with a uniform morphology. According to Shirvan et al. [26], the wet spinning technique was first used to produce rayon fibres and is considered the oldest fibre spinning process. Due to its simple configuration, the wet spinning technique [27,28,29] has recently attracted attention as an alternative encapsulation method that allows for the stable incorporation of PCMs. The main advantage of this technique is that it does not involve heat during production, reducing the risk of possible thermal degradation. Another point is that it can produce fibres with different diameters, shapes and cross-sectional sizes. It is also a continuous process and can produce any type of polymer, which makes it a very efficient [26]. Through wet coaxial spinning, hollow or single-core fibres can be produced for different purposes, such as electronic textiles, sensors and controlled release applications [30].
Phase change fibres (PCFs) are considered intelligent materials because, in addition to containing PCMs, PCFs react to environmental changes without any human action required. On their own, PCFs recognize changes and work to maintain the standard for which they were programmed [31]. The reproducibility and the performance of coaxial fibres will depend on the rigorous selection and maintenance of wet spinning parameters [26]. Among the different existing parameters, it is necessary to take into account the evaluation of the process parameters, from solution to production, in order to obtain fibres with a well-defined core and sheath to maximise the performance of the coaxial fibres in the final application [32].
Although several studies are exploring potential applications to produce PCFs, there needs to be more research in the literature on this subject in order to broaden the range of innovation. In a study carried out by Chen et al. [33] where PCFs were developed using the electrospinning technique, containing cellulose acetate (CA) as the support material and polyethylene glycol (PEG) as the PCM, it was observed that the thermal properties of PEG were different to those of virgin PEG due to the presence of CA. Swapnil et al. [34] studied the production of fibres, via wet spinning, consisting of CA/PEG in the same solution. As a result, they observed that the viscosity of the solutions and the dH2O used as a coagulation bath induced a more solid structure in the fibres. The addition of PEG to the CA solution considerably increased the mechanical properties of the fibres.
To the best of the authors’ knowledge, this is one of the first research works detailing the manufacturing process of wet spinning using this specific structure of PCF (coaxial fibres with CA and specially recycled CA from cotton fabrics (CAt) in the protective sheath and PEG in the core). Therefore, different manufacturing parameters were studied: (i) CA concentration and molecular weight; (ii) CA source (conventional versus recycled); and (iii) PEG concentration, molecular weight, and ejection. PCFs were analysed for their morphological, chemical, thermal, and mechanical properties. Morphological characteristics were examined using both bright-field microscopy and scanning electron microscopy (SEM). Chemical properties were assessed through Fourier transform infrared spectroscopy (ATR-FTIR), while thermal properties were evaluated using thermogravimetric analysis (TGA) and differential scanning calorimetry (DSC). Mechanical properties were tested with a dynamometer. The PCFs were then compared to their analogous uniaxial (Fu) and hollow (Fh) fibres.

2. Materials and Methods

2.1. Materials

The materials used in this work were (i) commercial cellulose acetate (CA, Sigma-Aldrich, St. Louis, MO, USA) powder, with an acetyl content of 39.8 wt. %, average Mn = 30,000 and an acetyl content of 39.8 wt. % by weight, average Mn = 50,000; (ii) N,N-Dimethylformamide (DMF, 99%, Sigma-Aldrich, St. Louis, MO, USA); (iii) N-Methyl-2-pyrrolidone (NMP, 99%, Sigma-Aldrich, St. Louis, MO, USA), (iv) Polyethylene glycol 2,000 H(OCH2CH2)nOH (PEG2000, Thermo Fisher Scientific, Waltham, MA, USA), MP = 53–55 °C; and (v) dH2O. DMF and dH2O were used as solvents for the CA and PEG solutions, respectively.
CA, which is an ester of cellulose acetate and the most common derivative of cellulose, was selected to be the polymeric material of the protective sheath due to its natural and non-toxic characteristics, being a polymer used to produce PCFs that result in good thermal and mechanical properties [24,35].
Among the different PCMs available on the market and in the literature, polyethene glycol (PEG), was selected for the core of PCFs as it presents interesting properties such as chemical stability, high storage capacity, a wide temperature range, low overcooling behaviour, and negligible volume change during its phase change [36].
Regarding the thermal proprieties of the CA and the PEG, Figure 1 and Figure 2 show the TGA and the DSC characterization of the virgin materials under study, respectively. Regarding TGA, studies were carried out on the loss of mass of the virgin materials in relation to the increase in temperature, where the main mass loss phase for PEG2000 starts at ≈350 °C and ends at ≈430 °C. For commercial CA and CAt, the main mass loss phase starts at ≈315 °C and ends at ≈350 °C.
In DSC measurements, multiple peaks are observed, a phenomenon not evident in TGA analysis results. The initial two endothermic peaks correspond to melting, as these events do not involve any mass loss. Consequently, these events are not visible in the TGA. In DSC curves, the third thermal effect (above 300 °C), characterized by irregular peaks and where the baseline is no longer maintained, corresponds to and corroborates degradation, as observed in the TGA results. The fact that the temperatures are not exactly the same is due to the experimental conditions. While the DSC measurements are performed in hermetically closed pans, the TGA analysis is carried out in an open crucible. Consequently, they reveal that the degradation event can start at lower or higher temperatures, as the samples may adsorb any water, for example.
For the DSC, the peaks, phase change temperatures, and comparison of the PCFs with the Fh were analysed. In this test, the virgin materials produced results that were expected and in accordance with the literature.
For the synthesis of the Cat, 100% cotton fabric (from Nostrobiz, Guimarães, Portugal), glacial acetic acid (CH3COOH, 100%, Pronalab, Lisbon, Portugal), sulphuric acid (H2SO4, 95–98%, Sigma-Aldrich) and acetic anhydride ((CH3CO)2O, 98%, AnalytiCals Carlos Erba, Emmendingen, Germany) were used. Sodium hydroxide (NaOH, JMGS, Odivelas, Portugal), ethanol absolute (CH3CH2OH, 99.5%, Merck, Rahway, NJ, USA), hydrochloric acid (HCl, 37%, Fisher Scientific), sodium hydroxide solution (NaOH, 0.25 mol/L, JMGS), hydrochloric acid solution (HCl, 0.25 mol/L, Fisher Scientific), and phenolphthalein (C20H14O4, AnalytiCals Carlos Erba) were used to determine the degree of substitution of CAt.

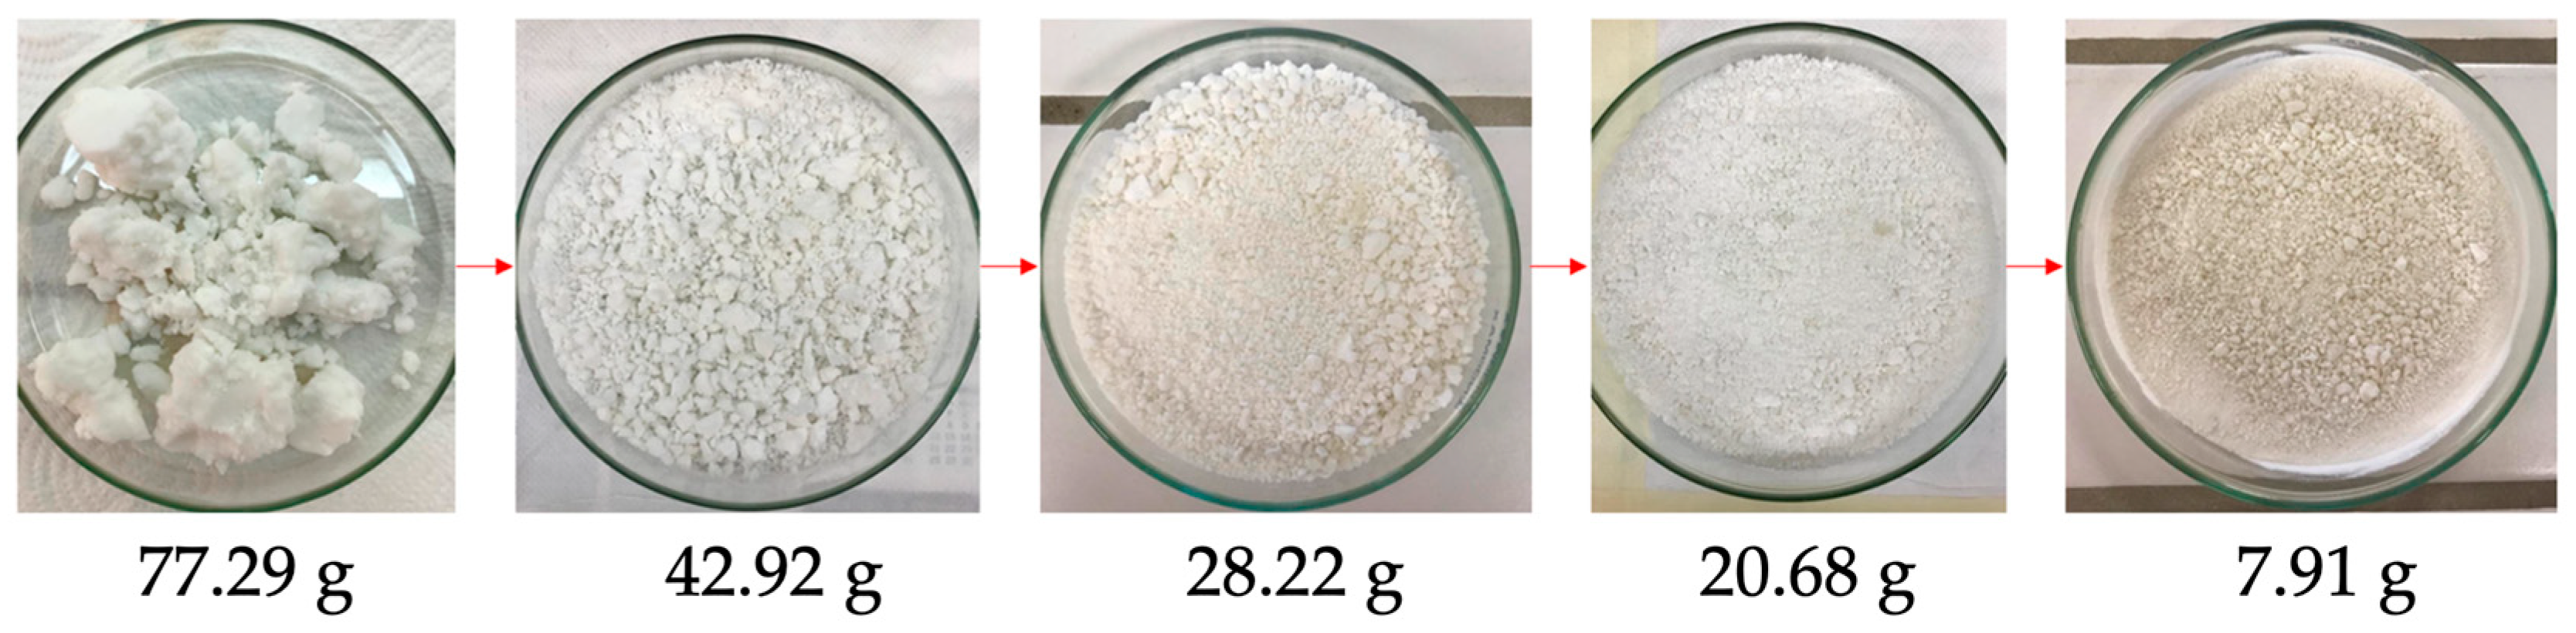
2.2. Synthesis of Recycled Cellulose Acetate (CAt)

As a sheath that is more environmentally friendly for PCFs, CAt (recycled cellulose acetate from textile waste) was produced using the homogeneous acetylation method [37]. In detail, 2.0 g of cotton fabric was first cut into thin strips and left in the desiccator for 24 h. The process was started by adding 40 mL of CH3COOH to 2.0 g of the cotton fabric. This mixture was stirred for 30 min at room temperature. Subsequently, a solution of H2SO4 and CH3COOH (0.3 mL and 17.5 mL, respectively) was added and the mixture was stirred for 15 min at room temperature. After 15 min, the textile was filtered and separated from the solution. At this point, 20 mL of (CH3CO)2O was added to the liquid, the textile was replaced and the solution stirred at room temperature for 24 h. After 24 h, the solution was removed from the stirrer and slowly added to a beaker containing 1.0 L of dH2O. Finally, the CAt was vacuum-filtered (Diaphragm Vacuum Pump N810, LABOPORT, Ebhausen, Germany) and washed with dH2O until pH 7 was reached. The CAt was dried in a drying and sterilyzing oven (J.P Selecta, Barcelona, Spain) overnight at 50 °C and stored in a humidity-controlled environment for further characterization. The drying stages of the recycled CAt are shown in Figure 3.
The degree of acetylation was determined by acid–base titration. Firstly, 5.0 mL of NaOH (0.25 mol L1) and 5.0 mL of CH3CH2OH were added to 0.10 g of CAt and the mixture was left to stand for 24 h. After 24 h, 10 mL of HCl (0.25 mol L1) was added and the mixture was left to stand for 30 min. After this period, the solution was titrated with a standard NaOH solution, using C20H14O4 as an indicator [37]. This test was carried out in triplicate. The percentage of acetyl groups (%GA) was obtained using the following Equation (1):
% G A = V b i + V b t × μ b V a . μ a × M × 100 m C A t
where Vbi is the volume of NaOH added to the system (L), Vbt is the volume of NaOH used in the titration (L), µb is the molarity of sodium hydroxide (M), Va is the volume of HCl added to the system, µa is the molarity of hydrochloric acid (M), M is the molar mass of the acetyl group (g/mol), and mCAt is the mass of the CAt sample (g). By assessing the degree of acetylation, it is possible to determine the degree of substitution of the sample [38].

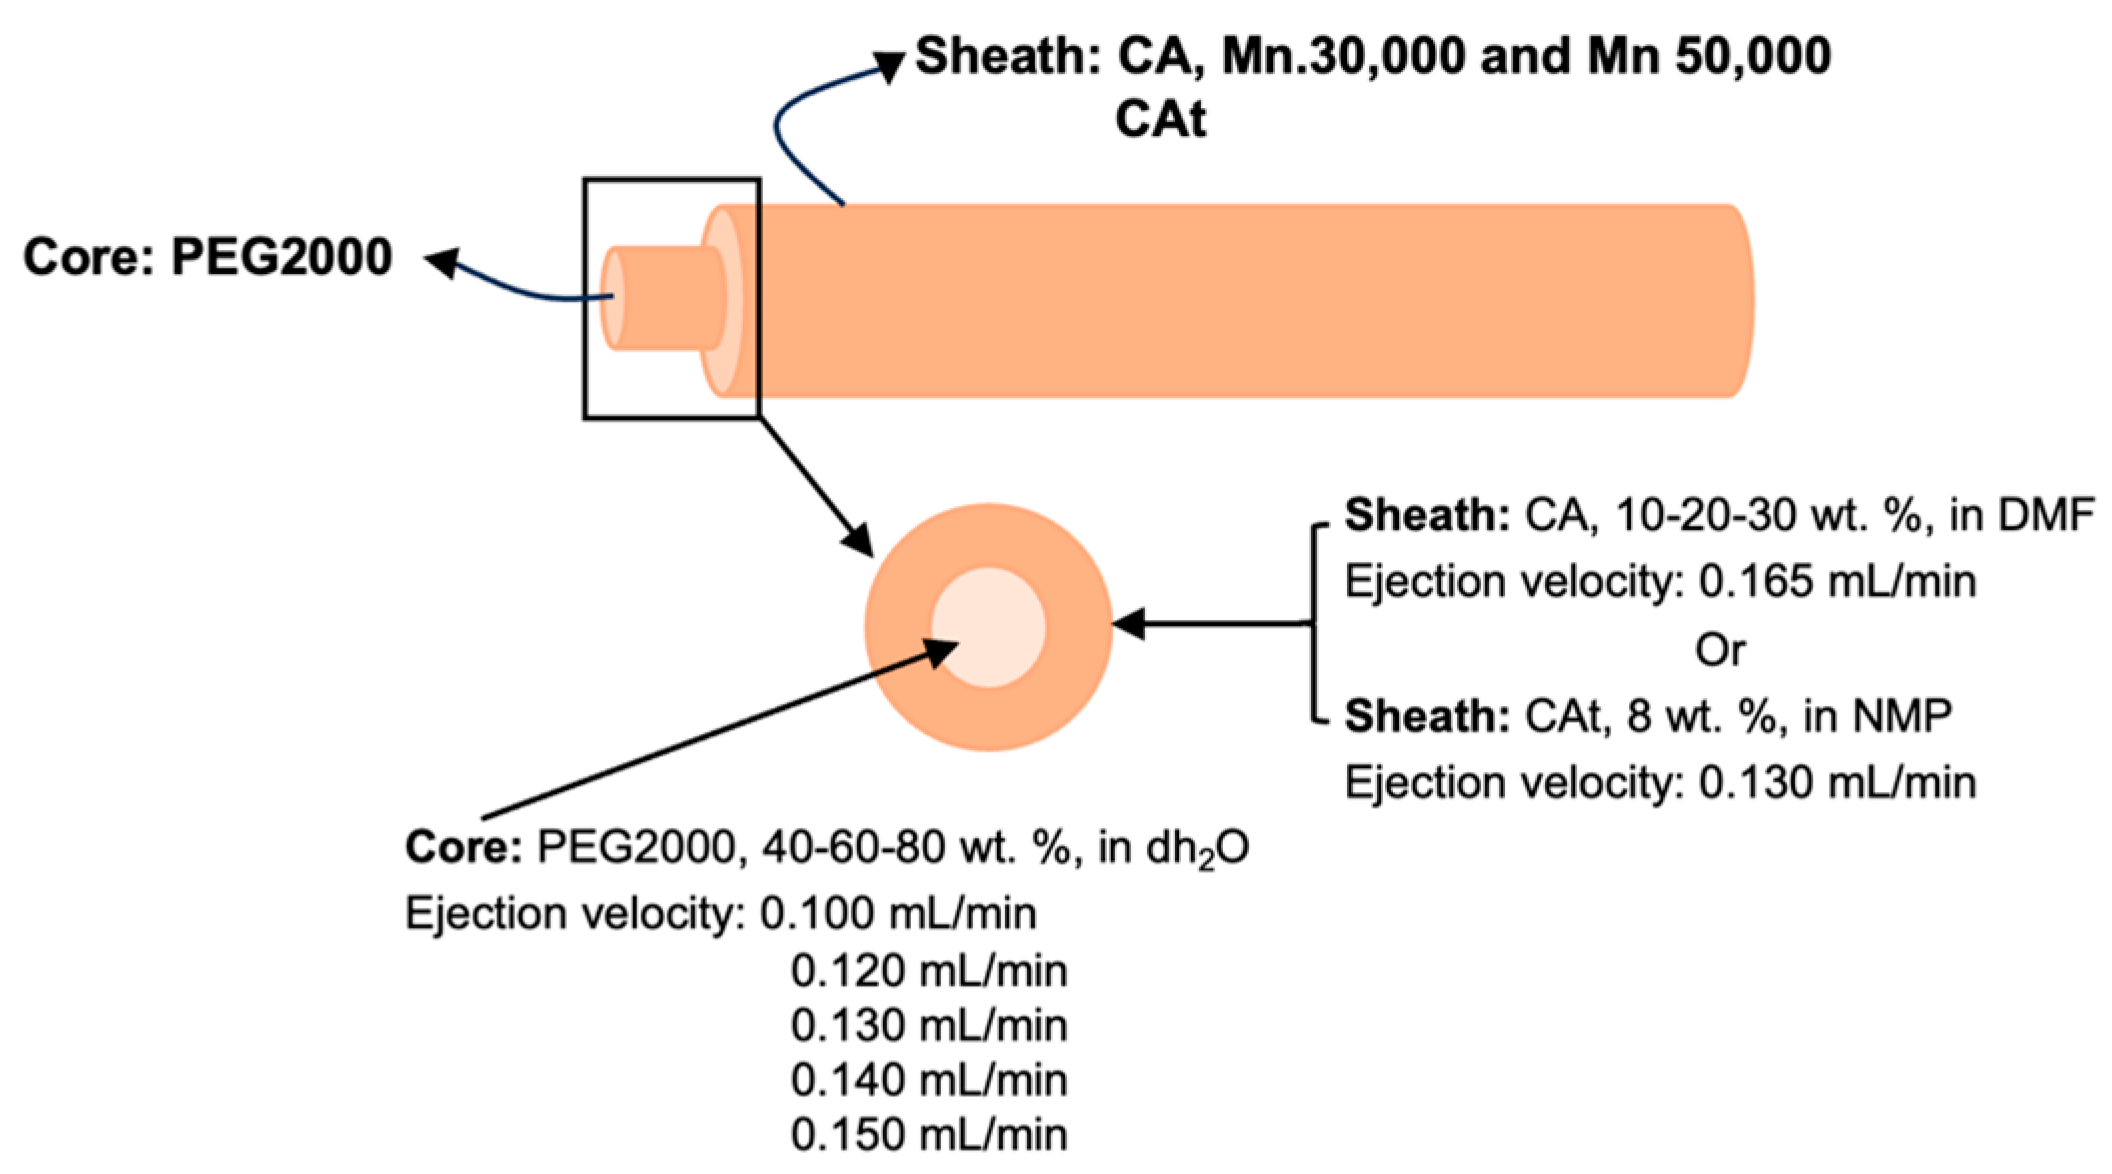
2.3. Fibres’ Production

Solutions of CA (10–20–30 wt. %) and PEG2000 at (40–60–80 wt. %) were prepared overnight in DMF and dH2O, respectively, both being stirred continuously at 50 °C. Meanwhile, the CAt (8 wt. %) solutions were prepared overnight in NMP under moderate stirring at 50 °C. Prior to the wet spinning production, the solutions were left to stand at room temperature for 1 h to remove any air bubbles.
For all productions, the wet spinning setup consisted of a syringe pump NE-1000 (New Era Pump Systems Inc., Farmingdale, NY 11735, EUA), a coagulation bath of dH2O at room temperature, a collector, and a needle (uniaxial or coaxial and one/two syringes connected to the pump, with the latter two parameters adjusted according to the type of fibre produced). A representative schematic of the wet spinning process is shown in Figure 4. The fibre collector consisted of aluminium foil wrapped around an automatic collector at a moderate velocity of 6.21 rpm. The distance between the collector and the needle was 45 cm, and the distance between the needle and the coagulation bath was 5 cm.
To produce uniaxial fibres (Fu) and uniaxial CAt fibres (Fut), a wet spinning configuration was applied, but the needle used for the process was uniaxial, requiring only one pump and adjusted according to ejection parameters. To produce hollow fibres (Fh), hollow CAt fibres (Fht), and PCF and coaxial CAt fibres (PCFt), the only parameter that differed was the needle, which instead of being a single needle was replaced by a coaxial needle. Meanwhile, for Fh and Fht only, the outermost port was used with the solution of CA and CAt, respectively. In contrast, for PCF and PCFt, the outermost port was used for CA and CAt, respectively, and the innermost port for PEG2000.
The parameters of the wet spinning process were adjusted to obtain fibres with better properties [39] and are demonstrated in Figure 5. The ejection velocity for CA was 0.165 mL/min, while for PEG2000, it varied from 0.130 to 0.140–0.150 mL/min. Fibres with CAt and PEG2000 were produced with slightly lower ejection velocities, namely 0.130 mL/min for CAt and (0.100–0.120 mL/min) for PEG2000. In the case of coaxial fibres, CAt required different ejection velocities to obtain enough time to compose a coaxial system with a protective sheath.
After production, all fibres were passed through dH2O to remove any traces of solvent (DMF and NMP) and dried for 1 h at room temperature. The fibres were then stored at room temperature and humidity for subsequent testing. A qualitative analysis was carried out during the production of the fibres by wet spinning, which considered whether the fibres could be extruded easily, whether there was surface roughness, and whether the fibres were extruded uniformly. This analysis is presented in the results and discussions.
PEG being soluble in dH2O guarantees its incorporation into the fibre. When dH2O meets the walls of the protective sheath, coagulation occurs, forming a resistant inner wall to fix the substance. Although there are not yet many reports on wet-spun coaxial fibres with this type of structure, it is hoped that research will progress in this direction.

2.4. Fibres’ Physical, Chemical, Thermal, and Mechanical Characterization

2.4.1. Bright-Field Microscopy

The morphology of the fibres will be presented herein. In addition, this test will give indications of the presence of a coaxial system. This analysis was carried out by bright-field microscopy using a Leica DM IL LED inverted microscope (Leica Microsystems, Weetzlar, Germany). Images were taken at 5× magnification, and the average fibre diameter was determined using ImageJ® software (version 1.53, National Institutes of Health, Bethesda, MD, USA).

2.4.2. Scanning Electron Microscopy (SEM)

To examine the morphology and differentiation between the fibre structure (uniaxial, hollow or coaxial), the CA and CAt sheath, and the corresponding cores within the fibres, fibres were characterised by SEM micrographs obtained using a dual-column ultra-high-resolution field emission SEM (NOVA 200 Nano SEM, FEI Company, Houston, TX, USA) with an accelerating voltage of 10 kV. The samples were initially coated with a 10 nm gold-palladium film (Au-Pd, 80–20% w/v) using a 208 High-Resolution Sputter-Coater (Cressington Company, Watford WD19 4BX, UK) coupled to an MTM-20 High-Resolution Thickness Controller (Cressington Company). Images were taken at 500× magnification.

2.4.3. Attenuated Total Reflectance–Fourier Transform Infrared Spectroscopy (ATR-FTIR)

The surface chemistry and chemical composition of different fibres were analysed using attenuated total reflectance Fourier transform infrared spectroscopy (ATR-FTIR). The equipment used was an IRAffinity-1S (Shimadzu, Kyoto, Japan) coupled with a HATR 10 accessory with a diamond crystal. The spectra were obtained over a wavenumber range of 400–4000 cm−1 at a scanning velocity of 200 scans with a resolution of 2 cm−1.

2.4.4. Thermogravimetric Analysis (TGA)

Thermogravimetric analyses (TGA) to evaluate variations in the thermal stability of polymer materials—specifically CA (Mn 30,000 and 50,000), recycled CAt, and PEG2000—and samples of fibres were carried out using Hitachi STA 7200 equipment (Fukuoka, Japan). The samples were placed in platinum crucible (Mettler Toledo, ME-26763, Columbus, OH, USA) and exposed to a heating rate of 10 °C/min over a range of 25 to 500 °C for all samples. The measurements were carried out under a N2 atmosphere of 200 mL/min. The test was carried out using an empty crucible as a reference.

2.4.5. Differential Scanning Calorimetry (DSC)

To evaluate the phase change behaviour of the samples and verify the phase change temperature, melting enthalpy, and endothermic changes in the materials (specifically CA (Mn 30,000 and 50,000), recycled CAt, and PEG2000) and the fibre samples, DSC analyses were carried out using Mettler Toledo equipment, model DSC-822 (Columbus, OH, USA), and a cooling accessory (Labplant RP-60 cryostat, Huddersfield, UK). The polymer material samples were placed in an aluminium crucible (Mettler Toledo, ME-26763, Columbus, OH, USA) and exposed to a heating rate of 10 °C/min over a range of 25 to 500 °C for all samples under an N2 atmosphere of 200 mL/min.

2.4.6. Mechanical Performance–Dynamometer

The mechanical properties of the fibres, such as tensile strength, were evaluated using a dynamometer test. The tensile strength and the maximum elongations of the fibres were determined using a Housefield H5KS dynamometer (Artilab, Kerkdriel, The Netherlands), associated with the QMAT Materials Testing & Analysis software, version 3.51, following the ISO 2062-2009 standard [40]. Fibres of 10 cm in length were analysed at RT with a holding distance, also known as gauge length, starting at 100 mm and increasing continuously until the maximum elongation to break was reached. The extension range was 5 mm, and the crosshead velocity was set at 25 mm/min, using a load cell of 250 N applied with a preload of 0 N and a load interval of 100 N.

3. Results

3.1. Degree of Substitution for CAt

The process of verifying the degree of substitution for the CAt was carried out by initially separating 0.1 g of the recycled CAt in a flask and adding 5 mL of NaOH solution (0.25 mol/L) and 5 mL of absolute ethanol. After the samples had rested for 24 h, 10 mL of HCl solution (0.25 mol/L) was added and left to rest for 30 min. Finally, three drops of phenolphthalein solution were added to each of the samples, and the acid–base titration was carried out by shaking the samples and using the standardised NaOH (0.25 mol/L) solution until a pink colour was achieved. Puleo et al. (1989) stated that by calculating the degree of acetylation (%GA), it is possible to determine the degree of substitution of the Cat, since a %GA of 43.5% is associated with a degree of substitution (DS) of 2.88 [38]. Thus, the DS of the CAt samples was calculated, and the results are shown in Table 1.
As can be seen, the recycled CAt showed a DS of ≈2.83 (very similar to the theoretical value) and a %GA of 42.80%. These results show that the acetyl groups partially replaced the hydroxyl groups through an acetylation reaction, making it possible to obtain the recycled CAt. These results are in line with those of the commercial samples. CA is the most important ester of cellulose, with the OH groups of cellulose being replaced with acetyl groups at a DS of approximately 2.50 [41].
During the testing of the DS of recycled CAt, it was shown that there can be a large amount of intermolecular interaction between the two hydroxyl groups, between two acetyl groups, and between the hydroxyl and an acetyl. These intermolecular interactions contribute to the packing and movement of the cellulose acetate chains. Since all positions are approximately uniformly acetylated, the type and number of intermolecular interactions are also distributed uniformly throughout the polymer [38]. Therefore, due to the results obtained, recycled CAt can be tested in the manufacturing of fibres.

3.2. Fibres Production

The different (functionalized) fibre samples were designated by an alphanumeric string, as shown in Table 2, called Fu_a_b, Fh_a_b and PCF_a_b/x_y for the fibres with CA/PEG2000 and Fut_b, Fht_b and PCFt_b/x_y for the fibres with CAt/PEG2000. Fu, Fut, Fh, Fht, PCF, and PCFt indicate the type of fibre (uniaxial, recycled uniaxial, hollow, recycled hollow, phase change fibres, and recycled phase change fibres, respectively). Next, the letter a represents the molecular weight (Mn 30,000 or Mn 50,000) of the CA, the letter b represents the concentration of CA (10–20–30 wt. %) and CAt (8 wt. %), the letter x represents the concentration of PEG2000 (40–60–80 wt. %), and, finally, the letter y represents the ejection velocity of PEG2000 (0.100–0.120–0.130–0.140–0.150 mL/min). In this case, the concentration of the solvent DMF, the solvent NMP, the ejection velocity of CA (0.165 mL/min), the ejection velocity of CAt (0.130 mL/min), and the molecular weight of PEG (Mn 2000) were not represented in the alphanumeric string of the samples, as they are constant values. For example, in PCF_30_30/40_140, where the structure PCF_a_b/x_y, i.e., is represented, PCF is the designation for a phase change fibre; the letter a is 30, which is the molecular weight of the CA (Mn 30,000); the letter b is 30, meaning a 30% concentration of the CA solution; the letter x is 40, meaning a 40% concentration of the PEG2000 solution; and, finally, the letter y is 140, referring to the 0.140 mL/min ejection velocity of the PEG2000.
While producing the fibres by wet spinning, it was important to pay attention and record whether the fibres were produced uniformly or presented any defects, which would warrant future testing. Table S1 reports these observations.
In this study, the production of recycled fibres made from CAt in the sheath and PEG2000 in the core was considered, by testing, only to succeed under the same commercial conditions that produced the best results.

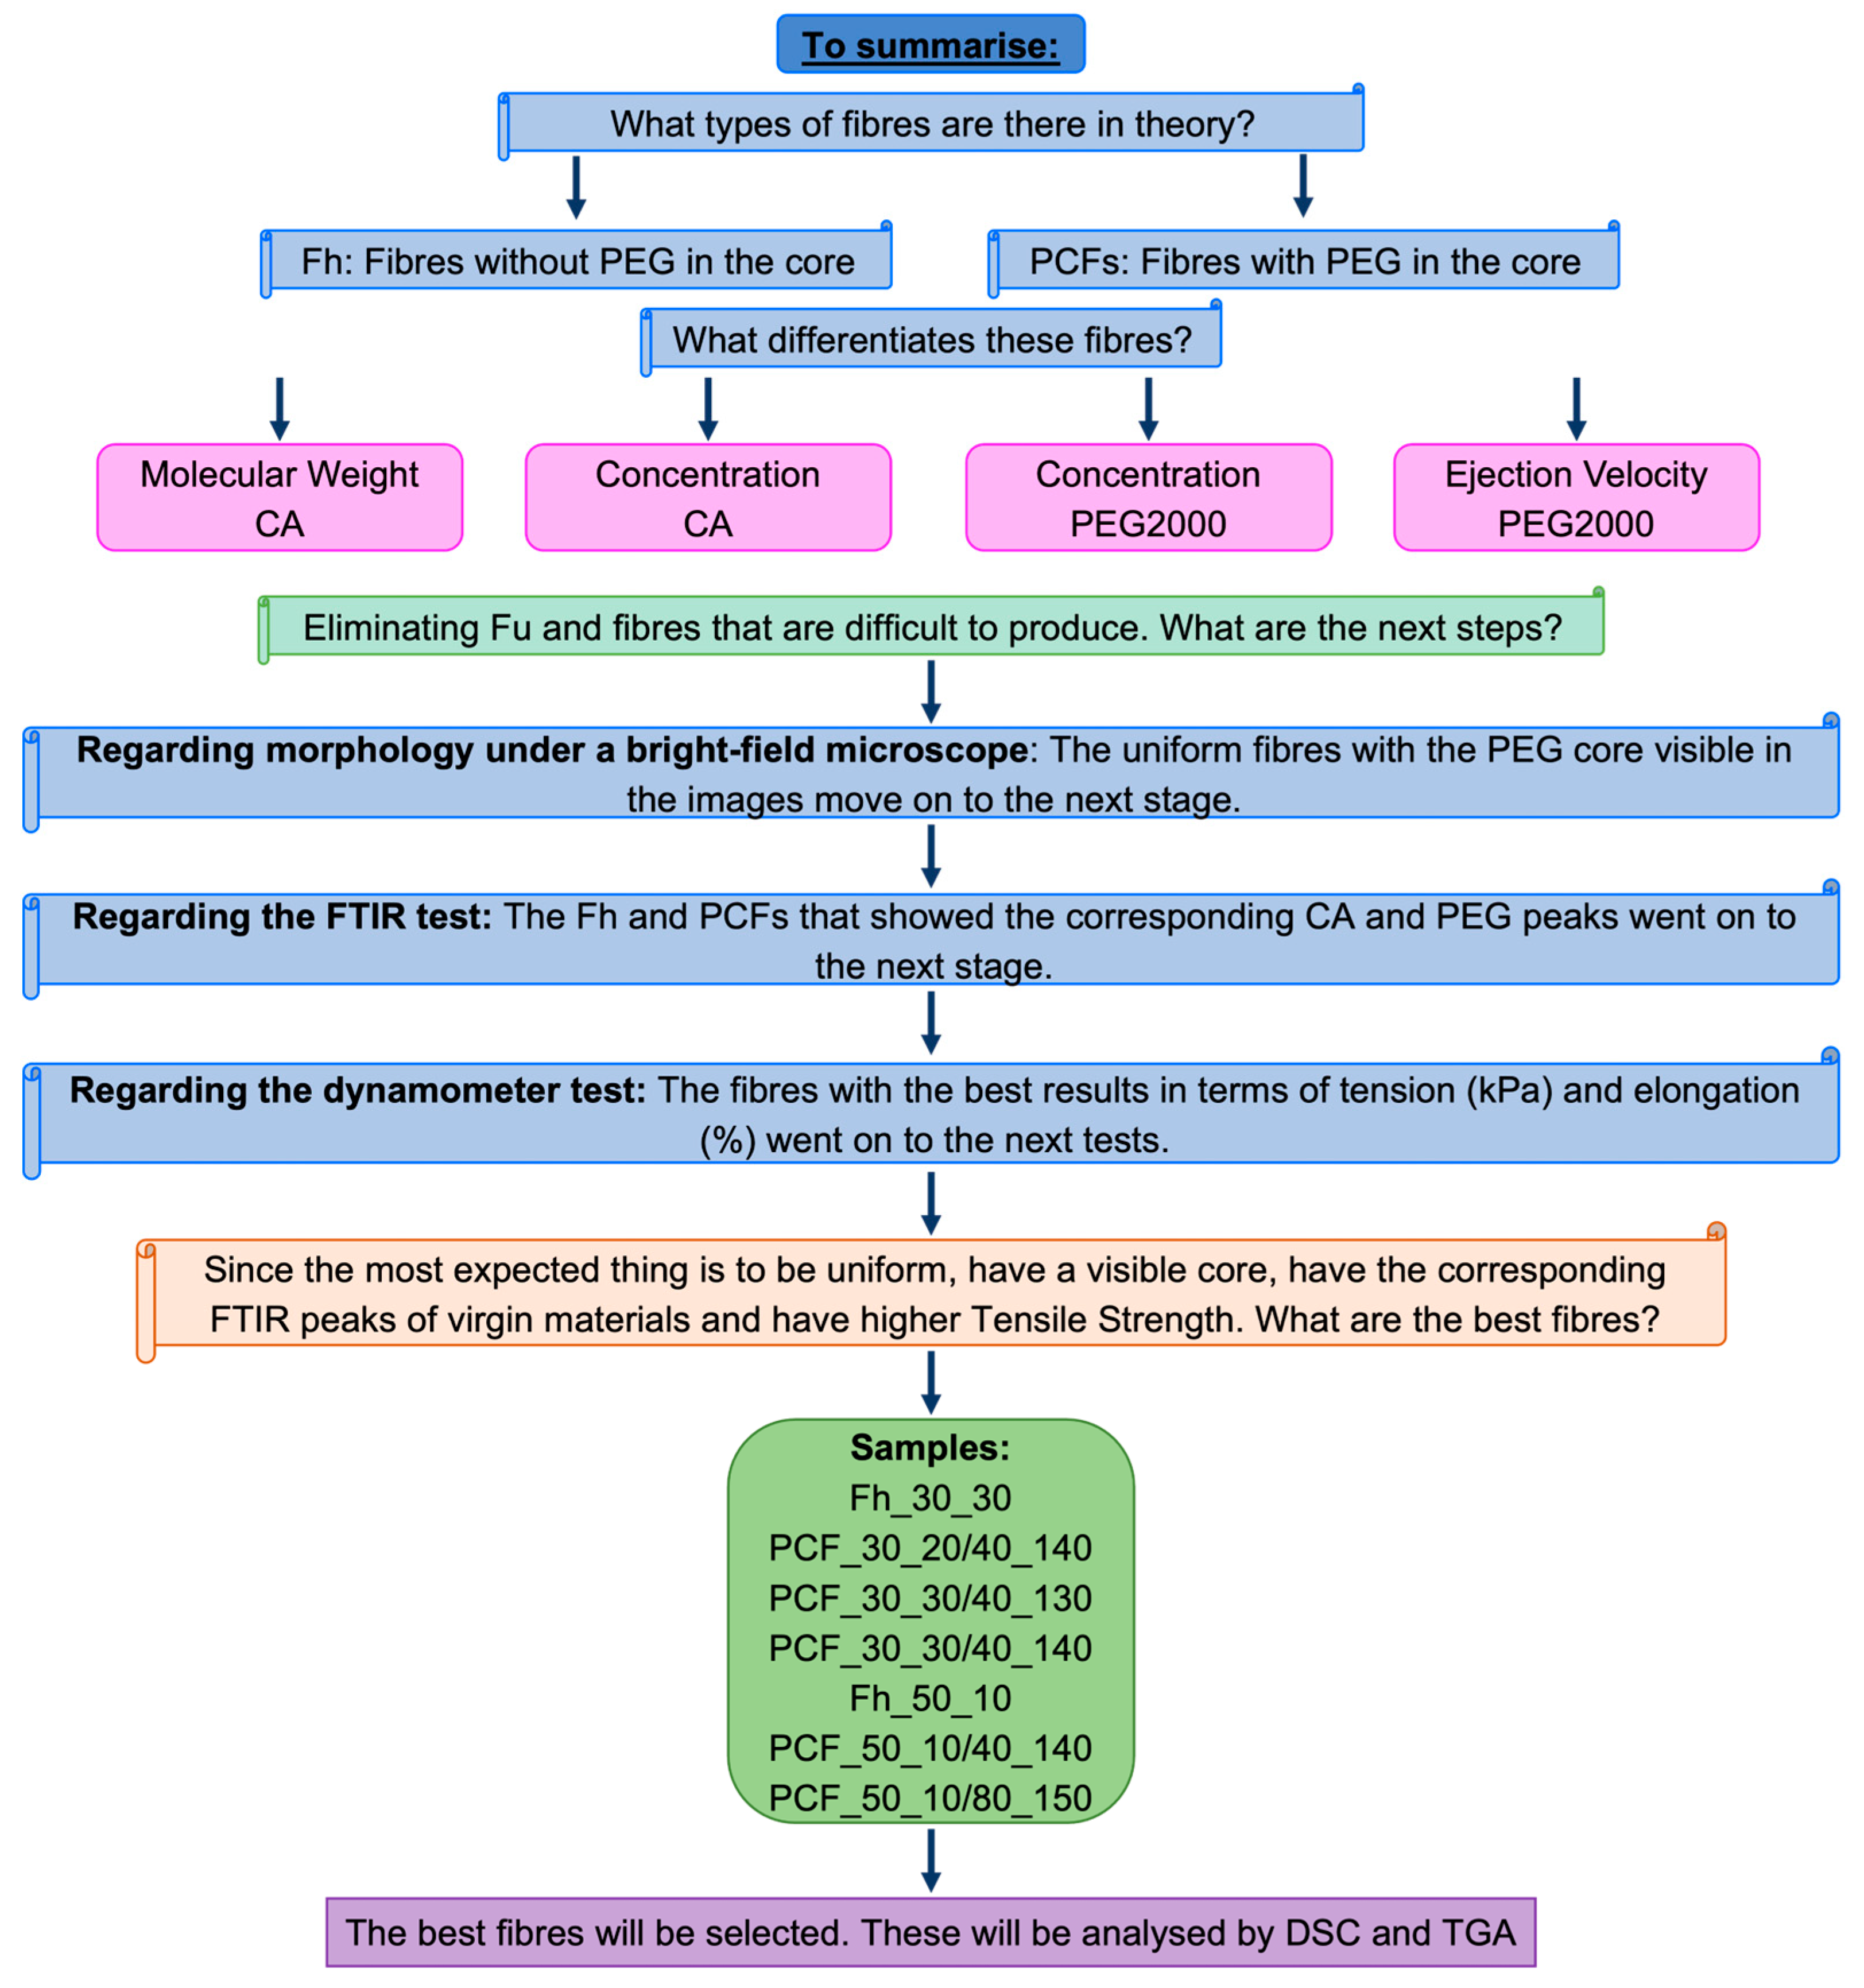
3.3. Sample Selection
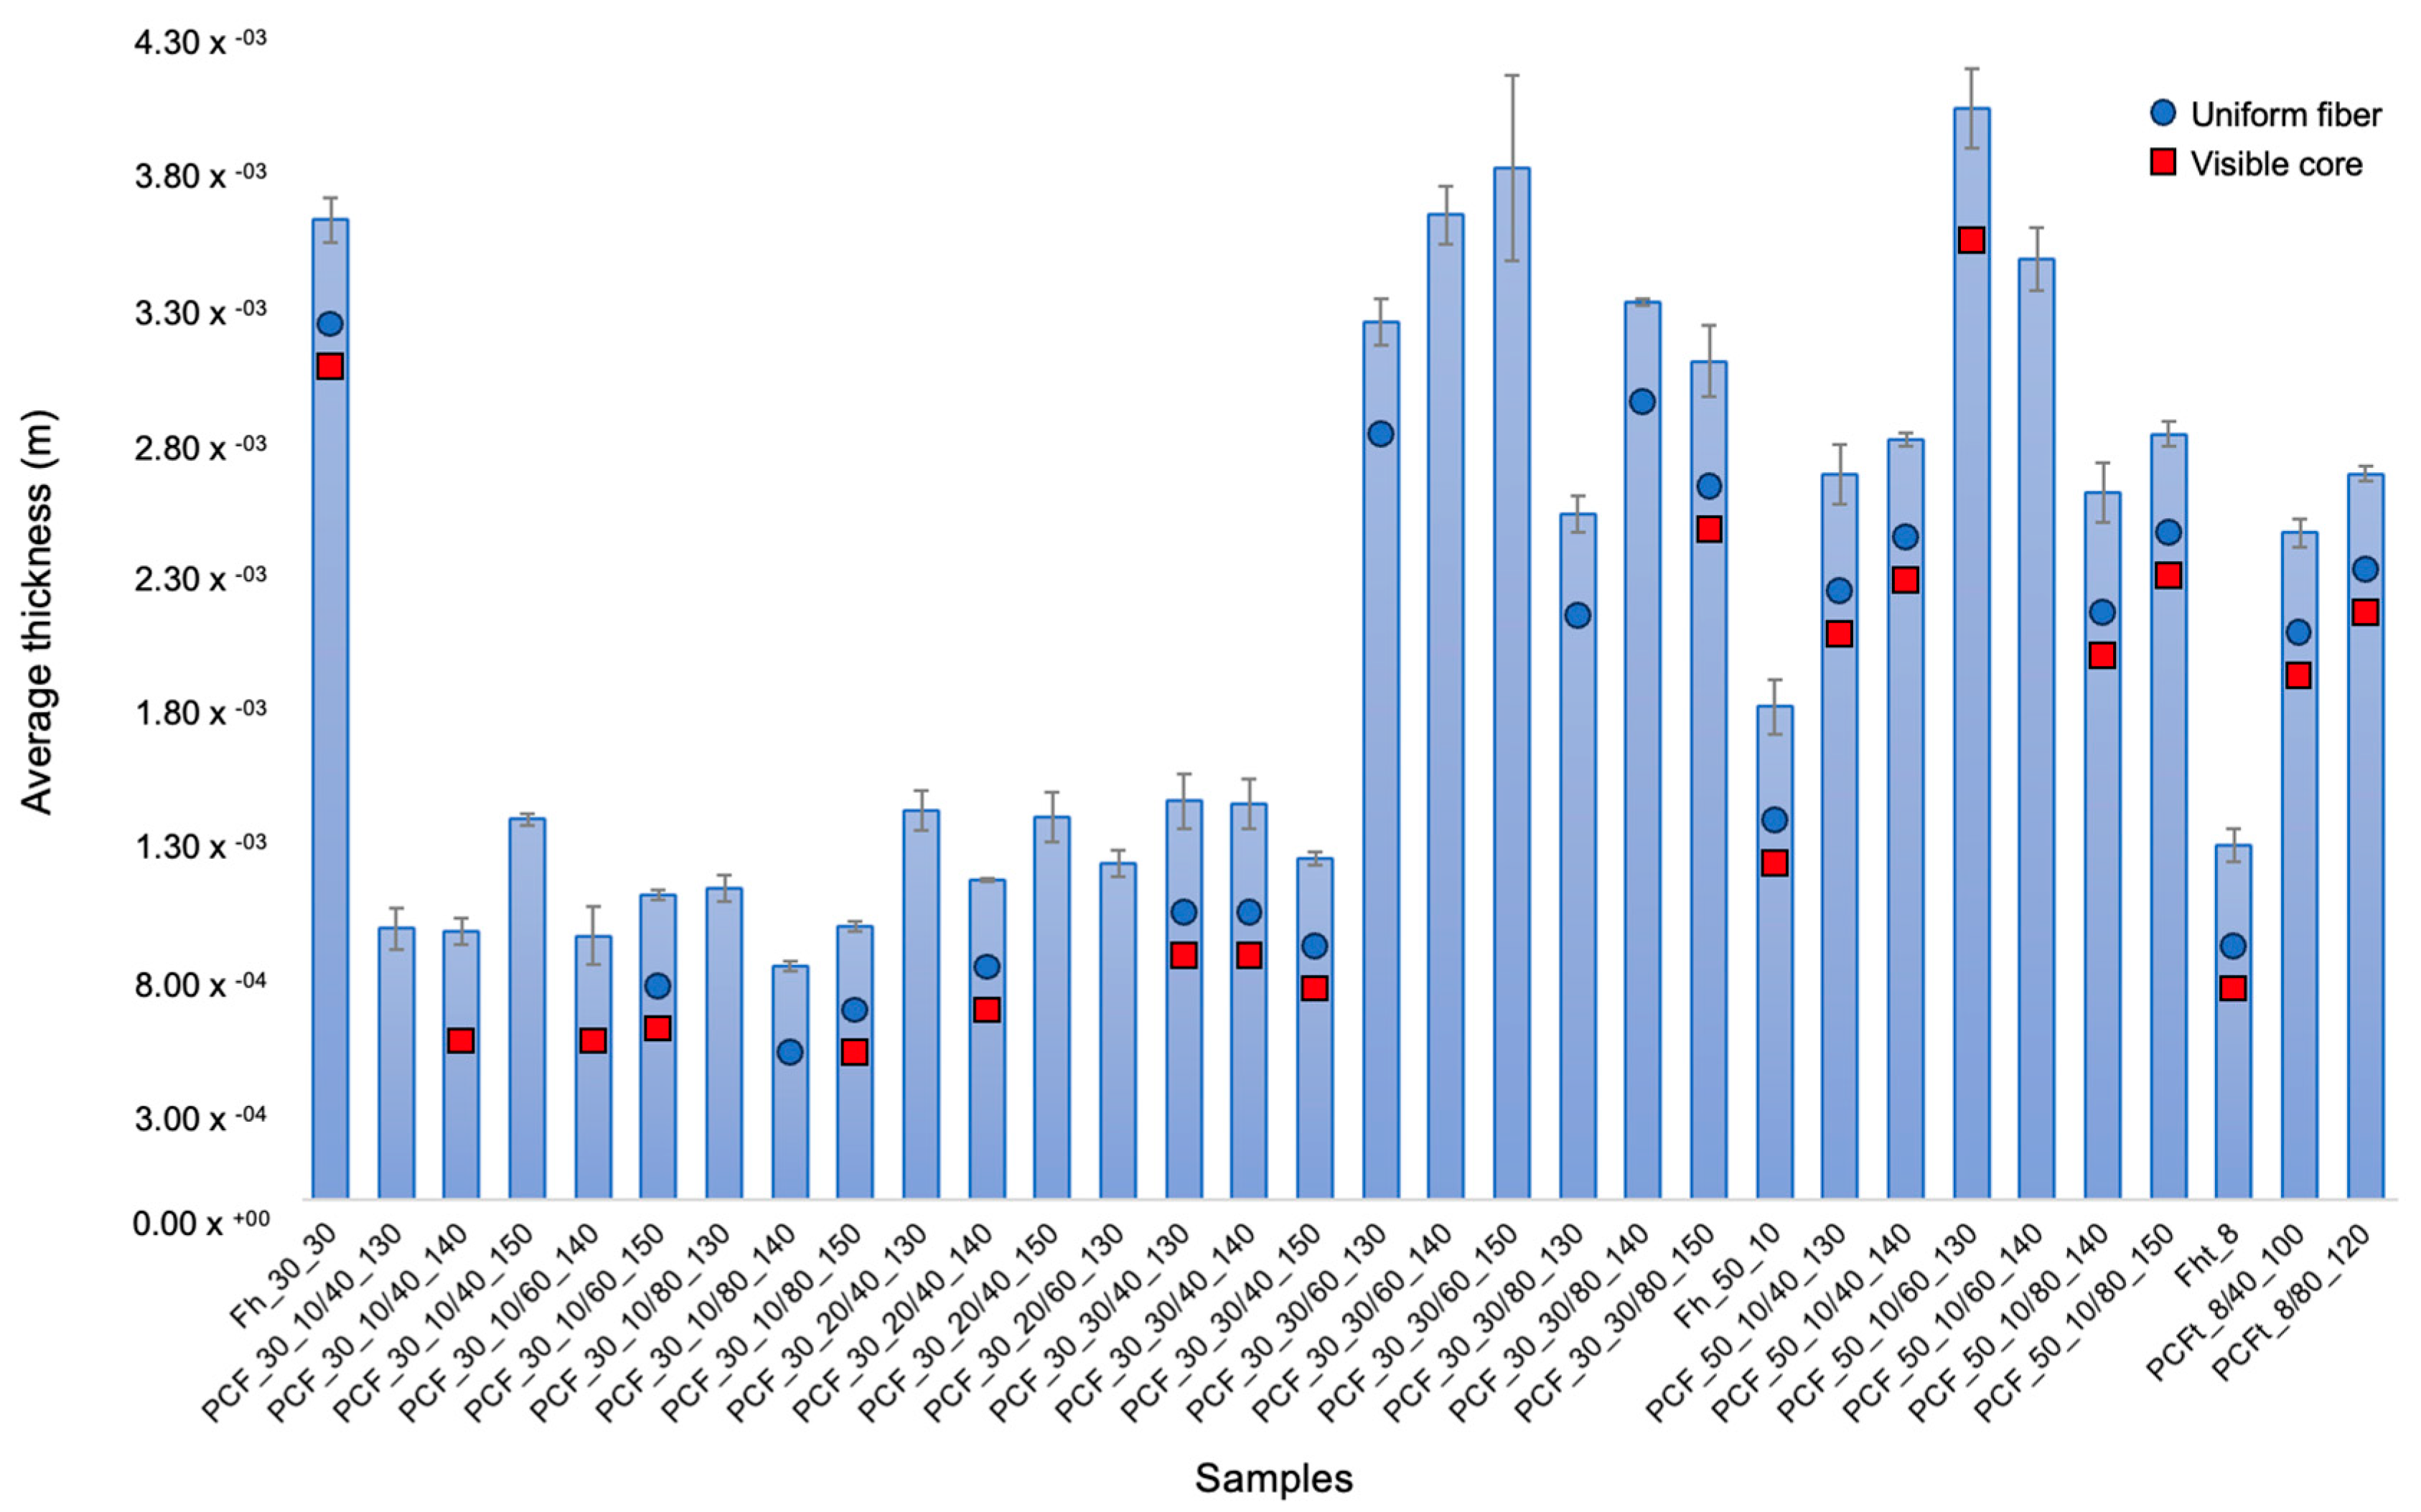
Before starting to analyse the results, a flowchart was drawn up (Figure 6) showing production with CA in the sheath and PEG2000 in the core. This flowchart considered the number of samples produced and their variables. This approach aimed to better organise and justify the choice of the best conditions for carrying out both the production of the samples with recycled CA and more detailed tests, such as dynamometry, DSC, and TGA, which were planned for this article.
The flowchart indicates that the samples with 40% and 80% PEG2000 performed better than the remainder. Therefore, the production of the fibres with recycled CAt followed the same conditions. In addition to Fut and Fht, PCFt was produced with 40% and 80% PEG2000. The ejection velocities were set at 0.100 mL/min for 40% and 0.120 mL/min for 80% for both CA and CAt.

3.4. Morphology

At this point, only the fibres with the best performance in terms of wet spinning production were analysed. Figure 7 illustrates the morphology of these 13 fibres, where direct observation revealed that PCFs_30_30 have a more rounded, cylindrical shape. This can be explained by the differences in concentration (30 wt. % (Mn 30,000) versus 10 wt. % (Mn 50,000)). The production of PCFt with recycled CA in the sheath and PEG2000 in the core was an innovation that encompassed everything from the solution phase to ejection by wet spinning.
These fibres were then measured for thickness (Figure 8) using ImageJ software. As can be seen in Figure 8, of the 29 fibres analysed, only 13 had a uniform morphology and a visible core. The main difference between CA with Mn 30,000 and Mn 50,000 is in the molar mass of the CA molecules [42,43]. In more practical terms, this difference in molar mass can affect the material’s properties, such as its solubility, viscosity, and mechanical strength.
The different types of fibre structure were observed by SEM, as shown in Figure 9. In general, the structures have an expected shape, where Fu, being uniaxial, has a cylindrical structure. In comparison, Fh has a coaxial hole, albeit a small one, which could be affected by the fact that it was filled with dH2O; when it met the coagulation bath, as it did not have a core structure, the structure collapsed and flattened. The PCF composed of CA (Mn 30,000) in the sheath and PEG2000 in the core had a more cylindrical structure with a larger opening compared to the PCF composed of CA (Mn 50,000) in the sheath and PEG2000 in the core, which not only had a smaller coaxial structure but also had a flattened structure. In addition, the PCFt with a PEG2000 with an 80% concentration in the core showed a similar (albeit less uniform) structure to the PCF_50, with the same PEG2000 concentration.
The presence of PEG2000 inside the PCFs is not noticeable and can be explained by a few possible factors. Firstly, as PEG2000 is diluted in dH2O and is in liquid form, when cutting the PCF samples for SEM, the PEG could leak out. Another viable option is the potential evaporation of the polymer during vacuuming. It is also likely that the magnification of the test was not big enough to detect the PEG2000 in contact with the CA and CAt sheath. Even though PEG detection was not possible, the goal of this test was the visualisation of the coaxial fibres, which was achieved.

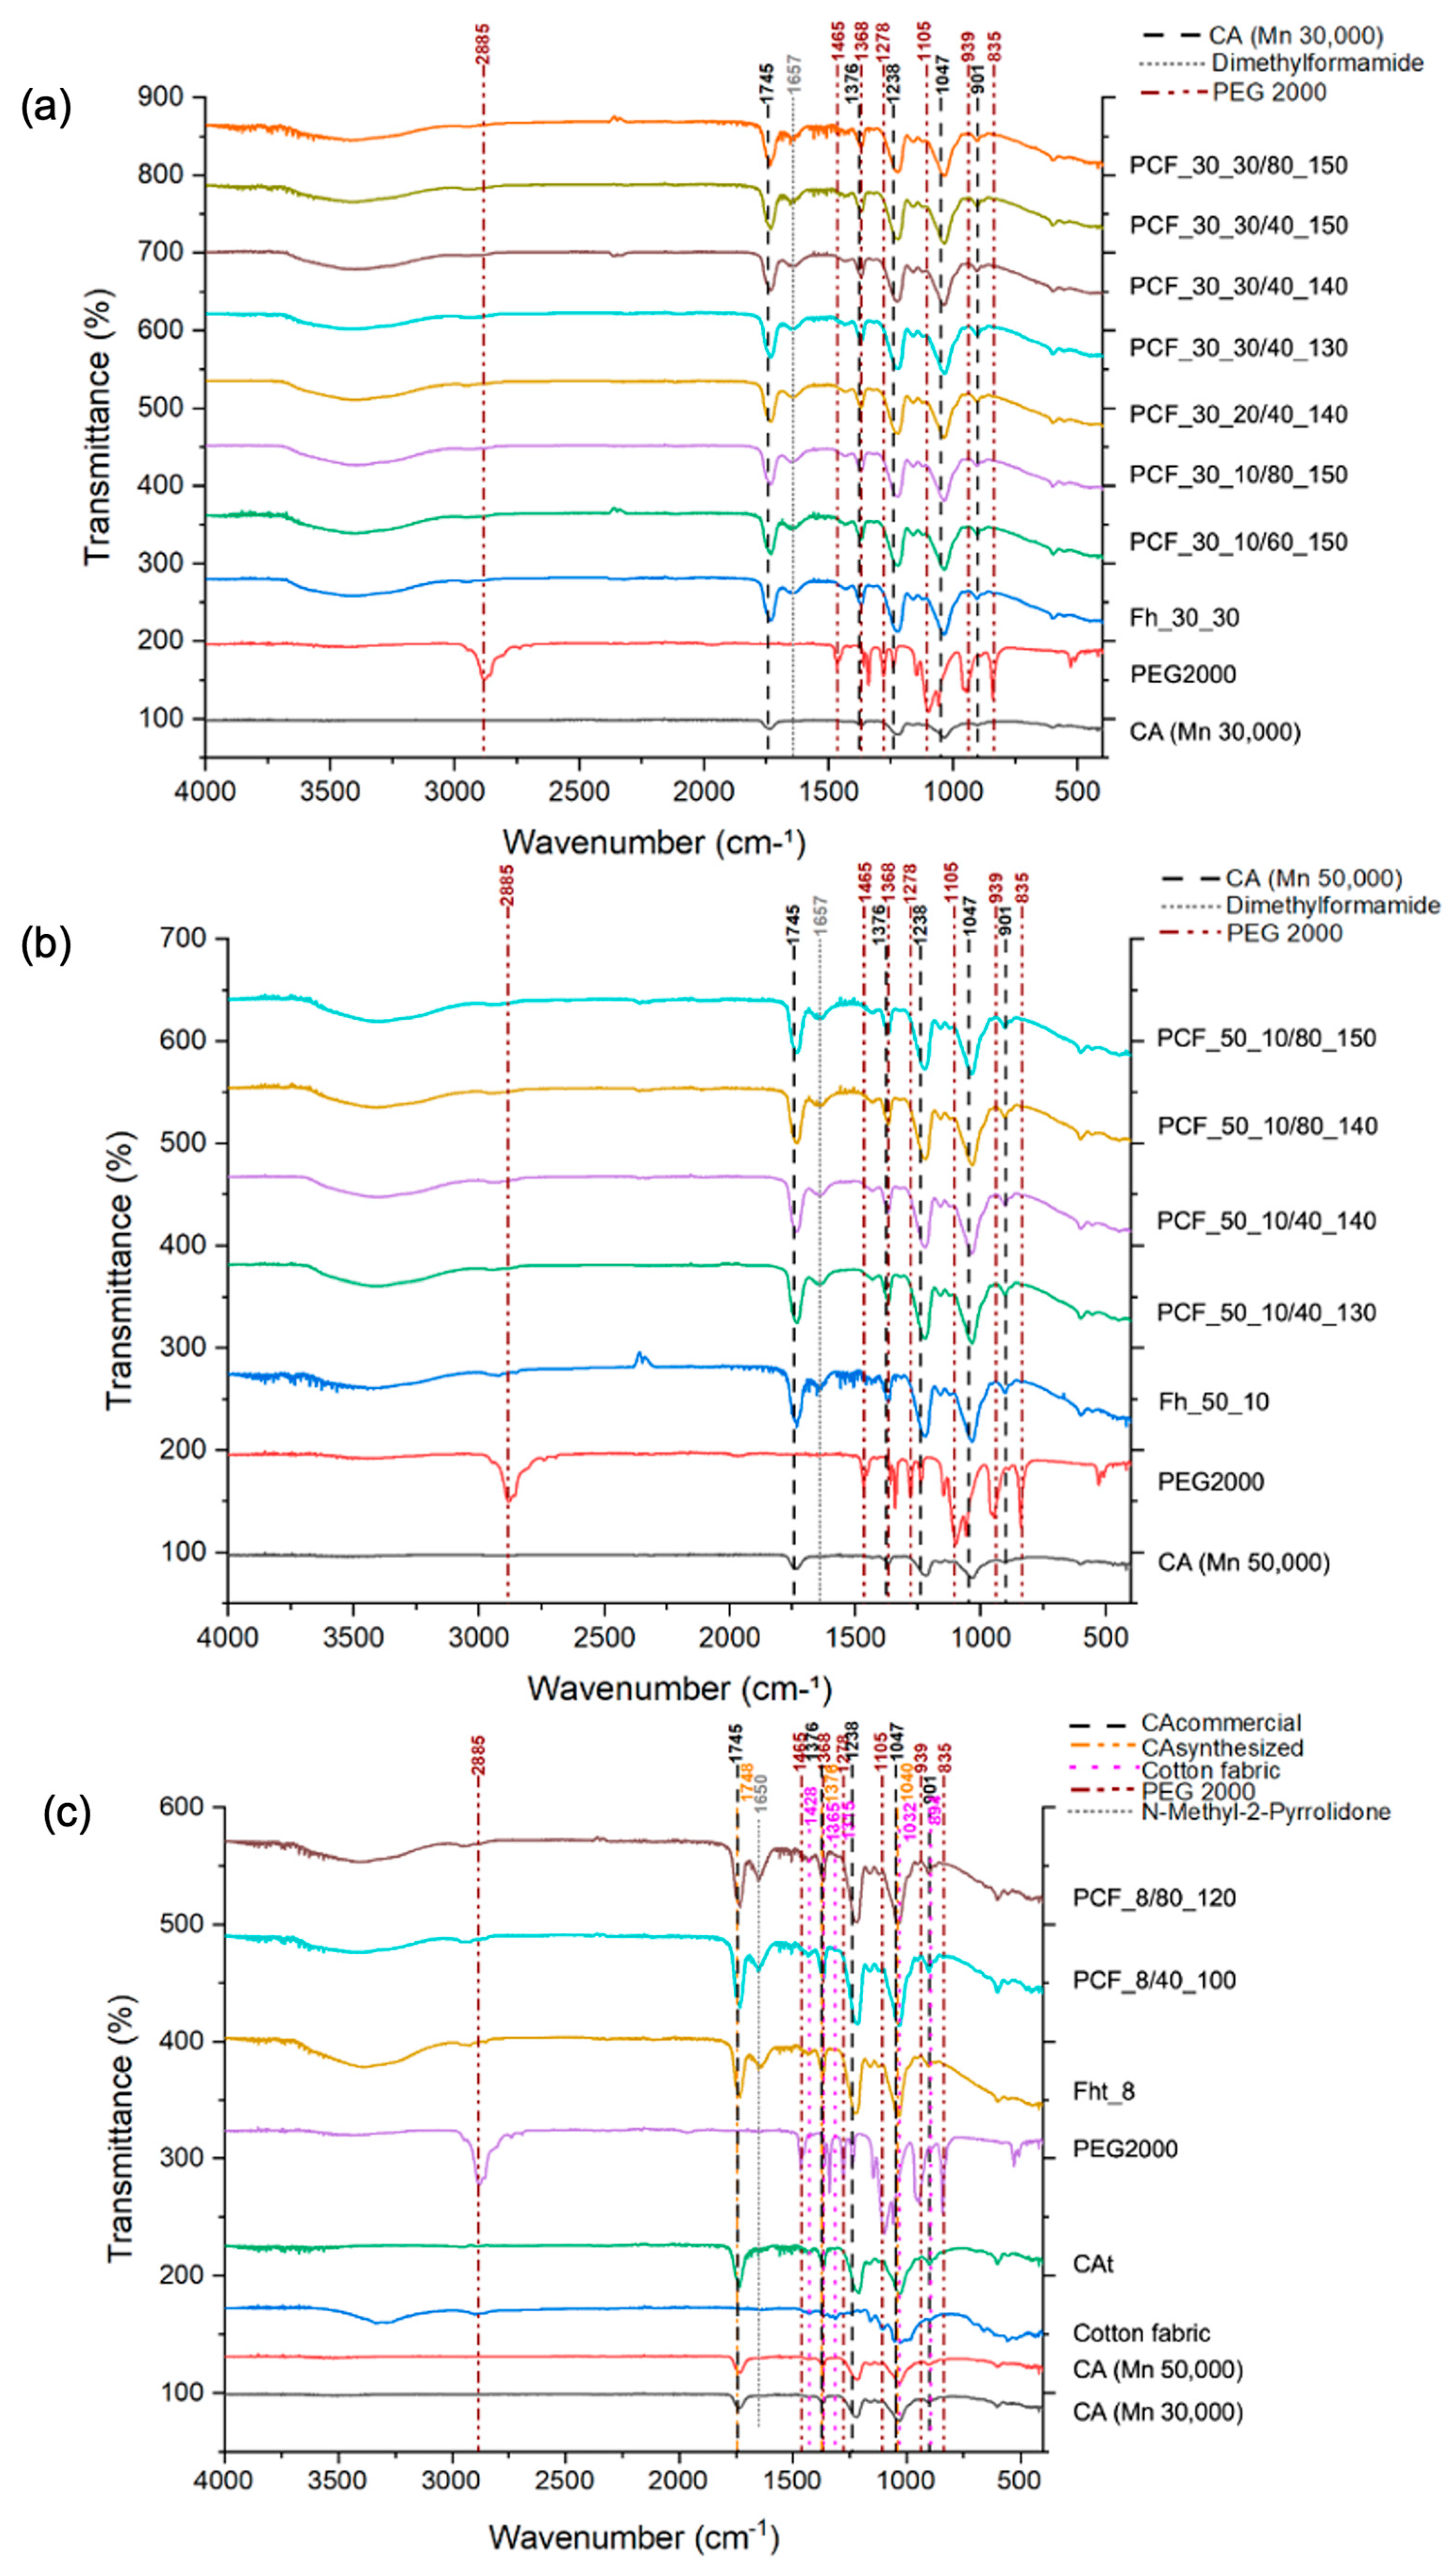
3.5. Chemical Composition (ATR-FTIR)

ATR-FTIR was used to investigate the chemical composition of the hollow and uniaxial fibres derived from CA [44,45]. The obtained spectra revealed characteristic peaks, mainly at 1745, 1657, 1376, 1238, 1047, and 901 cm−1, indicating the prevalent bonds and functional groups within these fibres [46]. The 1745 cm−1 peak was attributed to the stretching vibration of the carbonyl group (C=O) from acetate units, signalling the successful acetylation [47]. A peak near 1657 cm−1, approximating the expected band for C=O stretching in DMF around 1670 cm−1, refers to a potential residual solvent within the resultant fibres [44]. Furthermore, peaks at 1376 and 1238 cm−1 were ascribed to the symmetric deformation vibrations of CH3 in the acetate units and the ester linkage C-O-C stretching in the CA molecule, respectively [48]. A band at 1047 cm−1 confirmed the presence of typical C-O stretching vibrations found in cellulose derivatives, further affirming the structural integrity post fibre fabrication [44]. The 901 cm−1 peak is characteristic of the glycosidic ring’s out-of-plane vibration, cementing the fibre’s polysaccharide character [49].
ATR-FTIR also provided detailed chemical structure analyses of the coaxial fibres comprising a CA sheath enveloping a PEG2000 core (Figure 10a,b). The analysis exhibited noticeable peaks, offering insights into molecular interactions and functional groups within the fibre. The 2885 cm−1 peak resonated with C-H stretching vibrations of methyl (-CH3) and methylene (-CH2-) groups, aligning with PEG2000 repetitive methylene units and cellulose acetate’s structural attributes [50]. A 1745 cm−1 peak corresponded to the C=O stretching vibration characteristic of the acetate groups bonded with the cellulose polymer, underlining the seamless incorporation of the acetate structure [47]. The peak at 1657 cm−1 is notable; while it aligns with C=O stretching vibrations, potentially emanating from residual DMF, it also alludes to potential contributions from PEG (more specifically, any traces of water or -OH group deformations) [51]. Peaks observed at 1465, 1376, and 1368 cm−1 match with the structural vibrations of PEG2000 and acetate groups, signifying methylene deformation and methyl symmetric deformations, respectively [52]. Additionally, peaks at 1278, 1238, and 1105 cm−1 can be tied to varied C-O and C-O-C stretching, denoting the ester connections in cellulose acetate and PEG2000 recurrent ether linkages [53]. Peaks at 1047, 939, and 901 cm−1 further cement the polysaccharide nature of the fibre, with the latter denoting the glycosidic ring’s out-of-plane vibration in cellulose structures [53]. The 835 cm−1 peak might have origins in the PEG framework [50].
An FTIR analysis of the recycled CAt and its respective spectra are shown in Figure 10c. As can be seen, the spectrum for the recycled CAt is very similar to the spectrum of the commercial CA. There is a pronounced band at 1748 cm−1, which may be due to the stretching of the ester’s carbonyl, a characteristic of acetyl groups. Based on the literature, this peak is one of the main indications that cellulose has been acetylated [54]. It is also possible to see the presence of a band between 1300 and 1200 cm−1 (peak at 1238 cm−1), which represents the C-O stretching of acetate. The appearance of the band at 1376 cm−1 corresponds to the vibration of the C-H bond, which is also a characteristic band of acetyl groups. Therefore, the ATR-FTIR spectra indicate that acetylation of the cellulose molecule has been successfully carried out [55].

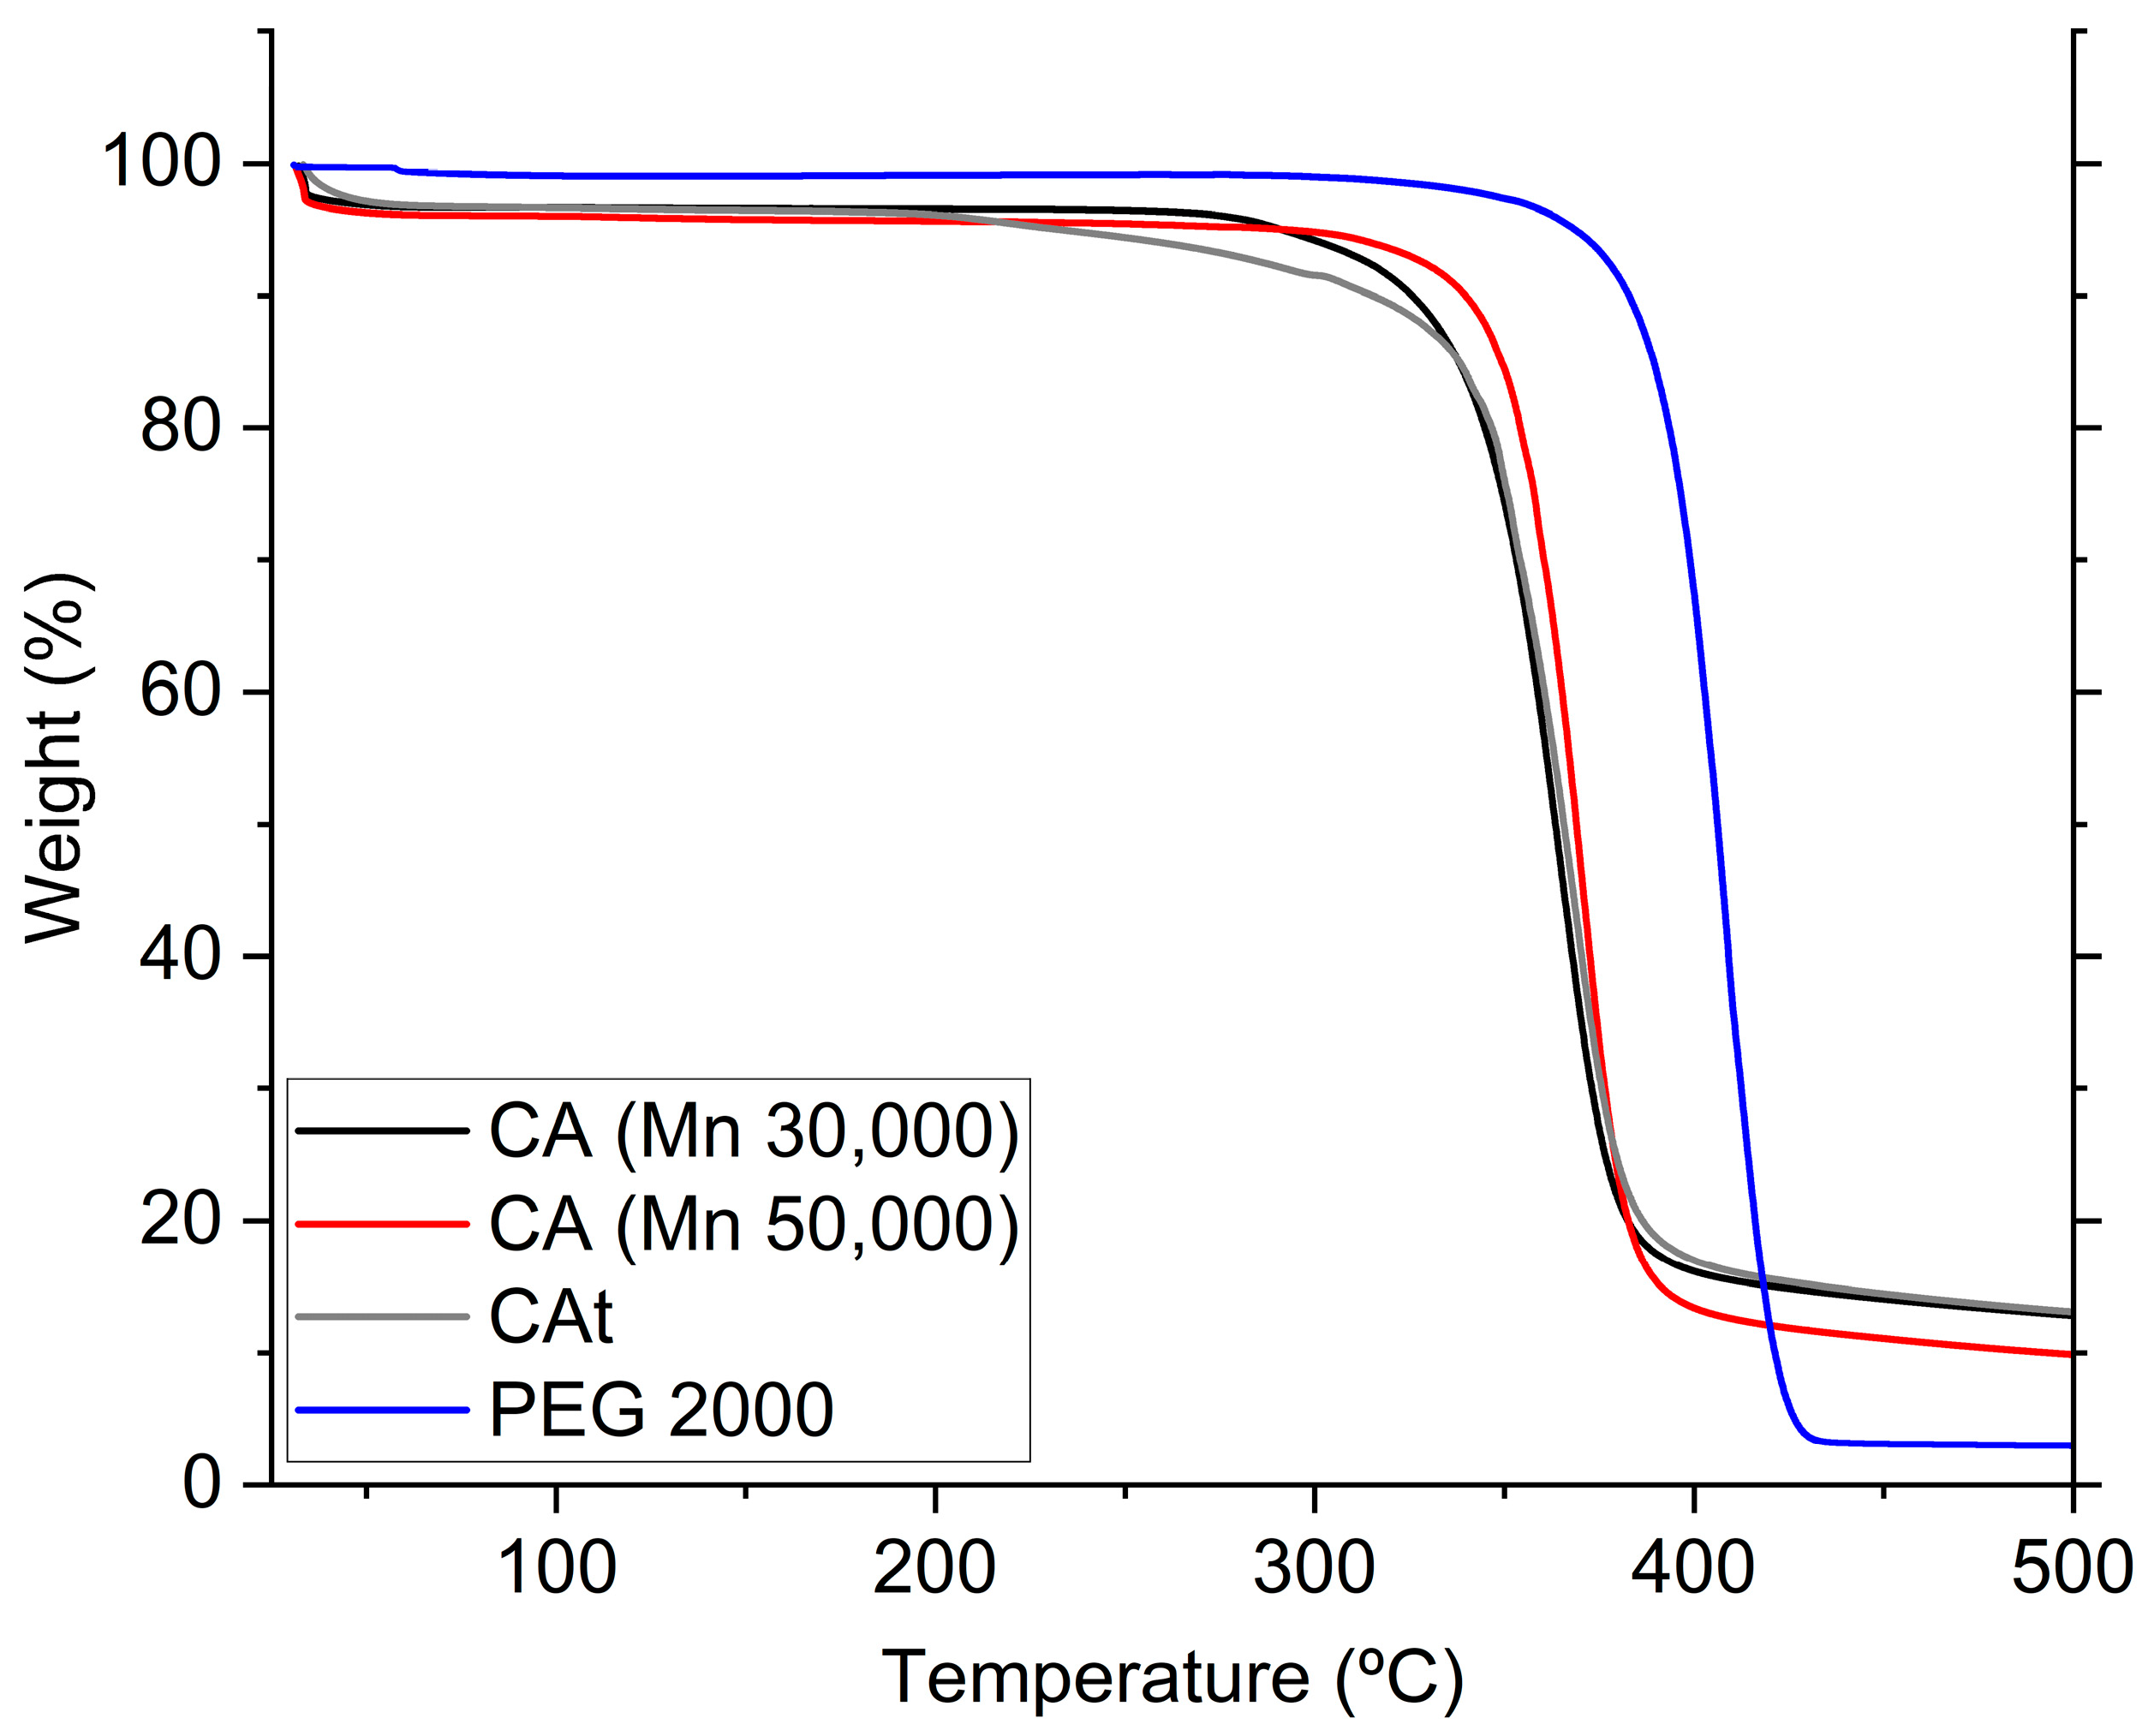
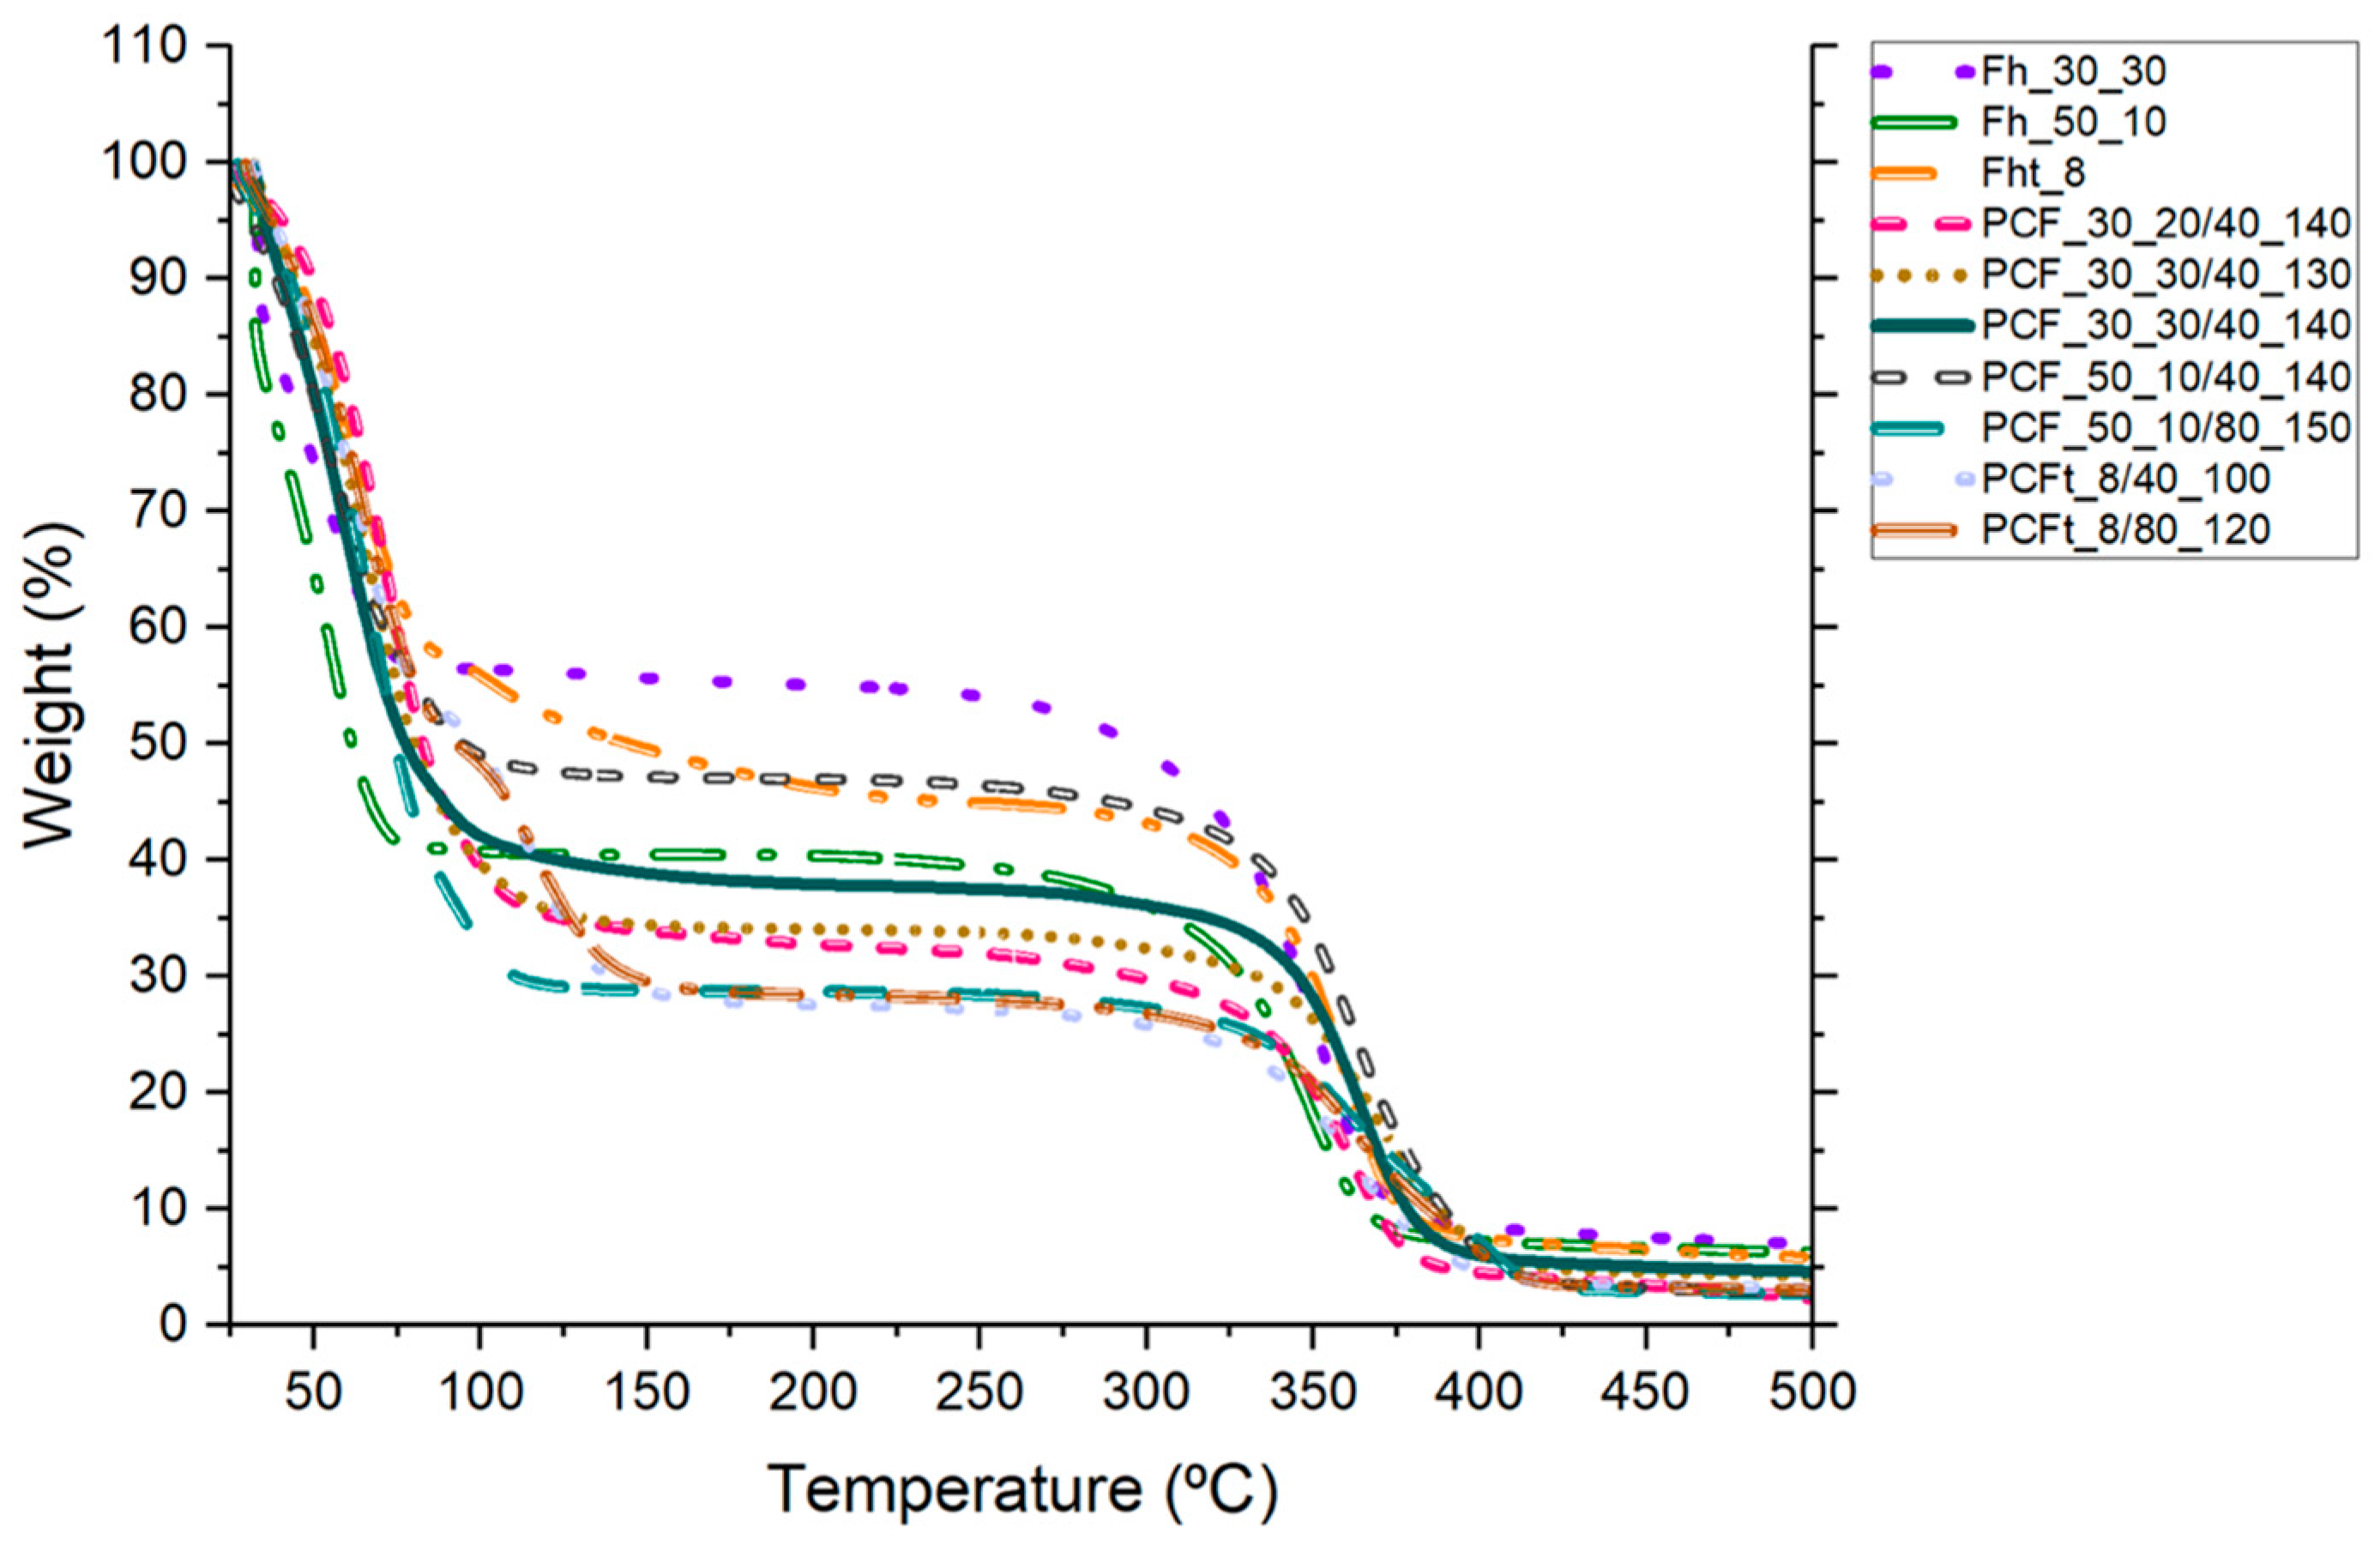
3.6. Thermogravimetric Analysis (TGA)

The increase in temperature associated with polymer degradation was identified in the variations in the fibres’ TGA curves, as shown in Figure 11. In the initial phase, degradation was observed up to ≈100 °C in all the samples, with this phase corresponding to the dehydration of the samples with the elimination of the dH2O molecules (associated with humidity) [56] and potential traces of DMF and NMP solvents. As mentioned in the Materials and Methods section, the fibres were stored for 24 h in a humidity-controlled environment and, to maintain their integrity, they were subjected to TGA without the fibres being completely free of dH2O. Both the Fh and the PCFs showed thermal stability up to ≈300 °C and ≈350 °C, respectively. Thereafter, mass losses were observed, consistent with the endothermic peak recorded in the DSC around 415 °C (Figure 12) [57]. The fact that PCFs, which have a CA sheath and a PEG core, showed thermal stability followed by mass loss at a slightly higher temperature can be explained by the presence of PEG in their core. Thus, the decomposition of the polymer takes place in two phases, with the first degradation due to the breakdown of the PEG2000 chains and the second decomposition due to the breakdown of CA [58]. According to the literature, the pyrolysis process of PEG with a molecular weight above 1000 g/mol generally takes place at a temperature of 350 °C, where thermal decomposition begins at the -C-O- and -C-C- bonds of the two chains and is evident between 340 and 415 °C [59]. However, CA has high thermal stability, with a degradation temperature of over 300 °C [58].
Considering that the PCFs with the best performance were selected, both visually and through mechanical and thermal tests, the results presented by the TGA analysis may be associated with the diameter of the PCFs. The PCFs with Mn 30,000 CA in the sheath had a more cylindrical shape, thus better preserving the PEG at their core, while the PCFs with Mn 50,000 CA showed flattening, which may have compromised the thermal stability of the PCFs (as evidenced in the DSC data) and resulted in a slightly greater loss of mass [24].
Finally, regarding the TGA analysis for PCFt, as with the PCFs, degradation up to ≈100 °C was recognized in all the samples, where the extent of this step corresponds to the dehydration of the samples with the elimination of the dH2O molecules and the NMP solvent present during production. CA synthesized with a degree of substitution of 2.90 registers the most important degradation step at 350–360 °C [55,60]. Therefore, the results for PCFt with a degree of substitution of 2.83 are in line with the literature and show similar thermal behaviour with a degradation temperature of ≈350 °C.

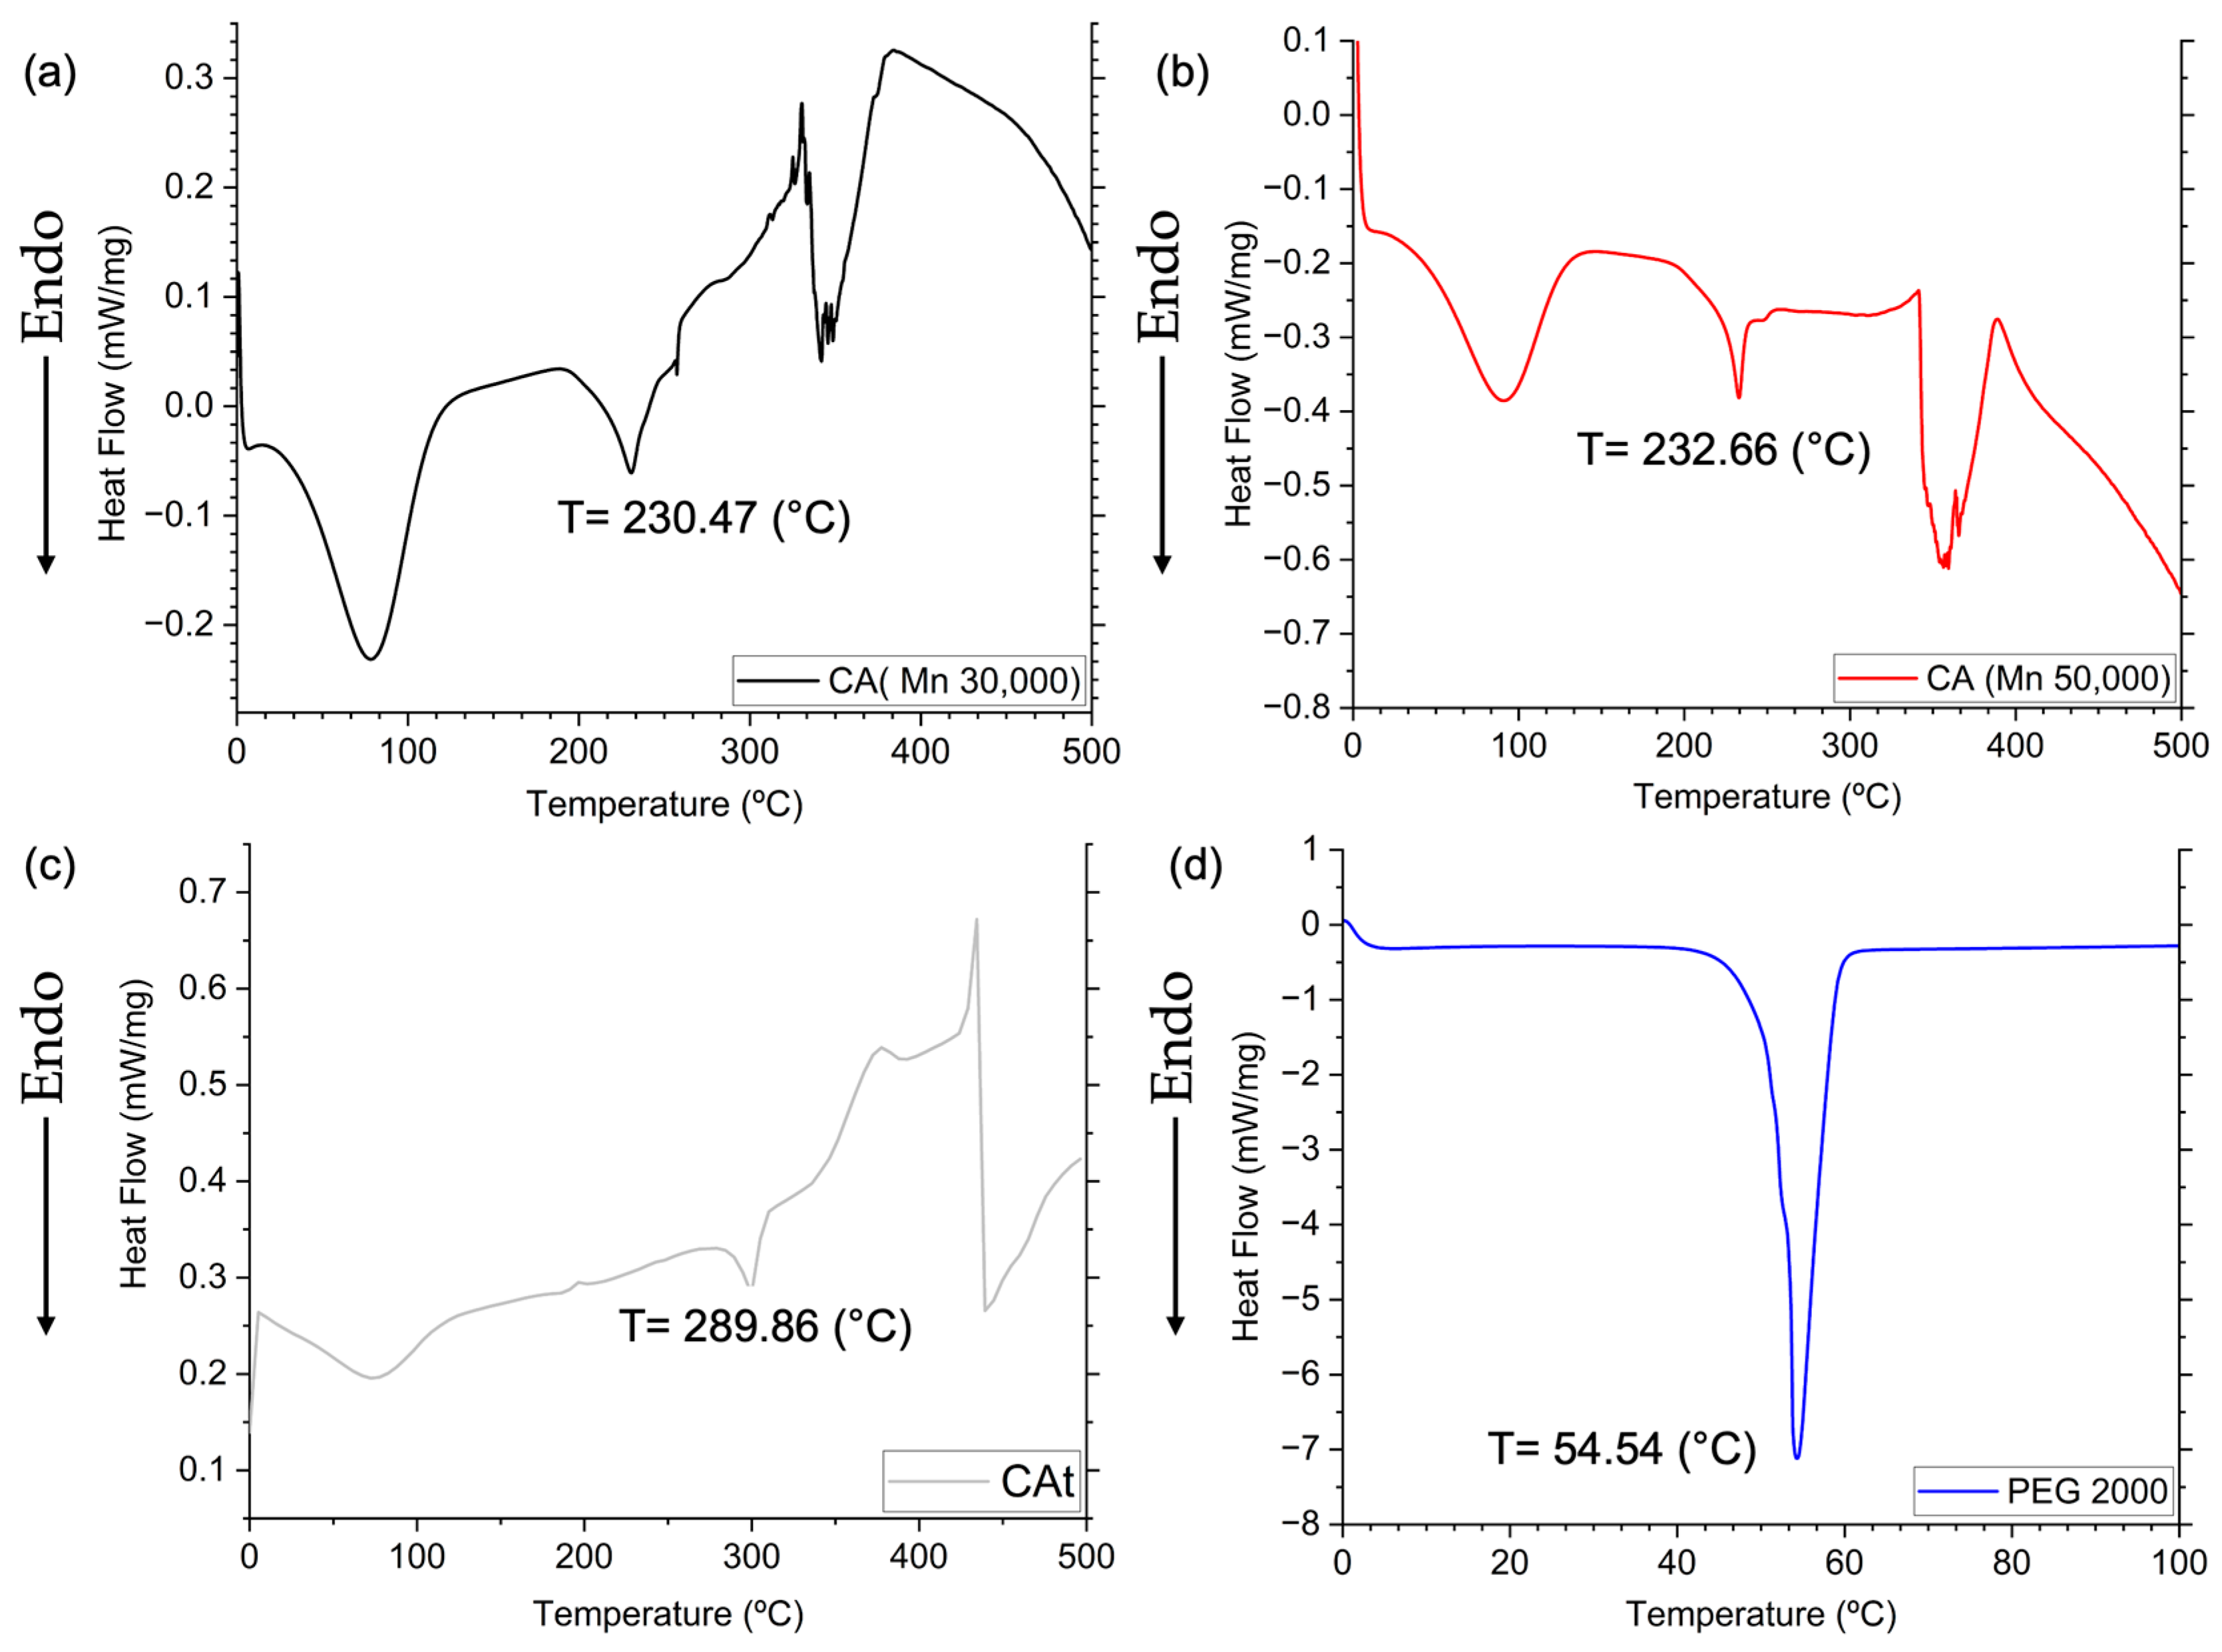
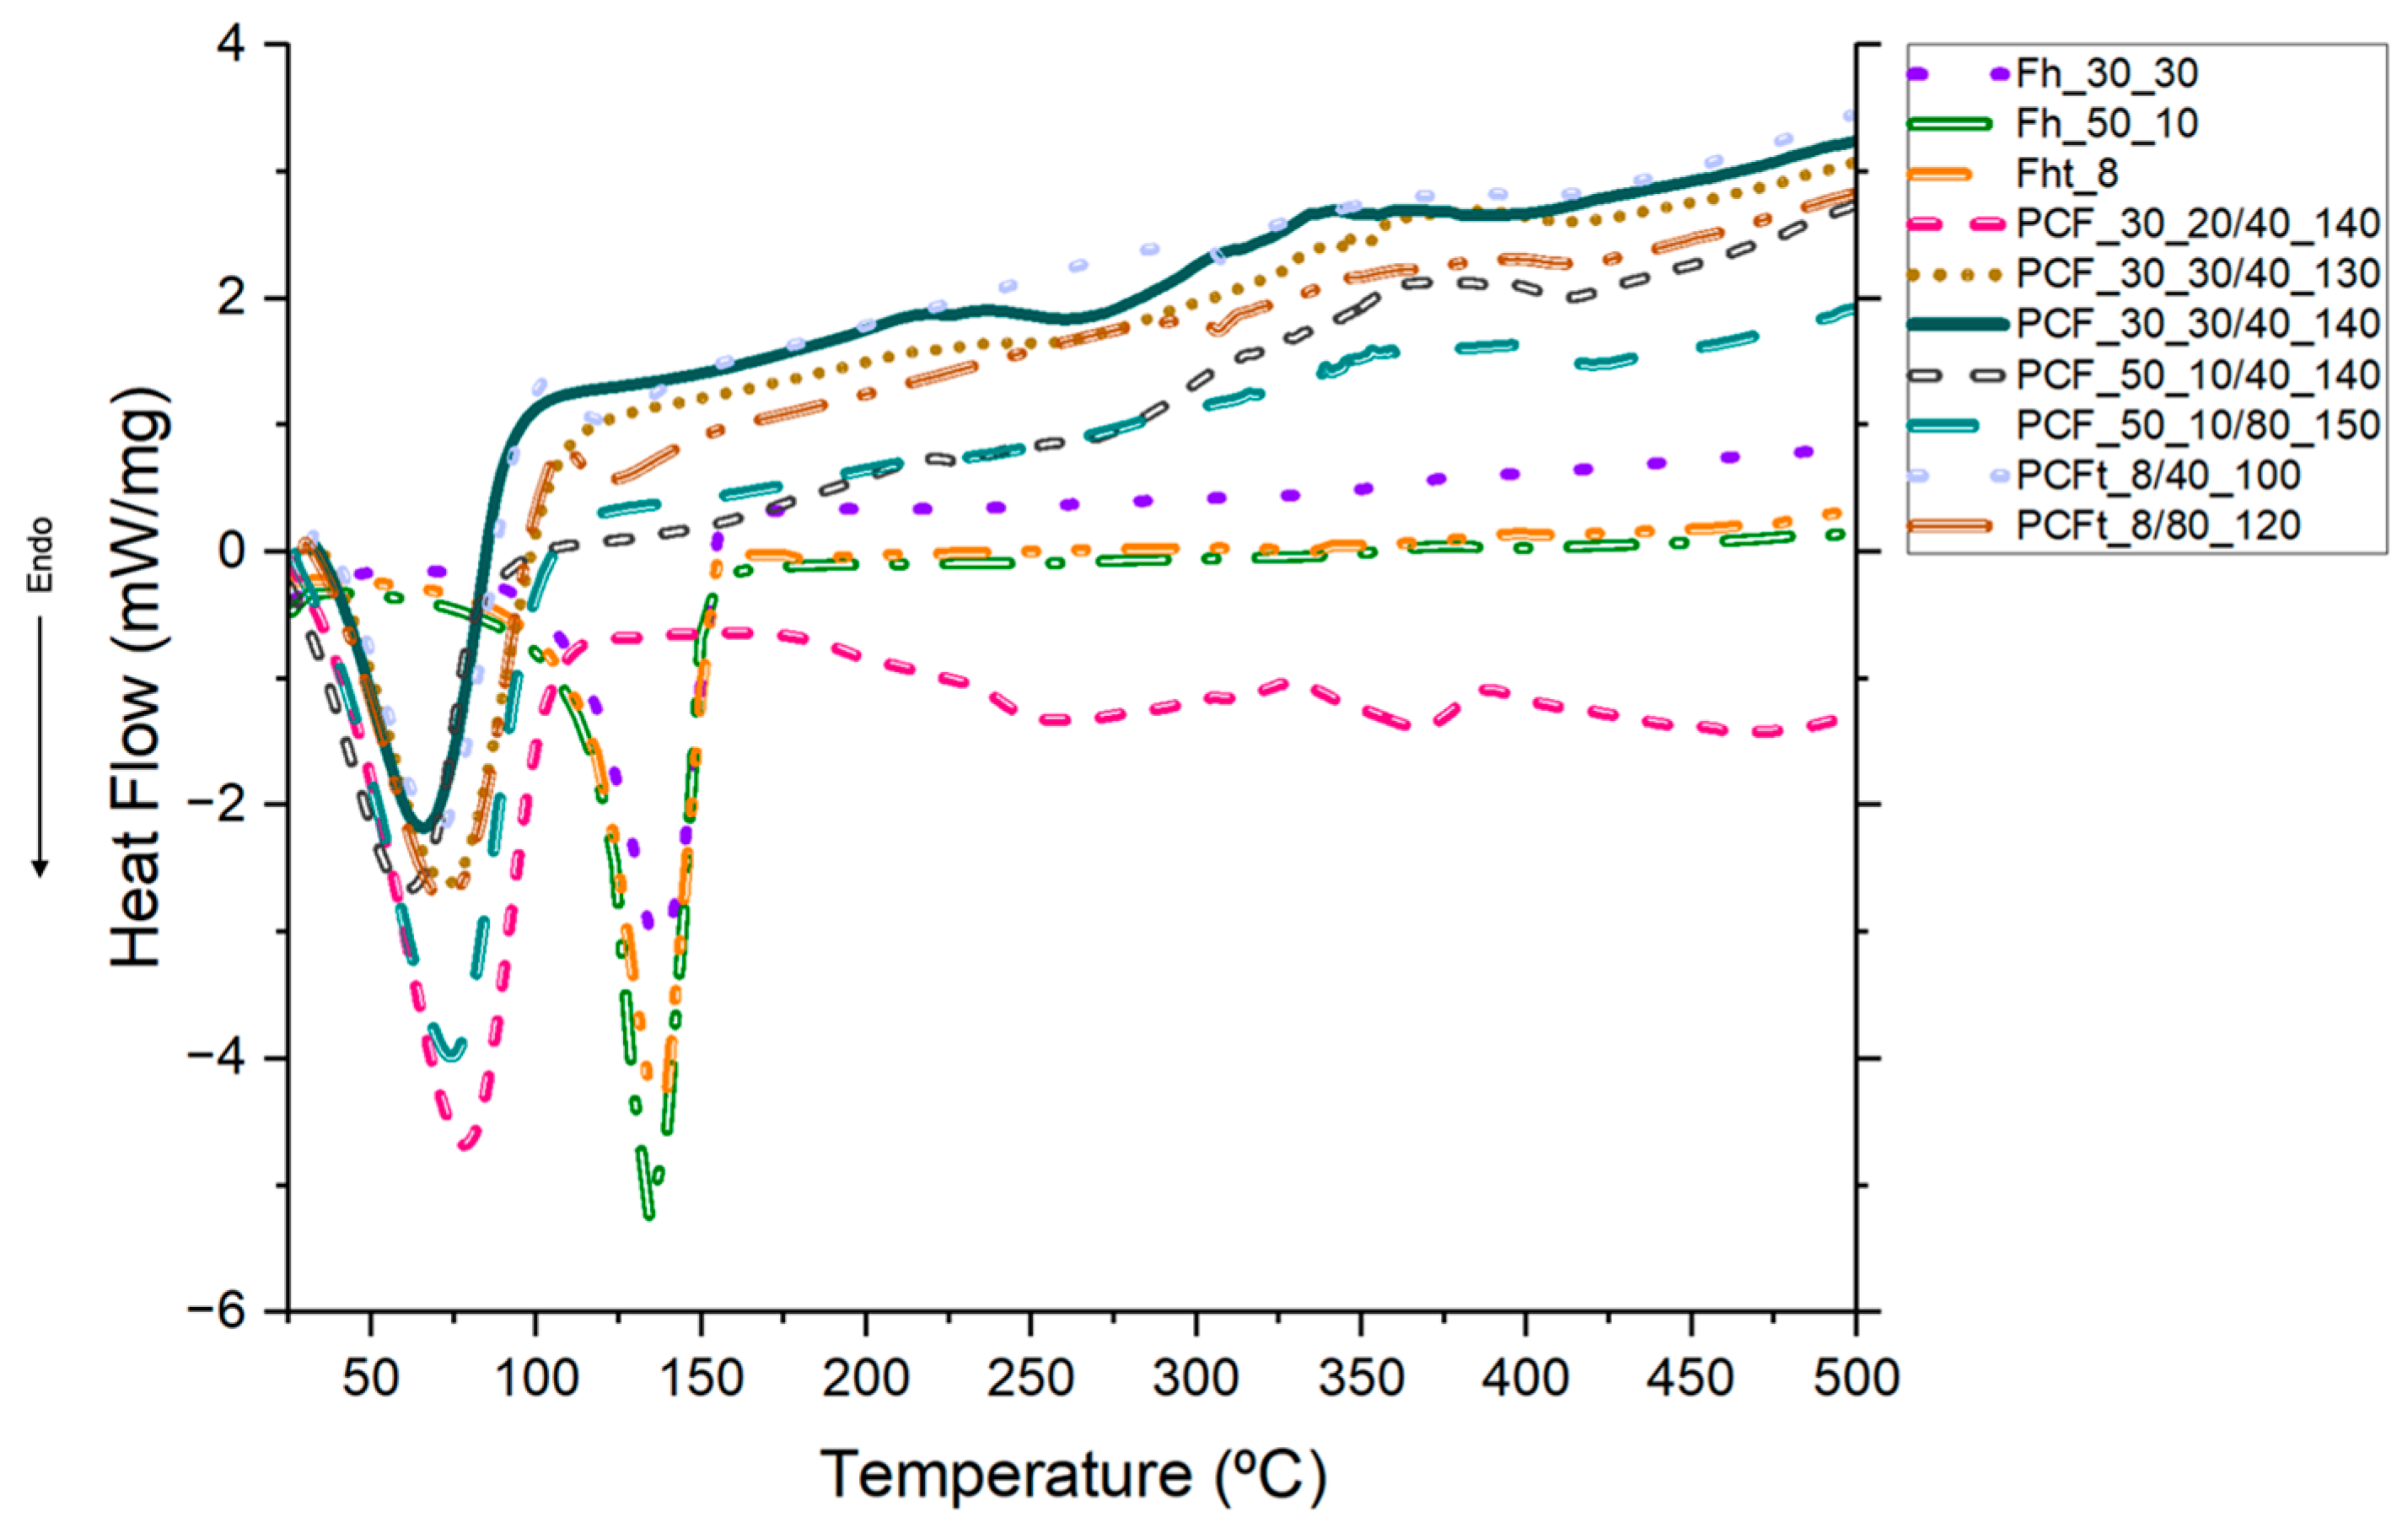
3.7. Differential Scanning Calorimetry (DSC)

DSC is used to study the thermal behaviour of materials and to determine enthalpy [33]. Figure 12 shows the DSC thermograms for Fh, Fht, PCFs and PCFts, in which coaxial fibres have different CA molecular weights and concentrations and different PEG concentrations and ejection velocities. Meanwhile, the corresponding thermal property data from the DSC curves are shown in Figure 12.
At first, both Fh and Fht were subjected to DSC and, as can be seen in Figure 12, an average endothermic transition occurred around 100 °C, which suggests the loss of moisture absorbed from the solvents [20] and the elimination of water molecules [61]. An average peak at ≈137.26 °C was detected and associated with the glass transition temperature of CA [62]. Finally, a last peak was detected at ≈236.08 °C, which was attributed to the crystallisation of the amorphous domains of the CA chains [61].
When the PCFs and PCFts were subjected to the DSC test, different behaviour was seen, where the addition of PEG to the core of the CA and CAt fibres resulted in the appearance of an average endothermic transition at ≈38.30 °C and an average peak, representative of PEG, at around 70.72 °C, with a variation of 10 °C which is attributed to the exothermic crystallisation of PEG [63].
A peak at ≈89.25 °C was also observed because of the interactions between CA, CAt and PEG, which displaced the peak detected in the pristine CA fibres at 92 °C. The introduction of a plasticiser such as PEG into the core lowers the Tg of the CA polymer as it causes a reduction in intermolecular forces, generating protective effects with functional groups such as -OH [34]. The PEG acts as a working material and the CA entanglement, due to secondary interactions, hinders and disturbs the orientation of the PEG molecular chains [58]. This explains the displacement of the endothermic melting peak of PEG2000 crystallisation, since according to Ansu et al., this peak normally occurs in the 46–54 °C range. These interactions between the carbonyl of CA and the hydroxyl groups of PEG occur frequently, and this justifies the displacement of the characteristic PEG peak [63,64]. Finally, two endothermic peaks could still be observed, the first characteristic of CA and CAt at ≈223.85 °C and the second referring to the PEG pyrolysis process at ≈370.55 °C, which generally happens around 350 °C, as detailed in the TGA discussion. As reported, the higher the molecular weight of PEG, the higher the temperature at which the pyrolysis process takes place, which explains the increase of ≈20.55 °C [59].
The peaks around 70 °C determined the enthalpy of phase change (Table 3). This reduction in PEG’s enthalpy of phase change was due to the disturbance in PEG crystallisation caused by the presence of CA [58]. There is a protective CA sheath, which, due to the different molecular weights and concentrations, was better formed for PCFs_30_30; consequently, PEG used less energy to change phases. Meanwhile, for PCF_50_10, as the sheath was less developed and the PCF was flatter, PEG needed more energy to change the phase. This explains why the enthalpy values were lower for PCFs_30_30. Therefore, the corresponding experimental enthalpy values for PCFs_30_30 were lower than the theoretical ones, with the decrease in enthalpy being attributed to PEG crystallisation becoming restricted and the possible entanglement between the PEG and CA molecular chains in the sheath of PCFs and PCFt [65]. Another factor that may have influenced this was the use of different PEG concentrations, i.e., even with a lower concentration for most of the PCFs, the high temperature was able to distribute the solution evenly, so that crystallisation was not negatively affected [58]. Finally, PCFs have good thermal reliability due to the PEG in the core of the fibres, as discussed above.

3.8. Mechanical Behavior

The maximum elongation and maximum breaking strength of the Fh and PCF fibres produced by wet spinning were analysed using 10 cm long filaments (Table 4). This test was carried out to assess and observe the mechanical strength of the fibres.
The fibres that did not show uniformity and a visible core could not be examined, since after the production, they were flattened and open; this is due to the fibre collapsing into its hollow interior and possible clogging of the needle.
Reports have addressed the poor mechanical properties of CA alone as an obstacle to many applications [66]. However, this does not significantly influence PCFs, since the final application depends on the properties of the CA, PEG, and PCF composites working together.
The tensile properties of wet-spun fibres can be affected by different factors, such as the concentration of the CA, the direction of the test, the concentration of the solution, and so on [34].
In this work, the tensile properties of PCFs and PCFt composed of CA and CAt in the sheath and PEG2000 in the core were measured, examining the extent to which the concentrations of CA and PEG can influence the final data. The cross-sectional area of the fibres was measured using bright-field microscopy (Figure 8), and from those values, the stress (kPa) could be calculated for each of the fibres. The maximum stress–stretch values for Fh and PCFs are shown in Table 4.
The mechanical properties of PCFs are also sensitive to the acetyl content; the tensile strength and modulus of elasticity are higher in CA with lower molecular weights and higher concentrations. This indicates that increased acetylation produces a stronger and stiffer material. The glass transition decreases as the degree of acetylation increases, reflecting the reduced fraction of the amorphous phase [38]. Following the reasoning in the literature, comparisons between PCFs—where the difference was in the molecular weight of the CA—showed that fibres with a molecular weight of Mn 30,000 exhibit higher tensions while fibres with Mn 50,000 show considerably lower values. This discrepancy can be attributed to the fact that PCF_30_30 has a thicker and more well-formed sheath compared to PCF_50_10. As for the comparison between the PCFs, where what changes is the concentration of CA, the conclusion is that the higher the concentration of CA, the higher values of elongation and tension. When the comparison factor was the concentration of PEG2000, we observed that the lowest concentration, 40%, showed better results than the higher concentrations. Finally, the PEG ejection velocity was peculiar, while the moderate PEG velocity (0.140 mL/min) showed considerably higher values. This can be explained by the fact that during fibre production, a moderate ejection speed (0.140 mL/min) can mean that the PEG does not mix with the CA sheath, remaining stored inside and considerably increasing the tension values [33]. As shown and discussed above, the PCFt had a less uniform morphology and structure and because of that, these fibres were more fragile and reported much lower values than expected compared to PCFs with commercial CA.
Therefore, the fibre with the highest tension value was PCF_30_30/40_140, which met all the requirements of the previous analyses.

4. Conclusions

In this study, an innovative approach was used to produce coaxial fibres using the wet spinning technique. These fibres were composed of cellulose acetate (CA) in the sheath, with different molecular weights and concentrations, while the core was made up of polyethylene glycol 2000 (PEG2000) with different concentrations and ejection speeds. The research aimed to improve the thermal properties of these fibres for potential applications in civil engineering. Chemical, thermal and mechanical tests were conducted to investigate the presence and impact of PEG2000 on the fibres. The results confirmed the successful production of coaxial fibres (PCFs) and the synthesis of recycled cellulose acetate (CAt). Microscopic analyses, including bright-field microscopy and scanning electron microscopy (SEM), differentiated between the core and the sheath, confirming the existence of coaxial fibres. Despite the challenges in confirming the presence of PEG2000 by SEM due to its liquid state, ATR-FTIR analyses showed representative peaks for CA, CAt and PEG2000 in all PCFs. Thermal tests (TGA and DSC) confirmed the presence of PEG2000, with the CA sheath influencing the displacement of the phase change peak and the decrease in PEG2000 enthalpy. The mechanical tests revealed varied performance between the fibres, with PCF_30_30 exhibiting superior tensile properties. The presence of PEG2000 was shown to improve the fibres’ performance in terms of tension. As a next step, we suggest optimising wet spinning production systems to produce a more uniform fibre morphology and structure, exploring alternative solvents, using coagulation baths, and addressing drying processes to avoid mass loss at high temperatures. These improvements aim to enhance fibre consistency, which is fundamental for civil engineering applications that require a phase change between 50 and 60 °C.

Supplementary Materials

The following supporting information can be downloaded at: https://www.mdpi.com/article/10.3390/app14062473/s1, Table S1: Qualitative analysis of the production of the fibres.

Author Contributions

Conceptualisation, N.H. and N.C.H.; methodology, I.R.S. and N.C.H.; software, N.H., C.P. and M.M.S.; validation, J.A.O.C.; formal analysis, N.H., I.R.S., N.C.H. and H.P.F.; research, N.H., I.R.S. and J.A.O.C.; resources, H.P.F., M.F.M.C. and J.A.O.C.; data curation, N.H., C.P. and M.F.M.C.; preparation of the original draft, N.H.; revision and editing of the writing, C.P., I.R.S., N.C.H., M.M.S., H.P.F., G.M.B.S., E.F., M.F.M.C. and J.A.O.C.; visualisation, I.R.S. and N.C.H.; supervision, I.R.S., M.F.M.C. and J.A.O.C.; project administration, M.F.M.C. and J.A.O.C.; acquisition of funding, M.F.M.C. and J.A.O.C. All authors have read and agreed to the published version of the manuscript.

Funding

This research was funded by the Portuguese Foundation for Science and Technology (FCT) under the projects MicroCoolPav EXPL/EQUEQU/1110/2021 and NanoAir PTDC/FISMAC/6606/2020 (https://doi.org/10.54499/PTDC/FIS-MAC/6606/2020) and within the framework of Strategic Funding UIDB/04650/2020, UIDB/04029/2020 (https://doi.org/10.54499/UIDB/04029/2020) and UID/QUI/0686/2020. I.R.S. and H.P.F. would like to thank FCT for their funding contracts 2022.00763.CEECIND (https://doi.org/10.54499/2022.00763.CEECIND/CP1718/CT0006) and 2021.02720.CEECIND (https://doi.org/10.54499/DL57/2016/CP1377/CT0098).

Institutional Review Board Statement

Not applicable.

Informed Consent Statement

Not applicable.

Data Availability Statement

The original contributions presented in the study are included in the article/Supplementary Materials, further inquiries can be directed to the corresponding authors.

Acknowledgments

The authors would like to thank the company Nostrobiz for supplying 100% cotton fabrics.

Conflicts of Interest

All the authors declare that the research was carried out in the absence of any commercial or financial relationships that could be interpreted as a potential conflict of interest.

References

  1. Segundo, I.R.; Freitas, E.; Branco, V.T.F.C.; Landi, S.; Costa, M.F.; Carneiro, J.O. Review and Analysis of Advances in Functionalized, Smart, and Multifunctional Asphalt Mixtures. Renew. Sustain. Energy Rev. 2021, 151, 111552. [Google Scholar] [CrossRef]
  2. Ibrahim, S.H.; Ibrahim, N.I.A.; Wahid, J.; Goh, N.A.; Koesmeri, D.R.A.; Nawi, M.N.M. The Impact of Road Pavement on Urban Heat Island (UHI) Phenomenon. Int. J. Technol. 2018, 9, 1597. [Google Scholar] [CrossRef]
  3. Piracha, A.; Chaudhary, M.T. Urban Air Pollution, Urban Heat Island and Human Health: A Review of the Literature. Sustainability 2022, 14, 9234. [Google Scholar] [CrossRef]
  4. Chen, G.; Chen, Y.; Tan, X.; Zhao, L.; Cai, Y.; Li, L. Assessing the Urban Heat Island Effect of Different Local Climate Zones in Guangzhou, China. Build. Environ. 2023, 244, 110770. [Google Scholar] [CrossRef]
  5. Andrade, C.; Fonseca, A.; Santos, J.A. Climate Change Trends for the Urban Heat Island Intensities in Two Major Portuguese Cities. Sustainability 2023, 15, 3970. [Google Scholar] [CrossRef]
  6. Vardhu, V.A.K.; Sharma, A. Classification, Mitigations and Methods to Detect UHI: A Review. Int. J. Sci. Res. Eng. Manag. 2023, 7, 2–3. [Google Scholar] [CrossRef]
  7. Mondal, S. Phase Change Fibers. In Handbook of Fibrous Materials; Hu, J., Kumar, B., Lu, J., Eds.; Wiley: Hoboken, NJ, USA, 2020; pp. 263–279. ISBN 978-3-527-34220-4. [Google Scholar]
  8. Betancourt-Jimenez, D.; Montoya, M.; Haddock, J.; Youngblood, J.P.; Martinez, C.J. Regulating Asphalt Pavement Temperature Using Microencapsulated Phase Change Materials (PCMs). Constr. Build. Mater. 2022, 350, 128924. [Google Scholar] [CrossRef]
  9. Chou, H.-M.; Chen, C.-R.; Nguyen, V.-L. A New Design of Metal-Sheet Cool Roof Using PCM. Energy Build. 2013, 57, 42–50. [Google Scholar] [CrossRef]
  10. Osterman, E.; Tyagi, V.V.; Butala, V.; Rahim, N.A.; Stritih, U. Review of PCM Based Cooling Technologies for Buildings. Energy Build. 2012, 49, 37–49. [Google Scholar] [CrossRef]
  11. Pinheiro, C.; Hammes, N.; Lima, O.; Landi, S.; Homem, N.; Rocha Segundo, I.; Felgueiras, H.P.; Freitas, E.; Costa, M.F.M.; Carneiro, J. Reducing the Effects of Low Albedo of Asphalt Materials Incorporating Polyethylene Glycol (PEG) 1000, 2000 and 4000 as Phase Change Materials (PCM). EPJ Web Conf. 2023, 287, 09024. [Google Scholar] [CrossRef]
  12. Pinheiro, C.; Landi, S.; Lima, O.; Ribas, L.; Hammes, N.; Segundo, I.R.; Homem, N.C.; Castelo Branco, V.; Freitas, E.; Costa, M.F.; et al. Advancements in Phase Change Materials in Asphalt Pavements for Mitigation of Urban Heat Island Effect: Bibliometric Analysis and Systematic Review. Sensors 2023, 23, 7741. [Google Scholar] [CrossRef]
  13. Baetens, R.; Jelle, B.P.; Gustavsen, A. Phase Change Materials for Building Applications: A State-of-the-Art Review. Energy Build. 2010, 42, 1361–1368. [Google Scholar] [CrossRef]
  14. Diaconu, B.M.; Varga, S.; Oliveira, A.C. Experimental Assessment of Heat Storage Properties and Heat Transfer Characteristics of a Phase Change Material Slurry for Air Conditioning Applications. Appl. Energy 2010, 87, 620–628. [Google Scholar] [CrossRef]
  15. Gil, A.; Oró, E.; Peiró, G.; Álvarez, S.; Cabeza, L.F. Material Selection and Testing for Thermal Energy Storage in Solar Cooling. Renew. Energy 2013, 57, 366–371. [Google Scholar] [CrossRef]
  16. Yinfei, D.; Pusheng, L.; Jiacheng, W.; Hancheng, D.; Hao, W.; Yingtao, L. Effect of Lightweight Aggregate Gradation on Latent Heat Storage Capacity of Asphalt Mixture for Cooling Asphalt Pavement. Constr. Build. Mater. 2020, 250, 118849. [Google Scholar] [CrossRef]
  17. Cunha, S.; Leite, P.; Aguiar, J. Characterization of Innovative Mortars with Direct Incorporation of Phase Change Materials. J. Energy Storage 2020, 30, 101439. [Google Scholar] [CrossRef]
  18. Kulkarni, P.; Muthadhi, A. Thermal Energy Storage Cement Mortar with Direct Incorporation of Organic and Inorganic Phase Change Materials. Innov. Infrastruct. Solut. 2021, 6, 30. [Google Scholar] [CrossRef]
  19. Pérez-Silva, I.; Ibarra, I.S.; Castañeda-Ovando, A.; Galán-Vidal, C.A.; Páez-Hernández, M.E. Development of Cellulose Acetate Microcapsules with Cyanex 923 for Phenol Removal from Aqueous Media. J. Chem. 2018, 2018, 9506489. [Google Scholar] [CrossRef]
  20. Gbekou, F.K.; Benzarti, K.; Boudenne, A.; Eddhahak, A.; Duc, M. Mechanical and Thermophysical Properties of Cement Mortars Including Bio-Based Microencapsulated Phase Change Materials. Constr. Build. Mater. 2022, 352, 129056. [Google Scholar] [CrossRef]
  21. Drissi, S.; Ling, T.-C.; Mo, K.H. Development of Leak-Free Phase Change Material Aggregates. Constr. Build. Mater. 2020, 230, 117029. [Google Scholar] [CrossRef]
  22. Rao, V.V.; Parameshwaran, R.; Ram, V.V. PCM-Mortar Based Construction Materials for Energy Efficient Buildings: A Review on Research Trends. Energy Build. 2018, 158, 95–122. [Google Scholar] [CrossRef]
  23. Abdullah, M.F.; Andriyana, A.; Muhamad, F.; Ang, B.C. Effect of Core-to-Shell Flowrate Ratio on Morphology, Crystallinity, Mechanical Properties and Wettability of Poly(Lactic Acid) Fibers Prepared via Modified Coaxial Electrospinning. Polymer 2021, 237, 124378. [Google Scholar] [CrossRef]
  24. Felgueiras, H.P.; Homem, N.C.; Teixeira, M.A.; Ribeiro, A.R.M.; Antunes, J.C.; Amorim, M.T.P. Physical, Thermal, and Antibacterial Effects of Active Essential Oils with Potential for Biomedical Applications Loaded onto Cellulose Acetate/Polycaprolactone Wet-Spun Microfibers. Biomolecules 2020, 10, 1129. [Google Scholar] [CrossRef]
  25. Ozipek, B.; Karakas, H. Wet Spinning of Synthetic Polymer Fibers. In Advances in Filament Yarn Spinning of Textiles and Polymers; Elsevier: Amsterdam, The Netherlands, 2014; pp. 174–186. [Google Scholar]
  26. Rohani Shirvan, A.; Nouri, A.; Sutti, A. A Perspective on the Wet Spinning Process and Its Advancements in Biomedical Sciences. Eur. Polym. J. 2022, 181, 111681. [Google Scholar] [CrossRef]
  27. Tang, Z.; Jia, S.; Wang, F.; Bian, C.; Chen, Y.; Wang, Y.; Li, B. Highly Stretchable Core–Sheath Fibers via Wet-Spinning for Wearable Strain Sensors. ACS Appl. Mater. Interfaces 2018, 10, 6624–6635. [Google Scholar] [CrossRef] [PubMed]
  28. Zhang, J.; Song, S.; Zhang, C.; Li, C.; Xu, J.; Xia, L.; Liu, X.; Xu, W. Fabrication of Leather-like Yarns Using Waste Leather for Textile Application. Prog. Org. Coat. 2024, 186, 108053. [Google Scholar] [CrossRef]
  29. Quan, Q.; Zhang, Y.; Piao, H.; Zhang, H.; Zhao, J. Polybutyrolactam (PBY) Fiber: A Promising Biobased and Biodegradable Fiber Fabricated by Dry-Jet-Wet Spinning. Polymer 2022, 260, 125392. [Google Scholar] [CrossRef]
  30. Teo, W.E.; Ramakrishna, S. A Review on Electrospinning Design and Nanofibre Assemblies. Nanotechnology 2006, 17, R89–R106. [Google Scholar] [CrossRef] [PubMed]
  31. Zhang, W.; Zhang, X.; Xu, Y.; Xu, Y.; Qiao, J.; Shi, T.; Huang, Z.; Liu, Y.; Fang, M.; Min, X.; et al. Flexible Polyethylene Glycol/Polyvinylpyrrolidone Composite Phase Change Fibres: Preparation, Characterization, and Thermal Conductivity Enhancement. Polymer 2021, 214, 123258. [Google Scholar] [CrossRef]
  32. Mirabedini, A. Developing Novel Spinning Methods to Fabricate Continuous Multifunctional Fibres for Bioapplications; Springer Theses; Springer International Publishing: Cham, Switzerland, 2018; ISBN 978-3-319-95377-9. [Google Scholar]
  33. Chen, C.; Zhao, Y.; Liu, W. Electrospun Polyethylene Glycol/Cellulose Acetate Phase Change Fibers with Core–Sheath Structure for Thermal Energy Storage. Renew. Energy 2013, 60, 222–225. [Google Scholar] [CrossRef]
  34. Swapnil, S.I.; Datta, N.; Mahmud, M.M.; Jahan, R.A.; Arafat, M.T. Morphology, Mechanical, and Physical Properties of Wet-spun Cellulose Acetate Fiber in Different Solvent-coagulant Systems and In-situ Crosslinked Environment. J. Appl. Polym. Sci. 2021, 138, 50358. [Google Scholar] [CrossRef]
  35. Santos-Sauceda, I.; Castillo-Ortega, M.M.; Del Castillo-Castro, T.; Armenta-Villegas, L.; Ramírez-Bon, R. Electrospun Cellulose Acetate Fibers for the Photodecolorization of Methylene Blue Solutions under Natural Sunlight. Polym. Bull. 2021, 78, 4419–4438. [Google Scholar] [CrossRef]
  36. Babapoor, A.; Karimi, G.; Golestaneh, S.I.; Mezjin, M.A. Coaxial Electro-Spun PEG/PA6 Composite Fibers: Fabrication and Characterization. Appl. Therm. Eng. 2017, 118, 398–407. [Google Scholar] [CrossRef]
  37. Homem, N.C.; Amorim, M.T.P. Synthesis of Cellulose Acetate Using as Raw Material Textile Wastes. Mater. Today Proc. 2020, 31, S315–S317. [Google Scholar] [CrossRef]
  38. Puleo, A.C.; Paul, D.R.; Kelley, S.S. The Effect of Degree of Acetylation on Gas Sorption and Transport Behavior in Cellulose Acetate. J. Membr. Sci. 1989, 47, 301–332. [Google Scholar] [CrossRef]
  39. Homem, N.C.; Tavares, T.D.; Miranda, C.S.; Antunes, J.C.; Amorim, M.T.P.; Felgueiras, H.P. Functionalization of Crosslinked Sodium Alginate/Gelatin Wet-Spun Porous Fibers with Nisin Z for the Inhibition of Staphylococcus Aureus-Induced Infections. Int. J. Mol. Sci. 2021, 22, 1930. [Google Scholar] [CrossRef] [PubMed]
  40. ISO2060:2009; Textiles—Yarns from Packages Determination of Single-End Breaking Force and Elongation at Break Using Constant Rate of Extension (CRE) Tester. Technical Committee ISO/TC 97: Geneva, Switzerland, 2009.
  41. Kramar, A.; González-Benito, F.J. Cellulose-Based Nanofibers Processing Techniques and Methods Based on Bottom-Up Approach—A Review. Polymers 2022, 14, 286. [Google Scholar] [CrossRef] [PubMed]
  42. Liu, L.; Gong, D.; Bratasz, L.; Zhu, Z.; Wang, C. Degradation Markers and Plasticizer Loss of Cellulose Acetate Films during Ageing. Polym. Degrad. Stab. 2019, 168, 108952. [Google Scholar] [CrossRef]
  43. Ahn, Y.-H.; DeWitt, S.J.A.; McGuire, S.; Lively, R.P. Incorporation of Phase Change Materials into Fibers for Sustainable Thermal Energy Storage. Ind. Eng. Chem. Res. 2021, 60, 3374–3384. [Google Scholar] [CrossRef]
  44. Ibrahim, M.M.; Fahmy, T.Y.; Salaheldin, E.I.; Mobarak, F.; Youssef, M.A.; Mabrook, M.R. Role of Tosyl Cellulose Acetate as Potential Carrier for Controlled Drug Release. Life Sci. J. 2015, 10, 127–133. [Google Scholar]
  45. Nikoomanesh, N.; Zandi, M.; Ganjloo, A. Development of Eco-Friendly Cellulose Acetate Films Incorporated with Burdock (Arctium Lappa L.) Root Extract. Prog. Org. Coat. 2024, 186, 108009. [Google Scholar] [CrossRef]
  46. Fei, P.; Liao, L.; Cheng, B.; Song, J. Quantitative Analysis of Cellulose Acetate with a High Degree of Substitution by FTIR and Its Application. Anal. Methods 2017, 9, 6194–6201. [Google Scholar] [CrossRef]
  47. Frisoni, G.; Baiardo, M.; Scandola, M.; Lednická, D.; Cnockaert, M.C.; Mergaert, J.; Swings, J. Natural Cellulose Fibers: Heterogeneous Acetylation Kinetics and Biodegradation Behavior. Biomacromolecules 2001, 2, 476–482. [Google Scholar] [CrossRef] [PubMed]
  48. Huda, E.; Rahmi; Khairan. Preparation and Characterization of Cellulose Acetate from Cotton. IOP Conf. Ser. Earth Environ. Sci. 2019, 364, 012021. [Google Scholar] [CrossRef]
  49. Zhuang, J.; Li, M.; Pu, Y.; Ragauskas, A.; Yoo, C. Observation of Potential Contaminants in Processed Biomass Using Fourier Transform Infrared Spectroscopy. Appl. Sci. 2020, 10, 4345. [Google Scholar] [CrossRef]
  50. Zhu, Q.; Wu, H.; Ma, Z.; Liu, Y.; Li, J.; Zhu, L.; Zhang, X.; Wang, C.; Chen, D.; Zhu, D. Micro-Volume Blood Separation Membrane for In-Situ Biosensing. Biosensors 2022, 12, 712. [Google Scholar] [CrossRef] [PubMed]
  51. Quan, S.; Li, S.; Wang, Z.; Yan, X.; Guo, Z.; Shao, L. A Bio-Inspired CO2-Philic Network Membrane for Enhanced Sustainable Gas Separation. J. Mater. Chem. A 2015, 3, 13758–13766. [Google Scholar] [CrossRef]
  52. Snyder, R.G.; Hsut, S.L.; Krimm, S. Vibrational Spectp in the C-H Stretching Region and the Structure of the Polymethylene Chain. Spectrochim. Acta Part A Mol. Spectrosc. 1978, 34, 395–406. [Google Scholar] [CrossRef]
  53. Hospodarova, V.; Singovszka, E.; Stevulova, N. Characterization of Cellulosic Fibers by FTIR Spectroscopy for Their Further Implementation to Building Materials. Am. J. Anal. Chem. 2018, 9, 303–310. [Google Scholar] [CrossRef]
  54. Das, A.M.; Ali, A.A.; Hazarika, M.P. Synthesis and Characterization of Cellulose Acetate from Rice Husk: Eco-Friendly Condition. Carbohydr. Polym. 2014, 112, 342–349. [Google Scholar] [CrossRef]
  55. Chen, J.; Xu, J.; Wang, K.; Cao, X.; Sun, R. Cellulose Acetate Fibers Prepared from Different Raw Materials with Rapid Synthesis Method. Carbohydr. Polym. 2016, 137, 685–692. [Google Scholar] [CrossRef]
  56. Lopes, S.; Bueno, L.; Aguiar Júnior, F.D.; Finkler, C. Preparation and Characterization of Alginate and Gelatin Microcapsules Containing Lactobacillus Rhamnosus. An. Acad. Bras. Ciênc. 2017, 89, 1601–1613. [Google Scholar] [CrossRef] [PubMed]
  57. Zhu, S.; Ji, T.; Niu, D.; Yang, Z. Investigation of PEG/Mixed Metal Oxides as a New Form-Stable Phase Change Material for Thermoregulation and Improved UV Ageing Resistance of Bitumen. RSC Adv. 2020, 10, 44903–44911. [Google Scholar] [CrossRef]
  58. Sundararajan, S.; Samui, A.B.; Kulkarni, P.S. Shape-Stabilized Poly(Ethylene Glycol) (PEG)-Cellulose Acetate Blend Preparation with Superior PEG Loading via Microwave-Assisted Blending. Sol. Energy 2017, 144, 32–39. [Google Scholar] [CrossRef]
  59. Faradilla, R.F.; Lee, G.; Sivakumar, P.; Stenzel, M.; Arcot, J. Effect of Polyethylene Glycol (PEG) Molecular Weight and Nanofillers on the Properties of Banana Pseudostem Nanocellulose Films. Carbohydr. Polym. 2019, 205, 330–339. [Google Scholar] [CrossRef] [PubMed]
  60. Shaikh, H.M.; Anis, A.; Poulose, A.M.; Al-Zahrani, S.M.; Madhar, N.A.; Alhamidi, A.; Aldeligan, S.H.; Alsubaie, F.S. Synthesis and Characterization of Cellulose Triacetate Obtained from Date Palm (Phoenix Dactylifera L.) Trunk Mesh-Derived Cellulose. Molecules 2022, 27, 1434. [Google Scholar] [CrossRef]
  61. Ribeiro, S.D.; Meneguin, A.B.; Barud, H.d.S.; Silva, J.M.; Oliveira, R.L.; Asunção, R.M.N.d.; Tormin, T.F.; Muñoz, R.A.A.; Filho, G.R.; Ribeiro, C.A. Synthesis and Characterization of Cellulose Acetate from Cellophane Industry Residues. Application as Acetaminophen Controlled-Release Membranes. J. Therm. Anal. Calorim. 2022, 147, 7265–7275. [Google Scholar] [CrossRef]
  62. Vinodhini, P.A.; Sangeetha, K.; Thandapani, G.; Sudha, P.N.; Jayachandran, V.; Sukumaran, A. FTIR, XRD and DSC Studies of Nanochitosan, Cellulose Acetate and Polyethylene Glycol Blend Ultrafiltration Membranes. Int. J. Biol. Macromol. 2017, 104, 1721–1729. [Google Scholar] [CrossRef]
  63. Ansu, A.K.; Pandya, M.; Sharma, R.K.; Tripathi, D. Experimental Investigation of Hybrid PCM Polyethylene Glycol with Al2O3 and CuO Nanoparticles. Res. Sq. 2022; in review. [Google Scholar] [CrossRef]
  64. Chen, C.; Wang, L.; Huang, Y. Electrospun Phase Change Fibers Based on Polyethylene Glycol/Cellulose Acetate Blends. Appl. Energy 2011, 88, 3133–3139. [Google Scholar] [CrossRef]
  65. Cai, Y.; Gao, C.; Xu, X.; Fu, Z.; Fei, X.; Zhao, Y.; Chen, Q.; Liu, X.; Wei, Q.; He, G.; et al. Electrospun Ultrafine Composite Fibers Consisting of Lauric Acid and Polyamide 6 as Form-Stable Phase Change Materials for Storage and Retrieval of Solar Thermal Energy. Sol. Energy Mater. Sol. Cells 2012, 103, 53–61. [Google Scholar] [CrossRef]
  66. Gonçalves, S.M.; Dos Santos, D.C.; Motta, J.F.G.; Santos, R.R.D.; Chávez, D.W.H.; Melo, N.R.D. Structure and Functional Properties of Cellulose Acetate Films Incorporated with Glycerol. Carbohydr. Polym. 2019, 209, 190–197. [Google Scholar] [CrossRef] [PubMed]
Figure 1. TGA of virgin materials obtained from 25 to 500 °C under a nitrogen atmosphere, flow rate of 200 mL/min, and temperature rise of 10 °C/min.
Applsci 14 02473 g001
Figure 2. DSC of virgin materials: (a) CA (Mn 30,000); (b) CA (Mn 50,000); (c) recycled CAt; (d) PEG2000.
Applsci 14 02473 g002
Figure 3. Demonstration of the drying process of recycled synthesized CAt.
Applsci 14 02473 g003
Figure 4. Scheme of production of PCFs via wet spinning.
Applsci 14 02473 g004
Figure 5. The parameters of the wet spinning process.
Applsci 14 02473 g005
Figure 6. A flowchart explaining the selection of the best samples.
Applsci 14 02473 g006
Figure 7. Micrographs of the morphology of the hollow and PEG2000-incorporated fibres obtained by brightfield microscopy. (a) Fh_30_30; (b) PCF_30_10/60_150; (c) PCF_30_10/80_150; (d) PCF_30_20/40_140; (e) PCF_30_30/40_130; (f) PCF_30_30/40_140; (g) PCF_30_30/40_150; (h) PCF_30_30/80_150; (i) Fh_50_10; (j) PCF_50_10/40_130; (k) PCF_50_10/40_140; (l) PCF_50_10/80_140; (m) PCF_50_10/80_150; (n) Fht_8; (o) PCFt_8/40_100; (p) PCFt_8/80_120.
Applsci 14 02473 g007
Figure 8. Calculation of the thickness of the fibres produced by wet spinning with a detailed analysis of the uniformity and presence of the visible core. Data presented as mean ± SD (n = 5).
Applsci 14 02473 g008
Figure 9. SEM micrographs of the Fu, Fh, PCF and PCFt. (a) Fu_30_30; (b) Fh_30_30; (c) PCF_30_30/40_140; (d) PCF_50_10/40_140; (e) PCF_50_10/80_150; (f) PCFt_8/40_100.
Applsci 14 02473 g009
Figure 10. ATR-FTIR spectra of (a) Fh_30, PCF_30_10, PCF_30_20 and PCF_30_30 fibres; (b) Fh_50_10 and PCF_50_10 fibres; (c) CAt, Fht and PCFt fibres.
Applsci 14 02473 g010
Figure 11. TGA curves of the Fh, PCF, Fht and PCFt fibres obtained from 25 to 500 °C under a nitrogen atmosphere, flow rate of 200 mL/min, and temperature rise of 10 °C/min.
Applsci 14 02473 g011
Figure 12. DSC curves of the Fh, PCF, Fht and PCFt fibres obtained from 25 to 500 °C under a nitrogen atmosphere, flow rate of 200 mL/min, and temperature rise of 10 °C/min.
Applsci 14 02473 g012
Table 1. Degree of acetylation and degree of substitution for synthesized CAt.
Samples%GADS
CAt42.702.83
CAt142.742.83
CAt242.962.84
Average42.80 ± 0.14 12.83 ± 0.01 1
1 Standard deviation.
Table 2. Names of the samples in the wet spinning process.
SamplesFibre TypeMn CAwt. %
CA/CAt
wt. %
PEG
Ejection Velocity PEG
(mL/min)
Fu_a_bUniaxial30,000 and 50,00010, 20 and 30--
Fut_bUniaxial-8--
Fh_a_bHollow30,000 and 50,00010, 20 and 30--
Fht_bHollow-8--
PCF_a_b/x_yPhase Change Fibre30,000 and 50,00010, 20 and 3040, 60 and 800.130, 0.140 and 0.150
PCFt_b/x_yPhase Change Fibre-840 and 800.100 and 0.120
Table 3. Thermal properties of Fh, Fht, PCF, and PCFt.
SamplesPeak Temperature
(°C)
Melting Point
(J/g)
Fh_30_30139.84111.78
Fh_50_10134.42140.46
Fht_8137.52134.39
PCF_30_20/40_14078.02108.43
PCF_30_30/40_13072.2656.38
PCF_30_30/40_14064.8750.51
PCF_50_10/40_14061.6170.91
PCF_50_10/80_15074.96106.40
PCFt_8/40_10069.8344.97
PCFt_8/80_12072.8441.52
Table 4. Mechanical testing of wet spinning fibres. Data presented as mean ± SD (n = 5).
SamplesMaximum Elongation at Break (%)Breaking Strength
(kPa)
Fh_30_3028.86 ± 1.59133.18 ± 6.57
PCF_30_10/60_1501.59 ± 0.14105.54 ± 14.73
PCF_30_10/80_1502.46 ± 0.30212.83 ± 52.80
PCF_30_20/40_14014.32 ± 0.221023.64 ± 52.56
PCF_30_30/40_13028.46 ± 1.081094.60 ± 150.04
PCF_30_30/40_14022.42 ± 0.841122.49 ± 145.56
PCF_30_30/40_15013.07 ± 0.93920.01 ± 104.02
PCF_30_30/80_15025.40 ± 0.63264.68 ± 22.18
Fh_50_1016.50 ± 0.95117.28 ± 30.03
PCF_50_10/40_13011.71 ± 0.6060.28 ± 5.86
PCF_50_10/40_14016.20 ± 0.99100.63 ± 13.22
PCF_50_10/80_14012.98 ± 0.5875.03 ± 17.68
PCF_50_10/80_15021.62 ± 0.42105.69 ± 15.68
Fht_84.00 ± 0.7161.36 ± 18.46
PCFt_8/40_1007.18 ± 0.6228.06 ± 14.20
PCFt_8/80_1209.02 ± 0.6639.75 ± 9.21
Disclaimer/Publisher’s Note: The statements, opinions and data contained in all publications are solely those of the individual author(s) and contributor(s) and not of MDPI and/or the editor(s). MDPI and/or the editor(s) disclaim responsibility for any injury to people or property resulting from any ideas, methods, instructions or products referred to in the content.

