Article

Mechanical Response and Deterioration Mechanisms in Freeze–Thaw Environments for Crushed Stone Stabilized with Industrial Solid Waste

1
School of Energy and Transportation Engineering, Inner Mongolia Agricultural University, Hohhot 010018, China
2
Shandong Yi Fang Da Construction Project Management Co., Ltd., Jinan 250000, China
*
Author to whom correspondence should be addressed.
Appl. Sci. 2024, 14(13), 5566; https://doi.org/10.3390/app14135566
Submission received: 24 May 2024 / Revised: 22 June 2024 / Accepted: 24 June 2024 / Published: 26 June 2024
(This article belongs to the Special Issue Novel Construction Material and Its Applications)

Abstract

:
The conflict between industrial solid waste treatment and environmental protection in Inner Mongolia is becoming increasingly prominent. Using industrial solid waste such as mineral powder, fly ash and wet calcium carbide slag as raw materials, using the alkali excitation method to prepare geopolymer, and replacing part of the cement for pavement base can effectively absorb industrial solid waste and realize the dual goals of waste utilization and environmental protection. Through mechanical properties tests before and after a freeze–thaw cycle and micro tests such as scanning electron microscopy (SEM) and mercury intrusion porosimetry (MIP), the strength variation rule and mechanism of geopolymer-cement stabilized aggregate under freeze–thaw cycles were deeply investigated. The relationship between different porosity indexes and mechanical properties in mercury intrusion porosimetry (MIP) was established by grey relation analysis. The results prove that a mixture with impaired properties after freeze–thaw cycles and the anti-freezing performance of the mixture with 20% geopolymer content are better than that of the mixture with no geopolymer content and 40% geopolymer content. The loss rates of unconfined compressive strength (UCS) after 5, 10 and 20 freeze–thaw cycles were 9.5%, 27.6% and 36.4%, respectively. The appropriate addition of geopolymer can enhance the anti-freezing performance of a stable aggregate. Following freezing and thawing cycles, the unconfined compressive strength (UCS) damage of the mixture is mainly influenced by a rise in total porosity, and the grey correlation degree is 0.75. The increase in more harmful pores and total porosity mainly results in an indirect tensile strength (ITS) loss. The grey correlation degree is 0.91. The compressive rebound modulus (CRM) is not affected by the change in pores but decreases with a rise in the geopolymer dosage.

1. Introduction

Inner Mongolia is rich in mineral resources [1], but while resource advantages drive economic development, the large-scale discharge and storage of bulk solid waste has become an issue that cannot be ignored. The large storage of fly ash, carbide slag, and slag not only wastes land resources but also contaminates the environment. Geopolymer is a new kind of inorganic aluminosilicate cementitious material with hydraulicity [2], which is usually prepared using aluminosilicate material under the action of an alkaline activator. At present, there are some achievements in the research and application of geopolymers worldwide, but there are few studies on the utilization of solid waste materials through geopolymer theory. The application of bulk solid waste to the production of geopolymer cementitious materials and the replacement of some cement for road bases not only solves the storage of bulk solid waste but also reduces the project costs and has certain economic and environmental benefits. In addition, as a seasonal freezing zone, Inner Mongolia has drastic temperature changes, which, in turn, leads to pavement damage, affecting the service life and maintenance cost of the pavement structure. The geopolymer cementitious material developed by using bulk solid waste materials has advantages of high strength, great anti-freezing performance and a stable and adjustable thermal expansion coefficient, which can make up for the shortcomings of cement as cementitious material and pavement base.
At present, the research on geopolymers at home and abroad is more extensive: In Zhao C et al. [3], aiming at a slag-based solid waste geopolymer, different slag contents and curing methods were designed to explore the carbonation resistance of geopolymer. The results show that high slag content and standard curing are beneficial to improve the carbonation resistance of the geopolymer. Yang G et al. [4] used slag, phosphogypsum, carbide slag and steel slag to prepare solid waste-based cementitious materials. The results of the mechanical properties of the material show that the incorporation of carbide slag makes the hydration reaction more sufficient, forming C-A-S-H gel and AFt, which significantly enhances the 3 d and 7 d strength of the material. Subramanian S et al. [5] used industrial solid wastes such as basic oxygen furnace slag and fly ash to prepare geopolymers, combined with iron ore tailings and steel fiber to prepare geopolymer composites, and explored the most suitable ratio. The results showed that the compression and bending strength of geopolymer composites prepared by 40% basic oxygen furnace slag, 1.5% steel fiber and 45% iron ore tailings reached 41.8 MPa and 5.78 MPa, respectively. Gao Y et al. [6] used industrial solid wastes such as steel slag and fly ash to prepare a geopolymer and explored its mechanical strength. The results showed that when the content of steel slag and NaOH-Na2SiO3 was 30% and 18%, the mechanical strength was the highest. The 7 d compressive strength reached 19.3 MPa. Ghosh A et al. [7] used fly ash and red mud to prepare geopolymers and explored their strength. The results showed that the compressive strength and flexural strength of geopolymers reached 31.5 MPa and 4.32 MPa under 60 °C environmental curing conditions. Under the support of the existing research results of geopolymers, the application research progress of geopolymers in road engineering is remarkable. Al-Dossary A A S et al. [8] prepared geopolymers using calcium carbide slag and straight-chain alkyl benzene sulfonic acid as raw materials for stabilizing base granules. The results showed that the optimum UCS (unconfined compressive strength) of the mix was achieved at a geopolymer dosage of 7.5%. Lu X et al. [9] prepared geopolymers for mine road construction from open-pit mine pavement aggregate, slag and fly ash and studied their weathering behavior; the results showed that with the slag and alkali activator admixture incremental price, the weathering resistance is enhanced, and the strength meets the requirements of the mine roads. Sun Y et al. [10] used fly ash and granulated blast furnace slag to prepare geopolymer for pavement subgrade construction and investigated its road performance, which showed that the UCS of geopolymer-stabilized soils reached 5.1 MPa under the optimal proportioning and good resistance to freezing and thawing. Ji X et al. [11] used waste incineration slag to prepare a geopolymer for stabilizing waste incineration slag–gravel mixes. The results showed that the strength of the mixes without natural debris met the criteria for pavement subgrade when the dosage of the geopolymer was 12–14%. In addition, the geopolymer significantly reduced the leaching of harmful heavy metals. Tabyang W et al. [12] used rubberwood fly ash to prepare a geopolymer for the preparation of geopolymer-stabilized marginal laterite subgrade material and tested its mechanical properties. The results showed that the UCS and ITS (indirect tensile strength) of this base material were optimized when the dosage of the geopolymer was 30% and the ratio of sodium silicate to sodium hydroxide was 7:3. Alakara E H et al. [13] studied the influencing factors of the UCS of a geopolymer, and the results indicated that 48 h of thermal curing did not significantly affect the UCS of geopolymers. Feng B et al. [14] explored the effect of different silane coupling agents and dosage metakaolin-based geopolymers on waterproof performance. The results show that any silane coupling agent has the right amount of doping to improve the water resistance and contact angle of the capillary. Singh S et al. [15] studied the feasibility of using a geopolymer prepared by jarofix to solidify soil. The results show that jarofix can prepare a geopolymer to solidify soil, and when the content of jarofix is 15%, it can be used for Indian road subbase and subgrade construction. Arulanantham A et al. [16] explored the feasibility of adding eggshell ash and rice husk ash to a geopolymer to solidify laterite for road subgrade construction. The results show that this geopolymer stabilization method has the potential to replace cement stabilization. Cao R et al. [17] used a metakaolin-based geopolymer and open-graded aggregate concrete to make up for the lack of asphalt and ordinary Portland cement for load-bearing water storage pavement. The results show that mixing open-graded aggregates with geopolymers produces the desired CGOA when the proportions are right. Turkane S D et al. [18] used a geopolymer to stabilize low-plastic soil. The results show that this kind of geopolymer has the potential to stabilize low-plastic soil, and this kind of geopolymer can reduce the pavement thickness when it is used in the design of low-traffic roads. Pang Y et al. [19] explored the implication of PE fiber and an asphalt emulsifier on the rheological–strength–ductility of geopolymers. The results show that the plasticity of the geopolymer composites is improved due to adding the PE fiber, the strength increases with the raising asphalt emulsifier dosage, and the asphalt emulsifier can balance the ductility and rheological properties. Zhang Y et al. [20] used the life cycle assessment method to explore the impacts of the use of geopolymers in roads on the environment. By comparing four kinds of road base stabilization materials, it is concluded that the use of geopolymers in road engineering has a positive impact on global warming. Qin L et al. [21] used fly ash and red mud to make a geopolymer and verified its feasibility for road subgrade construction through laboratory tests. The results indicate that the highest UCS of a geopolymer can reach 2.7 MPa, can meet the strength requirements, and can be used as roadbed materials. Lu X et al. [22] used a geopolymer to build mine roads and studied the performance changes in mine roadway materials under freeze–thaw cycles. The results show that as the test temperature decreases, the number of cycles increases, and the strength of the sample gradually decreases. The interior of the sample becomes loose, and the fracture mode is crystal fracture. Zhao Q et al. [23] used NaOH and Na2SiO3 as alkali activators and used carbide slag and coal gangue as raw materials to prepare cementitious materials for highway subgrade construction. The test results show that the material has good frost resistance. After six freeze–thaw cycles, the 7 d UCS of the material was 2.86 MPa, and the strength loss rate was 22.6%. Hao Y [24] used red mud and mineral powder to prepare cementitious materials after alkali excitation for the preparation of the base mixture. The test showed that when the content of cementitious materials was 8%, the mechanical properties and frost resistance of the mixture were the best. Ji X et al. [25] used domestic waste incineration slagging and fly ash to prepare a geopolymer. The results of the mixture test showed that the strength, water stability and frost resistance of the mixture increased with the increase in the content of the geopolymer. When the content of the geopolymer was 12%, the performance of the mixture was optimal.
The results of the above research are summarized and analyzed, and then potential researchable content is identified. Firstly, existing research used geopolymers as a cementitious material, which can be used for roadbed construction and road construction in mining areas, with certain environmental and economic benefits, as the raw materials used are mostly industrial solid wastes [9,10,11,12,15,16]. Secondly, considering the existing research on geopolymer-stabilized road building materials’ mechanical strength, frost resistance, environmental impact and other aspects, the results show the following: the geopolymer, as road building materials, has good mechanical strength, with a certain degree of frost resistance, and the geopolymer effectively reduces the leaching rate of the heavy metals contained in industrial solid waste materials [11,20,21]. The main purpose of this study is to use industrial solid waste to prepare a geopolymer for highway grass-roots construction; at the same time, the frost resistance of geopolymer-stabilized gravel grass-roots mixes and the freeze–thaw damage mechanism are investigated.
The geopolymer used in this study is mainly prepared from industrial solid waste, and the main raw materials are mineral powder, fly ash and wet calcium carbide slag. Mineral powder is the finished raw material produced by the thermal power plant, with a grade of S95, fly ash graded as F, wet calcium hydroxide slag, calcium hydroxide slag after hydrolysis of acetylene gas, and alkali exciters, and the NaOH granular purity is more than 96%. The preparation method for the geopolymer is to mix mineral powder, fly ash and calcium hydroxide slag according to the ratio of 85:10:5, and then 2.58% NaOH was added and mixed well. We added water at the end and mixed. The mass ratio of water to dry material is 1:2. The novelty of this study is that the geopolymer is used to prepare road subgrade materials instead of being limited to roadbed construction and mining road construction, which is conducive to increasing the resource utilization of industrial solid waste and saving on highway costs; moreover, this study used grey correlation analysis to investigate the strength damage mechanism of the mix after a freeze–thaw cycle for this kind of subgrade mix instead of being limited to the study of its frost resistance. This can provide a reference and optimization basis for the construction of highway base layers in cold regions.

2. Test Methods and Preparation

2.1. Micro Test

To explore the effect of geopolymer dosage and freezing and thawing cycles on the mechanical properties of a geopolymer–cement-stabilized macadam mixture, this section uses SEM (scanning electron microscopy) and MIP (mercury intrusion porosimetry) to research the strength change and mechanism of damage in the mixture after freeze–thaw cycles from two aspects of micro-morphology and pore size distribution through grey relation analysis. In addition, the chemical composition of mineral powder, fly ash and wet calcium carbide slag was probed by XRF (X-ray fluorescence analysis) tests.

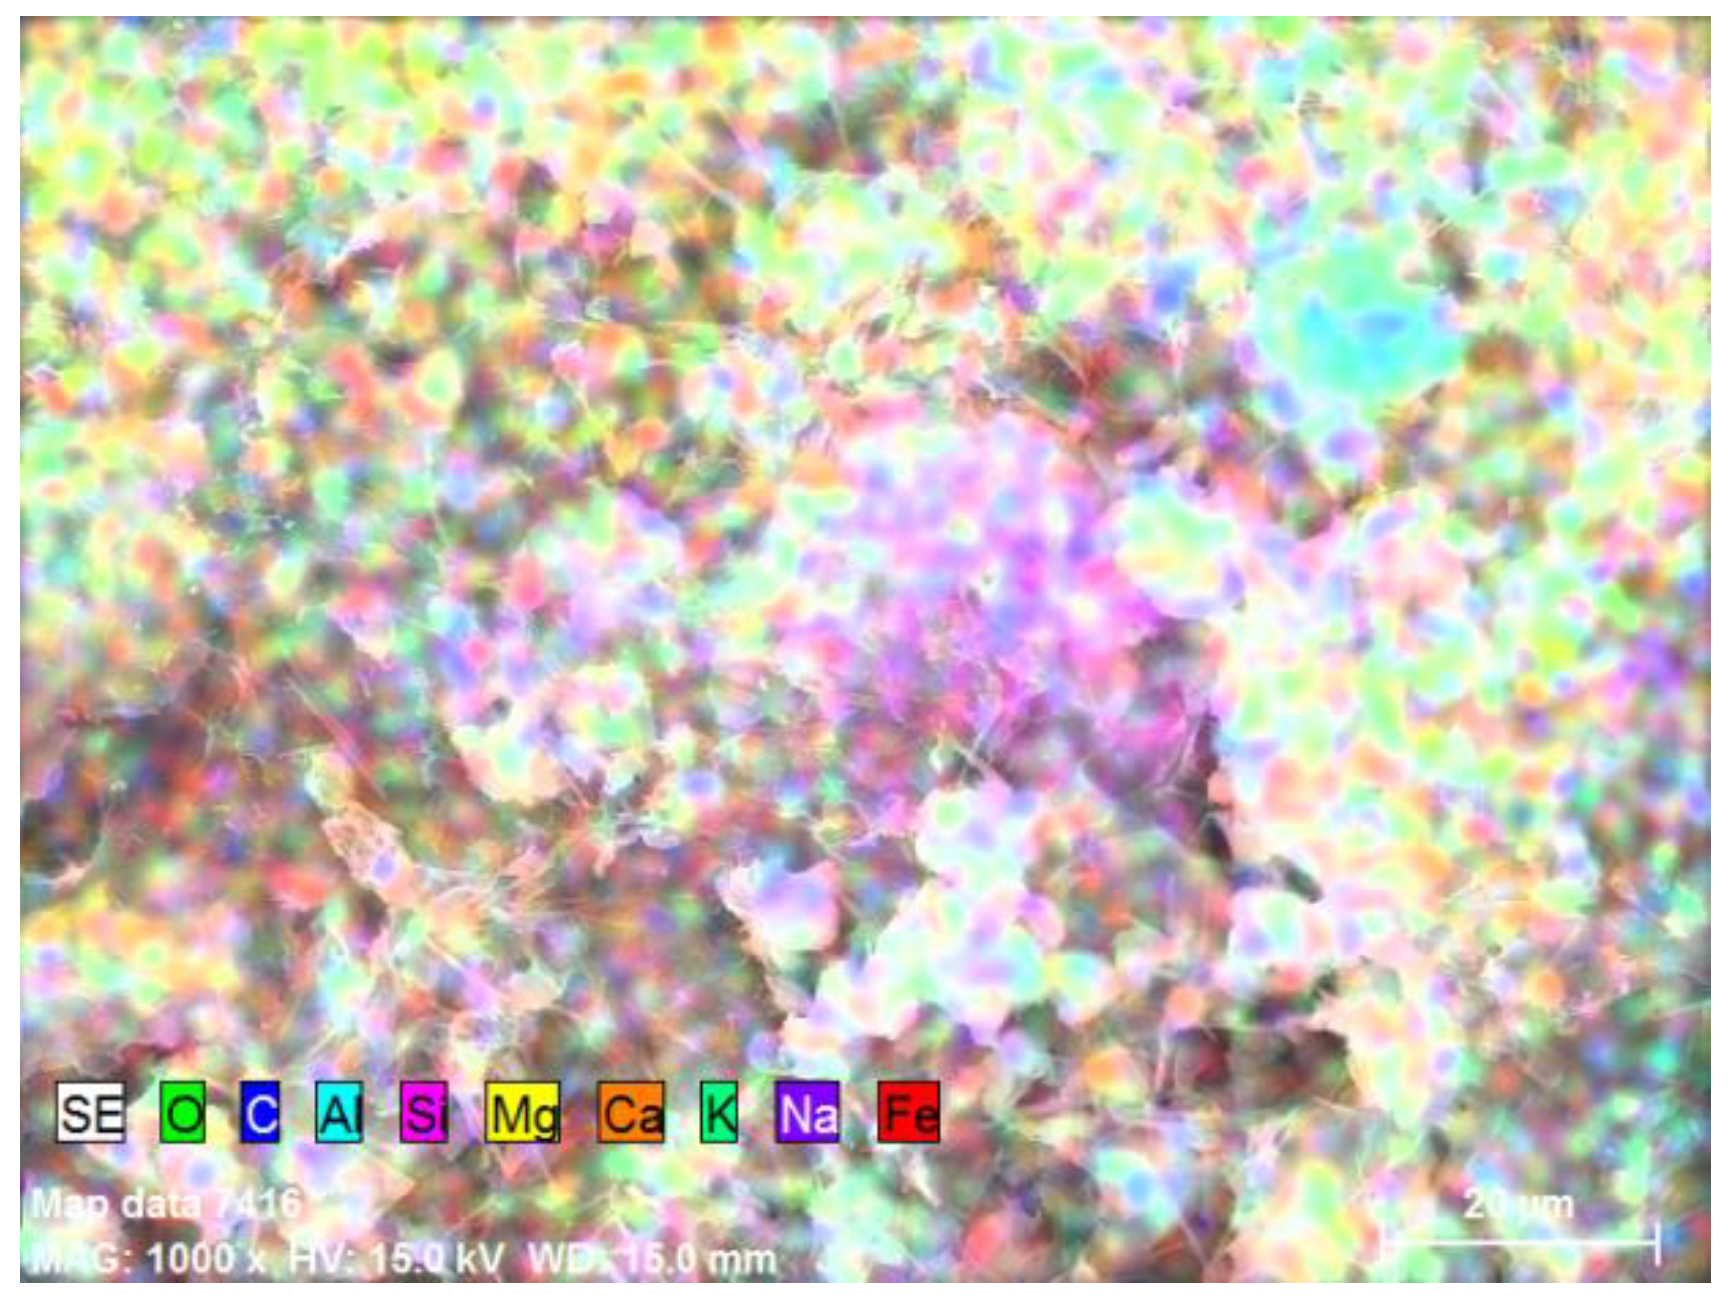
2.1.1. Scanning Electron Microscope

The model of scanning electron microscope used in test is HITACHI S-4800, produced by Hitachi, Tokyo, Japan. Firstly, the composition and element surface distribution of the geopolymer were detected and scanned. After that, the micro-morphology of the samples with different geopolymer dosages (0%, 20%, 40%) and different freeze–thaw cycles (0, 5, 10, 20) was analyzed.

2.1.2. Mercury Intrusion Porosimetry

The mixture specimens with different geopolymer contents (0%, 20%, 40%) and different freeze–thaw cycles after standard curing were sampled and tested using the AUTOPORE IV 9500 mercury intrusion porosimeter. The measurement range was between 3 nm and 360 μm. The aperture distribution and total porosity of the mixture were analyzed.

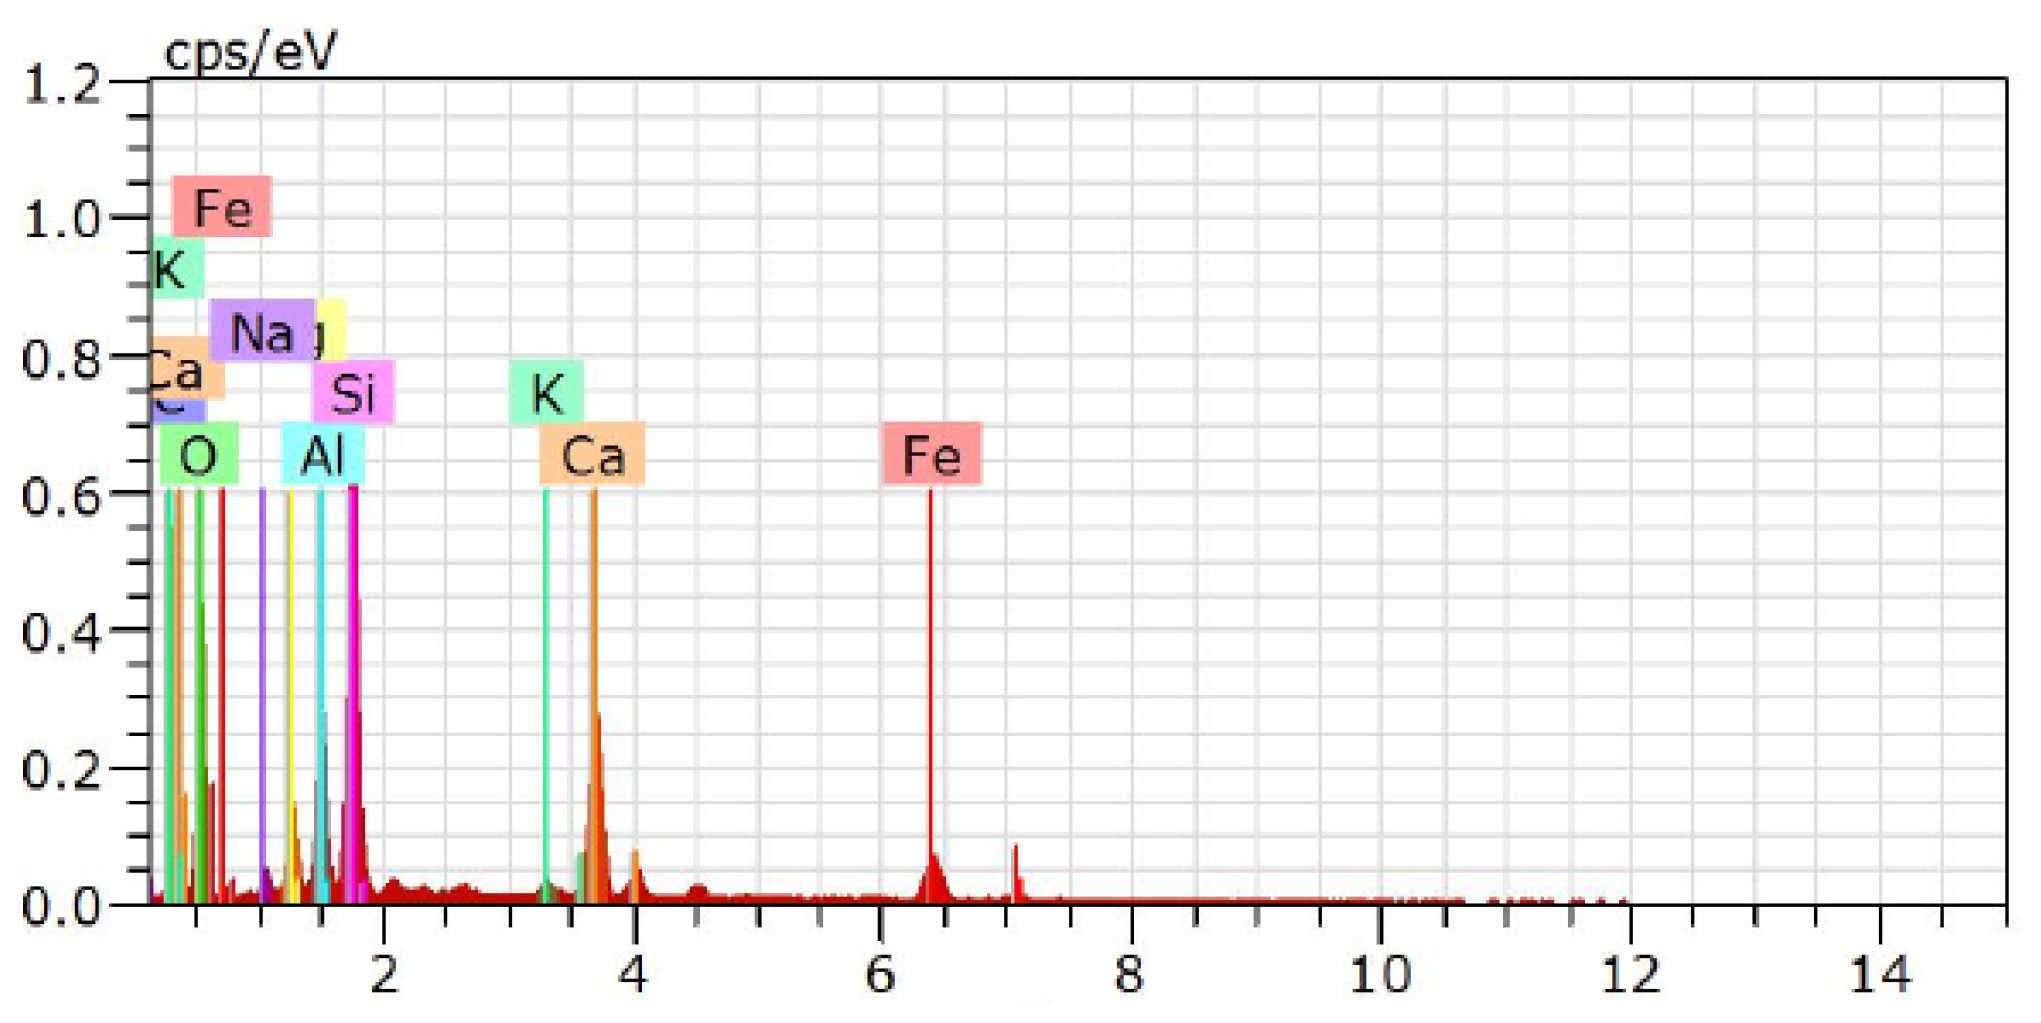
2.1.3. X-ray Fluorescence Analysis

XRF tests were carried out using a HITACHI EA1000AII to determine the chemical composition of the main raw materials of the geopolymer, mineral powder, fly ash and wet calcium carbide slag, and the mass fraction of each component.

2.2. Freeze–Thaw Cycle Test

The geopolymer was used to replace 0%, 20% and 40% cement to make cylindrical specimens. After curing, the freezing and thawing cycle test was launched in a low temperature box with a power of 2.6 kw. The freezing time and thawing time were 16 h and 8 h, respectively. And the cycles were set to 5 cycles, 10 cycles and 20 cycles. After completion, the UCS test, CRM (compressive rebound modulus) test, ITS test, SEM and MIP test were carried out.
Among them, the UCS test was carried out using a JYE300 pressure testing machine, and the ITS and CRM were carried out using the automatic electro-hydraulic servo pressure testing machine from Zhejiang Lixian Test Instrument Manufacturing Co., Ltd, Yueqing, Zhejiang, China. By testing the mixture specimens with different geopolymer contents (0%, 20%, 40%) and freeze–thaw cycles (0, 5, 10, 20), the advantages and disadvantages of frost resistance of mixtures with different geopolymer contents are analyzed.

2.3. Mechanical Test

Mechanical property tests include UCS test, ITS test and CRM test, which mainly investigate the change rule of mechanical properties for mixes under different geopolymer dosages and different numbers of freeze–thaw cycles.

2.3.1. Unconfined Compression Strength

UCS tests were carried out on mix specimens with different geopolymer dosages and number of freeze–thaw cycles using the JYE300 compression tester with specimen sizes of 150 × 150 mm cylindrical specimens and 13 specimens in each group. The UCS test was used to evaluate the maximum pressure that the mix can withstand when subjected to force, without considering lateral restraint.

2.3.2. Indirect Tensile Strength

ITS was carried out by the automatic electro-hydraulic servo pressure tester of Zhejiang Lixian Testing Instrument Manufacturing Co. The specimen specification was 150 × 150 mm cylindrical specimens, and the number of specimens in each group was 13. The performance of materials under tensile force was evaluated by an ITS test.

2.3.3. Compressive Rebound Modulus

The CRM test was carried out using an automatic electro-hydraulic servo pressure tester from Zhejiang Lixian Testing Instrument Manufacturing Co. The specimen size was 150 × 150 mm cylindrical specimens, and the number of specimens in each group was 13. The elastic recovery performance of the material after stress was evaluated by an ITS test.

2.4. Raw Material

The raw test materials mainly include the following: gravel, mineral powder, wet carbide slag, fly ash, sodium hydroxide, cement. The main raw materials of the geopolymer are shown in Figure 1. According to the “Aggregate test protocol” [26], “Soil test protocol” [27] and “Rock test protocol” [28], the raw material test was carried out.

2.4.1. Gravel

The crushed stone for testing is produced in Jiahe quarry, Shibao Town, Baotou City. According to the relevant specifications [26,27,28], the results are determined, as shown in Table 1.

2.4.2. Mineral Powder

The mineral powder for the test is produced at the Jinshan thermoelectric solid waste comprehensive treatment center in Inner Mongolia. The grade is S95. The chemical composition was determined by an XRF test. The relevant parameters are listed in Table 2 and Table 3.

2.4.3. Wet Calcium Carbide Slag

The wet carbide slag for testing is produced by the Sanlian Chemical Plant in Hohhot, Inner Mongolia. The chemical composition was determined by an XRF test. The results are shown in Table 4.

2.4.4. Fly Ash

The fly ash is produced by the Jinshan thermoelectric solid waste comprehensive treatment center in Inner Mongolia, and the category is F. The relevant parameters are indicated in Table 5, and the mass fraction of fly ash is tested by an XRF test, which is shown in Table 6.

2.4.5. NaOH

The activity of geopolymer materials was stimulated by alkali excitation. The alkali excitation material used in the experiment was sodium hydroxide, and the purity was greater than 96%.

2.4.6. Cement

The cement was silicate cement of P.O42.5 grade, and the parameters are as indicated in Table 7.

2.5. Mix Design

2.5.1. Sieve Test

According to the “Guidelines” [29], the test uses water washing and screening. According to the screening results, four empirical gradations are fitted, as indicated in Table 8, and the gradation fold is presented in Figure 2.

2.5.2. Unconfined Compressive Strength Test and Compaction Test

In order to determine the initial amount of cementing material, based on test requirements [30], three kinds of cement content of 4%, 5% and 6% were selected, and the test method was carried out by C method. Five different moisture contents are predetermined according to the difference of 0.5% between adjacent moisture contents. According to the results of the compaction test, 150 × 150 mm mixture specimens were prepared, with 13 specimens in each group, and standard maintenance was carried out [29]. After completion, the 7 d UCS was listed in Table 9.
According to the 7 d UCS data of different gradations under different cement contents listed in Table 9, it is found that at a 5% cement dosage, the 7 d UCS of gradation 4 is up to 5.6 MPa. The four gradations can meet the strength requirements of highways. However, when 6% cement is added, although the gradation meets base material standard requirements, it is not adopted from the perspective of engineering economic benefits and later cracking risk. Therefore, gradation 4 with the highest UCS when the cement dosage is 5% is selected as the gradation in this study. The final mix proportions are shown in Table 10. In Table 10, NO. 1, NO. 2 and NO. 3 represent the quality of each raw material of the mixture when the geopolymer dosage is 0%, 20% and 40%, respectively. Among them, the sum of the quality of the geopolymer and the quality of the cement is the total quality of the cementitious material. After the quality of the cementitious material is calculated according to the ‘regulations’ [30], the quality of the geopolymer is calculated according to the different geopolymer dosages (0%, 20%, 40%). Thus, 85% of the geopolymer quality is mineral powder, 10% is fly ash, 5% is wet carbide slag and the quality of NaOH is 2.58% of the geopolymer quality. For example, in Table 10, NO. 2 means that when the cementitious material content is 319 g and the geopolymer content is 20%, the raw material quality of the geopolymer is 20% of the cementitious material quality, that is, 63.8 g, of which the mineral powder is 54.2 g, the fly ash is 6.4 g, the wet carbide slag is 3.2 g and the alkali activator NaOH is 2.58% of the geopolymer raw material quality, that is, 1.7 g.

2.6. Specimen Preparation

Sample preparation includes the preparation of the ground polymer and preparation of the mix in the following process: the geopolymer used in this study was prepared by mixing 85% mineral powder, 10% fly ash and 5% wet calcium carbide slag with 2.58% NaOH for alkaline excitation, with a water–geopolymer ratio of 1:2. According to Table 9 and Table 10, 150 × 150 mm mixture specimens were prepared by using the mold-making and demolding machine. The specific steps are as follows: weighing raw materials, soaking gravel, preparing specimens, demolding specimens and curing specimens. The number of specimens in each group was 13. After the preparation of the specimens, they were put into the standard curing room (20 °C) for curing and soaked in water on the last day of curing. The preparation flow of the geopolymer and mix is shown in Figure 3.

3. Result Analysis

3.1. Freeze–Thaw Cycle Test

After the maintenance of the mixture specimens with different geopolymer contents was completed, the number of cycles was set to 0, 5, 10 and 20. After cycles, the UCS, CRM and ITS of the specimens without geopolymer, 20% geopolymer content, 40% geopolymer content and different freezing and thawing cycles were tested. The results are shown in Table 11.
It is possible to note from Figure 4 that the UCS of the undoped geopolymer mixture, 20% geopolymer mixture and 40% geopolymer mixture is 7.58 MPa, 7.69 MPa and 7.54 MPa, respectively. The UCS of the 20% geopolymer mixture is the highest, which is 1.5% and 2.0% higher than that of the undoped geopolymer mixture and 40% geopolymer mixture. The UCS of the mixture with three kinds of geopolymer contents decreased after freezing and thawing cycles. Of these, the loss of UCS after 10 cycles was the most obvious, and the UCS loss of the mixture was 27.70%, 27.57% and 31.30%, respectively. Between approximately 10 and 20 cycles, the damage of UCS was relatively small. After 20 cycles, the residual UCS of the mixture with a 20% geopolymer dosage reached up to 4.89 MPa in three dosages. It can be seen that the mixture with a 20% geopolymer content is superior to the mixture with 0% geopolymer content and 40% geopolymer content, both in terms of strength and the rate of loss of strength.
When 20% geopolymer was added, the CRM decreased by 2.35% compared with the mixture without a geopolymer. When the dosage of the geopolymer increased to 40%, the CRM of the mixture decreased by 10.34%. This obvious decrease shows that the mixture with a 40% geopolymer content is quite significant in reducing CRM.
After freezing and thawing cycle tests, the CRM of the mixture with different geopolymer contents showed different degrees of reduction. This reduction is negatively correlated with the number of cycles; that is, the higher the number of cycles, the smaller the CRM of the mixture. After 20 cycles, the CRM of the mixture with three kinds of geopolymer content decreased by 11.65%, 13.16% and 12.79%, respectively. This reduction means that the deformation resistance of the mixture is weakened. In addition, according to Figure 5b, the loss of strength of the mix with three types of geopolymer dosage is significant after 10 freeze–thaw cycles, which is 8.85%, 9.89% and 9.94%, respectively. After that, with an increase in cycles, the CRM loss tends to be gentle.
It is clear from Figure 6 that the ITS of the undoped geopolymer mixture, 20% geopolymer mixture and 40% geopolymer mixture is 0.80 MPa, 0.84 MPa and 0.77 MPa, respectively. The ITS of the 20% geopolymer mixture is the highest, which is 5% and 9.09% higher than that of the undoped geopolymer mixture and 40% geopolymer mixture. With an increase in cycles, the ITS of the mixture gradually reduced. The ITS of the mixture decreased most significantly after 10 freeze–thaw cycles, which were 26.25%, 23.81% and 27.27%, respectively. Regardless of the strength or strength loss rate, the mixture with a 20% geopolymer content is better than the mixture with 0% and 40% geopolymer content, which reflects that the incorporation of 20% geopolymer enhances the anti-freezing property of the mixture, while the incorporation of 40% geopolymer makes the cold resisting property of the mixture decrease instead of increasing.
In summary, the trend of the UCS and ITS of the geopolymer–cement-stabilized macadam mixture first rises and then falls. Among them, the mixture with 20% geopolymer content shows the best UCS and ITS, which are 7.69 MPa and 0.84 MPa, respectively. At the same time, the CRM indicates a decreasing trend with an increase in the geopolymer content. After freezing and thawing, the mixture with 20% geopolymer content is superior to the mixture without geopolymer and the mixture with 40% geopolymer content in terms of UCS and ITS, and the mixture with 20% geopolymer content is in the UCS and ITS. The loss rate of strength is also lower than that of the undoped geopolymer mixture and 40% geopolymer mixture. In addition, after 10 cycles, the loss of UCS, CRM and ITS of the mixture with three kinds of geopolymer content is larger.

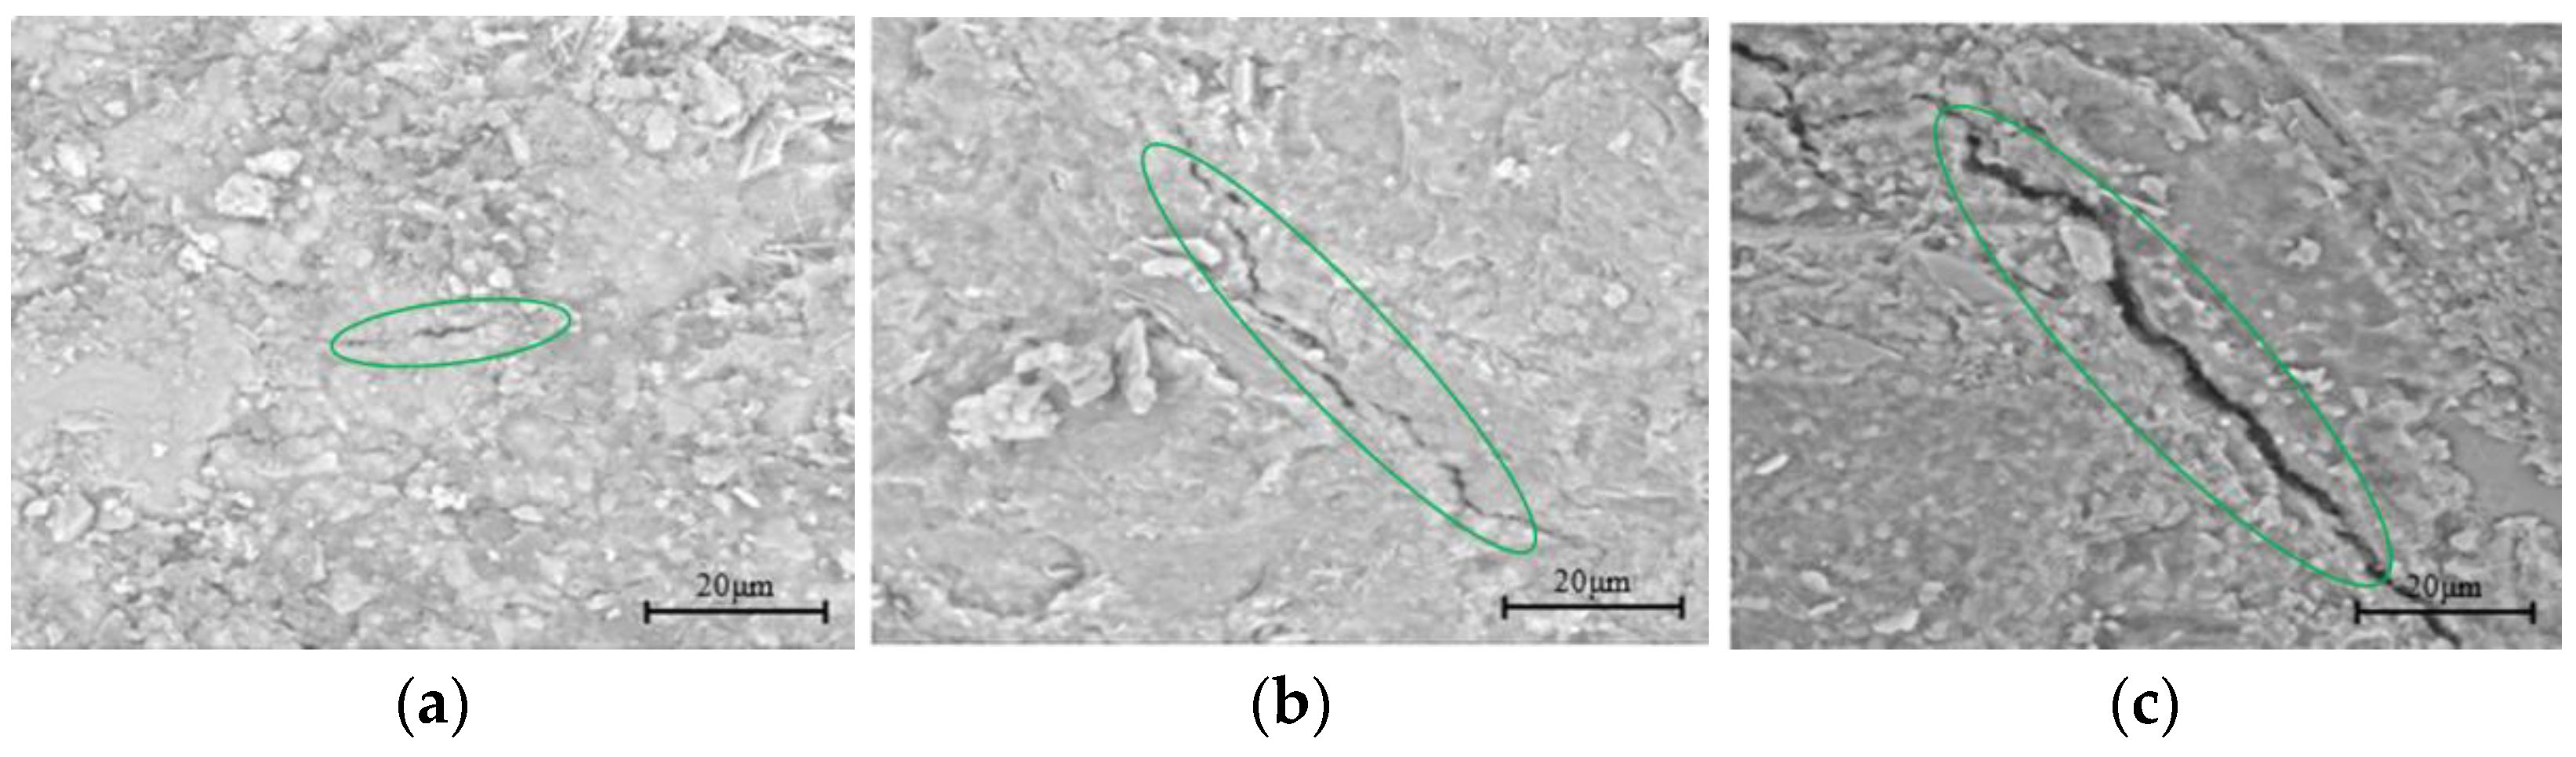
3.2. Scanning Electron Microscope

In order to understand the mechanism of geopolymer strength formation, the geopolymer portion of the maintenance-completed mix was selected for elemental composition analysis and elemental distribution analysis; the composition information is first detected, as shown in Figure 7. In addition, considering that the distribution uniformity of the cementitious material has an impact on the strength that cannot be ignored, the cementitious material powder is magnified by 1000-times for single element surface scanning, as shown in Figure 8.
Figure 7 shows the test results of the elemental composition of the geopolymer. From the diagram, the following can be seen: the geopolymer composition consists mainly of O, C, Al, Si, Mg, Ca, K, Na and Fe, which is basically the same as the composition of cement [31]. Therefore, the geopolymer has an acceptable composition basis for being used as cementitious material.
From Figure 8, it can be seen that the distribution of each element component of the geopolymer cementitious material is relatively uniform, which further indicates that the geopolymer cementitious material has great dispersibility after the hydration reaction and can be fully cemented with the aggregate as a cementitious material, thereby affecting the strength of the mixture.
Figure 9 shows an image of the mixture samples without geopolymer, 20% and 40% geopolymer content after 3000-times magnification by SEM. It can be seen that in the samples without a geopolymer, the products generated by cement hydration are connected with each other and cover the surface of the aggregate, making the surface relatively complete. However, with an increase in the geopolymer dosage, the hydration product and calcium aluminate hydrate began to appear on the surface of the sample. When the dosage of the geopolymer was raised from 20% to 40%, the surface hydration products changed from flake accumulation to granular accumulation.
This is mainly because the reaction mechanism of the geopolymer is divided into three steps [32]. First, under alkaline conditions, Al-O-Si and Si-O-Si in the raw materials are dissociated to form silicate and aluminate ions. Then, these ions are gelled, Al(OH) 4 Al(OH) 5 2 , Al3+, Ca2+ and so on. Finally, silicate ions and aluminate ions recrystallize to form zeolite-like substances.
Under the influence of alkaline excitation materials, 20% of the monomers in the geopolymer, such as Si, Al, etc., are separated from the material and become root ions. These monomers then react with dehydroxylation and interact with alkali metal ions to recombine to form silicates and aluminosilicates. These chemical changes make the geopolymer hydration reaction products connect and harden to form a plate-like structure, resulting in solidification and hardening effects. Therefore, the mechanical properties of the mixture with 20% geopolymer content are better than those of the mixture with no geopolymer dosage.
When 40% geopolymer is added, many massive and granular substances accumulate on the specimen surface. This is due to the high content of the geopolymer. On the one hand, the incomplete hydration reaction of some geopolymers makes the hydration products in the mixture accumulate in the form of particles or agglomerates and does not form a plate structure that can increase the strength. On the other hand, the incorporation of too much geopolymer increases the heat released by the hydration reaction, and the cement and geopolymer in the mixture shrink via heat release, resulting in shrinkage cracks [33], which, in turn, causes more pores to form inside the mixture, affecting the strength, and ultimately leading to a loss of strength in the mixture with 40% geopolymer content.
Figure 10 shows an image of the mixture samples with 20% geopolymer content after 3000 freezing and thawing cycles using SEM. As can be seen from the image, after five cycles, the surface smoothness of the mixture with 20% geopolymer content is reduced, and a small crack about 12 μm long and 1 μm wide is produced. After 10 cycles, the crack gradually grows to a length of approximately 52 μm and a width of approximately 2 μm. Finally, after 20 cycles, the crack grows to about 83 μm, indicating that under the effect of cycles, due to the saturation of the specimen, the open pores are filled with free water. Influenced by low temperature, the water in the pores begins to freeze, resulting in the frost heave effect. When the pores are gradually expanded, the pores are connected to each other, and the cracks are gradually formed and expanded, which further reduces the strength of the mixture. At the macro level, when enhancing the cycle, the mechanical properties of the mixture are damaged to varying degrees.

3.3. Mercury Intrusion Porosimetry

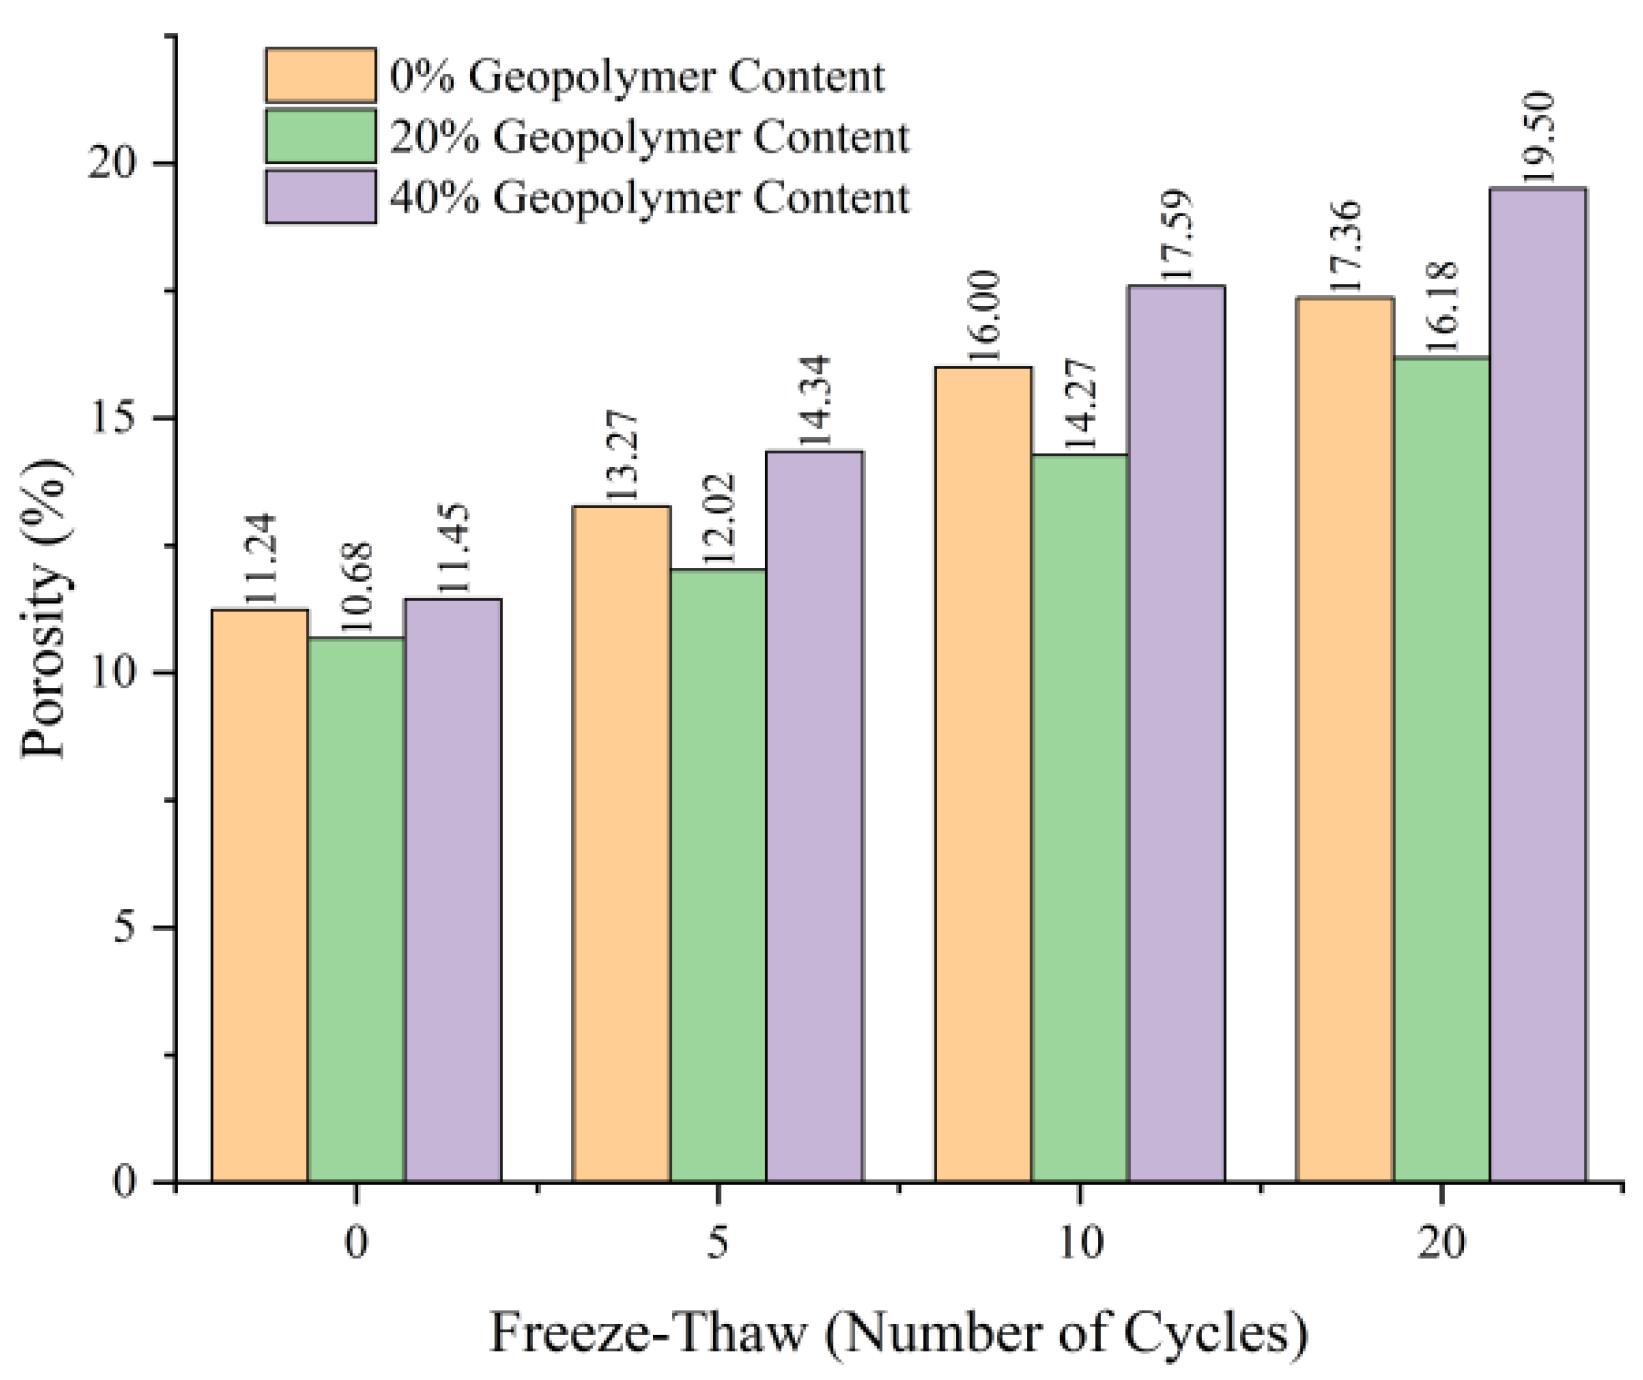
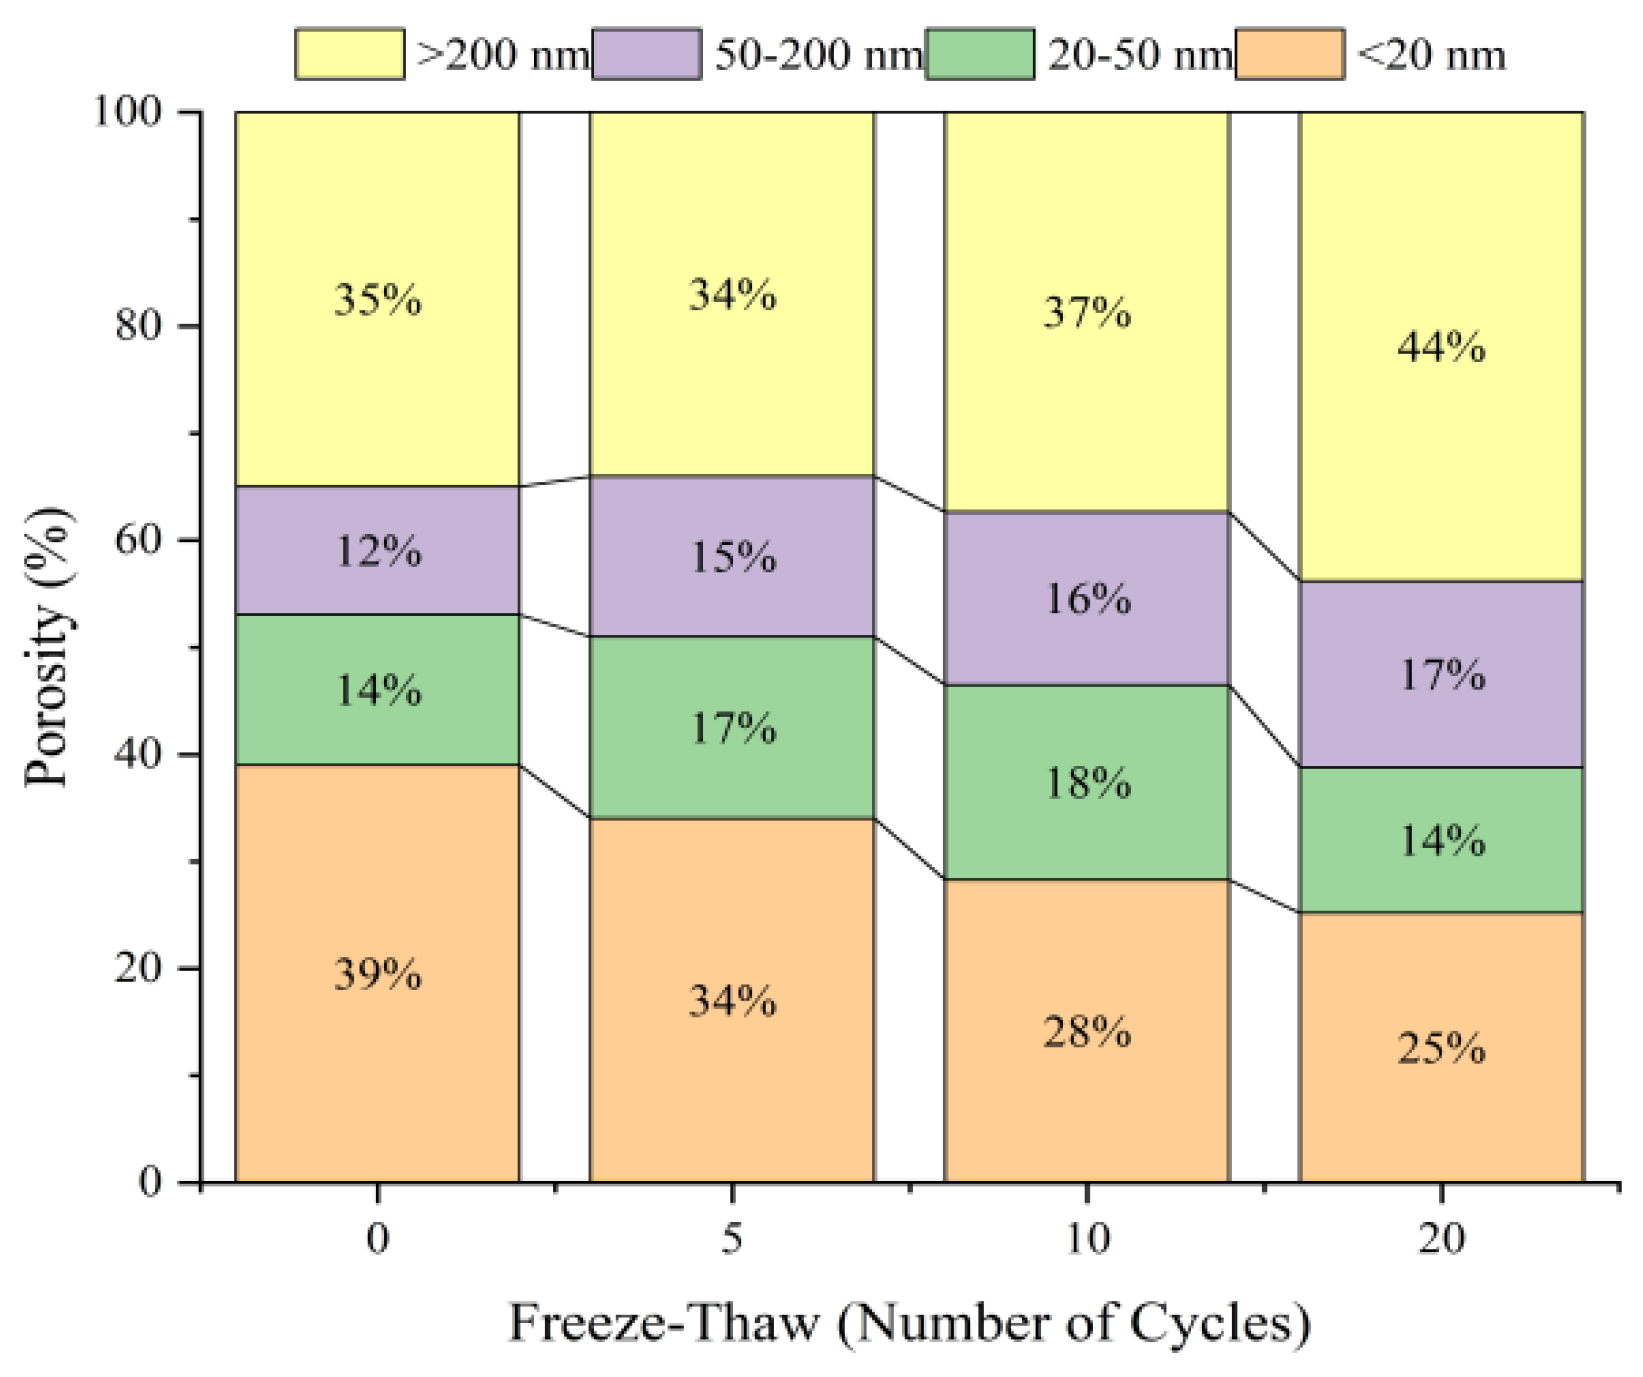
3.3.1. Results of Mercury Intrusion Porosimetry

The MIP was carried out on the samples with different geopolymer contents. The pores were divided into four categories according to the size of the pores [34]: harmless pores (<20 nm), less harmful pores (20–50 nm), harmful pores (50–200 nm) and more harmful pores (>200 nm). The experimental results are indicated in Table 12.
As shown in the MIP results in Table 12, combined with Figure 11, with an increase in cycles, the porosity of the mixture without geopolymer, 20% geopolymer and 40% geopolymer showed an increasing trend. This shows a positive correlation between the number of freezing and thawing cycles and porosity. In addition, regardless of the number of cycles, the porosity of the mixture with 20% geopolymer is always lower than that of the mixture without geopolymer and the mixture with 40% geopolymer.
From the perspective of macroscopic mechanical properties, the mechanical properties of the mixture reduce with increasing cycles. However, the UCS and ITS of the mixture with 20% geopolymer are better than those of the mixture without geopolymer and the mixture with 40% geopolymer.
By observing the change in pore size distribution for the single geopolymer content mixture (taking 20% content as an example) in Figure 12, we find that the more cycles, the more the porosity of harmless pores in the four types of pores gradually decreases, while the number of harmful pores and more harmful pores gradually increases. This is consistent with the change trend of macroscopic mechanical properties; that is, with more cycles, the mechanical properties of the mixture with 20% geopolymer decrease gradually.

3.3.2. Grey Relation Analysis of Mixture Performance Index and MIP Results under Freeze–Thaw Cycle Conditions

According to the results of freezing and thawing cycle tests and MIP, we can find that when the geopolymer content is 20%, the UCS and ITS of the mixture are always higher than those of the mixture without geopolymer and 40% geopolymer content, and less strength is wasted than that of the mixture without geopolymer and 40% geopolymer content. The comprehensive performance is the best among the three dosages; in addition, combined with Table 11 and Table 12, it is found that with an increase in cycles, under the same dosage, pores with a diameter of 50 nm or more and total porosity gradually increase, and the UCS and ITS of the mixture gradually decrease. Based on this, it is speculated that there is a certain relationship between the mechanical properties of the mixture and the distribution of harmful pores, more harmful pores and total porosity. Therefore, based on the grey relation theory, this section takes the change rate of harmful pores, more harmful pores and total porosity after freezing and thawing tests in the MIP test of the 20% geopolymer content sample as the parent sequence and the corresponding UCS, ITS and CRM loss of the sample as the sub-sequence to analyze the correlation between the macro-mechanical performances and micro-indicators of geopolymer–cement-stabilized crushed stone mixture after freeze–thaw cycles. The formula of grey relation analysis is as follows: Formulas (1)~(3), where Formula (1) is the dimensionless processing formula of elements, Formula (2) is the expression of the grey correlation coefficient and Formula (3) is the solution of the grey correlation index. The results of grey correlation analysis are listed in Table 13.
x = x min ( x ) max ( x ) min ( x )
ξ i ( j ) = min ( x i x 0 ) + ρ max ( x i x 0 ) x i x 0 + ρ max ( x i x 0 )
r i = 1 n j = 1 n ξ i ( j )
In the formula, ξi(j) represents the correlation coefficient; ri represents the correlation degree; and ρ represents the resolution coefficient.
Based on the grey relation analysis, we can see that the correlation between the UCS loss and the total porosity growth of the mixture with 20% geopolymer content after freeze–thaw cycles is 0.75, which indicates that there is a distinct positive correlation between the two. Comparing the results for pore sizes 20–50 nm and greater than 50 nm, the increase in overall porosity has the greatest impact on the loss of UCS. For the loss of ITS, the increase in more harmful pores and total porosity leads to damage, and the correlation degree is above 0.70. Specifically, the correlation between more harmful pores and ITS loss is 0.91, and the correlation between total porosity and ITS loss is 0.74. Compared with UCS and ITS, the correlation between the loss of CRM and several pore size changes is low, which does not exceed 0.70. This means that the CRM loss of the mixture after freezing and thawing cycles is basically not influenced by these pore size changes. In summary, the UCS loss of the mixture after freezing and thawing cycles is mainly affected by increased total porosity, and the ITS loss is mainly affected by the increase in more harmful pores and total porosity, while the CRM is basically not affected by these pore size changes.
After many freeze–thaw cycles, the mixture mechanical properties with different geopolymer contents were all damaged. Through the microscopic test, the theory of action is as follows: In the process of cycles, due to water’s frost-heightening effect, frost heaving cracks appear in the mixture. At the same time, a part of the cementitious material is taken out during the cycles, leading to a change in the pore size distribution of the mixture. For the mixture with 20% geopolymer, after cycles, the harmful pores, more harmful pores and total porosity increased by 1.63%, 3.58% and 5.50%, respectively, and the UCS decreased by 2.43 MPa. According to the grey relation analysis, we found that the increase in total porosity from 10.68% to 16.18% is the main factor leading to the loss of UCS. In addition, the increase in harmful pores (3.58%) and the increase in total porosity (5.50%) are also the main reasons for the loss of ITS.

4. Discussion

According to the previous research conclusions, the addition of an appropriate amount of geopolymer improves the mechanical properties and frost resistance of the base mixture. In order to compare the research in this study with the existing literature research and comprehensively discuss the influence of the geopolymer on the mechanical properties and frost resistance of road construction materials, the relevant studies containing similar research were selected, as shown in Table 14.
The previous research shows that although the types of geopolymer and the types of stabilized materials are different, in general, the addition of an appropriate amount of geopolymer can ensure the road performance of geopolymer-stabilized road materials, including mechanical properties, frost resistance and so on. In addition, due to the related characteristics of geopolymer materials, the geopolymer-stabilized mixture has better frost resistance than the cement-stabilized mixture [23], which is basically consistent with the previous research in Table 14.
For geopolymer-stabilized materials, the mechanical strength mainly comes from a large number of hydration products generated by geopolymer raw materials after alkali excitation, for example, C-(A)-S-H gel, N-A-S-H gel, AFt, geopolymer gel, etc. On the one hand, a large number of hydration products covers the surface of the stabilized material to form a solid matrix, which also makes the loose particles interconnected and aggregated into one, so that the mixture forms strength. On the other hand, the hydration products generated by the geopolymer raw materials after alkali excitation effectively fill the pores and other structures inside the stabilized material, which enhances the compactness of the stabilized material and makes the mixture form strength [5,8,12,15]. In addition, it is worth noting that the dosage of geopolymer generally has an optimal value. The reason is that when the dosage is below the optimal value, the amount of hydration products is lower and cannot cover the stabilized material. When the dosage is above the optimal value, it will lead to the deterioration of the internal compactness of the mixture [4]. Therefore, too little or too much geopolymer dosage is not recommended.
Combined with the previous research conclusions, it can be seen that under the condition of freeze–thaw cycles, the strength of the mixture will decrease with the increase in the number of freeze–thaw cycles [22,23,24,25], which is consistent with the conclusions of this study. According to the mechanism analysis part of this study, this kind of strength damage mainly comes from the increase in porosity and the change in the pore size distribution in the mixture after freeze–thaw cycles. The increase in total porosity leads to a significant decrease in UCS in the mixture, while an increase in more harmful pores and increase in total porosity lead to the damage of ITS in the mixture. In addition, relevant studies have pointed out that after the freeze–thaw cycle, the mixture develops cracks, the internal damage increases and the effective contact area of the particles inside the sample is reduced, which is also the cause of the strength damage in the mixture after the freeze–thaw cycle [22,24].

5. Conclusions

(1)
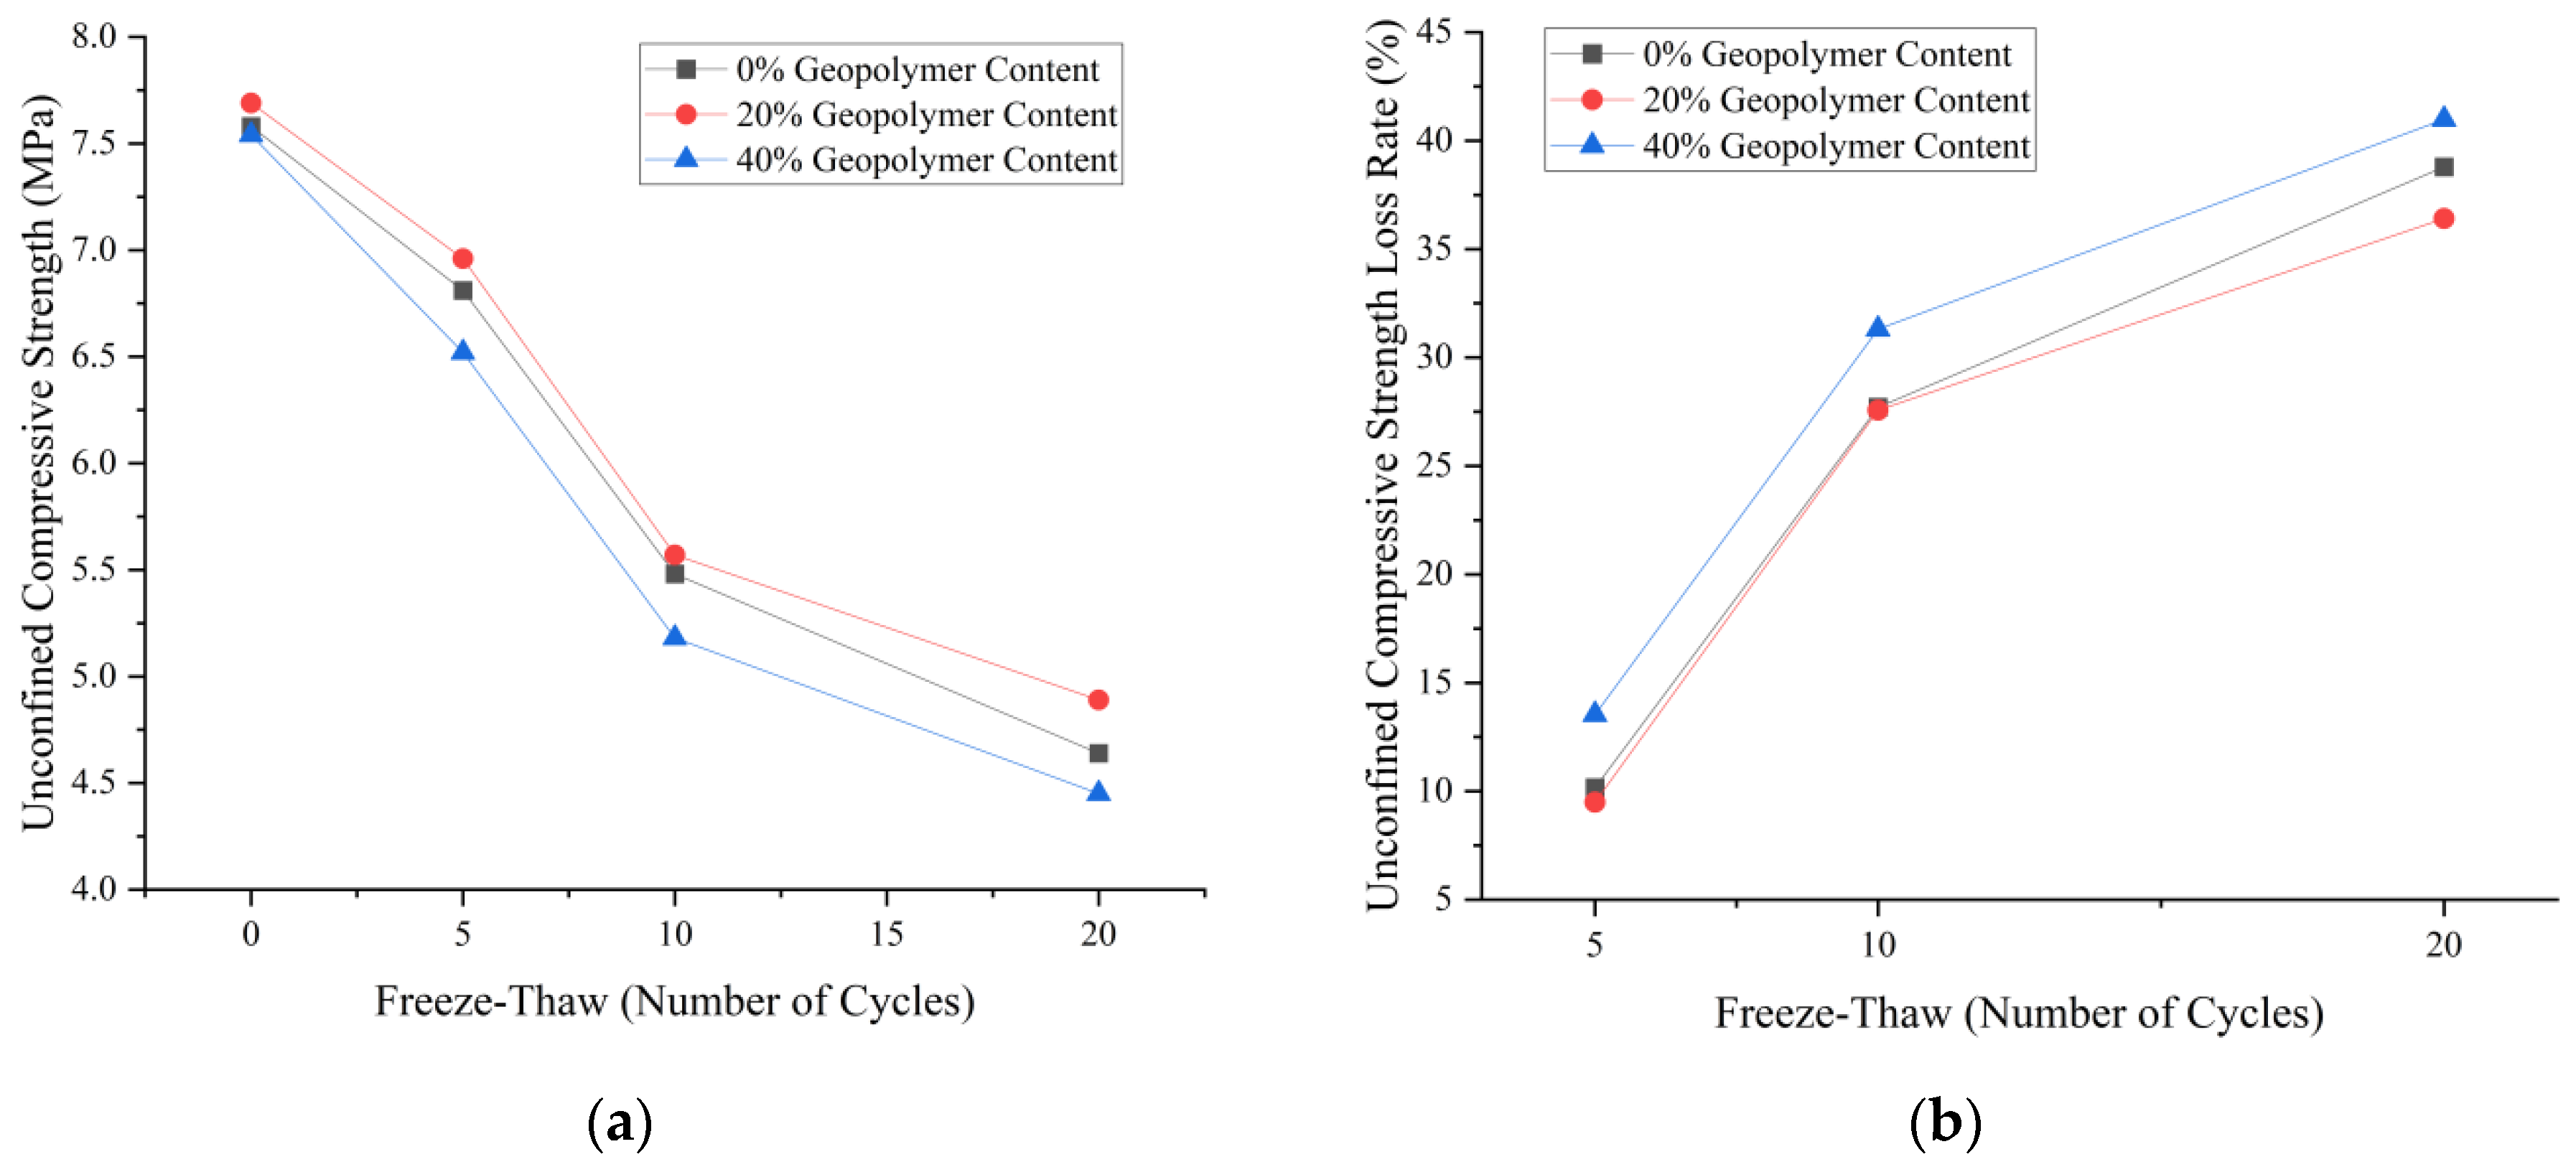
After adding 20% geopolymer into the mixture, the UCS and ITS are better than those of the mixture without a geopolymer, whether before or after the freeze–thaw cycle. This shows that that adding an appropriate amount of geopolymer has a positive influence on the UCS and ITS of the mixture.
(2)
When the amount of geopolymer is too large, the strength of the mixture will decrease. After freezing and thawing cycles, the loss of UCS and ITS is also expressively greater than that of the mixture mixed with 0% and 20% geopolymer. This shows that the amount of geopolymer must be appropriate to maintain the strength of the mixture.
(3)
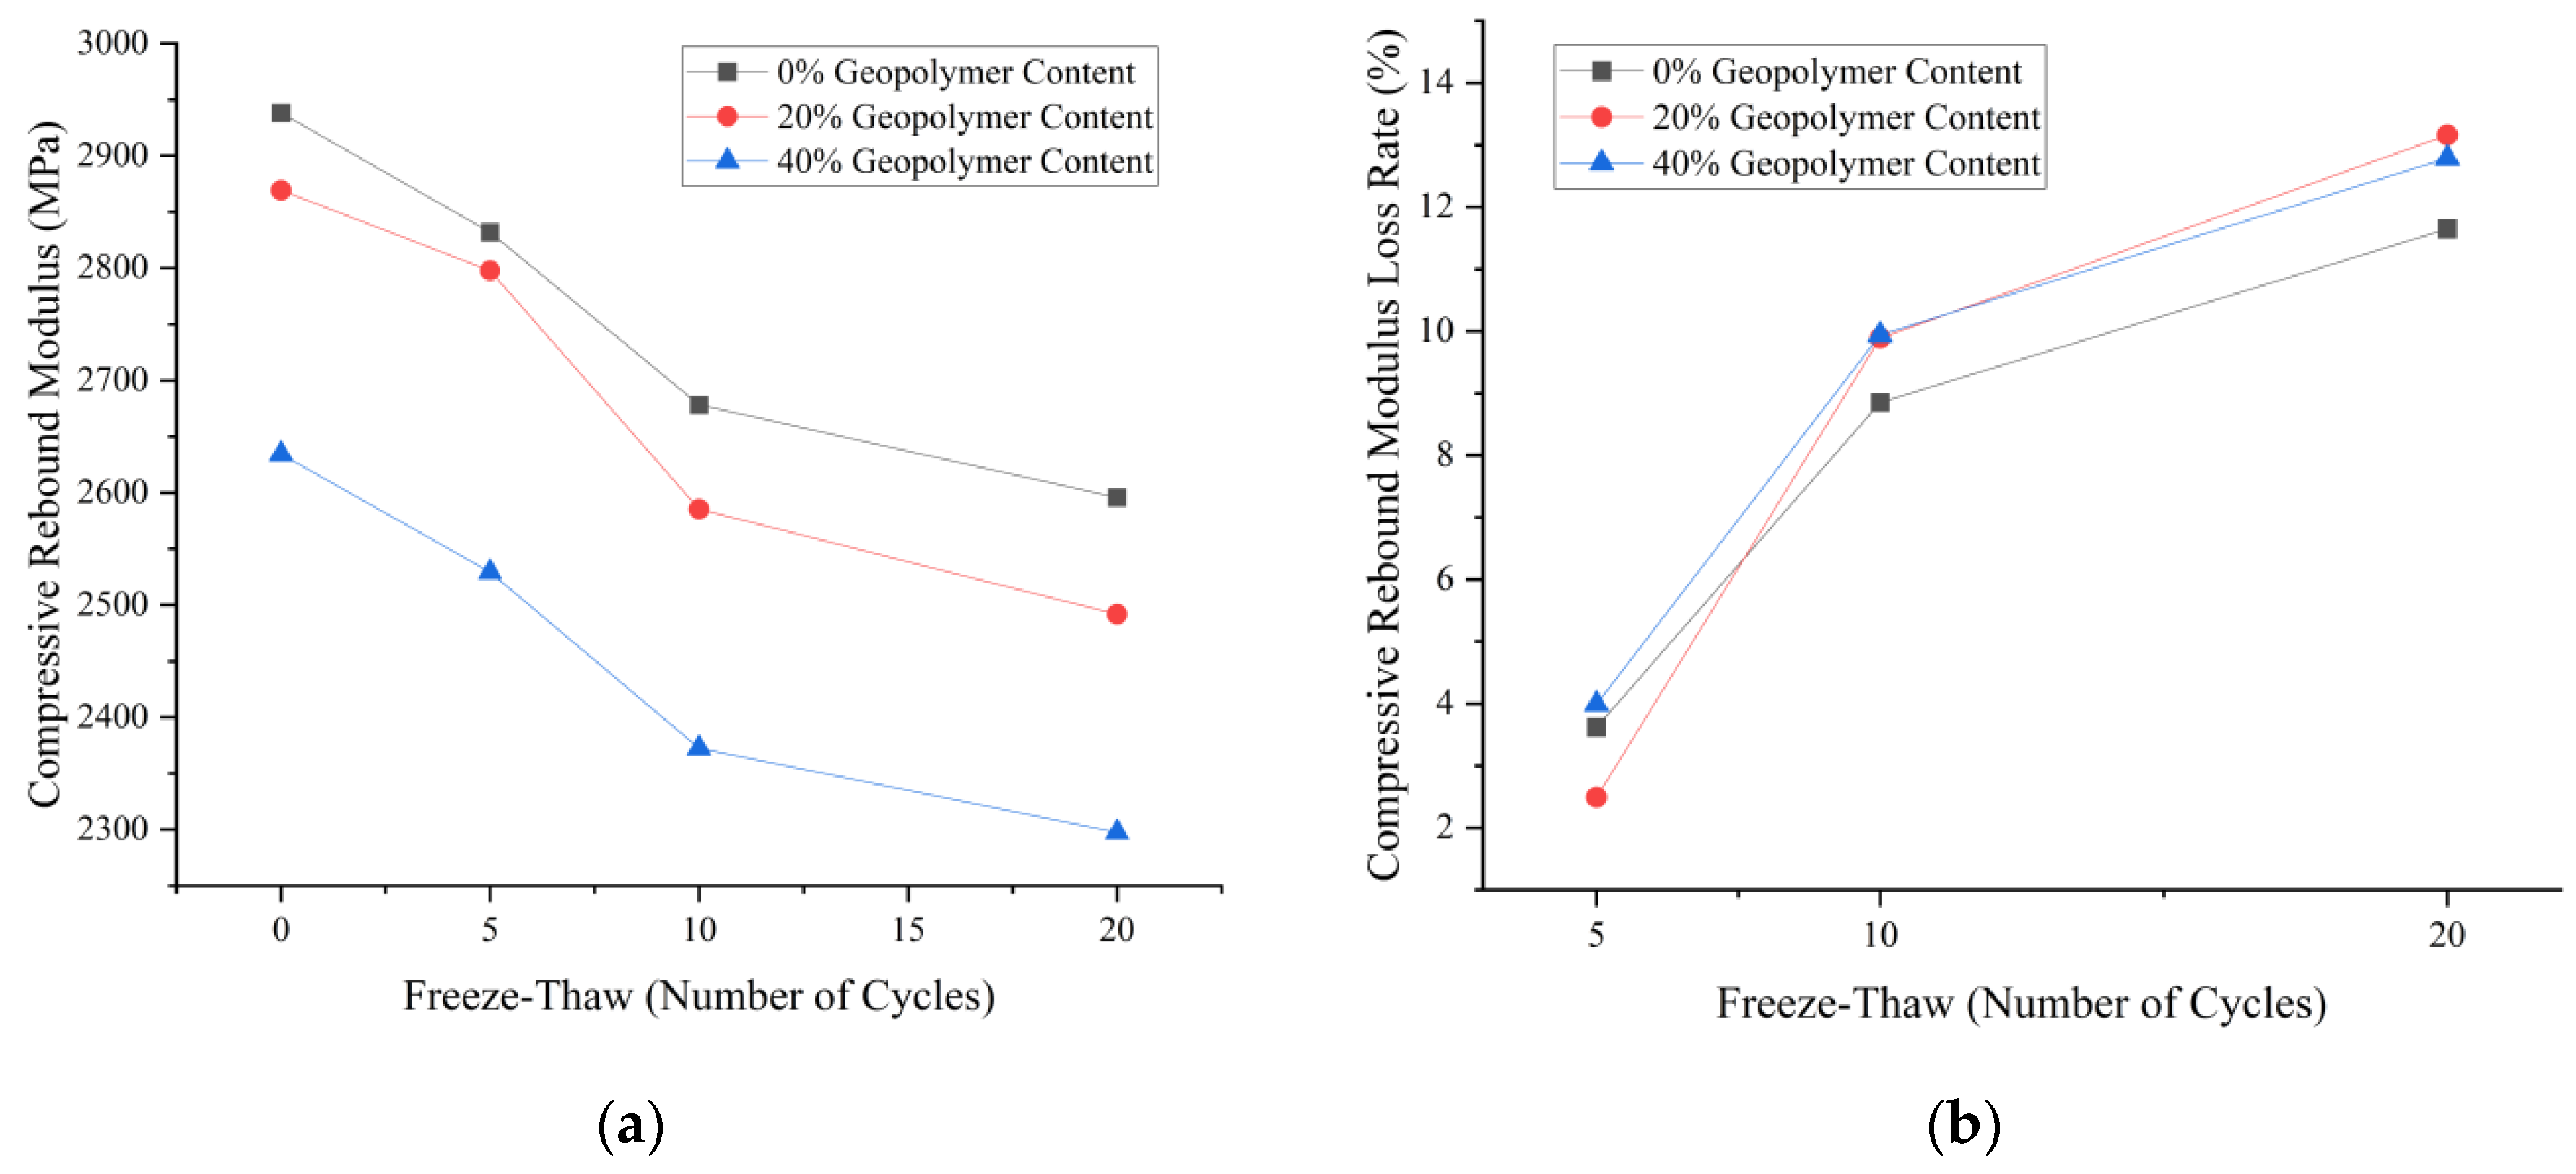
According to the comparative analysis of the results of the mechanical properties test and MIP after freezing and thawing cycle, it is indicated that the mixture with 20% geopolymer is superior to the mixture without and with 40% geopolymer in terms of frost resistance. This shows that an appropriate geopolymer content can improve the freezing resistance of the mixture.
(4)
The results of grey relation analysis indicate that the loss of UCS in the mixture after freezing and thawing cycles is mainly affected by the increase in total porosity, while the loss of ITS is mainly related to the increase in harmful pores and total porosity. It is worth noting that the CRM is basically not affected by these three types of pore sizes. This shows that when evaluating the performance of the mixture, it is necessary to consider the influence of different factors on the strength indicators, such as UCS, CRM and ITS.

Author Contributions

Conceptualization, Y.L., K.J. and L.L.; data curation, K.J.; Formal analysis, Y.L. and K.J.; Funding acquisition, Y.L.; Investigation, K.J., L.L. and X.L.; Methodology, Y.L.; Project administration, Y.L.; Resources, Y.L.; Software, Y.L. and K.J.; Supervision, Y.L.; Writing–original draft, K.J. and Y.L.; Writing–review & editing, L.L. and X.L. Validation, L.L.; Visualization, K.J. All authors have read and agreed to the published version of the manuscript.

Funding

This research was funded by the Inner Mongolia Autonomous Region Science and Technology Plan (no.2022YFHH0082, no.2020GG0257).

Institutional Review Board Statement

Not applicable.

Informed Consent Statement

Not applicable.

Data Availability Statement

The data presented in this study are available on request from the corresponding author.

Conflicts of Interest

Xiao Li was employed by the company Shandong Yi Fang Da Construction Project Management Co., Ltd. The remaining authors declare that the research was conducted in the absence of any commercial or financial relationships that could be construed as a potential conflict of interest.

References

  1. Kwan, C.L. The Inner Mongolia Autonomous Region: A major role in China’s renewable energy future. Util. Policy 2010, 18, 46–52. [Google Scholar] [CrossRef]
  2. Meskhi, B.; Beskopylny, A.N.; Stel’makh, S.A.; Shcherban’, E.M.; Mailyan, L.R.; Shilov, A.A.; El’shaeva, D.; Shilova, K.; Karalar, M.; Aksoylu, C.; et al. Analytical review of geopolymer concrete: Retrospective and current issues. Materials 2023, 16, 3792. [Google Scholar] [CrossRef]
  3. Zhao, C.; Li, J.; Zhu, Z.; Guo, Q.; Wu, X.; Wang, Z.; Zhao, R. Research on the Carbonation Resistance and Carbonation Depth Prediction Model of Fly Ash-and Slag-Based Geopolymer Concrete. KSCE J. Civ. Eng. 2024, 28, 2802–2817. [Google Scholar] [CrossRef]
  4. Yang, G.; Li, C.; Xie, W.; Yue, Y.; Kong, C.; Li, X. Effect of carbide slag and steel slag as alkali activators on the key properties of carbide slag-steel slag-slag-phosphogypsum composite cementitious materials. Front. Mater. 2024, 11, 1353004. [Google Scholar] [CrossRef]
  5. Subramanian, S.; Davis, P.R.; Thomas, B.S. Sustainable engineered geopolymer composites: A study on the potential of fly ash, BOF slag, and iron ore tailings. Environ. Eng. Res. 2024, 29, 230540. [Google Scholar] [CrossRef]
  6. Gao, Y.; Zhu, Z.; Zhu, J.; Hu, X. Study on the mechanical properties and water stability of steel slag-fly ash geopolymer for base Stabilisation. Int. J. Pavement Eng. 2024, 25, 2308168. [Google Scholar] [CrossRef]
  7. Ghosh, A.; Ransinchung, R.N.G.D. Performance evaluation of fly ash and red mud as geopolymer concrete precursors for rigid pavement application. Int. J. Pavement Res. Technol. 2024, 17, 680–692. [Google Scholar] [CrossRef]
  8. Al-Dossary, A.A.; Awed, A.M.; Gabr, A.R.; Fattah, M.Y.; El-Badawy, S.M. Performance enhancement of road base material using calcium carbide residue and sulfonic acid dilution as a geopolymer stabilizer. Constr. Build. Mater. 2023, 364, 129959. [Google Scholar] [CrossRef]
  9. Lu, X.; Tian, Y.; Jiskani, I.M.; Zhou, W.; Zhao, B.; Ding, X.; Ao, Z. Innovate geopolymer synthesis for green mine road construction: Analysis of efflorescence behavior and strength analysis. Constr. Build. Mater. 2023, 401, 132963. [Google Scholar] [CrossRef]
  10. Sun, Y.; Yang, Y.; Niu, X.; Yang, J.; Deng, K.; Song, S.; Shi, X.; Wen, Z.; Wang, Y. Pavement Performance of Fine-Grained Soil Stabilized by Fly Ash and Granulated Blast Furnace Slag-Based Geopolymer as Road Base Course Material. J. Mater. Civ. Eng. 2024, 36, 04024167. [Google Scholar] [CrossRef]
  11. Ji, X.; Chen, B.; Dong, X.; Lu, H.; Zhang, X.; He, S.; Wu, T. Mechanical and environmental properties of geopolymer-stabilized domestic waste incineration slag in an asphalt pavement base. J. Road Eng. 2023, 3, 218–228. [Google Scholar] [CrossRef]
  12. Tabyang, W.; Kuasakul, T.; Sookmanee, P.; Laksanakit, C.; Chusilp, N.; Bamrungphon, Y.; Suksiripattanapong, C. Use of a rubber wood fly ash-based geopolymer for stabilizing marginal lateritic soil as green subbase materials. Clean Technol. Environ. Policy 2024, 26, 2059–2073. [Google Scholar] [CrossRef]
  13. Alakara, E.H.; Nacar, S.; Sevim, O.; Korkmaz, S.; Demir, I. Determination of compressive strength of perlite-containing slag-based geopolymers and its prediction using artificial neural network and regression-based methods. Constr. Build. Mater. 2022, 359, 129518. [Google Scholar] [CrossRef]
  14. Feng, B.; Liu, J.; Chen, Y.; Tan, X.; Zhang, M.; Sun, Z. Properties and microstructure of self-waterproof metakaolin geopolymer with silane coupling agents. Constr. Build. Mater. 2022, 342, 128045. [Google Scholar] [CrossRef]
  15. Singh, S.; Kumar, A.; Sitharam, T.G. Mechanical, Microstructural, and Durability Properties of Soil Stabilized with Alkali-Activated Jarofix for Road Applications. J. Hazard. Toxic Radioact. Waste 2023, 27, 04023020. [Google Scholar] [CrossRef]
  16. Anburuvel, A.; Sathiparan, N.; Dhananjaya GM, A.; Anuruththan, A. Characteristic evaluation of geopolymer based lateritic soil stabilization enriched with eggshell ash and rice husk ash for road construction: An experimental investigation. Constr. Build. Mater. 2023, 387, 131659. [Google Scholar] [CrossRef]
  17. Cao, R.; Fang, Z.; Shang, Y. Production of a New Base Material for Load-Bearing Water-Storing Road. J. Mater. Civ. Eng. 2022, 34, 04022144. [Google Scholar] [CrossRef]
  18. Turkane, S.D.; Chouksey, S.K. Design of low volume road pavement of stabilized low plastic soil using fly ash geopolymer. Mater. Today Proc. 2022, 65, 1154–1160. [Google Scholar] [CrossRef]
  19. Pang, Y.; Zhu, X.; Yang, M.; Yu, J. Tailoring rheological–strength–ductility properties of self-cleaning geopolymer composites with asphalt emulsion. Constr. Build. Mater. 2021, 308, 124997. [Google Scholar] [CrossRef]
  20. Zhang, Y.; Gong, H.; Jiang, X.; Lv, X.; Xiao, R.; Huang, B. Environmental impact assessment of pavement road bases with reuse and recycling strategies: A comparative study on geopolymer stabilized macadam and conventional alternatives. Transp. Res. Part D 2021, 93, 102749. [Google Scholar] [CrossRef]
  21. Qin, L.; Nie, Q.; Zhang, H.; Jia, X.; Zhang, C. Laboratory experimental study on red mud geopolymer used as road subgrade materials. E3S Web Conf. 2021, 261, 02043. [Google Scholar] [CrossRef]
  22. Lu, X.; Tu, L.; Tian, Y.; Zhou, W.; Zhao, X.; Yang, Y. Experimental Study of the Freeze–Thaw Damage of Alpine Surface Coal Mine Roads Based on Geopolymer Materials. Water 2023, 15, 3903. [Google Scholar] [CrossRef]
  23. Zhao, Q.; Liu, J.; Wu, L.; Lu, X.; Li, H.; Hu, W.; Zhang, Y.; Kong, X.; Jing, S. Frost Resistance and Shrinkage Characteristics of Soil Stabilized by Carbide Slag and Coal Gangue Powder. Sustainability 2023, 15, 2249. [Google Scholar] [CrossRef]
  24. Hao, Y. Experimental Study on Durability of Red Mud-Based Cementitious Material Stabilized Crushed Stone. Master’s Thesis, Shandong University, Jinan, China, 2024. [Google Scholar]
  25. Ji, X.; Mou, K.; Zhang, T.; Dong, X. Durability of geopolymer stabilized domestic waste incineration slag blending macadam in pavement base. Front. Mater. 2023, 10, 1334547. [Google Scholar] [CrossRef]
  26. JTG E42—2005; Test Methods of Aggregate for Highway Engineering. Ministry of Transport of the People’s Republic of China: Beijing, China, 2005; pp. 7–45.
  27. JTG E40—2007; Test Methods of Soils for Highway Engineering. Ministry of Transport of the People’s Republic of China: Beijing, China, 2007; pp. 398–407.
  28. JTG E41—2005; Test Methods of Rock for Highway Engineering. Ministry of Transport of the People’s Republic of China: Beijing, China, 2005; pp. 5–18.
  29. JTG/T F20—2015; Technical Guidelines for Construction of Highway Roadbases. Ministry of Transport of the People’s Republic of China: Beijing, China, 2015; pp. 4–27.
  30. JTG E51—2009; Test Methods of Materials Stabilized with Inorganic Binders for Highway Engineering. Ministry of Transport of the People’s Republic of China: Beijing, China, 2009; pp. 67–113.
  31. Wichowski, P.; Kalenik, M.; Rutkowska, G.; Malarski, M.; Czajkowska, J.; Franus, W. Characteristics of products made in the process solidification and stabilization of fly ash from combustion of sewage sludge. Cem. Wapno Betonm Cem. Lime Concr. 2024, 28, 389–408. [Google Scholar]
  32. Li, Y.-C.; Min, X.-B.; Ke, Y.; Chai, L.-Y.; Shi, M.-Q.; Tang, C.-J.; Wang, Q.-W.; Liang, Y.-J.; Lei, J.; Liu, D.-G. Utilization of red mud and Pb/Zn smelter waste for the synthesis of a red mud-based cementitious material. J. Hazard. Mater. 2018, 344, 343–349. [Google Scholar] [CrossRef]
  33. Tang, S.B.; Wang, S.Y.; Ma, T.H.; Tang, C.A.; Bao, C.Y.; Huang, X.; Zhang, H. Numerical study of shrinkage cracking in concrete and concrete repair systems. Int. J. Fract. 2016, 199, 229–244. [Google Scholar] [CrossRef]
  34. Wu, Z.W. Discussion on the recent development direction of concrete science and technology. J. Chin. Ceram. Soc. 1979, 3, 262–270. [Google Scholar]
Figure 1. Main raw materials of geopolymer. (a) Mineral powder, (b) wet calcium carbide slag, (c) fly ash.
Applsci 14 05566 g001
Figure 2. Synthetic grading curve.
Applsci 14 05566 g002
Figure 3. Sample preparation process: (a) geopolymer preparation, (b) mixed specimen preparation.
Applsci 14 05566 g003
Figure 4. UCS and strength loss rate of mixture with different geopolymer content after freeze–thaw cycle: (a) UCS, (b) UCS loss rate.
Applsci 14 05566 g004
Figure 5. CRM and modulus loss rate of mixture with different geopolymer content after freeze–thaw cycle: (a) CRM, (b) CRM loss rate.
Applsci 14 05566 g005
Figure 6. ITS and strength loss rate of mixture with different geopolymer content after freeze–thaw cycle: (a) ITS, (b) ITS loss rate.
Applsci 14 05566 g006
Figure 7. Composition of geopolymer.
Applsci 14 05566 g007
Figure 8. Element surface distribution diagram of geopolymer.
Applsci 14 05566 g008
Figure 9. SEM images of different geopolymer content with 3000 times magnification: (a) 0% content, (b) 20% content, (c) 40% content.
Applsci 14 05566 g009
Figure 10. SEM images of different cycles of mixture with 3000-times magnification and 20% geopolymer content: (a) 5 cycles, (b) 10 cycles, (c) 20 cycles.
Applsci 14 05566 g010
Figure 11. The porosity of mixture with different geopolymer contents after freeze–thaw cycles.
Applsci 14 05566 g011
Figure 12. The pore size distribution of the mixture with a content of 20% geopolymer changed after freeze–thaw cycles.
Applsci 14 05566 g012
Table 1. Test results of crushed stone.
Grain Size (mm)Apparent Density (g·cm−3)Needle-like
Content (%)
Absorption Rate (%)Crush Value (%)
19~26.52.94812.95.612.6
9.5~192.97611.30.84
4.75~9.53.0085.80.51
0~4.752.978/0.72
Table 2. Test results of physical properties of mineral powder.
IndexSpecific Surface Area (m2·kg−1)Apparent Density
(g·cm−3)
Compressive Strength (MPa)
7 d28 d
Parameter4353.1916.739.6
Table 4. Chemical composition of wet calcium carbide slag.
Chemical
Composition
SiO2Al2O3CaOFe2O3SO3Other
Mass Fraction (%)3.201.3493.40.3880.4981.57
Table 5. Test results of physical properties of fly ash.
IndexApparent Density (g·cm−3)Activity Index (%)Compressive Strength (MPa)
7 d28 d
Parameter2.3370.9823.732.7
Table 6. Fly ash chemical composition mass fraction.
Chemical
Composition
SiO2Al2O3CaOFe2O3TiO2Other
Mass Fraction (%)44.9042.704.743.161.802.70
Table 7. Cement’s basic parameters.
IndexFineness (%)Setting Time (min)SoundnessMechanical Performance (MPa)
InitialFinalCompressive StrengthBreak Off Strength
Parameter2.8168275Qualified47.38.3
Table 8. Mixture ratio design.
Size of Screen Mesh (mm)Pass Rate (%)
NO. 1NO. 2NO. 3NO. 4NO. 5NO. 6NO. 7
Upper LimitLower LimitMedian1#2#3#4#
26.5100100100100100100100
1986828485.284.383.682.8
1679737678.577.377.476.7
13.2726568.570.068.469.769.3
9.5625357.559.557.760.360.2
4.7545354036.135.036.135.9
2.36312226.524.123.324.123.5
1.18221317.517.216.717.216.7
0.615811.512.512.112.512.1
0.31057.59.29.09.29.0
0.157356.96.76.96.7
0.075523.54.74.64.74.6
Table 9. Compaction test results.
GradationNO. 1NO. 2NO. 3
4% Cement5% Cement6% Cement
ρd ( g·cm−3)Wopt (%)UCS (MPa)ρd (g·cm−3)Wopt (%)UCS (MPa)ρd (g·cm−3)Wopt (%)UCS (MPa)
1#2.4864.94.02.4995.34.72.5025.55.8
2#2.4894.84.22.5094.95.12.5115.16.0
3#2.4915.04.62.5125.15.42.5155.66.2
4#2.4984.94.72.5005.05.62.5165.16.4
Table 10. Final mixture composition.
NO.Gravel (g)Mineral Powder (g)Fly Ash
(g)
Wet Calcium
Carbide Slag (g)
NaOH (g)Cement
(g)
Water (g)
16181.10.00.00.00.0309.1324.4
26372.854.26.43.21.7255.2368.0
36339.9107.812.76.33.3190.2326.2
Table 3. Chemical composition of mineral powder.
Chemical
Composition
SiO2Al2O3CaOFe2O3TiO2MgOSO3Other
Mass Fraction (%)29.8918.6234.581.363.076.922.732.82
Table 11. Results of freezing and thawing cycle test.
SampleFreeze–Thaw
(Number of Cycles)
Geopolymer Content (%)UCS (MPa)CRM (MPa)ITS (MPa)
1007.582938.1440.80
2207.692869.2310.84
3407.542634.3280.77
4506.812831.9150.71
5206.962797.7270.75
6406.522529.3280.68
71005.482678.2610.59
8205.572585.4150.64
9405.182372.3540.56
102004.642595.7410.48
11204.892491.6580.53
12404.452297.4820.45
Table 12. Test results of MIP.
SampleFreeze–Thaw (Number of
Cycles)
Geopolymer
Content (%)
Harmless Pores (%)Less
Harmful Pores (%)
Harmful Pores (%)More
Harmful Pores (%)
Total
Porosity
(%)
1003.931.801.464.0511.24
2204.171.501.283.7410.68
3403.321.951.834.3511.45
4504.381.991.994.9113.27
5204.092.041.804.0912.02
6403.732.292.725.5914.34
71004.002.722.886.4016.00
8203.992.572.285.2714.27
9403.692.643.697.5617.59
102003.992.263.307.6417.36
11204.212.272.917.3216.18
12403.902.154.109.3619.50
Table 13. Results of grey relation analysis between strength loss and pore size distribution of 20% geopolymer mixture after freeze–thaw cycle.
IndexCorrelation Degree
Harmful PoresMore Harmful PoresTotal Porosity
UCS0.670.580.75
ITS0.640.910.74
CRM0.660.470.58
Table 14. Compare the results obtained with the literature.
NO.Mixture CompositionEffect of GeopolymersSource
1Geopolymer: Mineral powder, fly ash, wet carbide slag, NaOH
Stabilized materials: Aggregate
When geopolymer is used to replace 20% cement, the UCS of the base mixture is 7.69 MPa; the freeze–thaw cycle test shows that the mixture with 20% geopolymer substitution rate has the best frost resistance.Present study
2Geopolymer: Calcium carbide residue, Linear alkyl benzene sulfonic acid
Stabilized materials: Road base material
When the ratio of Calcium carbide residue to Linear alkyl benzene sulfonic acid is 80%:20%, the UCS of the geopolymer is the largest. When the local polymer content is 7.5%, it is the best geopolymer content of the mixture.[8]
3Geopolymer: Rubber wood fly ash, NaOH, Na2SiO3
Stabilized materials: Road subbase material
When the geopolymer content is 30% and the ratio of sodium silicate to sodium hydroxide is 70:30, the mixture has the highest UCS and ITS.[12]
4Geopolymer: jarofix, NaOH, Na2SiO3
Stabilized materials: Road Subgrade Material
When the content of geopolymer is 13%, the UCS of the mixture reaches 2.75 MPa and 6.55 MPa respectively in environmental curing and dry curing.[15]
5Geopolymer: Slag, Fly Ash, Na2SiO3
Stabilized materials: Aggregate
The freeze–thaw cycle test of geopolymer stabilized aggregate specimens shows that with the increase of freeze–thaw cycles, the compressive strength and tensile strength of the mixture gradually decrease, but the compressive strength and tensile strength still reach 11.63 MPa and 1.09 MPa.[22]
6Geopolymer: carbide slag, coal gangue, NaOH, Na2SiO3
Stabilized materials: Subgrade soil
When the geopolymer content is 10%, the 7 d UCS of the mixture reaches 3.68 MPa, and the UCS and frost resistance are better than 4% cement stabilized mixture.[23]
7Geopolymer: Red mud, Mineral powder, alkali activator
Stabilized materials: Aggregate
When the local polymer content is 8%, the 7 d UCS of the mixture reaches 7.1 MPa; after freeze–thaw cycles, the strength loss rate of the mixture with 8% geopolymer content is the smallest.[24]
8Geopolymer: Fly ash, metakaolin, NaOH and anhydrous sodium metasilicate
Stabilized materials: Aggregate and domestic waste incineration slag
When 14% geopolymer stabilized mixture is used, the 7 d UCS of the mixture reaches more than 6 MPa, and the frost resistance is significantly better than that of cement stabilized mixture.[25]
Disclaimer/Publisher’s Note: The statements, opinions and data contained in all publications are solely those of the individual author(s) and contributor(s) and not of MDPI and/or the editor(s). MDPI and/or the editor(s) disclaim responsibility for any injury to people or property resulting from any ideas, methods, instructions or products referred to in the content.

