Abstract
In order to rapidly detect pest types in farmland and mitigate their adverse effects on agricultural production, we proposed an improved Yolox-tiny-based target detection method for farmland pests. This method enhances the detection accuracy of farmland pests by limiting downsampling and incorporating the Convolution Block Attention Module (CBAM). In the experiments, images of pests common to seven types of farmland and particularly harmful to crops were processed through the original Yolox-tiny model after preprocessing and partial target expansion for comparative training and testing. The results indicate that the improved Yolox-tiny model increased the average precision by 7.18%, from 63.55% to 70.73%, demonstrating enhanced precision in detecting farmland pest targets compared to the original model.
1. Introduction
China, a major agricultural nation, is experiencing an intensifying impact of pests on crops such as early rice, rice, and corn. Each year, diseases and pests result in a loss of 14 million tons of grain, corresponding to direct economic losses of at least 2 billion RMB. Consequently, researching pest monitoring techniques in farmlands is crucial to ensuring agricultural production [1,2,3].
Existing agricultural pest monitoring technologies can be categorized into manual and intelligent methods. Manual pest monitoring, known for its labor-intensive and time-consuming nature, limits the timeliness and effectiveness of pest control management. In recent years, significant advancements have been made in intelligent pest monitoring technologies. Researchers such as Li et al. and Liu et al. significantly improved identification and classification accuracy, marking a new era in precision agriculture. As a result, intelligent pest monitoring technologies have become increasingly prioritized in recent agricultural research. These advancements highlight the shift towards more intelligent pest monitoring methods [4,5,6,7].
Over the years, deep learning algorithms have been developed and implemented, achieving notable success in the recognition and detection of agricultural pests. For example, Fuentes et al. established an R-FCN with a ResNet-50 deep learning model by comparing combinations of seven feature extractors with a meta-framework. This model reached a mean Average Precision (mAP) of 0.8598 in detecting nine typical types of tomato pests [8]. Deng et al. introduced a multi-pest detection technique employing federated learning with an improved Faster R-CNN that uses ResNet-101 instead of VGG-16 for the base convolutional layer. This approach notably enhanced the detection speed for small targets, achieving an mAP of 90.27% in multi-pest detection [9]. Arun and Umamaheswari explored various deep-learning models for classifying crop pests. Among these, the Faster R-CNN with a ResNet101 feature extractor emerged as the most effective, achieving an mAP of 74.77% [10]. Zhang et al. enhanced Faster R-CNN by substituting VGG16 with ResNet50 for feature extraction and incorporating soft non-maximum suppression to improve recognition of overlapping objects. This modification boosted the detection accuracy for small objects to 83.26%, underscoring the effectiveness of deep learning in agricultural object detection [11]. Chithambarathanu and Jeyakumar provided a comprehensive survey on various deep learning and machine learning methods used for crop pest detection, evaluating their advantages and limitations [12]. Jiao et al. proposed a global context-aware-based deformable residual network module for precise pest recognition and detection, demonstrating improved recognition accuracy through enhanced feature extraction [13]. Additionally, Di and Li developed a method for detecting apple leaf diseases based on an improved convolutional neural network, which significantly increased detection accuracy [14]. However, these models exhibit low detection accuracy for small targets. Addressing this limitation and enhancing detection accuracy for small target pests represent urgent issues and are the primary focus of this paper [15].
To provide a clear comparison, Table 1 summarizes the algorithms, key features, and results highlighted in the existing literature.

Table 1.
Summary of the Existing Literature.
Object detection has emerged as a crucial task across various domains of computer vision. Introduced in 2015, the Yolo algorithm model has seen widespread application in this field [16,17,18,19,20]. The Yolo algorithm has evolved into a series, comprising Yolov1, Yolov2, Yolov3, Yolov4, Yolov5, and Yolox, among others [21,22,23,24,25,26]. Beginning with the introduction of anchor-based detection in Yolov1, Yolox employs anchor-free detection by directly extracting and regressing features from images or videos. These advancements have significantly improved not only detection accuracy but also the efficiency of object detection in images and videos. Furthermore, this technological progress has unlocked new potential for enhancing the detection accuracy of small-sized objects.
The main contributions of this paper are as follows:
- (a)
- Improved detection method: An improved Yolox-tiny-based target detection method is proposed, which enhances the detection accuracy for farmland pests by limiting downsampling and incorporating the Convolution Block Attention Module (CBAM).
- (b)
- Experimental validation: Extensive experiments are conducted using images of pests common to seven types of farmland, demonstrating that the improved model increases the average precision by 7.18% compared to the original Yolox-tiny model.
- (c)
- Optimization techniques: The paper introduces novel optimization techniques, including adaptive image equalization, image denoising, and mosaic image augmentation, to improve the clarity and detail of pest images, further enhancing the model’s accuracy.
- (d)
- Comprehensive dataset: A specialized pest image dataset is curated and preprocessed, providing a robust foundation for training and validating the improved detection model.
- (e)
- Practical applications: The research highlights the practical implications of the improved detection model for real-time pest monitoring and management in agricultural fields, contributing to the mitigation of pest-related losses in agriculture.
The organization of this paper is as follows:
- (a)
- Section 2 outlines the model structure of the Yolox-tiny object detection algorithm;
- (b)
- Section 3 details enhancements to the Yolox-tiny model to address challenges in detecting small objects;
- (c)
- Section 4 describes the preprocessing of image data within the dataset to enhance detection accuracy and details the process of feeding this preprocessed data into the model for training. Additionally, it covers comparative experiments conducted using the same dataset to verify the accuracy of the enhanced model;
- (d)
- Section 5 presents the conclusions derived from the experimental comparisons.
2. Related Work
2.1. Yolox-Tiny Object Detection Algorithm
Developed by Megvii Technology in 2021, the Yolox-tiny model is a lightweight object detection model that represents an advancement over previous Yolox series models. Fundamentally, the Yolox-tiny is based on a specialized deep-learning algorithm that employs convolutional and residual networks. Its core principle entails utilizing feature maps from shallow network convolutions as both inputs and outputs, subsequently feeding them into deeper layers for enhanced feature extraction. Additionally, the model fuses input feature maps with new ones generated by deeper network convolutions, thereby enhancing the image features. These enhanced feature maps are relayed to classifiers and regressors to ascertain the location and type of objects detected.
2.2. Yolox-Tiny Algorithm Model Structure
As illustrated in Figure 1, the Yolox-tiny network structure primarily comprises three components: the backbone feature extraction network, the enhanced feature extraction network, and the classifier and regressor.
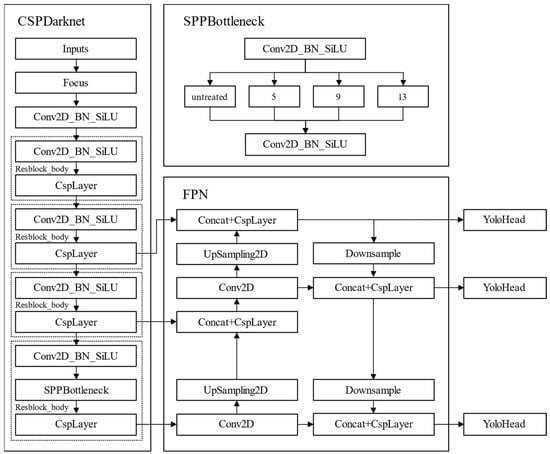
Figure 1.
Yolox-tiny Network Structure.
- (a)
- Backbone feature extraction network: CSPDarknet;
- (b)
- Enhanced feature extraction network: FPN;
- (c)
- Classifier and regressor: Yolo Head.
The CSPDarknet network primarily employs a residual network architecture to initially extract feature layers of various sizes from the input image. The architecture comprises one Focus module, one Conv2D_BN_SiLU module, and four Resblock_body modules. The input image dimensions are 1600 × 1600 pixels with 3 channels. Following multiple 1 × 1 and 3 × 3 convolutions, downsampling, and maximum pooling, the network produces three differently sized feature layers with varying channel counts: intermediate layer feat1 (200 × 200, 256 channels), mid-lower layer feat2 (100 × 100, 512 channels), and bottom layer feat3 (50 × 50, 1024 channels).
The FPN network constructs a feature pyramid with three output layers from the CSPDarknet network, enhancing the feature extraction process and thereby improving object detection accuracy. The FPN network comprises a Concat module, CspLayer module, UpSampling2D module, Conv2D module, and Downsample module. The Concat module facilitates effective layer fusion, the UpSampling2D module upsamples feature layers, the Conv2D module applies 1 × 1 convolutions to adjust image channel numbers, and the Downsample module downsamples feature layers. The FPN network conducts multiple operations of upsampling, feature fusion, and downsampling on input feature layers feat1, feat2, and feat3, resulting in enhanced feature layers: feat4 (200 × 200, 256 channels), feat5 (100 × 100, 512 channels), and feat6 (50 × 50, 1024 channels).
In the process of feature fusion, early features and late features can both be considered for integration. However, in limited training sets, this integration may lead to degradation, which is particularly severe in early feature fusion. Therefore, this study opted not to use early feature fusion of the CSPDarknet network, but rather to fuse the late features feat1, feat2, and feat3. This choice helps to reduce degradation and ensures the effectiveness of feature extraction [27]. This study employed a direct upsampling fusion method. This method is simple and effective but can be further optimized. For instance, using graph-based linear or nonlinear regularization α-integration methods can reduce the discreteness between fused features, enhancing their expressive capability [28].
In summary, this method of constructing the feature pyramid effectively merges features across different layer sizes, thereby enriching the feature information obtained.
The Yolo Head consists solely of Conv2D_BN_SiLU convolution modules. The outputs, which include predictions for classification (Cls), regression (Reg), and objectness (Obj), are detailed in Figure 2.
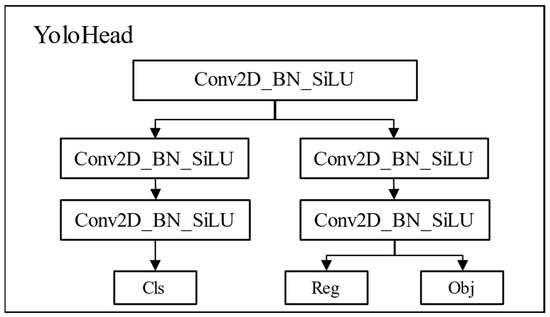
Figure 2.
Yolo Head Structure Diagram.
The Yolo Head is primarily divided into two sections: the left side classifies object types, while the right side assesses object presence within the prediction box and determines the box’s coordinates. The enhanced feature layers—feat4, feat5, and feat6—from the FPN network are fed into the Yolo Head, which processes each layer to derive Cls, Reg, and Obj outputs. Here, “Cls” represents the object’s class, “Reg” denotes the prediction box’s location, and “Obj” indicates the coordinates of the prediction box. Ultimately, these three predictions—box location, coordinates, and class—are integrated to generate comprehensive details about the target objects.
3. Methods
Pests in agricultural fields exhibit considerable variation in type and size, and identifying and detecting small-sized targets and pests against complex backgrounds present significant technical challenges in agricultural pest management. To address these challenges, optimizations and enhancements to the Yolox-tiny model have been described, aimed at improving detection and recognition capabilities for small target pests and pests in complex backgrounds.
3.1. Analysis of Detection Accuracy of the Original Yolox-Tiny Algorithm Model
The original Yolox-tiny model demonstrates low recognition accuracy in identifying and classifying agricultural pest images. Analysis of pest images and the model structure reveals the following main reasons for insufficient accuracy:
- (a)
- Significant size variation exists among different types of pests in agricultural images. For example, the Rice Leafroller is notably small, whereas the Turnip Moth is substantially large;
- (b)
- Some images feature overly complex backgrounds with numerous dried leaves and weeds, which often match the coloration of the target pests;
- (c)
- The Yolox-tiny model structure incorporates three downsampling operations, potentially leading to information loss about small-sized target pests and decreasing recognition accuracy;
- (d)
- The absence of an attention mechanism in the Yolox-tiny model makes it susceptible to interference from non-target objects in images, resulting in incorrect identifications.
To address these issues, this paper proposes enhancements to the Yolox-tiny model, including optimizations in image preprocessing and algorithmic structure, enabling more accurate identification and classification of agricultural pests.
3.2. Optimization of the Yolox-Tiny Model
In the original Yolox-tiny model, the backbone feature extraction network processes input images to produce three distinct feature layers: feat1, feat2, and feat3, each sensitive to large, medium, and small objects, respectively. However, the diminutive size of some pests and the complexity of image backgrounds complicate feature extraction. Moreover, multiple downsampling operations may result in the loss of information concerning small target objects. To address these challenges, two optimizations have been introduced to the Yolox-tiny model: limiting the number of downsampling operations to minimize information loss about small target pests and incorporating the convolutional attention module CBAM to enhance feature extraction for small targets and reduce the impact of complex backgrounds.
CBAM represents a convolutional attention mechanism designed for feed-forward convolutional neural networks. Upon receiving a feature layer, CBAM independently infers attention maps along the channel and spatial dimensions sequentially. These attention maps are subsequently multiplied with the input feature layer to enable adaptive feature refinement.
Figure 3 illustrates the improved Yolox-tiny network structure. This revised structure eliminates one Resblock_body module from the CSPDarknet network and reduces downsampling in the backbone feature extraction network, thereby minimizing feature information loss for small objects and more effectively preserving features of all detectable objects in the image. A CBAM convolutional attention mechanism has been incorporated into the remaining Resblock_body modules to allow adaptive feature refinement during feature extraction. This mechanism strengthens the network’s ability to focus on pests of varying sizes and mitigates the effects of complex backgrounds on object detection. It also simplifies feature fusion and enhances the classification and regression processes in the FPN and Yolo Head components. The CSPDarknet backbone extracts initial features, the CBAM enhances feature refinement, the FPN constructs a feature pyramid, and the Yolo Head generates predictions for classification, regression, and objectness.
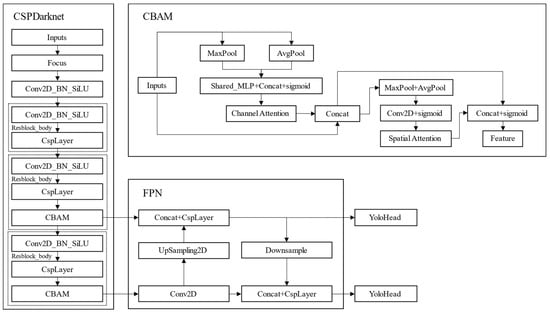
Figure 3.
Improved Yolox-tiny Network Structure.
4. Experiment and Analysis
4.1. Pest Image Preprocessing
4.1.1. Adaptive Image Equalization
Adaptive histogram equalization techniques improve image clarity and contrast by segmenting the image into multiple local regions and individually equalizing these segments. This technique effectively preserves the original image data while enhancing detail visibility. This method is particularly effective for enhancing the accuracy of pest detection locations and the reliability of species identification.
Figure 4 shows the original image of 00197.jpg. Figure 5 illustrates the image post adaptive histogram equalization, where details are significantly enhanced, contrast is more pronounced, and detail preservation is notably effective.
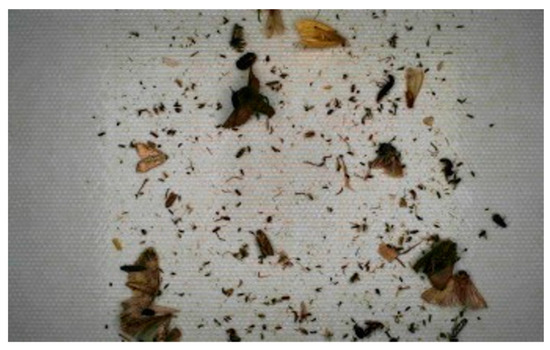
Figure 4.
Original Image of 00197.jpg.

Figure 5.
Image After Adaptive Histogram Equalization.
4.1.2. Image Denoising
During digitization and transmission, images frequently encounter noise introduced by imaging equipment and external environmental factors. To ensure the model’s accuracy and stability, noise reduction is a crucial step. This paper utilizes the Non-Local Means (NLM) filtering method for image denoising.
The NLM filter emphasizes the self-similarity of images, leveraging redundant information to preserve detail during denoising. In agricultural pest monitoring applications, each image may contain one or several types of pests, with some images displaying multiple pests of the same type, exhibiting high self-similarity. Therefore, the use of NLM filtering significantly enhances image quality and analysis accuracy.
Figure 6 shows the image post-NLM filtering with equalization. Following filtering, the pest features and contours become more precise and more distinct, while the overall image appears smoother.
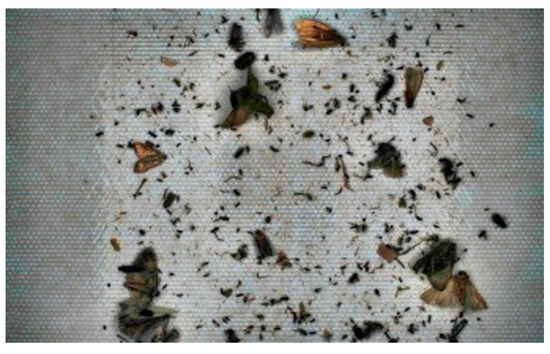
Figure 6.
Image After NLM Processing.
4.1.3. Mosaic Image Augmentation
To enhance the training speed and accuracy of the model, Mosaic image augmentation is applied after images are input. The following transformations are applied to each image in the training set, preserving image categories:
- (a)
- Random rotations, translations, scaling, cropping, padding, and flipping within specified limits to display varied visual perspectives of the same target;
- (b)
- Adding random noise disturbances like salt-and-pepper and Gaussian white noise to the image;
- (c)
- Color transformations involving principal component analysis on the RGB color space to derive three principal component vectors, p1, p2, and p3, along with their eigenvalues, followed by incremental adjustments to each channel;
- (d)
- Modifying image attributes including brightness, clarity, contrast, and sharpness.
Mosaic data augmentation enhances the background information of detected objects and compensates for the inability to set larger batch sizes due to hardware limitations, effectively increasing the batch size indirectly.
Figure 7 shows four images, 00388.jpg, 00418.jpg, 00436.jpg, and 00501.jpg, processed with Mosaic data augmentation. The positions of pests are marked by white boxes in the images.
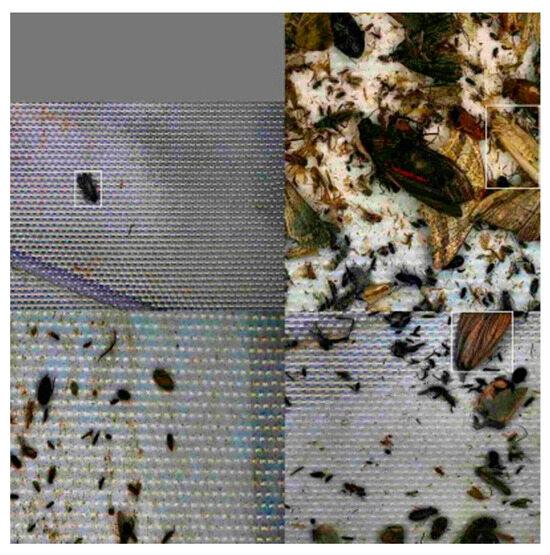
Figure 7.
Mosaic Image Augmentation Processed Images.
4.1.4. Image Augmentation
Given the substantial challenges in identifying and analyzing small-target pests, coupled with the limited availability of related image data, a batch augmentation approach will be employed to enrich sample information and increase the count of positive sample features during model training.
To prevent information leakage during training, enhancement processes are applied specifically to different types of small-target pests, and augmentation is restricted to the training dataset only. Furthermore, to prevent oversaturation of target information in a single image, data concerning target pests in the training dataset is augmented to threefold the original volume. Figure 8 presents the original image and displays the augmented image with the position of the target pests delineated by a red frame.
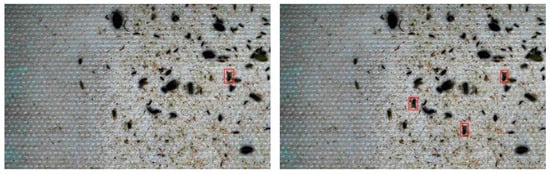
Figure 8.
Image Before Augmentation (Left) and Image After Augmentation (Right).
4.2. Dataset
The dataset for this experiment, a specialized pest image collection, was curated from data provided by the 10th “Teddy Cup” Data Mining Challenge in 2022, after careful reselection and cleansing. The dataset can be accessed online at the https://bdrace.tipdm.com/#/competition/1481159137780998144/question (accessed on 20 June 2024). All images are in JPEG format with a resolution of 5472 × 3648 pixels. The dataset comprises seven pest types: rice stem borer (pest number: 7), white-backed planthopper (pest number: 9), brown planthopper (pest number: 10), yellow-legged predatory bug (pest number: 148), eight-spotted forester moth (pest number: 156), cricket (pest number: 256), and oleander hawk-moth (pest number: 280), with a total of 491 images. Each image features various types and quantities of pests, as detailed in Table 2.
Table 2.
Pest Types and Quantities in Initial Data.
After the image preprocessing steps detailed in Section 4.1.1, Section 4.1.2, Section 4.1.3 and Section 4.1.4, 340 representative images were selected for model development, divided into 238 images for the training set and 68 for the testing set. To expand the dataset and enhance training efficiency, each image was segmented into four smaller images prior to inclusion in the training or testing process. Consequently, the training set effectively comprises 952 smaller images. During the testing phase, each test set image was similarly segmented into four smaller images for analysis. After testing, these smaller images were reassembled into a single image, matching the original’s resolution, to evaluate the results. All pest annotation tasks were conducted using the LabelImg tool, with pest identification numbers corresponding to those listed, and specific pest quantities (based on counts from uncropped images) detailed in Table 3.
Table 3.
Data on Pest Counts After Image Preprocessing.
4.3. Experimental Procedure
The experimental setup included the following: Windows 10 operating system, Python 3.6, TensorFlow-GPU 1.13.2, and Keras 2.1.5.
During the experiment, the epoch count was set at 200 and the batch size at 2. To evaluate model performance, this study conducted comparative experiments between two versions of the Yolox-tiny algorithm:
- (a)
- The original Yolox-tiny algorithm as the first model variant;
- (b)
- The enhanced Yolox-tiny as the second model variant.
4.4. Experimental Results
This experiment employed mean Average Precision (mAP) and Average Precision (AP) as evaluation metrics for pest target detection.
mAP and AP calculations are based on the Precision and Recall of the model’s training samples, with the corresponding formulas presented as follows:
In the formulas, denotes true positives, correctly identified; represents false positives, incorrectly identified as negative; and indicates false negatives, incorrectly identified as positive.
Average Precision (AP) is calculated from the area under the Precision-Recall (P-R) curve, as follows:
Mean Average Precision (mAP) is calculated as the average of the Average Precision (AP) across all categories, expressed as follows:
In the formula, represents the number of sample categories, and denotes the current index.
The complete dataset was employed to train two models, generating both training and testing loss curves, as illustrated in Figure 9.
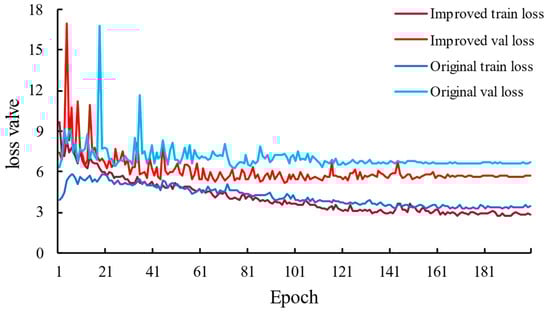
Figure 9.
Model Loss Function Curves.
To verify the reliability of the experimental results, this study assessed the recognition and classification performance of the YoloV4-tiny model from the same series on this dataset. The evaluation of the Yolox-tiny, modified Yolox-tiny, and YoloV4-tiny models involved calculating the AP for each pest type and the overall mAP. For a comparison of the APs, refer to Figure 10.
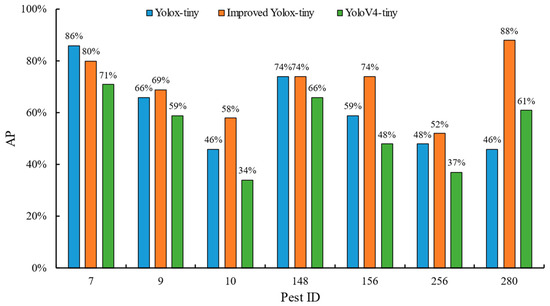
Figure 10.
Comparative Results of Pest Detection by Category.
According to data from Figure 11 and Table 4, the AP values for six types of pests in the enhanced Yolox-tiny model are at least equivalent to, if not higher than, those in the original Yolox-tiny model, except for the rice leafroller (pest ID: 7), which shows a slightly lower AP value. Furthermore, the AP values of the enhanced Yolox-tiny model exceed those of the YoloV4-tiny model. These findings demonstrate that the enhancements significantly improved the pest-detection capabilities of the model. For detailed mAP comparison results, see Table 4.
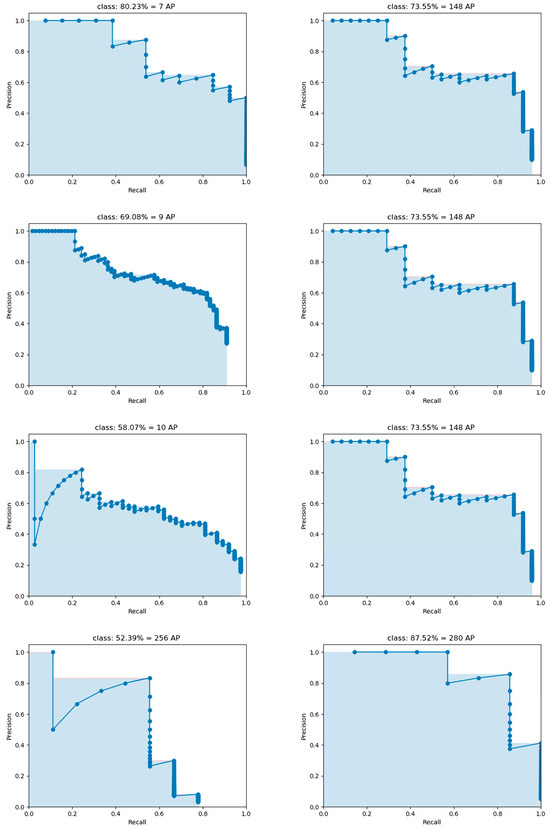
Figure 11.
Precision-Recall (P-R) curve of each type of pest.
Table 4.
Comparison of Training Results between Original and Improved Models.
According to Table 4, the mAP for the Yolox-tiny model is 63.55%, for the YoloV4-tiny model is 54%, and for the enhanced Yolox-tiny model is 70.73%. The Precision-Recall (P-R) curve of each type of pest is shown in Figure 11.
The P-R curve indicates that it is challenging to balance Precision and Recall for pests numbered 10 and 256. There is a significant negative correlation between Precision and Recall for pest number 10, while for pest number 256, there is a sharp drop in Precision after Recall exceeds 0.5, suggesting that the model still requires improvements in detecting these two types of pests. However, the detection of the other five types of pests shows better results in the P-R graph, with the Area Under the Curve (AUC) estimates all exceeding 0.7.
Compared to the Yolox-tiny and YoloV4-tiny models, the enhanced Yolox-tiny model achieved increases in average precision of 7.18% and 16.73%, respectively, underscoring its superiority over the original Yolox-tiny and YoloV4-tiny models.
5. Conclusions
To maintain normal agricultural production, mitigate adverse pest impacts, and reduce losses, an improved Yolox-tiny-based algorithm for pest detection and identification in fields has been proposed. The algorithm targets seven major pest types that pose significant threats across widespread agricultural areas. Compared to the original Yolox-tiny model, this enhanced algorithm improves target pest recognition and detection capabilities and effectively boosts training efficiency. Experimental results demonstrate that the enhanced Yolox-tiny algorithm effectively conducts pest detection in fields. However, the algorithm’s performance can be limited by the quality and diversity of the training data, which may not fully represent all possible variations in pest appearances and environmental conditions. Moreover, the algorithm’s real-time processing capabilities may be constrained by hardware limitations in field applications.
Despite the significant progress made in this study, certain issues remain unresolved due to time constraints, including statistical significance analysis, the addition of another case study, computational burden analysis, and the implementation of other fusion capabilities. These issues are of considerable importance and will be further explored in future research efforts. Specifically, future research will mainly include the following aspects:
- (a)
- Statistical significance analysis: Conduct a more in-depth statistical significance analysis of the experimental results to validate the effectiveness and reliability of the model improvements.
- (b)
- Addition of another case study: Plan to expand the dataset to include more diverse and representative images from different regions and cropping systems to enhance the generalization capability of the model.
- (c)
- Computational burden analysis: Focus on the computational efficiency and resource consumption of the model, particularly the computational burden in practical applications.
- (d)
- Consider the implementation of other fusion capabilities: Explore and implement additional fusion capabilities to further improve the detection performance and application effects of the model.
Furthermore, future research can also focus on enhancing image preprocessing techniques, exploring advanced denoising and equalization methods, and investigating additional data augmentation strategies to better handle variations in pest appearances and environmental conditions. Optimizing model parameters and architecture by introducing other attention mechanisms or feature extraction methods could further enhance performance. Implementing the algorithm in real-time pest monitoring systems and conducting extensive field tests will be essential to ensuring its practical applicability and effectiveness in various agricultural environments. Integrating the algorithm with other agricultural technologies and combining it with other pest management strategies could create more comprehensive and effective pest monitoring systems.
Author Contributions
Conceptualization, Y.W.; methodology, H.D.; software, Y.Y.; validation, Q.D.; formal analysis, Y.Y.; investigation, S.B.; resources, H.D.; data curation, Q.D.; writing—original draft preparation, H.D.; writing—review and editing, S.B. and H.D.; visualization, H.D.; supervision, Y.W.; project administration, Y.W.; funding acquisition, Y.W. All authors have read and agreed to the published version of the manuscript.
Funding
This research was funded by the National Natural Science Foundation of China (grant No. 42172163).
Institutional Review Board Statement
Not applicable.
Informed Consent Statement
Not applicable.
Data Availability Statement
The data are available online at https://bdrace.tipdm.com/#/competition/1481159137780998144/question (accessed on 6 July 2022).
Acknowledgments
The authors would like to thank each member of the team for their efforts.
Conflicts of Interest
The authors declare no conflicts of interest.
References
- Forecast on the Trend of Early Rice Pests and Diseases in China in 2022. Available online: http://www.agri.cn/sc/zxjc/zwbch/202311/t20231129_8129136.htm (accessed on 6 July 2022).
- Forecast on the Trend of Major Pests and Diseases in Rice in China in 2022. Available online: http://www.agri.cn/sc/zxjc/zwbch/202311/t20231129_8129130.htm (accessed on 6 July 2022).
- Forecast on the Trend of Major Pests and Diseases in Corn in China in 2022. Available online: http://www.agri.cn/sc/zxjc/zwbch/202311/t20231129_8129131.htm (accessed on 6 July 2022).
- Li, R.; He, Y.; Li, Y.; Qin, W.; Abbas, A.; Ji, R.; Li, S.; Wu, Y.; Sun, X.; Yang, J. Identification of cotton pest and disease based on CFNet- VoV-GCSP -LSKNet-YOLOv8s: A new era of precision agriculture. Front. Plant Sci. 2024, 15, 1348402. [Google Scholar] [CrossRef] [PubMed]
- Liu, L.; Qiao, S.; Chang, J.; Ding, W.; Xu, C.; Gu, J.; Sun, T.; Qiao, H. A multi-scale feature fusion neural network for multi-class disease classification on the maize leaf images. Heliyon 2024, 10, e28264. [Google Scholar] [CrossRef] [PubMed]
- Dong, S.; Du, J.; Jiao, L.; Wang, F.; Liu, K.; Teng, Y.; Wang, R. Automatic Crop Pest Detection Oriented Multiscale Feature Fusion Approach. Insects 2022, 13, 554. [Google Scholar] [CrossRef] [PubMed]
- Song, C.; Chen, W.; Chen, H.; Chen, Y. Development of a Pest Automatic Diagnosis System for Intelligent Agriculture Using Image Recognition. In Proceedings of the 2023 International Technical Conference on Circuits/Systems, Computers, and Communications (ITC-CSCC), Jeju, Republic of Korea, 25–28 June 2023. [Google Scholar]
- Fuentes, A.; Yoon, S.; Kim, S.C.; Park, D.S. A robust deep-learning-based detector for real-time tomato plant diseases and pests recognition. Sensors 2017, 17, 2022. [Google Scholar] [CrossRef] [PubMed]
- Deng, F.; Mao, W.; Zeng, Z.; Zeng, H.; Wei, B. Multiple Diseases and Pests Detection Based on Federated Learning and Improved Faster R-CNN. IEEE Trans. Instrum. Meas. 2022, 71, 3523811. [Google Scholar] [CrossRef]
- Arun, R.A.; Umamaheswari, S. Effective and efficient multi-crop pest detection based on deep learning object detection models. J. Intell. Fuzszy Syst. 2022, 43, 5185–5203. [Google Scholar] [CrossRef]
- Zhang, M.; Su, Y.; Hu, X. Small target detection based on faster R-CNN. In Proceedings of the Third International Conference on Computer Vision and Data Mining (ICCVDM 2022), Hulun Buir, China, 19–21 August 2022. [Google Scholar]
- Chithambarathanu, M.; Jeyakumar, M.K. Survey on crop pest detection using deep learning and machine learning approaches. Multimed. Tools Appl. 2023, 82, 42277–42310. [Google Scholar] [CrossRef] [PubMed]
- Jiao, L.; Li, G.; Chen, P.; Wang, R.; Du, J.; Liu, H.; Dong, S. Global Context-Aware-Based Deformable Residual Network Module for Precise Pest Recognition and Detection. Front. Plant Sci. 2022, 13, 895944. [Google Scholar] [CrossRef] [PubMed]
- Di, J.; Li, Q. A method of detecting apple leaf diseases based on improved convolutional neural network. PLoS ONE 2022, 17, e0262629. [Google Scholar] [CrossRef] [PubMed]
- Wang, Z.; Qiao, L.; Wang, M. Agricultural pest detection algorithm based on improved faster RCNN. In Proceedings of the International Conference on Computer Vision and Pattern Analysis (ICCPA 2021), Guangzhou, China, 19–21 November 2021. [Google Scholar]
- Cong, X.; Li, S.; Chen, F.; Liu, C.; Meng, Y. A Review of YOLO Object Detection Algorithms based on Deep Learning. Front. Comput. Intell. Syst. 2022, 4, 17–20. [Google Scholar] [CrossRef]
- Lavanya, G.; Pande, S. Enhancing Real-time Object Detection with YOLO Algorithm. EAI Endorsed Trans. Internet Things 2023, 10. [Google Scholar] [CrossRef]
- Su, P.; Li, H.; Wang, X.; Wang, Q.; Hao, B.; Feng, M.; Sun, X.; Yang, Z.; Jing, B.; Wang, C.; et al. Improvement of the YOLOv5 Model in the Optimization of the Brown Spot Disease Recognition Algorithm of Kidney Bean. Plants 2023, 12, 3765. [Google Scholar] [CrossRef] [PubMed]
- Dhruthi, L.; Megharaj, P.K.; Pranav, P.; Kiran, N.; Asha Rani, K.P.; Gowrishankar, S. State-of-the-Art Object Detection: An Overview of YOLO Variants and their Performance. In Proceedings of the 2023 4th International Conference on Smart Electronics and Communication (ICOSEC), Trichy, India, 10–12 September 2023; pp. 1018–1024. [Google Scholar]
- Kulkarni, S.; Mittal, N.; Gupta, R.R.; Ponnlagu, R.N. Investigation of YOLO models in the detection and classification of multiple negative road anomalies. In Proceedings of the 2023 14th International Conference on Computing Communication and Networking Technologies (ICCCNT), Delhi, India, 6–8 July 2023. [Google Scholar]
- Nazir, A.; Wani, M.A. You only look once—Object detection models: A review. In Proceedings of the 2023 10th International Conference on Computing for Sustainable Global Development (INDIACom), New Delhi, India, 15–17 March 2023. [Google Scholar]
- Sozzi, M.; Cantalamessa, S.; Cogato, A.; Kayad, A.; Marinello, F. Automatic Bunch Detection in White Grape Varieties Using YOLOv3, YOLOv4, and YOLOv5 Deep Learning Algorithms. Agronomy 2022, 12, 319. [Google Scholar] [CrossRef]
- Peng, M.; Zhang, W.; Li, F.; Xue, Q.; Yuan, J.; An, P. Weed detection with Improved Yolov 7. EAI Endorsed Trans. Internet Things 2023, 9, e1. [Google Scholar] [CrossRef]
- Ren, R.; Sun, H.; Zhang, S.; Wang, N.; Lu, X.; Jing, J.; Xin, M.; Cui, T. Intelligent Detection of Lightweight “Yuluxiang” Pear in Non-Structural Environment Based on YOLO-GEW. Agronomy 2023, 13, 2418. [Google Scholar] [CrossRef]
- Zhou, X.; Yi, J.; Xie, G.; Jia, Y.; Xu, G.; Sun, M. Human Detection Algorithm Based on Improved YOLO v4. Inf. Technol. Control 2022, 51, 485–498. [Google Scholar] [CrossRef]
- Huang, S.; Li, B. LE-YOLO: A lightweight and efficient cucumber pruning target detection and recognition method based on improved YOLOv5s. In Proceedings of the Fourth International Conference on Signal Processing and Computer Science (SPCS), Guilin, China, 25–27 August 2023. [Google Scholar]
- Pereira, L.M.; Salazar, A.; Vergara, L. A Comparative Analysis of Early and Late Fusion for the Multimodal Two-Class Problem. IEEE Access 2023, 11, 84283–84300. [Google Scholar] [CrossRef]
- Salazar, A.; Safont, G.; Vergara, L.; Vidal, E. Graph Regularization Methods in Soft Detector Fusion. IEEE Access 2023, 11, 144747–144759. [Google Scholar] [CrossRef]
Disclaimer/Publisher’s Note: The statements, opinions and data contained in all publications are solely those of the individual author(s) and contributor(s) and not of MDPI and/or the editor(s). MDPI and/or the editor(s) disclaim responsibility for any injury to people or property resulting from any ideas, methods, instructions or products referred to in the content. |
© 2024 by the authors. Licensee MDPI, Basel, Switzerland. This article is an open access article distributed under the terms and conditions of the Creative Commons Attribution (CC BY) license (https://creativecommons.org/licenses/by/4.0/).