Article

Investigation of Red Clay Internal Stress Anisotropy and Influence Factors

1
Gansu Shunda Road and Bridge Construction Co., Ltd., Lanzhou 730000, China
2
School of Civil Engineering, Lanzhou Jiaotong University, Lanzhou 730000, China
*
Author to whom correspondence should be addressed.
Appl. Sci. 2024, 14(13), 5592; https://doi.org/10.3390/app14135592
Submission received: 29 May 2024 / Revised: 22 June 2024 / Accepted: 25 June 2024 / Published: 27 June 2024

Abstract

:
Permeability characterized by permeability coefficient is one of the important engineering properties of clay, and its permeation mechanism depends on the permeation process of water in clay. To clarify the characteristics and influencing factors of the anisotropy of stress in red clay, indoor variable head permeability tests were conducted to obtain the permeability coefficients of undisturbed red clay in vertical and horizontal directions under different overlying loads. The research results indicate that under the same overburden load, the vertical permeability coefficient (kV) is greater than the horizontal permeability coefficient (kH), and on semi-logarithmic coordinates, both permeability coefficients exhibit a linear negative growth relationship with the overburden load. Moreover, with a gradual increase in the overburden load, the permeability coefficient ratio kV/kH shows a decreasing trend. When the overburden load does not exceed 150 kPa, the ratio of permeability coefficients (kV/kH) shows a linear decreasing trend, and when the overburden load exceeds 150 kPa, the rate of decrease gradually slows and eventually stabilizes. It is also found that the void ratio (e) is linearly related to lgkV and lgkH, and based on this, a prediction model for the anisotropy of stress in undisturbed red clay based on permeability coefficients is established. Under increasing osmotic pressure, the permeability coefficients in both directions exhibit linear growth. Essentially, it is the osmotic pressure that alters the stress pathways of red clay, and the smaller the overburden load, the greater the effect of osmotic pressure. With the increase in the overburden load, the anisotropy of stress gradually weakens.

1. Introduction

Red clay, resulting from the intense chemical weathering of carbonate rocks, is a highly plastic clay with well-developed fractures. During rainy seasons, water easily infiltrates through these cracks, causing deformation and instability in the roadbed [1,2,3]. In the process of engineering design, construction, or use, understanding the permeation characteristics of the foundation soil is of great significance for solving engineering problems [4,5,6]. If the geological model is simplified to a saturated, homogeneous, and isotropic porous continuous medium, ignoring the fundamental reality that soil in nature often displays anisotropy due to geological actions and its own weight, it would be highly unfavorable for estimating the long-term serviceability of engineering structures [7]. Currently, researchers have conducted studies on the anisotropic permeability behavior of soils in different regions [8,9,10].
Hong Bo et al. [11] conducted indoor variable head permeability tests on undisturbed loess at different burial depths to measure the vertical and horizontal permeability coefficients. They found that as the burial depth increased, the anisotropic permeability performance decreased successively, and they believed that the contact and arrangement of soil particles were the primary reasons for the inherent anisotropy. Zeng Wenxi et al. [12] used three types of permeability coefficient anisotropy ratios to compare and analyze the characteristics of slope stress under rainfall infiltration conditions in terms of the magnitude of horizontal and vertical permeability coefficients. The results showed that the greater the anisotropy ratio of the permeability coefficient, the shallower the infiltration depth of rainwater and the smaller the increase in pore water pressure. Yuan Junping et al. [13] used Seep/W software for numerical simulation analysis, discussing factors such as the direction of anisotropy, degree of anisotropy, and distribution area of anisotropy. The results indicated that factors like the direction, degree, and distribution of fracture-induced anisotropy all have a certain impact on slope rainfall infiltration. Furthermore, the impact of fracture-induced anisotropy only becomes apparent when the rainfall intensity exceeds the permeability coefficient in the direction of the fractures. Fang Chao [14] utilized a permeameter for variable head permeability tests to determine the permeability coefficients of peat soil samples at various cut angles. The findings suggest a specific relationship between the permeability coefficient of highly decomposed peat and the angle of cutting, where the coefficient increases with the cutting angle. The anisotropy of permeability was most distinct at moderate levels of organic content. Liu Yanzhi [15] conducted indoor permeability tests on silty soil, finding that the permeability coefficient ratio was generally less than 2. Sun Yannan [16] measured the permeability ratio of loess to be 1.3. From the above studies, it can be seen that different types of soil have varying degrees of permeability anisotropy. Additionally, international researchers have conducted tests on general soft soils. For instance, Leroueil [17] and Tsien [18] reported permeability coefficient ratios for soft clay falling within the range of 1.0 to 2.0.
While previous research has acknowledged that the inherent structure of soil significantly affects its stress characteristics, it is an essential factor in the calculation of stress and stability in engineering soil [19,20]. Regarding red clay itself, its soil structure is relatively loose, with developed pores and low shear strength. Therefore, soil is more prone to deformation under external forces, meaning that the particle structure inside the soil is more prone to undergo a reshaping effect under external loads. Moreover, the emergence of osmotic pressure is also an important objective factor that cannot be ignored for cohesive soil [21]. Particularly, the dual effects of water and temperature will further reduce its inherent strength [22]. However, there has not yet been a comprehensive research output on the evolution law of the anisotropy of stress in red clay under different stresses and osmotic pressure conditions.
Considering the above reasons, this study takes red clay from Gansu Province as the research object, and conducts indoor variable head permeability tests to thoroughly explore the stress characteristics of undisturbed red clay. The effect of total/effective stress on red clay and the stress paths which, together with their history, produce anisotropy in red clay and alter its properties was tested. Furthermore, detailed analysis was conducted on the fundamental laws of the anisotropy of stress in red clay under the influence of various factors. This study is of significant importance in determining the range of permeability coefficient values for red clay and exploring its consolidation settlement characteristics.

2. Materials and Methods
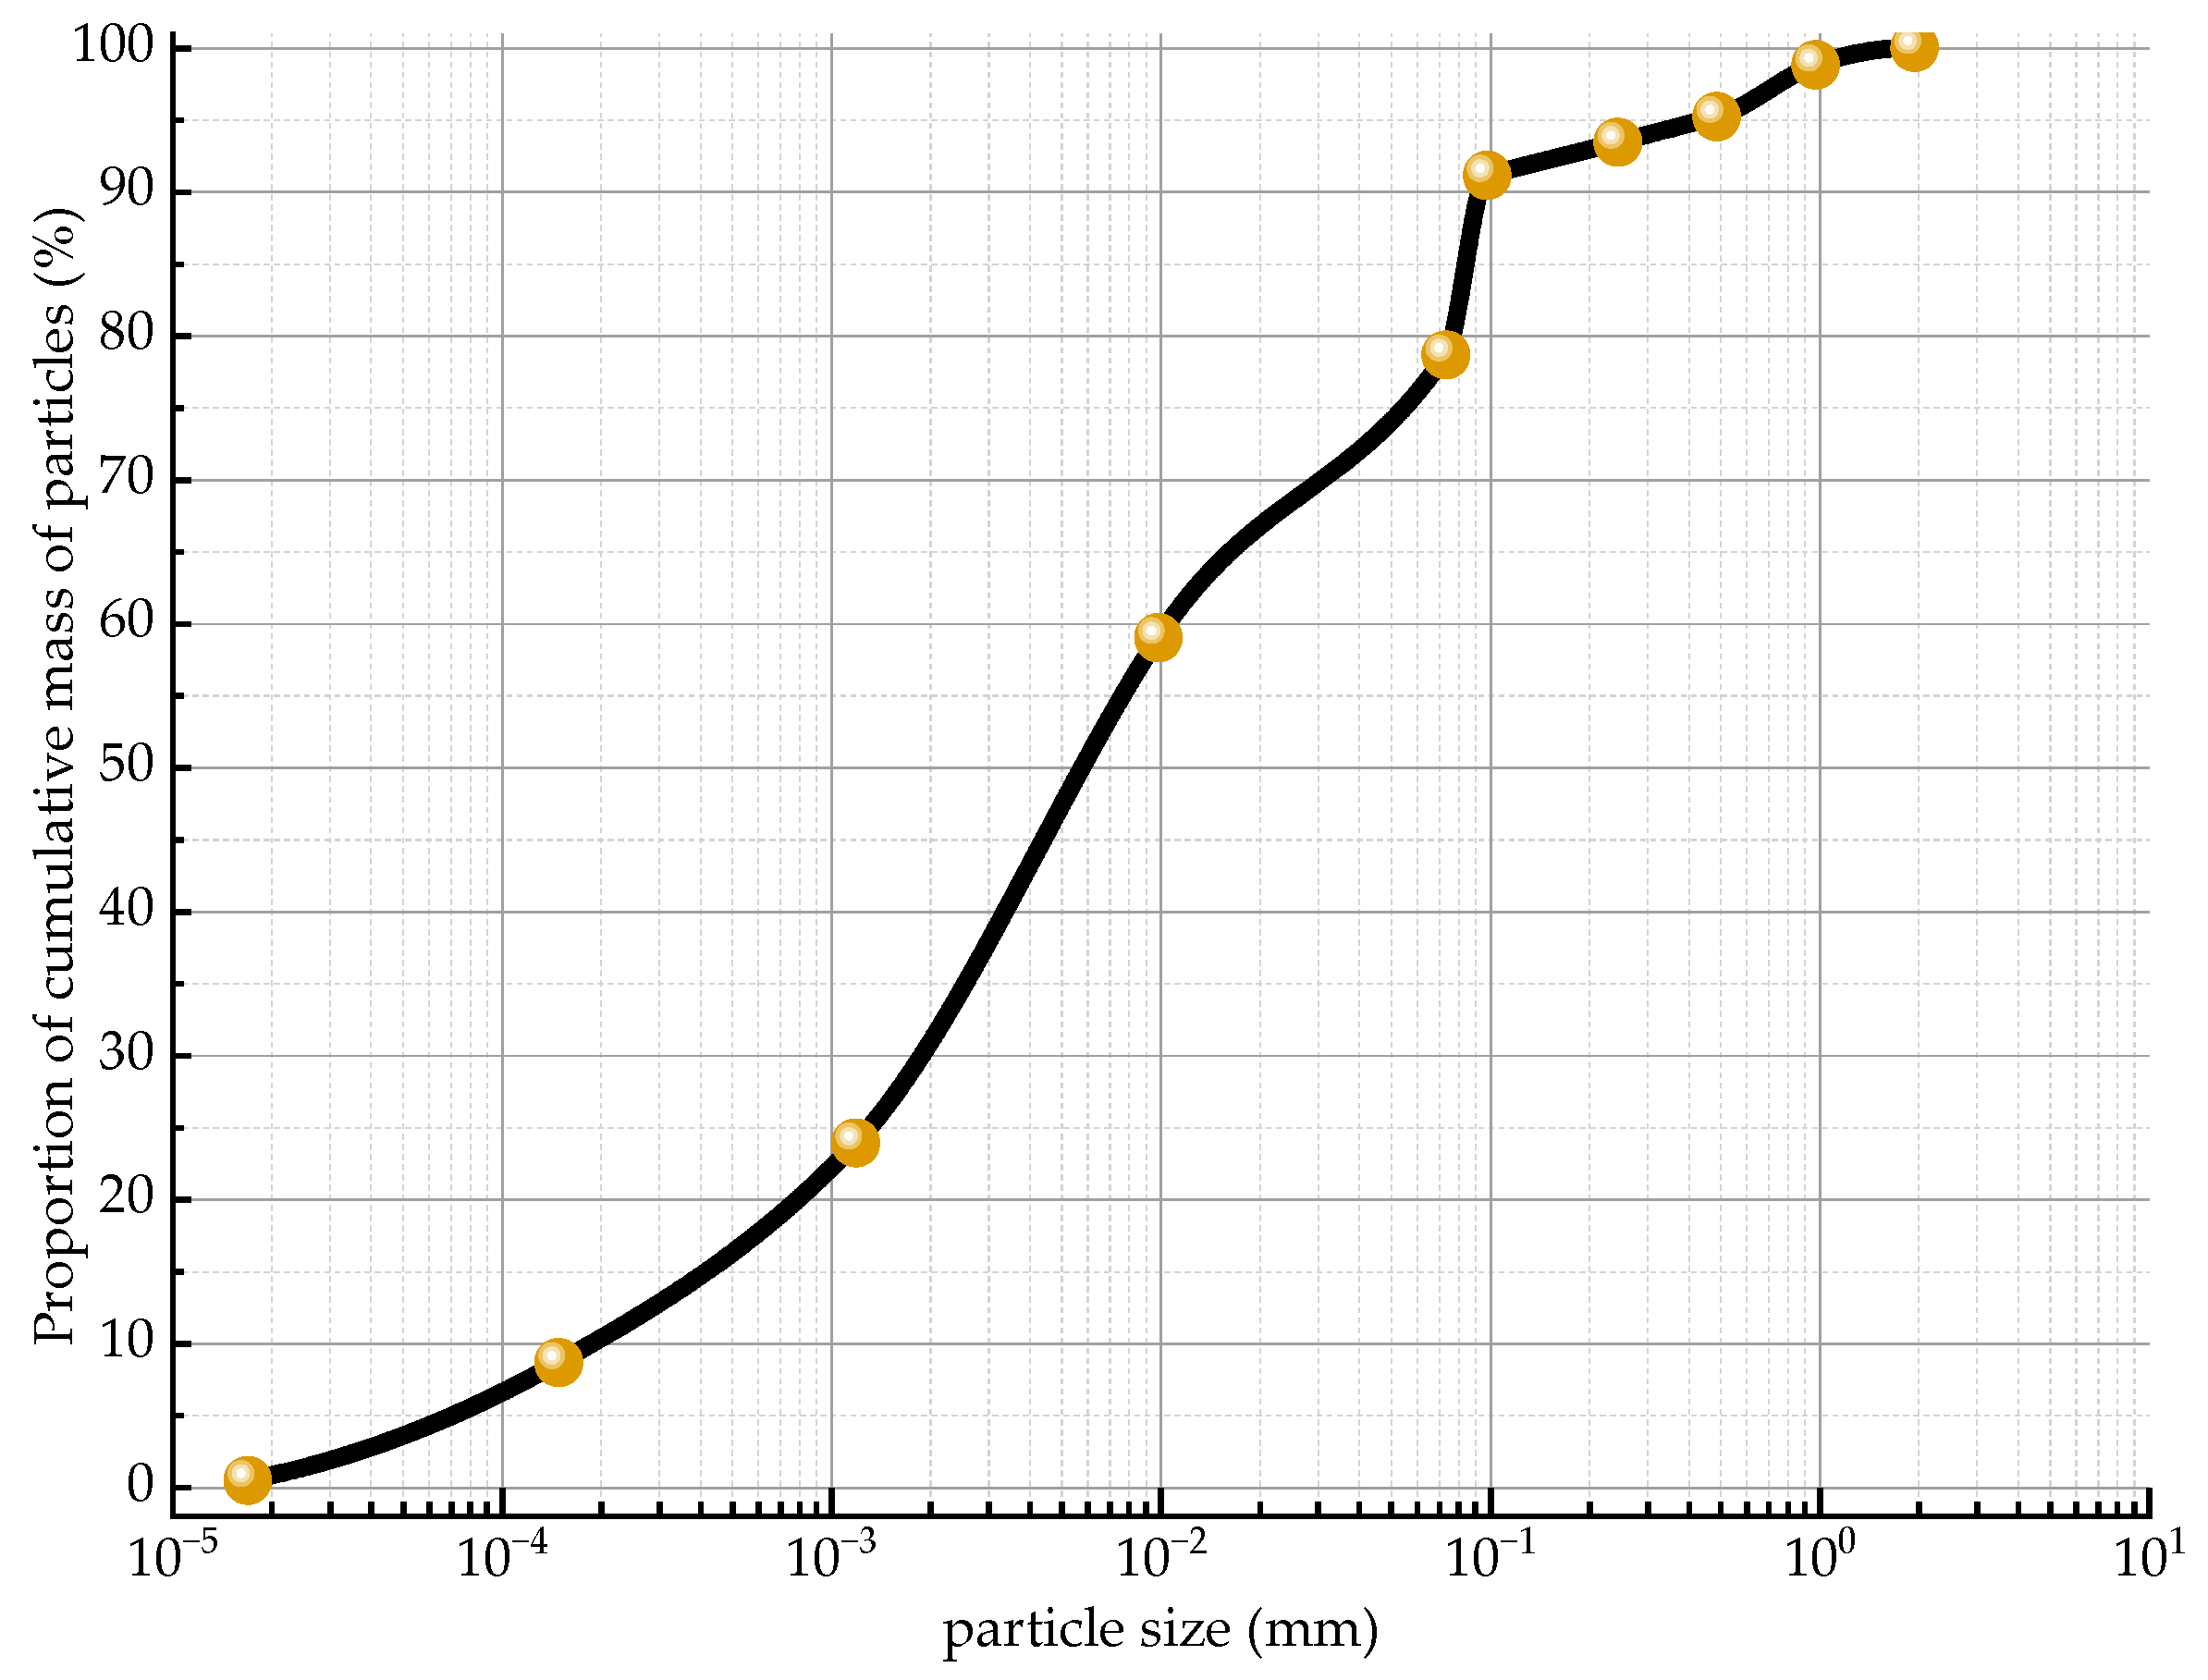
2.1. Materials

The experimental soil was sampled from a red clay subgrade of a highway in Gansu Province, China, at a depth of approximately 3 m. The onsite soil sample displayed a yellow-brown color, was in a hard plastic state, and had a uniform texture, a dense structure, a high natural moisture content, and significant cohesiveness, aligning with the typical features of red clay. Using XRD X-ray diffraction, the mineral content of the red clay was identified, primarily including quartz (24.2%), calcite (21.1%), illite (19.2%), kaolinite (7.8%), montmorillonite (5.3%), potassium feldspar (14.5%), hematite (1.4%), and other minerals (7.5%). The liquid and plastic limits, optimum water content, and maximum dry density of the red clay were ascertained using a combined liquid–plastic limit determiner and wet heavy compaction. The specific indicators are presented in Table 1.
Based on the particle grading test method outlined in the “Standard for Geotechnical Test Methods” (GB/T 50123-2019) [23], the gradation curve of the red clay for this research was established. As shown in Figure 1, the fine particles of the red clay are mainly concentrated in the range of 0.0001 mm to 0.1 mm, and the proportion of particles smaller than 0.075 mm reaches 78.6%, indicating that the red clay has strong water sensitivity.

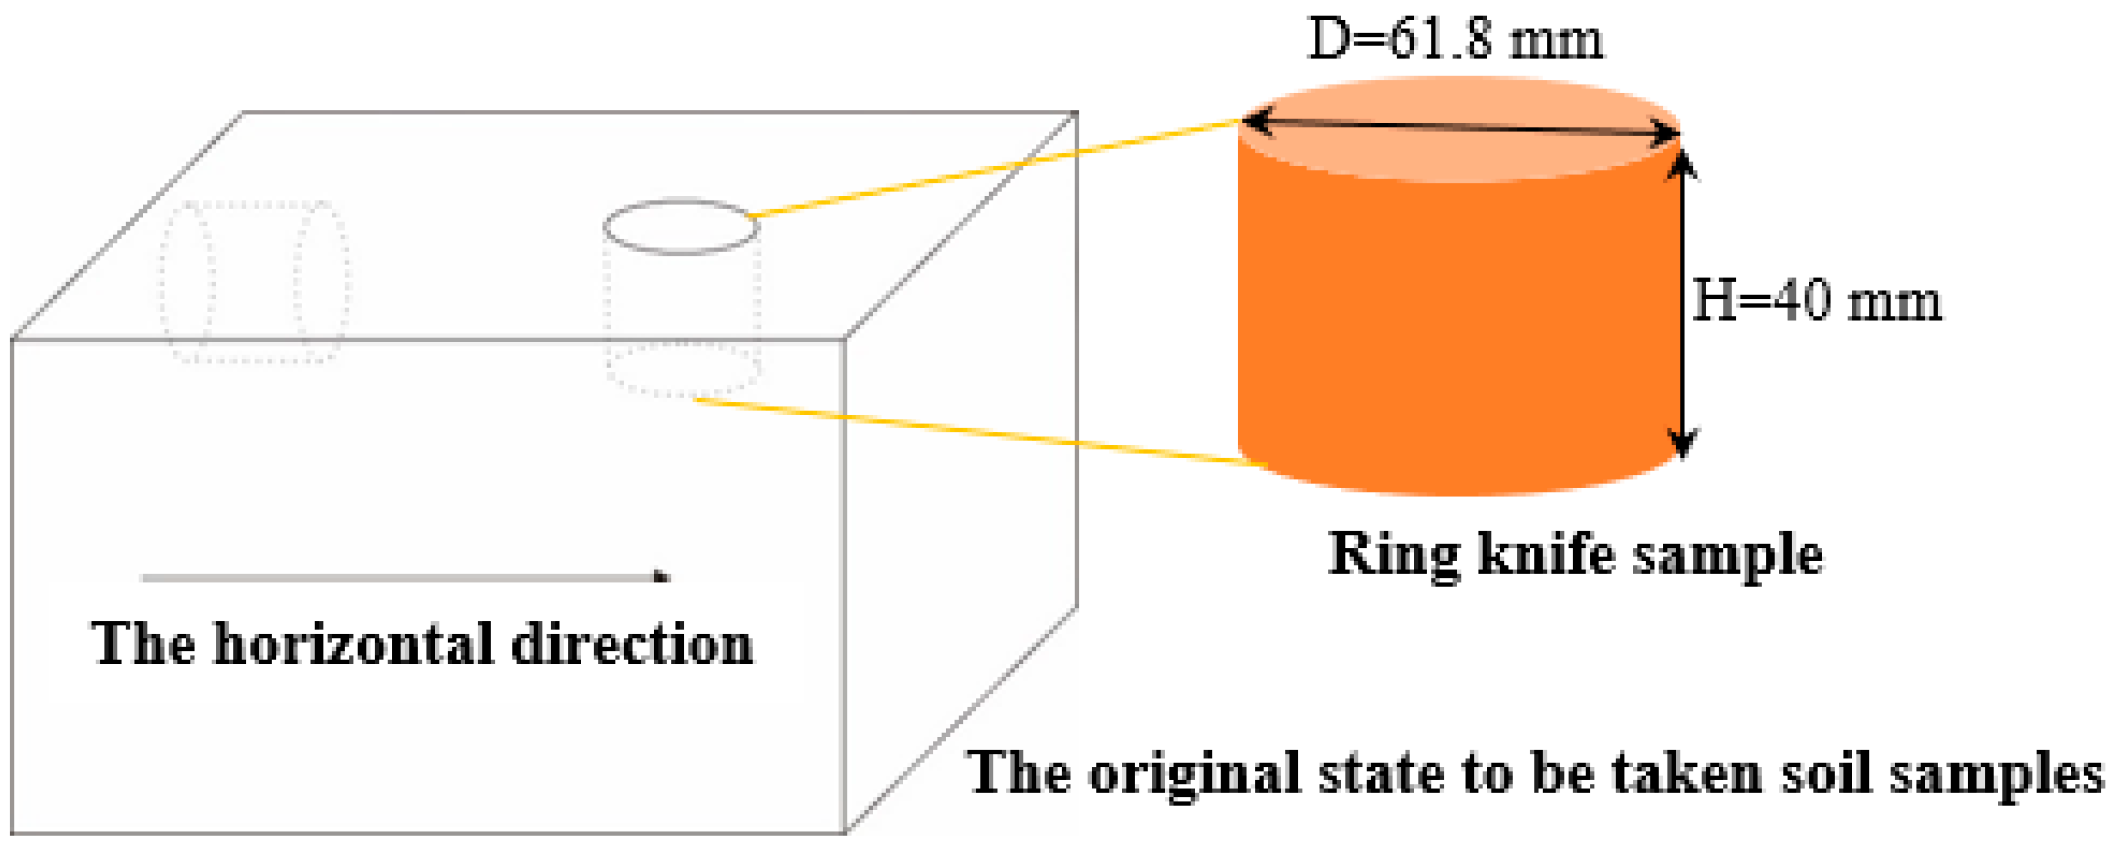
2.2. Simple Preparation

The specific sampling steps are as follows: At the same depth, two undisturbed samples are taken vertically and horizontally using a ring cutter, as shown in Figure 2. During the sampling process, Vaseline is applied to the side walls of the ring cutter to prevent the formation of preferential stress channels between the inner wall of the ring cutter and the soil sample. The ring cutter used in the experiment has a diameter of 61.8 mm and a height of 40 mm.

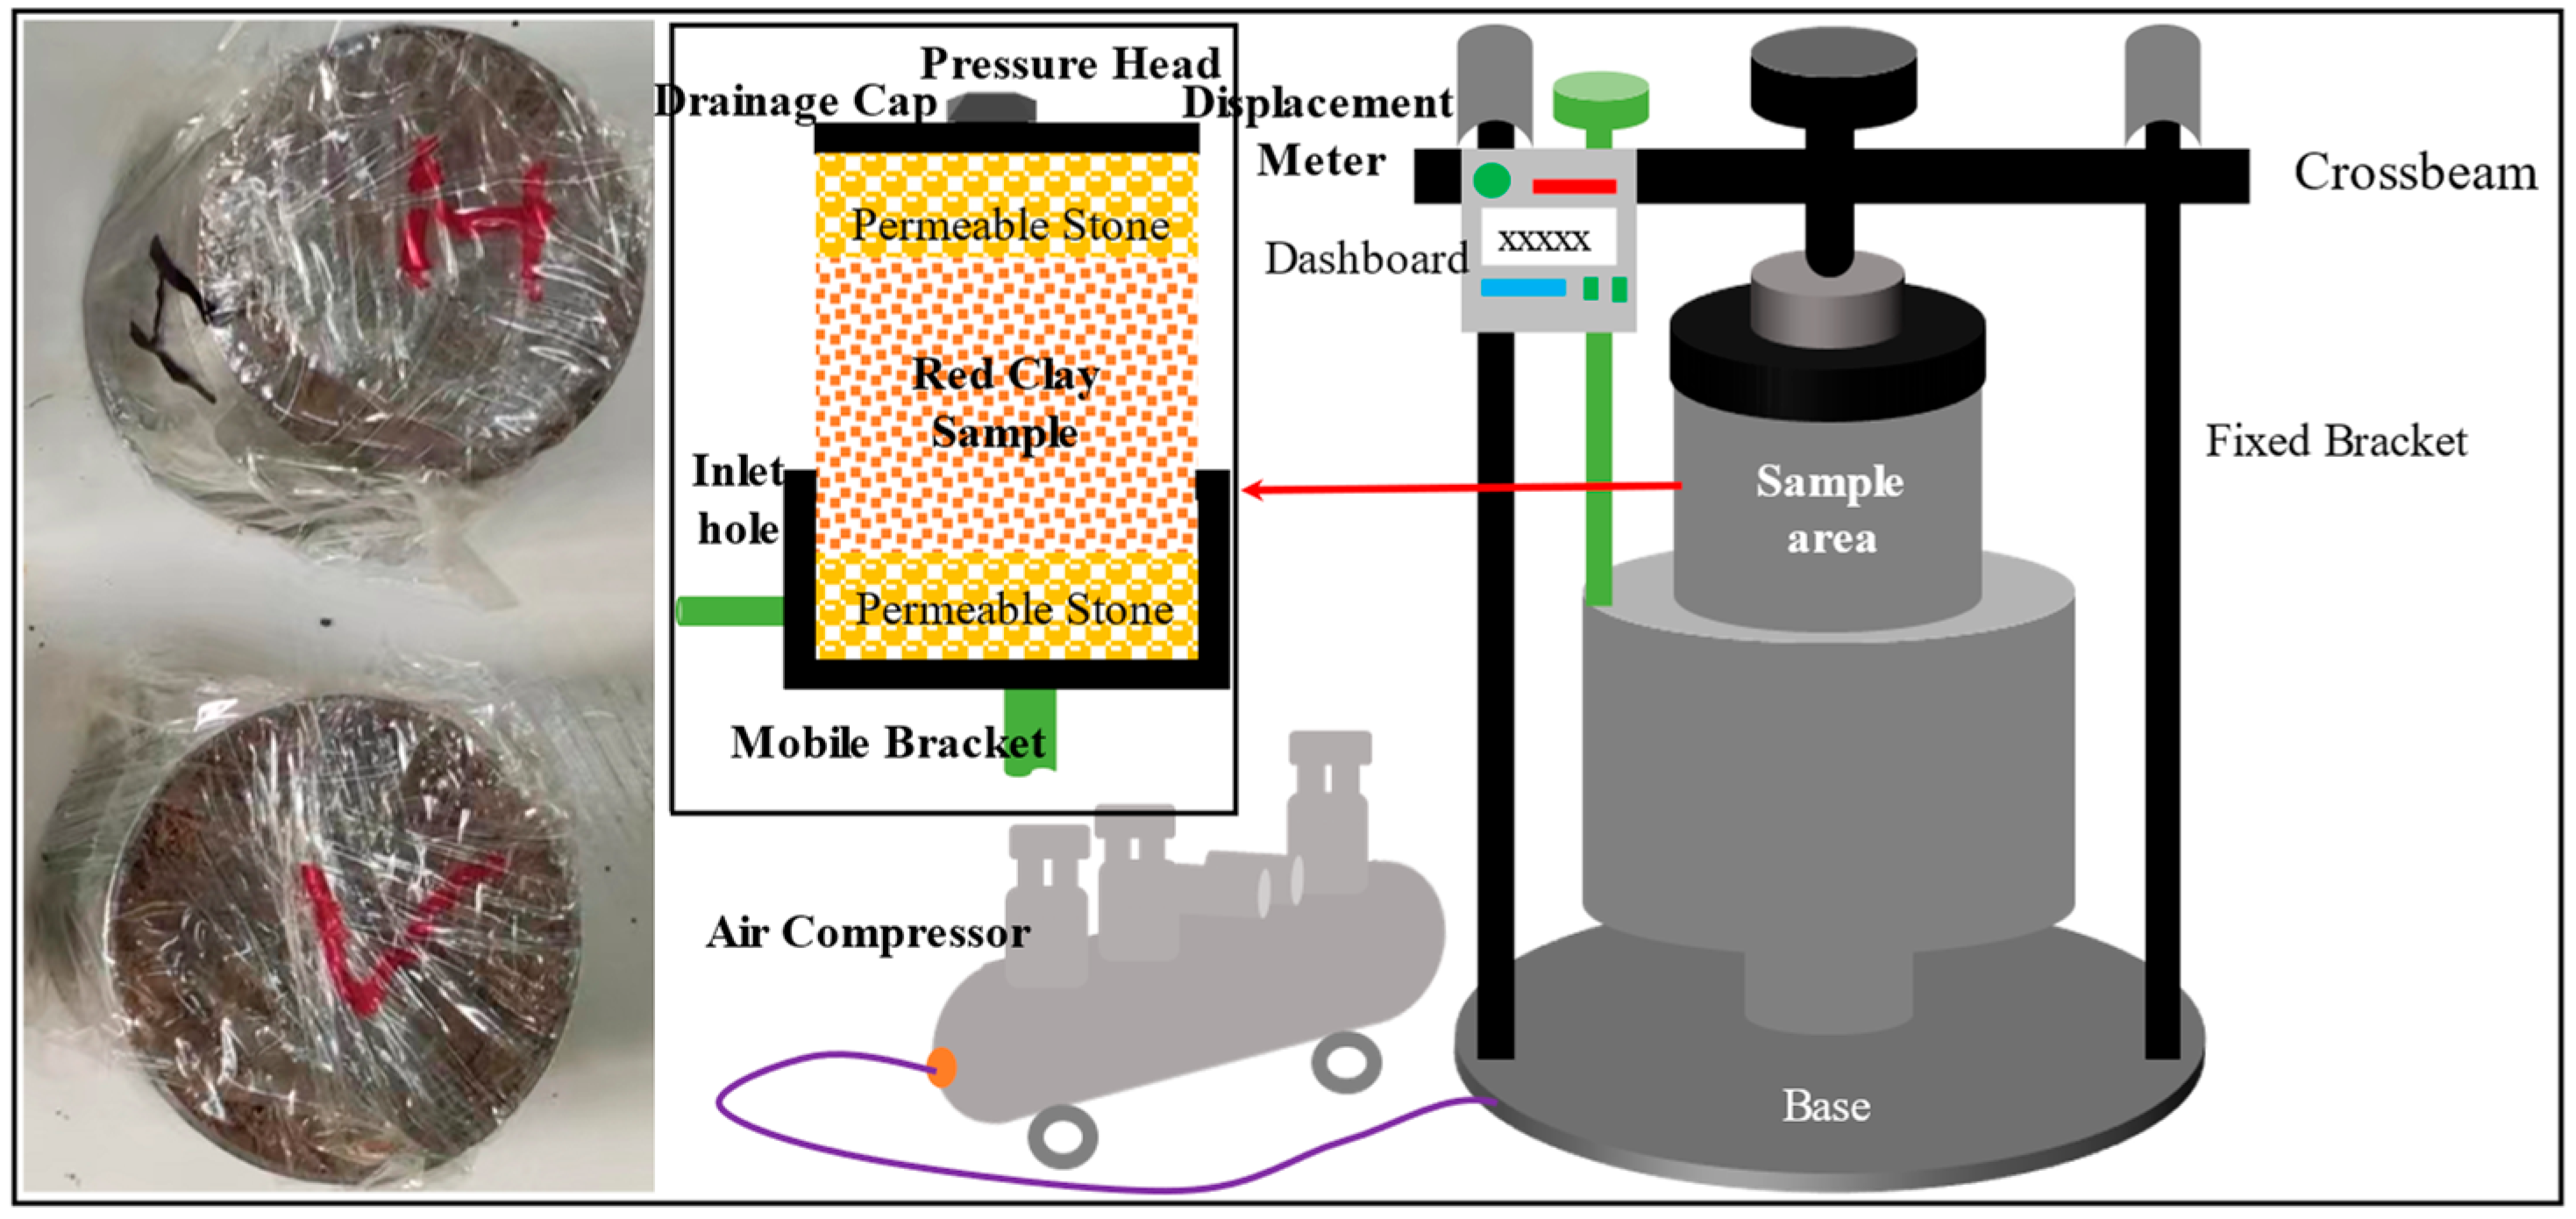
2.3. Experimental Method

At present, the indoor measurement of the permeability coefficient k utilizes diverse instruments and methodologies, predominantly the constant head and variable head methods. The constant head method is typically suitable for sandy soils and non-cohesive soils that contain little to no gravel. In the case of clay, given its low permeability coefficient and the scant water flow through the sample, its k-value is challenging to measure directly and accurately, thus the variable head method is commonly employed. The variable head test’s benefit lies in its ability to minimize reading errors due to evaporation and temperature, and as the water head difference changes over time during the test, it enables more accurate measurement of the permeability coefficient for low-permeability materials. For these reasons, this experiment employs the variable head method, depicted in Figure 3, to conduct stress experiments on undisturbed red clay with the TT-APP2C type dual variable head automatic permeameter from Suzhou Toptesting Instruments Co., Ltd in Suzhou, China. This device comes equipped with an automatic data collection system, capable of instantaneously reading water head heights and automatically calculating the permeability coefficient using built-in software and Formula (1).
k = 2.31 L A 1 A 2 ( t 2 t 1 ) lg h 1 h 2
Herein, L represents the length of the permeation path; A1 is the cross-sectional area of the water column; A2 is the cross-sectional area of the sample; t1 and t2 are the start and end time of the measuring head respectively; and h1 and h2 are the water head heights at different times [24]. And k represents the permeability coefficient, with kV and kH respectively denoting the vertical and horizontal permeability coefficients in this study.
The specific test steps are as follows:
(1)
Following the standard for geotechnical testing methods, samples are saturated via the vacuum saturation technique, which includes applying a vacuum for one hour and subsequently saturating for 10 h after the saturator is fully immersed in water;
(2)
Once the sample’s vacuum saturation is finished, it is taken out of the saturator and placed on the permeameter for permeability testing under various overlying load conditions (i.e., 25 kPa, 50 kPa, 100 kPa, 150 kPa, 200 kPa, 250 kPa, 300 kPa, 350 kPa) using boiled, degassed tap water for the experiment. Four loading levels (50 kPa, 100 kPa, 200 kPa, 300 kPa) are chosen, and under these four load conditions, the permeation pressure is incrementally increased to investigate its impact on the permeability coefficient at different overlying loads. The initial hydraulic gradient (i0) is 1.25;
(3)
Correct operation of experimental apparatus, detailed recording of test results, and in-depth analysis of test results.

3. Results and Discussion

3.1. The Influence of Overlying Load on Stress Paths

As depicted in Figure 4, the permeability coefficients of red clay in both directions decrease with increasing overlying load, with a faster decrease in vertical permeability. At any given overlying load, the vertical permeability exceeds the horizontal; furthermore, with increasing load, the curves of both directions tend to converge. This demonstrates the anisotropic nature of water permeation in red clay, with both horizontal and vertical permeability coefficients showing a linear negative correlation with overlying load on a semi-log scale, though vertical permeation is more sensitive to changes in load. That is, red clay has higher permeability in the vertical direction, which may be related to the development of vertical pores within the structure of the red clay itself, and the effect of stress effects also has a certain influence on the direction of water stress.
In order to assess the effect of consolidation stress on the anisotropic stress of undisturbed red clay, the ratio of permeability coefficients (kV/kH) is utilized as a metric. As shown in Figure 5, taking the covering layer load of 150 Kpa as the characteristic boundary point, the variation of kV/kH values forms a two-stage development characteristic. When the overburden load is 25 kPa, the maximum value of kV/kH is 2.78. With the gradual increase of the overburden load, the value of kV/kH initially decreases linearly in a steep manner. After the overburden load exceeds 150 kPa, the rate of decrease gradually slows down and eventually stabilizes at about 1.77. And when the covering layer load is 150 kPa, the value of kV/kH reaches the maximum of 1.92 in the second stage. This indicates that at lower overburden loads, the permeability of red clay primarily depends on the effects of stress effects and the characteristics of voids; when the overburden load is in a lower range, the developed vertical void structure within the red clay enhances the strength of water flow under the influence of stress effects. When the overburden load is large, the pore structure within the red clay is destroyed, the soil structure becomes denser, the porosity greatly reduces, and the effect of stress effects is no longer significant, at this time, the flow rate of water in both horizontal and vertical directions tends to be consistent, thereby showing a more stable permeability coefficient ratio.

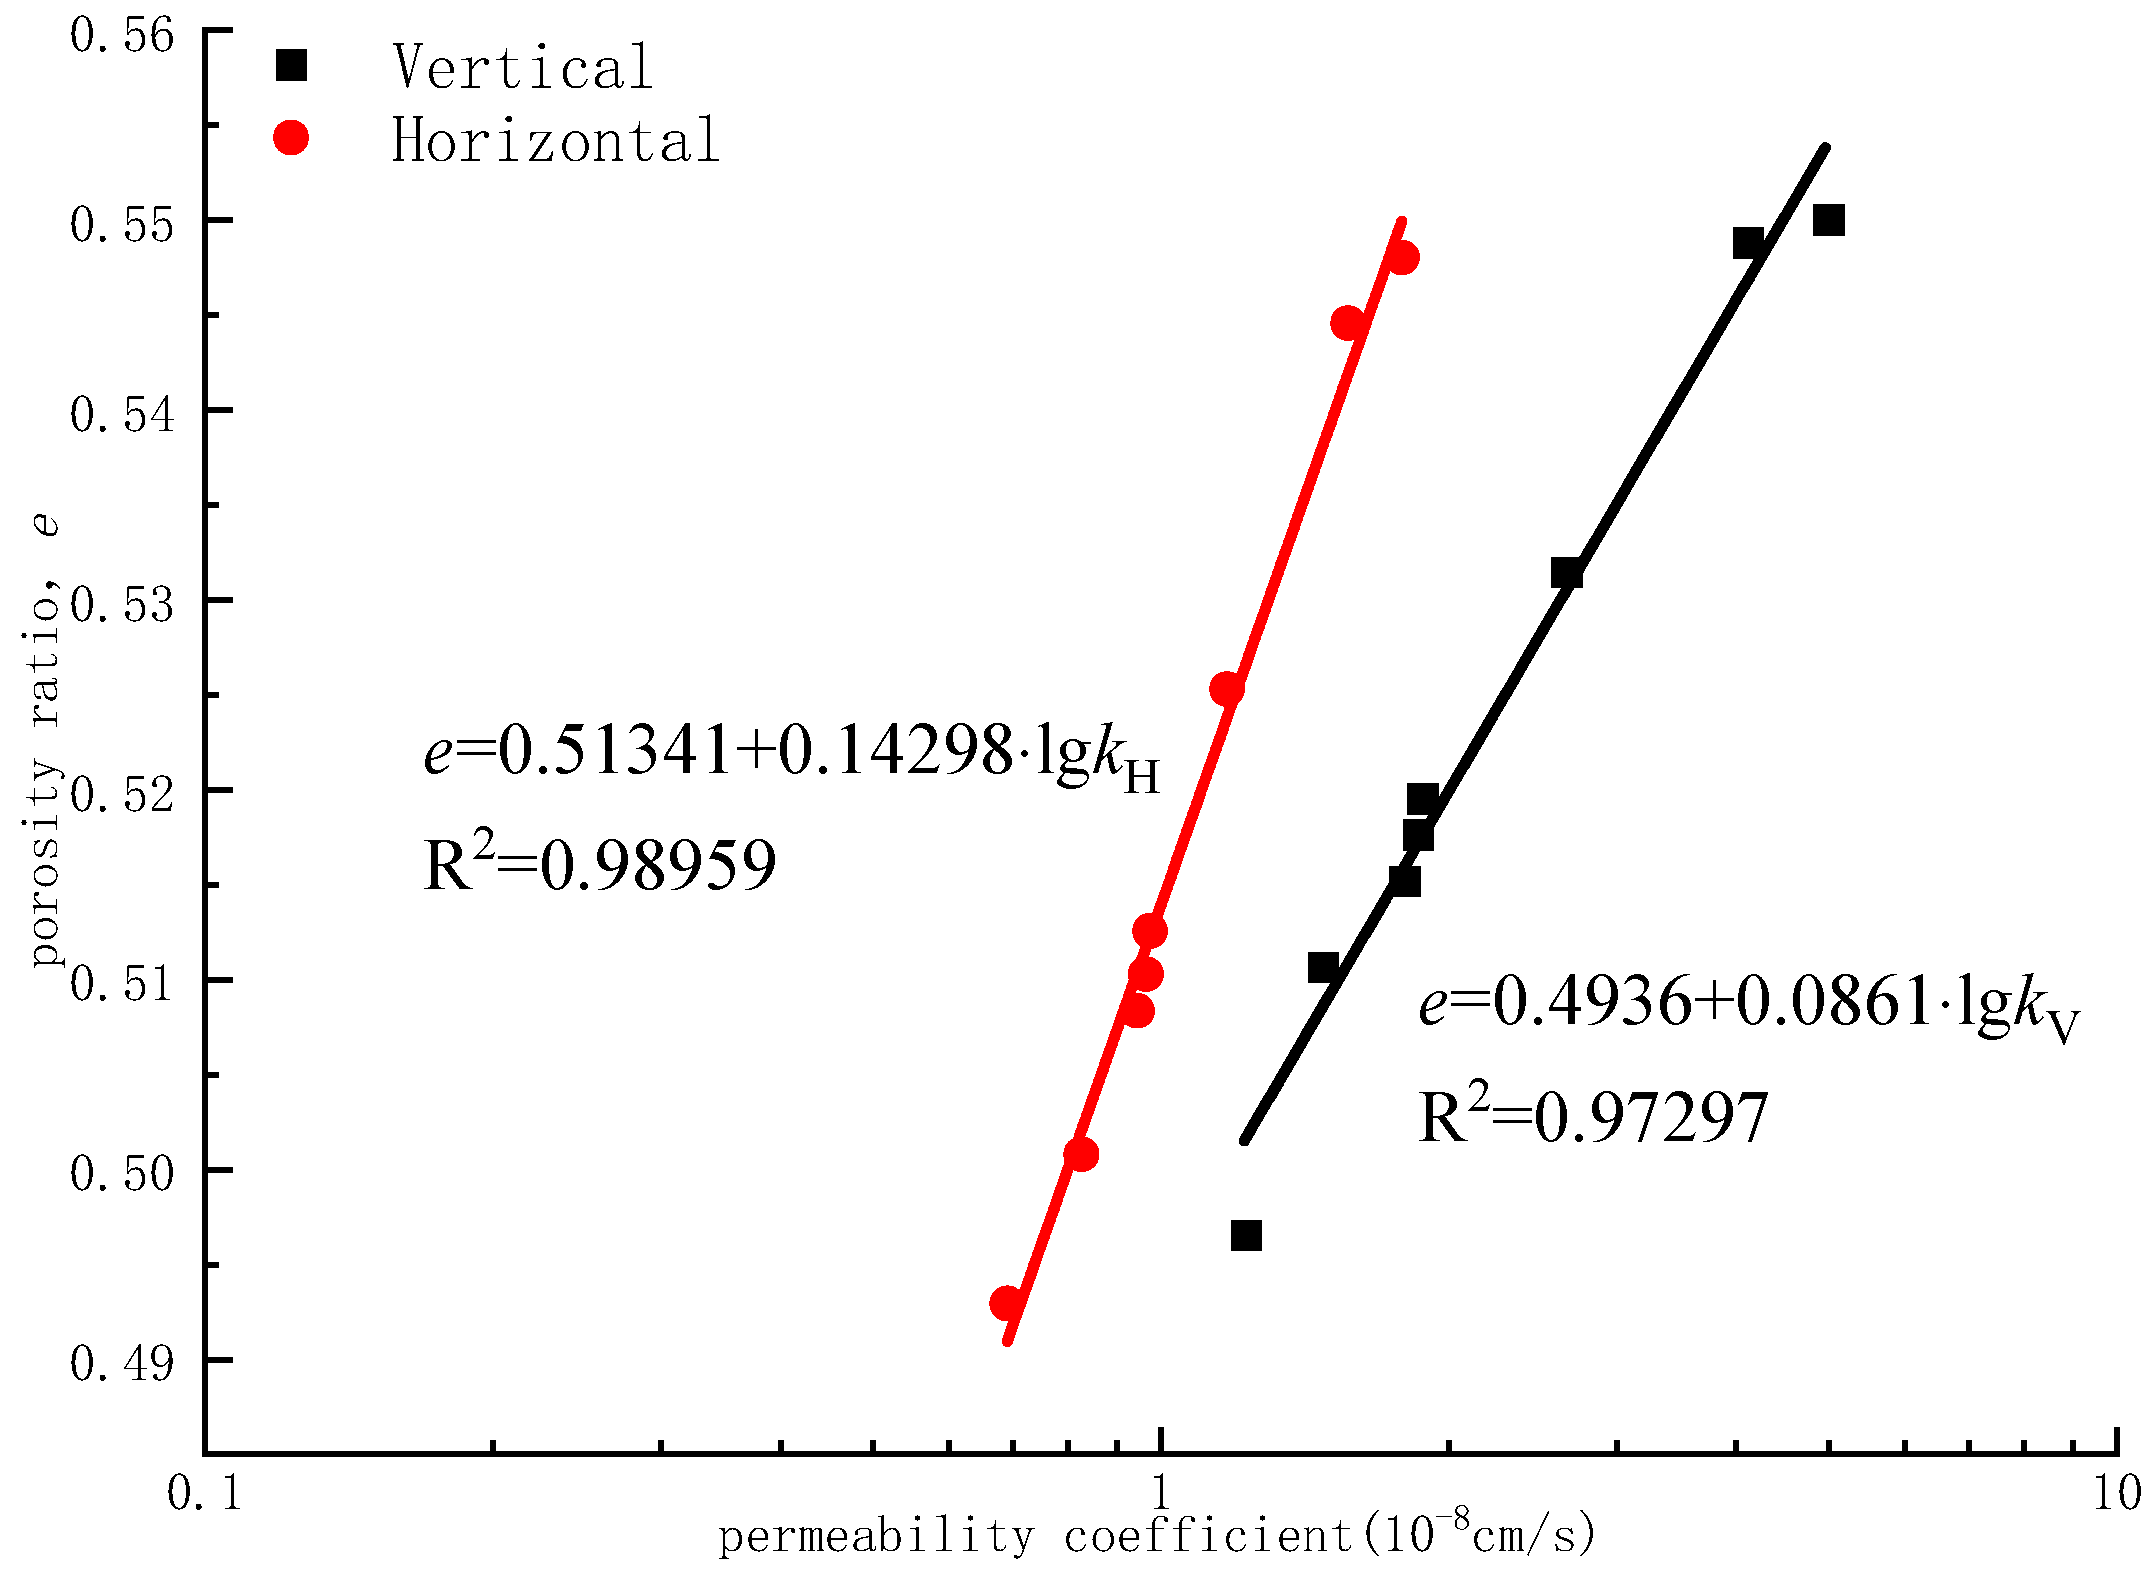
3.2. The Correlation between Permeability Coefficient and Porosity

The previous analysis has shown that under the dual influence of overburden load and stress effects, the development and distribution of void structures are significantly reshaped, thereby markedly affecting the intensity of water stress within the soil. To clarify the correlation between permeation characteristics and void development, permeability coefficients and porosity ratios at respective stages were calculated based on permeation tests under different overburden loads, and their relationship curves were constructed, as shown in Figure 6.
As can be seen from Figure 6, there is a very strong correlation between the permeability coefficient and the porosity ratio. Specifically, the correlation between the porosity ratio and the horizontal permeability coefficient reaches 0.99, and with the vertical permeability coefficient, it reaches 0.97. This further proves that the degree of development of void structures within the soil has a key impact on the permeation characteristics in different directions of the soil. Moreover, based on regression analysis, it was found that the logarithmic values of both the horizontal and vertical permeability coefficients of red clay have a linear relationship with the porosity ratio within the soil. From the permeability coefficient in one direction, the degree of void development can be predicted, and thus, the permeation characteristics in another direction within the soil can be inferred.

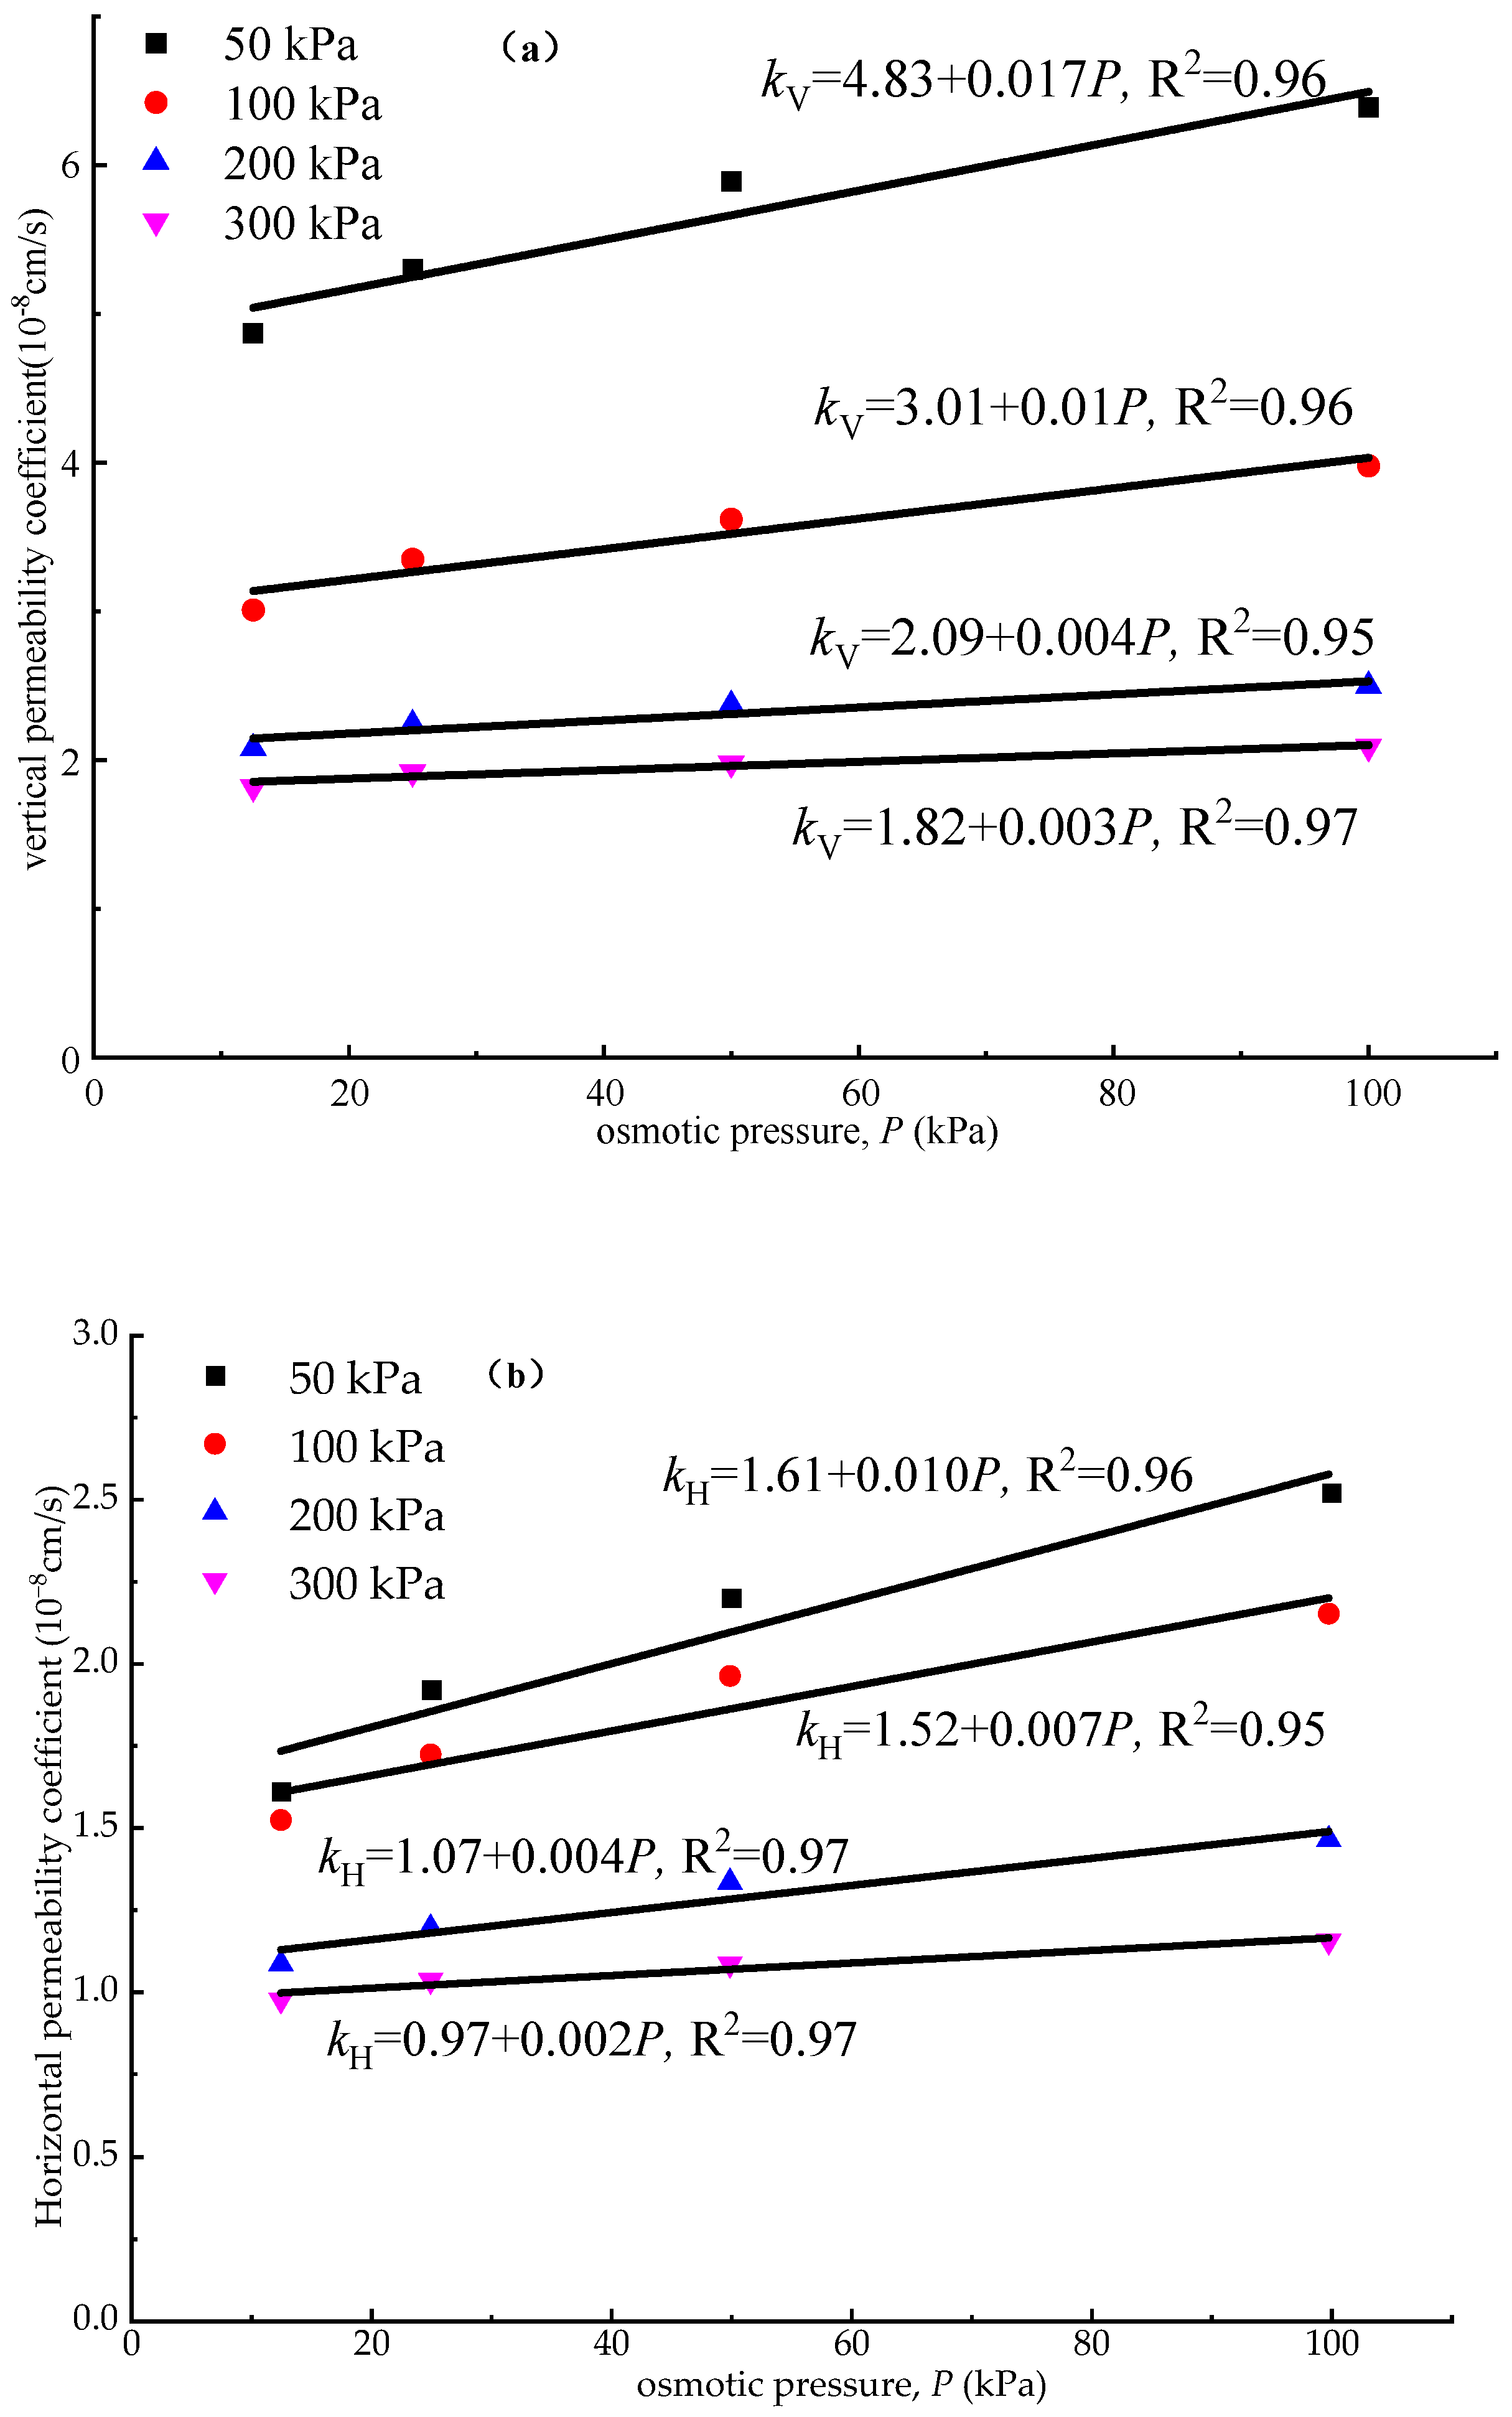
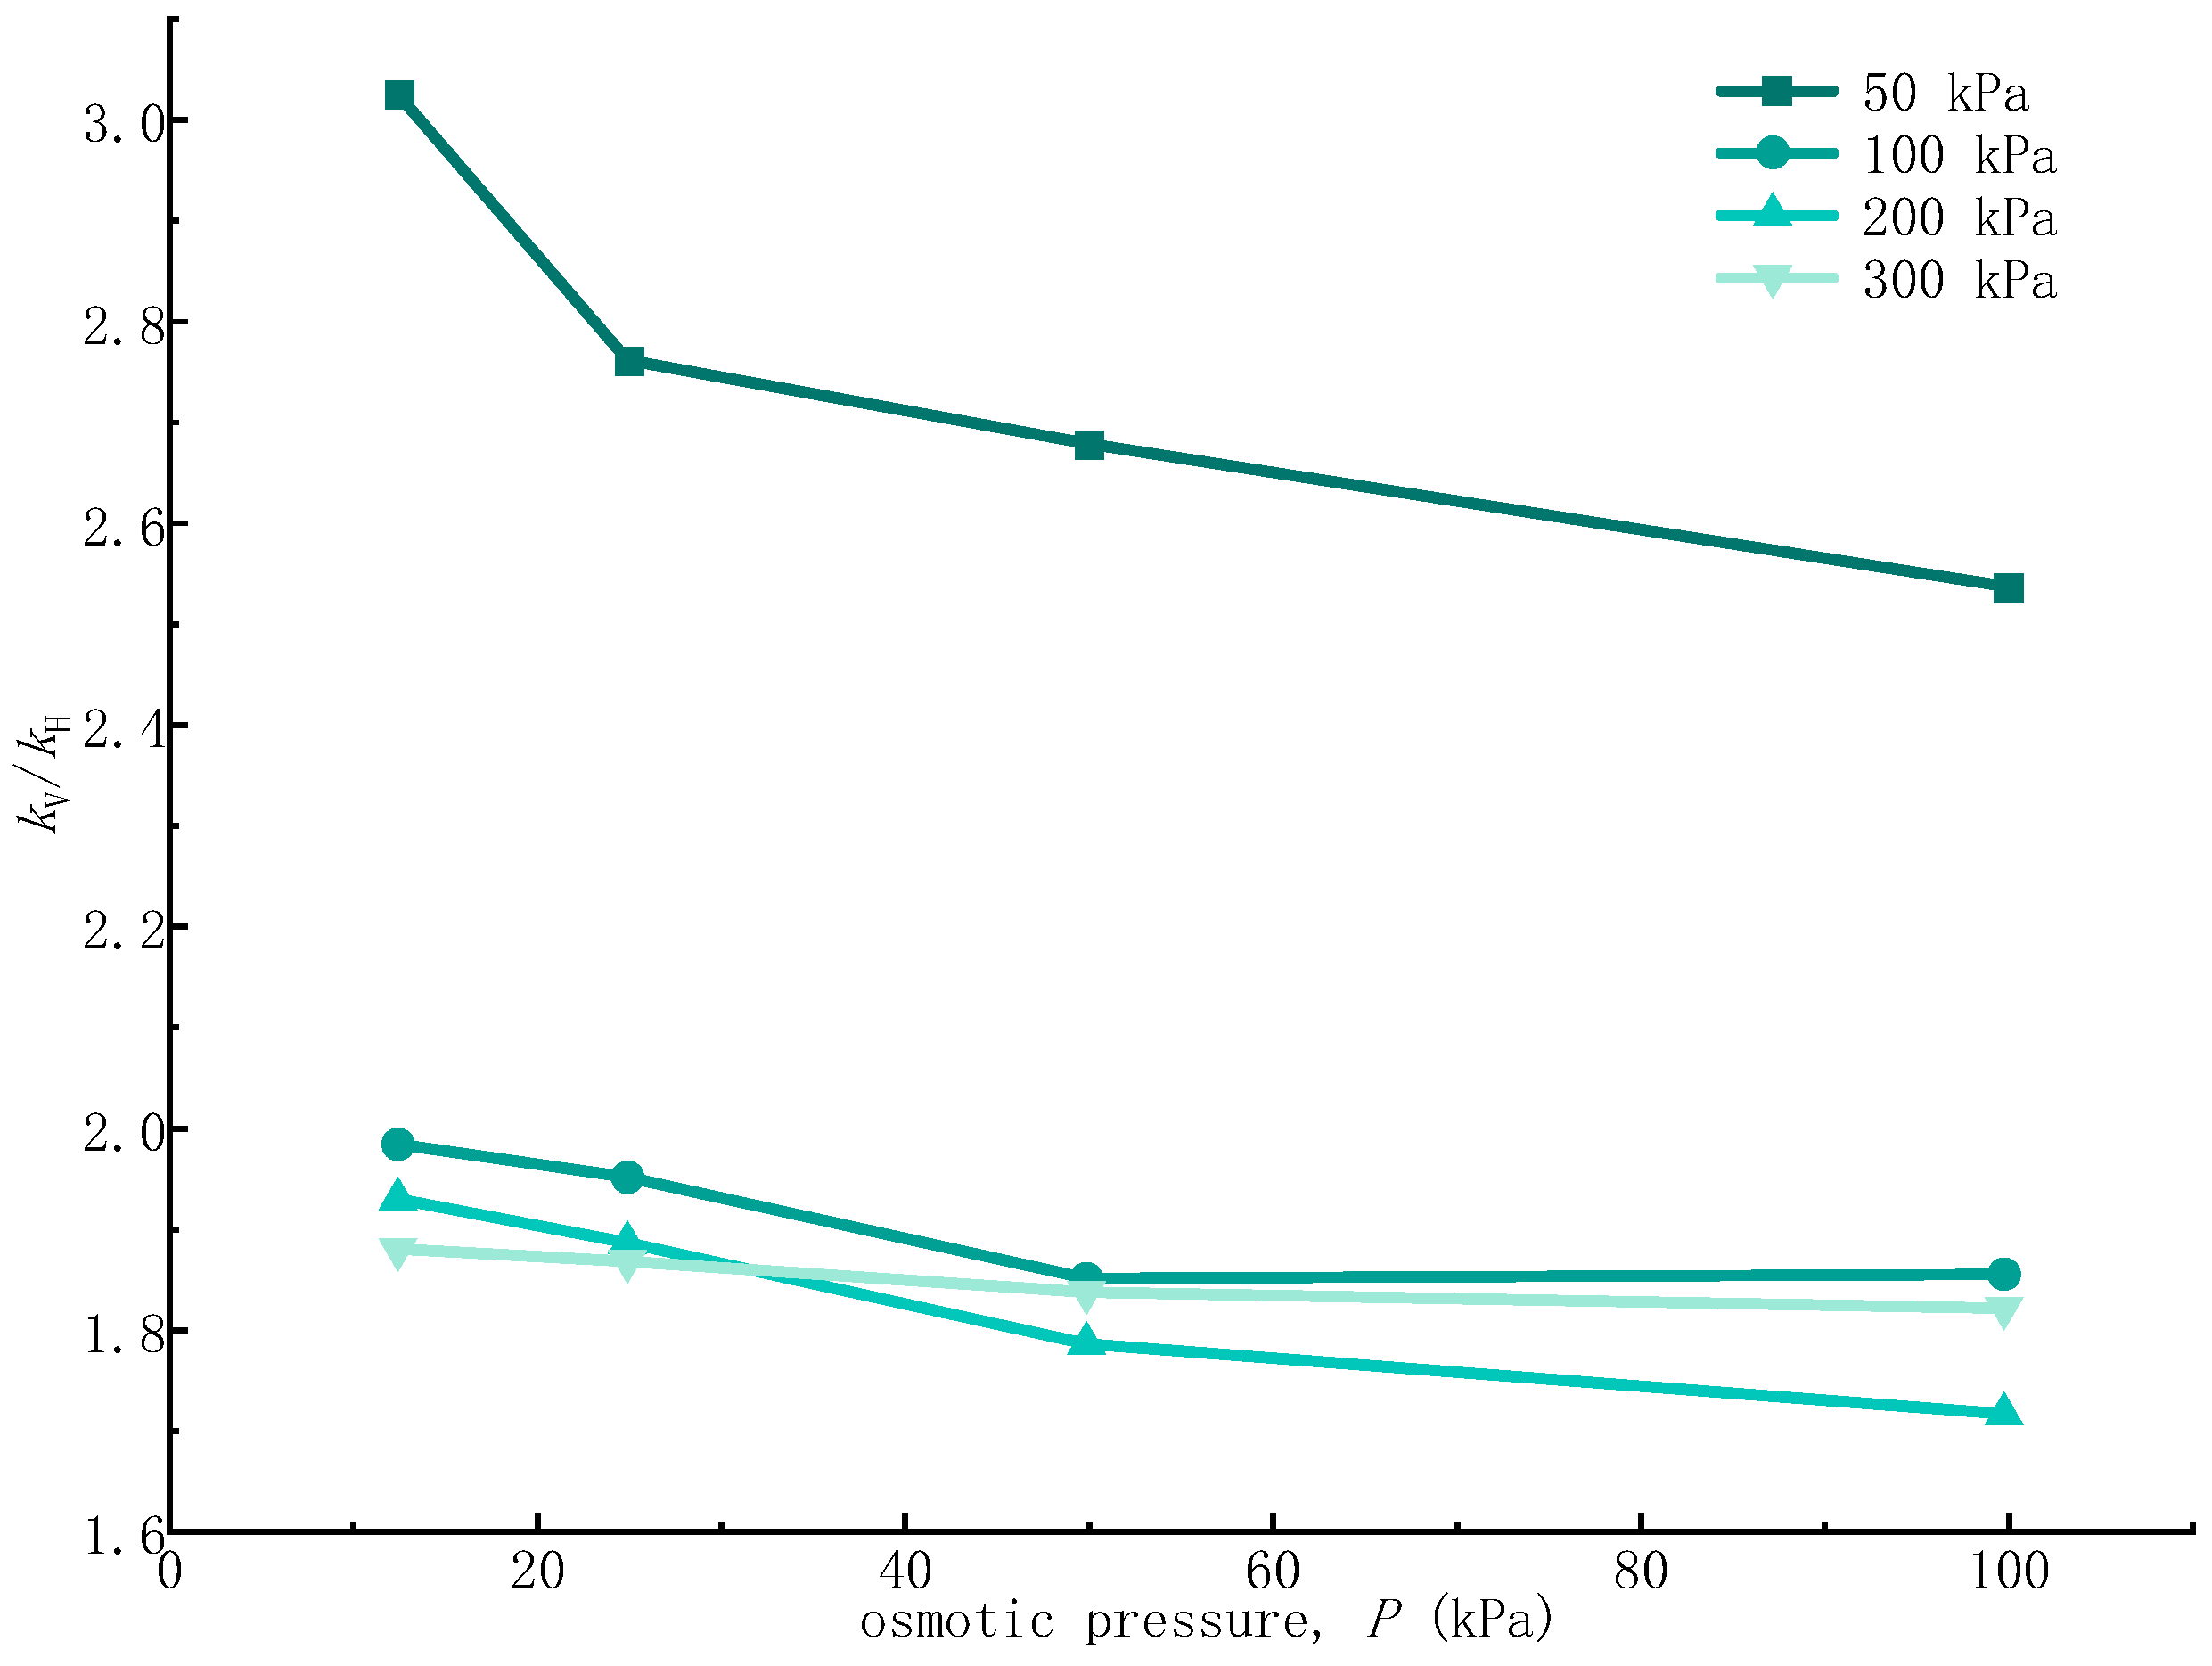
3.3. The Influence of Permeation Pressure on Stress Anisotropic

Figure 7 illustrates the variation curves of permeability coefficients in different directions relative to permeation pressure under assorted overburden loads. It is observable that under consistent overlying load, the permeability coefficients for both directions incrementally increase with rising permeation pressure, demonstrating a strong correlation between permeability coefficient and permeation pressure. Moreover, when the overburden load is low, the slopes of the curves are steep. As the overburden load increases, the slopes of the curves gradually become stable, indicating that the impact of permeation pressure on the red clay’s permeability coefficient is most intense under low-level overburden load conditions, and the increase in overburden load gradually suppresses this effect. On the other hand, it can be seen that overall, under the same overburden load condition, the slope of the kV-P curve is steeper than that of the kH-P curve, indicating that the vertical permeability coefficient is more sensitive to permeation pressure. This also indirectly reflects that the vertical fractures in the native structure of the red clay in this study are more developed. With the gradual increase in permeation pressure, internal flow pathways in the red clay widen, potentially leading to the creation of secondary fractures, further intensifying the soil’s inherent stress field.
Figure 8 illustrates the change in the permeability coefficient ratio kV/kH in different directions as a function of permeation pressure P under different overlying load levels. The figure indicates that with increasing permeation pressure, the permeability coefficient ratio kV/kH decreases sequentially under each level of overlying load. Notably, the decrease in kV/kH is most pronounced under an overlying load of 50 kPa. Once the overburden load exceeds 50 kPa, the value of kV/kH only changes within a small range; in particular, when P = 300 kPa, kV/kH stabilizes at almost 1.7.
It is worth noting that although the permeation pressure increased the stress strength of the red clay itself, it also led to further expansion of fractures, and might even cause originally independent pores to connect, thereby weakening the anisotropy of its stress.
Additionally, it was found that when the osmotic pressure exceeded 50 kPa, the permeability coefficient ratio reversed under overburden loads of 200 and 300 kPa, which further proves that osmotic pressure and overburden load simultaneously have a dynamic interaction effect on stress anisotropy. Under continuously increasing osmotic pressure, although the bias flow effect inside the soil was reduced, weakening the stress anisotropy, the permeability coefficient ratio under the two loads gradually tended to be consistent. However, different overburden loads simultaneously have a reshaping effect on the internal structure of the soil. Larger overburden loads make the soil more compact, gradually reducing the interconnected pores inside, decreasing the intensity of stress, and eventually causing certain differentiated characteristics in stress properties under the two load.

4. Conclusions

This study, based on indoor variable head permeability tests, obtained the permeability coefficients of undisturbed red clay in both vertical and horizontal directions under different vertical loads. The study deeply discussed the variation rules of permeability coefficients in different directions within the soil body under load, clarified the anisotropy of permeation characteristics in red clay, statistically analyzed the relationship between permeability coefficients and porosity ratio, and constructed a predictive model for permeability coefficients based on regression fitting.
(1)
The stress within undisturbed red clay exhibits obvious anisotropy, and the clay cannot be considered an isotropic homogeneous body. Under the dual effects of different overburden loads, the vertical permeability coefficient kV is always greater than the horizontal permeability coefficient kH, and the permeability coefficients k in both directions are negatively correlated with lgσ.
(2)
With the gradual increase of overburden load, the permeability coefficient ratio kV/kH shows a decreasing trend. When the overburden load does not exceed 150 kPa, the value of kV/kH decreases linearly. However, after the overburden load exceeds 150 kPa, the rate of decrease gradually slows and eventually stabilizes, approximately at 1.77. The porosity ratio e has a linear relationship with lgkV and lgkH, based on which a predictive formula for the anisotropy of permeability coefficients in undisturbed red clay was established.
(3)
Permeation pressure can expand the internal stress channels of red clay, increasing its permeability coefficient, and the vertical permeability coefficient is more sensitive to permeation pressure; moreover, permeation pressure can weaken the anisotropy of seepage in red clay to a certain extent.
(4)
The anisotropy of stress depends on the anisotropy of pores and their connectivity; the inherent anisotropy of pores in red clay leads to the anisotropy of stress movement. However, based on the structural characteristics of the soil, the permeation characteristics of the soil in different directions are also sensitive to feedback from the external environment (such as permeation pressure) and load.
Based on the stress characteristics of red clay under different osmotic pressure and overburden load conditions, this study provides a detailed discussion, clarifying the evolution laws of the anisotropy of stress in red clay under different stress and osmotic pressure conditions, and exploring the intrinsic mechanisms of stress anisotropy inside the soil. The research findings are of significant importance for determining the permeability strength and consolidation settlement laws of red clay. Of course, there are some shortcomings in this study, and in the future, we will use CT technology to further explore the evolution of the internal voids and structure of red clay under the action of different influencing factors from a fine viewpoint.

Author Contributions

D.C. was responsible for planning the experiments, directing the research project, and writing this paper. X.H. was responsible for some experiments and data sorting. C.W. was responsible for project administration, writing—review and editing. All authors have read and agreed to the published version of the manuscript.

Funding

The authors gratefully acknowledge the financial supports of the Planned Project of Gansu Science and Technology Department [grant No. 21JR7RA310] and the Youth Science Foundation of Lanzhou Jiaotong University [grant No. 2021029].

Institutional Review Board Statement

Not applicable.

Informed Consent Statement

Not applicable.

Data Availability Statement

Data are contained within the article.

Conflicts of Interest

Author Dongshan Chen was employed by the Gansu Shunda Road and Bridge Construction Co., Ltd. The remaining authors declare that the research was conducted in the absence of any commercial or financial relationships that could be construed as a potential conflict of interest.

References

  1. Yuan, Y. The Research on Anisotropic Seepage Characteristics and Stability of Red Clay Slope Containing Crack Zone. Master’s Thesis, Changsha University of Science & Technology, Changsha, China, 2023. [Google Scholar]
  2. Zhu, W. Study on Crack Development and Strength Deterioration Mechanism of Red Clay under Dry-Wet Cycle. Master Thesis, Guilin University of Technology, Guilin, China, 2023. [Google Scholar]
  3. Peng, C.; Hu, Z.; Wang, D.; Liu, X.; Mo, B.; Fu, Z. Research on mechanical properties and micro-mechanics of red clay under coupled acid-etching-freeze-thaw cycles. J. Railw. Sci. Eng. 2023, 20, 3738. [Google Scholar]
  4. He, H.; Zhang, J.; Wang, Y. Analysis of the effect of fissures on seepage stability of red clay slopes. J. China Foreign Highw. 2014, 34, 6. [Google Scholar]
  5. Feng, X.; Xie, Z.; Chen, C.; Teng, J.; Xu, G.; Wei, H.; Geng, C. Experimental and theoretical study on the water retention characteristics of compacted red clay considering the influence of double-pore structure. J. Railw. Sci. Eng. 2023, 1–11. [Google Scholar] [CrossRef]
  6. Li, X.; Dong, X.; Chen, Z.; Chen, S.; Sun, Y. Study on permeability of foundation soil of bridges on lower reaches of yangtze river. Chin. J. Rock Mech. Eng. 2005, 10, 1692–1696. [Google Scholar]
  7. Qiao, T.; Zhou, J.; Zhang, T.; Jiang, Y. Influence of anisotropic permeability on seepage flow in underwater tunnels. J. Ground Improv. 2024, 6, 8–15. [Google Scholar]
  8. Jiao, D.; Chen, Y. Anisotropy and volume-contraction of soil due to axial unloading in CD test. Chin. J. Geotech. Eng. 1994, 16, 9–16. [Google Scholar]
  9. Zhao, J. Anisotropic soil slope stability analysis under different rainfall patterns. Coal Geol. China 2018, 30, 70–74. [Google Scholar]
  10. Lü, J.; Ke, X.; Zhang, X.; Li, X.J. Variability of saturated permeability coefficient of loess slopes in South Jingyang tableland. Bull. Soil Water Conserv. 2017, 37, 254–257. [Google Scholar]
  11. Hong, B.; Li, X.; Wang, L.; Li, L. Permeability anisotropy and microstructure of yan’an Q3 loess. J. Jilin Univ. (Earth Sci. Ed.) 2019, 49, 1389–1397. [Google Scholar]
  12. Zeng, W.; Xiao, X. Stability analysis of soil slopes under anisotropic conditions of permeability coefficient. J. China Foreign Highw. 2017, 37, 10–14. [Google Scholar]
  13. Yuan, J.; Lin, Y.; Ding, P.; Han, C. Influence of anisotropy induced by fissures on rainfall infiltration of slopes. Chin. J. Geotech. Eng. 2016, 38, 76–82. [Google Scholar]
  14. Fang, C. Experimental Study on Inherent Anisotropy of Engineering Properties of Plateau Lacustrine Peat Soil. Master’s Thesis, Kunming University of Science and Technology, Kunming, China, 2020. [Google Scholar]
  15. Liu, Y. Research on the Anisotropic of Hangzhou Silt Soil by Laboratory Tests. Master Thesis, Zhejiang University of Technology, Hangzhou, China, 2011. [Google Scholar]
  16. Sun, Y. Compaction Loess Strength and Permeability Anisotropy of the Research. Master Thesis, Xi’an University of Architecture and Technology, Xi’an, China, 2016. [Google Scholar]
  17. Leroueil, S.; Bouclin, G.; Tavenas, F.; Bergeron, L.; Rochelle, P.L. Permeability anisotropy of natural clays as a function of strain. Can. Geotech. J. 1990, 27, 568–579. [Google Scholar] [CrossRef]
  18. Tsien, S.I. Stability of marsh deposits. Highway Research Board. Bulletin 1955, 15, 15–43. [Google Scholar]
  19. Zhang, Z.; Fu, X.; Sheng, Q.; Yin, D.; Zhou, Y.; Huang, J. Effect of rainfall pattern and crack on the stability of a red bed slope: A case study in Yunnan province. Adv. Civ. Eng. 2021, 2021, 6658211. [Google Scholar] [CrossRef]
  20. Clapp, R.B.; Hornberger, G.M. Empirical equations for some soil hydraulic properties. Water Resour. Res. 1978, 14, 601–604. [Google Scholar] [CrossRef]
  21. Wang, Y.; Li, K.; Li, J.; Tang, S. Influence of soil particle size on the engineering properties and microstructure of a red clay. Appl. Sci. 2021, 11, 10887. [Google Scholar] [CrossRef]
  22. Wang, J.; Bao, T.; Yang, W.; Zhou, Q.; Fu, H. Analysis of influence of moisture content-temperature dual factor on mechanical properties of red clay. J. China Foreign Highw. 2023, 43, 253–258. [Google Scholar]
  23. Ministry of Housing and Urban Rural Development of the People’s Republic of China. Standard for Soil Test Method (GB/T 50123-2019); China Planning Press: Beijing, China, 2019. [Google Scholar]
  24. Zhao, T.; Qiu, Z. Soil Mechanics Test Guide and Test Report; Southwest Jiaotong University Press: Chengdu, China, 2008. (In Chinese) [Google Scholar]
Figure 1. Grading curve of lateritic clay.
Applsci 14 05592 g001
Figure 2. Acquisition of undisturbed samples in different directions.
Applsci 14 05592 g002
Figure 3. Schematic diagram of dual variable head automatic osmometer.
Applsci 14 05592 g003
Figure 4. Change of permeability coefficient with overlying load.
Applsci 14 05592 g004
Figure 5. The relationship between permeability ratio and overlying load.
Applsci 14 05592 g005
Figure 6. Relationship between permeability coefficient and porosity ratio.
Applsci 14 05592 g006
Figure 7. Dynamic correlation between vertical and horizontal permeability coefficients and osmotic pressure (a,b).
Applsci 14 05592 g007
Figure 8. The change curve of permeability coefficient ratio and osmotic pressure.
Applsci 14 05592 g008
Table 1. Main physical indexes of lateritic clay.
Natural Moisture Content (%)Optimum Moisture Content (%)Maximum Dry Density (g/cm3)Specific Gravity GsLiquid Limit
ωL/%
Plastic Limit
ωP/%
Plasticity Index
IP
36.718.61.892.6557.825.931.9
Disclaimer/Publisher’s Note: The statements, opinions and data contained in all publications are solely those of the individual author(s) and contributor(s) and not of MDPI and/or the editor(s). MDPI and/or the editor(s) disclaim responsibility for any injury to people or property resulting from any ideas, methods, instructions or products referred to in the content.

