Article

Research on Fault Detection and Automatic Diagnosis Technology of Water Hammer in Centrifugal Pump

School of Mechanical and Power Engineering, Zhengzhou University, No. 100 Science Street, Zhengzhou 450001, China
*
Author to whom correspondence should be addressed.
Appl. Sci. 2024, 14(13), 5606; https://doi.org/10.3390/app14135606
Submission received: 25 May 2024 / Revised: 16 June 2024 / Accepted: 25 June 2024 / Published: 27 June 2024
(This article belongs to the Special Issue Fault Diagnosis and Detection of Machinery)

Abstract

:
Centrifugal pumps are important equipment in industrial production, and their safe and reliable operation is of great significance to water supply and industrial safety. During the use of centrifugal pumps, faults such as bearing damage, blade wear, shaft imbalance, shaft misalignment and water hammer often occur. Among them, although water hammer faults occur at a low frequency, they are difficult to monitor and pose significant risks to valve and pipeline interfaces. This article analyzes the causes, mechanisms and phenomena of water hammer faults in centrifugal pumps, designs a monitoring method to effectively monitor the vibration signal of the centrifugal pumps, extracts vibration characteristics to determine and record water hammer events, designs monitoring and diagnostic models for the edge layer and server side, and establishes an experimental verification testing system. The test results show that, under the conditions of simulating water hammer faults, after high-pass filtering of the collected vibration data, the kurtosis index, pulse index and margin index all exceed twice the threshold, and both sensors emit water hammer alarms. The designed data acquisition method can capture water hammer signals in a timely manner, and the analysis model can automatically identify water hammer faults based on existing fault knowledge and rules. This fully demonstrates the scientific and effective nature of the proposed centrifugal pump fault monitoring method and system, which is of great significance for ensuring the safe operation and improving the design of centrifugal pumps.

1. Introduction

Centrifugal pumps are widely used in industrial enterprises such as the electric power and chemical industry due to their simple structure, convenient operation and uniform flow. During the use of centrifugal pumps, fluid or mechanical failures often occur, causing abnormal vibration. In engineering applications, through vibration monitoring, the running state of the pump can be monitored, faults can be diagnosed, and maintenance suggestions and treatment measures can be given to ensure the safe operation of the pump [1,2]. Common failure forms of centrifugal pumps include bearing wear, blade failure, pump shaft imbalance, misalignment, water hammer, cavitation, dry rotation, etc. [3,4]. Among them, water hammer failure is sporadic and difficult to monitor. However, when a water hammer failure occurs, pressure in the pipeline rises sharply, causing serious accidents such as valve damage and pipeline bursts. Effective and accurate monitoring of water hammer failure is of great significance for ensuring equipment safety and improving pump and pipeline design.
In recent years, domestic and foreign scholars have conducted a series of studies on the water hammer phenomenon and fault diagnosis of centrifugal pumps. In the literature [5,6,7], the vibration characteristics of pipelines caused by the water hammer phenomenon was studied, and the impact of water hammer on various parts of pipelines was analyzed from the perspective of vibration. In the literature [8,9,10], the water hammer response during pump stop was analyzed and theoretically calculated, which provided a basis for the optimal design of a pump system in the hydraulic transition process; the corresponding measures to protect the pump system from water hammer in various occasions were also introduced. In the literature [11,12], the generation and propagation mechanism of the water hammer impact pressure wave were studied, and the influence of the water hammer wave speed on the system’s natural frequency and mode shape were analyzed. In the literature [13,14], the closing law curve was obtained based on Bayesian grid modeling technology, and the water hammer impact was effectively reduced. Although the above literature has made some progress in the analysis of water hammer mechanics and damage assessment, research on water hammer phenomena is still in the developmental stage. At present, there is still no effective means for the automatic capture and recognition of water hammer signals, and there are still some problems:
  • Methods for the online monitoring and diagnosis of water hammer faults are still limited in practical engineering applications.
  • Monitoring methods have lag. Traditional monitoring methods have lag and are difficult to respond to and address potential equipment damage and safety hazards in a timely manner.
  • Monitoring methods have low data processing efficiency and a strong dependence on manual intervention. Traditional monitoring methods have low efficiency in data collection and transmission, and the diagnostic process relies on manual labor, which affects time and accuracy, while increasing costs and manpower requirements.
As new technologies, edge computing and cloud computing bring new opportunities to monitor water hammer failures and diagnose centrifugal pumps. Through real-time data acquisition and processing, edge computing can quickly respond to water hammer failures and the centrifugal pump operation status. Cloud computing enables data storage and trend analysis, enabling intelligent and automated diagnosis. The collaborative work of cloud computing and edge computing not only improves diagnostic efficiency but also promotes the intelligent development of fault diagnosis.
The main contributions of this article can be summarized as follows:
  • A centrifugal pump water hammer monitoring method is proposed, which can effectively capture and record water hammer events, providing new ideas for practical engineering applications.
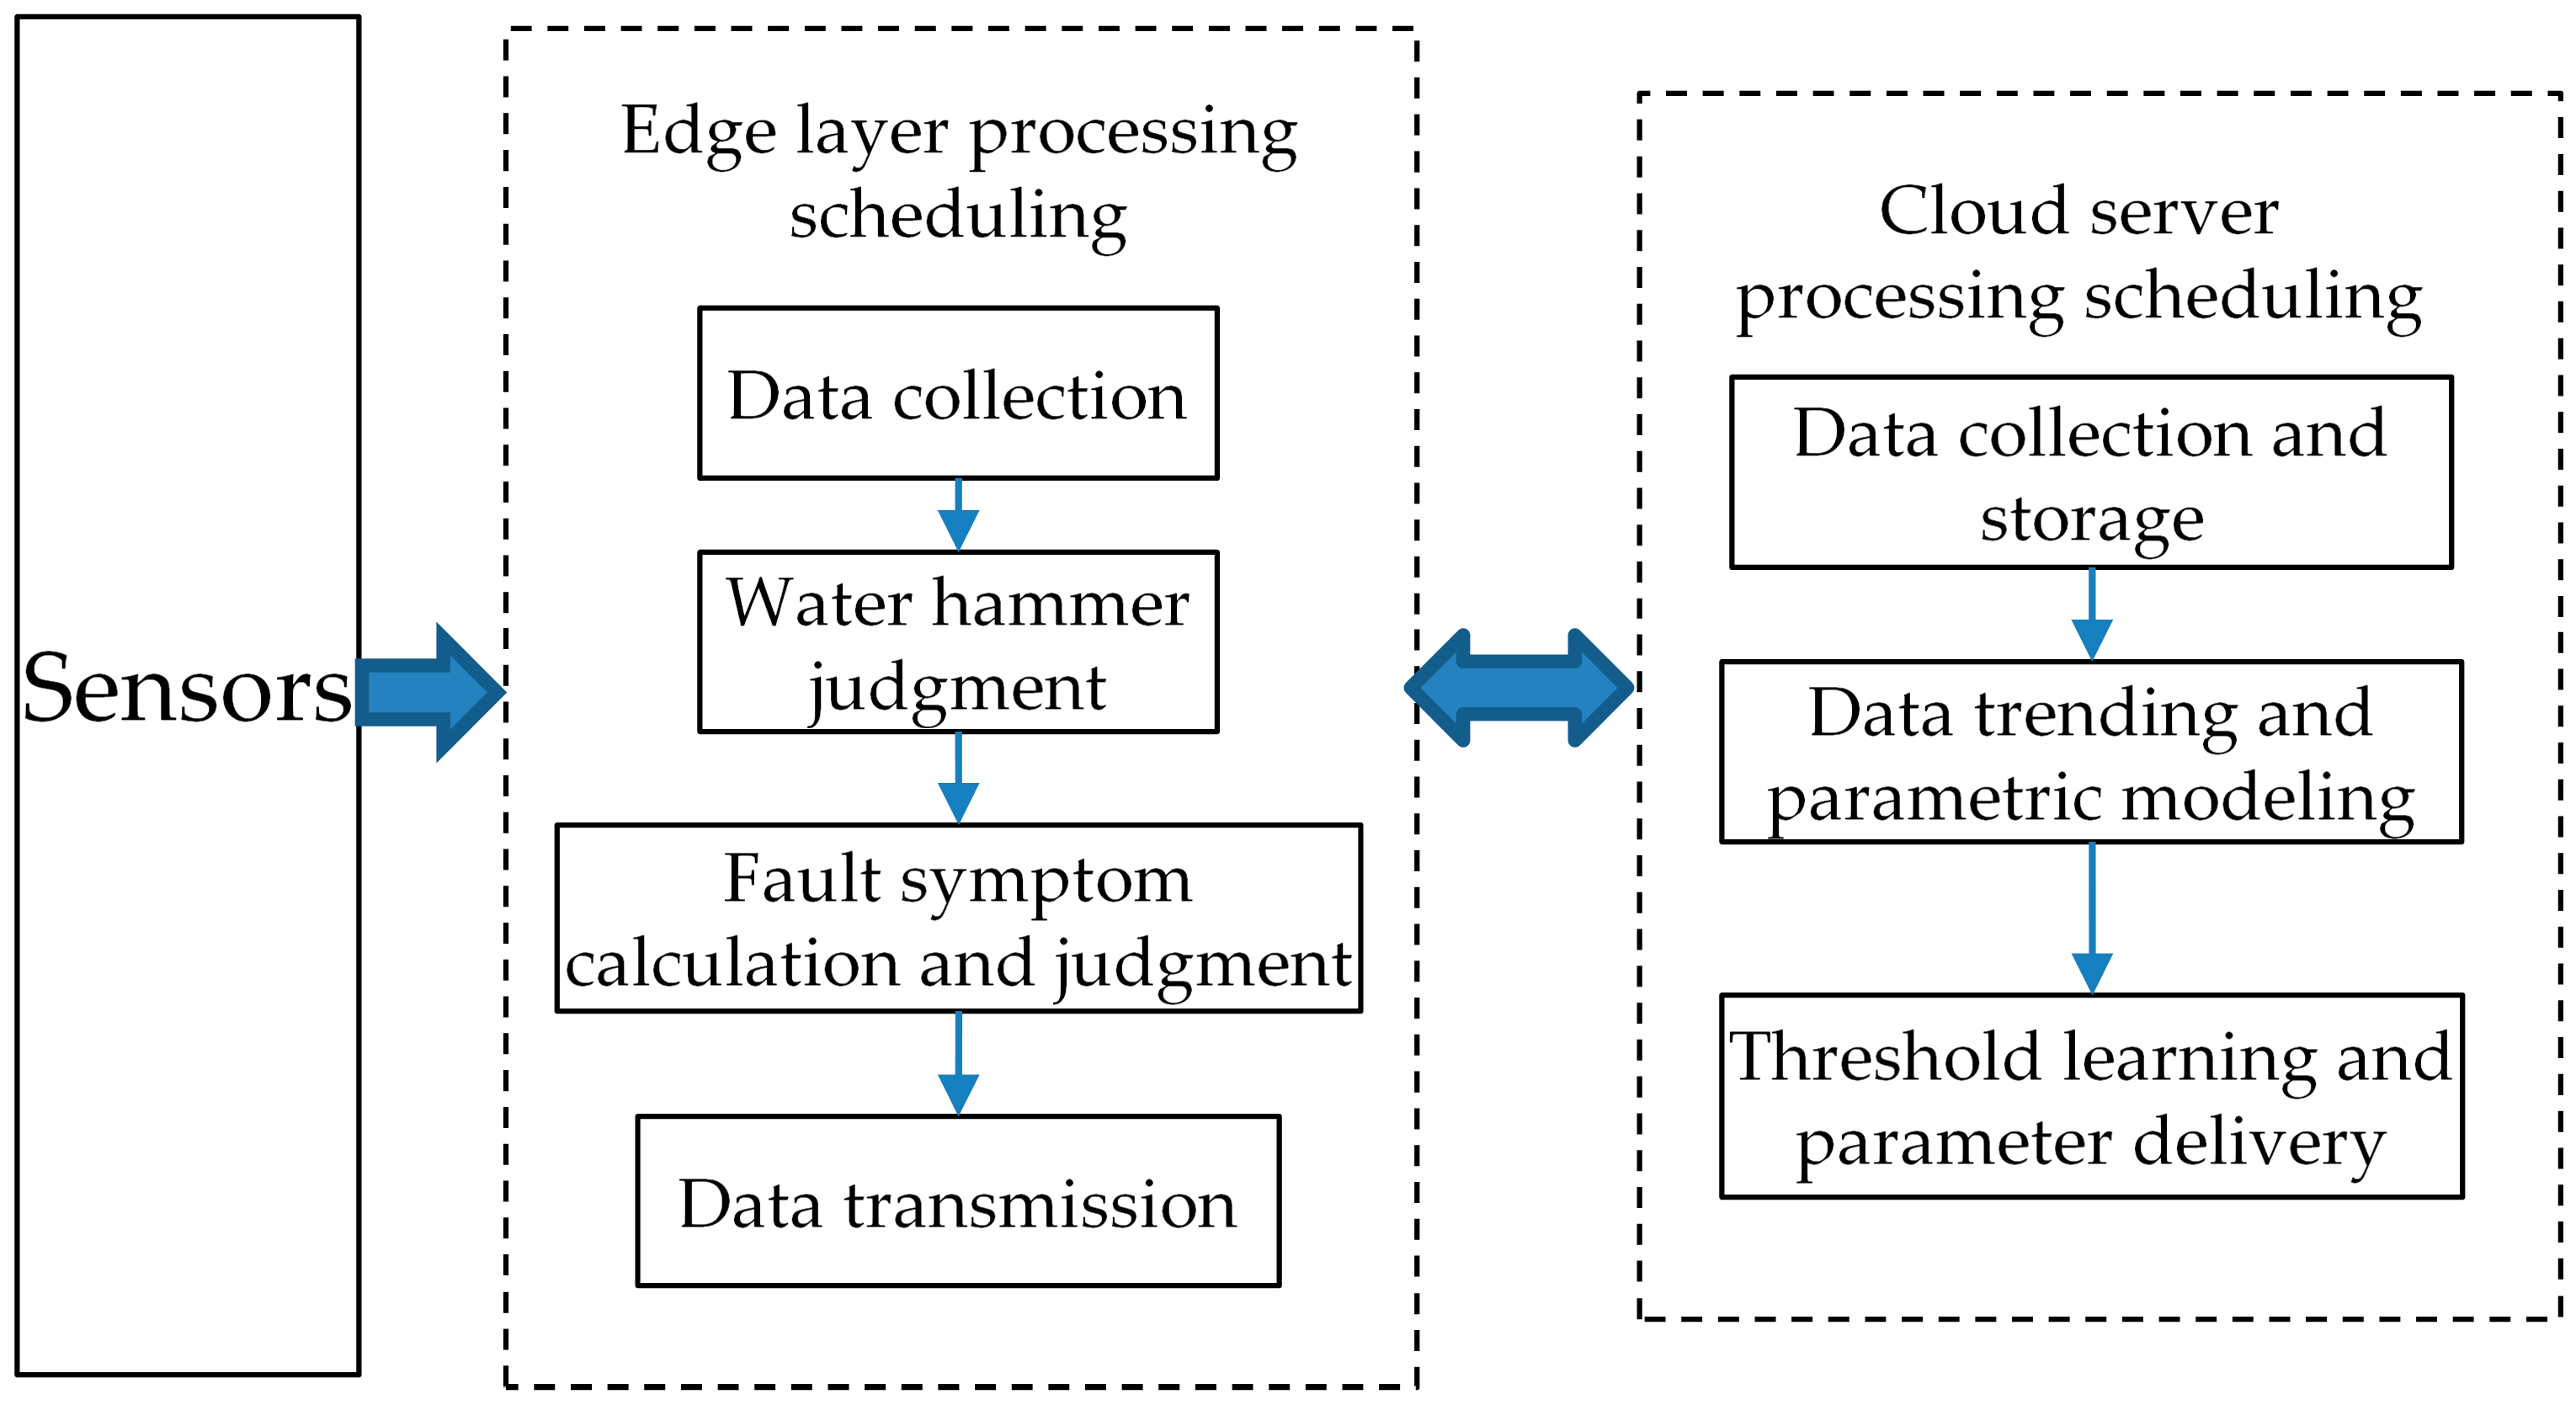
  • The introduction of edge layer and cloud collaborative data processing and transmission methods improves the efficiency of data processing and real-time transmission, providing reliable technical support for timely prevention and handling of water hammer events.
  • An intelligent water hammer monitoring and diagnosis system is designed, which has self-learning alarm thresholds and can automatically send alarm messages, achieving automatic fault diagnosis and reducing reliance on manual labor.
The remaining sections of this paper are organized as follows: In Section 2, the mechanism and characteristics of water hammer faults are analyzed. In Section 3, the proposed monitoring method for water hammer faults is introduced in detail. In Section 4, the water hammer fault monitoring and diagnosis system is designed, including data acquisition and scheduling methods. Section 5 is about experimental verification. Section 6 is the conclusion of this study.

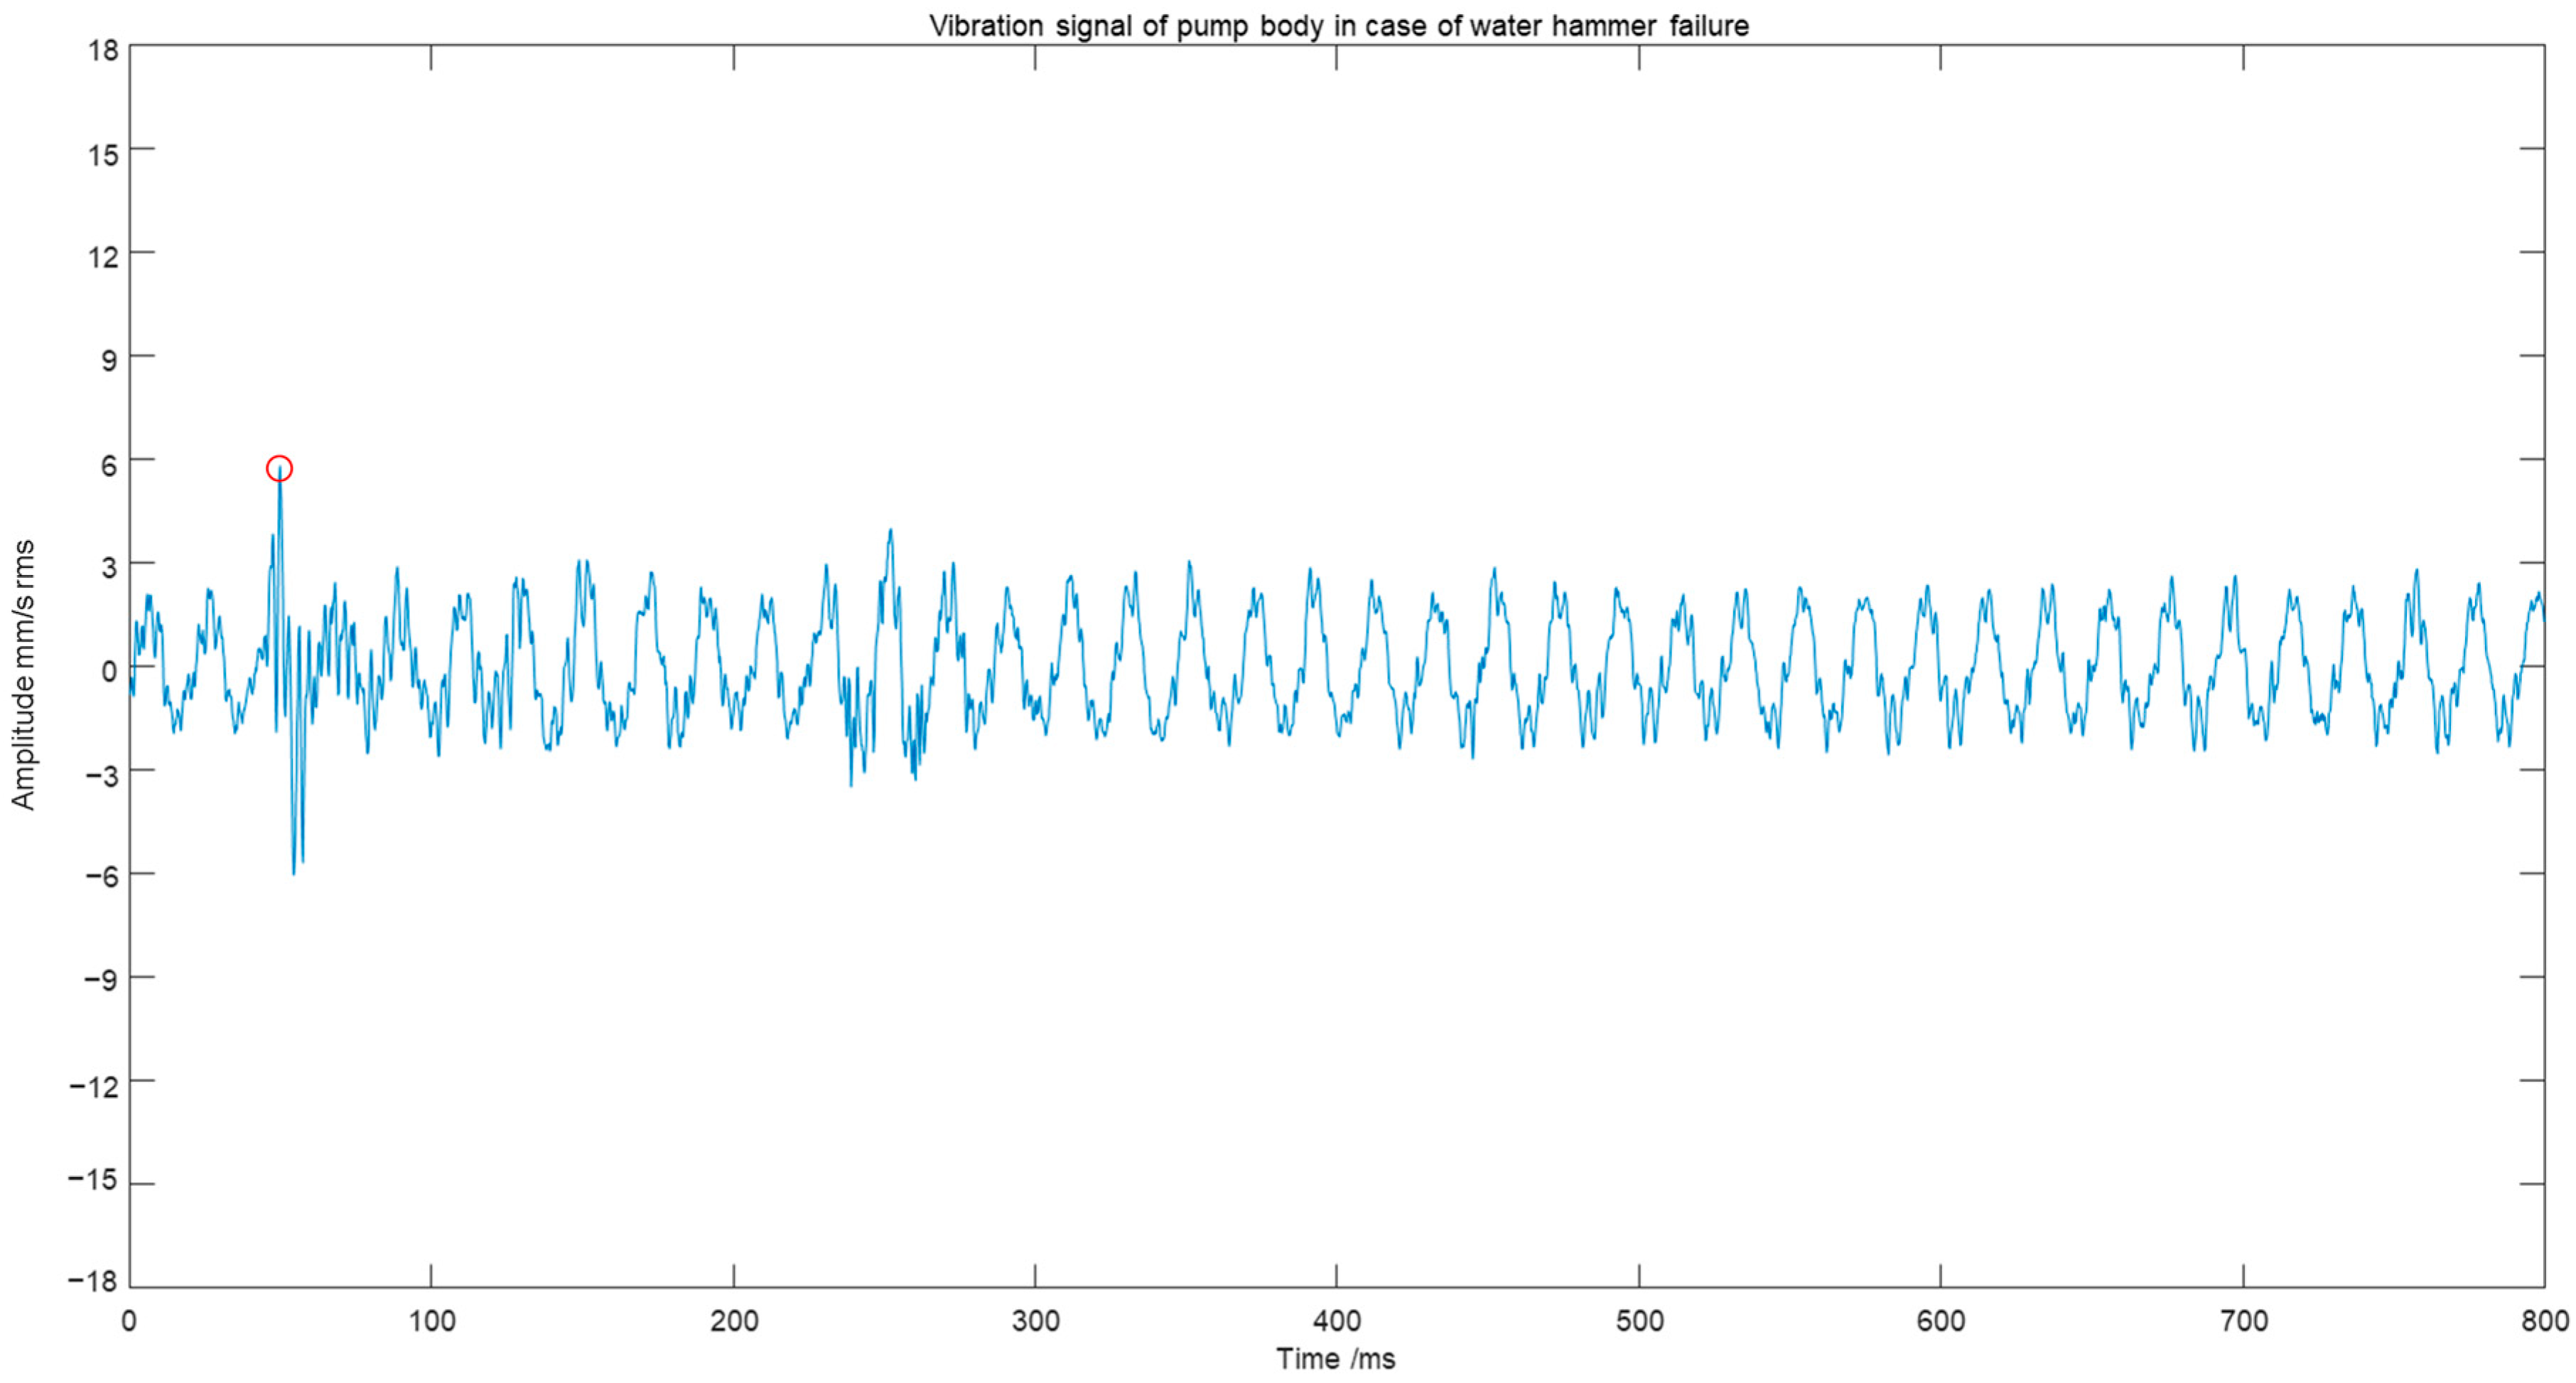
2. Failure Mechanism and Vibration Characteristics

2.1. Failure Mechanism

In the centrifugal pump system, due to the sudden closing of the pressure pipeline valve, the sudden stop of the centrifugal pump unit, etc., the flow rate of water suddenly changes, causing water hammer. This hydraulic phenomenon is called water hammer [15]. Water hammer belongs to the phenomenon of unsteady fluid flow. When water hammer happens, the instantaneous pressure generated can reach dozens or even hundreds of times the normal pressure in the pipeline, resulting in changes in the speed and torque of the centrifugal pump and other characteristic parameters, and even some serious pipeline damage [16,17]. Industrial water supply sites are often unattended. Only after monitoring and recording the occurrence of water hammer failures can timely measures be taken to avoid serious accidents.

2.2. Vibration Characteristics

When a water hammer failure occurs, a large-scale impact is generated on the vibration waveform. This shock waveform is more pronounced at the pump outlet and lasts longer. The impact signal detected on the pump body is weak, but the characteristics of water hammer failure can also be extracted. When a water hammer failure occurs, the vibration waveform at the pump outlet is as shown in Figure 1, and the vibration waveform on the pump body is as shown in Figure 2, where the red mark indicates the starting point of the water hammer failure.

3. Monitoring Method of Water Hammer Failure

The traditional state monitoring method of centrifugal pumps collects the vibration signal of a centrifugal pump through a sensor, and after filtering, amplifying and A/D conversion by the sensor, the transceiver transmits the data to the server for fault analysis and diagnosis [18,19]. The water hammer signal is a shock signal, so it has transient and occasional characteristics. When the traditional vibration monitoring system works, a set of dynamic waveform data is often collected and uploaded to the server for analysis and processing, and after the results are displayed, the next set of data collection and analysis is carried out. There is a collection interval between two data collections due to data transmission, storage, network delay and other reasons. The interval between the two sets of data is often too large, even longer than the duration of the water hammer time, and it is prone to the phenomenon of missing judgment because the water hammer signal cannot be collected. On the other hand, although the occurrence of water hammer failure is occasional, it is more destructive to the centrifugal pump [20]. Effectively recording the water hammer time is important for improving the design of pipelines and centrifugal pumps, but so far, there is no effective method for the real-time digital monitoring of water hammer failures in centrifugal pumps.
In response to the needs of monitoring and diagnosing water hammer faults in centrifugal pumps, this paper designs a new type of digital acquisition and analysis module for centrifugal pumps in order to timely judge the working status of centrifugal pumps. The monitoring and diagnosis process of centrifugal pump water hammer is shown in Figure 3, which is divided into four steps. The specific process is as follows:
Step 1: The sensor collects the vibration signal of the centrifugal pump. High-pass filtering is performed on the collected raw signal to eliminate interference other than the high-frequency fault frequency of water hammer.
Step 2: The kurtosis index, pulse index, and margin index of the high-pass filtered data are calculated.
Step 3: The relevant indices obtained in Step 2 are compared with the normal range to determine if there is a suspected water hammer fault being sent. If there is a suspected occurrence of water hammer failure, vibration signals and fault characteristics are uploaded to the cloud server.
Step 4: The cloud server receives data and performs further diagnosis.
The feature extraction of the water hammer fault needs to first filter out the frequency components of the conventional fault in the signal and then restore the filtered signal to the time domain waveform. According to the filtered time domain signal, the kurtosis index x k u r , pulse index C and margin index L [21], which are sensitive to the impact signal, are selected as the characteristic data of the time domain waveform after high-pass filtering to determine whether the centrifugal pump has a water hammer failure. Specifically, if the kurtosis index, pulse index and margin index simultaneously surpass twice their respective normal levels, it triggers an alarm, indicating that the centrifugal pump might be experiencing a water hammer failure.
x k u r = 1 n t = 1 n x t 1 n t = 1 n x t 4
C = E max | x t | / 1 n t = 1 n x t
L = E max | x t | / 1 n t = 1 n x t 1 / 2 2
where x is the amplitude of the vibration signal, E max is the value with the largest difference in vibration amplitude, n is the number of sampling points and t is a positive integer.

4. Design of Water Hammer Fault Monitoring and Diagnosis System

4.1. Composition of Monitoring System

The water hammer detection system consists of two parts: a data collector on the edge side and a server on the cloud side. The topology structure is shown in Figure 4. The monitoring system works in the way of edge–cloud collaboration [22,23]. Vibration data acquisition, water hammer characteristic calculation and water hammer characteristic value alarm judgment are completed in the collector on the edge side. And symptoms related to centrifugal pump failures are also calculated in the collector. These failure symptoms mainly include imbalance, misalignment, bearing wear, impeller wear, cavitation, loosening, etc. [24]. Common centrifugal pump faults have different fault characteristics in different frequency domains. Therefore, vibration signals can be divided into different frequency bands, and alarm thresholds can be set for each frequency band to achieve the use of predefined thresholds to distinguish common centrifugal pump faults. The data sent by each edge collector are stored in the cloud server. And the trend analysis and modeling of the data are performed by software running on the cloud server. The server software corrects the alarm thresholds of each fault symptom according to the data trend and sends it to the edge collector.

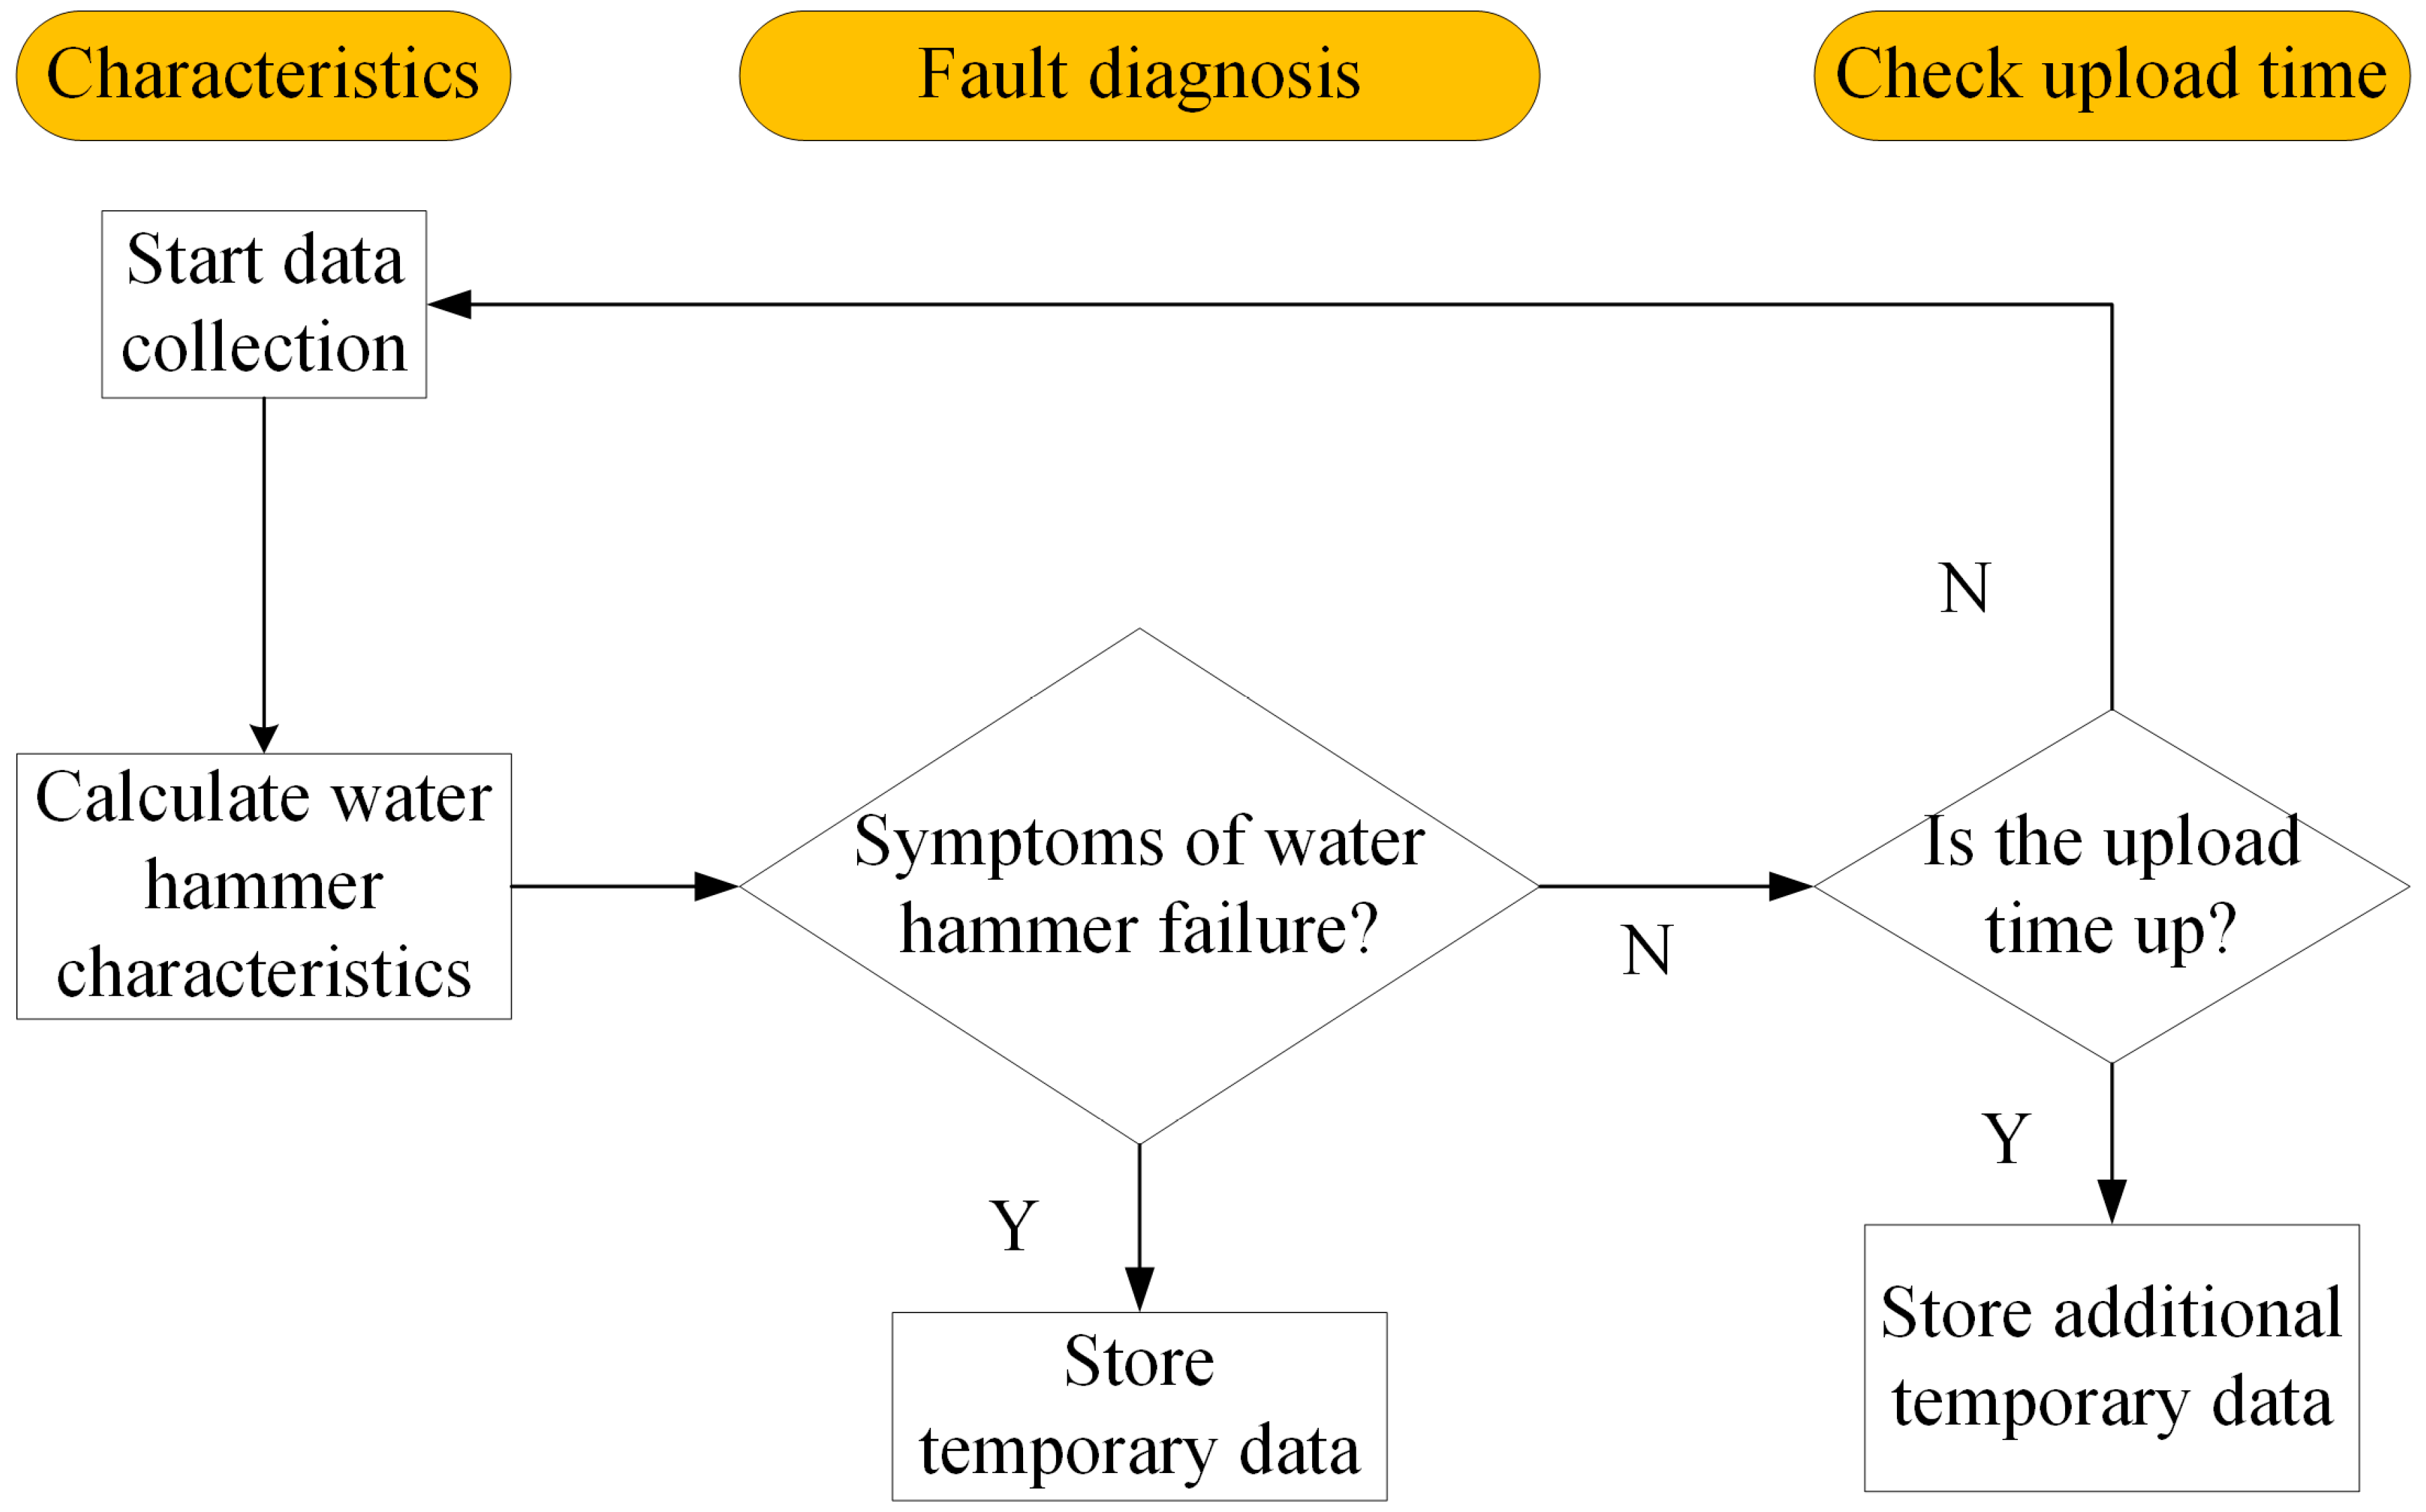
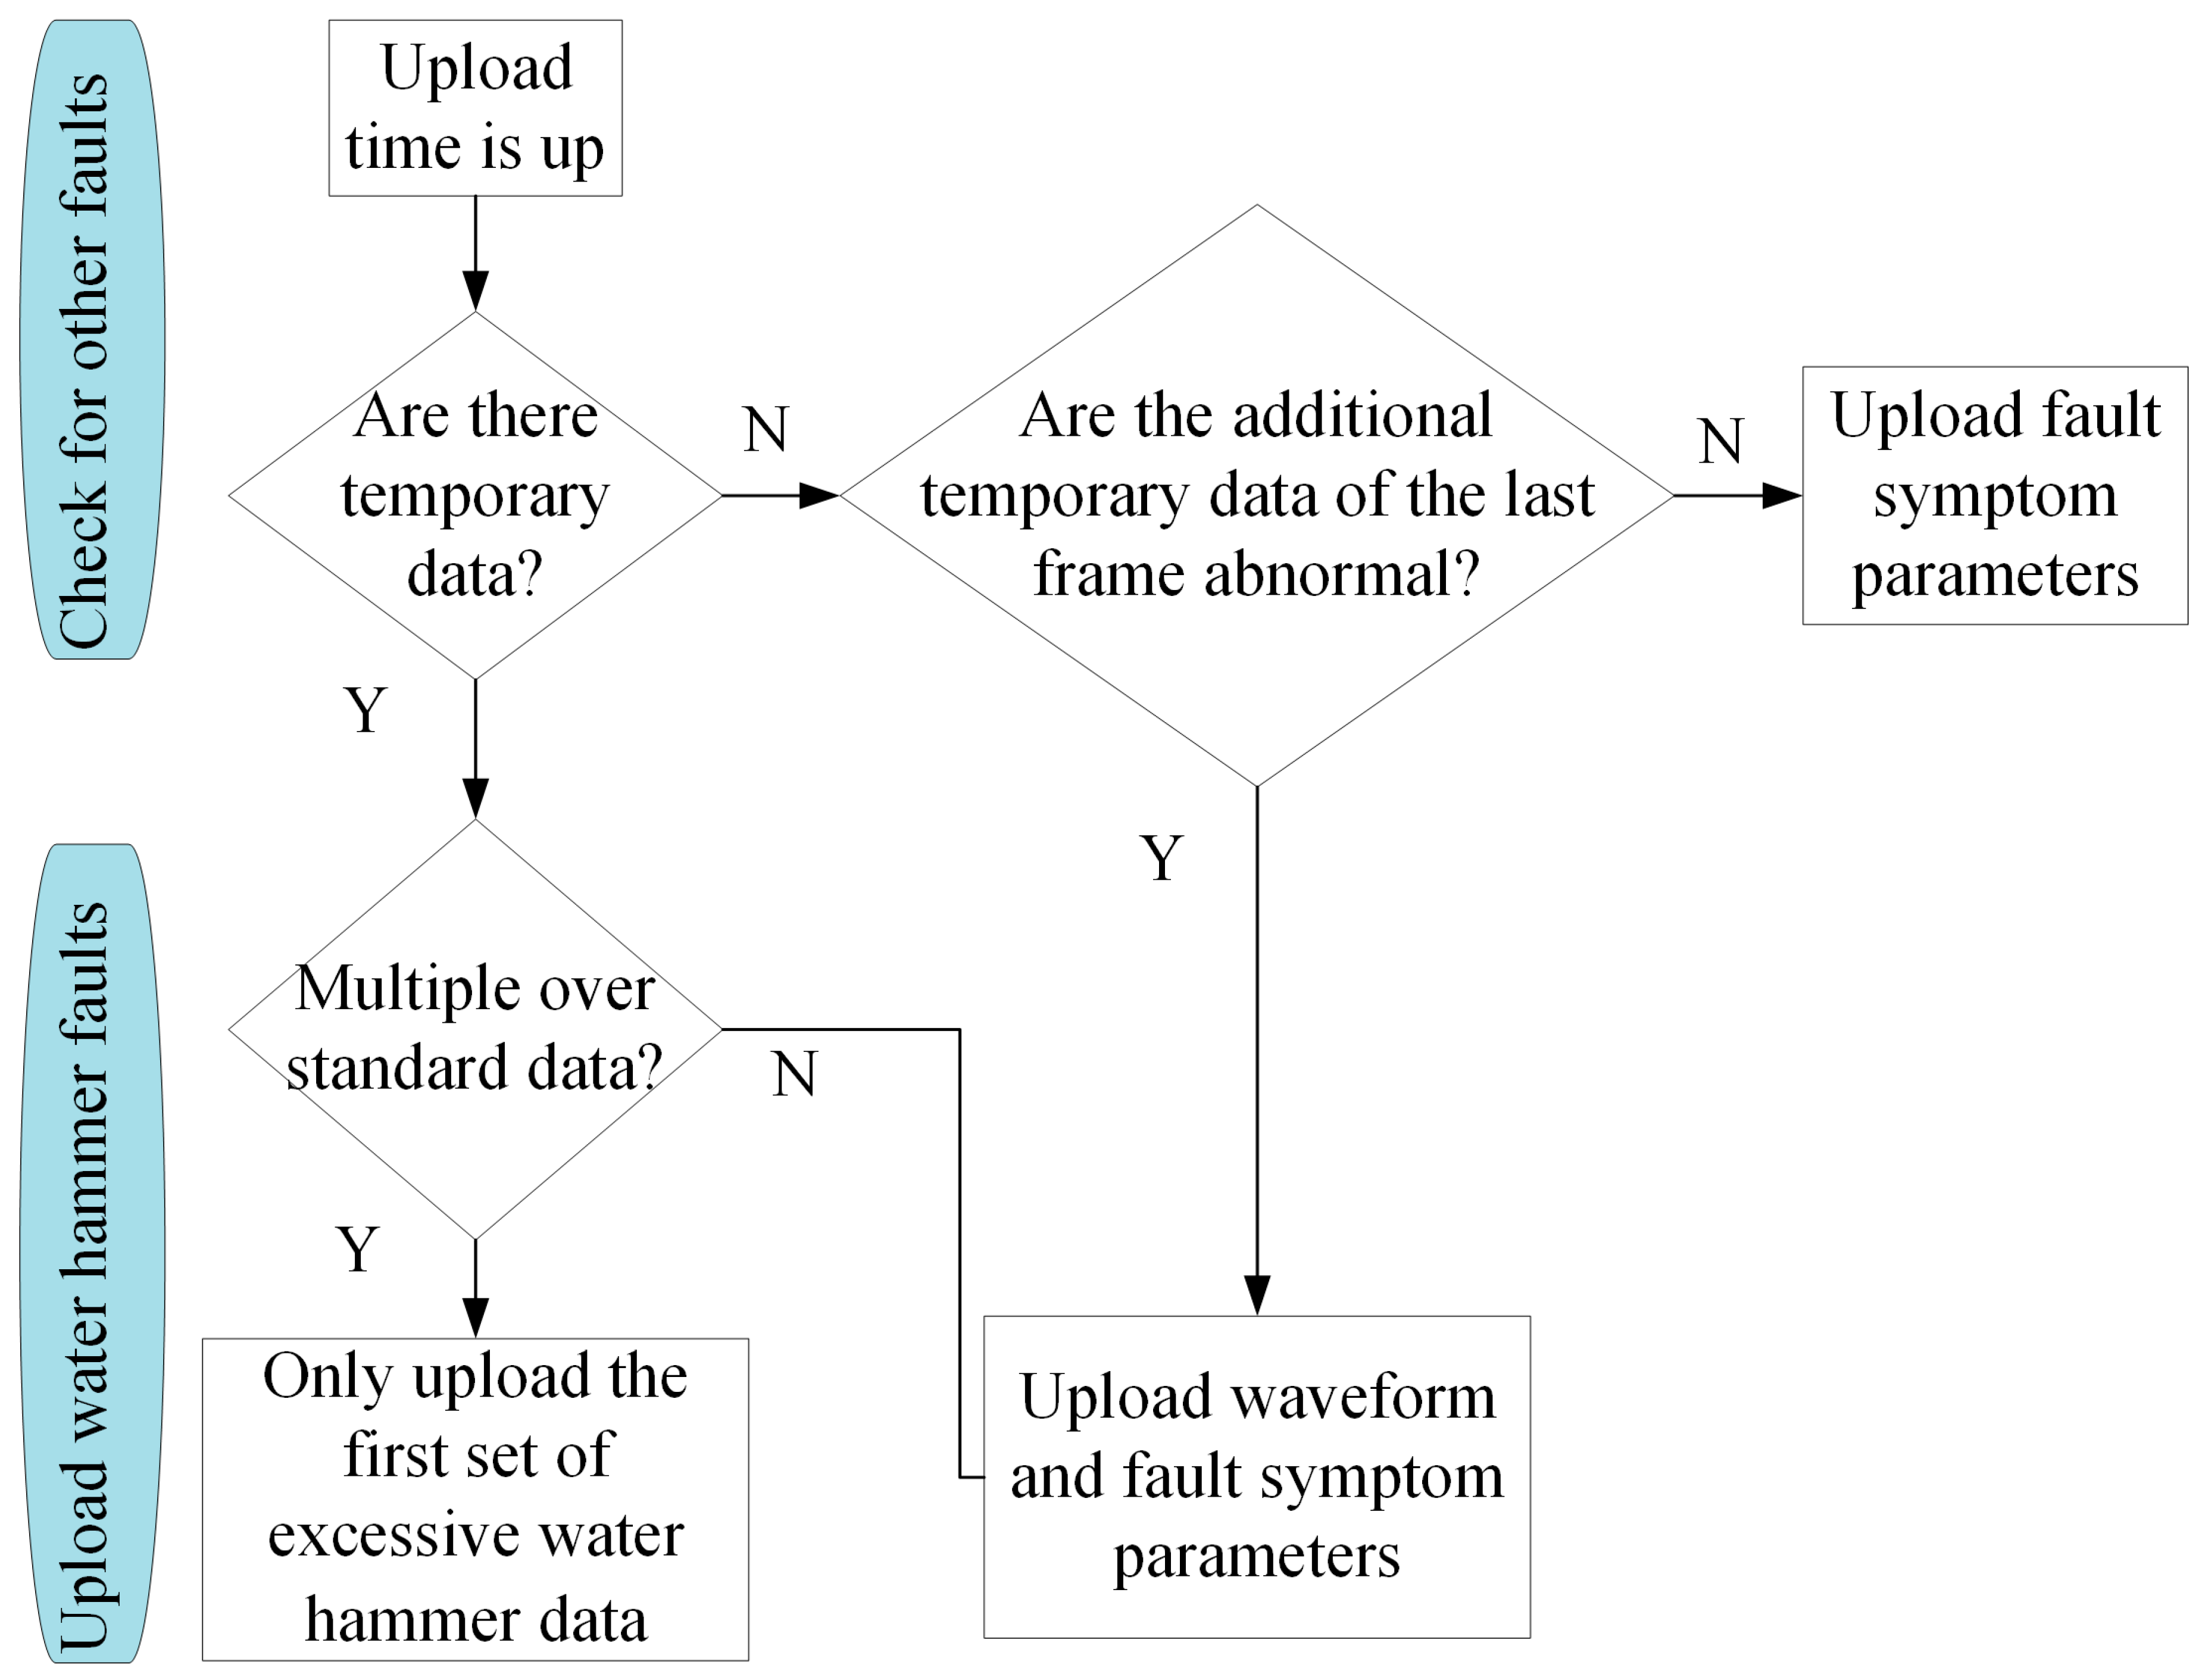
4.2. Monitoring System Data Collection and Scheduling Method

The collector can collect the acceleration sensor signal and perform edge computing in the collector to quickly extract the signs of water hammer in the signal. The water hammer fault has strong occasional and short duration characteristics after it occurs [25,26]. According to these characteristics, the data collection and scheduling method was designed. The method is shown in Figure 5. When each group of data arrives, the collector collects data frame by frame, calculates the characteristic parameters of water hammer and determines whether water hammer has occurred. Specifically, if a malfunction occurs, the set of data in the collector is temporarily stored. If there are no faults, the next collection is prepared, and the final frame of additional temporary data is stored before the upload time to detect other types of faults. The idle time interval between each frame of data is within 1 s to ensure that any water hammer event can be monitored. In this way, the extraction interval of symptom extraction is controlled within 1 s, which effectively avoids omission caused by not collecting symptoms when the water hammer event occurs; the collected vibration data are uploaded to the server through the network. And the server learns and corrects the alarm threshold based on the historical data and sends the learned alarm threshold to the collector. If each group of data is uploaded to the server, it takes up a lot of network bandwidth and storage resources, and most of the data features are similar without significant changes. In addition to water hammer, other mechanical failures of centrifugal pumps have a gradual process, so in terms of uploading collected data, a reasonable time interval can be set, such as uploading once every 30s to reduce the upload frequency and network bandwidth usage.
The data transmission strategy is shown in Figure 6. If the water hammer fault symptom is not detected before the end of the upload window, it indicates that there are no temporary data. Therefore, we calculate other characteristic parameters except for the water hammer fault symptom based on the final frame of the additional temporary data collected within this window. Among them, the fault characteristic parameters mainly include common centrifugal pump faults: balance failure, misalignment, looseness, impeller failure, cavitation, etc. If none of the parameters exceed the predefined threshold, only the fault symptom parameters are uploaded. However, if one or more of these parameters violate the alarm values, the symptom parameters and the entire vibration waveform dataset are uploaded to the server.
If the dataset collected before the upload window closes shows water hammer fault characteristics exceeding the set threshold, it indicates the presence of temporary data. When the upload window opens, the dataset is uploaded together with the calculated fault symptom parameters. If multiple feature datasets collected after detecting water hammer symptoms exceed the standard, we prioritize uploading the first dataset that shows water hammer features exceeding the threshold. In addition to this data transmission strategy, we also upload waveform data at a fixed time every day (such as 13:00).

5. Test and Experiment
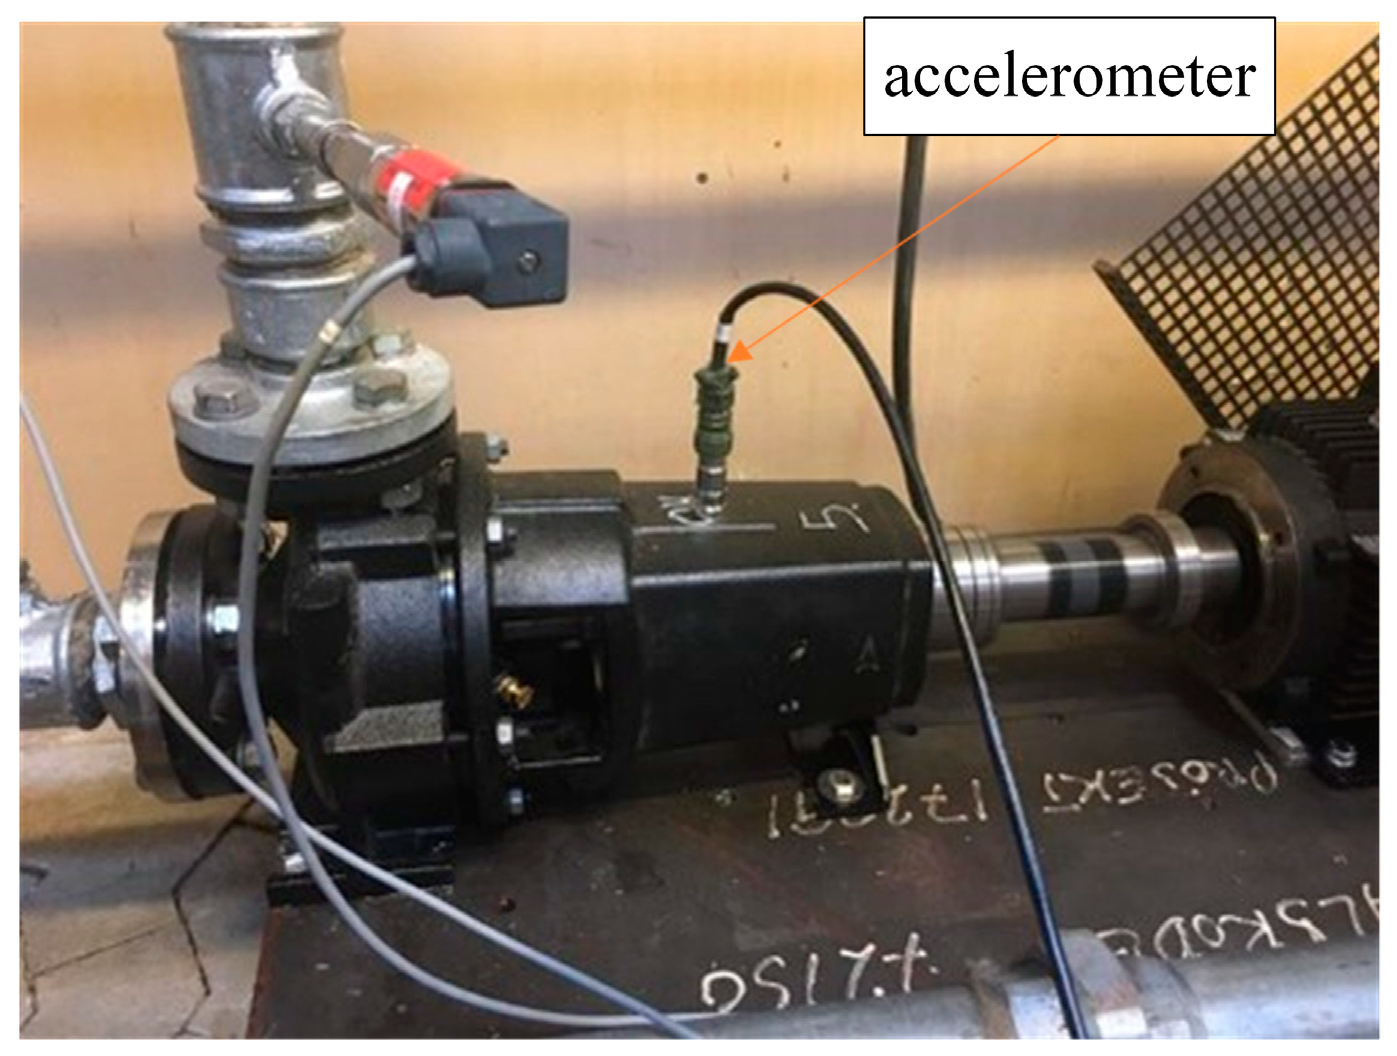
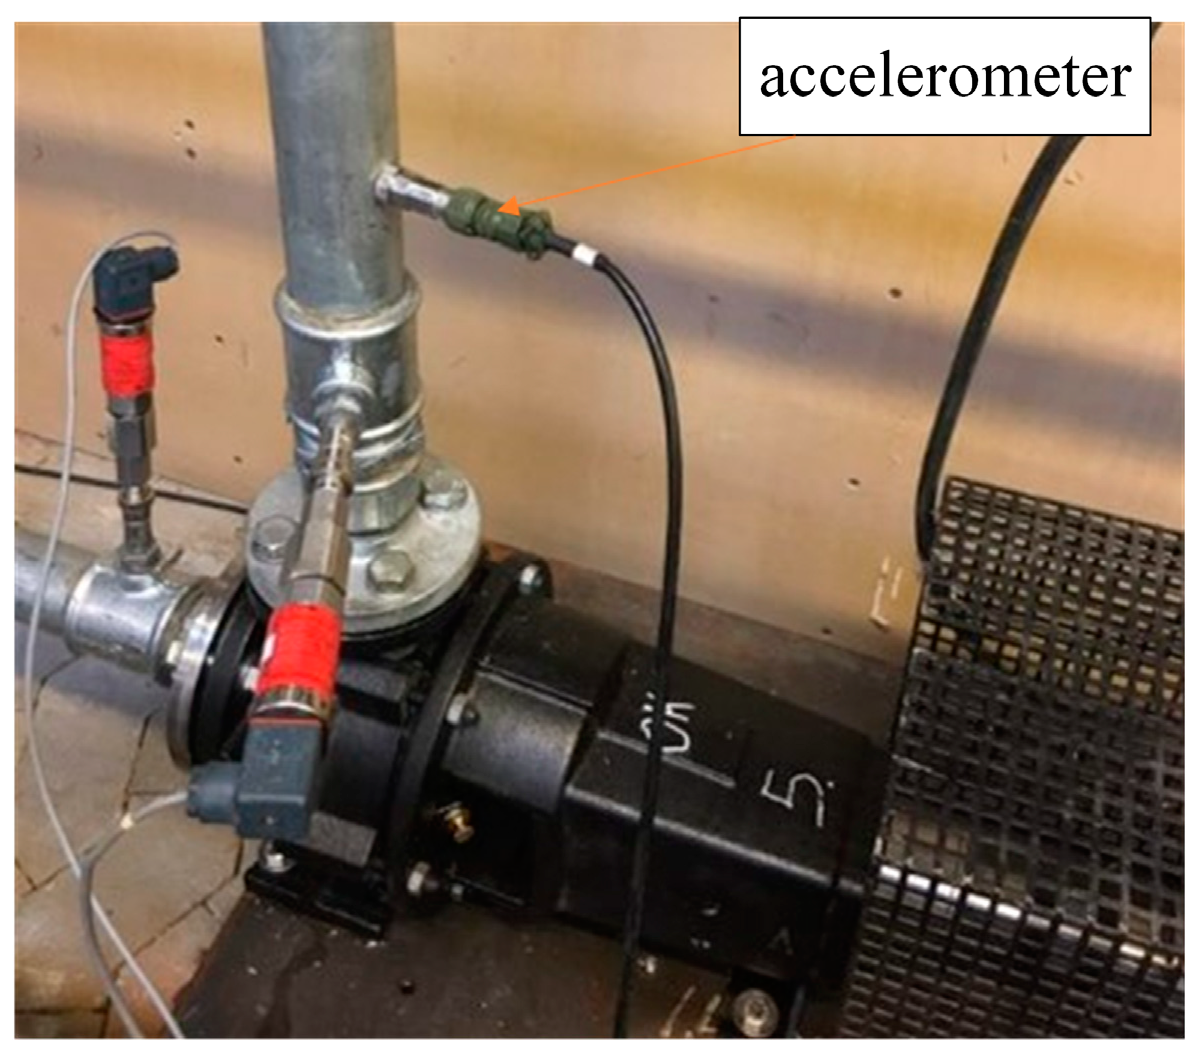
5.1. Test Object

In order to verify the effectiveness of the proposed centrifugal pump water hammer fault diagnosis system and method, a vertical multistage centrifugal pump, model CR10-02 A-FJ-A-E-HQQE, was selected as the test object. Two acceleration sensors were installed at the pump body (measuring point 1) and water outlet (measuring point 2) of the centrifugal pump to monitor the vibration signal changes during the operation of the centrifugal pump, as shown in Figure 7 and Figure 8. The driving power of the centrifugal pump motor used in the experiment was 1.5kW, and the rotating speed was 3000 r/min.

5.2. Experimental Methods

An intelligent sensor was used for real-time monitoring of the centrifugal pump, and the water outlet’s measuring points were the pump body (measuring point 1) and the water outlet (measuring point 2). The sampling frequency was set to 5120 Hz, the number of sampling points was 4096, and the medium was water. The pump outlet pipe was tapped 30 cm away to simulate the pump water hammer failure. The experimental centrifugal pump speed was 3000 r/min, and the cutoff frequency of the centrifugal pump impeller frequency (300 Hz) was used as the cut-off frequency of the high-pass filter to test the effectiveness and reliability of the centrifugal pump water hammer fault monitoring system and method.
In this experiment, the ADXL1002 accelerometer produced by ADI Semiconductor Company was selected, with a sensitivity of 100 mV/g. The collector was powered by 220 V AC and had a built-in 24 bit analog-to-digital converter to ensure measurement accuracy requirements. The built-in signal conditioning circuit performed high-pass filtering on vibration signals. The built-in high-performance ARM processor analyzed sensor data and combined specific algorithms to calculate three time domain indicators that reflected the characteristics of water hammer faults, including the kurtosis index, pulse index and margin index.
The cloud server was responsible for building a diagnostic model for centrifugal pump water hammer, calculating the kurtosis index, pulse index and margin index of centrifugal pump data under normal conditions and using twice the various indicators as the alarm threshold for centrifugal pump water hammer faults. The cloud server was responsible for issuing diagnostic results to the edge collector for early warning. When the evaluation result was normal, the cloud server determined whether the threshold change exceeded 5% of the original threshold and updated the threshold if it exceeded 5%. If it did not exceed it, it was not updated. In practical applications, this percentage can be adjusted according to the actual situation.

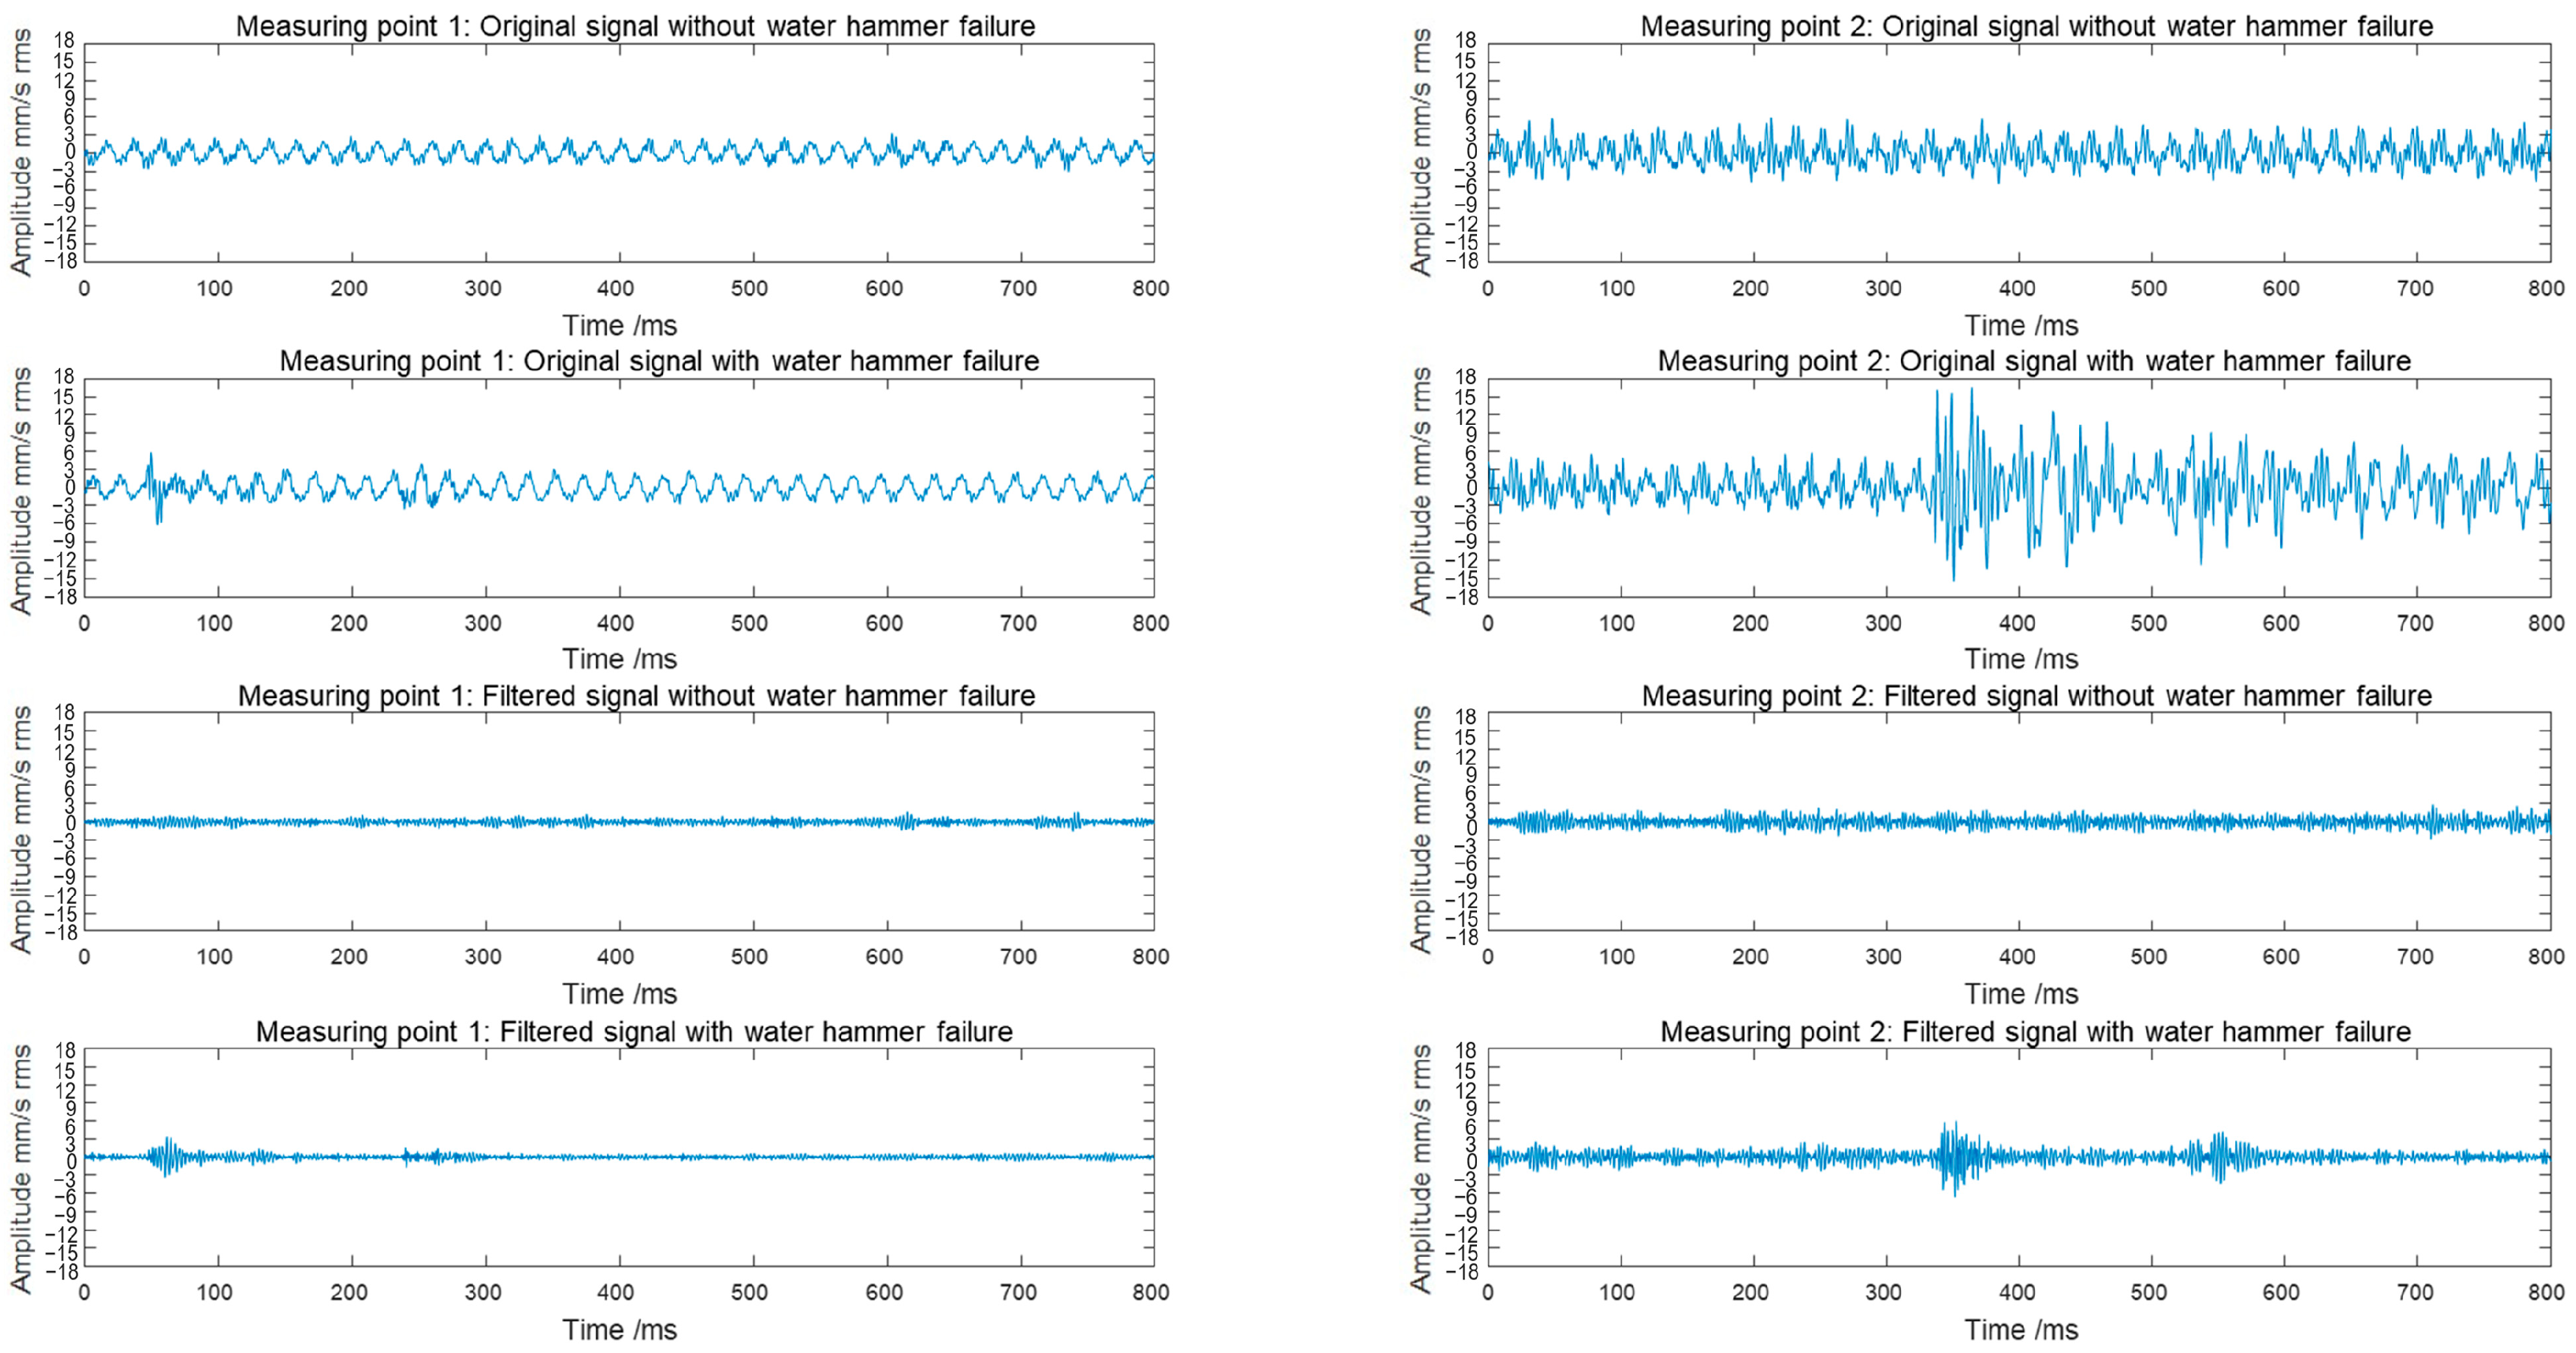
5.3. Analysis of Results

The waveforms of the original signal and filtered signal at measurement points 1 and 2 of the centrifugal pump under normal conditions and water hammer failure are shown in Figure 9. When no water hammer fault occurred, the original signal and filtered signal waveforms of measurement points 1 and 2 showed relatively stable characteristics, and there were no obvious impact signals. At this point, the kurtosis index, pulse index and margin index values of measurement points 1 and 2 were also relatively small.
However, when a water hammer failure occurred, it can be observed from Figure 9 that there were impulse components present in both the original signal and filtered signal waveforms of measurement points 1 and 2. The kurtosis index, pulse index and margin index calculated during the experimental process are shown in Table 1. It can be seen that the original signal’s kurtosis index, pulse index and margin index of measurement point 1 without water hammer failure were 2.10, 3.18 and 3.58, respectively, whereas the original signal’s kurtosis index, pulse index and margin index of measurement point 2 without water hammer failure were 2.57, 3.72, and 4.34, respectively. In contrast, the original signal’s kurtosis index, pulse index and margin index of measuring points 1 and 2 significantly increased when a water hammer fault occurred. For example, the original signal’s kurtosis index, pulse index and margin index of measurement point 1 increased to 2.49, 4.91 and 5.52, respectively, when a water hammer fault occurred, whereas the original signal’s kurtosis index, pulse index and margin index of measurement point 2 increased to 4.86, 6.25 and 7.66 under the same conditions. It can be seen that the original signal’s kurtosis index, pulse index and margin index of measuring points 1 and 2 underwent significant changes compared to the normal state when a water hammer fault occurred, increasing 1.19 to 1.54 times and 1.89 to 1.76 times, respectively.
Compared with the unfiltered original signal, the index change in the filtered signal was more significant when a water hammer fault occurred. From Table 1, the kurtosis index, pulse index and margin index of the filtered signal at measurement points 1 and 2 increased 3.90 to 2.40 times and 2.64 to 2.18 times, respectively, compared to the normal state when a water hammer fault occurred.
The multiples of the three indicators (kurtosis, pulse, and margin) were used with the corresponding indicators under normal conditions as the judgment criteria. If all three indicators exceeded twice the normal conditions, it was judged that a water hammer failure had occurred. When simulating a water hammer failure by tapping on the water pump outlet pipe 30 cm away, the three indicators without a high-pass filter did not exceed twice the normal conditions. The diagnostic result showed that no water hammer failure had occurred, which is inconsistent with the simulated situation, indicating an error in judgment. After applying the high-pass filter, all three indicators significantly exceeded twice the normal conditions, which is consistent with the simulated water hammer fault conditions; therefore, the judgment was correct. The vibration and fault characteristic data of the centrifugal pump, measured by the sensors, were uploaded to the cloud server for further precise fault diagnosis. The cloud server determined that the centrifugal pump experienced a water hammer failure and issued an alarm to notify personnel for timely processing.

5.4. Experimental Results

Based on the comparison of the kurtosis index, pulse index and margin index of the original signal and the filtered signal during a water hammer failure of the centrifugal pump in the experiment, it can be concluded that these indices changed more significantly after filtering. In the experimental process after filtering, when a water hammer failure occurred in the centrifugal pump, both sensors issued an alarm indicating a suspected water hammer failure. This indicates that monitoring the changes in the kurtosis index, pulse index and margin index of the original data after high-pass filtering can effectively detect whether a water hammer failure occurs in the operation of a centrifugal pump. This fully demonstrates the scientific and effective nature of the proposed method and system for monitoring centrifugal pump failures.

6. Conclusions

Through the study of the fault characteristics of centrifugal pump water hammer, the following conclusions can be drawn:
  • In response to the difficulty in monitoring water hammer in centrifugal pumps, the proposed water hammer fault monitoring method and diagnostic model can achieve timely capture, early warning and rapid response to water hammer events.
  • In view of the problem that water hammer events are difficult to deal with in time, this paper adds edge computing to the data acquisition module, which makes full use of the computing power of the edge layer, reduces the computing pressure of the server and improves the data transmission speed and the processing efficiency of water hammer events.
  • After experimental testing, the water hammer monitoring and diagnosis system designed in this article can effectively collect operational data of centrifugal pumps and intelligently identify faults based on the characteristics of centrifugal pump water hammer faults.
In summary, this project overcomes the difficulties of water hammer monitoring, fills the research gap in the field of centrifugal pump water hammer fault monitoring and intelligent diagnosis, expands the scope of intelligent fault diagnosis and can more comprehensively monitor the operating status of centrifugal pumps, improving the reliability of centrifugal pump operation. In the future, research will be conducted on how to further improve the accuracy of cloud-server-based diagnosis in order to better apply it to practical production.

Author Contributions

Conceptualization, L.C. and Z.L.; Investigation, L.C. and Z.L.; Supervision, L.C.; Writing—original draft preparation, Z.L. and W.S.; Writing—review and editing, W.S. and W.L. All authors have read and agreed to the published version of the manuscript.

Funding

This work is partially supported by the National Natural Science Foundation of China (51775515), the Key Scientific and Technological Projects in Henan Province (182102210016) and the National Key Research and Development Project of China (2016YFF0203104-5).

Institutional Review Board Statement

Not applicable.

Informed Consent Statement

Not applicable.

Data Availability Statement

The data presented in this study are available on request from the corresponding author. The data are not publicly available due to privacy or ethical restrictions.

Conflicts of Interest

The authors declare no conflicts of interest.

References

  1. Sunal, C.E.; Dyo, V.; Velisavljevic, V. Review of Machine Learning Based Fault Detection for Centrifugal Pump Induction Motors. IEEE Access 2022, 10, 71344–71355. [Google Scholar] [CrossRef]
  2. Jardine, A.K.S. Vibration Monitoring in Industry: Then and Now. IEEE Trans. Reliab. 2024, 73, 31–32. [Google Scholar] [CrossRef]
  3. Yu, R.; Liu, J. Failure analysis of centrifugal pump impeller. Eng. Fail. Anal. 2018, 92, 343–349. [Google Scholar] [CrossRef]
  4. Ahmad, Z.; Rai, A.; Maliuk, A.S.; Kim, J.M. Discriminant Feature Extraction for Centrifugal Pump Fault Diagnosis. IEEE Access 2020, 8, 165512–165528. [Google Scholar] [CrossRef]
  5. Cao, Y.; Wang, J.; Dou, Y.; Huang, Y. Vibration Response of Fracturing Tubing Induced by Water Hammer. Mach. Tool Hydraul. 2019, 47, 1–7. [Google Scholar] [CrossRef]
  6. Li, S.; Meng, L.; Xu, X.; Lou, Y. Influence of Opening Characteristics for Ultra-supercritical Steam Trap on Water Hammer Induced Pipe Vibration. J. Vib. Meas. Diagn. 2017, 37, 1169–1174, 1280. [Google Scholar] [CrossRef]
  7. Urbanowicz, K.; Jing, H.; Bergant, A.; Stosiak, M.; Lubecki, M. Progress in Analytical Modeling of Water Hammer. J. Fluids Eng. Trans. Asme 2023, 145, 081203. [Google Scholar] [CrossRef]
  8. Liu, M.; Liang, X.; Liu, Z.; Lin, Q.; Wu, Y. Field Measurement of Water Hammer and Signal Analysis at Pump-Stop Due to Power Failure in Long Water-Supply Pipeline. J. Drain. Irrig. Mach. Eng. 2012, 30, 249–253. [Google Scholar] [CrossRef]
  9. Britton, L.G.; Willey, R.J. Avoiding Water Hammer and Other Hydraulic Transients. Process Saf. Prog. 2024, 43, 101–112. [Google Scholar] [CrossRef]
  10. Wu, L.; Wang, H.; Li, X.; Sang, Z.; Chen, Z. Ultimate Bearing Capacity Analysis of Pipelines under Water Hammer. J. Pipeline Syst. Eng. Pract. 2024, 15, 04023063. [Google Scholar] [CrossRef]
  11. Zhang, X.; Bian, S.; Feng, M.; Lu, W.; Zhang, J. Experimental study on direct water hammer pressure characteristics in PMMA pipelines. J. Drain. Irrig. Mach. Eng. 2024, 42, 37–42. [Google Scholar] [CrossRef]
  12. Yu, Y.; Wang, J.; Qin, X. Hydraulic vibration analysis of parallel pump system with air surge tank for water hammer protection. J. Drain. Irrig. Mach. Eng. 2013, 31, 958–963. [Google Scholar] [CrossRef]
  13. Bazargan-Lari, M.R.; Kerachian, R.; Afshar, H.; Bashi-Azghadi, S.N. Developing an optimal valve closing rule curve for real-time pressure control in pipes. J. Mech. Sci. Technol. 2013, 27, 215–225. [Google Scholar] [CrossRef]
  14. Bergant, A.; Tijsseling, A.S.; Vítkovský, J.P.; Covas, D.I.C.; Simpson, A.R.; Lambert, M.F. Parameters affecting water-hammer wave attenuation, shape and timing—Part 1: Mathematical tools. J. Hydraul. Res. 2008, 46, 373–381. [Google Scholar] [CrossRef]
  15. Liu, Z.; Bi, H.; Wang, F. Effect of air valves on water hammer protection in pressure pipelines. J. Drain. Irrig. Mach. Eng. 2011, 29, 333–337. [Google Scholar] [CrossRef]
  16. Wang, X.; Zhang, J.; Yu, X.; Chen, S.; Zhao, W.; Xu, H. Effect of multi-valve closure on superposed pressure in a tree-type long distance gravitational water supply system. J. Water Supply Res. Technol. AQUA 2019, 68, 420–430. [Google Scholar] [CrossRef]
  17. Urbanowicz, K.; Bergant, A.; Stosiak, M.; Karpenko, M.; Bogdevicius, M. Developments in analytical wall shear stress modelling for water hammer phenomena. J. Sound Vib. 2023, 562, 117848. [Google Scholar] [CrossRef]
  18. Wan, W.; Zhang, B.; Chen, X. Investigation on Water Hammer Control of Centrifugal Pumps in Water Supply Pipeline Systems. Energies 2019, 12, 108. [Google Scholar] [CrossRef]
  19. Hu, J.; Wang, C.; Shan, C.; Guo, Y. Monitoring and Analysis of the Operation Performance of Vertical Centrifugal Variable Frequency Pump in Water Supply System. Energies 2023, 16, 4526. [Google Scholar] [CrossRef]
  20. Arun Shankar, V.K.; Subramaniam, U.; Padmanaban, S.; Holm-Nielsen, J.B.; Blaabjerg, F.; Paramasivam, S. Experimental Investigation of Power Signatures for Cavitation and Water Hammer in an Industrial Parallel Pumping System. Energies 2019, 12, 1351. [Google Scholar] [CrossRef]
  21. Han, J.; Zhang, R. Fault Mechanism and Diagnostic Technology of Rotating Machinery; Machinery Industry Press: Beijing, China, 1997; pp. 36–37. [Google Scholar]
  22. Chen, Y.; Liu, B.; Lin, W.; Cheng, H. Survey of Cloud-edge Collaboration. Comput. Sci. 2021, 48, 259–268. [Google Scholar] [CrossRef]
  23. Yao, J.; Zhang, S.; Yao, Y.; Wang, F.; Ma, J.; Zhang, J.; Chu, Y.; Ji, L.; Jia, K.; Shen, T.; et al. Edge-Cloud Polarization and Collaboration: A Comprehensive Survey for AI. IEEE Trans. Knowl. Data Eng. 2023, 35, 6866–6886. [Google Scholar] [CrossRef]
  24. Tong, Z.M.; Xin, J.G.; Tong, S.G.; Yang, Z.Q.; Zhao, J.Y.; Mao, J.H. Internal flow structure, fault detection, and performance optimization of centrifugal pumps. J. Zhejiang Univ. Sci. A 2020, 21, 85–117. [Google Scholar] [CrossRef]
  25. Wang, Y.; Xiong, W.; Ding, Z.; Pi, Q.; Yuan, X.; Liu, H.; Li, M. Water Hammer Characteristics in Pressurized Pipeline Based on CFD. J. Drain. Irrig. Mach. Eng. 2023, 41, 1156–1162. [Google Scholar] [CrossRef]
  26. Dutta, N.; Palanisamy, K.; Subramaniam, U.; Padmanaban, S.; Holm-Nielsen, J.B.; Blaabjerg, F.; Almakhles, D.J. Identification of Water Hammering for Centrifugal Pump Drive Systems. Appl. Sci. 2020, 10, 2683. [Google Scholar] [CrossRef]
Figure 1. Vibration signal of water outlet when water hammer failure occurs.
Applsci 14 05606 g001
Figure 2. Vibration signal of pump body in case of water hammer failure.
Applsci 14 05606 g002
Figure 3. Flow chart of centrifugal pump water hammer failure monitoring and diagnosis.
Applsci 14 05606 g003
Figure 4. Interactive topology diagram of edge side and cloud side.
Applsci 14 05606 g004
Figure 5. Flow chart of collection and scheduling method.
Applsci 14 05606 g005
Figure 6. Flow chart of data transmission strategy.
Applsci 14 05606 g006
Figure 7. Field experiment photos of centrifugal pump (measuring point 1).
Applsci 14 05606 g007
Figure 8. Field experiment photos of centrifugal pump (measuring point 2).
Applsci 14 05606 g008
Figure 9. Waveforms of original signals and filtered signals at measuring points 1 and 2 under normal and water hammer fault conditions.
Applsci 14 05606 g009
Table 1. Comparison of time domain characteristics of the original and filtered signals at measuring points 1 and 2 under normal and water hammer conditions.
ParameterMeasuring Point 1Measuring Point 2
Kurtosis IndexPulse IndexMargin IndexKurtosis IndexPulse Index Margin Index
Original signal without water hammer failure2.103.183.582.573.724.34
Original signal with water hammer failure2.494.915.524.866.257.66
Multiple1.191.541.541.891.681.76
Filtered signal without water hammer failure3.125.096.002.914.615.44
Filtered signal with water hammer failure12.1811.7014.407.619.5411.79
Multiple3.902.302.402.642.072.18
Disclaimer/Publisher’s Note: The statements, opinions and data contained in all publications are solely those of the individual author(s) and contributor(s) and not of MDPI and/or the editor(s). MDPI and/or the editor(s) disclaim responsibility for any injury to people or property resulting from any ideas, methods, instructions or products referred to in the content.

