Article

Thermal–RGB Imagery and Computer Vision for Water Stress Identification of Okra (Abelmoschus esculentus L.)

1
Irrigation and Drainage Engineering Division, ICAR—Central Institute of Agricultural Engineering, Bhopal 462038, India
2
Agricultural Mechanization Division, ICAR—Central Institute of Agricultural Engineering, Bhopal 462038, India
3
Department of Biological Systems Engineering, Virginia Tech Tidewater AREC, Suffolk, VA 23437, USA
4
Center for Advanced Innovation in Agriculture (CAIA), Virginia Tech, Blacksburg, VA 24061, USA
5
School of Electrical and Electronics Engineering, VIT Bhopal University, Bhopal 466114, India
*
Authors to whom correspondence should be addressed.
Appl. Sci. 2024, 14(13), 5623; https://doi.org/10.3390/app14135623
Submission received: 7 April 2024 / Revised: 12 June 2024 / Accepted: 23 June 2024 / Published: 27 June 2024
(This article belongs to the Special Issue Recent Progress in Infrared Thermography)

Abstract

:
Crop canopy temperature has proven beneficial for qualitative and quantitative assessment of plants’ biotic and abiotic stresses. In this two-year study, water stress identification in okra crops was evaluated using thermal–RGB imaging and AI approaches. Experimental trials were developed for two irrigation types, sprinkler and flood, and four deficit treatment levels (100, 50, 75, and 25% crop evapotranspiration), replicated thrice. A total of 3200 thermal and RGB images acquired from different crop stages were processed using convolutional neural network architecture-based deep learning models (1) ResNet-50 and (2) MobileNetV2. On evaluation, the accuracy of water stress identification was higher with thermal imagery inputs (87.9% and 84.3%) compared to RGB imagery (78.6% and 74.1%) with ResNet-50 and MobileNetV2 models, respectively. In addition, irrigation treatment and levels had significant impact on yield and crop water use efficiency; the maximum yield of 10,666 kg ha−1 and crop water use efficiency of 1.16 kg m−3 was recorded for flood irrigation, while 9876 kg ha−1 and 1.24 kg m−3 were observed for sprinkler irrigation at 100% irrigation level. Developments and observations from this study not only suggest applications of thermal–RGB imagery with AI for water stress quantification but also developing and deploying automated irrigation systems for higher crop water use efficiency.

1. Introduction

Okra (Abelmoschus esculentus L.) is an economically important vegetable crop with a global annual production of 10.5 million tons per year, of which 60% is produced in India in the country’s coastal and central regions in particular [1]. Stress caused by biotic and abiotic factors induces physiological, developmental, and biochemical changes in a crop, leading to lower yield [2]. Various abiotic factors such as water stress (drought), waterlogging (excessive watering), extreme temperatures (cold, frost, and heat), salinity, and mineral toxicity can cause a more than 50% drop in crop yield [3]. This is because the plant metabolic processes are more sensitive to environmental changes during the active reproductive stage compared to the vegetative growth stage [4]. This eventually impedes physiological and morphological development and often forces early maturity and lower yields and quality [1,5]. Heat shock, or exposure to temperatures above ideal thresholds for even a brief duration, can disrupt physiological functions such as photosynthesis. It has already been reported that heat shock in the ranges of 2 min to 2 h reduces stomatal conductance, chlorophyll fluorescence, and photosynthesis rates [6].
Higher crop production either requires infinite availability of key resources such as land, water, and energy, which is not possible, or improved management of those finitely available resources, which is the only possibility. The need for the latter is further aggravated due to rising population, climate change, poor resource management, overexploitation of groundwater, pollution of freshwater bodies, land degradation, and economic water scarcity, among other factors. These factors can cause a reduction in global food production by 25% or more [7]. A critical factor of crop-water productivity is negatively impacted due to uneven rainfall during monsoon season and/or an inadequate supply of irrigation water post-monsoon. This affects vegetative growth and biomass accumulation of okra a great deal [8]. To mitigate this, surface irrigation, such as border and furrow irrigation, has been conventionally utilized but tends to have lower conveyance and application efficiency. Conversely, micro-irrigation techniques such as drips and sprinklers have provided better yield, water use efficiency, and economic returns [9,10,11]. Therefore, early detection of water stress and appropriate irrigation management is imperative for improved crop productivity and resource efficiency [12].
Crop water stress can be detected using several invasive techniques (gene expression, relative water content, equivalent water thickness, etc.) and non-invasive techniques (visible-NIR broadband and hyperspectral sensing and imaging, infrared thermometry, etc.). While invasive techniques provide accurate estimates, those are limitedly viable for real field applications due to lower sampling accuracies, highly skilled labor requirements, and increased time to obtain results. This often leads to missed opportunities for effective crop water management. Conversely, non-invasive techniques are relatively much more rapid and high-throughput in nature for qualitative and quantitative characterization of crop plants [13,14]. In order to obtain accurate estimates, visible-range RGB imaging necessitates precise leaf orientation with respect to the camera and specified illumination conditions, whereas thermal imaging depicts the emissivity profile of the crop canopy which is influenced by number of physiological parameters [15,16]. Studies on the applications of thermal imagery in agriculture for various uses such as stress identification and soil moisture estimation are in vogue. However, variations in wind speeds and relative humidity in addition to the high cost of sensors limit its wider application.
A number of computer vision techniques such as image classification, segmentation, and object detection have been widely adopted for image interpretation and enhancement, using methods like neural computing, deep learning, etc. Deep learning (DL) enables automated feature extraction without human intervention [17]. RGB imagery as inputs have been coupled with deep learning models in number of pre- and post-harvest agricultural applications [18]. One such study by Chandel et al. [17] consisted of the application of DL models (AlexNet, GoogLeNet, ResNet-50, and Inception V3, among others) with RGB imagery inputs for classifying water-stressed and non-stressed field crops, namely soybean, maize, wheat, and okra. So far, most computer vision techniques have used RGB images to predict crop water stress status [19,20], while thermal imagery is limitedly explored through DL. Recently, both thermal and RGB images have been used as inputs to identify water stress in wheat [12] using DL. ResNet-50 is widely recognized for its deep structure and residual learning skills, enabling it to effectively catch intricate patterns and complex traits in high-resolution images. This feature makes it well-suited for differentiating nuanced differences in thermal and RGB images that are essential for identifying water stress in crops. However, MobileNetV2 presents an efficient and effective architecture, specifically designed to maximize performance for devices that have limited processing capabilities. This is particularly crucial for on field applications in agriculture, where rapid evaluation and usage of mobile or hand-held devices are frequently necessary. The integration of these two models offers a wide range of practicality, striking a balance between profoundness and intricacy, while also ensuring effectiveness and expandability. Exploration in this direction is further needed to validate the implementation of thermal–RGB imagery and DL for non-invasive and water stress detection in other crops.
Conventionally, RGB imagery has been mostly used as inputs to DL models for crop characterization and phenotyping, including water stress. It has however been well reported that thermal imagery can be a better characterizer of water content in crops but has been limitedly explored with DL models for water stress prediction. Alleviating this gap is the goal of this study. In addition, most explored DL models are heavy in architecture and need heavy computing resources for deployment. Therefore, in addition to a heavy DL model, this study will evaluate a light DL model that can be deployed on a resource-constrained device such as a smartphone or microcomputer. These unexplored aspects will be applied to okra, which is an economical vegetable crop consumed worldwide. Okra has been limitedly explored to predict water stress using thermal–RGB imaging and AI techniques. This study is intended to create potential for prompt and efficient irrigation management; therefore, its specific objectives are (i) assessment of the performance of okra with different irrigation methods (flood and sprinkler) and levels with respect to crop evapotranspiration in terms of yield and water use efficiency and (ii) to identify water stress in okra using thermal–RGB imaging and AI techniques.

2. Materials and Methods

2.1. Experiment Details

A two-year field experiment on okra (F1 hybrid Kubera) was developed at the experimental farms (0.5 ha) of the ICAR-Central Institute of Agricultural Engineering (CIAE), Bhopal, India (77°24′7.50″ E, 23°18′56.91″ N) from February–June of 2019 and 2020. The average annual rainfall for the region is 1090 mm, and the soil is vertisol with a clay content ranging from 47–53%, and porosity ranging from 40.5–48.7% (moderate permeability). The experiment followed a strip-plot design with two irrigation types and four levels of irrigation treatments (based on crop evapotranspiration [ETc]: 100, 75, 50, and 25% ETc) in three replications (Figure 1), resulting in a total of 24 plots. Each plot had a length of 14 m and a width of 6 m, and they were separated by 3 m-wide buffer strips. The plant to plant spacing was 0.30 m and row to row spacing of 0.45 m was selected during plantation. For flood irrigation, water was transported through pipes and monitored using a water meter. For sprinkler irrigation, micro-sprinklers with a discharge rate of 110 L/h at an operating pressure of 2–2.5 kg/cm2 (Netafim, India) were used with 100% overlap. The application efficiency was identified in our prior evaluations as 65% for flood irrigation and 85% for sprinkler irrigation. ETc was determined using the pan crop coefficient derived from 10-year pan evaporation data. Typically for okra, the water demand increases between the sowing and fruiting stages and decreases afterwards until harvest. In 2019, the crop was planted on 15 February and harvested multiple times until 15 June. Meanwhile in 2020, the crop was planted on 22 February and harvested multiple times until 21 June. The crop water use efficiency was calculated per Equation (1). The impact of irrigation treatments on crop yield and water use efficiency were later evaluated using a pooled least significant difference test.
Crop water use efficiency (kg m−3) = pod yield (kg ha−1)/amount of water applied (m3 ha−1)

2.2. Data Collection Campaigns

2.2.1. Thermal–RGB Imagery

Thermal images of the experiment plots were acquired using a commercial imager (Krykard TCA 1950, Atandra Energy Private Limited, Chennai, India), positioned 1 m away from the plant and angled 45 degrees from the horizontal. Through a similar configuration, RGB images were acquired using a 18MP camera (Canon EOS 3000D, Tokyo, Japan). A total of 3200 images were captured (thermal: 1600 and RGB: 1600) from 25, 40, 60, and 75 days of sowing (DAS) in two seasons. These images were acquired on clear days between 11 a.m. and 1 p.m. Representative RGB and thermal images of stressed (@ 25% ETc, sprinkler irrigation) and non-stressed (@ 100% ETc, flood irrigation) okra plants are shown in Figure 2.

2.2.2. Ground Truth Data

Daily weather data of pan evaporation (mm/day), rainfall, maximum and minimum air temperature, relative humidity, and wind speed were collected from the meteorological observatory situated 500 m away. Root zone (0–20 cm) soil moisture content (SMC) was monitored using a soil moisture meter (ICT, MP-406, Armidale, Australia). These weather parameters were evaluated to study microclimate variations as a result of different irrigation treatments in okra. The determination of the relative water content (RWC) of leaves was conducted according to the specified protocol [12]. The ground data observations were utilized to classify and designate the images as crops that were experiencing stress and non-stress (Table 1).

2.3. Water Stress Identification

Thermal and RGB images were processed separately through two convolutional neural network-based DL models, MobileNetV2 and ResNet-50, to predict water-stressed and non-stressed crops. These models were selected for their successful application and extensive validation for various agricultural applications [12,18,23,24]. MobileNetV2 is a fast and efficient framework for lightweight networks and suitable for deployment on mobile and embedded systems. One significant benefit of MobileNetV2 is separation of convolutions, where standard convolutions are divided into depth-wise and point-wise convolutions. This enables a much finer granularity of feature extraction from imagery inputs. Next, one-by-one point-wise convolutions linearly combine the outputs of depth-wise convolutions. This factorization significantly reduces model size and computational costs by almost 8–9 times compared to traditional convolution separation methods [25,26].
ResNet-50 is a variant of ResNet architecture that has been pre-trained using a big dataset of over one million images from the ImageNet database. ResNet-50 comprises fifty layers and differentiates convolutions by depth. This design solves the vanishing gradient problem by creating a gradient flow shortcut. To alleviate concerns of overfitting with training data, ResNet-50 offers the ability to circumvent a CNN weight layer when it is determined to be redundant, using identity mapping. According to Theckedath and Sedamkar [27], this strategic halting method makes the model more generalizable and stable by avoiding overfitting and making it adaptable to different datasets. Most ResNet-50 models use batch normalization and double- or triple-layer skips with non-linearity (ReLU). ResNet-50 uses softmax at the final layer and sequences of convolutional blocks with average pooling for classification. Among the five convolutional layers of ResNet-50, the first layer, with 64 filters and a 7 × 7 kernel size, is applied to the input image, followed by a max-pooling layer with a stride length of 2. Layers in ResNet-50 are paired to match residual network connection patterns in layer 2 [28]. This thoroughness in architecture and layer organization makes ResNet-50 an efficient and robust DL model to solve complex image characterization.
The collected imagery datasets were divided into training (70%), validation (20%), and testing (10%) subsets. The DL model training involved identifying combinations of hyper-parameters from epochs (10, 20, 30, or 50) and batch sizes (8, 16, or 32) for a learning rate of 0.001, momentum of 0.9, and stochastic gradient descent with momentum (SGDM) solver. Additionally, the training and testing loss–accuracy graphs throughout the training process were monitored. By comparing these graphs, we ensured that the model’s performance on the validation dataset remained consistent with its performance on the training dataset. Specifically, a significant divergence between the training and validation losses or a plateau in validation accuracy while training accuracy continued to improve was observed. Model performances were evaluated through accuracy and loss curves for training and validation. These curves highlight the need and directions for model hyperparameter tuning, thereby ensuring that the model neither overfits nor underfits and achieves a balance that can be generalizable to an independent dataset. In addition, confusion matrices and metrics of the accuracy, precision, sensitivity, and F1 score of the test datasets were also computed [24,29]. These metrics are critical to agronomists and breeders and are calculated using true positives (TPs), true negatives (TNs), false positives (FPs), and false negatives (FNs). A TP represents correctly identified instances of a particular target class (stressed), a TN indicates correctly identified negative instances (non-stressed), and FPs are non-stressed cases incorrectly classified as stressed, while FNs represent stressed cases incorrectly classified as non-stressed. All the image processing steps are outlined in Figure 3.

3. Results and Discussion

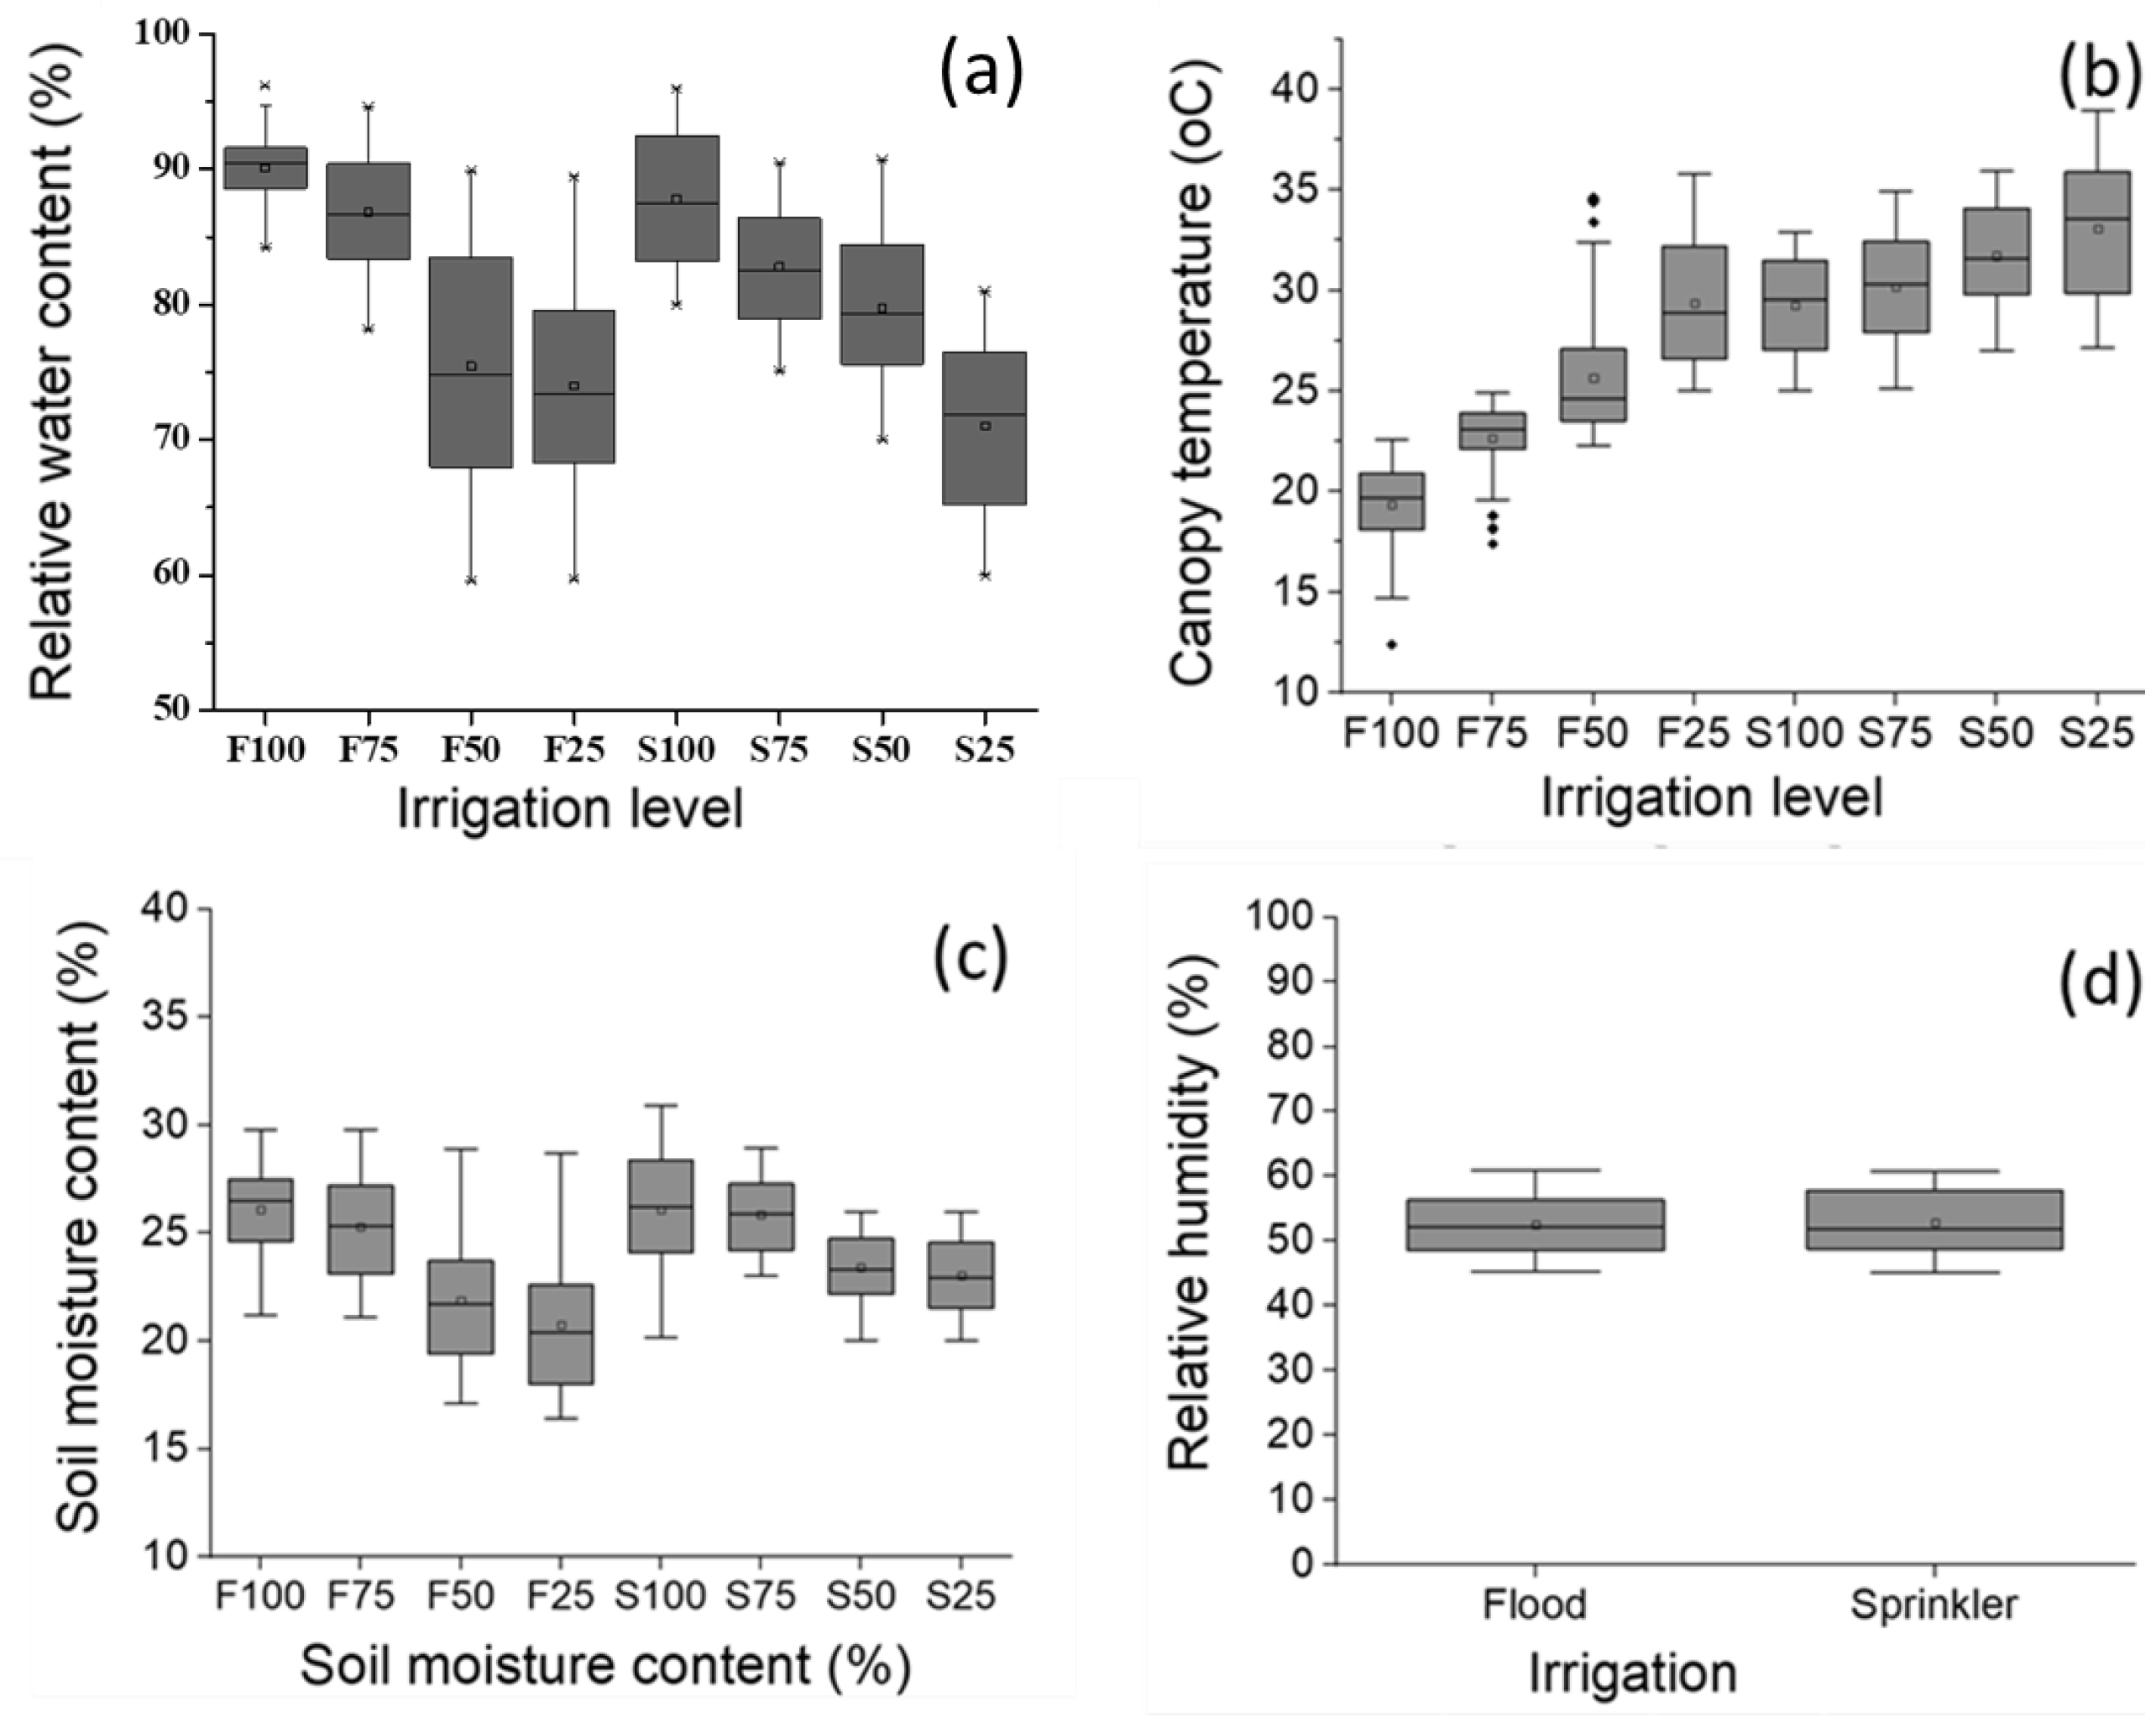
3.1. Crop Physiological Responses to Irrigation

The values of soil moisture content, relative water content, canopy temperature, and relative humidity recorded in different irrigation methods and levels over the two years are shown in Figure 4. The average values (±SD) of relative water content (Figure 4a) were 90 ± 2.4%, 86 ± 4.3%, 75 ± 9.0%, and 74 ± 7.8% in flood irrigation and 86 ± 2.9%, 82 ± 1.8%, 75 ± 2.9%, and 71 ± 2.2% in sprinkler irrigation for 100, 75, 50, and 25% ETc, respectively. The canopy temperatures (Figure 4b) obtained from thermal imagery were higher in sprinkler irrigation treatments compared to corresponding flood irrigation treatments. Over the two years, average (±SD) canopy temperature with 100% ETc was 20 ± 2 °C and 28 ± 2.4 °C in flood and sprinkler irrigation, respectively. At the same time, canopy temperature of 29 ± 3 °C and 33 ± 3.4 °C were recorded in 25% ETc treatment in flood and sprinkler irrigation, respectively. Similarly, average values (±SD) of soil moisture content (Figure 4c) were 26 ± 2.2, 25.2 ± 2.5, 22 ± 3.0, 21 ± 3.0% in flood irrigation and 26 ± 2.9, 25 ± 1.7, 23 ± 1.5, 23 ± 1.7% in sprinkler irrigation for corresponding levels of crop evapotranspiration. Relative humidity varied from 26 to 55% across the study period. Statistical analysis of the above variables revealed significant effect of irrigation method as well as irrigation level (p = 0.05). Overall, higher values of canopy temperature and lower values of soil moisture content and relative water content were recorded in stressed plants and vice-versa for non-stressed plants.

3.2. Impact of Irrigation on Yield and Crop Water Use Efficiency

The effect of irrigation levels, as well as irrigation method, was significant on okra yield (p = 0.05, Figure 5, Table 2). Among the different treatments, the maximum okra yield (10,666 kg ha−1) was recorded under flood irrigation with 100% ETc followed by sprinkler irrigation (9876 kg ha−1) at a similar ETc level (Figure 5, Table 2). The lowest yield (6086 kg ha−1) was recorded under sprinkler irrigation at 25% ETc. Similar observations were recorded for the transplanted rice plants, in which higher transpiration under flood irrigation led to higher yields compared to drip-irrigated rice, which suffered under higher canopy temperatures [30]. Especially during hot summers, canopy and/or air temperatures above 40 °C might have led to dead flowers, eventually leading to lower okra yields. Sprinkler irrigation is also responsible for exposing crops to sudden temperature fluctuations that can induce temperature shock under high temperature conditions, eventually leading to dead blooms. A significant yield reduction in okra under water stress conditions has also been reported earlier [5], when it was observed that water stress at lower temperatures can lead to lower seed pod weight compared to no water stress at higher temperatures. An earlier study [31] suggested non-significant differences in okra yield among basin, sprinkler, and furrow irrigation methods, though level of irrigation significantly affected fruit yield. Furthermore, irrigating okra plants every seven days was reported to influence morphological parameters, such as plant height, number of leaves, leaf area, and flowering initiation, which eventually resulted in highest number of fruits per plant and the highest yield [32,33].
Among the irrigation levels, okra yield at 100% ETc with sprinkler irrigation and 75% ETc with flood irrigation were highly similar. Similarly, water use efficiency was highest (3.3 kg m−3) at a 25% ETc level with flood irrigation, followed by the same ETc level with sprinkler irrigation (3.06 kg m−3) (Figure 5). At lower levels of irrigation (50 and 25% ETc), water use efficiency was higher in flood irrigation than sprinkler irrigation. Higher water use efficiency for low-frequency irrigation (higher allowable depletion) in flood irrigation was also observed by [31]. Overall, water use efficiency under flood irrigation was higher compared with sprinkler irrigation across all the treatments. Significant effects of irrigation level on fruit diameter and length and water use efficiency of okra under drip irrigation was also reported by [34].

3.3. Water Stress Identification

Among various combinations of epoch (10, 20, 30, 50) and batch sizes (8, 16, 32), both DL models, (ResNet-50 and MobileNetV2), demonstrated superior performance at 30 epochs and 16 batch size combinations with both RGB and thermal imagery inputs (Table 3). In the case of ResNet-50, as the number of epochs increased from 10 to 30, the model accuracy improved. However, beyond 30 epochs, overfitting and a decline in accuracy was observed with both RGB and thermal imagery inputs. Similarly, an increase in batch size from 8 (72.4%) to 16 (78.6%) enhanced testing accuracy, but a further increment (32 batch size) resulted in reduced (76.2%) accuracy with RGB imagery. The performance of ResNet-50 surpassed that of MobileNetV2, as it achieved an accuracy of 87.9% for thermal imagery and 78.6% for RGB imagery on testing dataset. A similar trend was noted with thermal imagery inputs, though the prediction accuracy was higher compared to that of RGB imagery inputs. The training and validation plots of ResNet-50 and MobileNetV2 models for both RGB and thermal imagery inputs are shown in Figure 6 while pertaining confusion matrices are shown in Figure 7. These figures indicate that ResNet-50 avoided overfitting and were robust on both RGB and thermal imagery datasets.
From the confusion matrices pertaining to the testing dataset, the optimized ResNet-50 model (batch size 16, epoch 30) was able to successfully classify 45 images as non-stressed out of 57 images and misclassified 12 images from the thermal imagery dataset. In addition, the model successfully identified 57 water-stressed images out of 67 and misclassified 10 images from the RGB imagery dataset. Similarly, in the testing dataset of thermal images, ResNet-50 correctly classified 61 non-stressed images out of 67 and accurately identified 48 out of 57 stress images (Figure 7). The accuracy, precision, sensitivity, and recall metrics obtained for the RGB imagery inputs using ResNet-50 model were 82.3%, 78.9%, 81.8%, and 80.3%, respectively, whereas the same for thermal imagery inputs were 87.9%, 91%, 87.1%, and 89.0%, respectively. Similarly, for MobileNetV2 model, maximum accuracy was recorded for epoch 30 and batch size 16 for RGB as well as thermal imagery inputs. The testing accuracy, precision, recall, and F1 score were 74.1%, 73.9%, 80.6%, and 77.1%, respectively, for RGB images and 84.3%, 84.5%, 86.9%, and 85.7%, respectively, for thermal imagery (Table 3). However, MobileNetV2 exhibited a notable difference in training and validation loss, indicating overfitting (Figure 6). MobileNetV2 utilizes an inverse residual structure and linear bottleneck structure to effectively decrease the computational load of convolution. The input for this module is a low-dimensional compressed representation, which is then enlarged to high dimensions and filtered using a lightweight depth-wise convolution to achieve the desired effect. After that, the features are projected back to a low-dimensional representation using a linear convolution for further analysis [35]. The architecture of this system is favored above others owing to its straightforward design and effective use of memory. The computational and storage requirements of this architecture are lower than those of ResNet-50 due to its smaller number of parameters. This could be beneficial in creating a mobile application that utilizes the MobileNetV2 model for automatically detecting and classifying plant stress. This would enable users or farmers to identify stress promptly, even with minimal knowledge of the subject. Similarly, MobileNetV2 could classify 54 non-stressed images and 38 stressed images out of 73 and 51 RGB images, respectively. Moreover, with thermal imagery, 60 images were correctly classified as non-stressed and 47 as stressed out of a total of 71 and 56 images in each class (Figure 7).
ResNet-50’s utilization of residual structures employ skip connections to mitigate the vanishing gradient, unlike MobileNetV2 or other deeper network-based models, which is an advantage [36]. By employing this strategy, the network transforms the identity map into a residual fit, thereby bypassing the necessity for the layers to learn the underlying mapping themselves. Moreover, ResNet-50 efficiently addresses the degradation problem by fragmenting large convolution filters into smaller ones and reducing training parameters without sacrificing performance. In addition, ResNet-50 achieves greater depth due to inclusion of a global pooling layer rather than fully connected layers [37]. Conversely, MobileNetV2 has a much simpler architecture, especially designed to be implemented on micro- or mobile computers. MobileNetV2 has been effectively used for classification of fruit images [38], seeds [39], maize seed varieties [40], etc. Comparable performance in biotic stress prediction on coffee leaves by ResNet-50 (97%) and MobileNetV2 (96%) has been reported by [41].
CNNs are being increasingly used in agricultural applications, particularly for crop phenotyping. Their ability to simulate complex agricultural processes is due to their capacity to identify and extract data patterns [42]. Both the ResNet-50 and MobileNetV2 models accurately predicted the stress levels of crops using both thermal and RGB images. Water stress lowers the levels of chlorophyll and carotenoids, causing changes in leaf coloring. This shift in color may be detected using RGB images, which have been shown to provide reliable results [43]. Thermal imaging, as compared to RGB imagery, provides a more thorough estimate of crop water stress by assessing canopy temperature, which is influenced by emissivity patterns in a proportionate manner [44,45]. This may lead to relatively lower accuracy of water stress detection using RGB images (74–79%) over thermal imagery (84–88%). In a study by [44], a higher (89%) accuracy of wheat ear counting with thermal imagery over RGB imagery (82%) was found using DCNN models. For identifying water stress in wheat, ResNet-50 had the highest accuracy among the deep learning models [12]. Convolutional neural network (CNN) models were utilized to assess the thermal images and classify water stress in maize. The study classified maize plants into well-irrigated, moderately irrigated, and water-stressed treatments, achieving an impressive total accuracy of 89% [19]. This study contributes to the advancement of water stress identification using multidimensional data inputs that would enhance robustness across various agro-climatic conditions.

4. Conclusions

This study evaluated the feasibility of thermal–RGB imagery and computer vision techniques to identify water stress in okra in a two-year field study. Observations indicated a significant effect of irrigation method as well as the level of irrigation on okra yield and water use efficiency. During high temperatures in summer, flood irrigation may have led to favourable soil moisture and canopy temperature, resulting in higher yield over sprinkler irrigation. For the combination of epochs (30) and batch size (16), both (ResNet-50 and MobileNetV2) deep learning models exhibited optimal results for water stress identification. The accuracy of water stress identification was higher using thermal imagery inputs (87 and 84%) over RGB imagery inputs (78 and 74%) for the DL models (ResNet-50 and MobileNetV2). A maximum yield of 10,666 kg ha−1 and crop water use efficiency of 1.16 kg m−3 was recorded for flood irrigation, while 9876 kg ha−1 and 1.24 kg m−3, respectively, for sprinkler irrigation at a 100% irrigation level was recorded.
While ResNet-50 was computationally accurate, MobileNetV2 was computationally efficient. Thus, each is fit for different computational resources. MobileNetV2 could be more handily implemented in microcomputers or embedded systems to be deployed for precision irrigation management in agriculture.

Author Contributions

Conceptualization, Y.A.R. and N.S.C.; data curation, K.D.; funding acquisition, Y.A.R. and N.S.C.; methodology, N.S.C., K.D. and A.S.; project administration, V.P.C. and K.V.R.R.; resources, Y.A.R. and A.K.C.; software, S.K.S., K.D., A.S. and M.M.; supervision, V.P.C.; validation, K.D., A.S. and M.M.; writing—original draft, Y.A.R., N.S.C. and A.K.C.; writing—review and editing, A.K.C. All authors have read and agreed to the published version of the manuscript.

Funding

This research was funded by the Indian Council of Agricultural Research ICAR-CIAE-824—project, Govt. of India, New Delhi.

Institutional Review Board Statement

Not applicable.

Informed Consent Statement

Not applicable.

Data Availability Statement

Data will be made available on request.

Acknowledgments

Authors would like to acknowledge the technical and farm management team for their assistance in maintaining experimental plots and harvesting.

Conflicts of Interest

The authors declare no conflicts of interest.

References

  1. Wakchaure, G.C.; Minhas, P.S.; Kumar, S.; Khapte, P.S.; Dalvi, S.G.; Rane, J.; Reddy, K.S. Pod quality, yields responses and water productivity of okra (Abelmoschus esculentus L.) as affected by plant growth regulators and deficit irrigation. Agric. Water Manag. 2023, 282, 108267. [Google Scholar] [CrossRef]
  2. Chandel, N.S.; Chakraborty, S.K.; Chandel, A.K.; Dubey, K.; Subeesh, A.; Jat, D.; Rajwade, Y.A. State-of-the-art AI-enabled mobile device for real-time water stress detection of field crops. Eng. Appl. Artif. Intell. 2024, 131, 107863. [Google Scholar] [CrossRef]
  3. Gull, A.; Lone, A.A.; Wani, N.U.I. Biotic and abiotic stresses in plants. In Abiotic and Biotic Stress in Plants; IntechOpen: London, UK, 2019; pp. 1–19. [Google Scholar] [CrossRef]
  4. Adejumo, S.A.; Ezeh, O.S.; Mur, L.A. Okra growth and drought tolerance when exposed to water regimes at different growth stages. Int. J. Veg. Sci. 2019, 25, 226–258. [Google Scholar] [CrossRef]
  5. Gunawardhana, M.D.M.; De Silva, C.S. Impact of temperature and water stress on growth yield and related biochemical parameters of okra. J. Trop. Agric. 2011, 23, 77–84. [Google Scholar] [CrossRef]
  6. Mercado Álvarez, K.; Bertero, H.D.; Paytas, M.J.; Ploschuk, E.L. Mesophyll conductance modulates photosynthetic rate in cotton crops exposed to heat stress under field conditions. J. Agron. Crop Sci. 2022, 208, 53–64. [Google Scholar] [CrossRef]
  7. McKenzie, F.C.; Williams, J. Sustainable food production: Constraints, challenges and choices by 2050. Food Secur. 2015, 7, 221–233. [Google Scholar] [CrossRef]
  8. Bhatt, R.M.; Rao, N.S. Influence of pod load on response of okra to water stress. Indian J. Plant Physiol. 2005, 10, 54. [Google Scholar]
  9. Rajwade, Y.A.; Swain, D.K.; Tiwari, K.N.; Singh Bhadoria, P.B. Grain yield, water productivity, and soil nitrogen dynamics in drip irrigated rice under varying nitrogen rates. J. Agron. 2018, 110, 868–878. [Google Scholar] [CrossRef]
  10. Zou, H.; Fan, J.; Zhang, F.; Xiang, Y.; Wu, L.; Yan, S. Optimization of drip irrigation and fertilization regimes for high grain yield, crop water productivity and economic benefits of spring maize in Northwest China. Agric. Water Manag. 2020, 230, 105986. [Google Scholar] [CrossRef]
  11. Yuan, Y.; Lin, F.; Maucieri, C.; Zhang, Y. Efficient irrigation methods and optimal nitrogen dose to enhance wheat yield, inputs efficiency and economic benefits in the North China Plain. Agronomy 2022, 12, 273. [Google Scholar] [CrossRef]
  12. Chandel, N.S.; Rajwade, Y.A.; Dubey, K.; Chandel, A.K.; Subeesh, A.; Tiwari, M.K. Water stress identification of winter wheat crop with state-of-the-art AI techniques and high-resolution thermal-RGB imagery. Plants 2022, 11, 3344. [Google Scholar] [CrossRef] [PubMed]
  13. Chandel, N.S.; Rajwade, Y.A.; Golhani, K.; Tiwari, P.S.; Dubey, K.; Jat, D. Canopy spectral reflectance for crop water stress assessment in wheat (Triticum aestivum L.). Irrig. Drain. 2021, 70, 321–331. [Google Scholar] [CrossRef]
  14. Katsoulas, N.; Elvanidi, A.; Ferentinos, K.P.; KaciraM, B.T.; Kittas, C. Crop reflectance monitoring as a tool for water stress detection in greenhouses: A review. Biosyst. Eng. 2016, 151, 374–398. [Google Scholar] [CrossRef]
  15. Chandel, A.K.; Khot, L.R.; Osroosh, Y.; Peters, T.R. Thermal-RGB Imager Derived in-Field Apple Surface Temperature Estimates for Sunburn Management. Agric. For. Meteorol. 2018, 253, 132–140. [Google Scholar] [CrossRef]
  16. Chandel, A.K.; Khot, L.R.; Molaei, B.; Peters, R.T.; Stöckle, C.O.; Jacoby, P.W. High-Resolution Spatiotemporal Water Use Mapping of Surface and Direct-Root-Zone Drip-Irrigated Grapevines Using Uas-Based Thermal and Multispectral Remote Sensing. Remote Sens. 2021, 13, 954. [Google Scholar] [CrossRef]
  17. Chandel, N.S.; Chakraborty, S.K.; Rajwade, Y.A.; Dubey, K.; Tiwari, M.K.; Jat, D. Identifying Crop Water Stress Using Deep Learning Models. Neural Comput. Appl. 2021, 33, 5353–5367. [Google Scholar] [CrossRef]
  18. Chakraborty, S.K.; Chandel, N.S.; Jat, D.; Tiwari, M.K.; Rajwade, Y.A.; Subeesh, A. Deep learning approaches and interventions for futuristic engineering in agriculture. Neural Comput. Appl. 2022, 34, 20539–20573. [Google Scholar] [CrossRef]
  19. Zhuang, S.; Wang, P.; Jiang, B.; Li, M.; Gong, Z. Early Detection of Water Stress in Maize Based on Digital Images. Comput. Electron. Agric. 2017, 140, 461–468. [Google Scholar] [CrossRef]
  20. An, J.; Li, W.; Li, M.; Cui, S.; Yue, H. Identification and Classification of Maize Drought Stress Using Deep Convolutional Neural Network. Symmetry 2019, 11, 256. [Google Scholar] [CrossRef]
  21. Budania, Y.K.; Khichar, M.L.; Dhaiya, H.S.; Dhankhar, S.; Niwas, R. Agrometeorological aspects of okra (Abelmoschus esculebtus) in arid subtropical regions of Haryana. Ann. Plant Soil Res. 2018, 20, 363–370. [Google Scholar]
  22. Bhatt, R.M.; Rao, N.K. Morpho-physiological response of okra (Abelmoschus esculentum L.) genotypes to moisture stress during reproductive stage. Indian J. Horti. 2005, 62, 336–339. [Google Scholar]
  23. Rajwade, Y.A.; Chandel, N.S.; Dubey, K.; Anakkallan, S.; Upender, K.; Jat, D. Assessment of water stress in rainfed maize using RGB and thermal imagery. Arab. J. Geosci. 2023, 16, 119. [Google Scholar] [CrossRef]
  24. Modi, R.U.; Chandel, A.K.; Chandel, N.S.; Dubey, K.; Subeesh, A.; Singh, A.K.; Jat, D.; Kancheti, M. State-of-the-art computer vision techniques for automated sugarcane lodging classification. Field Crops Res. 2023, 291, 108797. [Google Scholar] [CrossRef]
  25. Howard, A.G.; Zhu, M.; Chen, B.; Kalenichenko, D.; Wang, W.; Weyand, T.; Andreetto, M.; Adam, H. MobileNets: Efficient convolutional neural networks for mobile vision applications. arXiv 2017, arXiv:1704.04861. [Google Scholar]
  26. Bi, C.; Wang, J.; Duan, Y. MobileNet Based Apple Leaf Diseases Identification. Mob. Netw. Appl. 2022, 27, 172–180. [Google Scholar] [CrossRef]
  27. Theckedath, D.; Sedamkar, R.R. Detecting affect states using VGG16, ResNet50 and SE-ResNet50 networks. SN Comput. Sci. 2020, 1, 79. [Google Scholar] [CrossRef]
  28. Ikechukwu, A.V.; Murali, S.; Deepu, R.; Shivamurthy, R.C. ResNet-50 vs VGG-19 vs training from scratch: A comparative analysis of the segmentation and classification of Pneumonia from chest X-ray images. Glob. Transit. Proc. 2021, 2, 375–381. [Google Scholar] [CrossRef]
  29. Subeesh, A.; Bhole, S.; Singh, K.; Chandel, N.S.; Rajwade, Y.A.; Rao, K.V.R.; Kumar, S.P.; Jat, D. Deep convolutional neural network models for weed detection in polyhouse grown bell peppers. Artif. Intell. Agric. 2022, 6, 47–54. [Google Scholar] [CrossRef]
  30. Rajwade, Y.A.; Swain, D.K.; Tiwari, K.N. Effect of irrigation method on adaptation capacity of rice to climate change in subtropical India. Int. J. Plant Prod. 2018, 12, 203–217. [Google Scholar] [CrossRef]
  31. Home, P.G.; Panda, R.K.; Kar, S. Effect of method and scheduling of irrigation on water and nitrogen use efficiencies of Okra (Abelmoschus esculentus). Agric. Water Manag. 2002, 55, 159–170. [Google Scholar] [CrossRef]
  32. Ghannad, M.; Madani, H.; Darvishi, H.H. Effect of different sowing times, irrigation intervals and sowing methods on okra (Abelmoschus esculentus L. Moench). Int. J. Farm Allied Sci. 2014, 3, 683–689. [Google Scholar]
  33. Ghannad, M.; Madani, H.; Darvishi, H.H. The response of okra crop to sowing times, interval and sowing methods in shahrood region. Intl. J. Agric. Crop Sci. 2014, 7, 676–682. [Google Scholar]
  34. Farias, D.B.D.S.; da Silva, P.S.O.; Lucas, A.A.T.; de Freitas, M.I.; de Jesus Santos, T.; Fontes, P.T.N.; de Oliveira, L.F.G., Jr. Physiological and productive parameters of the okra under irrigation levels. Sci. Hortic. 2019, 252, 1–6. [Google Scholar] [CrossRef]
  35. Sandler, M.; Howard, A.; Zhu, M.; Zhmoginov, A.; Chen, L.C. Mobilenetv2: Inverted residuals and linear bottlenecks. In Proceedings of the IEEE Conference on Computer Vision and Pattern Recognition 2018, Salt Lake City, UT, USA, 18–23 June 2018; 23 June 2018; pp. 4510–4520. [Google Scholar]
  36. Feng, X.; Gao, X.; Luo, L. A ResNet50-based method for classifying surface defects in hot-rolled strip steel. Mathematics 2021, 9, 2359. [Google Scholar] [CrossRef]
  37. He, K.; Zhang, X.; Ren, S.; Sun, J. Deep residual learning for image recognition. In Proceedings of the IEEE Conference on Computer Vision and Pattern Recognition 2016, Las Vegas, NV, USA, 27–30 June 2016; pp. 770–778. [Google Scholar]
  38. Gulzar, Y. Fruit image classification model based on MobileNetV2 with deep transfer learning technique. Sustainability 2023, 15, 1906. [Google Scholar] [CrossRef]
  39. Hamid, Y.; Wani, S.; Soomro, A.B.; Alwan, A.A.; Gulzar, Y. Smart seed classification system based on MobileNetV2 architecture. In Proceedings of the 2022 2nd International Conference on Computing and Information Technology (ICCIT), Tabuk, Saudi Arabia, 25–27 January 2022; pp. 217–222. [Google Scholar]
  40. Ma, R.; Wang, J.; Zhao, W.; Guo, H.; Dai, D.; Yun, Y.; Li, L.; Hao, F.; Bai, J.; Ma, D. Identification of maize seed varieties using MobileNetV2 with improved attention mechanism CBAM. Agriculture 2022, 13, 11. [Google Scholar] [CrossRef]
  41. Esgario, J.G.; Krohling, R.A.; Ventura, J.A. Deep learning for classification and severity estimation of coffee leaf biotic stress. Comput. Electron. Agric. 2020, 169, 105162. [Google Scholar] [CrossRef]
  42. Taheri-Garavand, A.; Rezaei Nejad, A.; Fanourakis, D.; Fatahi, S.; Ahmadi Majd, M. Employment of Artificial Neural Networks for Non-Invasive Estimation of Leaf Water Status Using Color Features: A Case Study in Spathiphyllum wallisii. Acta Physiol. Plant. 2021, 43, 78. [Google Scholar] [CrossRef]
  43. Zomorrodi, N.; Rezaei Nejad, A.; Mousavi-Fard, S.; Feizi, H.; Tsaniklidis, G.; Fanourakis, D. Potency of Titanium Dioxide Nanoparticles, Sodium Hydrogen Sulfide and Salicylic Acid in Ameliorating the Depressive Effects of Water Deficit on Periwinkle Ornamental Quality. Horticulturae 2022, 8, 675. [Google Scholar] [CrossRef]
  44. Grbovic, Z.; Panic, M.; Marko, O.; Brdar, S.; Crnojevic, V. Wheat Ear Detection in RGB and Thermal Images Using Deep Neural Networks. Environments 2019, 11, 13. [Google Scholar]
  45. de Melo, L.L.; de Melo, V.G.M.L.; Marques, P.A.A.; Frizzone, J.A.; Coelho, R.D.; Romero, R.A.F.; da Silva Barros, T.H. Deep Learning for Identification of Water Deficits in Sugarcane Based on Thermal Images. Agric. Water Manag. 2022, 272, 107820. [Google Scholar] [CrossRef]
Figure 1. Experimental site and plot layout of irrigation type and treatment levels.
Applsci 14 05623 g001
Figure 2. Representative RGB (a,b) and thermal imagery (c,d) of okra under stress (25% ETc, sprinkler irrigation) and non-stress condition (100% ETc, flood irrigation).
Applsci 14 05623 g002
Figure 3. Process flow chart for data acquisition, and processing for okra water stress identification from thermal–RGB imagery and deep learning models.
Applsci 14 05623 g003
Figure 4. Relative water content (a), canopy temperature (b), soil moisture content (c), and relative humidity (d) under different irrigation levels observed during okra growing season over two years. F-Flood and S-sprinkler irrigation method at 100, 75, 50, and 25% crop evapotranspiration.
Applsci 14 05623 g004
Figure 5. Okra yield ((a), kg ha−1) and water use efficiency ((b), kg m−3) under flood (F) and sprinkler (S) irrigation methods with different levels irrigation (100, 75, 50, and 25% crop evapotranspiration).
Applsci 14 05623 g005
Figure 6. Accuracy and loss plot of ResNet-50 and MobileNetV2 models for water stress identification in okra using (a) RGB and (b) thermal imagery.
Applsci 14 05623 g006
Figure 7. Confusion matrix of ResNet-50 (a,b) and MobileNetV2 (c,d) for identification of water stress using RGB and thermal imagery inputs.
Applsci 14 05623 g007
Table 1. Ground truth data labelling for stress and non-stress.
Crop LabelParameterReference
StressRelative water content <80%
Canopy temperature; >30 °C
Soil moisture content < 33% (v/v)
[12,21,22]
Non-StressNeither of the “stressed” conditions
Table 2. Results of least significant difference tests between okra yield and water use efficiency observed under different irrigation treatments.
Irrigation Type/Level100% ET75% ET50% ET25% ETMean
Sprinkler irrigation98767765660560867583
Flood irrigation10,6669751915875869290
Mean10,271875878826836
TypeLevelType × Level
Standard error of mean 110.881.0135.3
Least significant difference (0.05)457.3222.5497.0
Table 3. Training and testing accuracies of ResNet-50 and MobileNetV2 models with for RGB and thermal imagery inputs.
HyperparametersAccuracies (%) for ResNet-50 ModelAccuracies (%) for MobileNetV2 Model
RGB ImageryThermal ImageryRGB ImageryThermal Imagery
EpochBatch SizeTraining Testing Training Testing Training Testing Training Testing
10874.972.483.077.466.864.877.474.2
101676.773.186.678.068.765.780.376.6
103275.272.085.376.965.967.979.775.3
20878.474.592.578.569.668.684.578.7
201676.077.593.780.668.870.888.182.3
203277.676.093.078.167.768.486.078.4
30878.076.496.479.670.271.589.684.5
301682.378.696.887.970.974.190.784.3
303280.577.395.981.669.073.590.085.7
50875.675.093.575.365.767.988.577.0
501678.376.594.279.367.972.486.179.5
503277.176.293.077.868.669.885.778.7
Disclaimer/Publisher’s Note: The statements, opinions and data contained in all publications are solely those of the individual author(s) and contributor(s) and not of MDPI and/or the editor(s). MDPI and/or the editor(s) disclaim responsibility for any injury to people or property resulting from any ideas, methods, instructions or products referred to in the content.

