Article

Impact of Biomass Burning, Wildfires, and Wind Events on Aerosol Optical Depth: Implications for Climate Change

by
Tymon Zielinski
1,
Amandine Willems
2,* and
Mathilde Lartigaud
2
1
Institute of Oceanology Polish Academy of Sciences, 81-712 Sopot, Poland
2
Seatech, University of Toulon, 83130 Toulon, France
*
Author to whom correspondence should be addressed.
Appl. Sci. 2024, 14(13), 5633; https://doi.org/10.3390/app14135633
Submission received: 29 May 2024 / Revised: 20 June 2024 / Accepted: 26 June 2024 / Published: 27 June 2024
(This article belongs to the Special Issue Aerosol Measurement, Properties and Its Impacts)

Abstract

:
In this article, we describe multiannual variations of the atmospheric aerosol optical depth values in the widely understood area of the Baltic Sea. We present the trends in the changes and depict unusual aerosol situations. As a result of analyses, we focus on 2019, since unusually high values of aerosol optical depth were recorded in several stations around the Baltic. We match the high aerosol levels with an unusually high number of wildfires across Europe in spring and summer, which emitted large quantities of aerosols into the atmosphere that were distributed over vast European areas in part by the wind. We then connect this case with the climate change consequences. Since aerosols influence the radiative budget of the planet by directly affecting the atmospheric radiation budget, it is obvious that human well-being is in danger due to wildfires, as well as from the atmospheric perspective. Climate change will lead to more frequent fires; thus, humans need to develop solutions to decrease the risk of fire outbreaks.

1. Introduction

There is no doubt that atmospheric aerosols, which are usually suspensions of solid and/or liquid particles in a gas mixture, are among the most variable components of the Earth’s atmosphere [1,2]. One way to monitor them is through their aerosol optical depth (AOD).
Aerosol concentrations vary in the atmosphere due to both natural and anthropogenic processes. For the natural sources, we usually refer to sea salt and dust production, while anthropogenic aerosol particles are usually a result of various combustion processes, and these particles have increased the aerosol levels over the last couple of centuries [3,4,5,6,7].
Particle size is one of the most important parameters. Particle diameters typically range from nanometers to around 100 μm. We can define different types of particles according to their diameters: coarse particles have a diameter exceeding 1.0 μm, fine particles from 1.0 to 0.01 μm, and ultrafine particles are particles with diameters below 0.01 μm. Moreover, fine particles are divided into 2 categories: accumulation mode particles (sizes between 0.1 and 1.0 μm) and Aitken mode particles (sizes between 0.01 and 0.1 μm diameter). For each type of particle, the production process is different.
Coarse particles are produced as a result of both natural and anthropogenic processes and are introduced directly to the atmosphere. Sea salt particles (also named coarse aerosols) are among the most abundant particles from natural production, while anthropogenic coarse particles are produced through the abrasion of machinery, road traffic, and in industrial and agricultural processes. The accumulation of aerosols occurs mainly as a result of coagulation and condensation of vapors onto particles, resulting in particle growth. They can reach the atmosphere directly, usually as a result of incomplete combustion of coal, wood, or oil. Thus, they contain organic matter, as well as sulfates, nitrates, and ammonium. Combustion processes also produce Aitken mode particles in conditions when the conversion from ambient temperature gas-to-particle is observed.
Ultrafine particles are produced by conversion processes of gas-to-particle. Both fine and coarse particles are impacted and created by burning biomass (BB), which is the burning of living and dead vegetation. It includes the human-initiated burning of vegetation for land clearing and land-use change, as well as natural lightning-induced fires [8].
Another phenomenon, called nucleation, is also a source of particle formation, involving formation of aerosol particles from the gas phase with core formation. There are two types of nucleation events: long-term, during daytime for 1 to 8 h, and short-term, occurring throughout the year from minutes to 1 h. Over the Baltic Sea, these phenomena are enhanced during spring and autumn, with high solar radiation and air mass transport from the north or northwest, depending on the area (coastal or continental) [9].
One particular feature of aerosols is that they absorb and scatter solar radiation. This feature is the base of the AOD measurement that gives us a ratio of the concentration of aerosols in the atmosphere that we will use during this study. The AOD depends on the wavelength used to record data, and a common reference is around 500 nm. Because of this particular property (also called direct effect), aerosols modify solar radiation and pose a crucial impact on climate. Additionally, they have an impact on the climate by modifying microphysics and, thus, the radiative properties of clouds (cloudiness and cloud lifetime), the so-called indirect effect [3,10,11].
Aerosols are responsible for atmospheric visibility levels. They can also have an impact on UV radiation levels [10], as well as photochemistry in the planetary boundary layer. Various aerosol particles (different chemical compositions) can absorb solar radiation in the atmosphere, which results in cooling of the surface and/or atmospheric warming [3,12]. Due to significant radiative forcing on the surface, aerosols are important locally (regional weather), but they also influence global climate patterns [3,12]. Therefore, atmospheric aerosol particles are key players in the Earth’s energy budget and thus in climate patterns.
Remote aerosol sources contribute greatly to the pollution of low-emission regions via long-range transport. These advections further impact local climate patterns [13,14,15,16]. Local emissions and the long-range transport of atmospheric aerosols across regions or even continents have a pronounced impact on air quality and living organisms’ health [13,14,15,16]. The Arctic is among the most prominent examples. The extreme biomass burning episodes, which occurred in Canada and Siberia, and which affected the summer levels of AODs over Svalbard and the European Arctic between 20013 and 2019, have been reported by numerous researchers [17,18,19,20,21,22,23].
In all cases, the authors show that the extreme wildfires were due to climate change consequences, such as dryness of the soil, as well as intensive human activities. The reports show that these events are becoming a usual summer problem for the Arctic region and that these episodes may become more pronounced in comparison to the so-called Arctic haze phenomenon, which is a springtime haze in the atmosphere at high latitudes in the Arctic due to advections of anthropogenic air pollution.
The examples above involve both natural sources, such as sea salt particles and emissions of volatile organic compounds from plants or wildfires, which sometimes may also be attributed to anthropogenic aerosol sources, which are mainly associated with fossil fuel combustion to generate electricity, various industries, households, and liquid fuel combustion for transport energy purposes. Transportation-related aerosol particles can have local and regional importance, while massive industrial activities (such as those in Siberia) can influence atmospheric conditions globally.
Biomass burning aerosols are difficult to qualify since they originate from wildfires, which, in turn, can be of both natural and anthropogenic origins. However, more frequent, massive, and long-lasting wildfire outbreaks in various parts of the globe are related to the climate change consequences, mainly a lack of precipitation and the dryness of soils.
Uncertainty of the role of aerosols regarding the radiative and climate effects is still the most significant question in climate change scenarios due to particle emissions and precursor emissions, their mass concentrations, size distribution, and the cloud fraction [3,24,25,26]. This uncertainty is very dependent on the region of the planet [3].
To better describe climate change and to make climate change scenarios more accurate, we need to reduce aerosol-related uncertainties. In order to achieve this, we must develop a description and knowledge of particle concentrations, size distributions, optical properties, chemical composition, and particle spatial and temporal distribution [3,27].
Monitoring atmospheric aerosols is very difficult: it requires high-tech equipment and a very dense network of measurements worldwide [3,26].
Since aerosol optical properties are among the greatest uncertainties in the aerosol global description, there have been many studies dedicated to the description of these properties at local and regional levels. However, the Baltic Sea is among these regions, but still has not been very well studied [28,29,30].
In this paper, we describe the atmospheric aerosol levels, namely, aerosol optical depth values, in the widely understood area of the Baltic Sea over last two decades. We describe the multiannual variations at different stations, describe the trend in the changes, and then analyze the situation in 2019. This year has been chosen due to unusually high values of aerosol optical depth (AOD). In the course of the analyses, we match the high aerosol levels with the extreme number of wildfires, which occurred in the spring and summer of 2019 across Europe. Those events produced large quantities of biomass burning aerosols, which were emitted into the atmosphere and distributed over vast areas, including the Baltic region. We then connect this case with the climate change consequences of aerosols due to their properties in the core of the discussion.

2. Description of the Study Area and the Methods

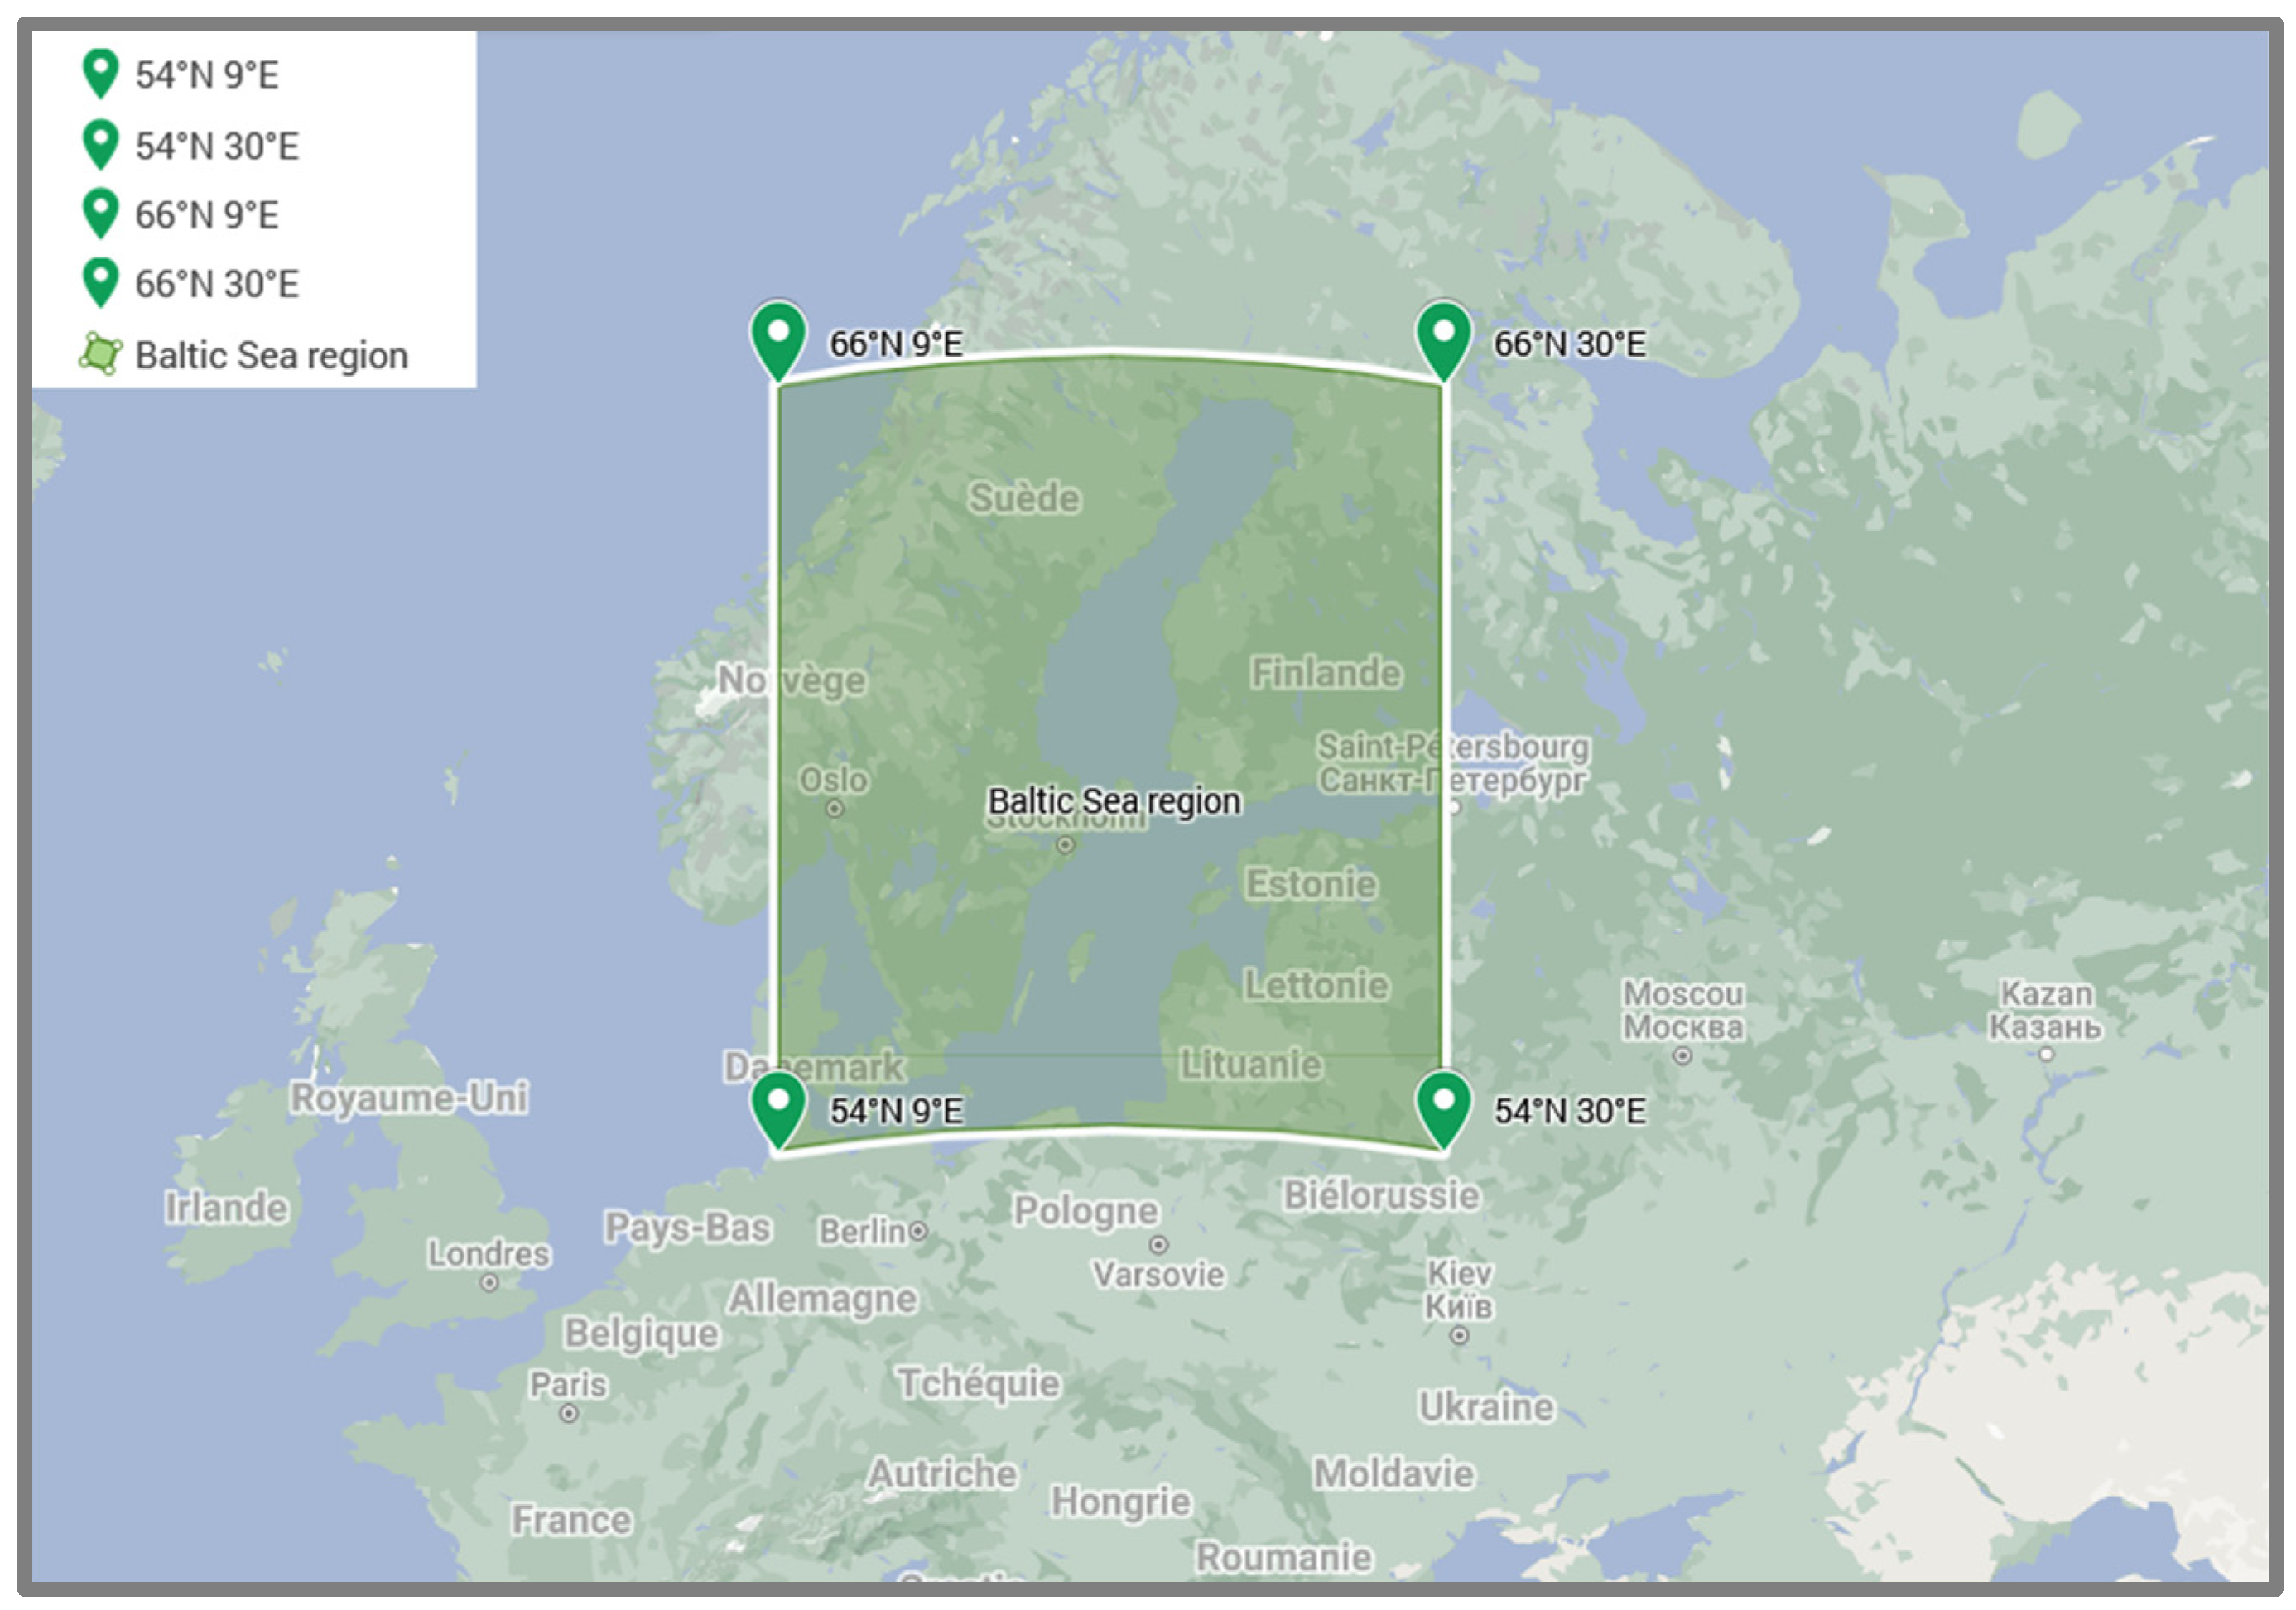
2.1. The Baltic Sea Region

The Baltic Sea is a relatively small and shallow sea in the northeastern part of Europe and is surrounded by nine very industrialized countries. Thus, it is under strong anthropogenic impact. The Baltic area covers 392,978 km2, and a catchment area covers 1,650,000 km2. It is four times larger than the Baltic area and is inhabited by an estimated 85 million people (Figure 1).
The Baltic Sea is the largest brackish water system in the world due to its shallowness (average depth is c. 52 m), inflow of more than 200 rivers, and a very limited (almost non-existent in recent years due to climate change) inflow of highly saline North Sea waters. Thus, the Baltic water salinity reaches c. 7.5 PSU, which is very low in comparison with other inland seas, and it increases towards the western regions. The average surface temperature reaches 17 °C in August and varies from 1 to 2 °C in February.
The Baltic Sea is located between two climate zones: the maritime and the continental sub-Arctic (latitude–longitude box [54° N–66° N] × [9° E–30° E]). It is dominated by two air mass types, moist and mild marine mass from the North Atlantic and continental air masses.
The southwestern regions are often influenced by a moderate climate (western circulation), and the northern part is often under the impact of the polar front (dry and cold winters). During warm summers and cool winters, winds are moderate, causing a blockade of the high-pressure system: the weather situation is stable for weeks.
The seasonal vertical structure of atmospheric layers influences the transfer of heat and moisture between the sea and the atmosphere. In autumn and winter, the sea surface is warmer than the air, winds are stronger, and the boundary layer over the sea is unstable. In spring and early summer, the situation changes: the air becomes hotter, and the sea surface and winds become weaker.

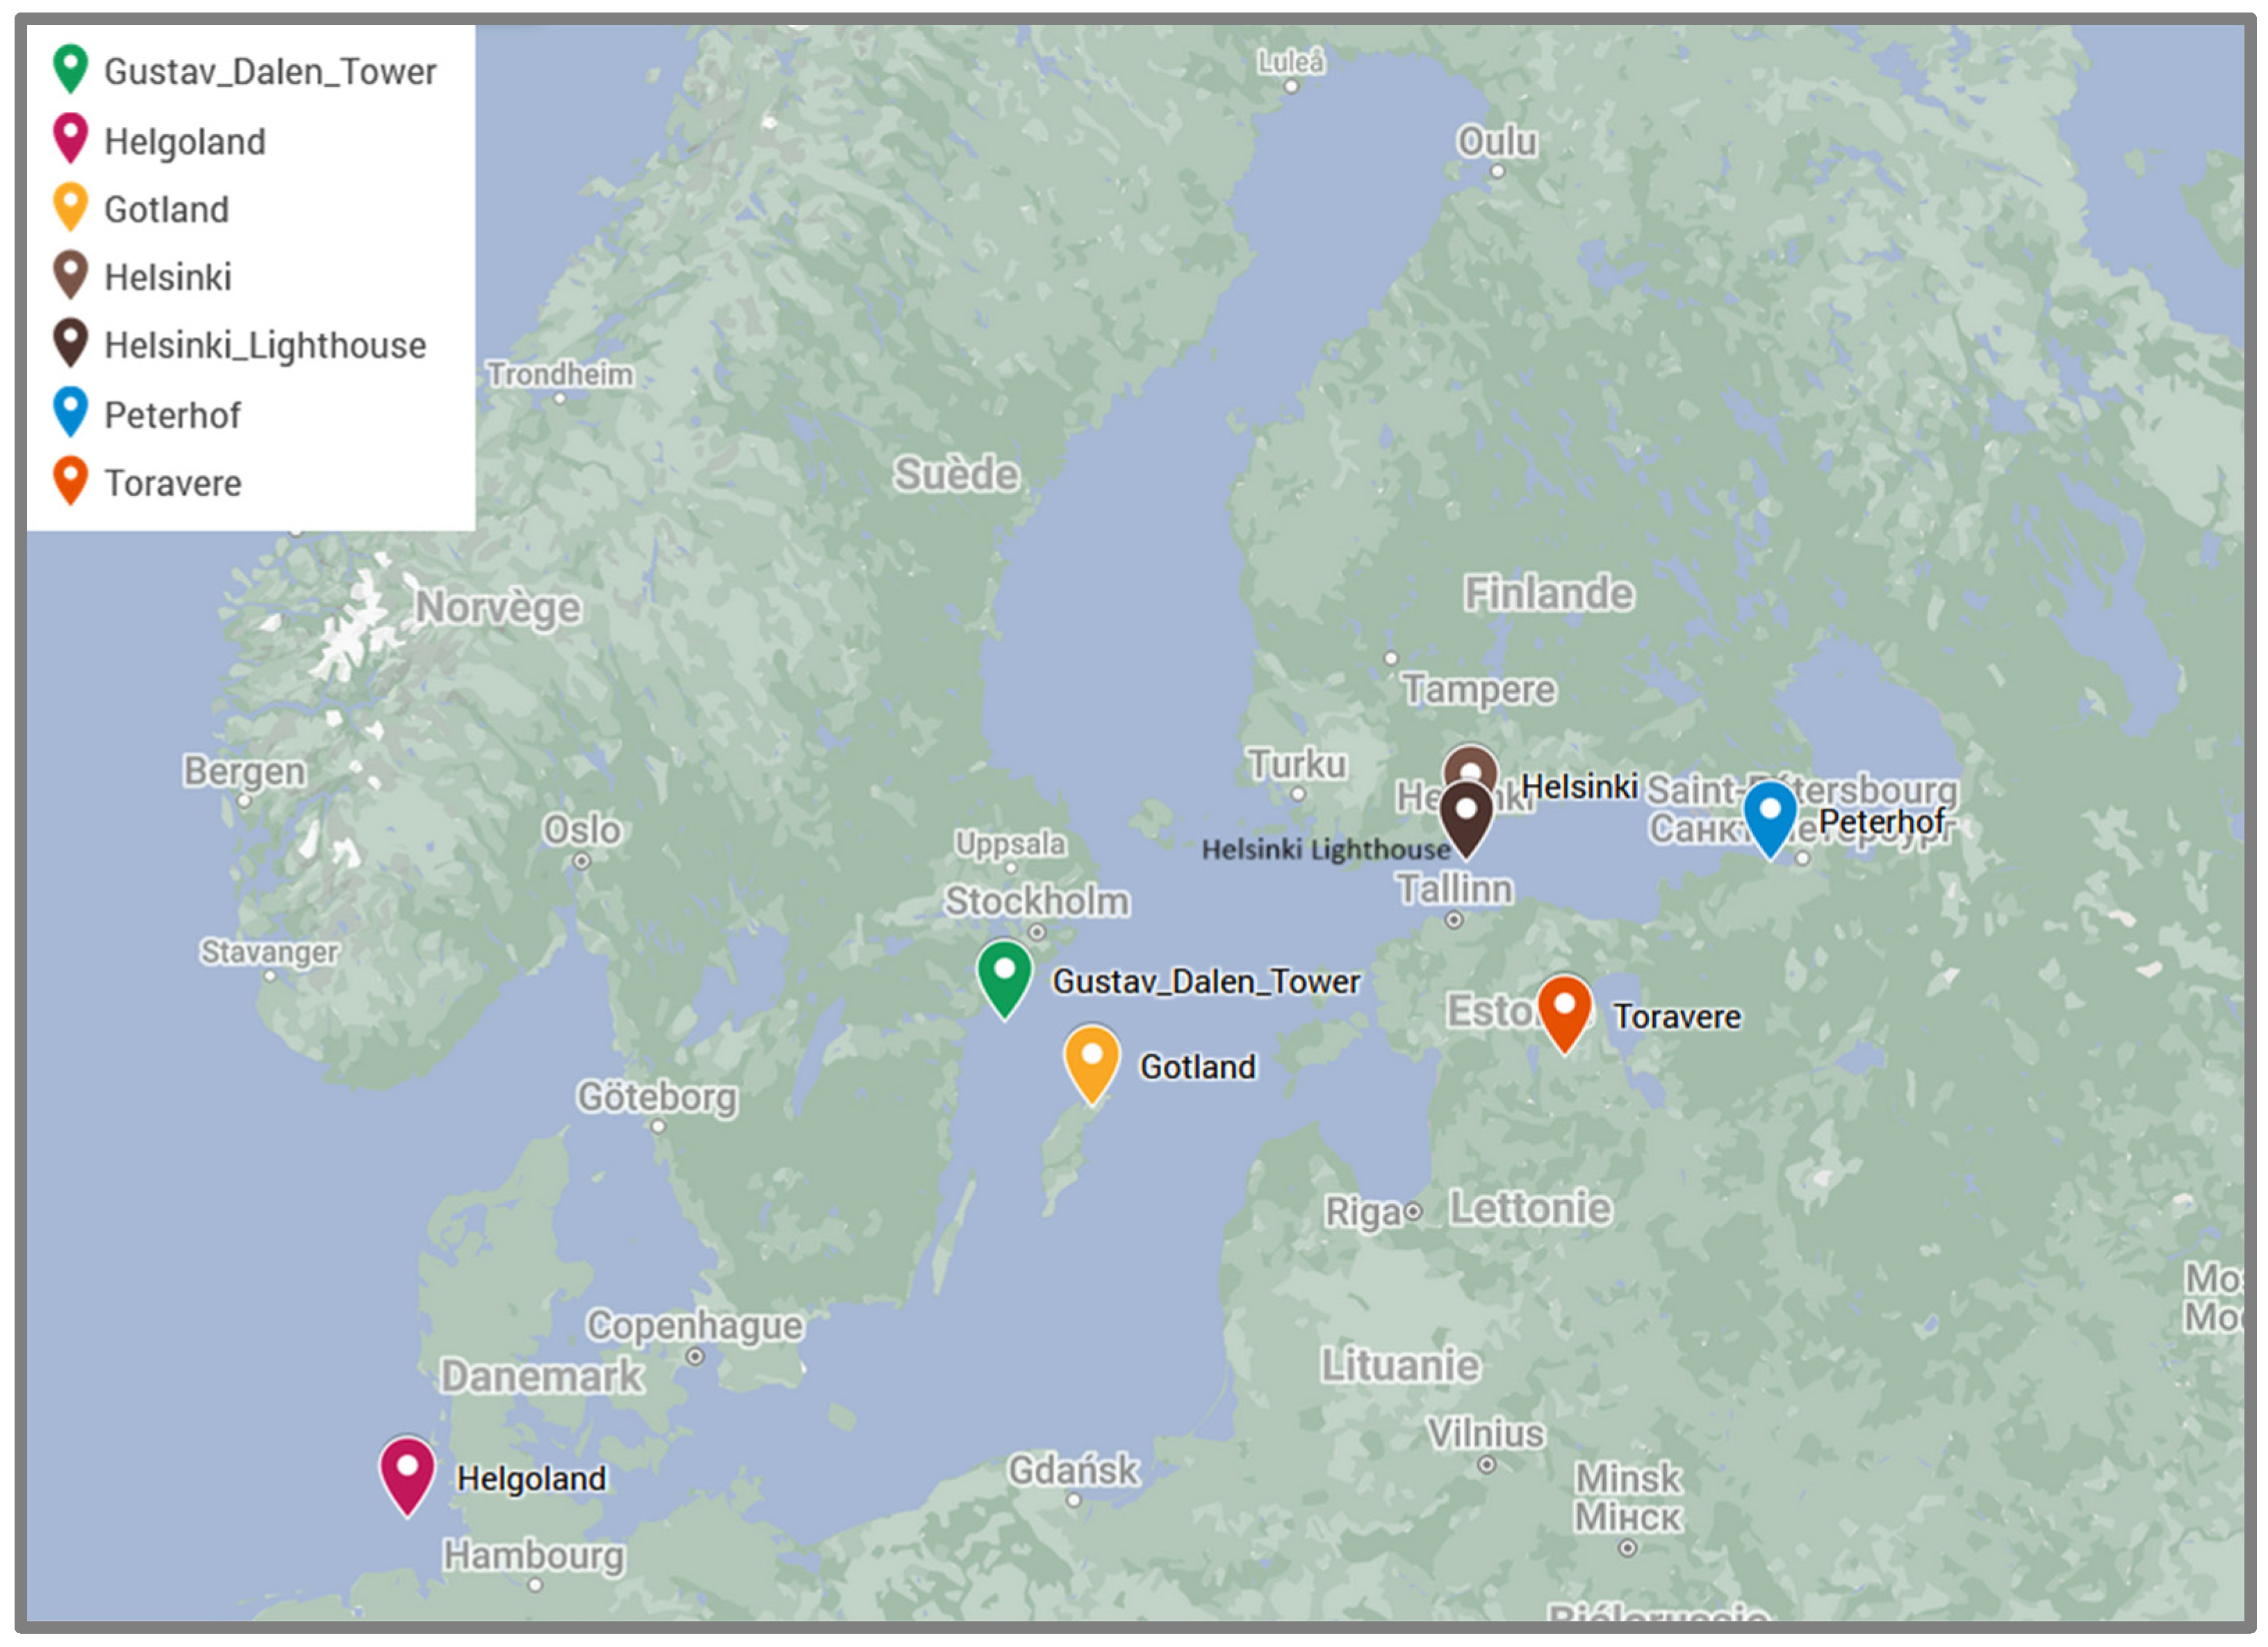
2.2. Data and Measurements

In terms of aerosol studies, the region is both difficult and important to study. It is a very cloudy sea and deeply impacted by aerosols produced in various anthropogenic activities, both locally and from distant sources. Due to the cloudiness, satellite aerosol studies are limited, and sun photometry seems like a proper tool for Baltic aerosols’ measurements in that case.
For our study, we chose AERONET data, as there are a number of NASA AERONET sunphotometer stations located around the Baltic Sea and they provide aerosol optical properties with good quality [31].
The AERONET program (AErosol RObotic NETwork), initiated by NASA and LOA-PHOTONS (CNRS), comprises a coalition of ground-based remote sensing aerosol networks. This initiative maintains a comprehensive and easily accessible database of aerosols’ optical, microphysical, and radiative properties. They are essential for aerosol research, satellite retrieval validation, and collaboration with other databases. Standardization of sun photometers, including calibration, data processing, and distribution, ensures measurement unity and coherence. Using CIMEL Electronique CE318 multiband sun photometers, the program conducts direct measurements of solar and sky radiation across multiple spectral bands (between 340 to 1020 nm) with the latest CE318-T model capable of nocturnal measurements of lunar spectral radiation. Based on the Beer–Bouguer law, optical depth calculations account for factors such as Rayleigh scattering, ozone absorption, and gaseous pollutants to extract the aerosol optical depth (AOD).
AERONET observations, focusing on spectral AOD, inversion products, and precipitation water, and leverage evolving data-processing algorithms with the latest version 3.0 enhancing data analysis capabilities, offer us three data quality levels: Level 1.0 (unscreened), Level 1.5 (cloud-screened), and Level 2.0 (cloud-screened and quality-assured). All the derivative products from the AOD depend on these levels and are submitted to additional quality checks. Each AOD measurement consists of a triplet observation per wavelength, taken every 30 s over one minute. This variability provides insight into data quality. During large air mass periods, measurements are made at 0.25 air mass intervals, while at smaller air masses, they are taken every 15 min. Cloud variations, usually greater than those of aerosols, cause observable triplet variations useful for cloud detection. The 15 min interval also allows for an extended assessment for cloud contamination. Moreover, the daily average takes into account all the points during the day (more than three required), and the monthly average is based on the daily average [31,32].
To ensure the increasing quality of data in the future, some research and developments are in process. Notably, between the PHOTONS network, the original French component of the AERONET network and the CIMEL company created a specialized sun photometer for measuring linear polarization at wavelengths between 340 and 1640 nm. Several of these “Dual Polar” instruments are already in the testing phase at sites such as Lille (France) and Beijing (China). Another example is CIMEL developing a portable single wavelength (532 nm) lidar system, CAMLTM. The CAMLTM CE 370-2 has the ability to profile atmospheric cloud and aerosol structures and to retrieve aerosol optical and dynamic properties. [33]. These studies and developments are essential to improve AOD measurements through diverse weather conditions.
In order to search for the multiannual trends and extreme aerosol optical depth (AOD) cases, we selected seven AERONET stations, which are located around the Baltic Sea and provide long-term data, and chose level 2.0 and λ = 500 nm (AOD_500/550). The AOD is a measure of the extinction effect of atmospheric aerosols and is typically used as a parameter to assess the degree of air pollution. The AOD data were not always collected and available at the same periods; however, the selected stations provide good geographical and multiannual coverage of the region. The following AERONET stations were selected for the AOD analyses (Figure 2).
The Gustav Dalen Tower station is managed by the Swedish Maritime Administration. It is located in the northern Baltic Proper (58.594° N and 17.467° E), approximately 10 nautical miles off the Swedish coast, at an elevation of 25 m a.s.l. The data were collected between 2005 and 2023. The station used a CIMEL sun photometer with the following measurement wavelengths: 412 nm, 443 nm, 490 nm, 532 nm, 551 nm, 667 nm, 870 nm, 1020 nm.
The Helsinki station is located at 60.20373° N and 24.96065° E, at an elevation of 52.8 m a.s.l. The CIMEL sun photometer is installed on top of the Finnish Meteorological Institute’s main building. It is an urban-type station and is characterized by its location at high latitude and in the vicinity of the sea. The data were collected at the station between 2008 and 2023. The station was equipped with a CIMEL sun photometer (wavelengths: 340 nm, 380 nm, 440 nm, 500 nm, 675 nm, 870 nm, 1020 nm, 1640 nm).
The Helsinki Lighthouse station is managed by the Finnish Maritime Administration. It is located in the Gulf of Finland (59.949° N and 24.926° E), approximately 15 nautical miles southeast of the harbor of Helsinki. The data were collected at the station between 2006 and 2019. The station was equipped with a CIMEL device (wavelength: 412 nm, 443 nm, 490 nm, 532 nm, 551 nm, 667 nm, 870 nm, 1020 nm).
The Gotland AERONET station (57°55′ N, 18°57′ E) lies in the northern part of the island of Gotland, 50 m inshore, at an elevation of 10 m a.s.l. Owing to the location of the island in the central Baltic Sea, this station is often referred to as a representative of Baltic Sea aerosol conditions. The data were collected between 1999 and 2021. The station was equipped with a CIMEL device (wavelengths: 340 nm, 380 nm, 440 nm, 500 nm, 675 nm, 870 nm, 1020 nm).
The Toravere station is located at 58.25500° N and 26.46000° E, at an elevation of 70 m a.s.l. This site is located about 20 km southwest of Tartu, and the data were collected between 2001 and 2023. The station was equipped with a CIMEL device (wavelengths: 340 nm, 380 nm, 440 nm, 500 nm, 675 nm, 870 nm).
The Helgoland station is located at 54.17786° N and 7.88736° E on Helgoland Island, at an elevation of 60 m a.s.l and some 35 miles from the mainland. The data were collected between 1999 and 2015 at the following wavelengths: 340 nm, 380 nm, 440 nm, 500 nm, 675 nm, 870 nm, 1020 nm.
The Peterhof station is located at 59.88100° N and 29.82600° E, at an elevation of 58 m a.s.l. The data were collected between 2013 and 2012 at the following wavelengths: 340 nm, 380 nm, 440 nm, 500 nm, 675 nm, 870 nm, 1020 nm.

3. Results and Discussion

The data selected for the analyses were taken from the AERONET database for AODs for clear-sky conditions (level 2.0), i.e., fully quality-assured data. In our studies, we concentrated on temporal trends of AOD variations over time at the same wavelength, λ = 500 nm (AOD_500). However, in some cases, we encountered the absence of specific data for this wavelength, and then we used values for the closest wavelengths, i.e., AOD_551 or AOD_555. The multiannual variations of AODs at particular stations are divided into two time spans, until 2011 and from 2011 on.
Typically, an optical depth of less than 0.1 indicates clear sky conditions with maximum visibility, whereas values over 0.4 and especially those reaching 1 indicate very hazy conditions. We are aware that the AOD itself is just one element of “an atmospheric pollution puzzle” and that many other features and parameters play an important role in precise determination of the aerosol composition, which can also enhance the study on the origins of the particles. However, in this study, we use the AODs as a measure of certain trends and particular cases of high aerosol episodes. Due to the fact that our data are scattered among different stations, which have/had operated in different time periods, accurate analyses of chemical composition are not a subject for this study.
We have looked into additional parameters, such as single scattering albedo or asymmetry factor; however, brief analyses of the data showed significant deficiency in accurate data. Thus, the conclusions from these analyses did not provide any additional or convincing arguments. Therefore, we support our observations with information about the times and regions of wildfires in 2019, as well as the particle pathways during that period.
However, realizing that the AODs provide us with incomplete information on the nature of aerosol particles and their impact on climate, we have also analyzed the size distribution of particles, indicating that fine mode particles were most abundant in the analyzed cases, which, together with other supporting information, indicates the highly possible presence of biomass burning aerosols in the analyzed periods.

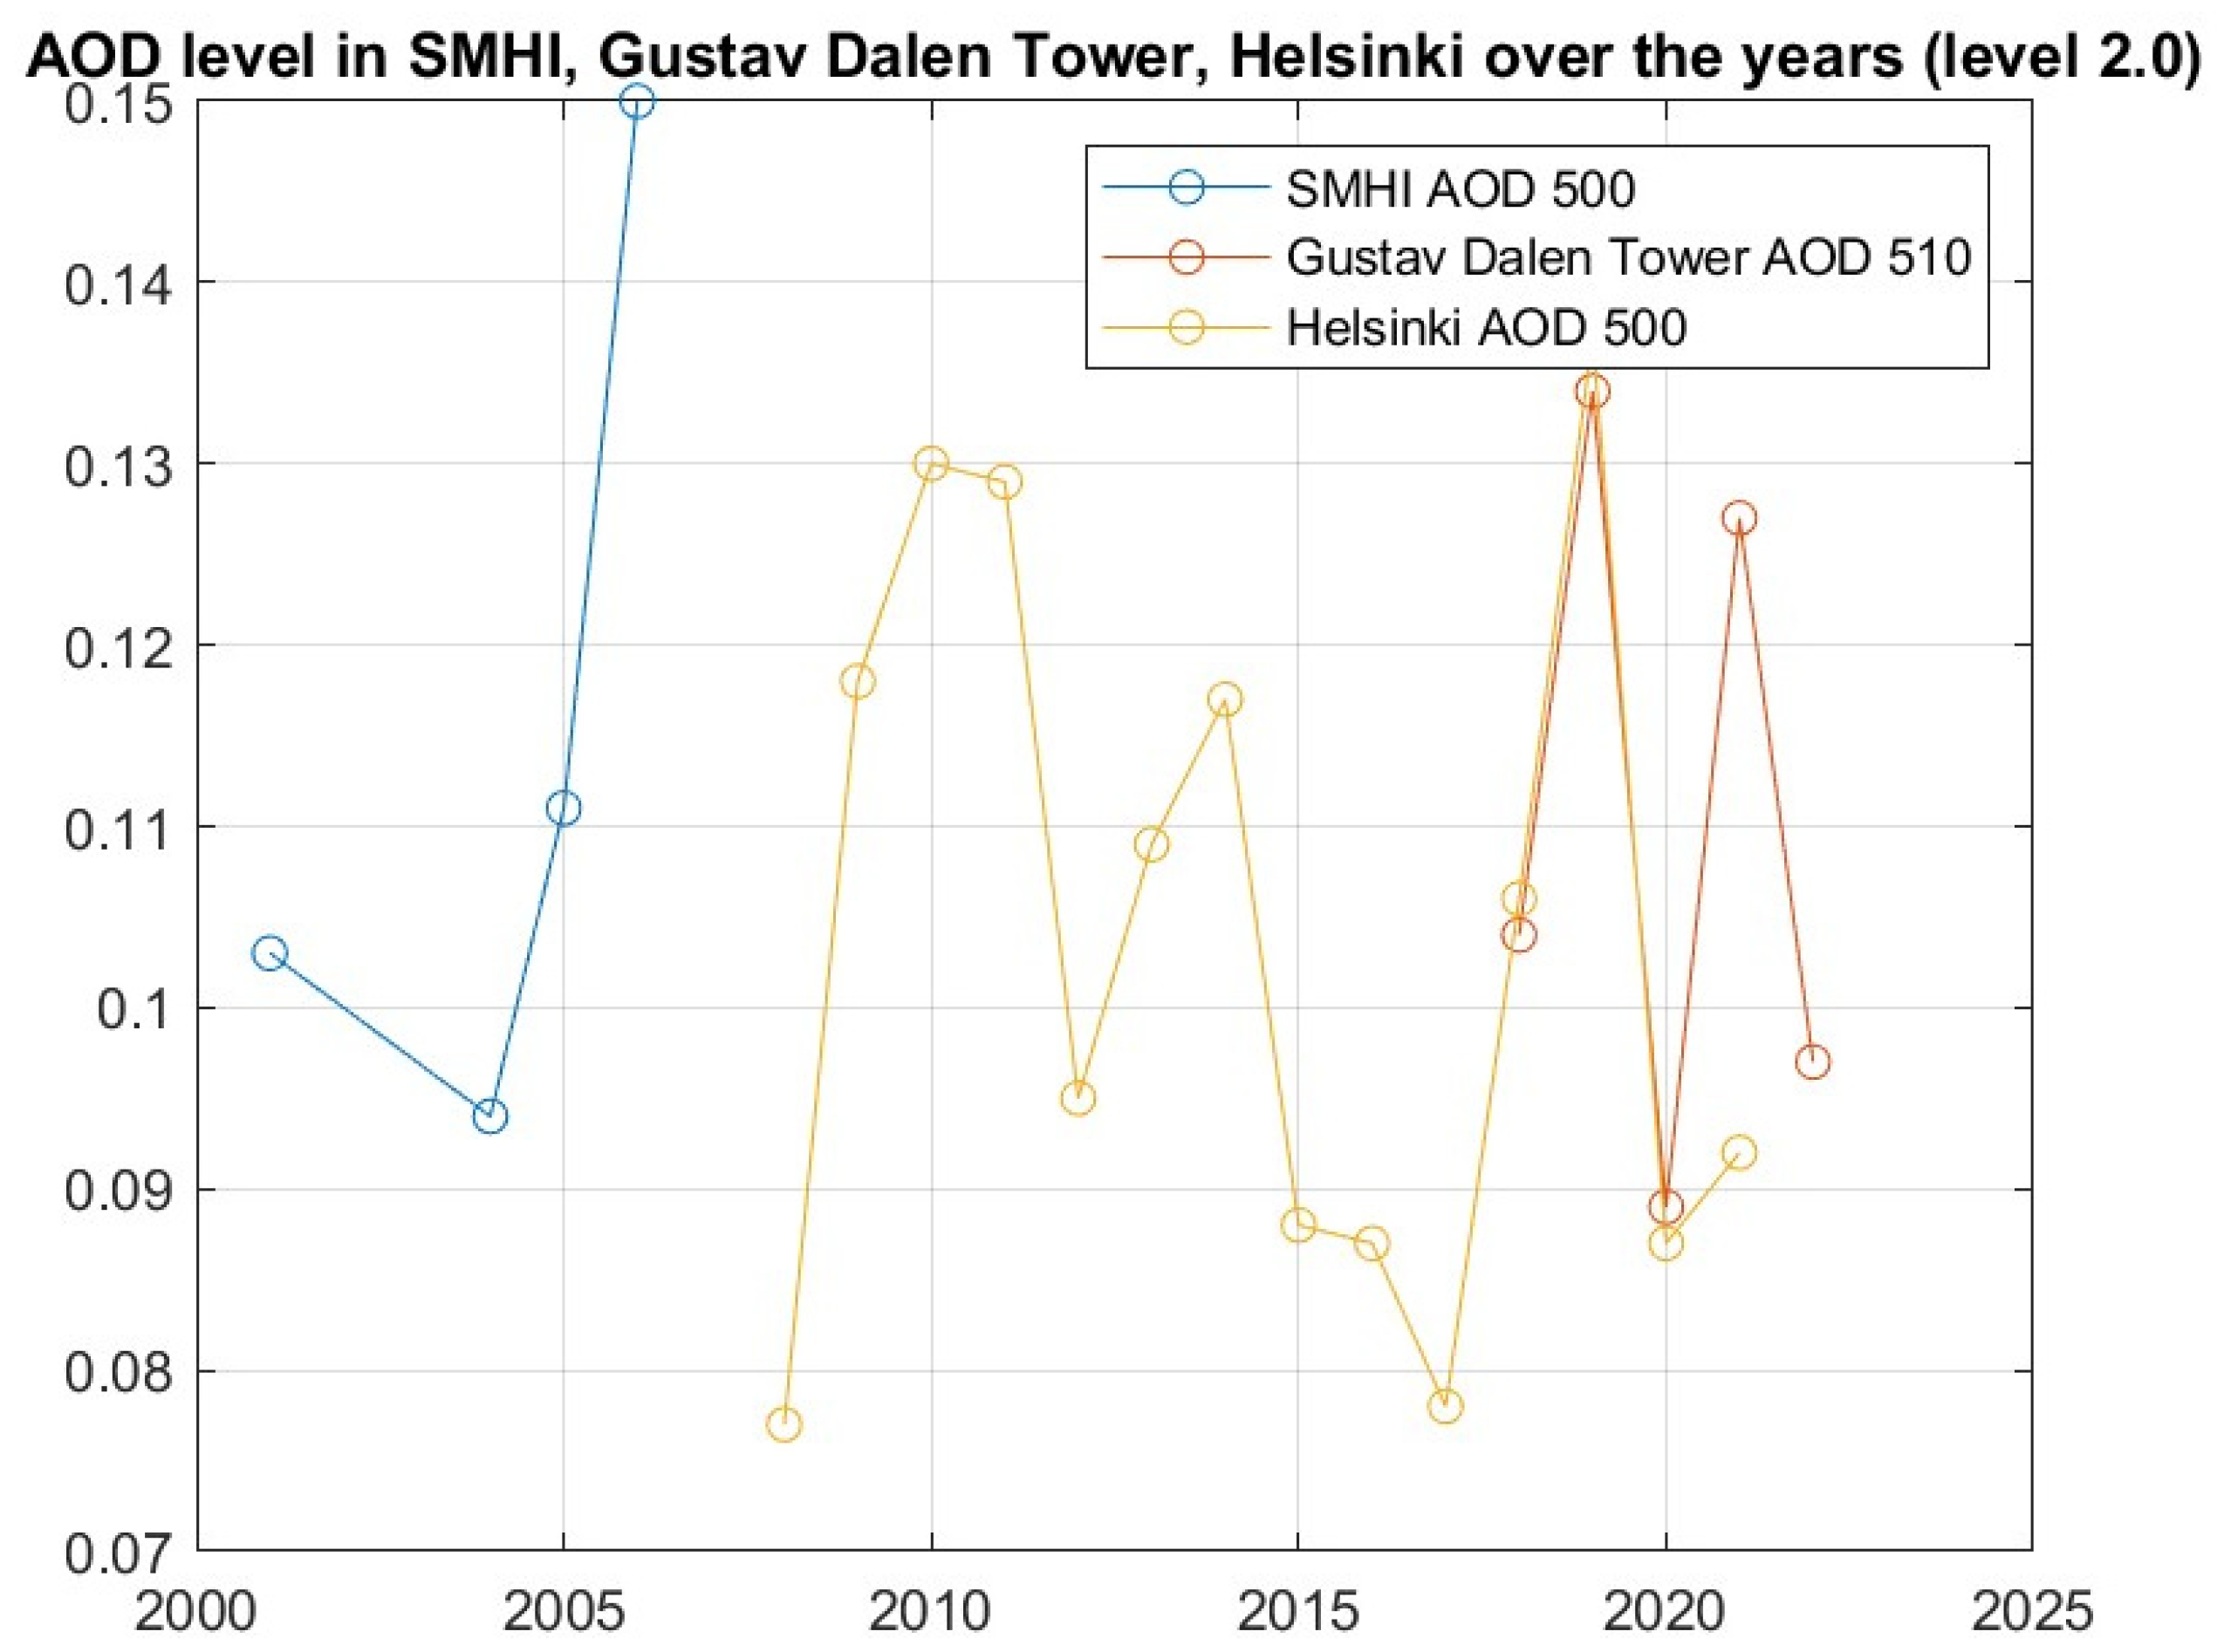
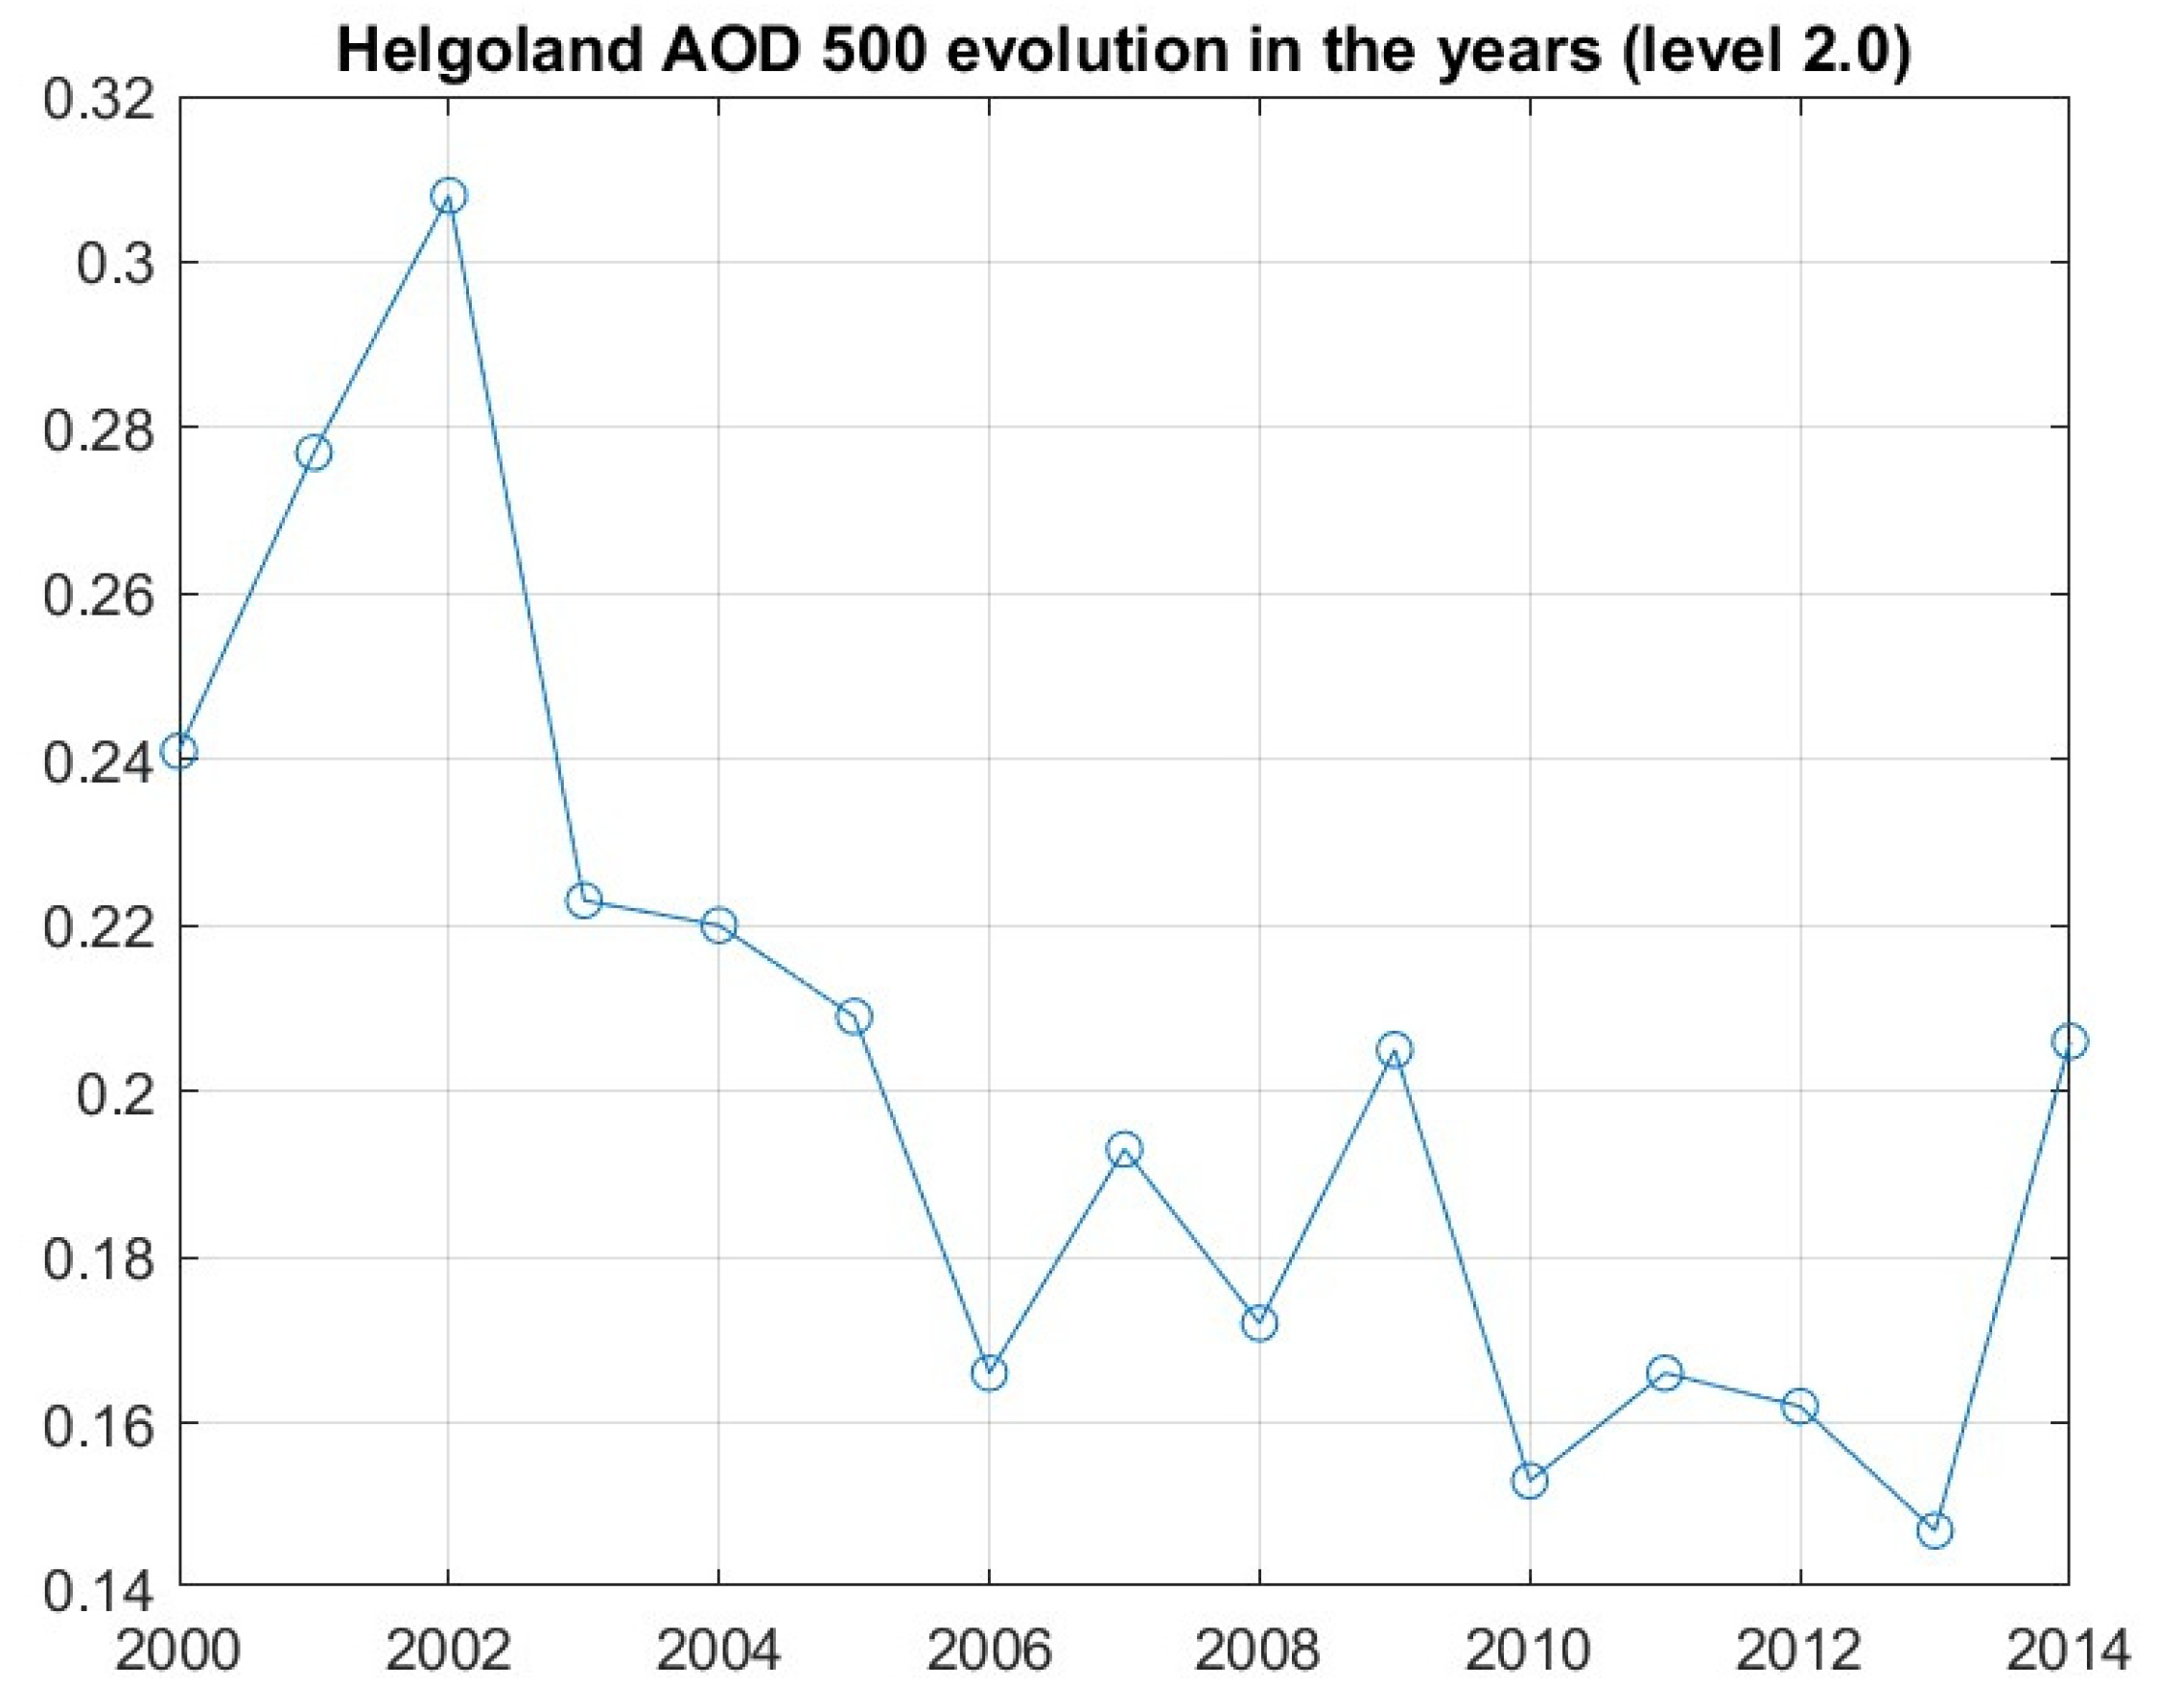
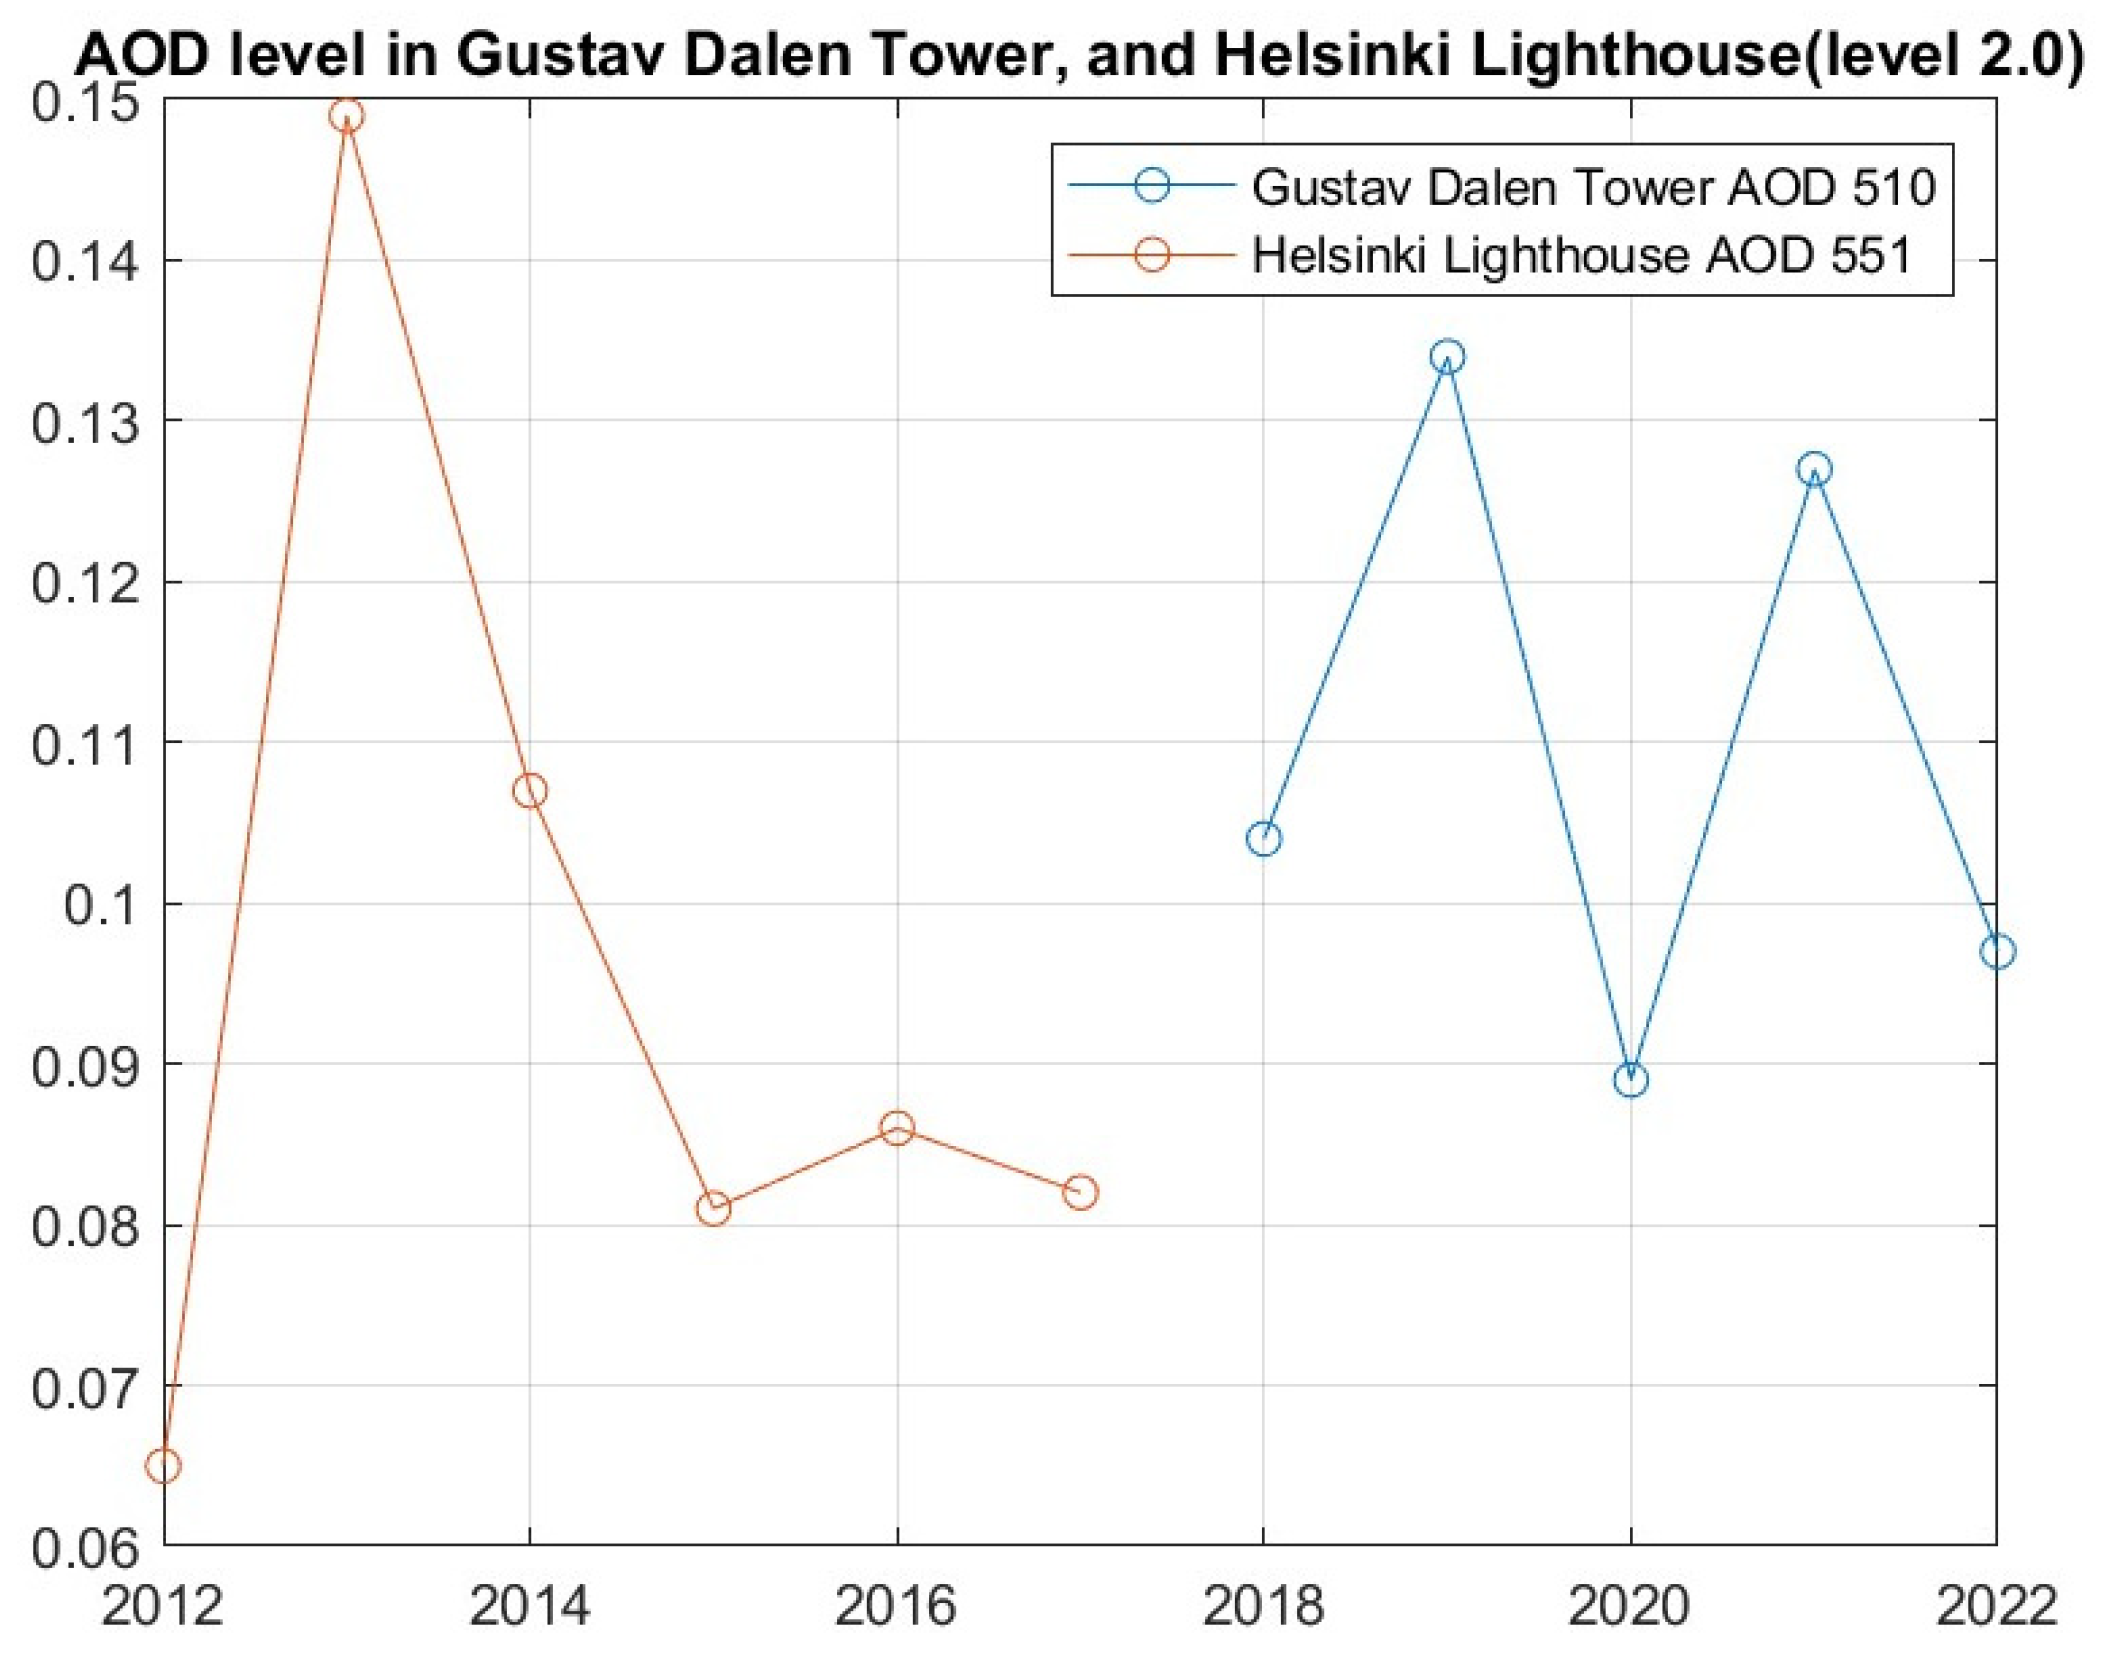
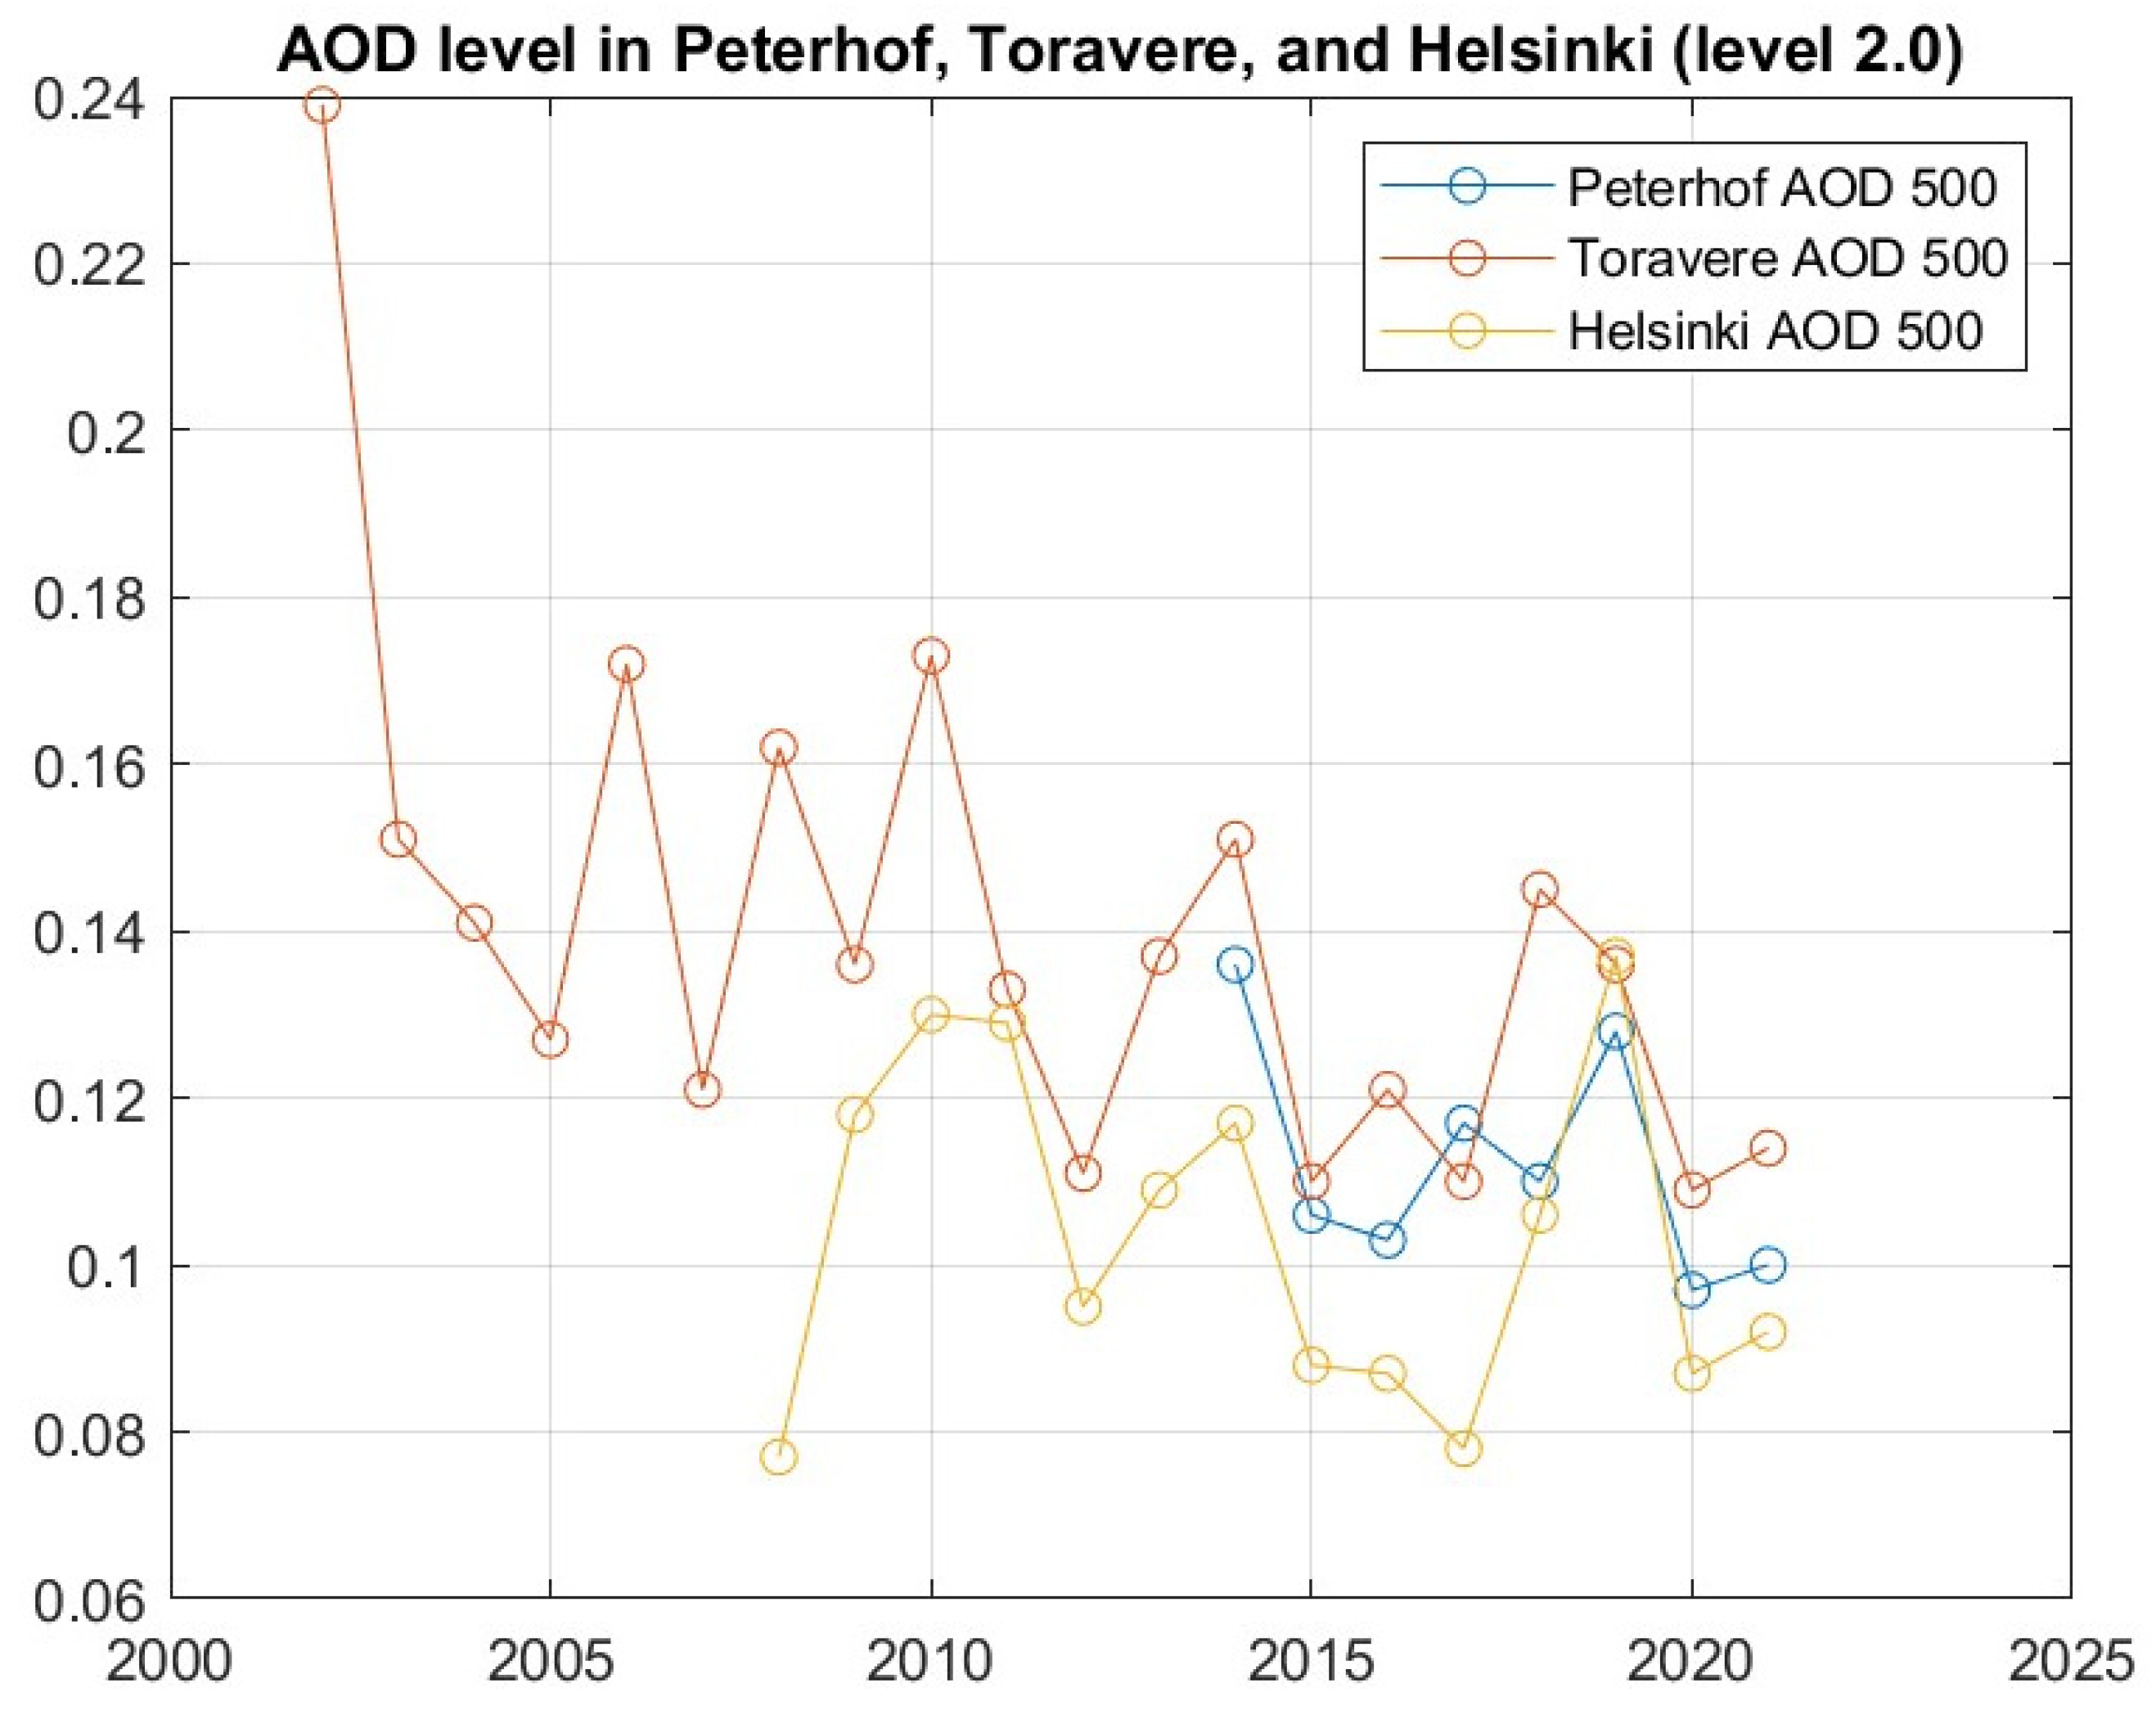
3.1. Long-Term AOD Analyses

The first approach involved a global study, i.e., AOD for each station over the years. The first group of data is presented in Figure 3 below.
The data presented from 2000 through 2011 show a very slight increase during this period. This is evident for all three stations (Gotland, Gustav Dalen Tower, and Helsinki stations). There is a clear increase trend around the years 2004 and 2007 for the Swedish stations and in the years 2008–2010 for the Finland station.
Subsequently, the Helgoland station AODs were investigated (Figure 4). These analyses provide insight into the southwest region of the Baltic. As shown in Figure 4, it is evident that between 2000 and 2014, there is a clear decrease in the AOD_500 values in Helgoland.
Two stations, Gustav Dalen Tower and Helsinki Lighthouse, were also analyzed at wavelengths λ = 510 and 551 nm for the period between 2012 and 2022 (Figure 5). An AOD decline is noticeable for both stations; however, it is noteworthy that for both stations, there are values in 2013 and 2014 that do not follow this trend, as they are both slightly higher.
The next step was to analyze the AOD data from the stations with more recent data, until 2022. These analyses refer to the stations in Peterhof, Toravere, and Helsinki (Figure 6).
It is clear that the behavior of the Toravere station (Estonia) and Peterhof station (Russia) is very similar and consistent with what was previously observed. That is a clear decline with values that closely follow this downward trend. As for the Helsinki station, there is also a decline, but it is slightly less pronounced, with values that deviate a bit more from the trend curve. Table 1 presents the AOD changes and their character for particular stations.
What is visible for the three northerly stations (especially for Toravere and Peterhof) is the year 2019 stands out, as it deviates from the observed decline. This suggests that there might have been an event or factor influencing this deviation during that year.

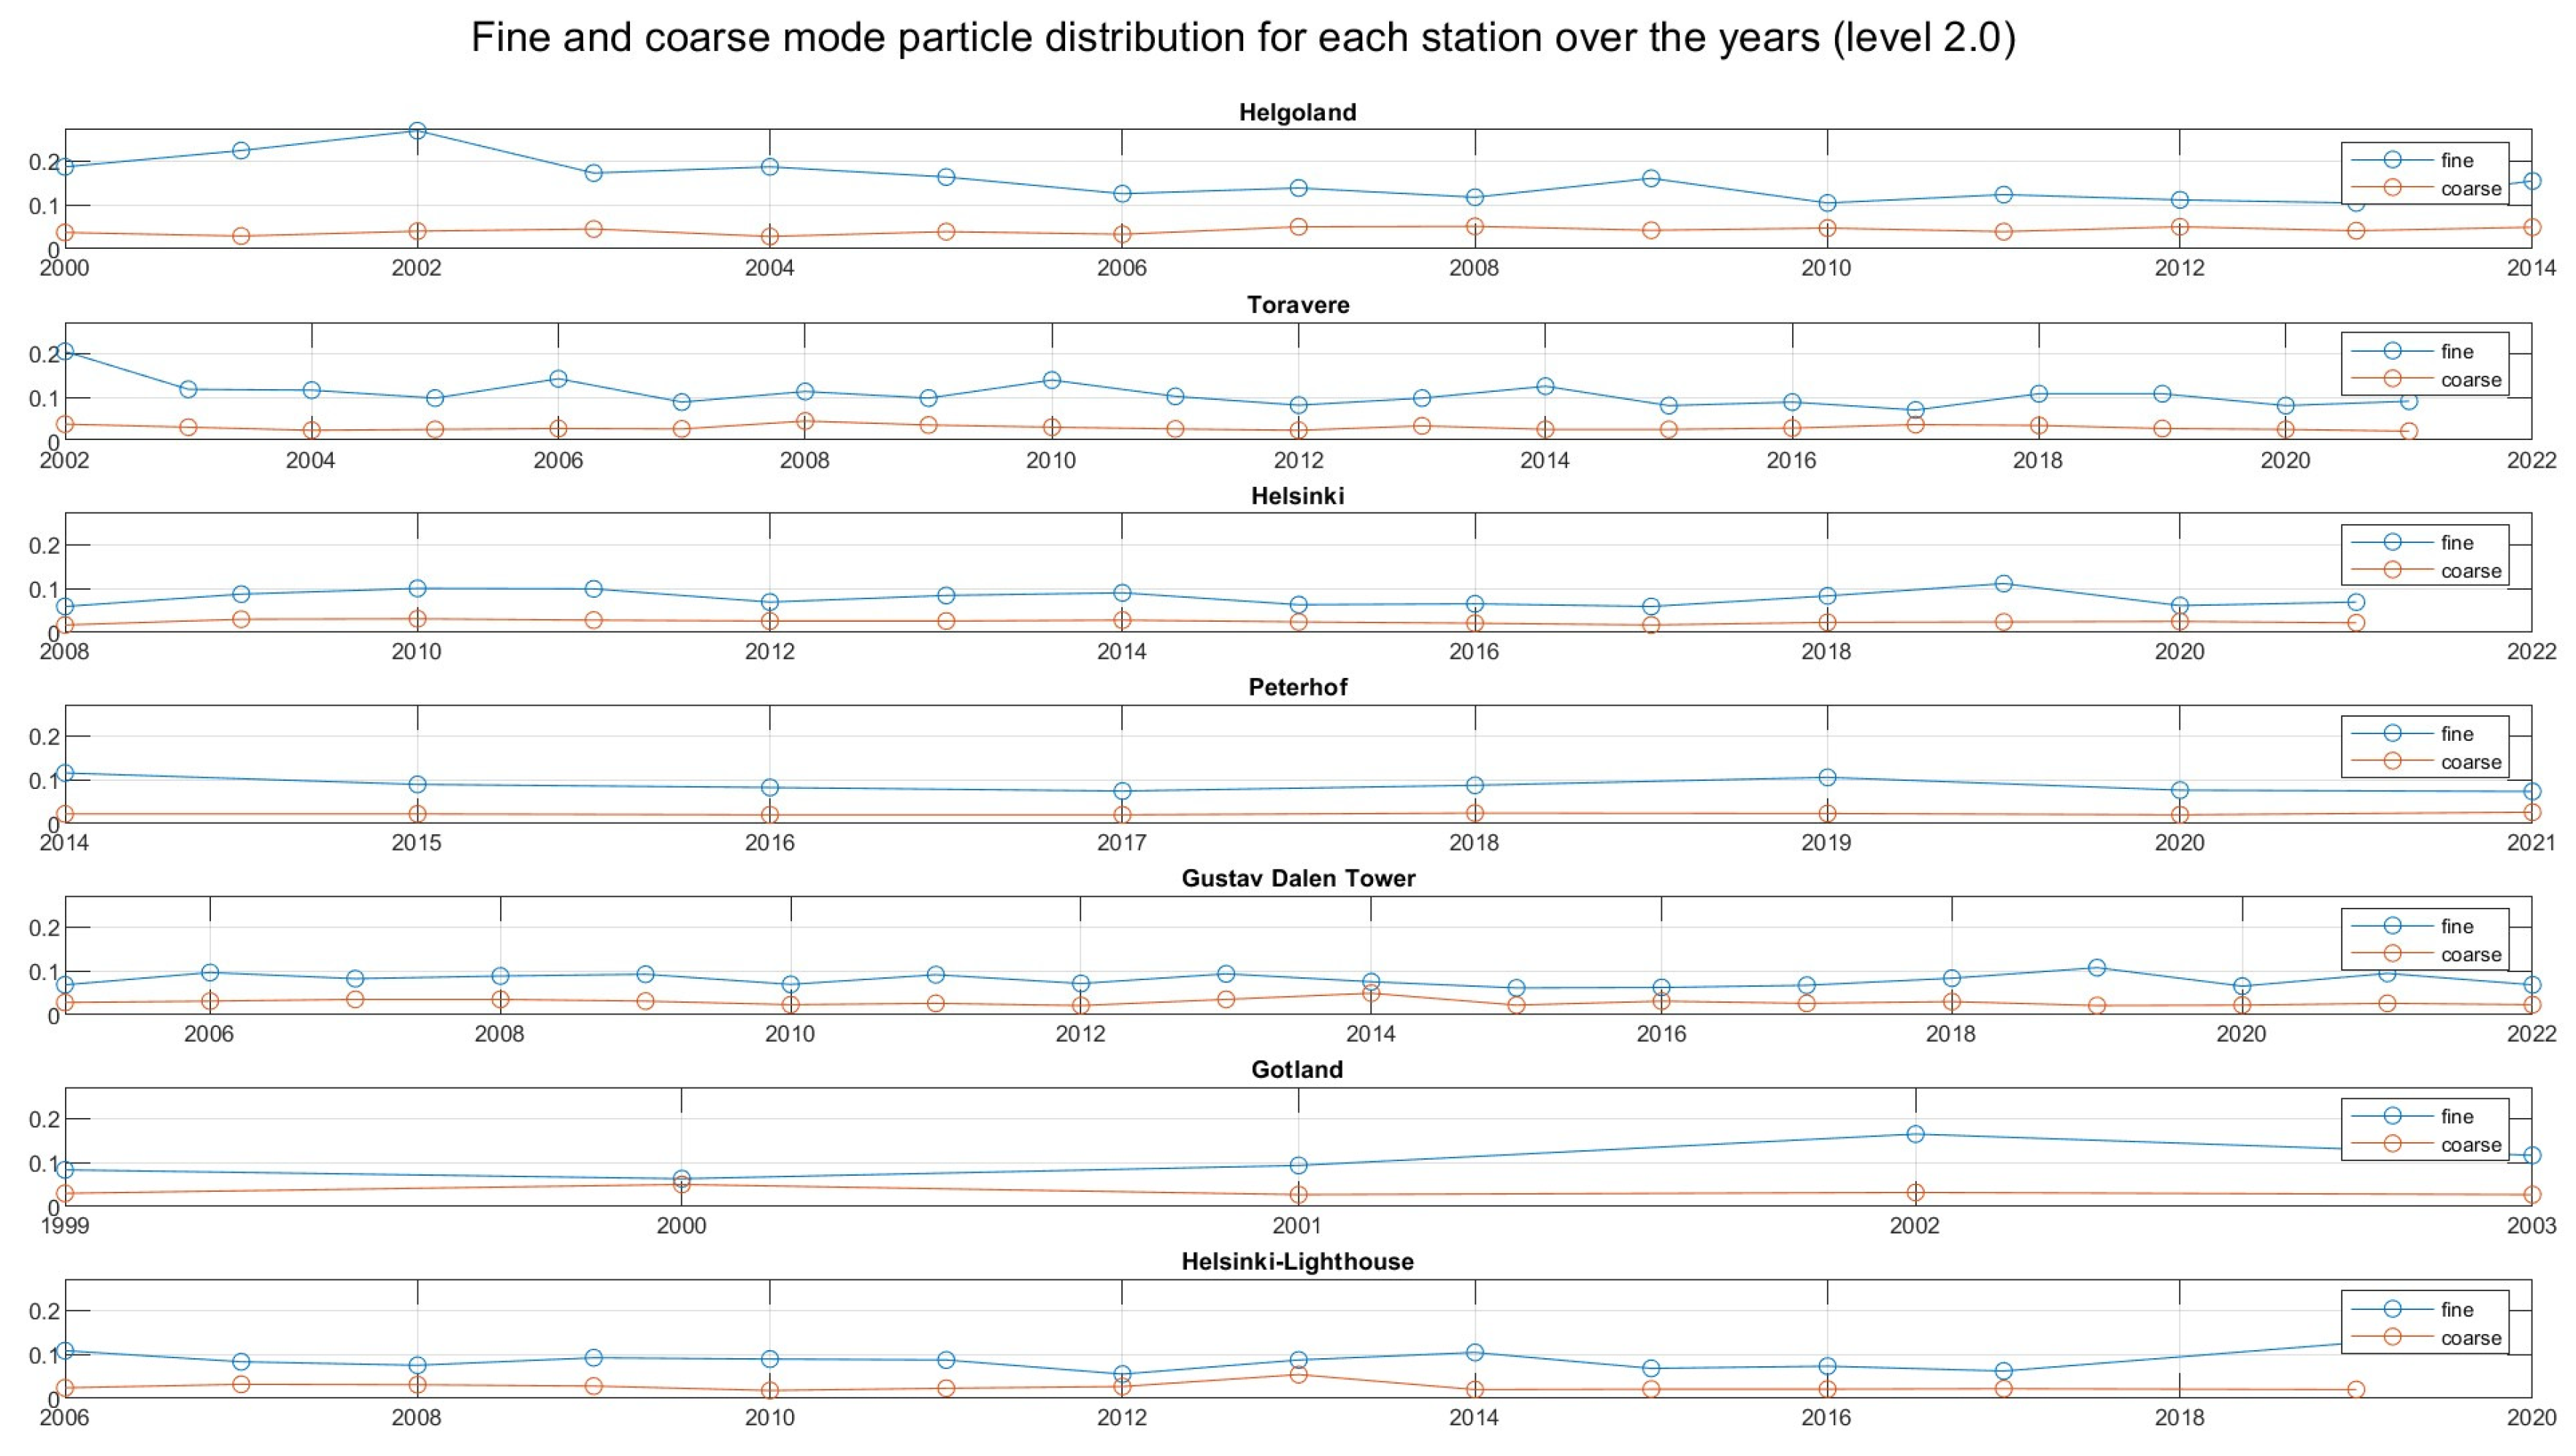
3.2. Focus on the Particle Size: Fine and Coarse Aerosols

Following this assessment, it was necessary to study the trend in aerosol particle size variations for all the analyzed stations (fine and coarse at wavelengths around 500 nm) (Figure 7).
Globally, fine and coarse particles follow the same trends through the years, always with a higher fine mode distribution than coarse mode distribution at each station.
For the Gotland station, between 1999 and 2003, we observed a clear increase in fine mode particle domination, which is consistent with the similarly observed increase in the aerosol number concentration during the same period. In the case of the three stations situated in Finland and Sweden (Helsinki, Gustav Dalen Tower, and Helsinki Lighthouse), it is evident that both the fine and coarse aerosol particle trends show a slight downward trajectory. The decline is very subtle, to the extent that one could even consider their evolution as relatively constant over time. However, there is a clear domination of fine particles over coarse aerosol particles. Again, 2019 shows a “jump” in fine and coarse mode values.
Finally, for the last three stations located in Estonia (Toravere), Germany (Helgoland), and Russia (Peterhof), the decline in fine aerosol particles is significantly more pronounced, while the decline in coarse particles remains relatively discrete. Moreover, the overall concentration of coarse particles is also comparatively lower than that of fine particles.
It is interesting to note that the deviation observed in the aerosol concentration during the year 2019 is also clearly visible in the trend of fine aerosol particles. Indeed, in 2019, a significantly higher value of fine particles was recorded for each station.
As a reminder from the introduction, fine and coarse mode particles are impacted by wildfires and burning biomass (BB), which is the burning of living and dead vegetation and includes human-initiated burning of vegetation for land clearing and land-use change, as well as natural lightning-induced fires [10]. Thus, studying the 2019 case more particularly to explain the variation of AOD compared to other years and external events’ impact on aerosols is needed.

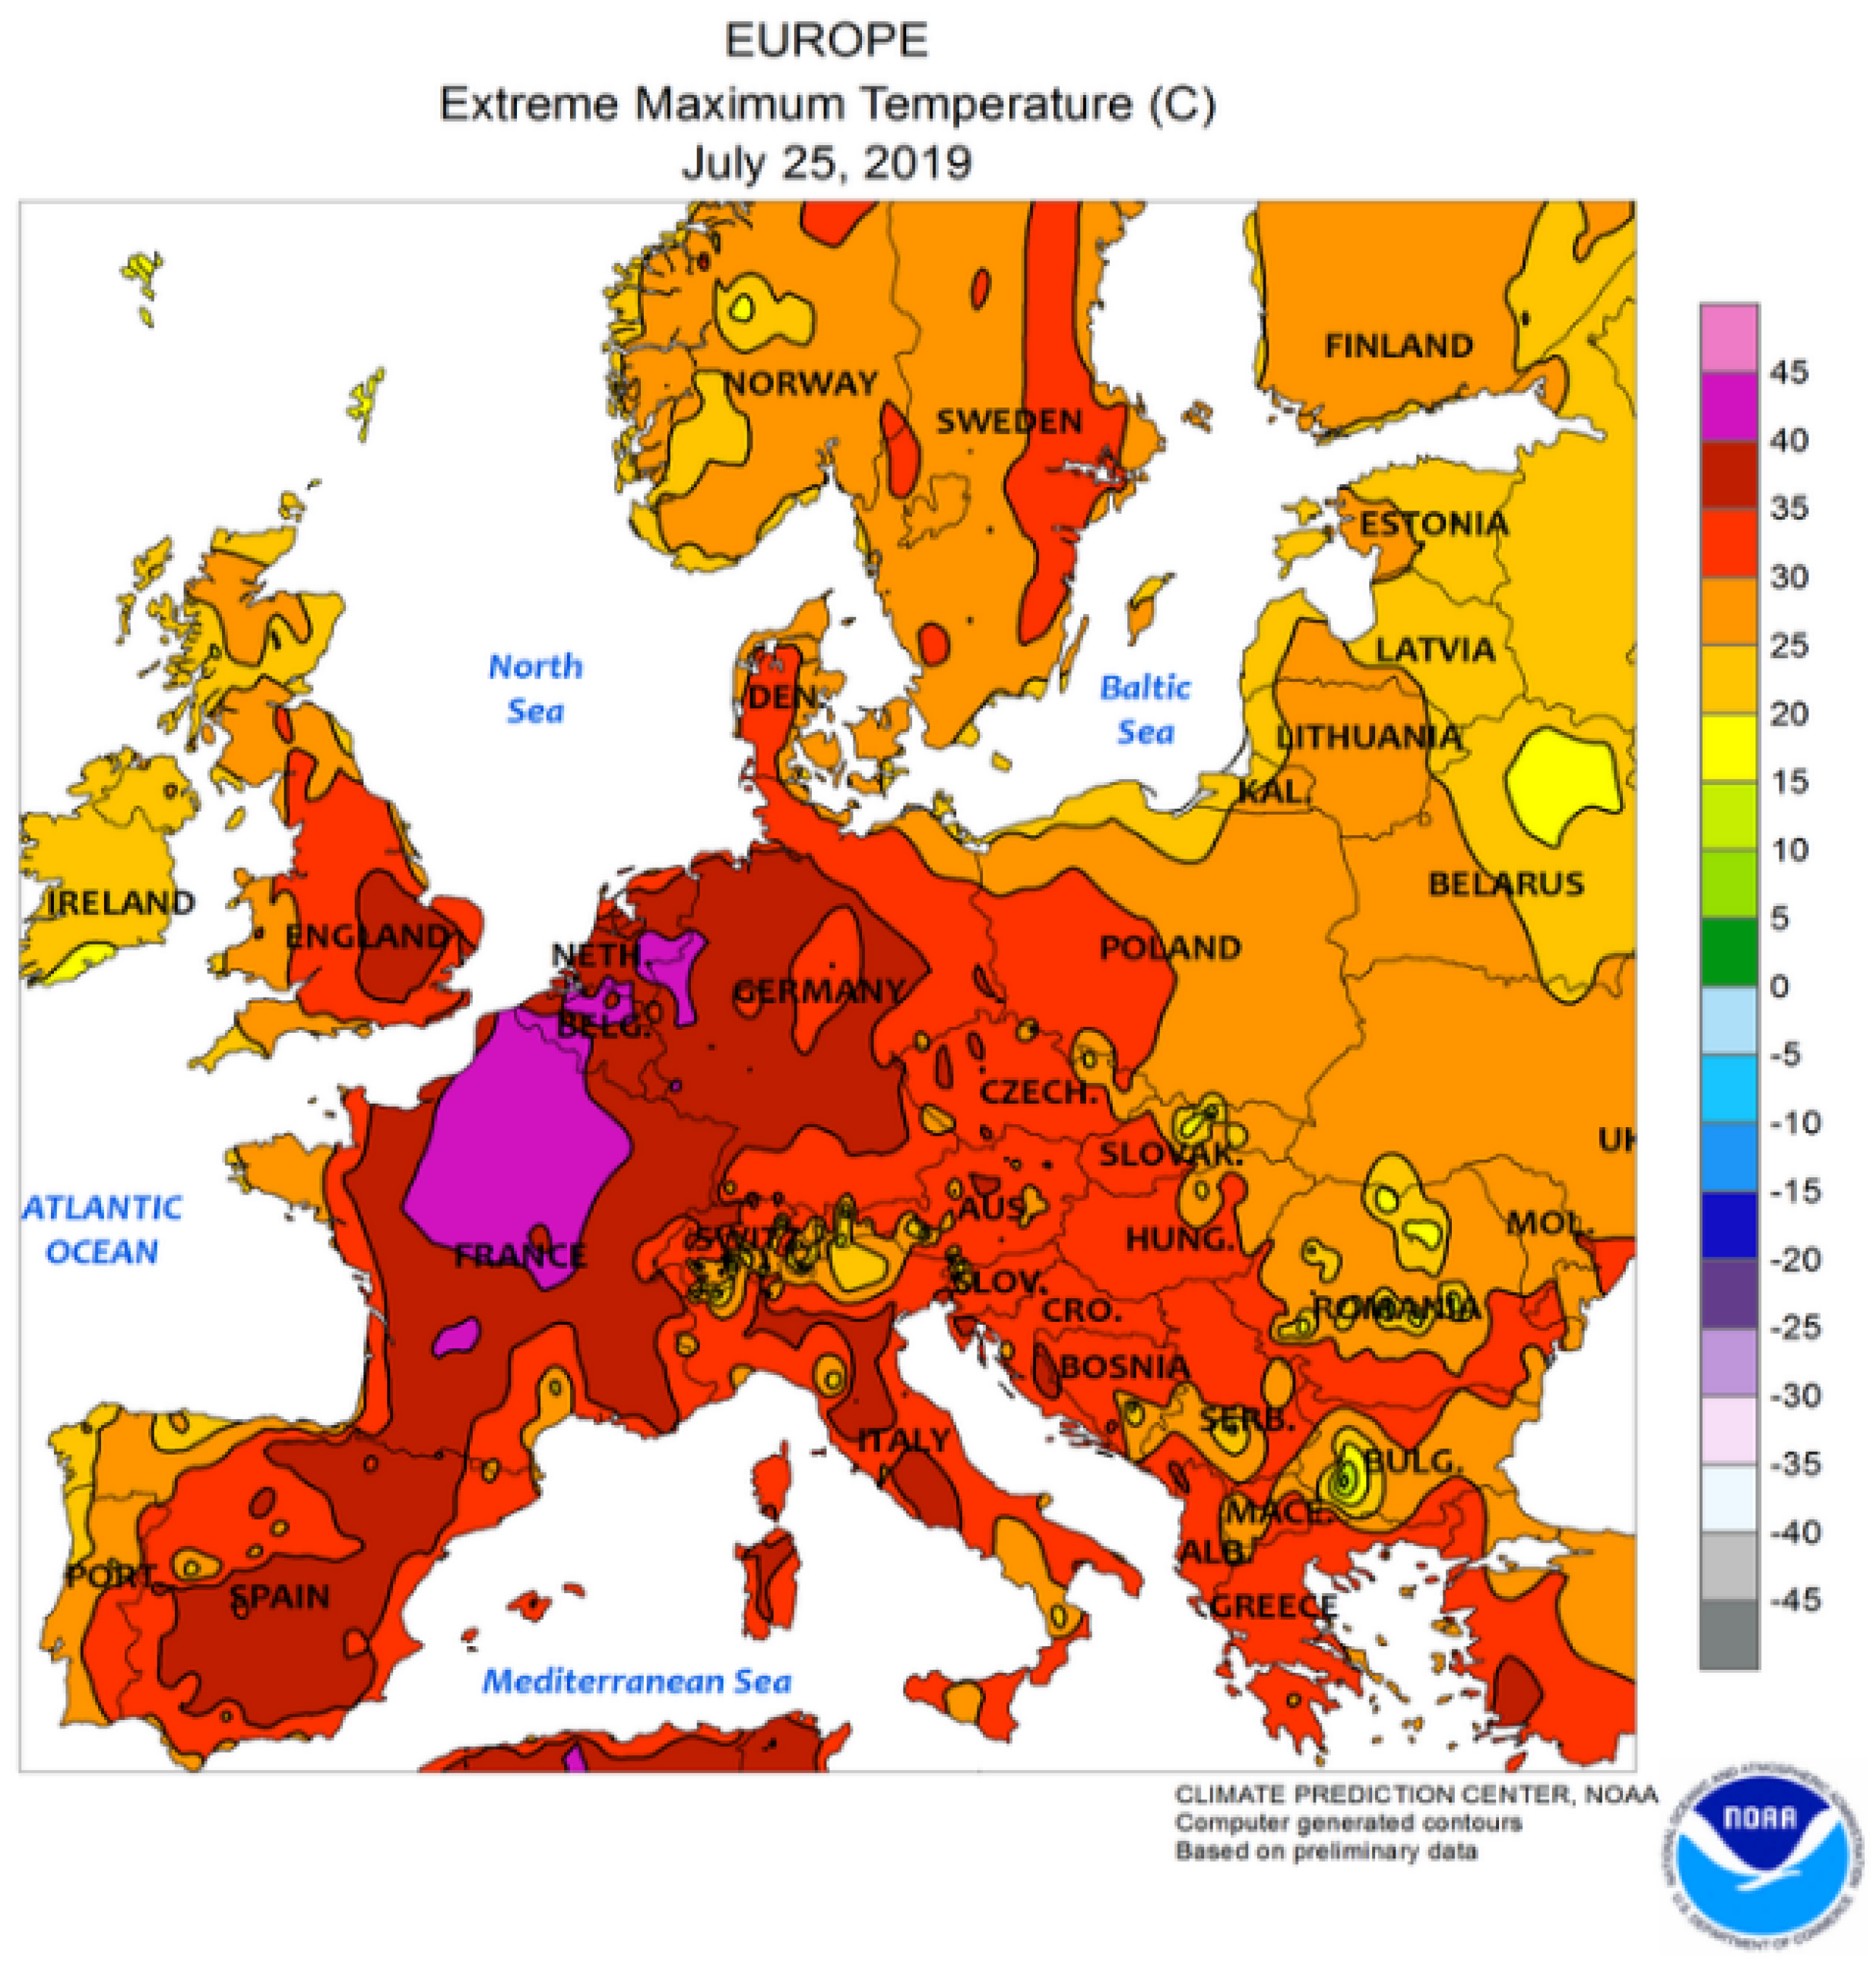
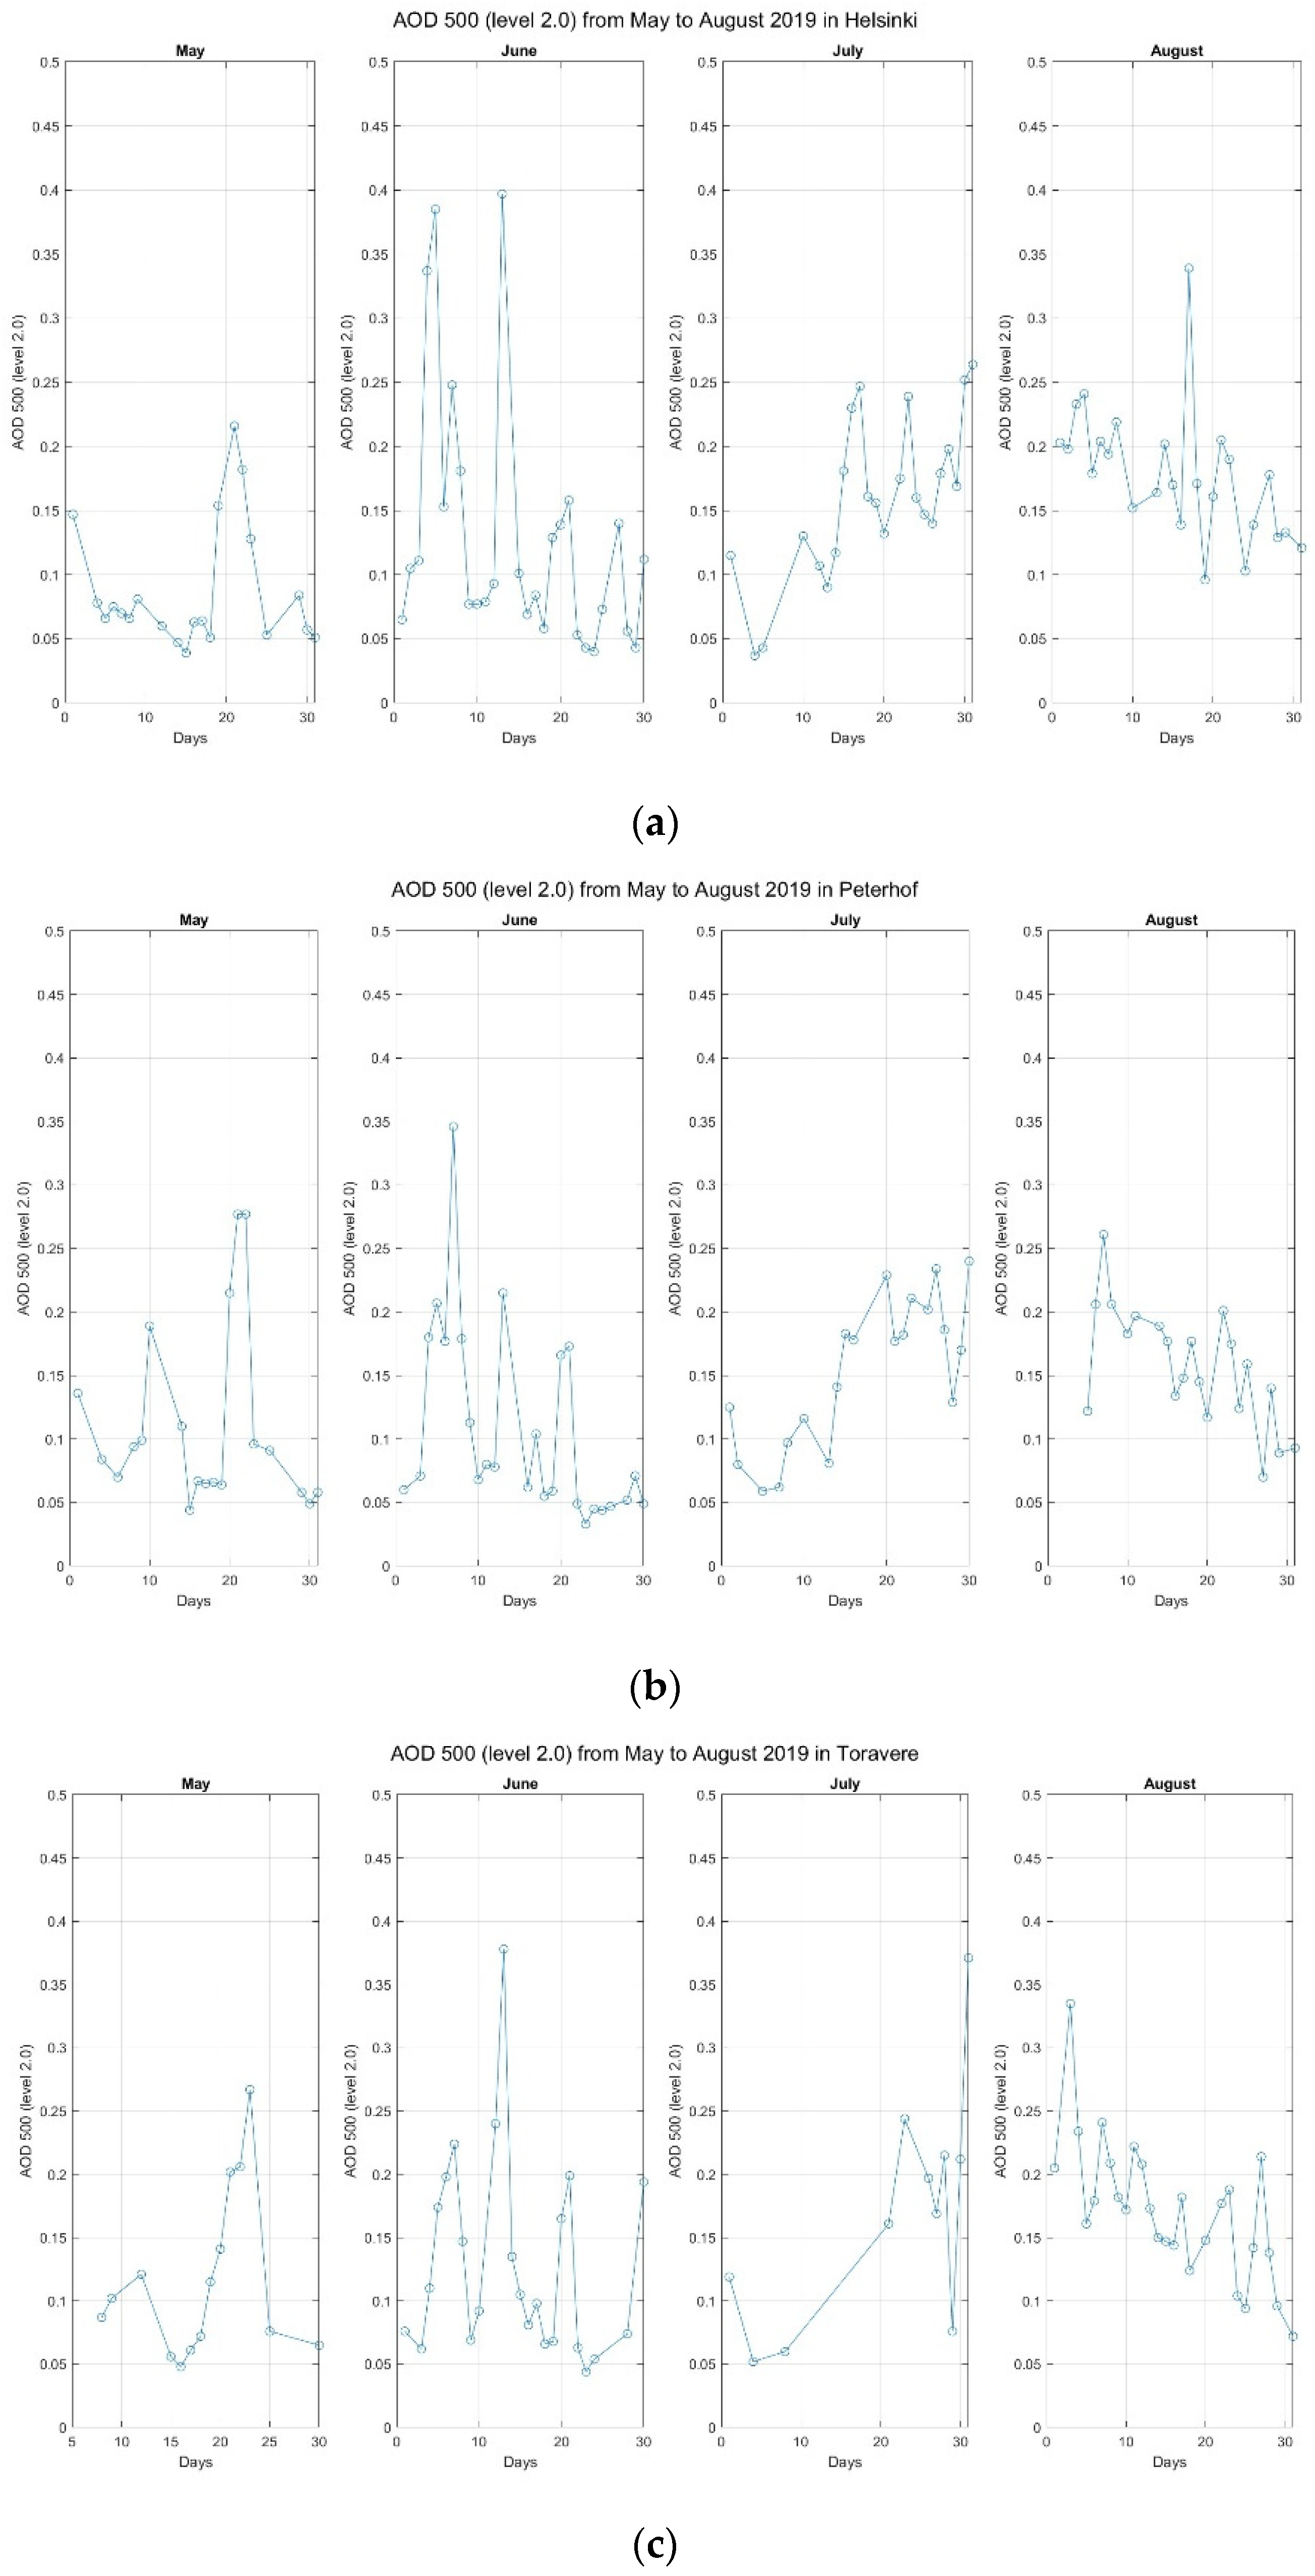
3.3. Focus on 2019 and Link with Wildfires

This led us to focus on the analyses of the 2019 case. The data are available for the following stations: Peterhof, Toravere, Helsinki, Helsinki Lighthouse, and Gustav Dalen. The analyses of the annual trends clearly show that the summer AOD values at these stations were significantly higher than in the rest of the year. Table 2 shows the summer AODs for these stations.
The data show that the AOD levels in April, July, and August were significantly higher than those for the annual averages, which leads to the conclusion that during spring and summer in 2019, the aerosol episodes dominated the aerosol optical depth values for the entire year.
Moreover, compared to the other summer trend AOD level (Figure 8), the 2019 summer is higher: it was always around 0.15 for each station (Helsinki Lighthouse, Irbe Lighthouse, Gustav Dalen Tower, and Helsinki). In fact, most of the time, the AOD level was under 0.15 for the other years (2007 to 2009, 2015 to 2018 and 2020) or was not the same at each station, which did not allow us to make conclusions (2006, 2010, 2013, 2014). In some cases, due to the small number of data, for example, from 1999 to 2005, we have only two values of the maximum AOD level; therefore, we cannot make any conclusions. However, another study was conducted for the year 2002 (see [34] for the entire study and results). In this study, the high AOD level (0.7 for August 2002) during 2002 was related to a very warm and long period (of seven months from February to September 2002) increasing the number of wildfires.
In the following section, we will focus on the period of April to August 2019 to examine the origin of this unusual level of AOD during this period.
To explain this higher average of AOD, we have made further analyses and provided information on extreme wildfire episodes across Europe during this period. The fire episodes in the selected countries are provided in Table 3. The selection was based on the vicinity of particular countries towards the Baltic and prevailing summer wind direction patterns (southerly), as well as on data availability (this is why there isn’t mention of Belarus in the following).
Apart from Ukraine, all the other countries had much worse fire situations in 2019 than for the average of 2009–2018. That is both in terms of the number of fires and burnt areas (except for Sweden and Ukraine). The fire situation in Europe as of 25 June 2019 is shown below in Figure 9.
The picture clearly shows how the entire Baltic catchment area is covered by regions with a very high wildfire outbreak probability. The reports [35] show that May and June 2019 were warm and dry in Finland; dryness contributed to wild forest fire outbreaks in July and August. There were two peaks of fires in Germany in 2019, one in April and the second one in the June–July period [35]. In Latvia, the wild forest fire peak season in 2019 ranged from April to August, and it coincided with the fire peak in Lithuania. The same pattern was reported for Poland, while in Romania, it was April. There were two fire outbreak peaks in Sweden, one in April and the second one in summer, which is similar to the Ukraine case [35]. Both peak periods coincide with high AOD values, which were measured at the selected AERONET stations around the Baltic Sea (Table 2).
Between late June and late July 2019, there were two very distinct heat waves, which set all-time high temperature records in a number of European countries. The temperatures recorded in various European countries in late July 2019 are shown in Figure 10.
Again, it is clear that the areas located in the vicinity of the Baltic Sea and in the areas where the AERONET stations are located show high air temperatures, reaching extreme values in relation to multiannual averages. Such a situation led to many casualties and extreme dryness in vast European areas, hence, facilitating conditions for wildfire outbreaks.
The biomass burning aerosol presence in the area of the Baltic is very well reflected in the high AOD values recorded at three stations around the Baltic between May and August 2019 (Figure 11).
There are three AOD peak periods observed at all three stations: the first one in May, the second one in June, and the last one in August. The AOD values reach levels of up to 0.4 (Helsinki in June 2019), and there is a visible increasing trend towards summer with constantly high values of AOD for the period of late July and the start of August. That may indicate the increase and the accumulation of biomass burning pollution with time and subsequent fire outbreaks.

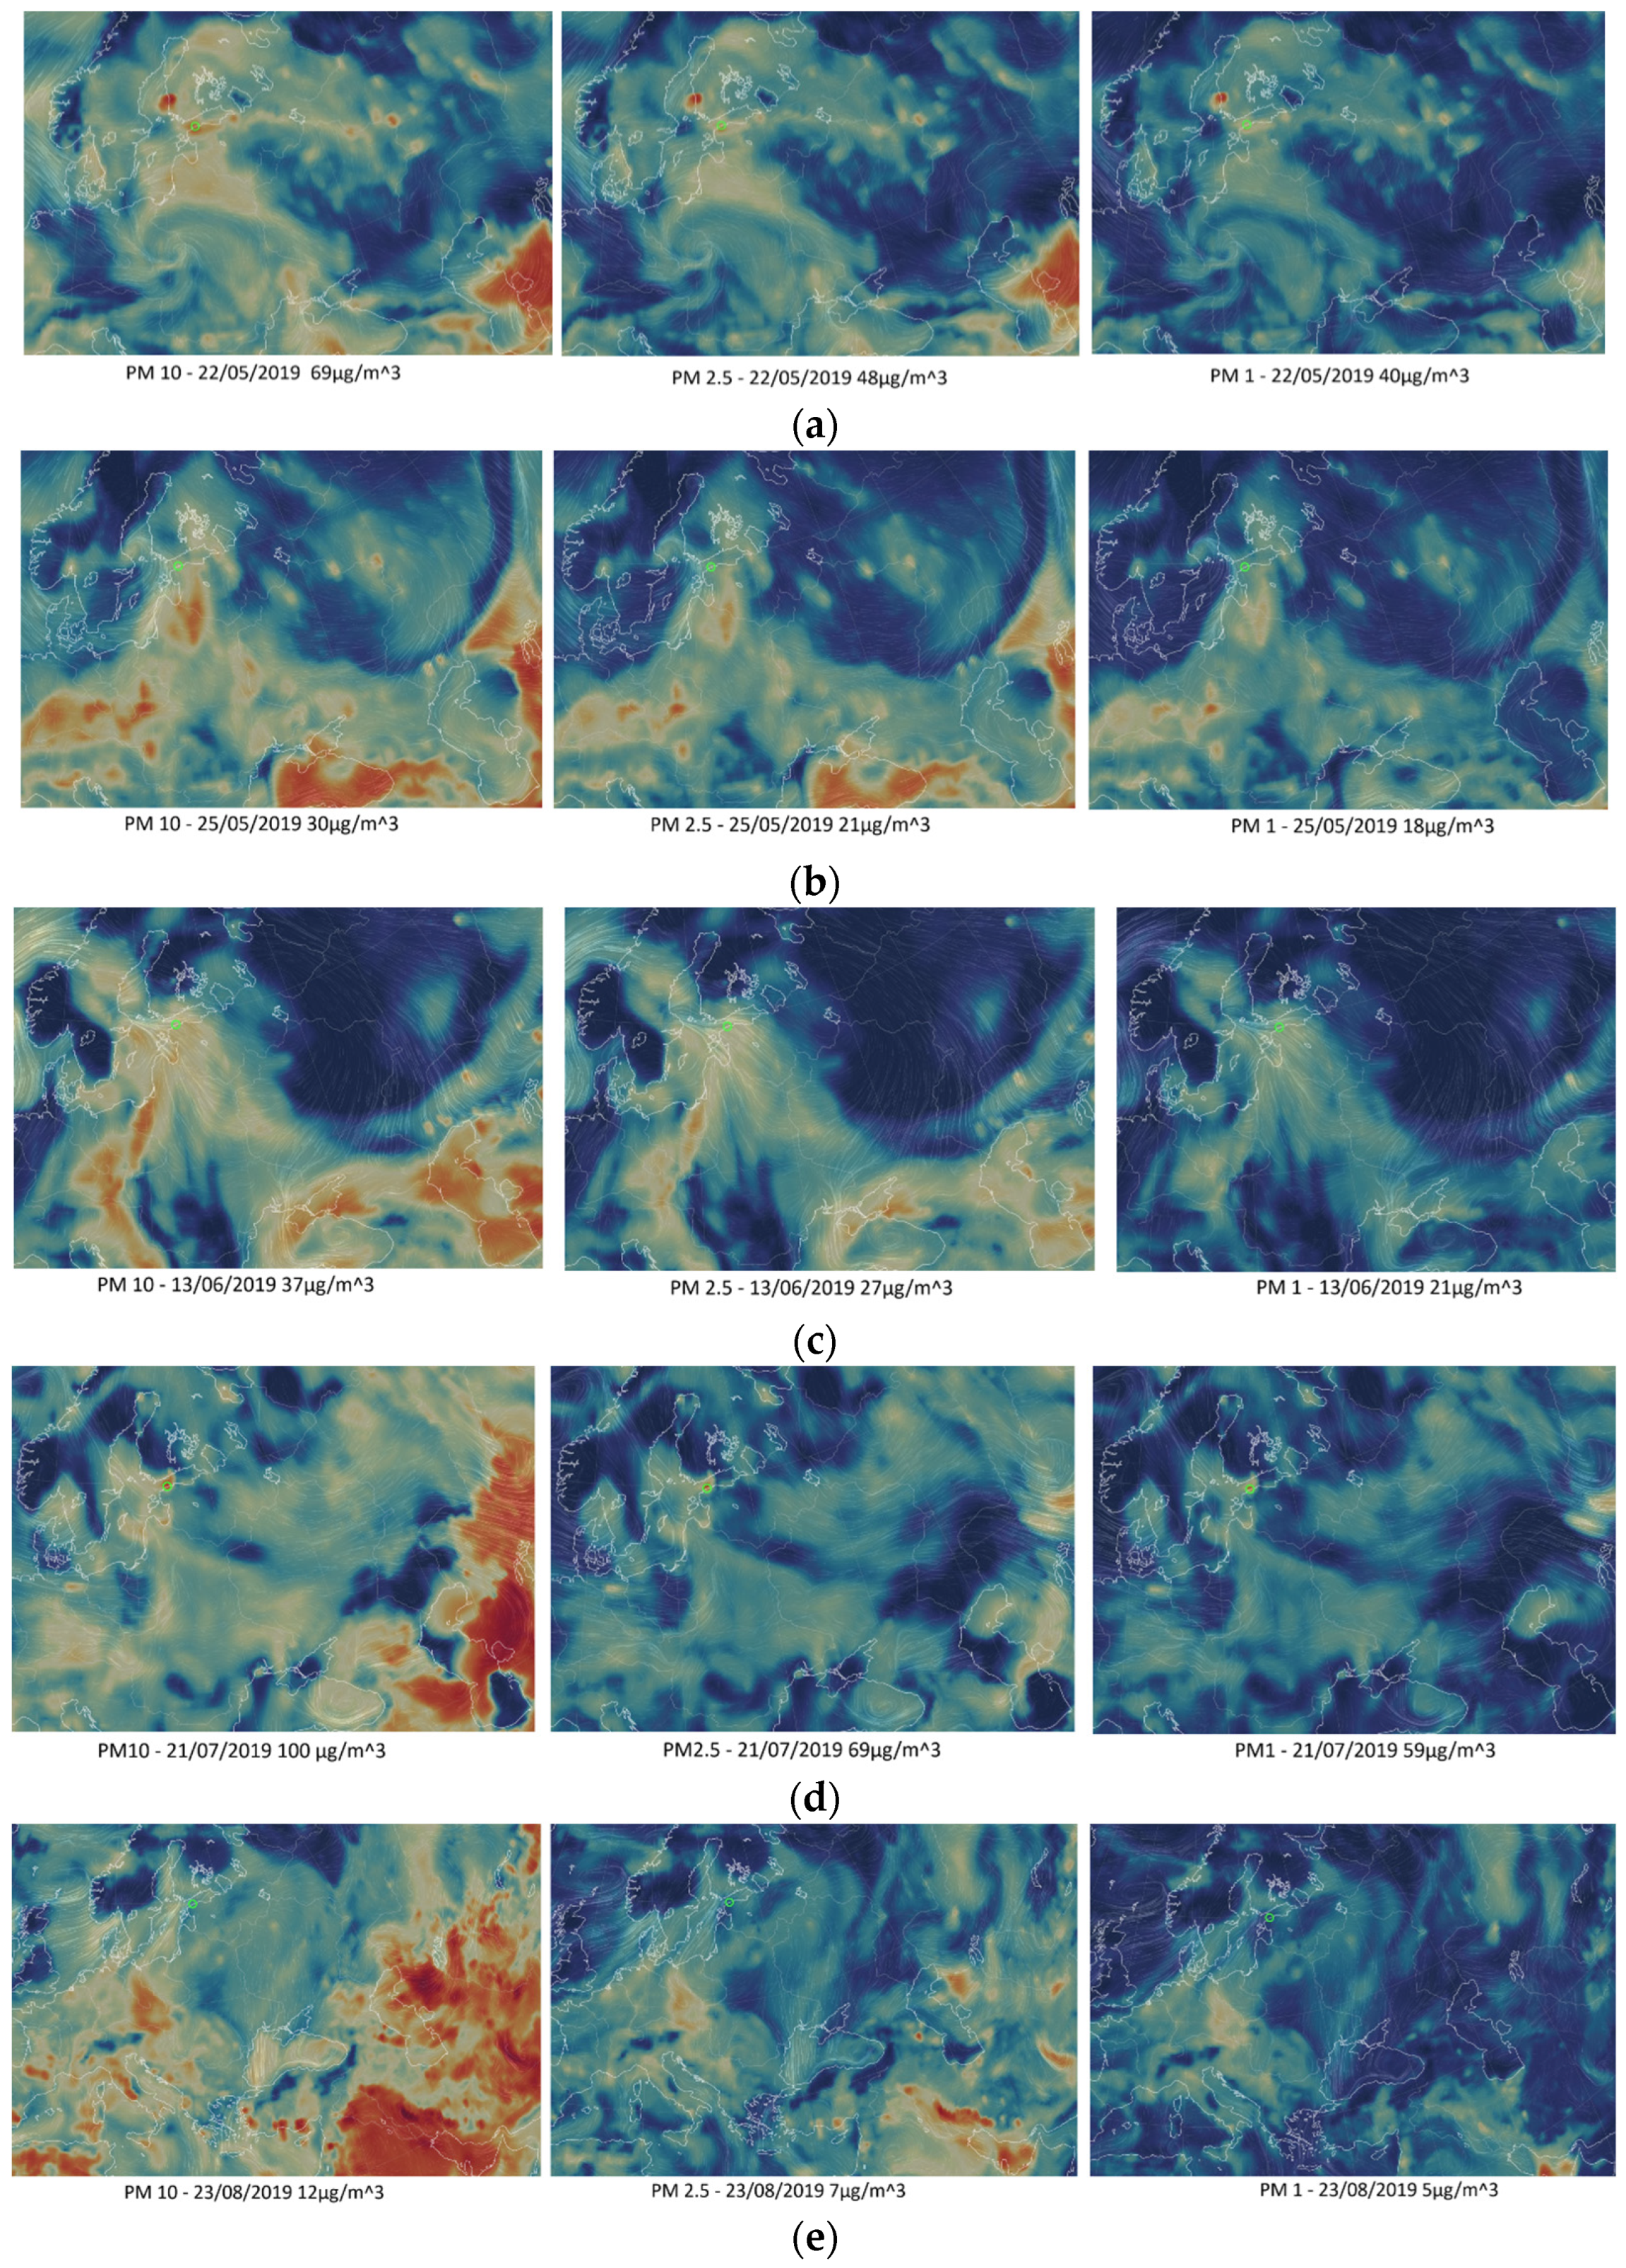
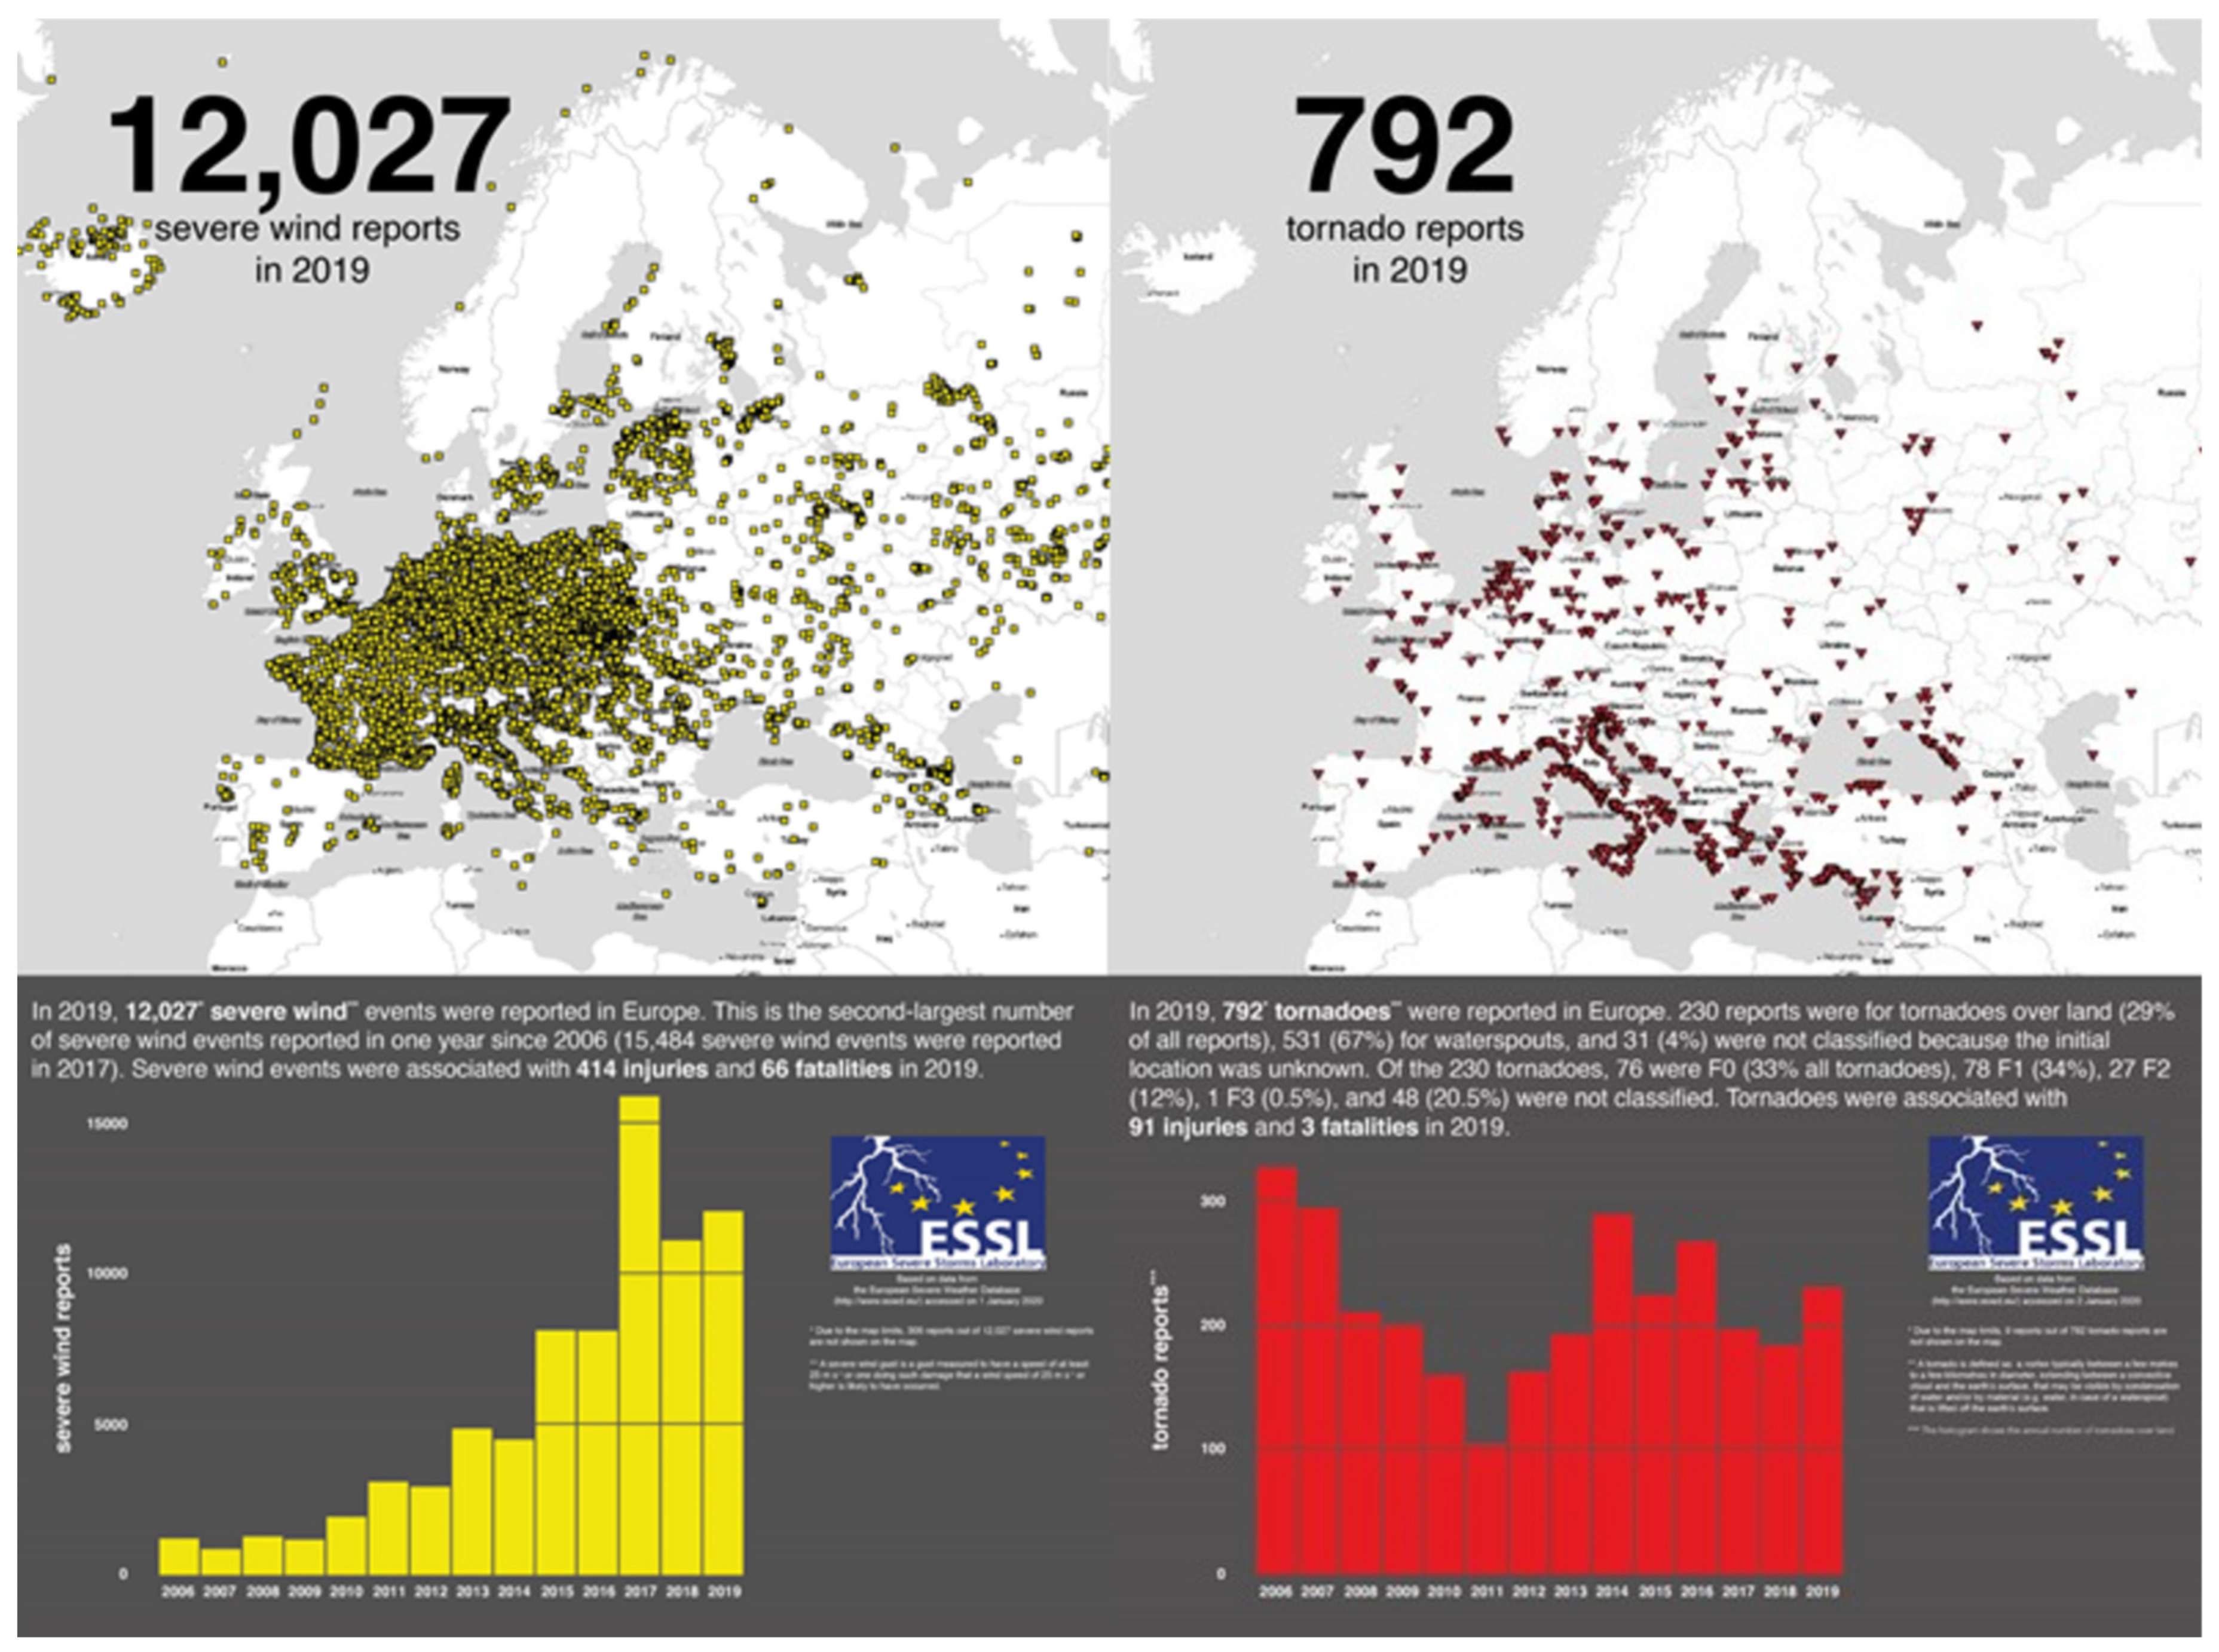
3.4. Transport of Aerosols by Wind and Link with Wildfires

Another important point to consider in the analyses of the AOD in 2019 is the wind transport of aerosols. Meteorological events have an impact on aerosol concentration, AOD, and their circulation in the atmosphere, such as mesoscale ones like sea breeze (SB) or nocturnal low-level jet (LLJ), which significantly influence coastal air quality thanks to their ability to sufficiently mix different types of aerosols. Moreover, SB events are linked with an increase of PM1 and PM2.5 concentrations [38]. PM1 represents particles with a diameter less than 1.0 μm (fine particles), PM2.5 for particles under 2.5 μm, and PM10 for particles under 10 μm (both fine and coarse particles).
In Figure 12, we focus on the particle transport by the wind related to the wildfires identified before: this figure represents the circulation of the wind and the quantities of particles at different sizes (PM10, PM2.5, PM1) with a specific value located at (59.50° N, 24.63° E), with the green circle in the area of the three stations: Helsinki, Peterhof, and Toravere.
We chose specific dates (22 May 2019, 25 May 2019, 13 June 2019, 21 July 2019, and 23 August 2019) for which we have a high value of AOD in Figure 11d in the area of the three stations: Helsinki, Peterhof, and Toravere. For 22 May 2019 and 25 May 2019, the AOD is between 0.21 and 0.27 at each station; for 13 June 2019, it is around 0.4 for all the stations; and for 21 July 2019 and 23 August 2019, it is around 0.2.
On 22 May 2019, the wind was essentially coming from the southeast and the Black Sea area, passing by Ukraine, Belarus, Latvia, Lithuania, and Estonia. We have a similar quantity of PM1 and PM2.5 (40 μg·m−3 and 48 μg·m−3) and a high value of PM10 (69 μg·m−3). This high value of PM10 can be explained by the excessive number of wildfires this year, according to Table 3: 201% of the average 2019 for Latvia and 163% for Lithuania. Thus, the wind transports the particles from these countries to the area of the three stations, making a high value of AOD.
It is the same process for the two other days:
On 25 May 2019, the wind came from Poland and Germany, where there is a high value for each PM10, PM2.5, and PM1, and transported particles to the area we are studying. This can be illuminated by the number of wildfires (according to Table 3) in Poland (135%) and Germany (193%) during 2019.
On 13 June 2019, the wind came from the Black Sea area and transported particles from there to our area of study, which explains the high level of AOD around 0.4 on this day (Figure 11d).
On 21 July 2019, the wind came from France, Germany, and Russia, with a high level of particles in both of these areas resulting in a high level of PM10, PM2.5, and PM1 for this day, between 60 and 100 μg·m−3. Moreover, according to Figure 10, around 25 July 2019 was a period of a heatwave with temperatures higher than 40 °C in France and 35 °C in Germany, making wildfires easier to spread, corroborating the 193% of the average 2019 wildfires in Germany (Table 3).
On 23 August 2019, there was a high level of particles around Europe, especially Italy and Germany, and around Russia and Kazakhstan. The wind came from these areas, which explains the level of AOD on this day (around 0.2 according to Figure 11d).
Moreover, 2019 was a year with many severe wind events in all of Europe: more than 12,000 were recorded, and there were several tornadoes in the same area (792) [40]. Figure 13 presents an overview of these events across Europe.
This accumulation of extreme wind events in 2019 corroborates the previous observations linking the wildfires and AOD level around the Baltic Sea (because of wind transport) further with the following Figure 14, which represents the major convective storm events in 2019.
Figure 14 shows that many extreme wind events have taken place in Europe, especially during the summer of 2019. On 4th June, several tornadoes occurred, including two strong F2 tornadoes in the Netherlands and western Germany. An active period of severe weather started on 10 June, with a hailstorm that struck parts of Germany. On 1st July, 372 severe weather reports were amassed in France, Switzerland, northern Italy, southern Germany, the Czech Republic, and Poland into Ukraine. Most of them were about severe storms producing severe wind gusts.
In this way, all the extreme wind events occurring during the summer of 2019 around the area of the Baltic Sea have a big impact on the AOD level by transporting particles from wildfires happening around Europe and beyond to this area. Thus, wind is a variable to take into account in addition to wildfires when studying the AOD level.

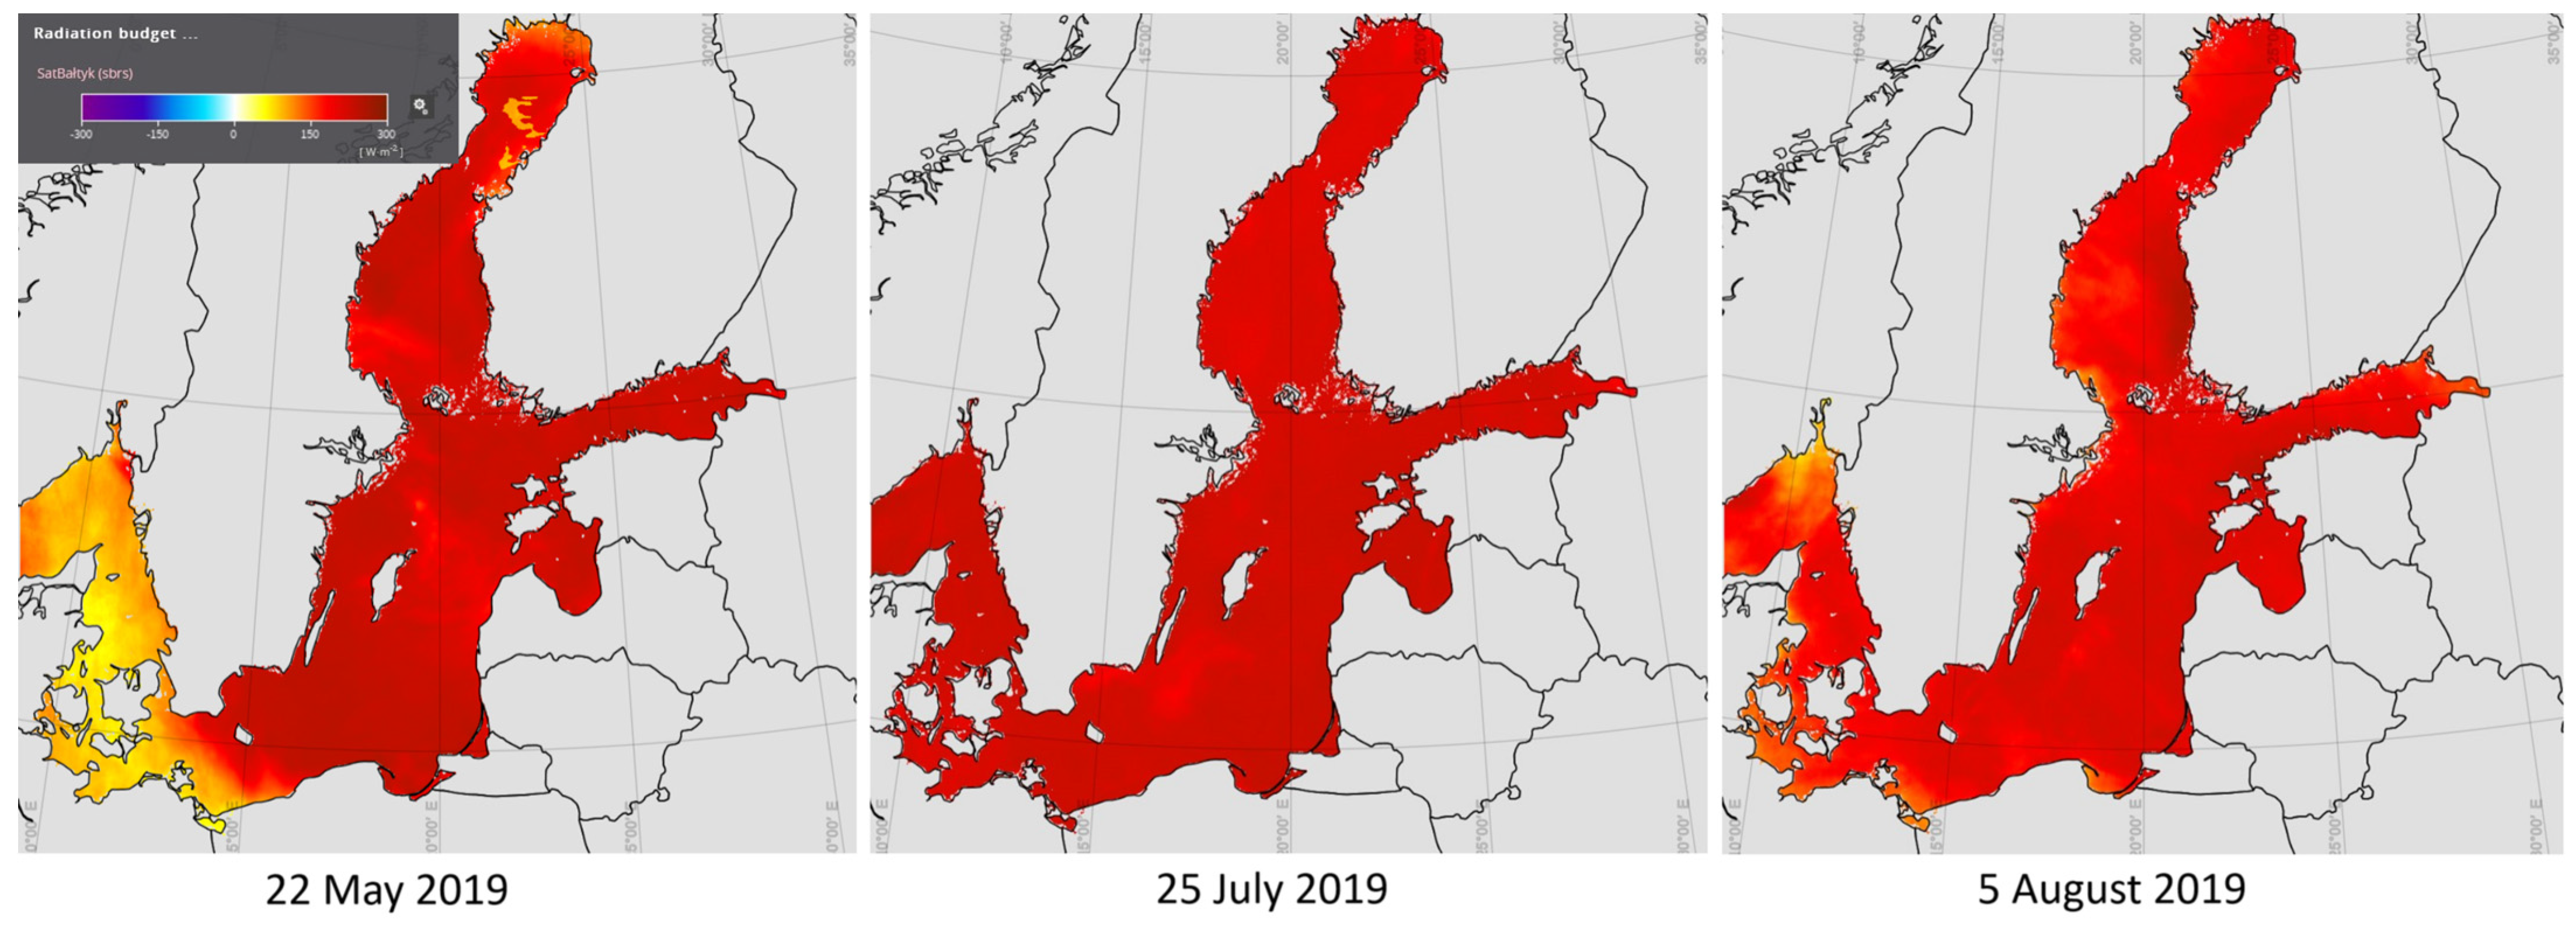
3.5. Aerosols and Climate Change

Earlier, a similar high aerosol presence over the Baltic Sea due to wild forest fire activity in eastern Europe was observed in 2002 [34,41]. That situation was also a result of a warm and dry spring and summer in Europe. However, the 2019 episode is very prominent when bearing climate change consequences in mind. The extreme weather situation was present across Europe, leading to extreme wild forest fire activity, which caused many fatalities and posed health risks to thousands of Europeans, especially with the wind capacity to transport the particles.
Unfortunate examples also include the very recent pan-European problem with the extreme wildfires in Greece and other regions of Europe in the summer of 2023. In the following months, Ww must analyze the regional consequences and the level of atmospheric aerosols related to the wildfires. Atmospheric aerosols produced in wildfires cause a significant impact on climate through the radiative effect, owing to their various optical and chemical properties [12,27,41]. Biomass burning events produce large amounts of trace gases and aerosols, which enter the troposphere, causing adverse air quality conditions locally but also in distant regions located downwind. Extreme wildfires may emit aerosol particles into the stratosphere, allowing for global transport [12,27]. Fire-induced aerosols cause the reduction of global “green areas”, leading to the reduction of carbon uptake by ecosystems.
These fire-related modifications in radiative balance further induce modifications in meteorological and hydrologic factors. These, in turn, affect the frequency of fire occurrence through the modification of moisture levels, hence local weather conditions. These effects are visible in Figure 15, which presents the radiation budget for selected days between May and August 2019 for the Baltic Sea. Clearly, the radiative budget shows very high values, indicating the warming of the atmosphere, which is very likely connected with the presence of biomass burning aerosol particles, which absorb solar radiation.
With this impact on the radiation budget and solar radiation, the nucleation process to create new aerosol particles can be affected. In fact, this process is highly related to solar radiation (for more details about nucleation, see [9]). Thus, we can assume that aerosols from wildfires can impact other aerosol particle formation, like nucleation processes, by influencing the radiation budget over the Baltic Sea.
Moreover, on top of environmental disturbances due to the presence of biomass burning aerosols in the atmosphere, wildfire air pollution also poses hazards to global public health through the increase of risks and threats of a variety of respiratory and cardiovascular diseases, thereby increasing mortality. The global estimates show that fire-related aerosol particles can be responsible for as many as 33,000 deaths per annum [3].

4. Conclusions

Aerosols influence the radiative budget of the planet by directly affecting the atmospheric radiation budget by absorbing or backscattering solar radiation. Aerosol–radiation interactions involve immediate effects, including fast adaptation of the atmosphere to aerosol effects due to changes in local heating rates (aerosol absorption), which affect atmospheric stability and/or the cloud cover rate.
Aerosol particles also have an indirect impact by modifying the atmosphere and cloud properties via a microphysical influence on the cloud droplet and ice crystal formation.
Despite scarce aerosol data, we made an attempt to link the observed multidecadal variations of aerosol optical properties over the Baltic with climatic changes. The analyses show that the aerosol optical depth values remained rather stable or slightly increased at low levels until c. 2011, and then the trends reversed, and the AOD values continued to decrease until the present time. This indicates relatively clean aerosol conditions in the air over the Baltic Sea.
However, there are some cases when the aerosol optical depth values are high, and such a situation was observed in the first half of 2019. The high AOD values at the Baltic AERONET stations in spring and summer are linked to dry weather conditions in spring and extremely high air temperatures in summer across Europe. These conditions led to outbreaks of a number of extreme wildfires in various parts of Europe, including the countries adjacent to the Baltic.
Biomass burning produced large quantities of aerosols, which were injected into the atmosphere and further distributed over the entire region by the wind. The significant prevalence of fine aerosol particles (associated with smoke particles) in the detected aerosol ensemble at all the stations supports this observation.
This leads to the second goal of this paper: linking the climate change consequences, such as extreme environmental events (in our case, wildfires) with aerosol optical properties. In cases like the 2019 situation in Europe, climate changes lead to significant disturbances in the regional radiative budget. This, in turn, makes the climate change processes even more unpredictable and difficult to study and leads to enhanced climate instability. This climate instability, as we studied previously, has an impact on wildfires and leads again to an increase of them, thus creating a vicious circle with climate change, wildfires, and an increase of AOD by spreading aerosols in the atmosphere.
Extreme wildfires have become a very urgent problem, since they occur every year in all parts of the world. Several factors are responsible for the variability of the distribution and levels of reported damage due to wildfires. Fire hazard is related to a combination of such factors as air temperature, precipitation and humidity patterns, wind force and direction, and general climatic changes. The predicted increase in wildfire frequency of occurrence depends on the global air temperature increase scenario; however, considering that weather patterns modify the moisture content of the vegetation, we must assume that fire danger will continue to worsen over time [3,43].
Since we know that climate change will increase the hazards of more frequent wildfire outbreaks, humans urgently need to work on mechanisms and tools for decreasing the risk of wildfire outbreaks and decreasing the magnitude of the wildfire risk components [44]. These must include such actions as the increase in awareness and, hence, preparedness for health hazards, since not only societies in direct vicinity of fires are affected by the polluted air, but also distant communities are at risk due to the transport of biomass burning aerosols in the atmosphere. Societies worldwide must invest in education regarding short- and long-term adverse consequences to their health due to smoke and aerosol emissions from wildfires [45].
We can cite an example Ukraine, where there is still incineration of agricultural residues practiced every year. This was the first cause of wildfire between 2020 and 2022 in Ukraine, even if it is an illegal practice. Therefore, we need to raise awareness about wildfires and their consequences, as creating laws is not enough, and continue to carry on studies in this area about wildfires and AOD. As we saw before, these issues concern not only the country in which they take place, but the area all around it. The Ukraine wildfire has an impact on the AOD around the Baltic Sea.
Societies must also invest in the improvement of vegetation resilience. This can be obtained through more environmentally oriented regional planning of landscape vegetation patterns and adapting to changing bioclimatic conditions.

Author Contributions

Conceptualization, T.Z.; Methodology, T.Z.; validation, T.Z. and A.W.; investigation, T.Z., A.W., M.L.; data curation, A.W.;writing—original draft preparation, T.Z., M.L.; writing—review and editing, T.Z., A.W. All authors have read and agreed to the published version of the manuscript.

Funding

This research received no external funding.

Data Availability Statement

Dataset available on request from the authors.

Acknowledgments

We are grateful to AERONET PIs and we acknowledge the AERONET team for the use of the data from the AERONET stations.

Conflicts of Interest

The authors declare no conflict of interest.

References

  1. Bates, T.S.; Huebert, B.J.; Gras, J.L.; Griffiths, F.B.; Durkee, P.A. International Global Atmospheric Chemistry (IGAC) project’s first Aerosol Characterization Experiment (ACE 1): Overview. J. Geophys. Res. 1998, 103, 16297–16318. [Google Scholar] [CrossRef]
  2. d’Almeida, G.; Koepke, P.; Shettle, E. Atmospheric aerosols. In Global Climatology and Radiative Characteristics; A. DEEPAK Publishing: Hampton, VA, USA, 1991; p. 561. [Google Scholar]
  3. Available online: https://www.ipcc.ch/report/ar5/syr/ (accessed on 29 May 2024).
  4. Sano, I.; Lynch, M.; Ogasa, K.; Mukai, S. Photopolarimetric observations of atmospheric aerosols from space and/or sea surface. Adv. Space Rev. 2002, 29, 1867–1872. [Google Scholar] [CrossRef]
  5. Smirnov, A.; Holben, B.N.; Slutsker, I.; Giles, D.M.; McClain, C.R.; Eck, T.F.; Sakerin, S.M.; Macke, A.; Croot, P.; Zibordi, G.; et al. Maritime Aerosol Network as a component of Aerosol Robotic Network. J. Geophys. Res. 2009, 114. [Google Scholar] [CrossRef]
  6. Voiland, A. Aerosols: Tiny Size, Big Impact. Earth Observatory; NASA: Washington, DC, USA, 2010.
  7. Zbizika, R.; Pakszys, P.; Zielinski, T. Deep Neural Networks for Aerosol Optical Depth Retrieval. Atmosphere 2022, 13, 101. [Google Scholar] [CrossRef]
  8. Julia Cole 19 March 2001. Available online: https://earthobservatory.nasa.gov/features/BiomassBurning (accessed on 29 May 2024).
  9. Plauskaite, K.; Ulevicius, V.; Spirkauskaite, N.; Bycenkiene, S.; Zielinski, T.; Petelski, T.; Ponczkowska, A. Observations of new particle formation events in the south-eastern Baltic Sea. Oceanologia 2010, 52, 53–75. [Google Scholar] [CrossRef]
  10. Schutgens, N.; Sayer, A.M.; Heckel, A.; Hsu, C.; Jethva, H.; de Leeuw, G.; Leonard, P.J.T.; Levy, R.C.; Lipponen, A.; Lyapustin, A.; et al. An AeroCom/AeroSat Study: Intercomparison of Satellite AOD Datasets for Aerosol Model Evaluation; Copernicus GmbH: Göttingen, Germany, 2020. [Google Scholar] [CrossRef]
  11. Twomey, S. Atmospheric Aerosols; Elsevier: New York, NY, USA, 1977; p. 289. [Google Scholar]
  12. Cappelletti, D.; Petroselli, C.; Mateos, D.; Herreras, M.; Ferrero, L.; Losi, N.; Gregorič, A.; Frangipani, C.; La Porta, G.; Lonardi, M.; et al. Vertical profiles of black carbon and nanoparticles pollutants measured by a tethered balloon in Longyearbyen (Svalbard islands). Atmos. Environ. 2022, 290, 119373. [Google Scholar] [CrossRef]
  13. Li, J.; Carlson, B.E.; Yung, Y.L.; Lv, D.; Hansen, J.; Penner, J.E.; Liao, H.; Ramaswamy, V.; Kahn, R.A.; Zhang, P.; et al. Scattering and absorbing aerosols in the climate system. Nat. Rev. Earth Environ. 2022, 3, 363–379. [Google Scholar] [CrossRef]
  14. Brown, H.; Liu, X.; Pokhrel, R.; Murphy, S.; Lu, Z.; Saleh, R.; Mielonen, T.; Kokkola, H.; Bergman, T.; Myhre, G.; et al. Biomass burning aerosols in most climate models are too absorbing. Nat. Commun. 2021, 12, 277. [Google Scholar] [CrossRef]
  15. China, S.; Scarnato, B.; Owen, R.C.; Zhang, B.; Ampadu, M.T.; Kumar, S.; Dzepina, K.; Dziobak, M.P.; Fialho, P.; Perlinger, J.A.; et al. Morphology and mixing state of aged soot particles at a remote marine free troposphere site: Implications for optical properties. Geophys. Res. Lett. 2015, 42, 1243–1250. [Google Scholar] [CrossRef]
  16. Tian, P.; Zhang, N.; Li, J.; Fan, X.; Guan, X.; Lu, Y.; Shi, J.; Chang, Y.; Zhang, L. Potential influence of fine aerosol chemistry on the optical properties in a semi-arid region. Environ. Res. 2023, 216, 0013–9351. [Google Scholar] [CrossRef]
  17. Zielinski, T.; Ferrero, L.; Grassl, S.; Hansen, G.H.; Mateos, D.; Mazzola, M.; Neuber, R.; Pakszys, P.; Posyniak, M.; Ritter, C.; et al. Study of aerosol optical and chemical properties during a long-range transport of biomass burning particles towards Spitsbergen in summer. Atmosphere 2017, 11, 84. [Google Scholar] [CrossRef]
  18. Kokhanovsky, A.; Tomasi, C.; Smirnov, A.; Herber, A.; Neuber, R.; Ehrlich, A.; Lupi, A.; Petkov, B.H.; Mazzola, M.; Ritter, C.; et al. Remote Sensing of Arctic Atmospheric Aerosols. In Physics and Chemistry of the Arctic Atmosphere in Springer Polar Sciences; Springer: Berlin/Heidelberg, Germany, 2020. [Google Scholar] [CrossRef]
  19. Pakszys, P.; Zielinski, T.; Fererro, L.; Kotynska-Zielinska, I.; Wichorowski, M. Changing Arctic. Firm scientific evidence versus public interest in the issue. Where is the gap? Oceanologia 2020, 62, 593–602. [Google Scholar] [CrossRef]
  20. Ferrero, L.; Sangiorgi, G.; Perrone, M.; Rizzi, C.; Cataldi, M.; Markuszewski, P.; Pakszys, P.; Makuch, P.; Petelski, T.; Becagli, S.; et al. Chemical composition of aerosol over the Arctic Ocean from two years of summer AREX cruise: Ions, amines, EC/OM, PAHs, n-alkanes, and metalsresults from two years of summer AREX cruise. Atmosphere 2019, 10, 54. [Google Scholar] [CrossRef]
  21. Kabanov, D.; Sakerin, S.; Kruglinsky, I.; Ritter Ch Sobolewski, P.; Zielinski, T. Comparison of atmospheric aerosol optical depths measured with different sun photometers in three regions of Spitsbergen Archipelago. In Proceedings of the SPIE 24th International Symposium on Atmospheric and Ocean Optics: Atmospheric Physics, Tomsk, Russia, 2–5 July 2018; p. 10833. [Google Scholar]
  22. Markowicz, K.M.; Pakszys, P.; Ritter, C.; Zielinski, T.; Udisti, R.; Cappelletti, D.; Mazzola, M.; Shiobara, M.; Zawadzka, O.; Lisok, J.; et al. Impact of Canadian intense fires on aerosol optical properties measured over the European Arctic in July 2015. J. Geophys. Res. Atmos. 2017, 121, 14487–14512. [Google Scholar]
  23. Tomasi, C.; Kokhanovsky, A.; Lupi, A.; Ritter, C.; Smirnov, A.; O’Neill, N.T.; Stone, R.; Holben, B.N.; Nyeki, S.; Wehrli, C.; et al. Aerosol remote sensing in polar regions. Earth Sci. Rev. 2015, 140, 108–157. [Google Scholar] [CrossRef]
  24. She, L.; Zhang, H.K.; Li, Z.; de Leeuw, G.; Huang, B. Himawari-8 Aerosol Optical Depth (AOD) Retrieval Using a Deep Neural Network Trained Using AERONET Observations. Remote Sens. 2020, 12, 4125. [Google Scholar] [CrossRef]
  25. Choi, W.; Lee, H.; Park, J. A First Approach to Aerosol Classification Using Space-Borne Measurement Data: Machine Learning-Based Algorithm and Evaluation. Remote Sens. 2021, 13, 609. [Google Scholar] [CrossRef]
  26. Alonso-Blanco, E.; Calvo, A.I.; Pont, V.; Mallet, M.; Fraile, R.; Castro, A. Impact of Biomass Burning on Aerosol Size Distribution, Aerosol Optical Properties and Associated Radiative Forcing. Aerosol Air Qual. Res. 2014, 14, 708–724. [Google Scholar] [CrossRef]
  27. Ferrero, L.; Cappelletti, D.; Busetto, M.; Mazzola, M.; Lupi, A.; Lanconelli, C.; Becagli, S.; Traversi, R.; Caiazzo, L.; Giardi, F.; et al. Vertical profiles of aerosol and black carbon in the Arctic: A seasonal phenomenology along 2 years (2011–2012) of field campaigns. Atmos. Chem. Phys. 2016, 16, 12601–12629. [Google Scholar] [CrossRef]
  28. Dubovik, O.; Holben, B.; Eck, T.; Smirnov, A.; Kaufman, Y.; King, M.; Tanre, D.; Slutsker, L. Variability of absorption and optical properties of key aerosol types observed in worldwide locations. J. Atmos. Sci. 2002, 59, 590–608. [Google Scholar] [CrossRef]
  29. Kuśmierczyk-Michulec, J.; Rozwadowska, A. Seasonal changes of the aerosol optical thickness for the atmosphere over the Baltic Sea-preliminary results. Oceanologia 1999, 41, 127–145. [Google Scholar]
  30. Kuśmierczyk-Michulec, J.; Schulz, M.; Ruellan, S.; Kruger, O.; Marks, R.; de Leeuw, G.; Cachier, H. Aerosol composition and related optical properties in the marine boundary layer over the Baltic Sea. J. Aerosol Sci. 2001, 32, 933–955. [Google Scholar] [CrossRef]
  31. Available online: https://aeronet.gsfc.nasa.gov/ (accessed on 29 May 2024).
  32. Available online: https://aeronet.gsfc.nasa.gov/new_web/data_description.html (accessed on 29 May 2024).
  33. Goloub, P.; Li, Z.; Dubovik, O.; Blarel, L.; Podvin, T.; Jankowiak, I.; Lecoq, R.; Deroo, C.; Chatenet, B.; Morel, J.P.; et al. PHOTONS/AERONET Sunphotometer Network Overview. Description—Activities—Results. Available online: https://repositorio.aemet.es/bitstream/20.500.11765/5980/1/PHOTONSAERONET_sunphotometer.pdf (accessed on 29 May 2024).
  34. Zielinski, T.; Petelski, T.; Strzalkowska, A.; Pakszys, P.; Makuch, P. Impact of wild forest fires in Eastern Europe on aerosol composition and particle optical properties. Oceanologia 2016, 58, 13–24. [Google Scholar] [CrossRef]
  35. Available online: https://euneighbourseast.eu/news/publications/forest-fires-in-europe-middle-east-and-north-africa-2019/ (accessed on 29 May 2024).
  36. Available online: https://www.euronews.com/my-europe/2019/06/25/eu-hit-by-1-381-wildfires-so-far-in-2019-risk-higher-in-areas-with-heatwave (accessed on 29 May 2024).
  37. NOAA, National Weather Service—National Centers for Environmental Prediction—Climate Prediction Center. Available online: https://www.cpc.ncep.noaa.gov/products/analysis_monitoring/regional_monitoring/europe.shtml (accessed on 29 May 2024).
  38. Crumeyrolle, S.; Augustin, P.; Rivellini, L.-H.; Choël, M.; Riffault, V.; Deboudt, K.; Fourmentin, M.; Dieudonné, E.; Delbarre, H.; Derimian, Y.; et al. Aerosol Variability Induced by Atmospheric Dynamics in a Coastal Area of Senegal, North-Western Africa. Available online: https://hal.science/hal-02080486/document (accessed on 29 May 2024).
  39. Data from CAMS/Copernicus and European Commission. Available online: http://earth.nullschool.net/ (accessed on 29 May 2024).
  40. Available online: https://www.essl.org/cms/severe-weather-season-2019-summary/ (accessed on 29 May 2024).
  41. Markowicz, K.M.; Chilinski, M.T.; Lisok, J.; Zawadzka, O.; Janicka, L.; Stachlewska, I.S.; Makuch, P.; Pakszys, P.; Rozwadowska, A.; Petelski, T.; et al. Study of aerosol optical properties during long-range transport of biomass burning from Canada to Central Europe in July 2013. J. Aerosol Sci. 2016, 101, 156–173. [Google Scholar] [CrossRef]
  42. Available online: https://www.satbaltyk.en/ (accessed on 29 May 2024).
  43. Available online: https://www.fondriest.com/environmental-measurements/ (accessed on 29 May 2024).
  44. Liu, L.; Cheng, Y.; Wang, S.; Wei, C.; Pöhlker, M.L.; Pöhlker, C.; Artaxo, P.; Shrivastava, M.; Andreae, M.O.; Pöschl, U.; et al. Impact of biomass burning aerosols on radiation, clouds, and precipitation over the Amazon: Relative importance of aerosol–cloud and aerosol–radiation interactions. Atmos. Chem. Phys. 2020, 20, 13283–13301. [Google Scholar] [CrossRef]
  45. Kotynska-Zielinska, I.; Olenin, S.; Fornalewicz, K.; Pradzinska, A.; Weslawski, J.M. Perception of Arctic issues among young learners in Poland and Lithuania. Oceanologia 2020, 62, 576–587. [Google Scholar] [CrossRef]
Figure 1. The Baltic Sea region.
Applsci 14 05633 g001
Figure 2. Location of AERONET stations around the Baltic Sea.
Applsci 14 05633 g002
Figure 3. AODs at 500 and 510 nm (level 2.0) reported for three stations until 2022.
Applsci 14 05633 g003
Figure 4. AODs at 500 nm (level 2.0) from the Helgoland station between 2000 and 2014.
Applsci 14 05633 g004
Figure 5. AODs at 510/551 nm (level 2.0) from the Gustav Dalen and Helsinki stations between 2012 and 2022.
Applsci 14 05633 g005
Figure 6. AODs at 500 nm (level 2.0) reported for three stations until 2022.
Applsci 14 05633 g006
Figure 7. Fine and coarse mode particle distribution for each station over the years (level 2.0); wavelength around 500 nm.
Applsci 14 05633 g007
Figure 8. AOD level during summer through the years at each station.
Applsci 14 05633 g008
Figure 9. EFFIS fire danger forecast on 25 June 2019 for Europe [36].
Applsci 14 05633 g009
Figure 10. Maximum temperatures in Europe on 25 July 2019 [37].
Applsci 14 05633 g010
Figure 11. AODs at 500 nm (level 2.0) from the Helsinki, Peterhof, and Toravere between May and August 2019. (a) AODs at 500 nm (level 2.0) from the Helsinki station between May and August 2019. (b) AODs at 500 nm (level 2.0) from the Peterhof station between May and August 2019. (c) AODs at 500 nm (level 2.0) from the Toravere station between May and August 2019. (d) AODs at 500 nm (level 2.0) from each station between May and August 2019.
Applsci 14 05633 g011aApplsci 14 05633 g011b
Figure 12. Transport of particles (PM1, PM2.5, and PM10) with wind circulation [39]. (a)—22/05/2019 for PM10, PM2.5, and PM1. (b)—25/05/2019 for PM10, PM2.5, and PM1. (c)—13/06/2019 for PM10, PM2.5, and PM1. (d)—21/07/2019 for PM10, PM2.5, and PM1. (e)—23/08/2019 for PM10, PM2.5, and PM1.
Applsci 14 05633 g012
Figure 13. An overview of severe winds and tornadoes in 2019 across Europe [40].
Applsci 14 05633 g013
Figure 14. An overview of the major convective events in 2019 [40].
Applsci 14 05633 g014
Figure 15. Radiation budget for the Baltic Sea on 22 May, 25 July, and 5 August 2019 [42].
Applsci 14 05633 g015
Table 1. Multiannual AOD changes at the AERONET stations selected for this study.
StationYearsAOD DifferenceIncrease/DecreaseStandard DeviationCurve Coefficient
Gotland2001–20060.046145.63% (I)0.02467.29 × 10−4
Gustav Dalen2005–20220.025131.25% (I)0.01355.36 × 10−4
Helgoland2000–2014−0.03585.48% (D)0.0461−7.81 × 10⁻⁴
Helsinki2008–20210.001101.29% (I)0.02017.29 × 10−4
Helsinki Lighthouse2006–20110.01786.18% (I)0.013093.71 × 10−4
Peterhof2014–2021−0.03673.53% (D)0.01387−2.73 × 10⁻³
Toravere2002−2021−0.10655.65% (D)0.03398−3.03 × 10⁻³
Table 2. AOD values (level 2.0) at the Peterhof, Toravere, Helsinki, Helsinki Lighthouse, and Gustav Dalen stations for March and three summer months of 2019.
AERONET StationAprilJune July August Annual Average
Peterhof (500 nm)0.2660.1120.1590.1500.128
Gustav Dalen (510 nm)0.2000.1370.1250.1720.137
Helsinki (500 nm)0.1700.1310.1610.1680.137
Helsinki Lighthouse (510 nm)No data0.0770.1430.1730.146
Toravere (500 nm)0.1440.1190.1480.1540.134
Table 3. Number of fires and burnt areas reported by countries in 2019. A modified table from the “Forest Fires in Europe, Middle East and Africa 2019” [35].
Number of FiresBurnt Area (ha)
Year20192009–2018 Average2019 as % of Average20192009–2018 Average2019 as % of Average
Country
Finland14581238118565525108
Germany15237891932711514528
Latvia1107552201805596135
Lithuania279171163200107187
Poland9635714113535723110115
Romania42527415524961678149
Sweden548343911251233473026
Ukraine12611992631065372029
Disclaimer/Publisher’s Note: The statements, opinions and data contained in all publications are solely those of the individual author(s) and contributor(s) and not of MDPI and/or the editor(s). MDPI and/or the editor(s) disclaim responsibility for any injury to people or property resulting from any ideas, methods, instructions or products referred to in the content.

