
Experimental Study and Analysis on Wear Characteristics of Mining Pumps Transporting Solid-Liquid Two-Phase Flows

Abstract
1. Introduction
2. Methods: Three-Dimensional Wear Model and Numerical Method
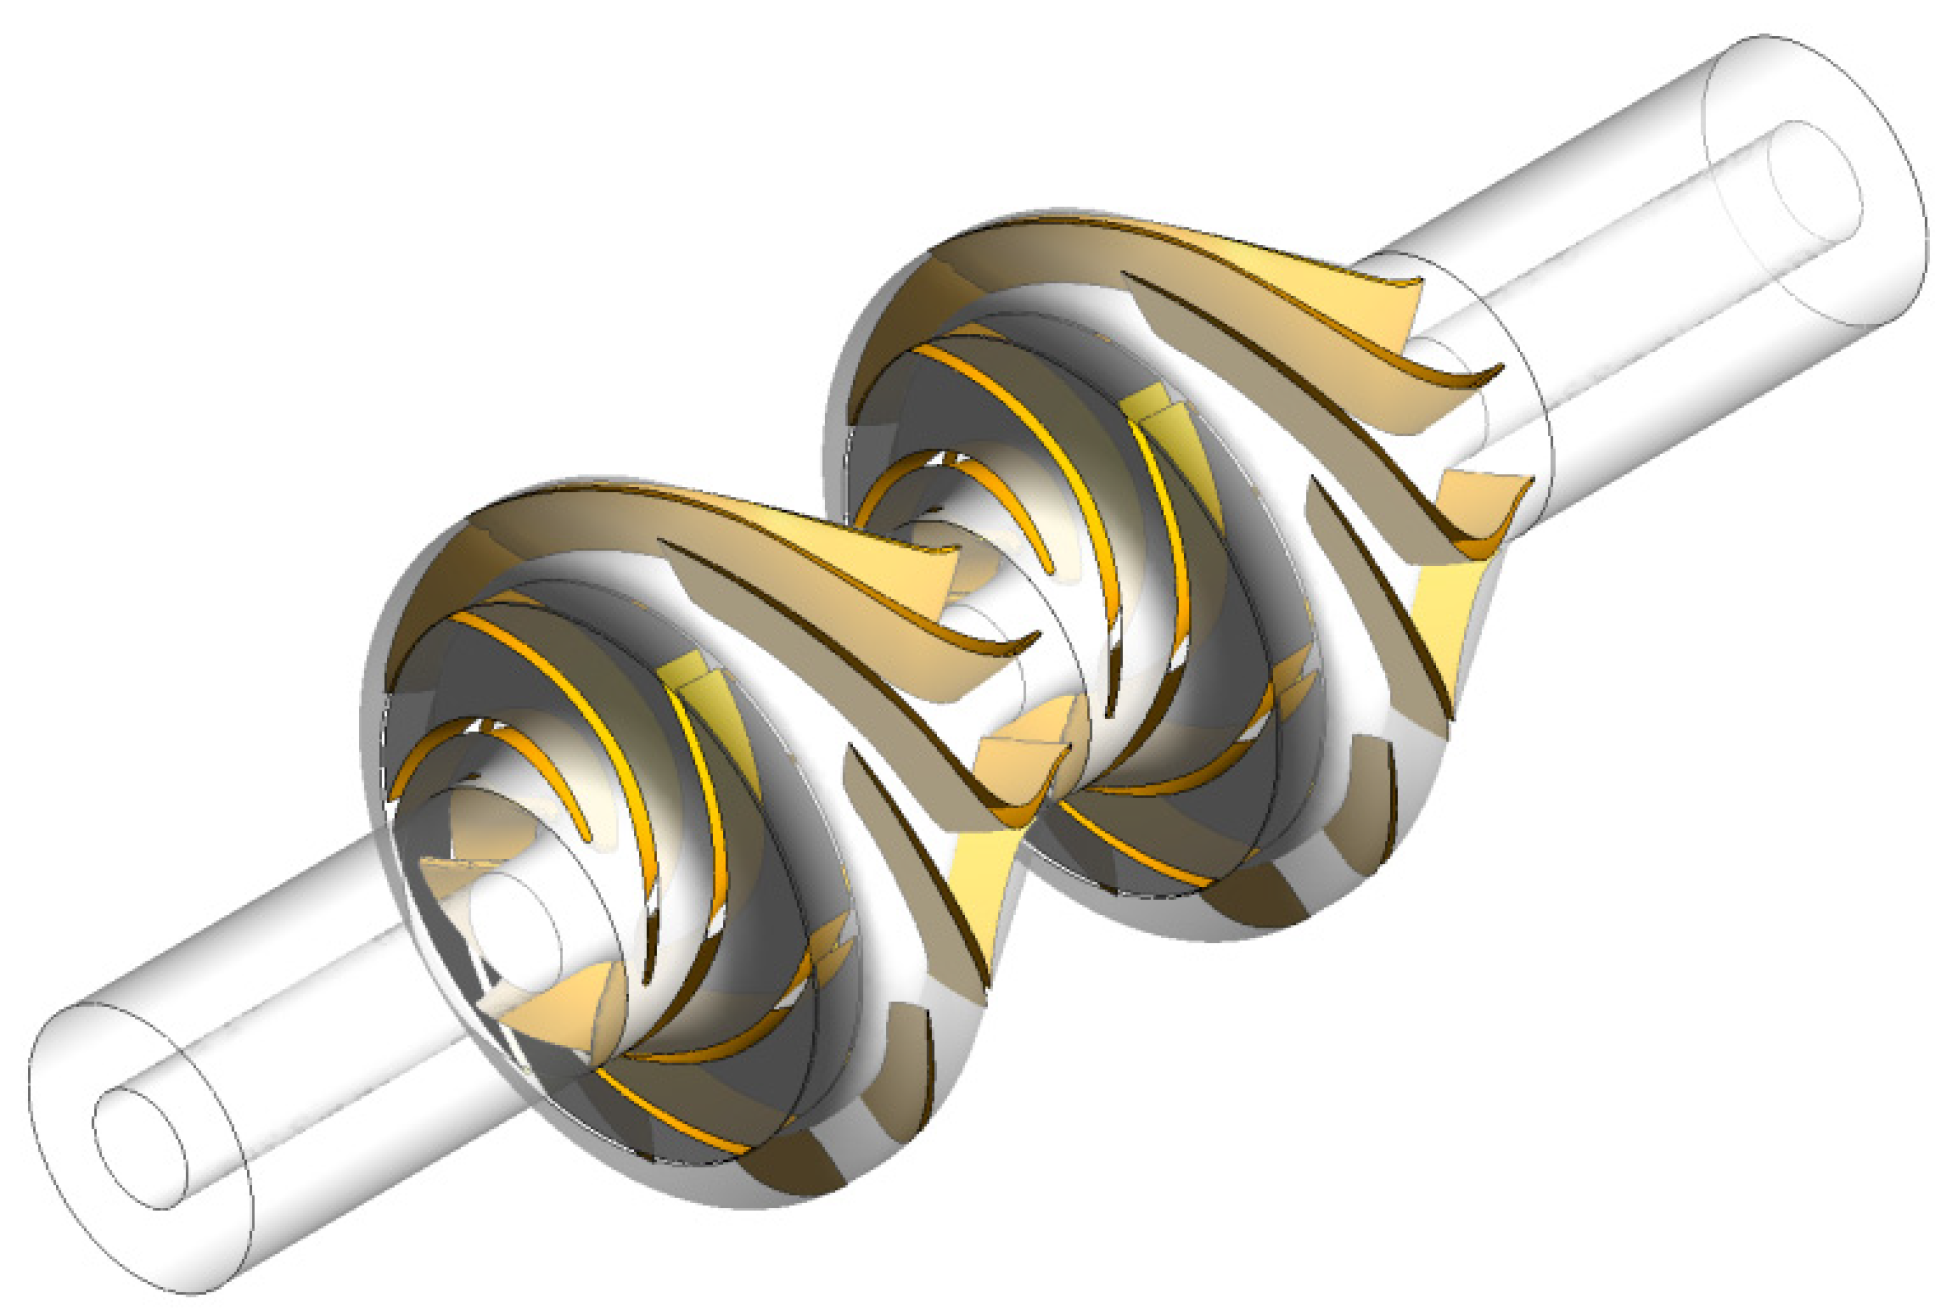
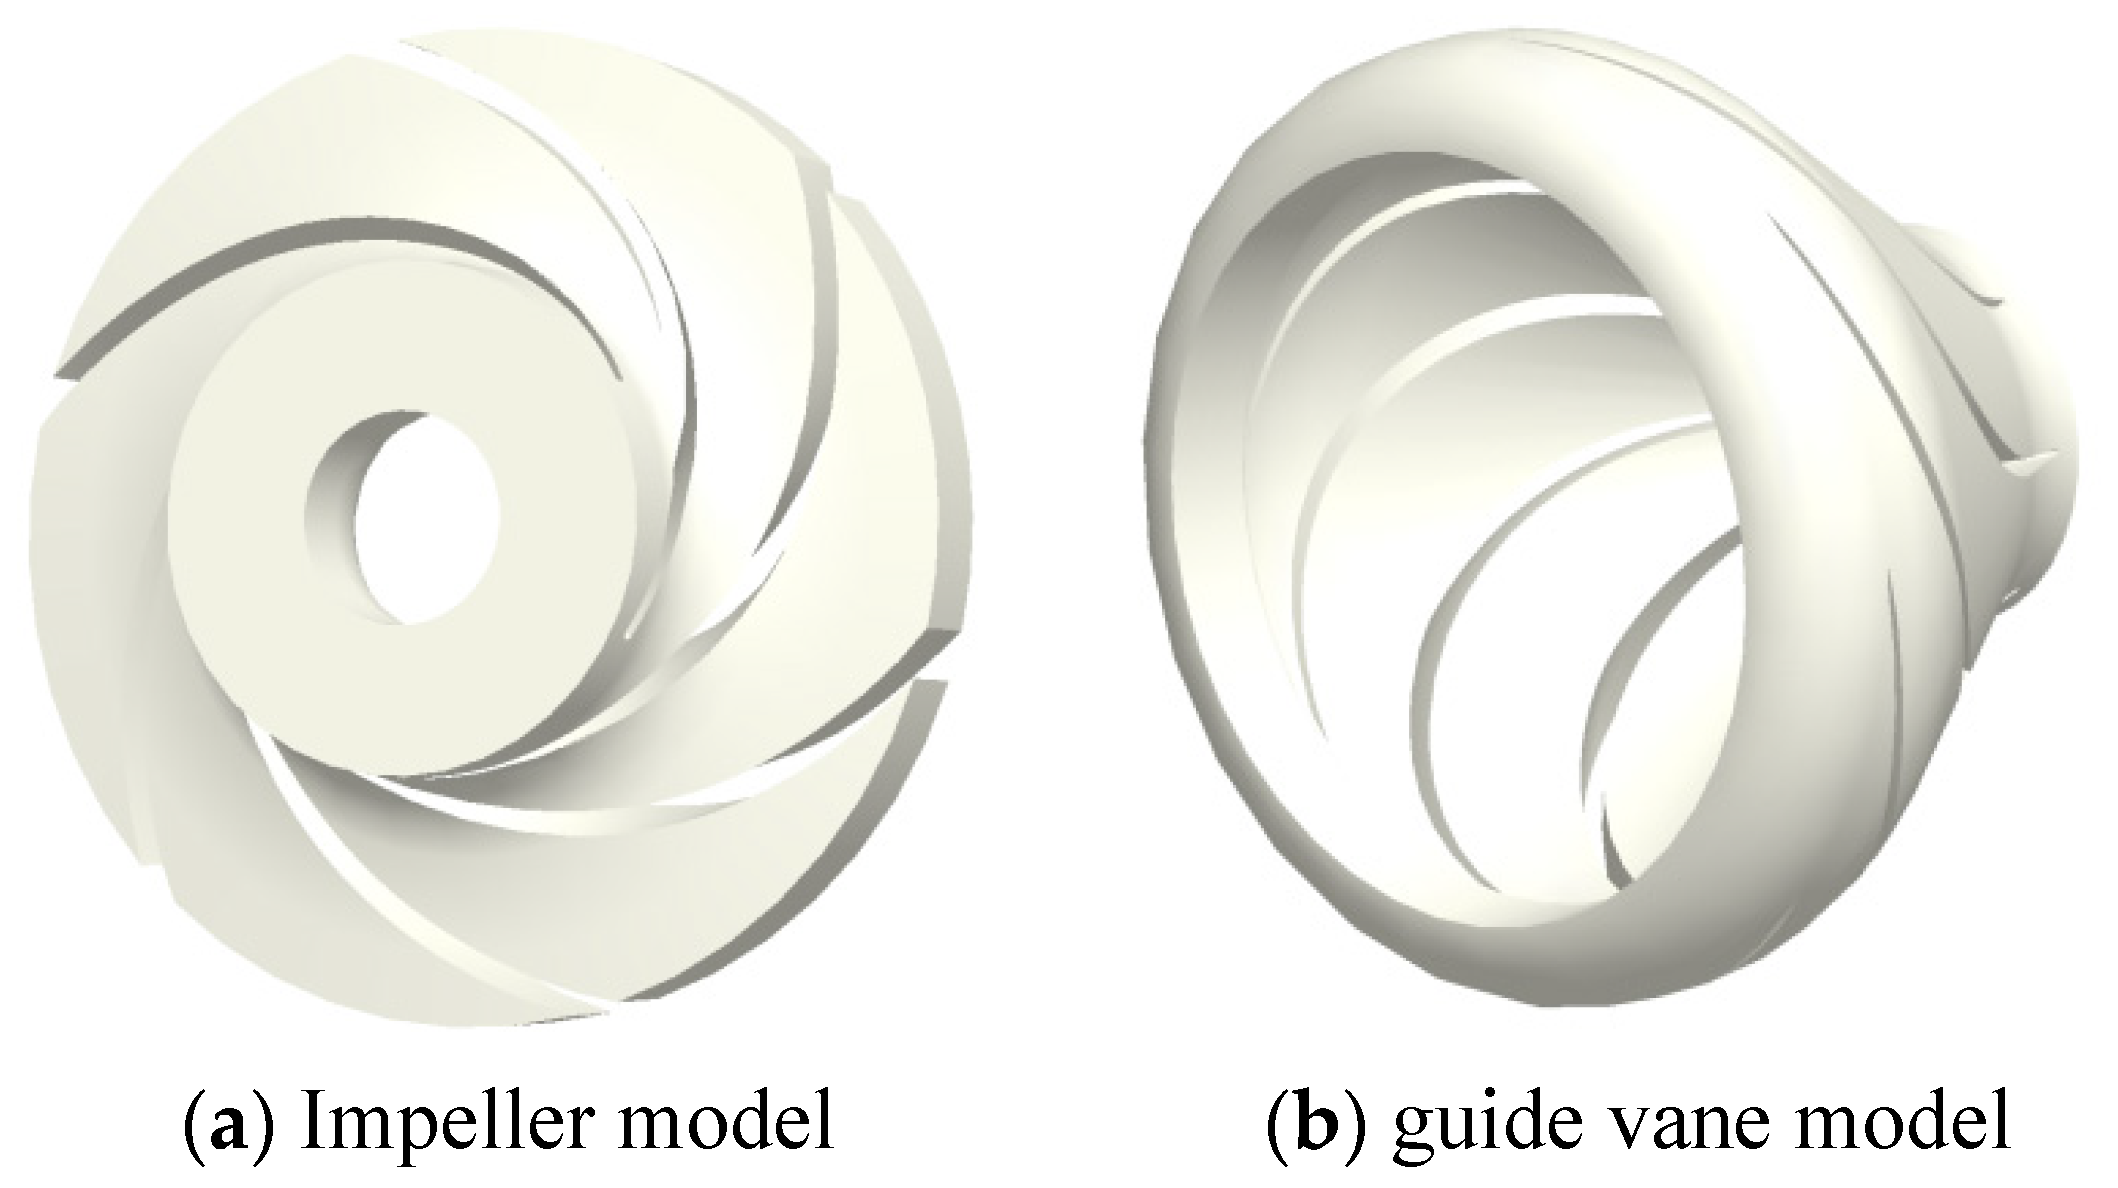
2.1. Three-Dimensional Modelling
2.2. Numerical Calculation Method
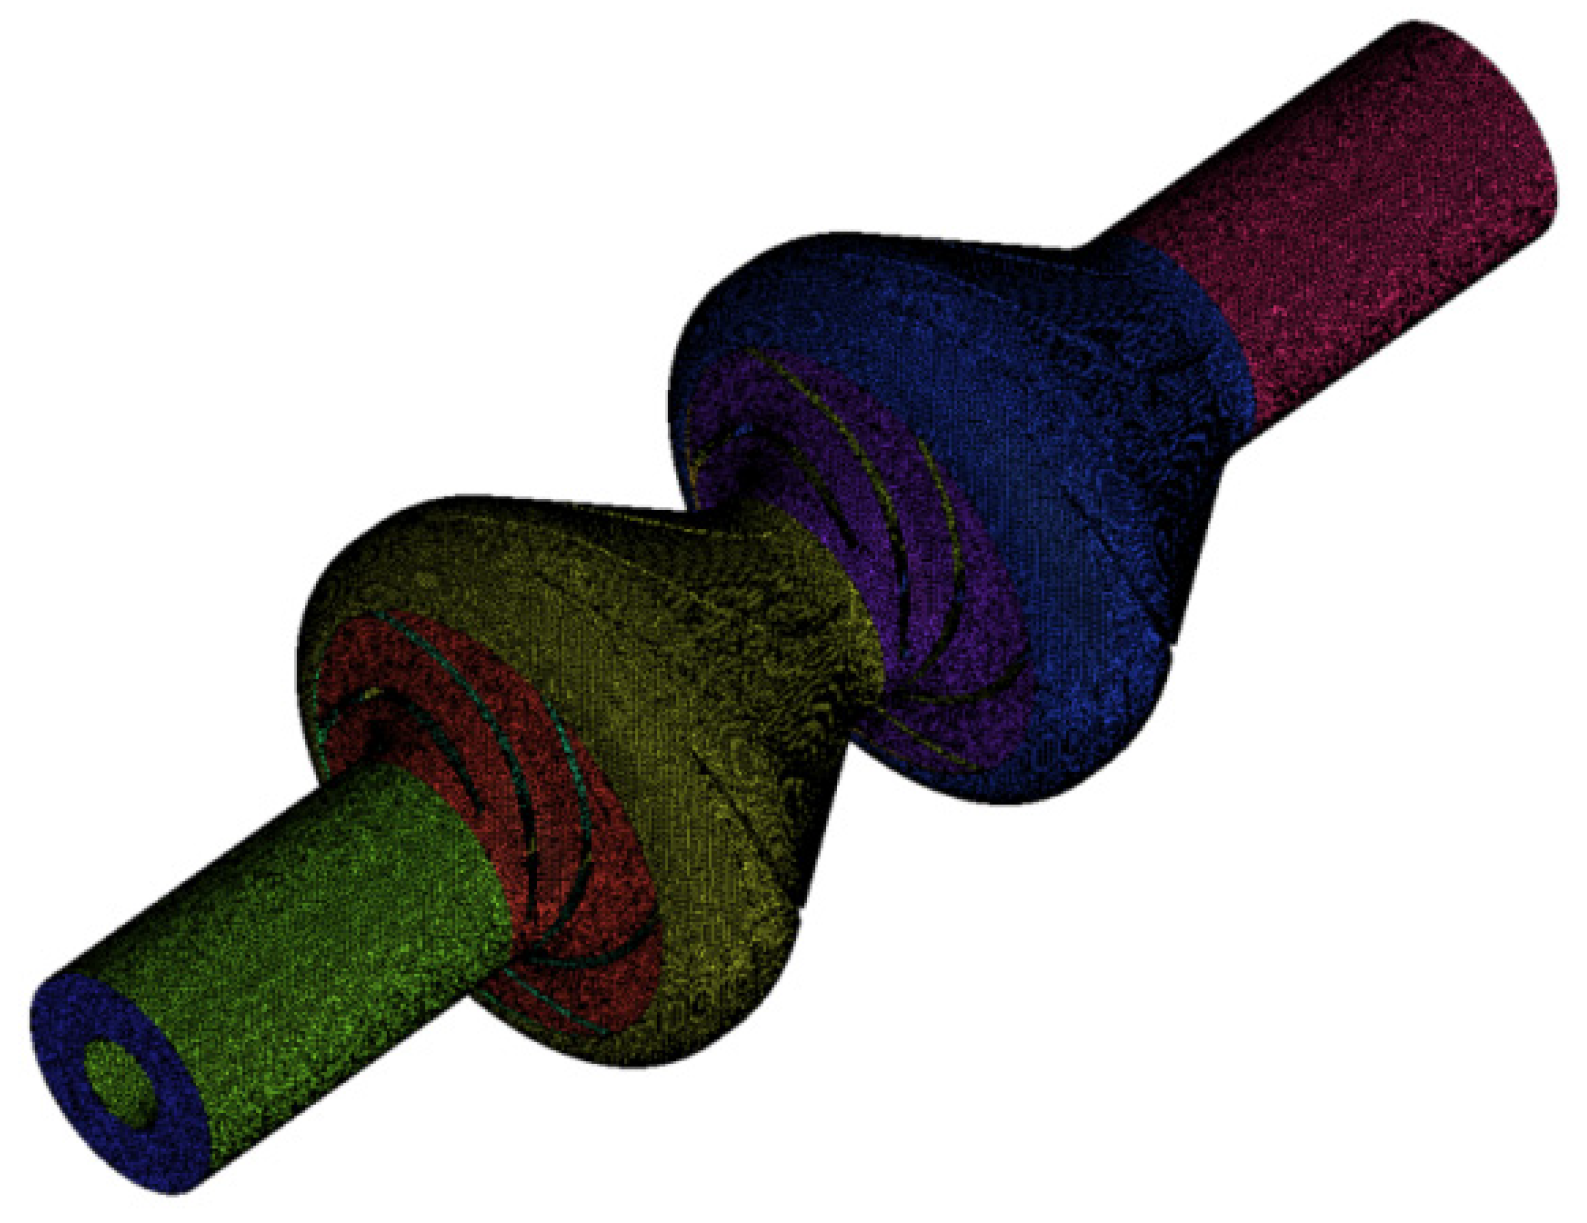
2.2.1. Meshing
2.2.2. Numerical Calculation Method
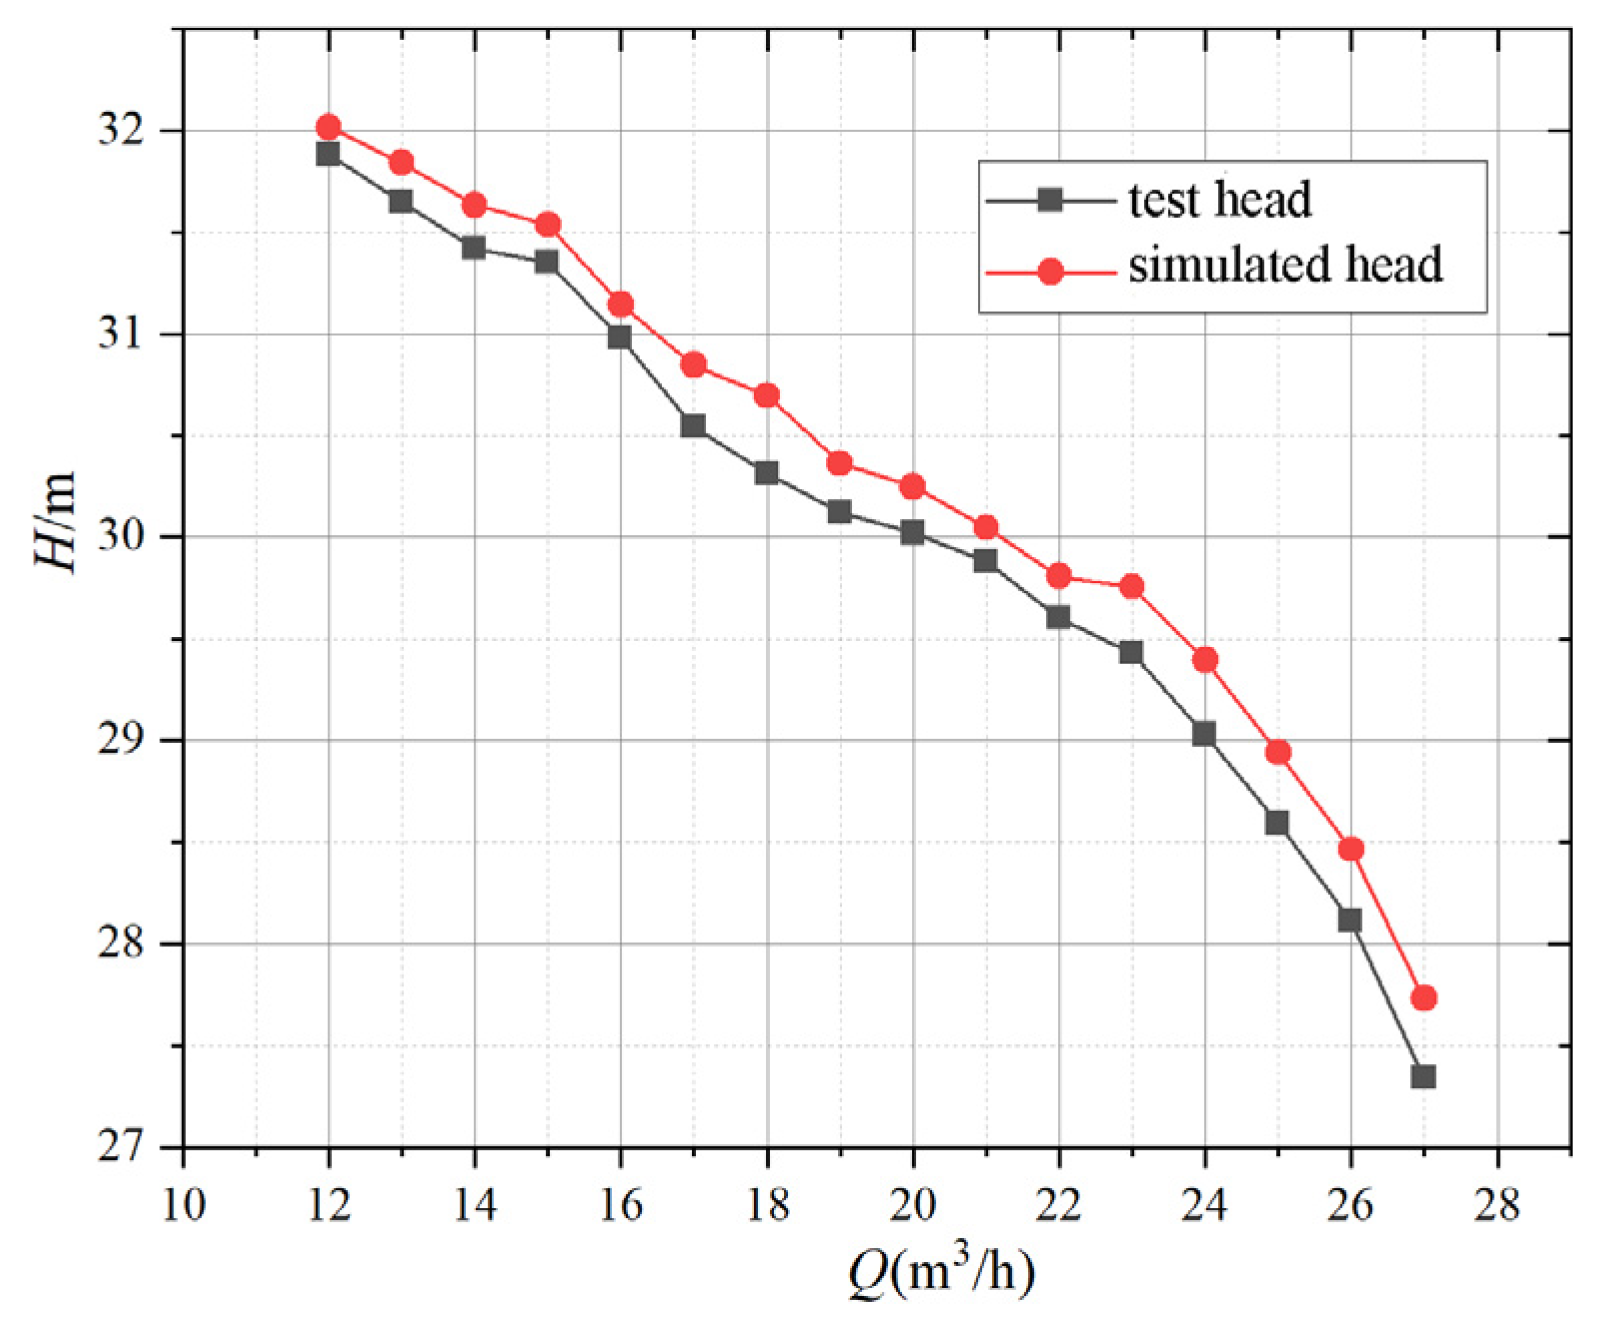
2.2.3. Hydraulic Performance Test
2.3. Boundary Conditions
3. Results: Prediction of Wear Characteristics in a Mining Pump
3.1. Wear Model
3.2. Computational Scheme
3.3. Wear Predictions for the Low-Flow Condition
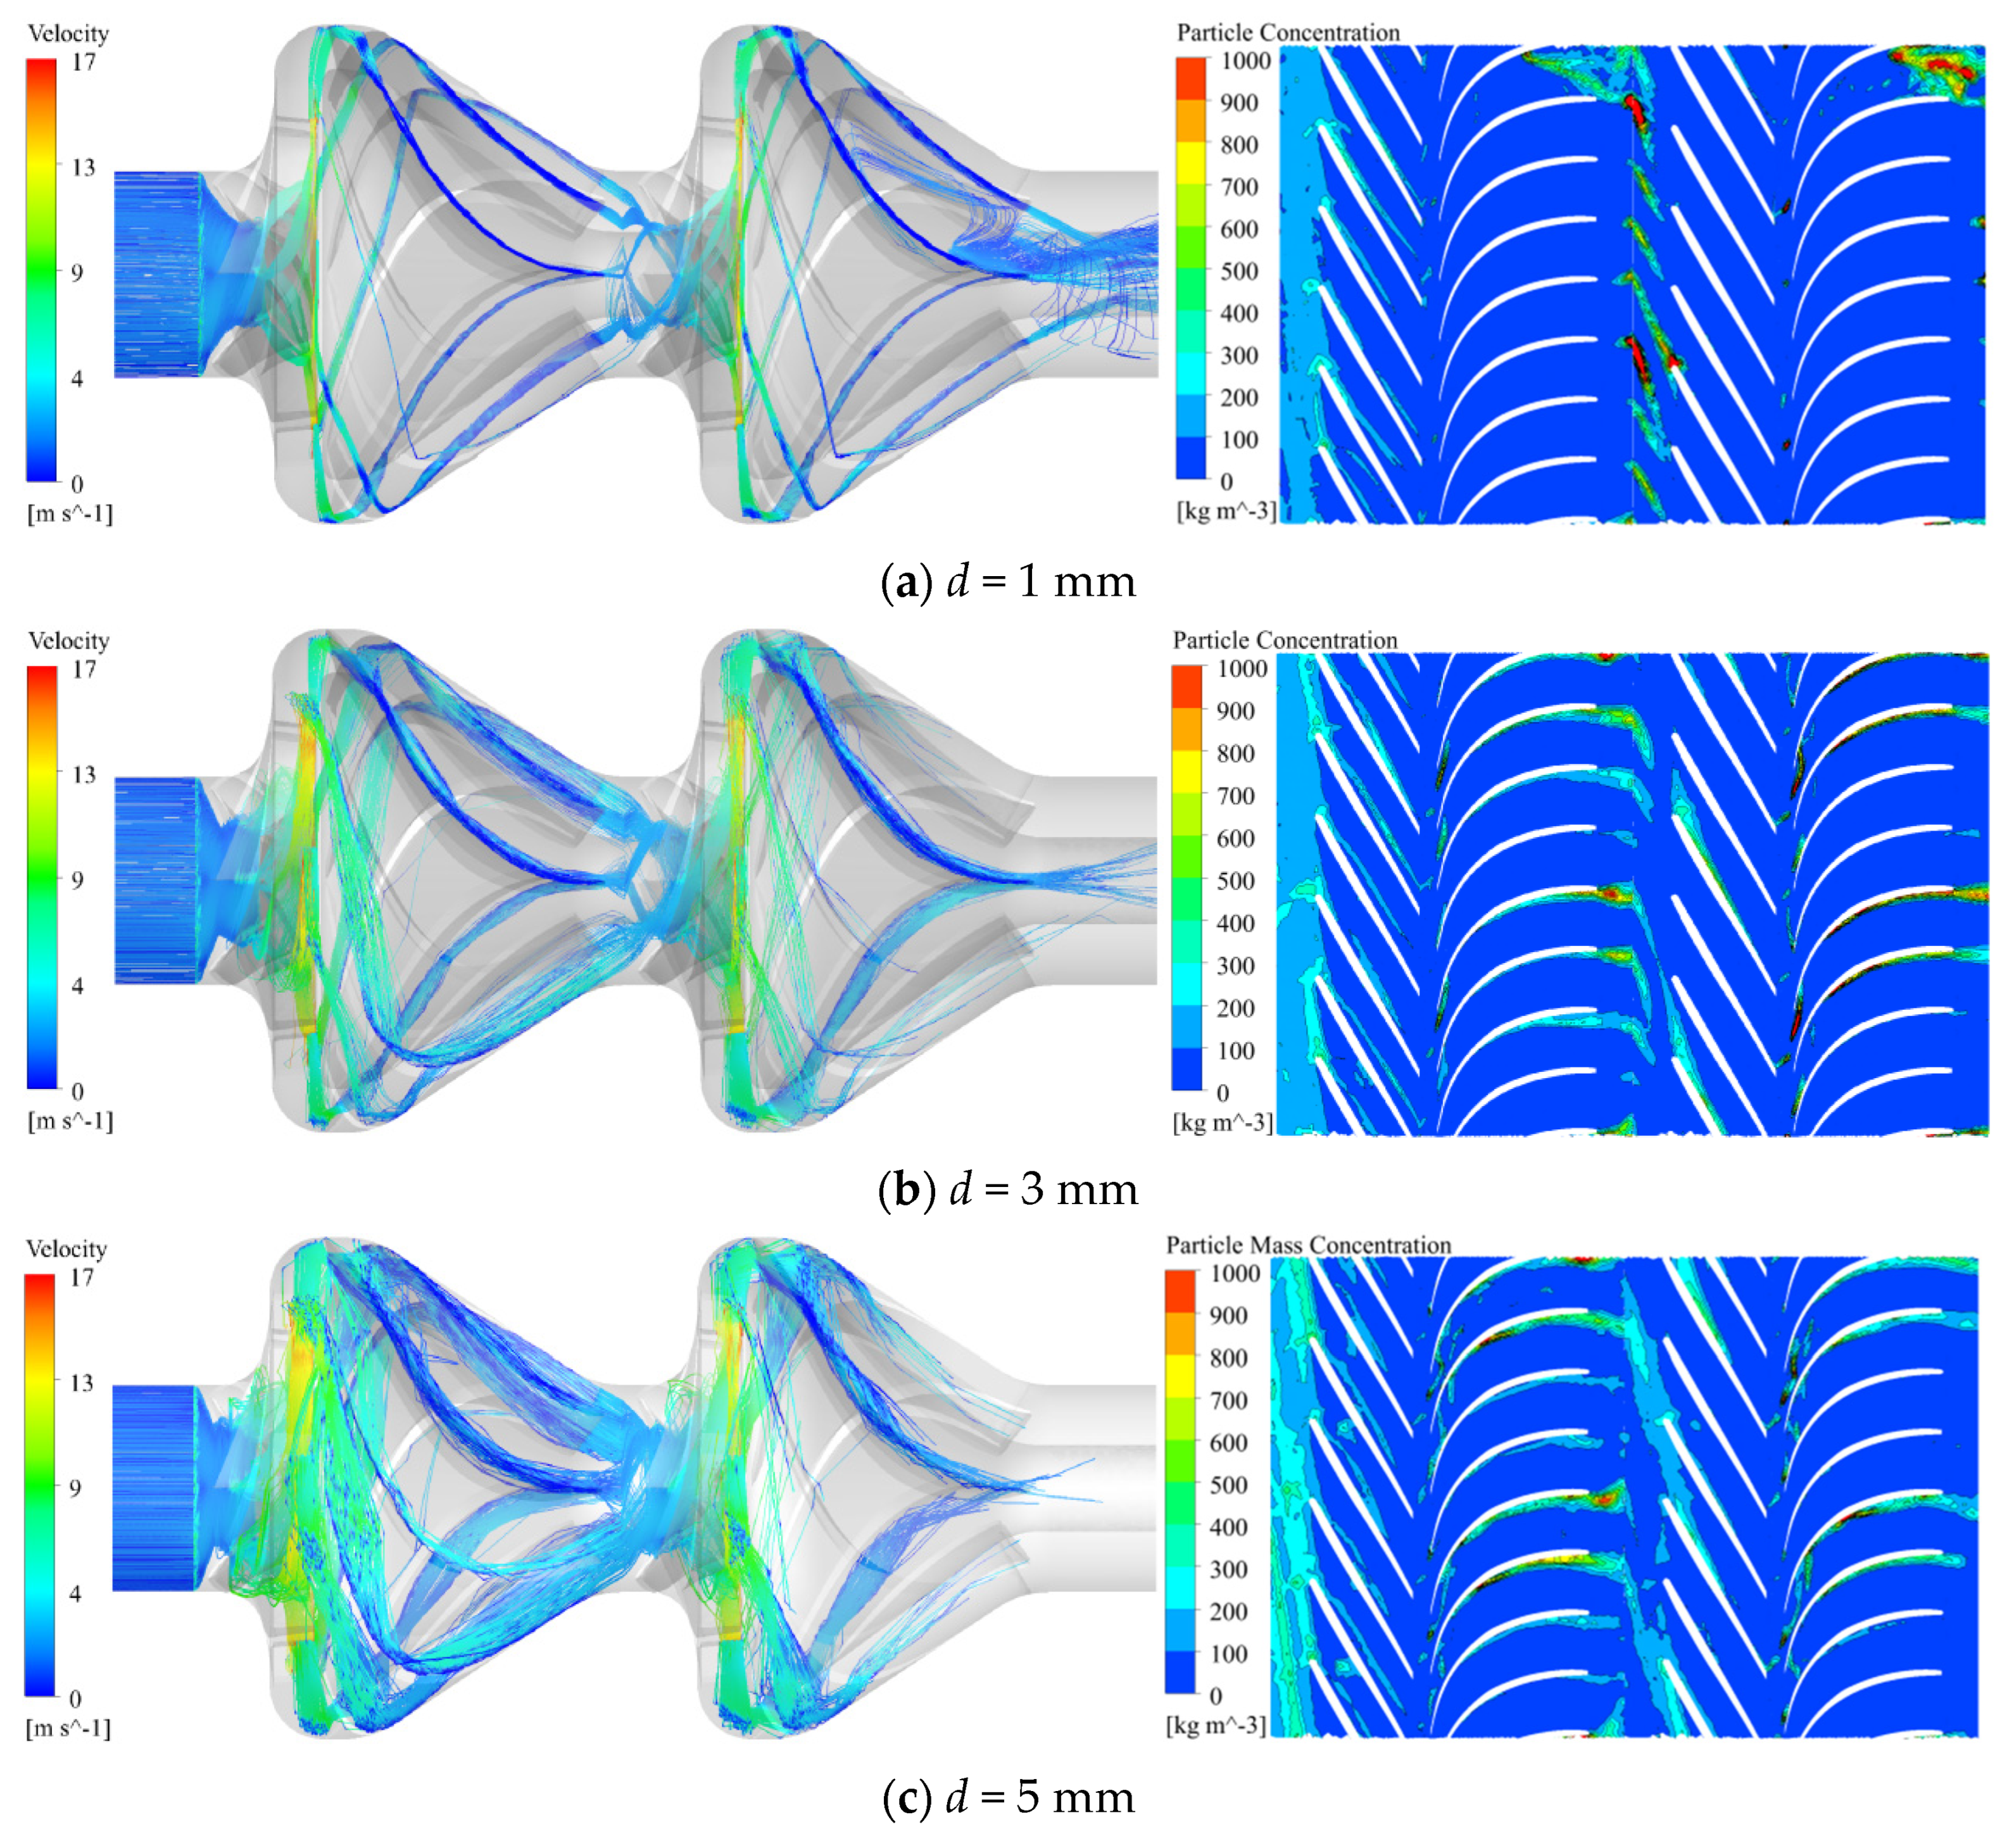
3.3.1. Analysis of Particle Motion Trajectories and Concentrations
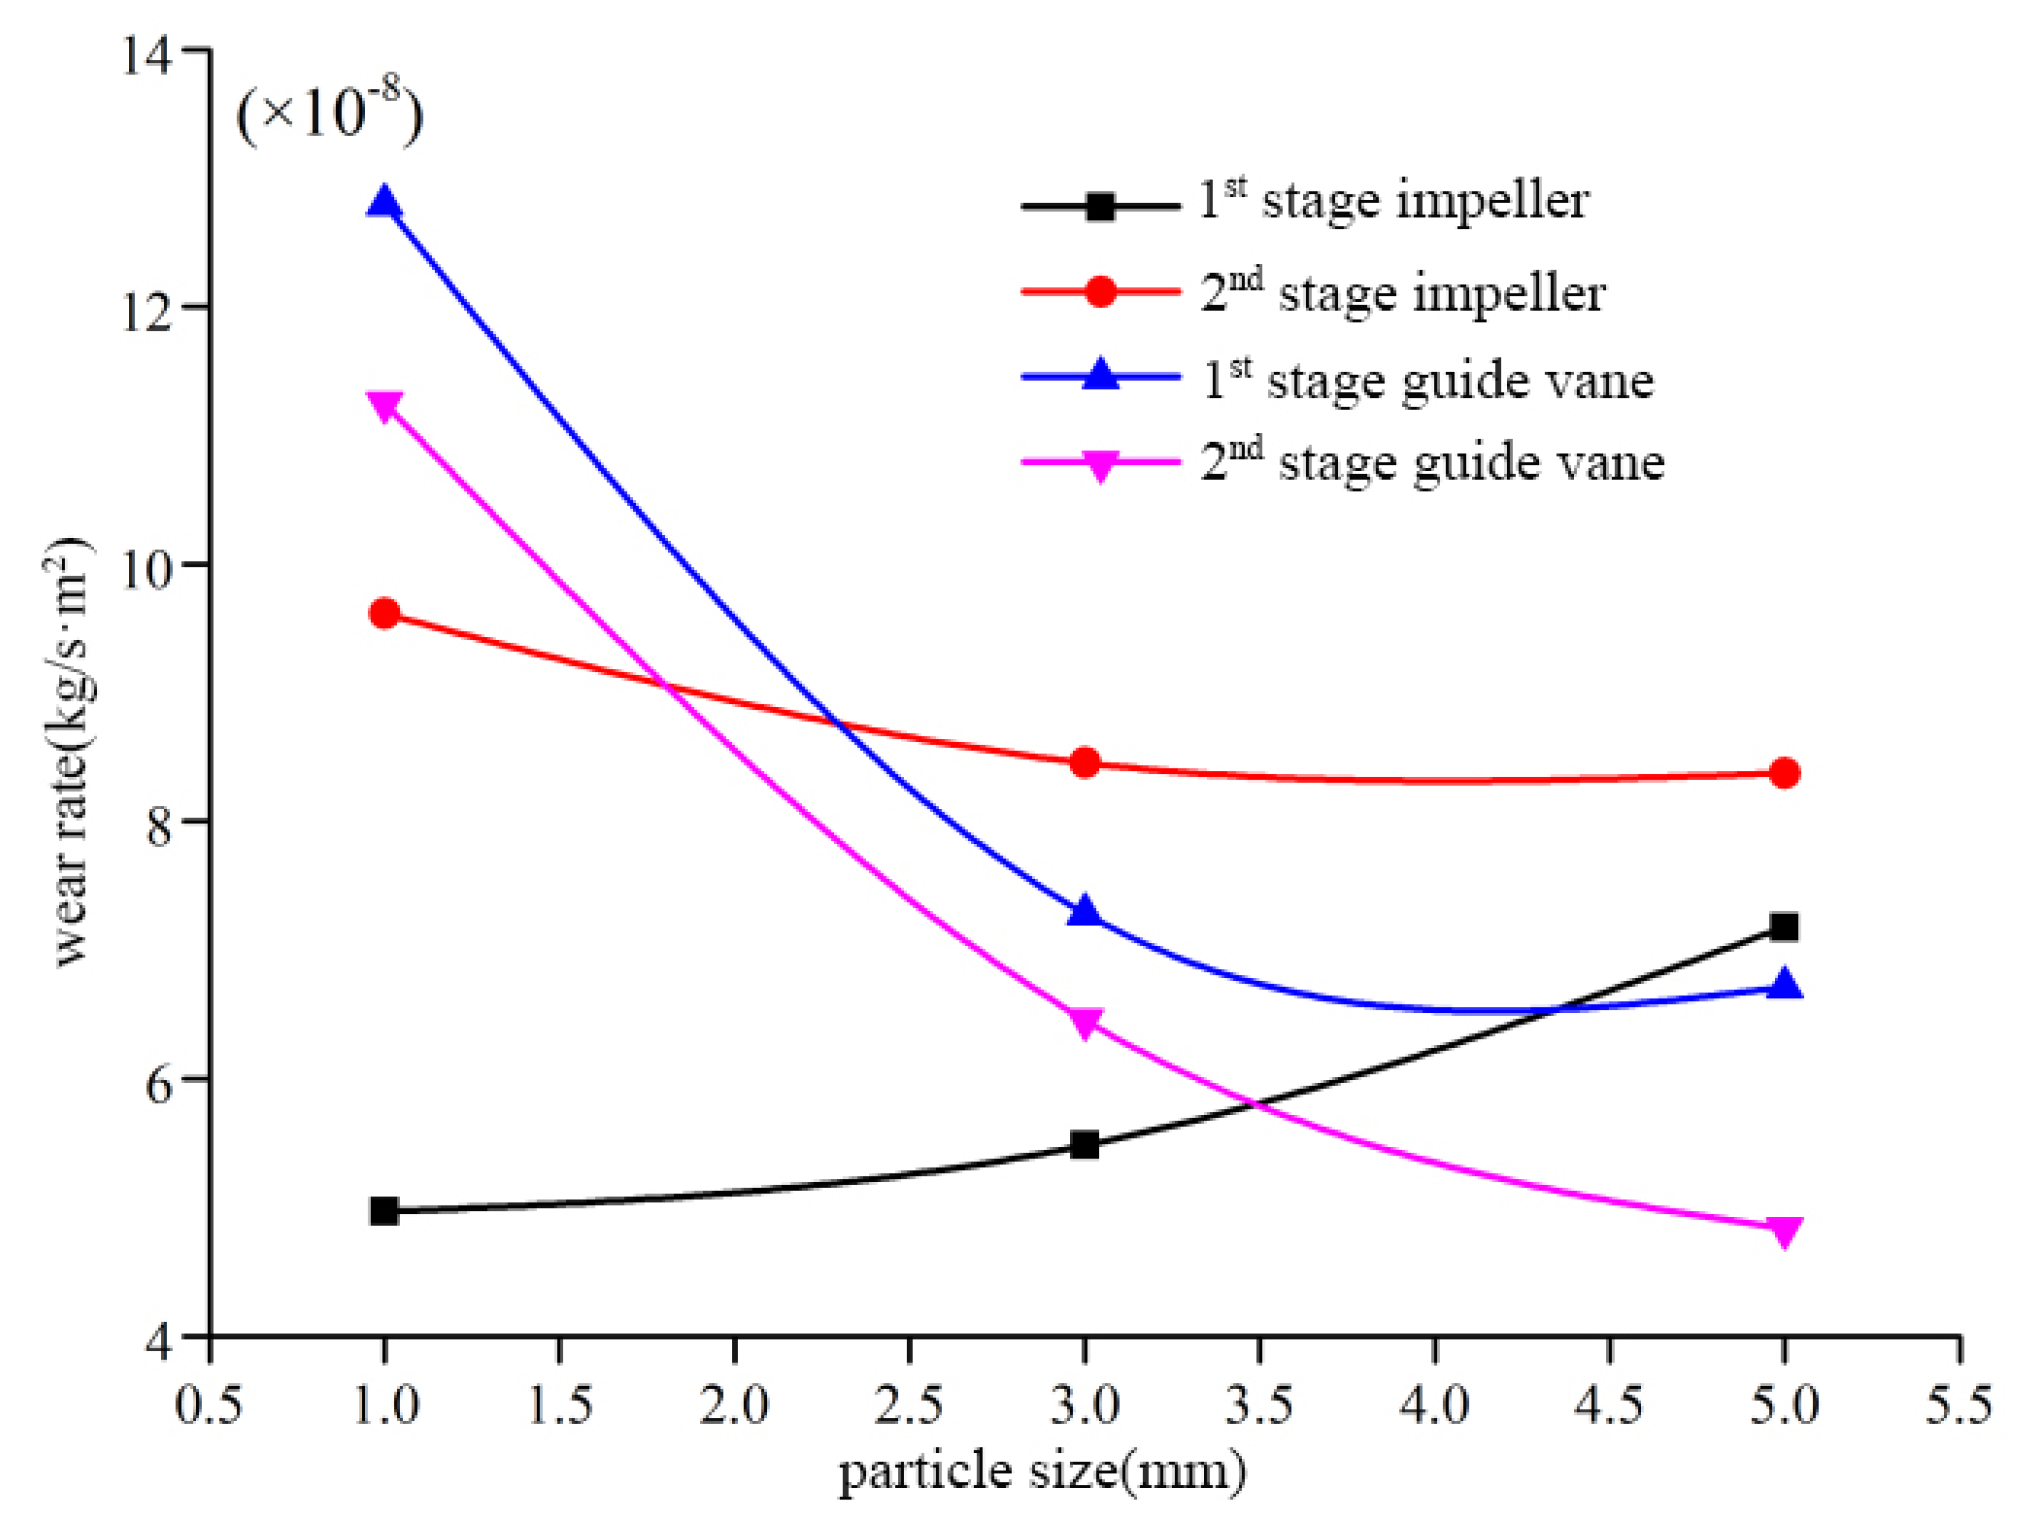
3.3.2. Wear Rates of the Flow-Passing Components
3.4. Wear Predictions for the Rated-Flow Condition
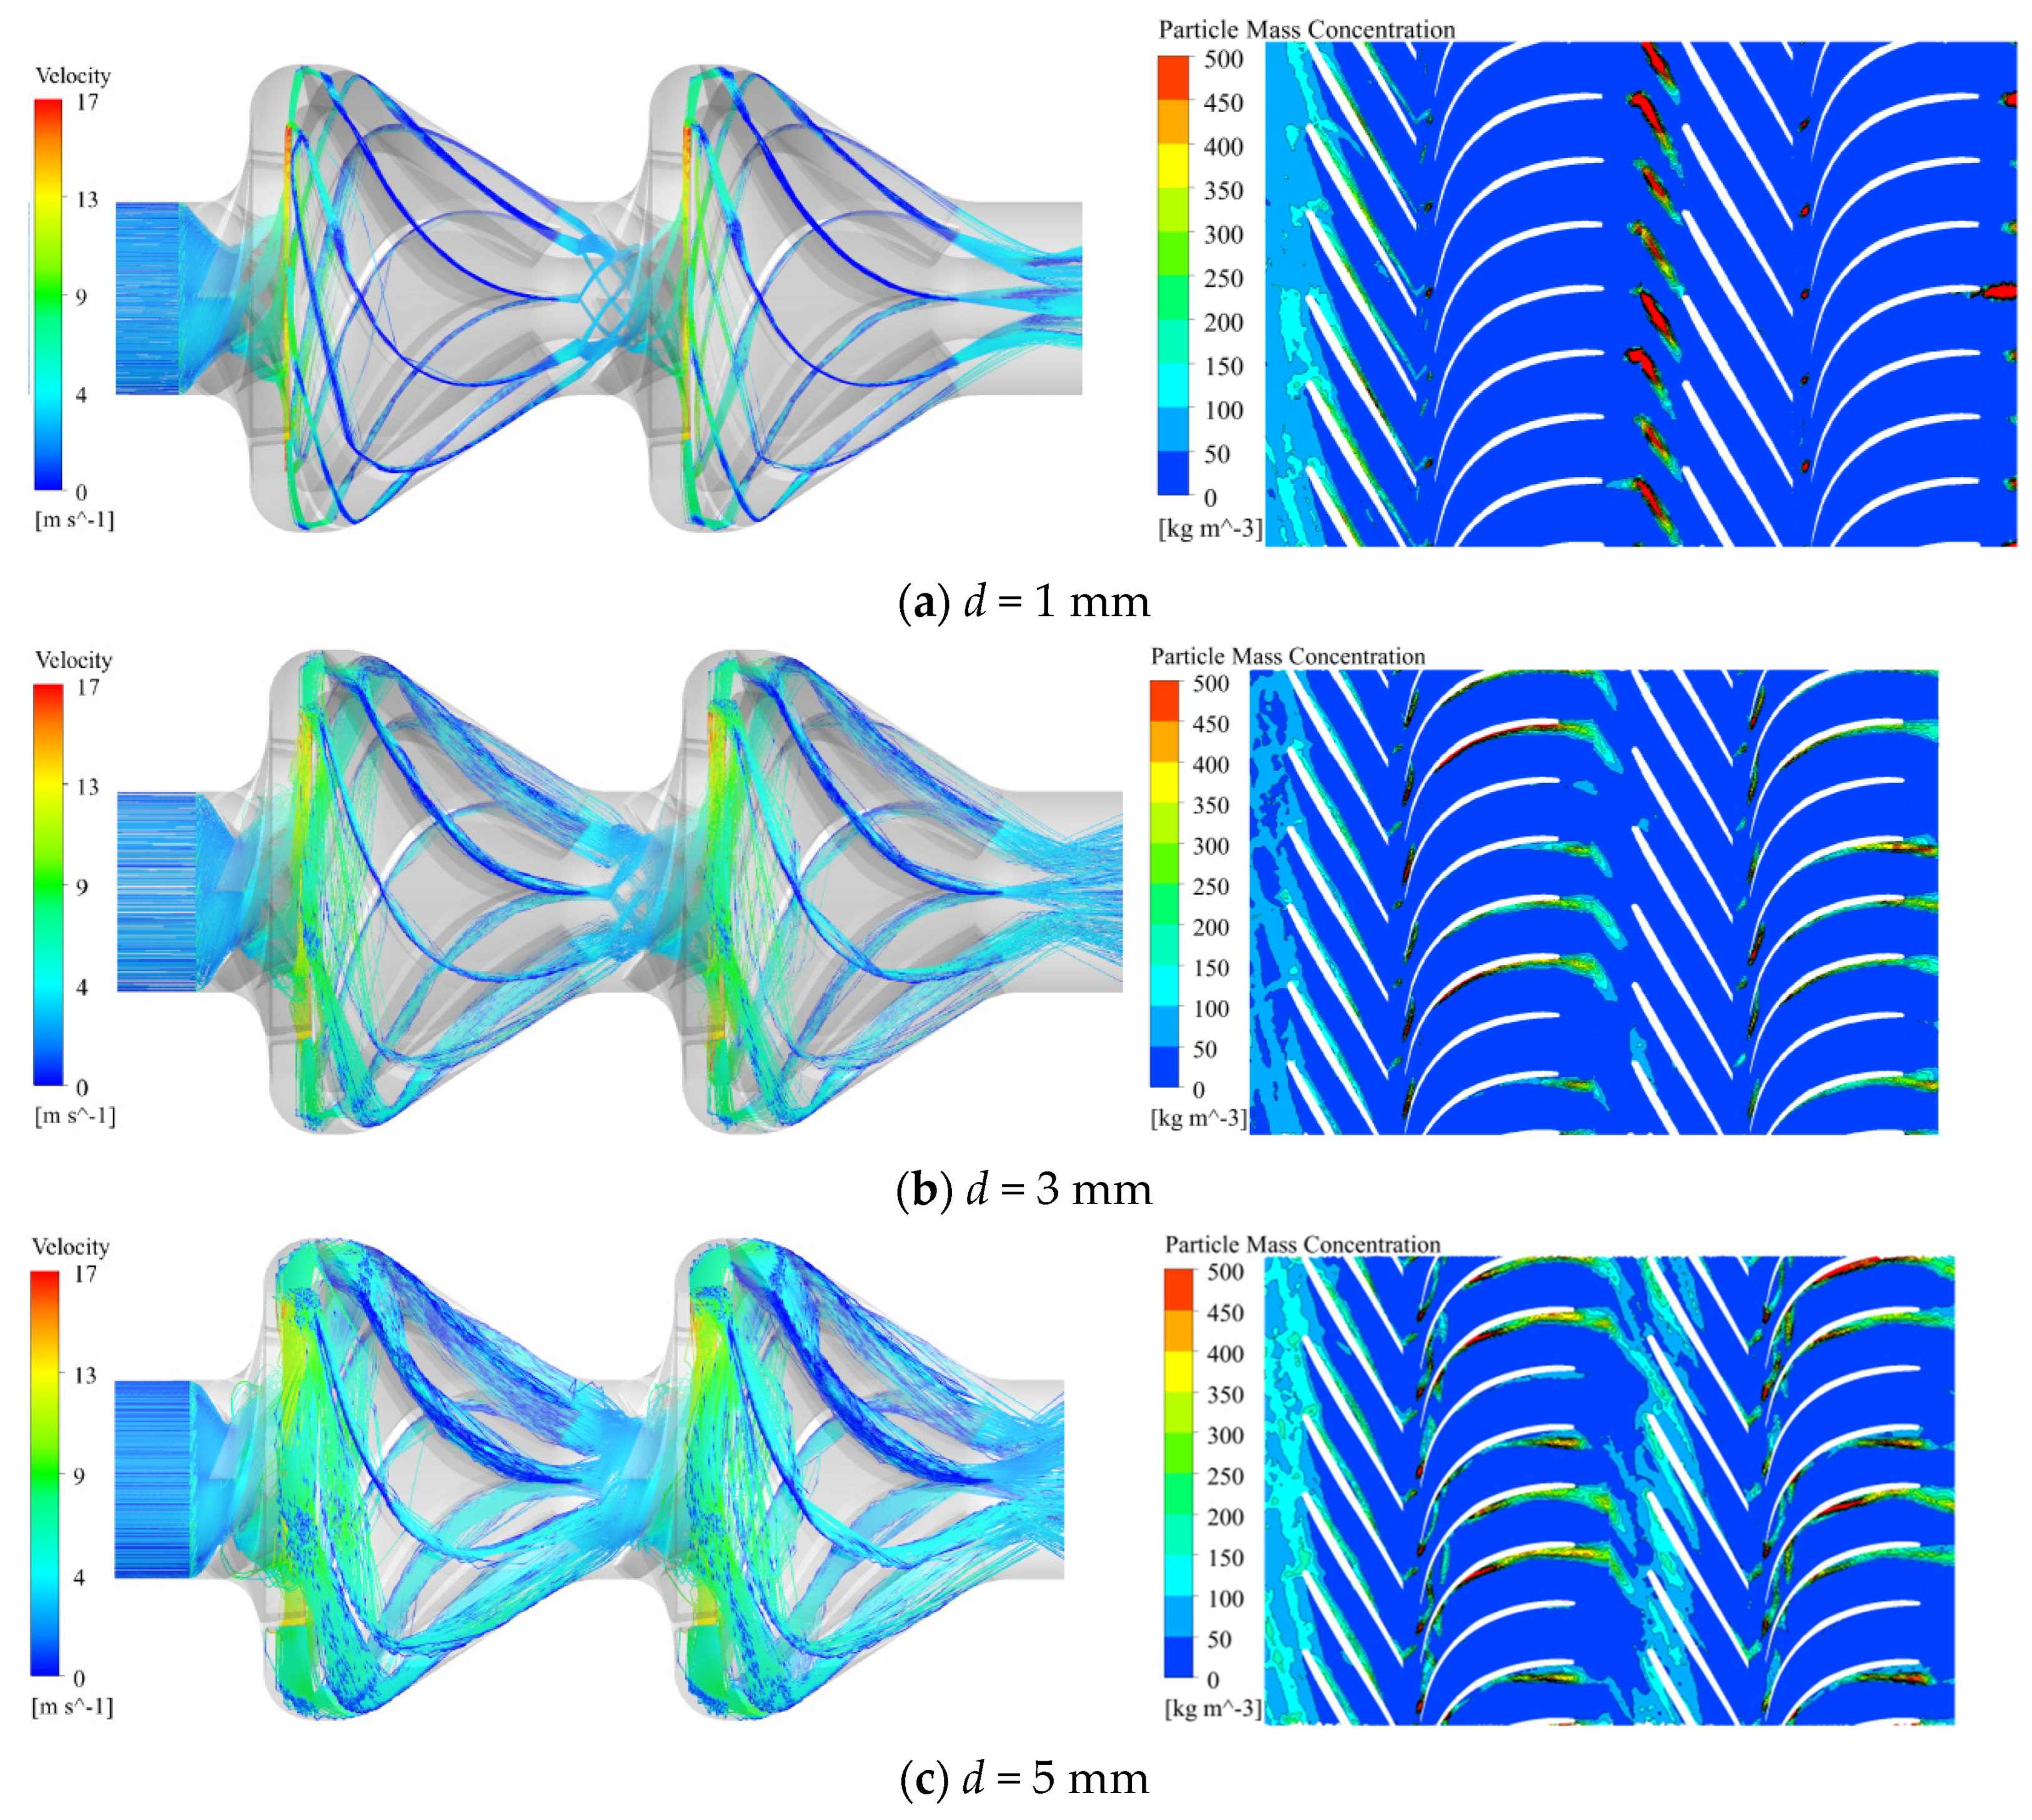
3.4.1. Analysis of Particle Motion Trajectories and Concentrations
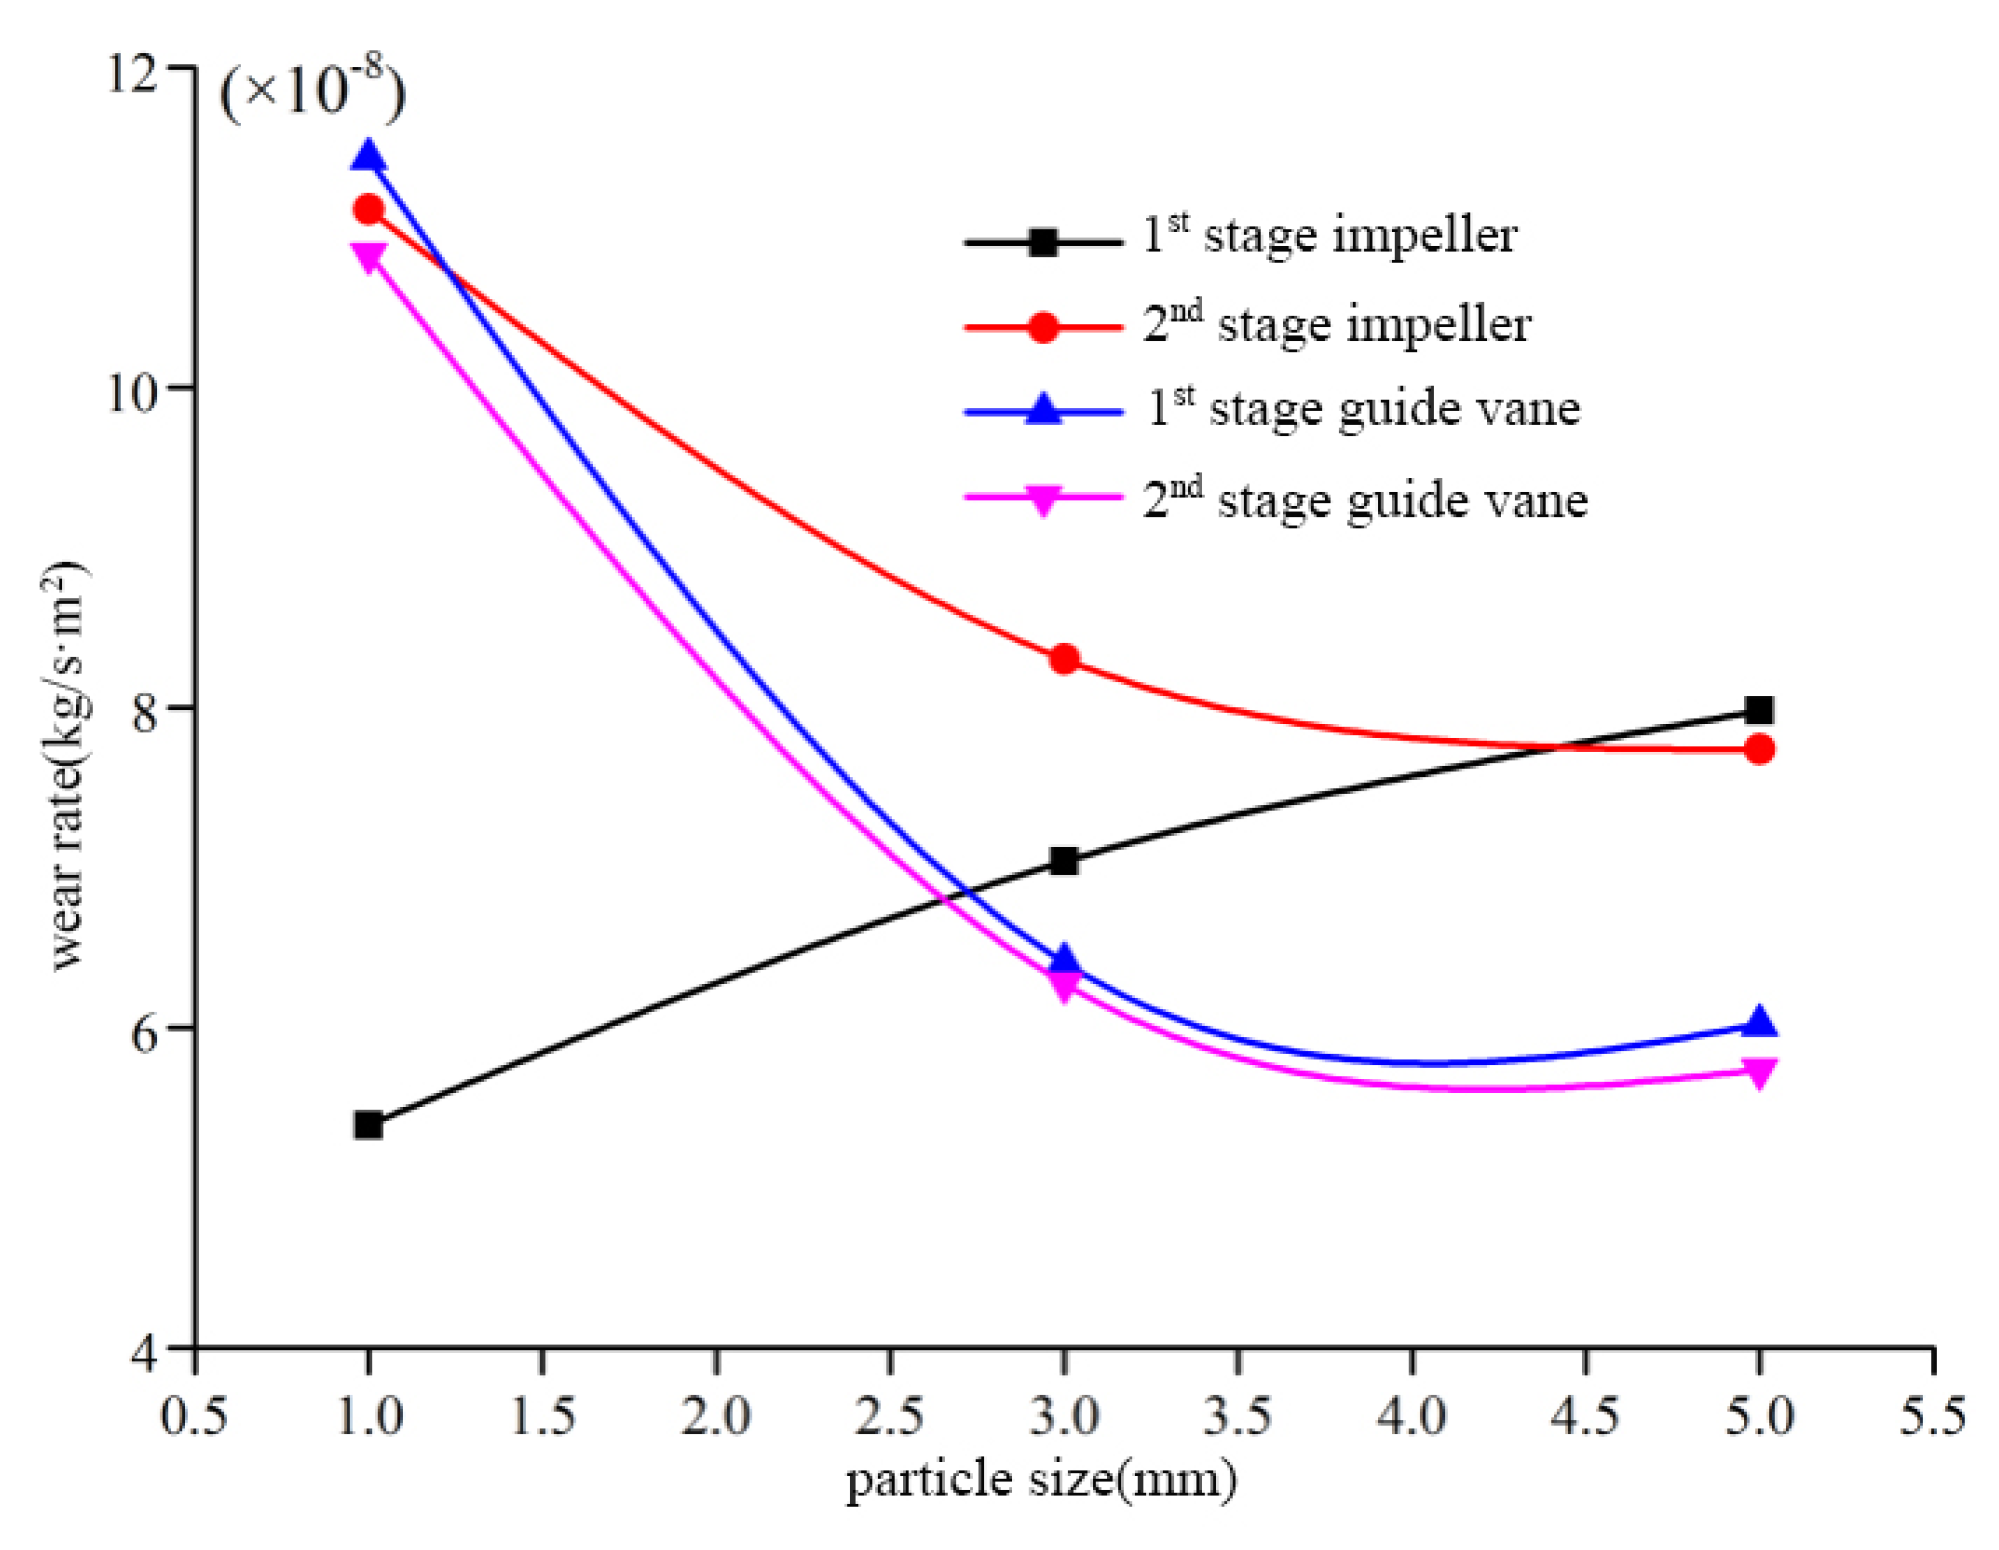
3.4.2. Wear Rates of the Flow-Passing Components
3.5. Wear Predictions for the High-Flow Condition
3.5.1. Analysis of Particle Motion Trajectories and Concentrations
3.5.2. Wear Rates of the Flow-Passing Components
4. Experiment: Wear Experiment Verification
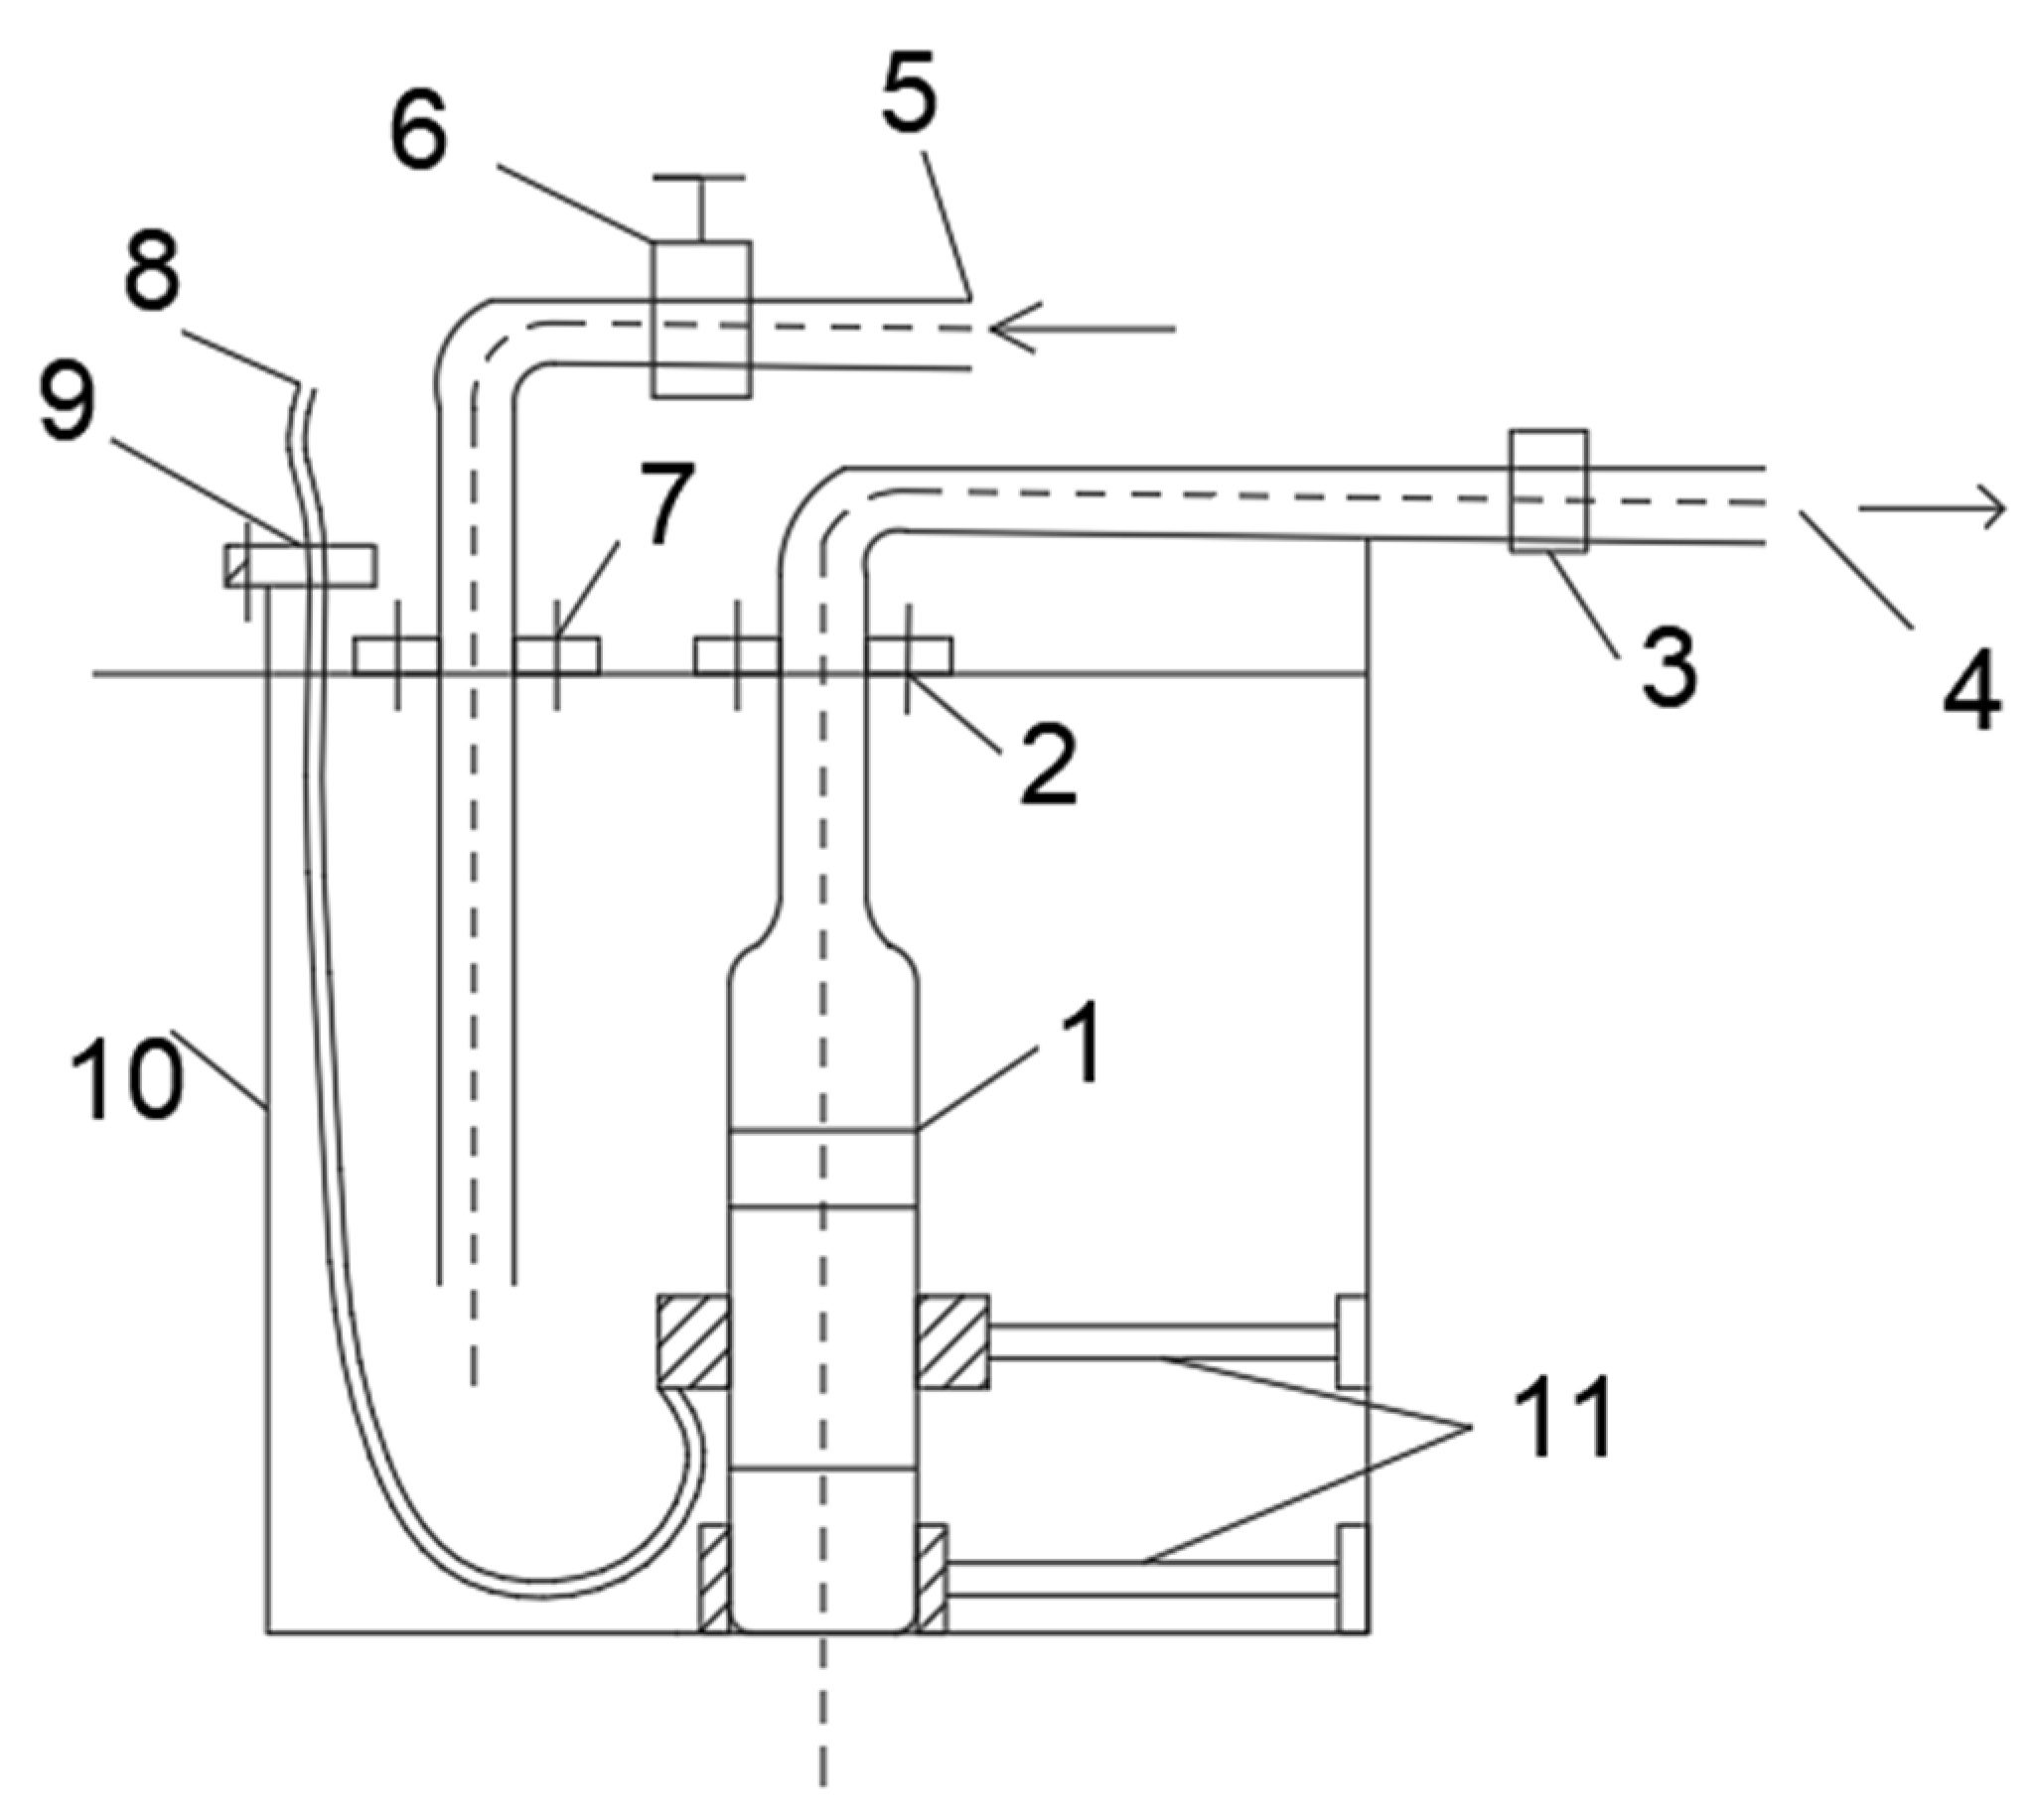
4.1. Experimental Methodology
4.2. Comparison between Experimental and Numerical Results
5. Conclusions
- (1)
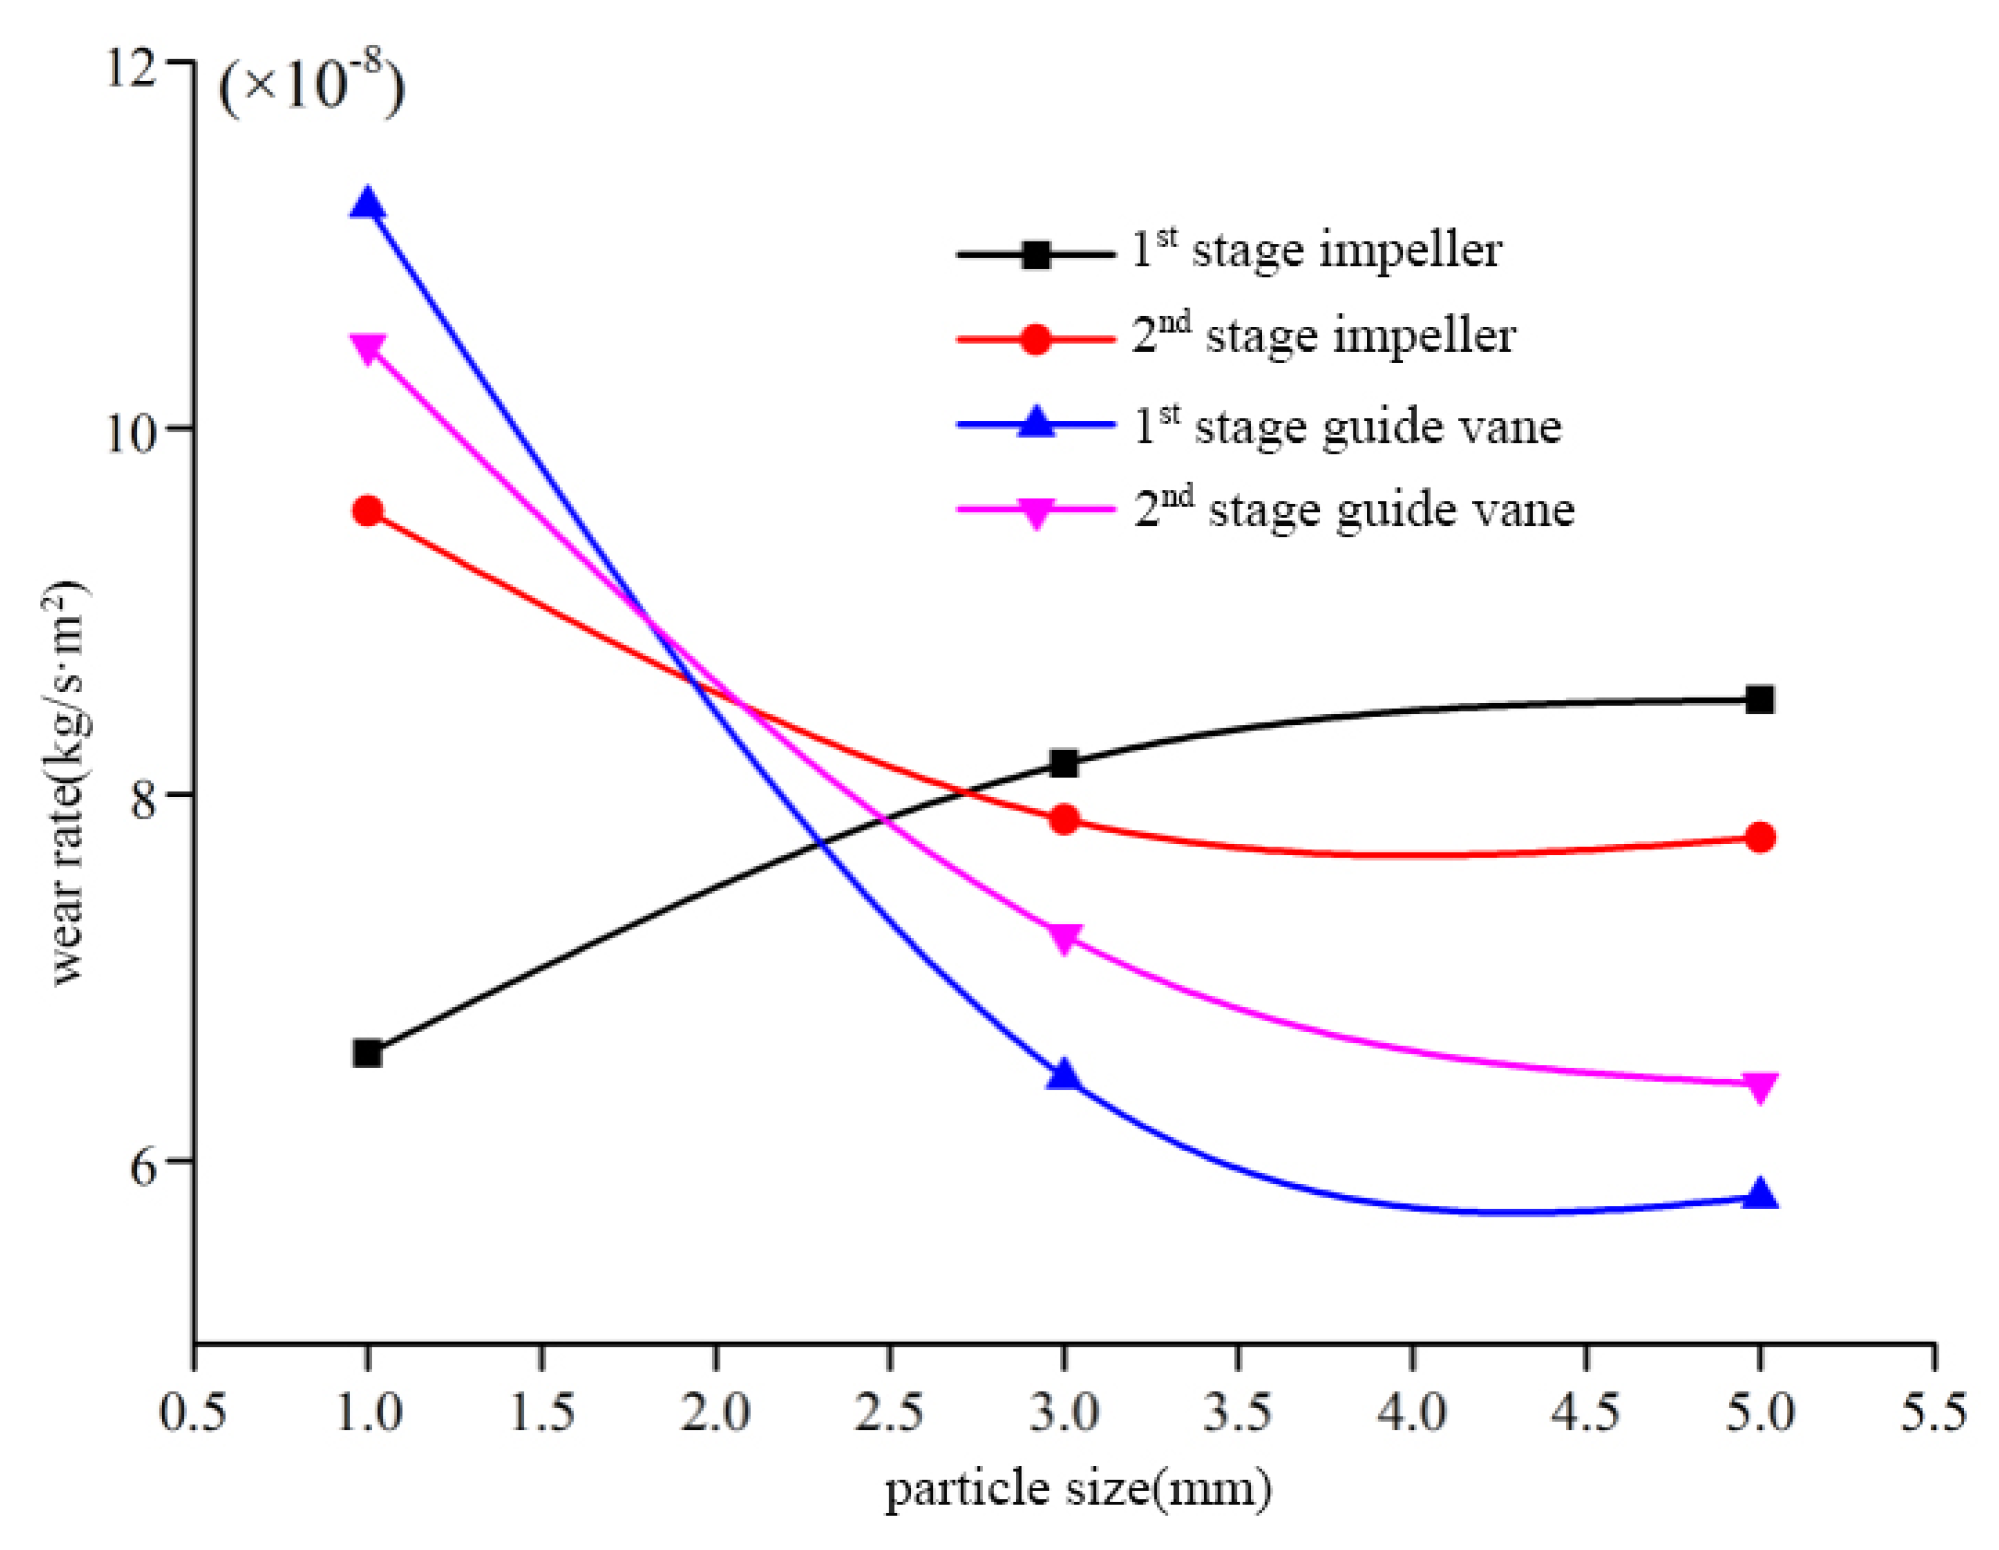
- Numerical simulations were performed to compare the wear on the impeller and guide-vane surfaces under several conditions. During the transportation of small particles, the first-stage guide vane always exhibited the greatest surface wear, at all flow rates. However, during the transportation of large particles, the second-stage guide vane exhibited the least surface wear in the low-flow and rated-flow conditions, whereas in the high-flow condition, the first-stage guide vane exhibited the least surface wear. Therefore, the surface strength of the first-stage guide vane should be prioritized in the design and construction of small, two-stage mining pumps.
- (2)
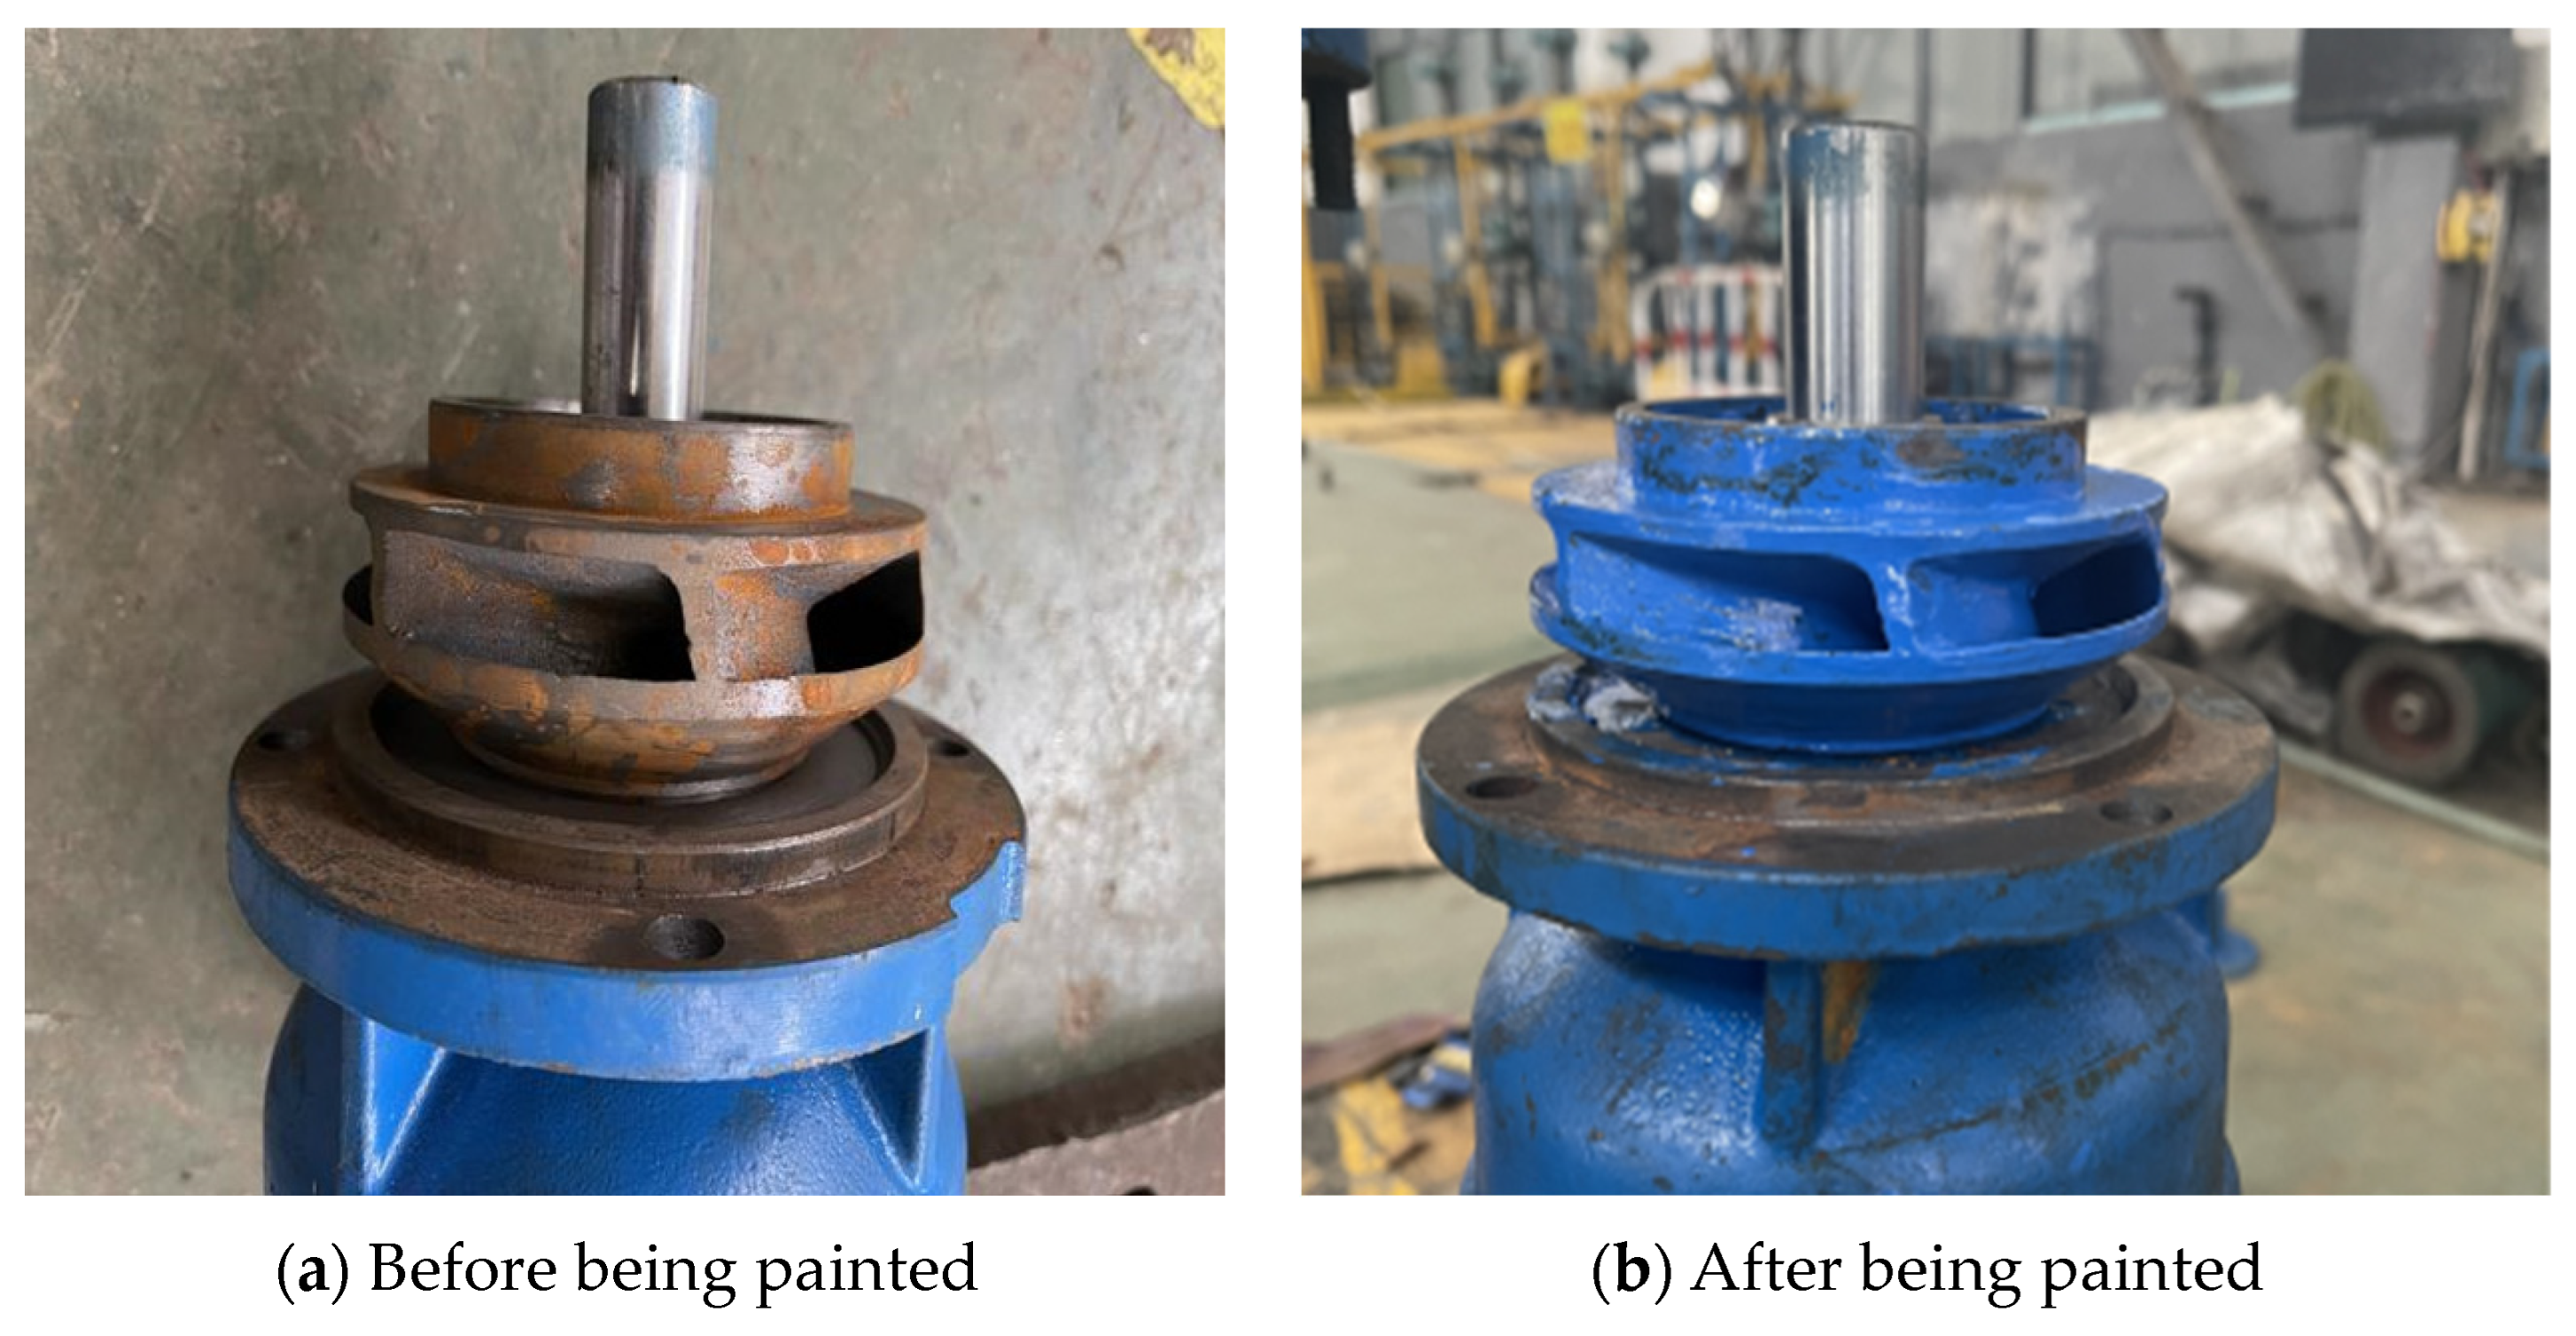
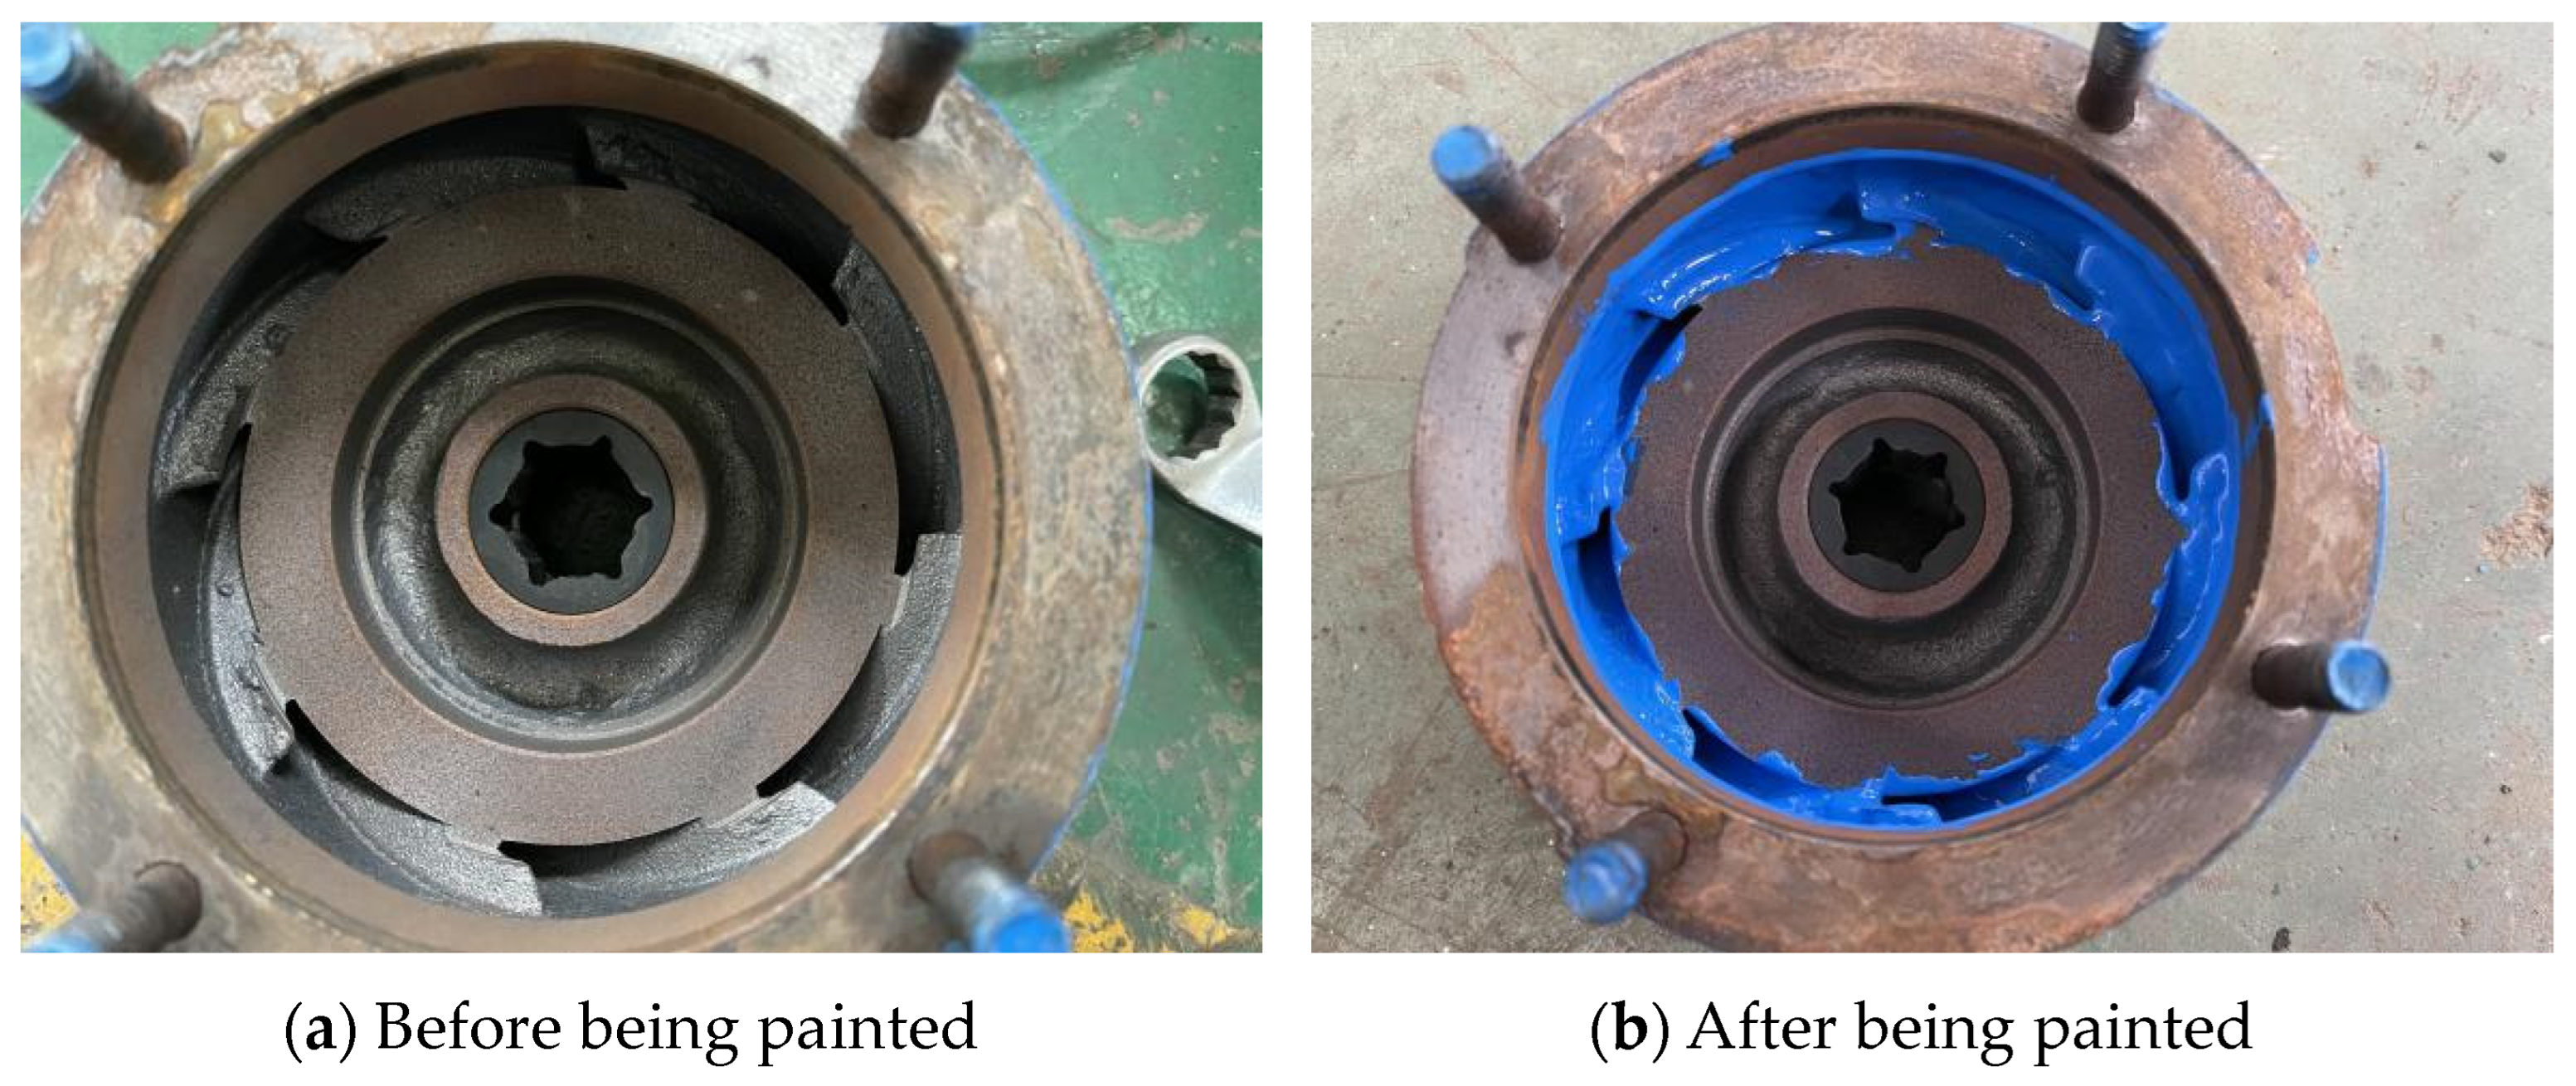
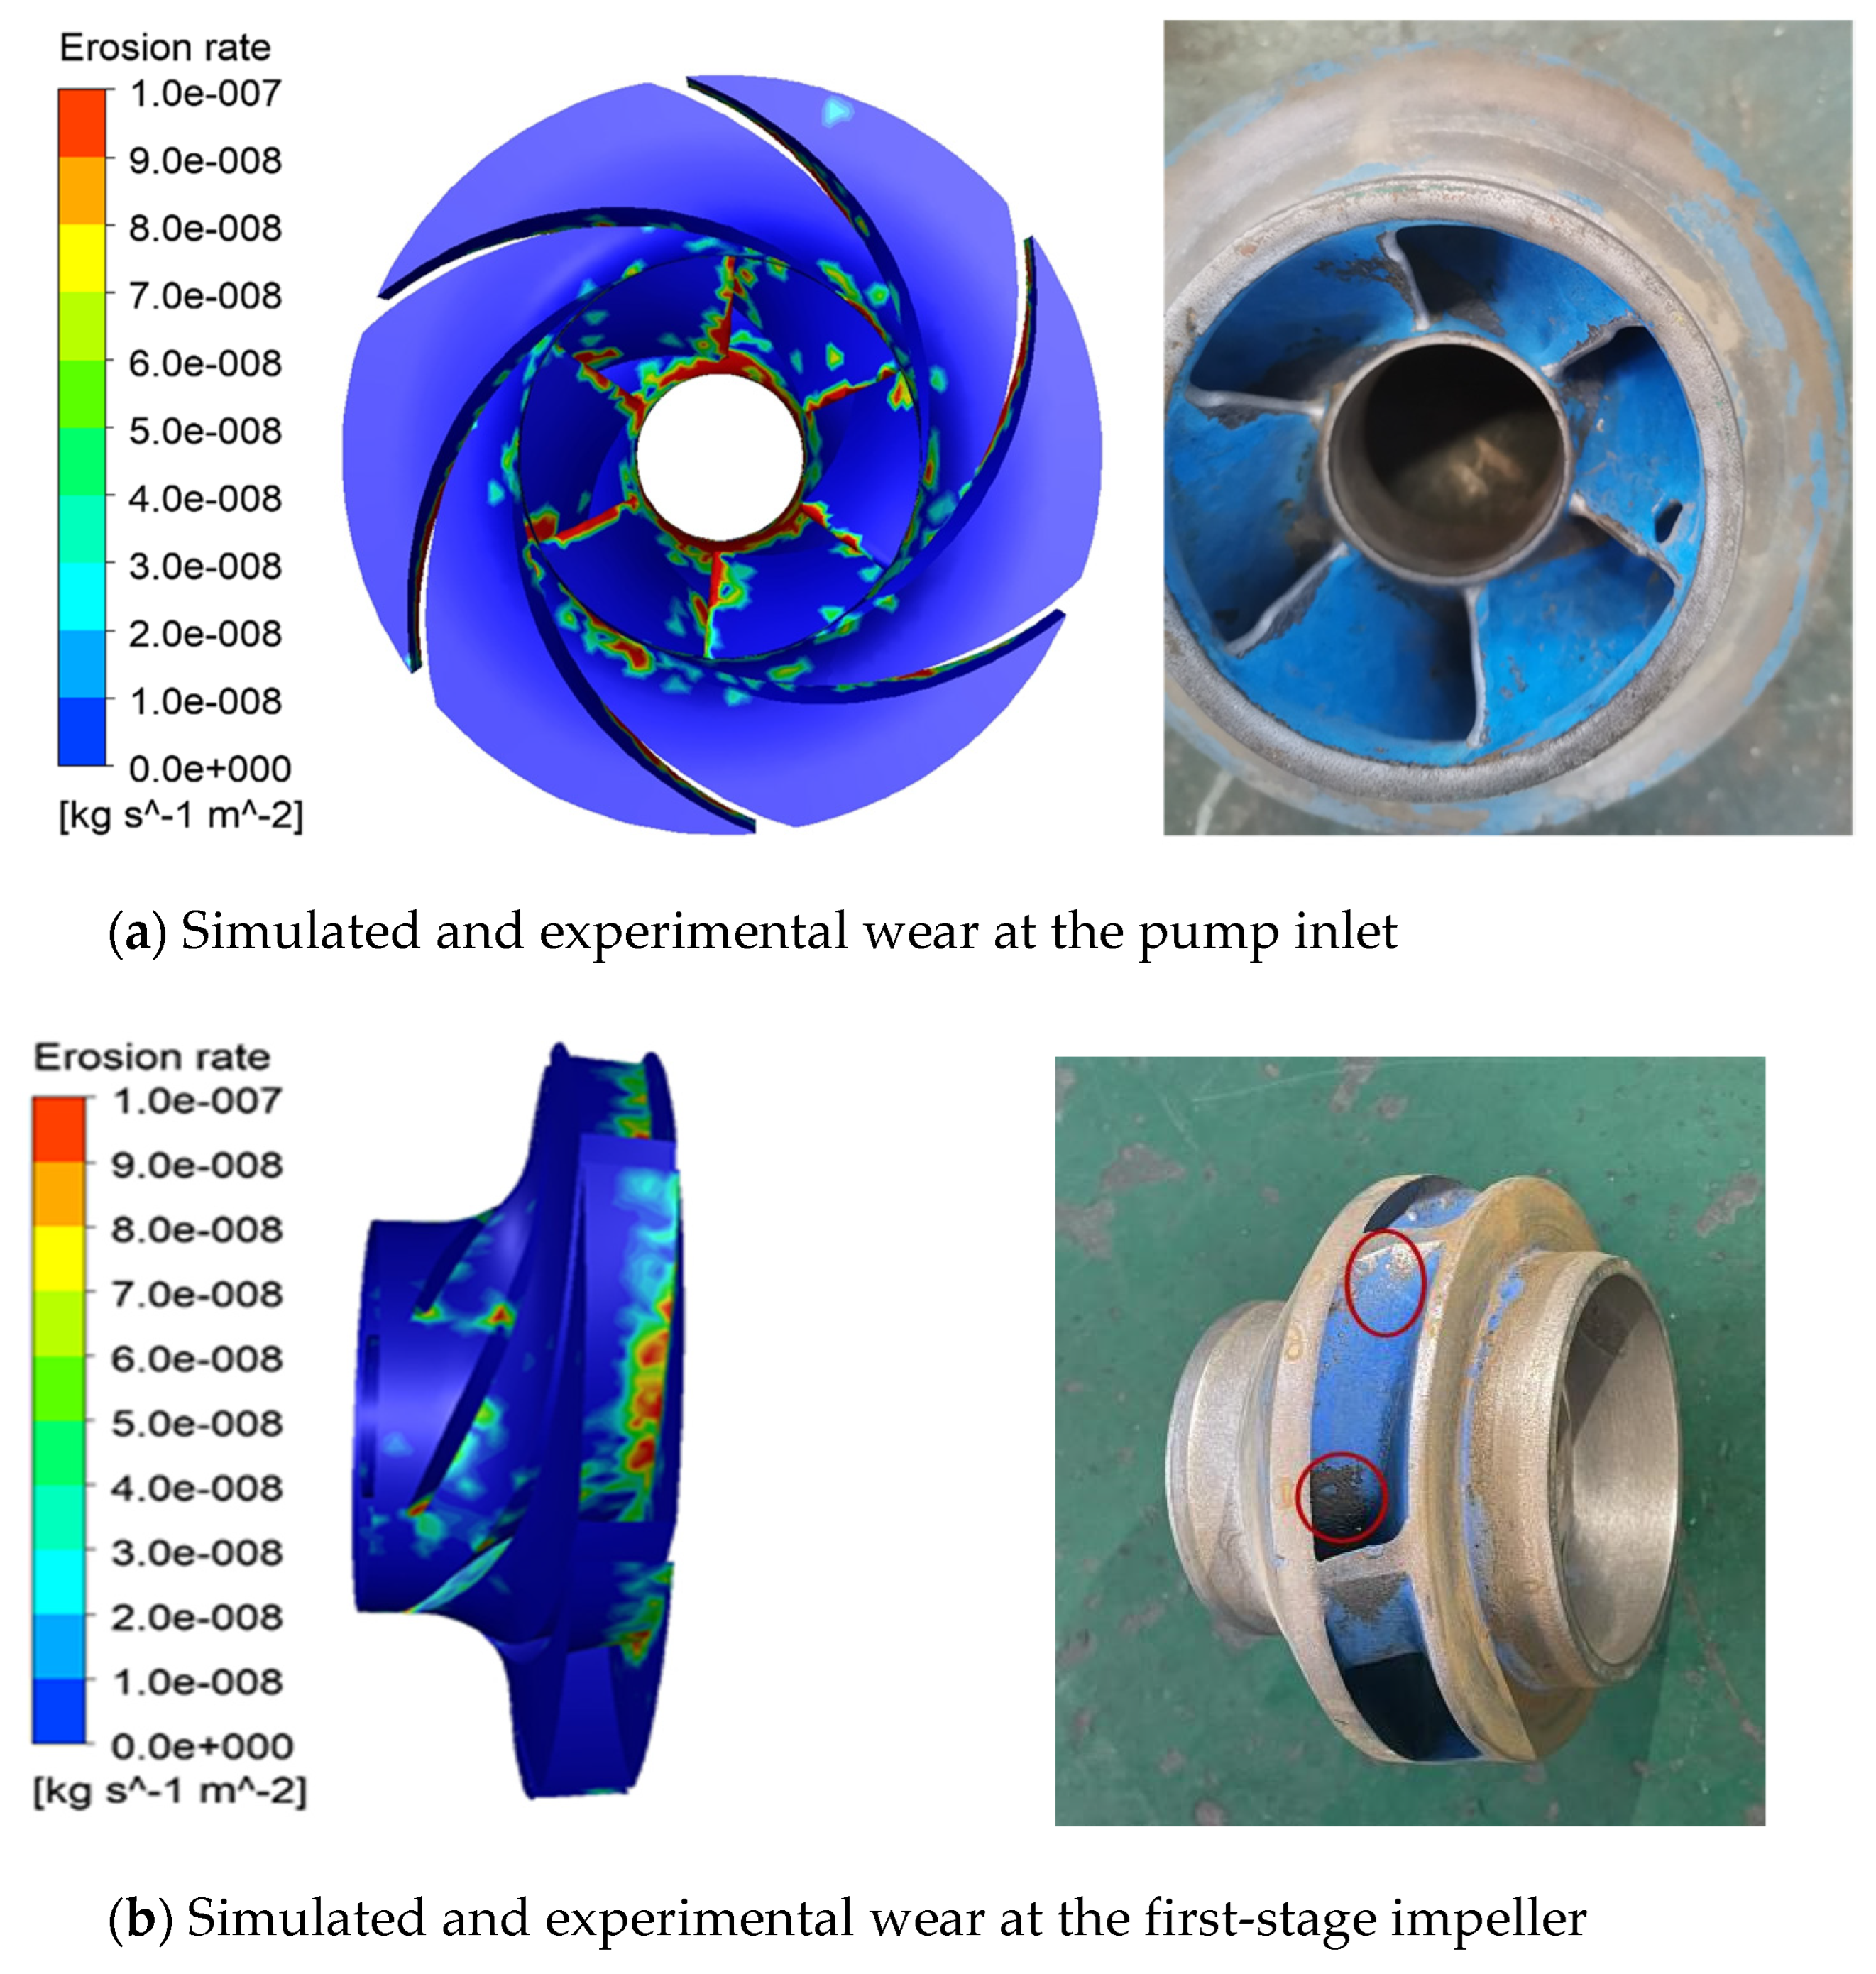
- In the pump wear experiment, which was performed at the pump’s rated flow, severe wear was observed at the radial inlet of the pump, as well as the LE and TE of the first-stage impeller and second-stage impeller. Moreover, the surface wear on the second-stage impeller was more severe than that on the first-stage impeller. Hence, the flow-passing components must be strengthened at these locations.
- (3)
- A comparison was performed between numerically simulated and experimentally observed wear characteristics, which showed that the numerical and experimental results are consistent with each other. Therefore, the numerical method used in this work can accurately predict the surface wear of flow-passing components in mining pumps.
- (4)
- As mining pumps work in complex operating environments and comprise several flow-passing components, their particle motions are highly complex. When a mining pump is used to transport solid-liquid two-phase flows, the solid particles cause varying degrees of wear in the flow-passing components. However, by predicting the wear characteristics of mining pumps using an appropriate numerical method and erosive wear model, pump designers and manufacturers may use the insights gained from these predictions to selectively strengthen the parts of the flow-passing components that are expected to experience significant wear. Thus, the methods proposed in this study are expected to function as a suitable numerical method and wear model that is well-suited for this purpose.
Author Contributions
Funding
Institutional Review Board Statement
Informed Consent Statement
Data Availability Statement
Conflicts of Interest
References
- Xu, H.; Zhou, Y.; Yang, F.; Wu, B. Analysis on influences of feeding flow rate on flow characteristics in deep-sea ore hydraulic transport equipment. J. Drain. Irrig. Mach. Eng. 2019, 37, 618–624. [Google Scholar]
- Yang, Y.; Zhou, L.; Hang, J.; Du, D.; Shi, W.; He, Z. Energy characteristics and optimal design of diffuser meridian in an electrical submersible pump. Renew. Energy 2021, 167, 718–727. [Google Scholar] [CrossRef]
- Wilson, K.; Addie, G. Slurry Transport Using Centrifugal Pumps; Elsevier Applied Science: London, UK, 2009. [Google Scholar]
- Bai, L.; Zhou, L.; Jiang, X.; Pang, Q.; Ye, D. Vibration in a multistage centrifugal pump under varied conditions. Shock. Vib. 2019, 2019, 2057031. [Google Scholar] [CrossRef]
- Kang, Y.; Wang, K.; Hu, Q.; Liu, S. Research on a coupled system design for mineral lifting and wastewater drainage in deep-sea mining applications. Ocean. Eng. 2024, 299, 117260. [Google Scholar] [CrossRef]
- Clark, H.M. Particle velocity and size effects in laboratory slurry erosion measurements OR… do you know what your particles are doing? Tribol. Int. 2002, 35, 617–624. [Google Scholar] [CrossRef]
- Tarodiya, R.; Gandhi, B.K. Hydraulic performance and erosive wear of centrifugal slurry pumps—A review. Powder Technol. 2017, 305, 27–38. [Google Scholar] [CrossRef]
- Dong, X.; Zhang, H.L.; Wang, X.Y. Finite element analysis of wear for centrifugal slurry pump. Procedia Earth Planet. Sci. 2009, 1, 1532–1538. [Google Scholar]
- Noon, A.A.; Kim, M.H. Erosion wear on centrifugal pump casing due to slurry flow. Wear 2016, 364–365, 103–111. [Google Scholar] [CrossRef]
- Shen, Z.; Chu, W.; Li, X.; Dong, W. Sediment erosion in the impeller of a double-suction centrifugal pump-A case study of the Jingtai Yellow River Irrigation Project. Wear 2019, 422–423, 269–279. [Google Scholar] [CrossRef]
- Huang, X.B. Numerical simulation of prediction in centrifugal pump based on particle track model. Trans. Chin. Soc. Agric. Mach. 2016, 47, 35–41. [Google Scholar]
- Pagalthivarthi, K.V.; Desai, P.V.; Addie, G.R. Particle motion and concentration fields in centrifugal slurry pumps. Part. Sci. Technol. 1990, 8, 77–96. [Google Scholar] [CrossRef]
- Pagalthivarthi, K.V.; Gupta, P.K.; Tyagi, V.; Ravi, M.R. CFD Prediction of Erosion Wear in Centrifugal Slurry Pumps for Dilute Slurry Flows. J. Comput. Multiph. Flows 2011, 3, 225–246. [Google Scholar] [CrossRef]
- Peng, G.; Fan, F.; Zhou, L.; Huang, X.; Ma, J. Optimal hydraulic design to minimize erosive wear in a centrifugal slurry pump impeller. Eng. Fail. Anal. 2021, 120, 105105. [Google Scholar] [CrossRef]
- Khalid, Y.A.; Sapuan, S.M. Wear analysis of centrifugal slurry pump impellers. Industr. Lubric. Tribol. 2007, 59, 18–28. [Google Scholar] [CrossRef]
- Lopez, A.; Stickland, M.; Dempster, W. Modeling erosion in a centrifugal pump in an Eulerian-Lagrangian frame using OpenFOAM®. Open Eng. 2015, 5, 105–124. [Google Scholar] [CrossRef]
- Peng, G.; Huang, X.; Zhou, L.; Zhou, G.; Zhou, H. Solid-liquid two-phase flow and wear analysis in a large-scale centrifugal slurry pump. Eng. Fail. Anal. 2020, 114, 104602. [Google Scholar] [CrossRef]
- Walker, C.I.; Robbie, P. Comparison of some laboratory wear tests and field wear in slurry pumps. Wear 2013, 302, 1026–1034. [Google Scholar] [CrossRef]
- Janssen, A.; Pinedo, B.; Igartua, A.; Liiskmann, G.; Sexton, L. Study on friction and wear reducing surface micro-structures for a positive displacement pump handling highly abrasive shale oil. Tribol. Int. 2017, 107, 1–9. [Google Scholar] [CrossRef]
- Serrano, R.O.P.; Santos, L.P.; de Faria Viana, E.M.; Pinto, M.A.; Martinez, C.B. Case study: Effects of sediment concentration on the wear of fluvial water pump impellers on Brazil’s Acre River. Wear 2018, 408–409, 131–137. [Google Scholar] [CrossRef]
- Veselin, B. Erosion wear model of slurry pump impeller. J. Tribol. 2010, 132, 1–5. [Google Scholar]
- Sugiyama, K.; Nagasaka, H.; Enomoto, T.; Hattori, S. Prediction of wear depth distribution by slurry on a pump impeller. Int. J. Fluid Mach. Syst. 2009, 2, 21–30. [Google Scholar] [CrossRef]
- Zhao, E.L. Numerical Simulation and Wear Analysis of Solid-Liquid Two Phase Turbulent Flow in Centrifugal Impurity Pump. Master’s Thesis, Hefei University of Technology, Hefei China, June 2017. [Google Scholar]
- Wu, W.D. Research on Flow and Wear Characteristics of Dense Fine Particles Solid-Liquid Two Phase Flow in Centrifugal Pump. Master’s Thesis, Zhejiang Sci-Tech University, Hangzhou, China, June 2020. [Google Scholar]
- Zhou, L.; Deshpande, K.; Zhang, X.; Agarwal, R.K. Process simulation of Chemical Looping Combustion using ASPEN Plus for a mixture of biomass and coal with various oxygen carriers. Energy 2020, 195, 116955. [Google Scholar] [CrossRef]
- Wei, H.; Xuefeng, L.I.; Min, S.U.; Rennian, L.I.; Hao, C. Pressure fluctuation of solid-liquid flow in stator and rotor cascades of pump as turbine. J. Drain. Irrig. Mach. Eng. 2018, 36, 99–103. [Google Scholar]
- Zhou, L.; Han, C.; Bai, L.; Li, W.; El-Emam, M.A.; Shi, W. CFD-DEM bidirectional coupling simulation and experimental investigation of particle ejections and energy conversion in a spouted bed. Energy 2020, 211, 118672. [Google Scholar] [CrossRef]
- Pagalthivarthi, K.V.; Gupta, P.K.; Tyagi, V.; Ravi, M.R. CFD predictions of dense slurry flow in centrifugal pump casings. World Acad. Sci. Eng. Technol. 2011, 5, 16–28. [Google Scholar]
- Tarodiya, R.; Gandhi, B.K. Effect of particle size distribution on performance and particle kinetics in a centrifugal slurry pump handling multi-size particulate slurry. Adv. Powder Technol. 2020, 31, 4751–4767. [Google Scholar] [CrossRef]
- Peng, G.; Chen, Q.; Bai, L.; Hu, Z.; Zhou, L.; Huang, X. Wear mechanism investigation in a centrifugal slurry pump impeller by numerical simulation and experiments. Eng. Fail. Anal. 2021, 128, 105637. [Google Scholar] [CrossRef]
- Tarodiya, R.; Gandhi, B.K. Numerical simulation of a centrifugal slurry pump handling solid-liquid mixture: Effect of solids on flow field and performance. Adv. Powder Technol. 2019, 30, 2225–2239. [Google Scholar] [CrossRef]
- Kadambi, J.R.; Charoenngam, P.; Subramanian, A.; Wernet, M.P.; Sankovic, J.M.; Addie, G.; Courtwright, R. Investigations of particle velocities in a slurry pump using PIV: Part 1, the tongue and adjacent channel flow. J. Energy Resour. Technol. 2004, 126, 271–278. [Google Scholar] [CrossRef]
- Cader, T.; Masbernat, O.; Roco, M.C. Two-phase velocity distributions and overall performance of a centrifugal slurry pump. J. Fluids Eng. 1994, 116, 316. [Google Scholar] [CrossRef]
- Cai, X.; Zhou, S.P.; Li, S. Study on the influence of back blade shape on the wear characteristics of centrifugal slurry pump. IOP Conf. Ser. Mater. Sci. Eng. 2016, 129, 012058. [Google Scholar] [CrossRef]
- Liao, J.; Lai, X.D.; Zhang, W.M. Numerical analysis of internal flow field of centrifugal pump based on solid-liquid two-phase flow. J. Eng. Therm. Energy Power 2017, 32, 95–99+139–140. [Google Scholar]
- Yang, L.B.; Xiao, Y.X.; Tang, B. Prediction of pulp pump erosion characteristic based on solid-liquid two-phase turbulent flow. J. Drain. Irrig. Mach. Eng. 2015, 33, 98–103. [Google Scholar]
- Liu, S.J.; Wen, H.; Zou, W.S.; Hu, X.Z.; Dong, Z. Deep-sea mining pump wear prediction using two-phase flow numerical simulation. J. Drain. Irrig. Mach. Eng. 2020, 38, 541–546. [Google Scholar]
- Zhao, R.J.; Zhao, Y.L.; Zhang, D.S.; Li, Y.; Geng, L.L. Numerical Investigation of the Characteristics of Erosion in a Centrifugal Pump for Transporting Dilute Particle-Laden Flows. J. Mar. Sci. Eng. 2021, 9, 961. [Google Scholar] [CrossRef]
- Kökpınar, M.A.; Göğüş, M. Critical flow velocity in slurry transporting horizontal pipelines. J. Hydraul. Eng. 2001, 127, 763–771. [Google Scholar] [CrossRef]


| Impeller | Guide Vane | ||
|---|---|---|---|
| Parameter | Value | Parameter | Value |
| Inlet diameter/mm | 60 | Number of blades/piece | 8 |
| Outer diameter/mm | 116 | Wrap angle/° | 90 |
| Number of blades/piece | 6 | Inlet inner diameter/mm | 120 |
| Blade wrap angle/° | 130 | Inlet outer diameter/mm | 145 |
| Exit placement angle/° | 28 | Outlet inner diameter/mm | 25 |
| Outlet width/mm | 12 | Outlet outer diameter/mm | 60 |
| Mesh Scheme Number | Impeller (Ten Thousand) | Guide Vane (Ten Thousand) | Inlet/Outlet Section (Ten Thousand) | Total (Ten Thousand) | Head (m) |
|---|---|---|---|---|---|
| 1 | 9.1 | 24.9 | 13.2 | 94 | 31.71 |
| 2 | 15.2 | 42.0 | 22.8 | 160 | 30.84 |
| 3 | 20.0 | 55.1 | 29.9 | 210 | 31.22 |
| 4 | 29.1 | 80.2 | 42.9 | 300 | 30.35 |
| 5 | 51.5 | 142 | 76.0 | 530 | 30.36 |
| 6 | 66.0 | 184 | 101 | 700 | 30.31 |
| b | c | x | y | w | z |
|---|---|---|---|---|---|
| −13.3 | 7.85 | 1.09 | 0.125 | 1 | 1 |
| Flow Conditions | Particle Volume Concentration | Particle Density | Particle Size (mm) |
|---|---|---|---|
| 0.65Qd | 7.5% | 1900 kg/m3 | 1, 3, 5 |
| 1.0Qd | 7.5% | 1900 kg/m3 | 1, 3, 5 |
| 1.3Qd | 7.5% | 1900 kg/m3 | 1, 3, 5 |
Disclaimer/Publisher’s Note: The statements, opinions and data contained in all publications are solely those of the individual author(s) and contributor(s) and not of MDPI and/or the editor(s). MDPI and/or the editor(s) disclaim responsibility for any injury to people or property resulting from any ideas, methods, instructions or products referred to in the content. |
© 2024 by the authors. Licensee MDPI, Basel, Switzerland. This article is an open access article distributed under the terms and conditions of the Creative Commons Attribution (CC BY) license (https://creativecommons.org/licenses/by/4.0/).
Share and Cite
Hong, S.; Hu, X. Experimental Study and Analysis on Wear Characteristics of Mining Pumps Transporting Solid-Liquid Two-Phase Flows. Appl. Sci. 2024, 14, 5634. https://doi.org/10.3390/app14135634
Hong S, Hu X. Experimental Study and Analysis on Wear Characteristics of Mining Pumps Transporting Solid-Liquid Two-Phase Flows. Applied Sciences. 2024; 14(13):5634. https://doi.org/10.3390/app14135634
Chicago/Turabian StyleHong, Shunjun, and Xiaozhou Hu. 2024. "Experimental Study and Analysis on Wear Characteristics of Mining Pumps Transporting Solid-Liquid Two-Phase Flows" Applied Sciences 14, no. 13: 5634. https://doi.org/10.3390/app14135634
APA StyleHong, S., & Hu, X. (2024). Experimental Study and Analysis on Wear Characteristics of Mining Pumps Transporting Solid-Liquid Two-Phase Flows. Applied Sciences, 14(13), 5634. https://doi.org/10.3390/app14135634