
Simulation-Oriented Analysis and Modeling of Distracted Driving
Abstract
:1. Introduction
2. Data
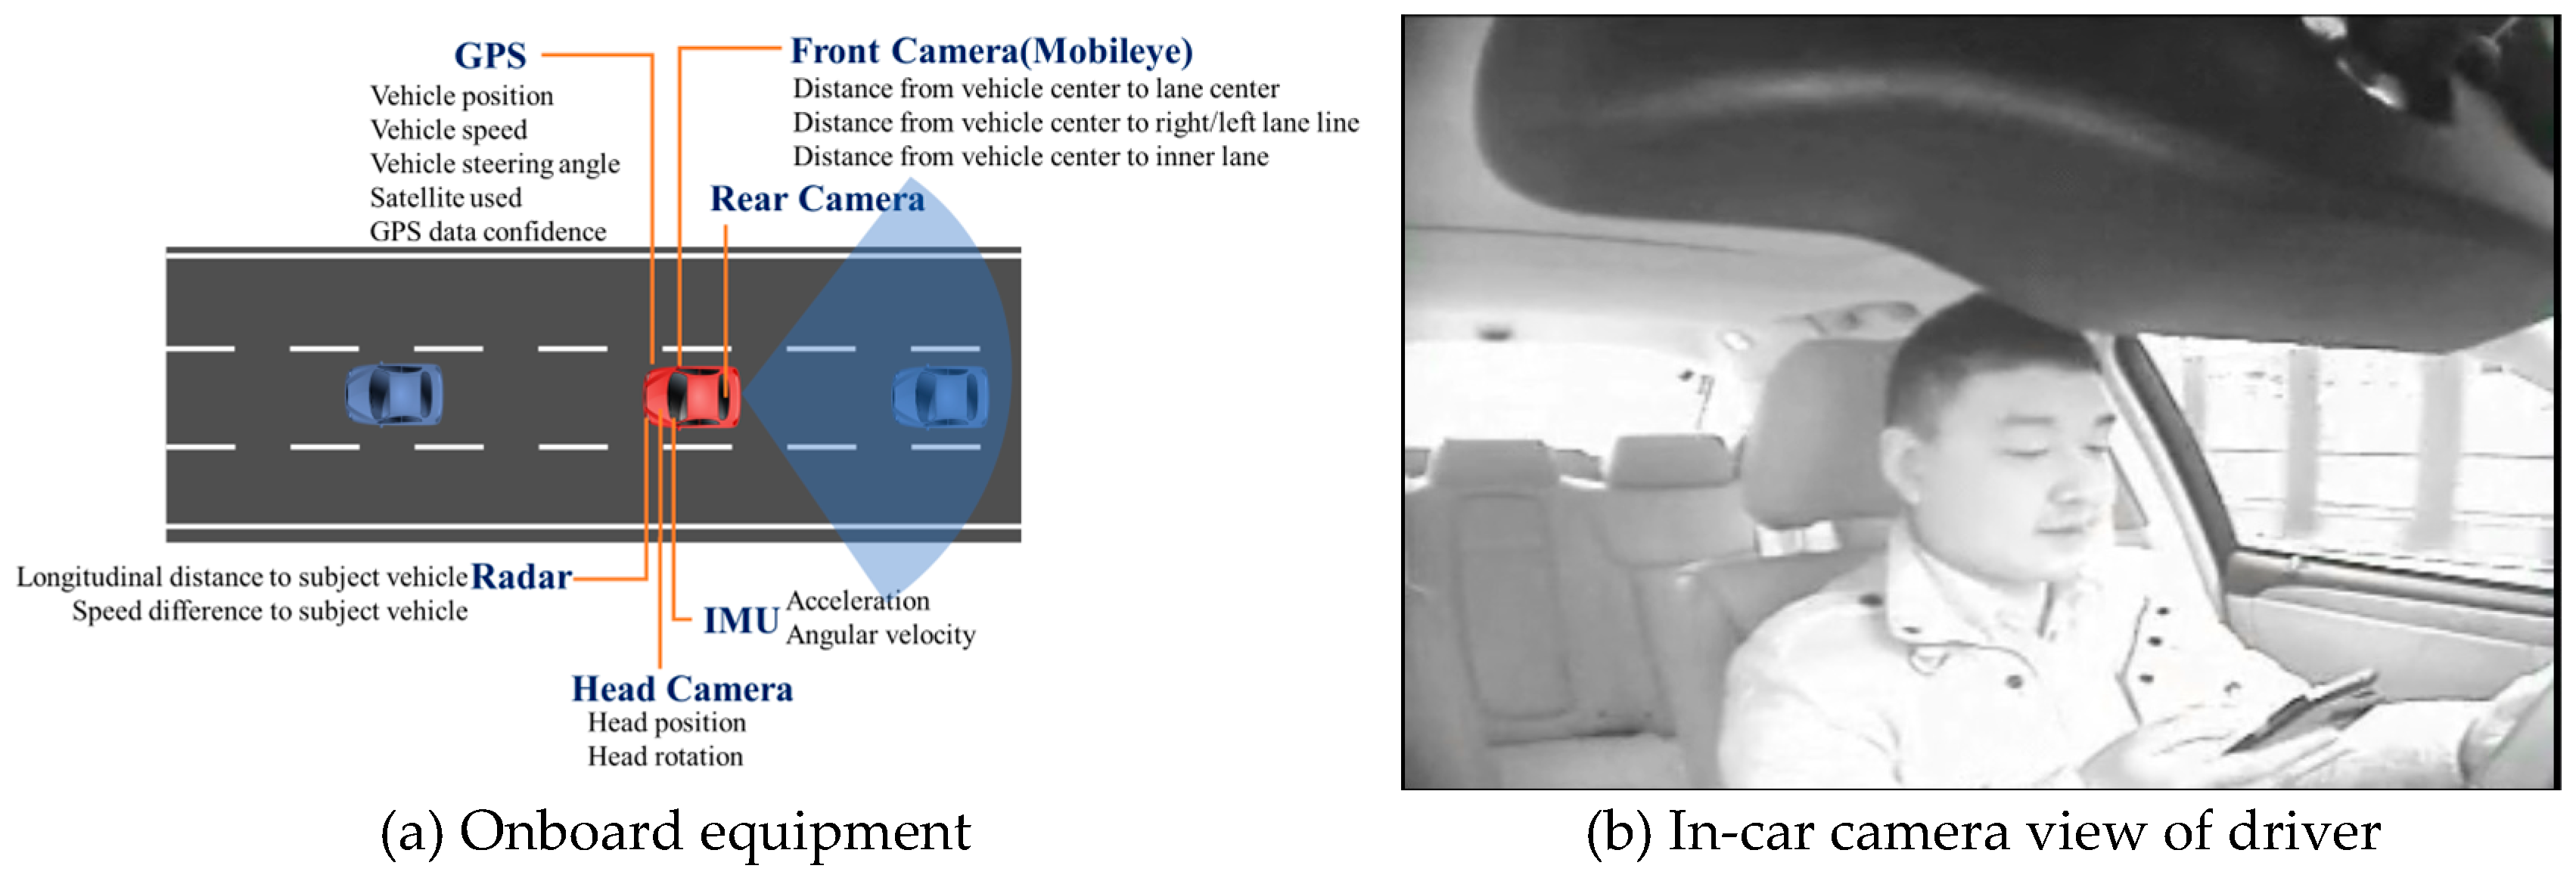
2.1. Shanghai Naturalistic Driving Study (SH-NDS)
2.2. Participants
2.3. Distracted Car-Following Event
3. Characteristics of Distracted Car-Following Events
3.1. Interval between Events
3.2. Duration of the Events
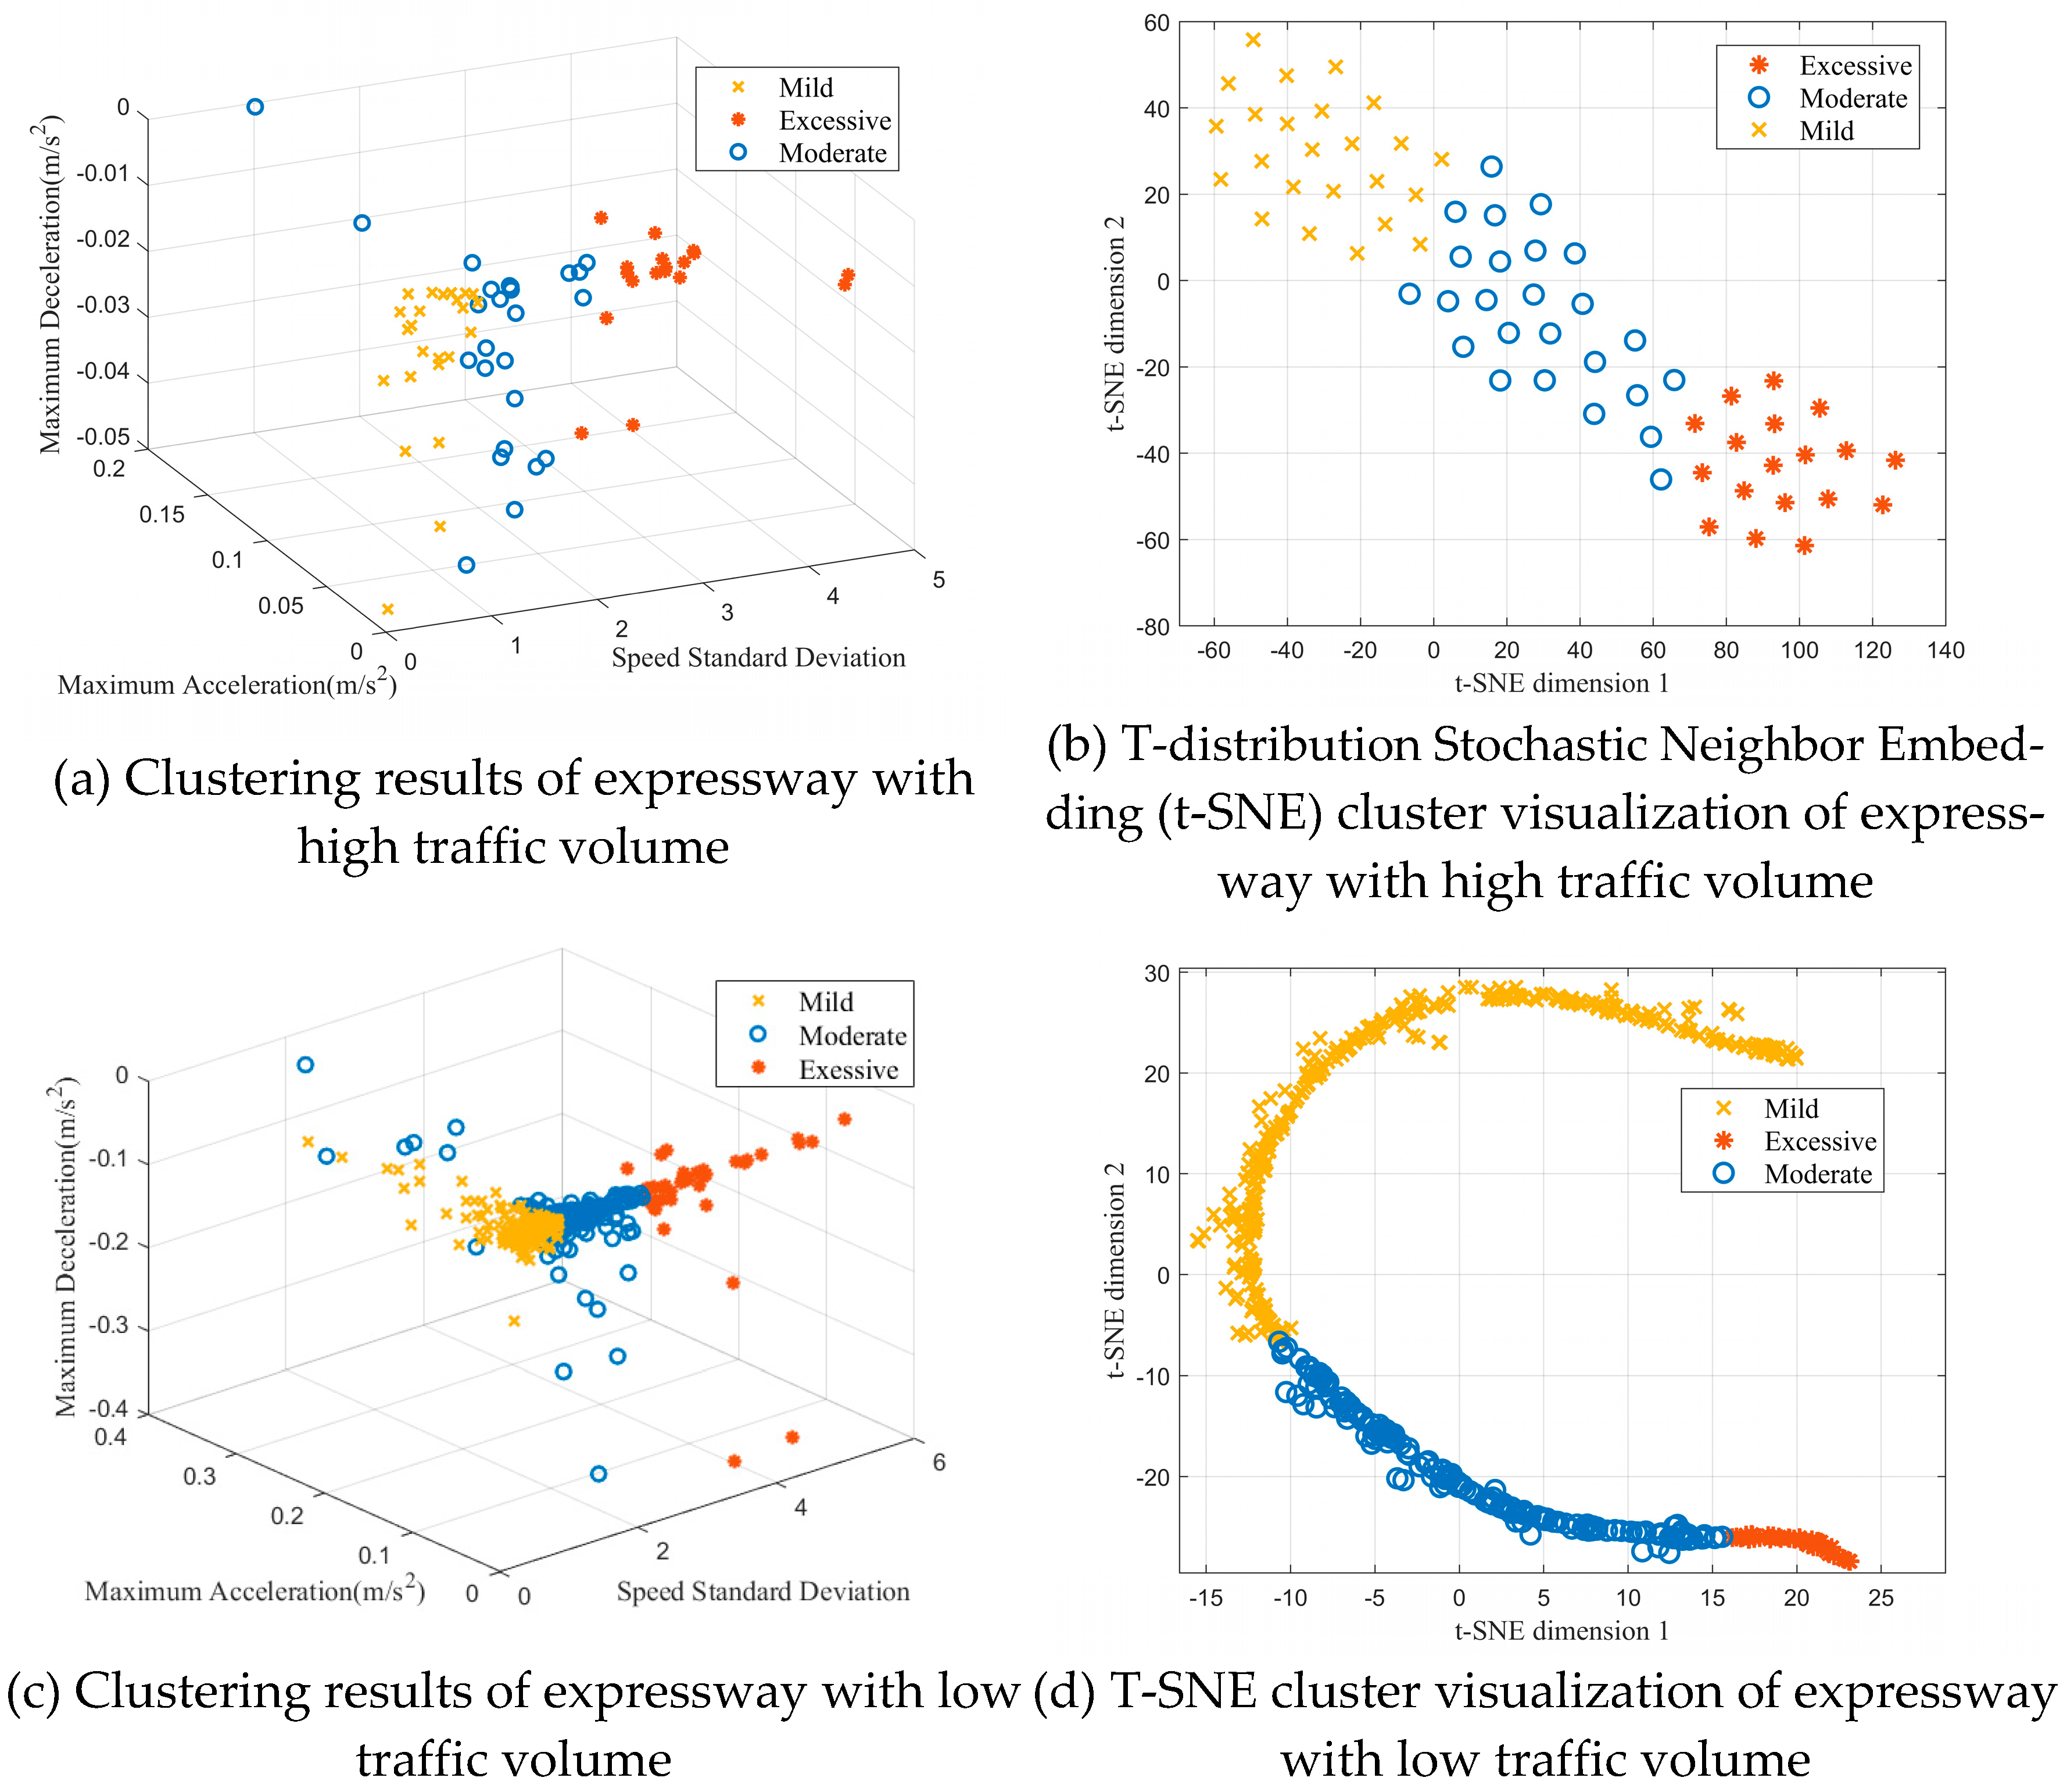
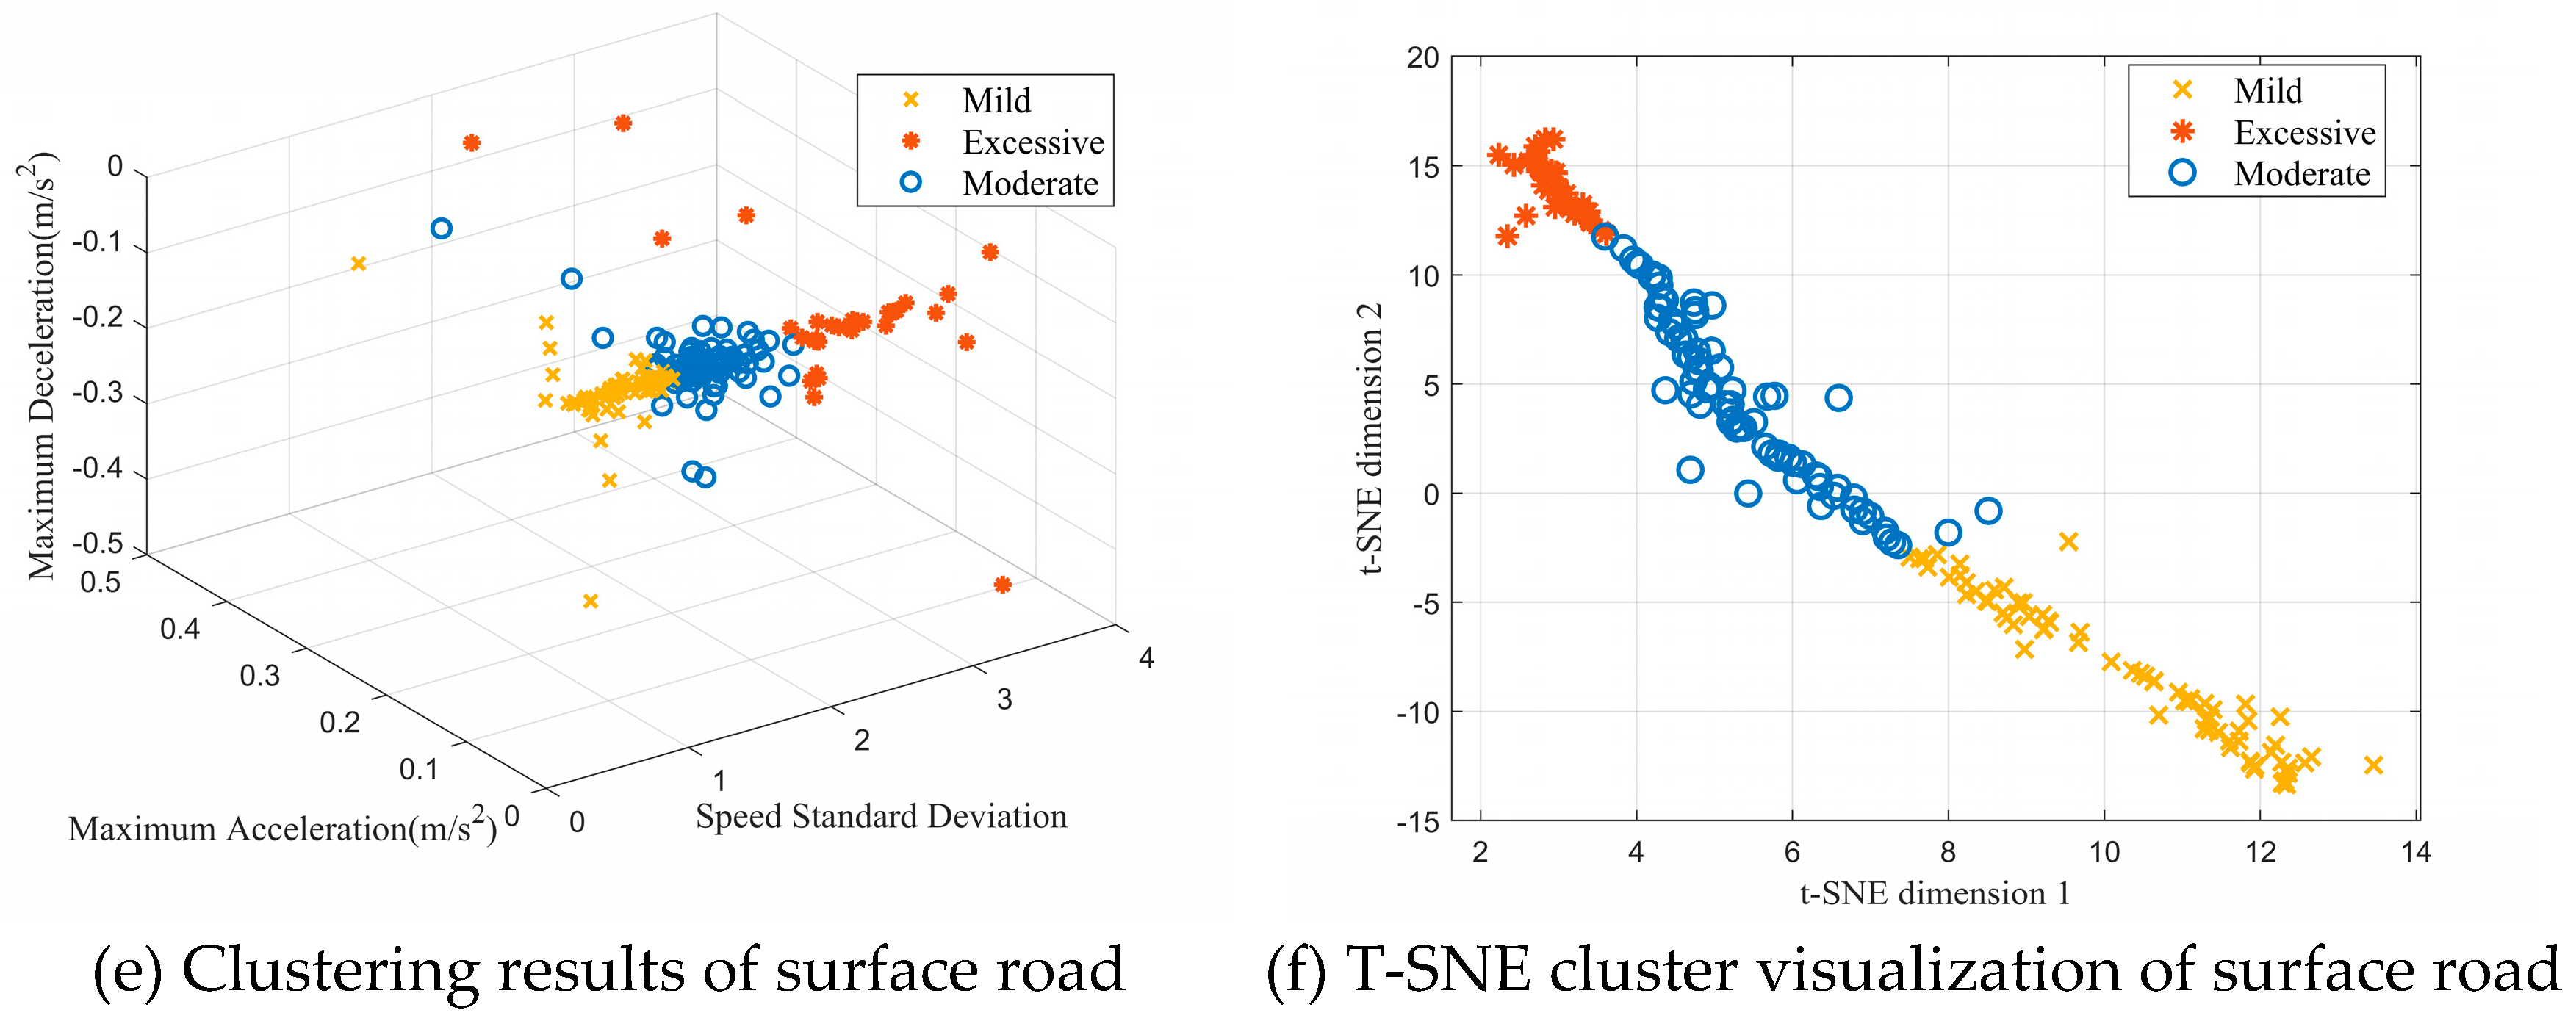
3.3. Distracted Car-Following Pattern
4. Distracted Car-Following Model
4.1. Driver Attributes Affected by Distraction
4.2. Distracted Car-Following Model
5. Model Calibration
5.1. Model Calibration Results
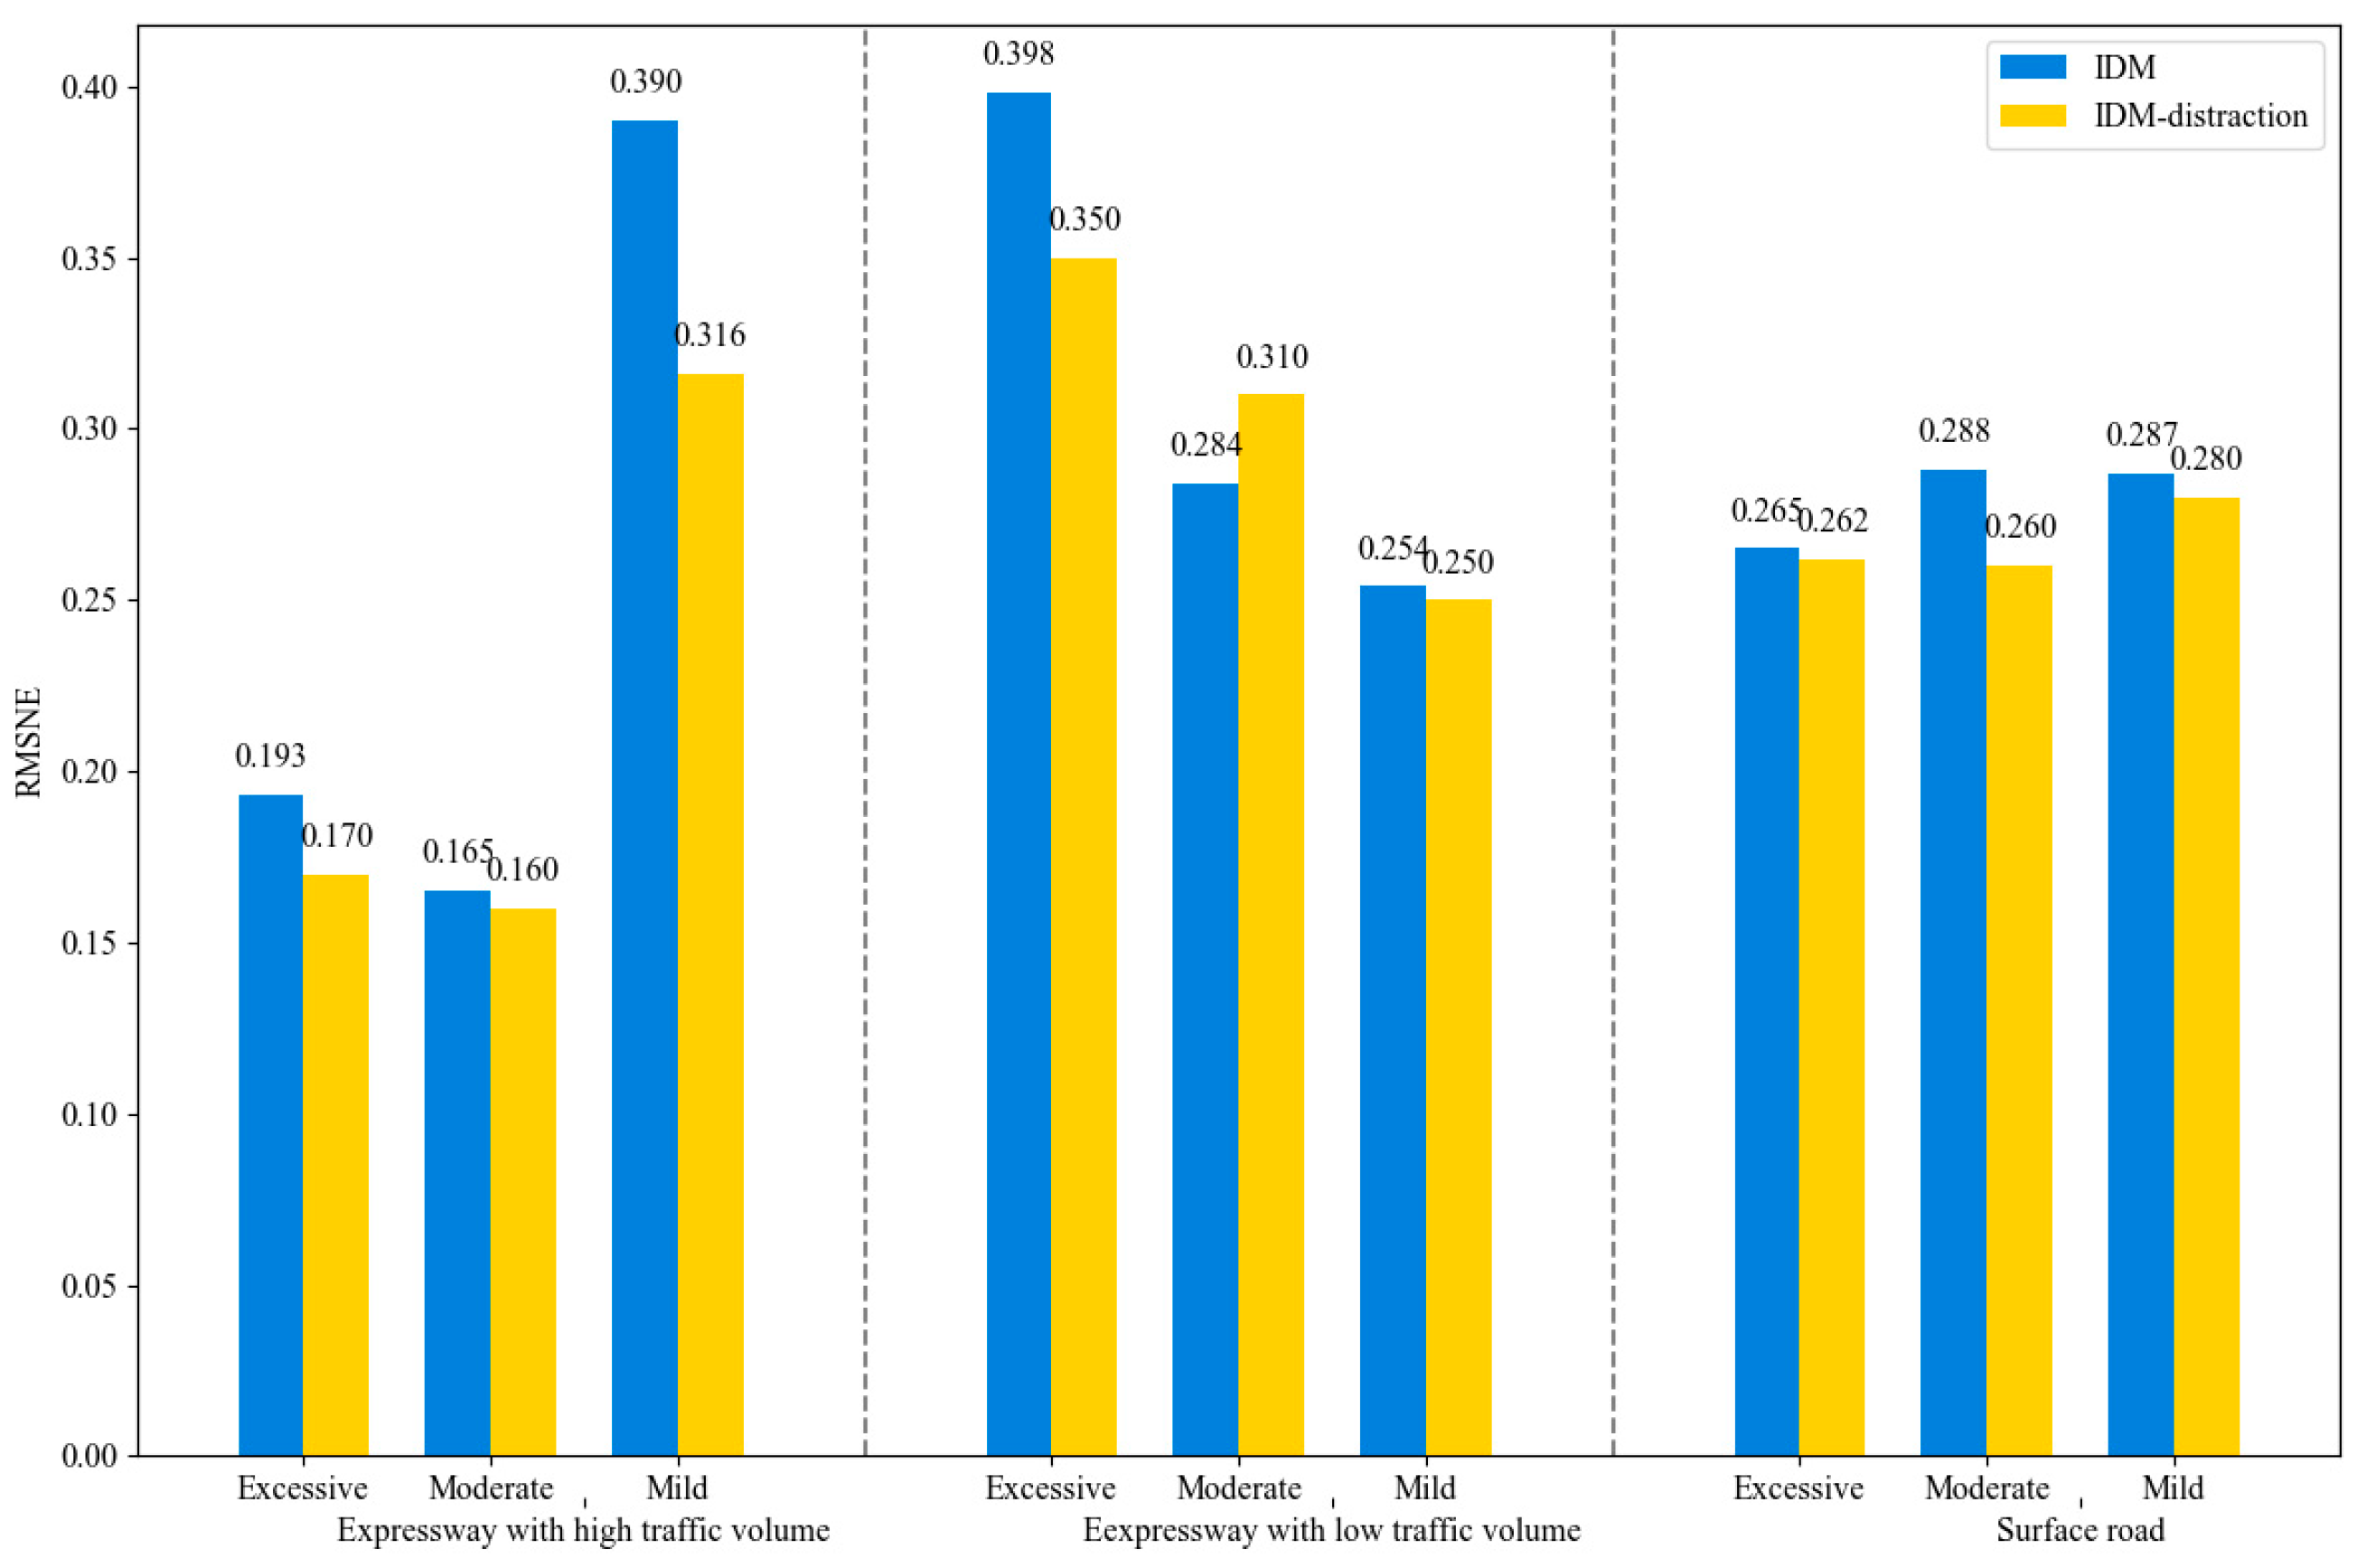
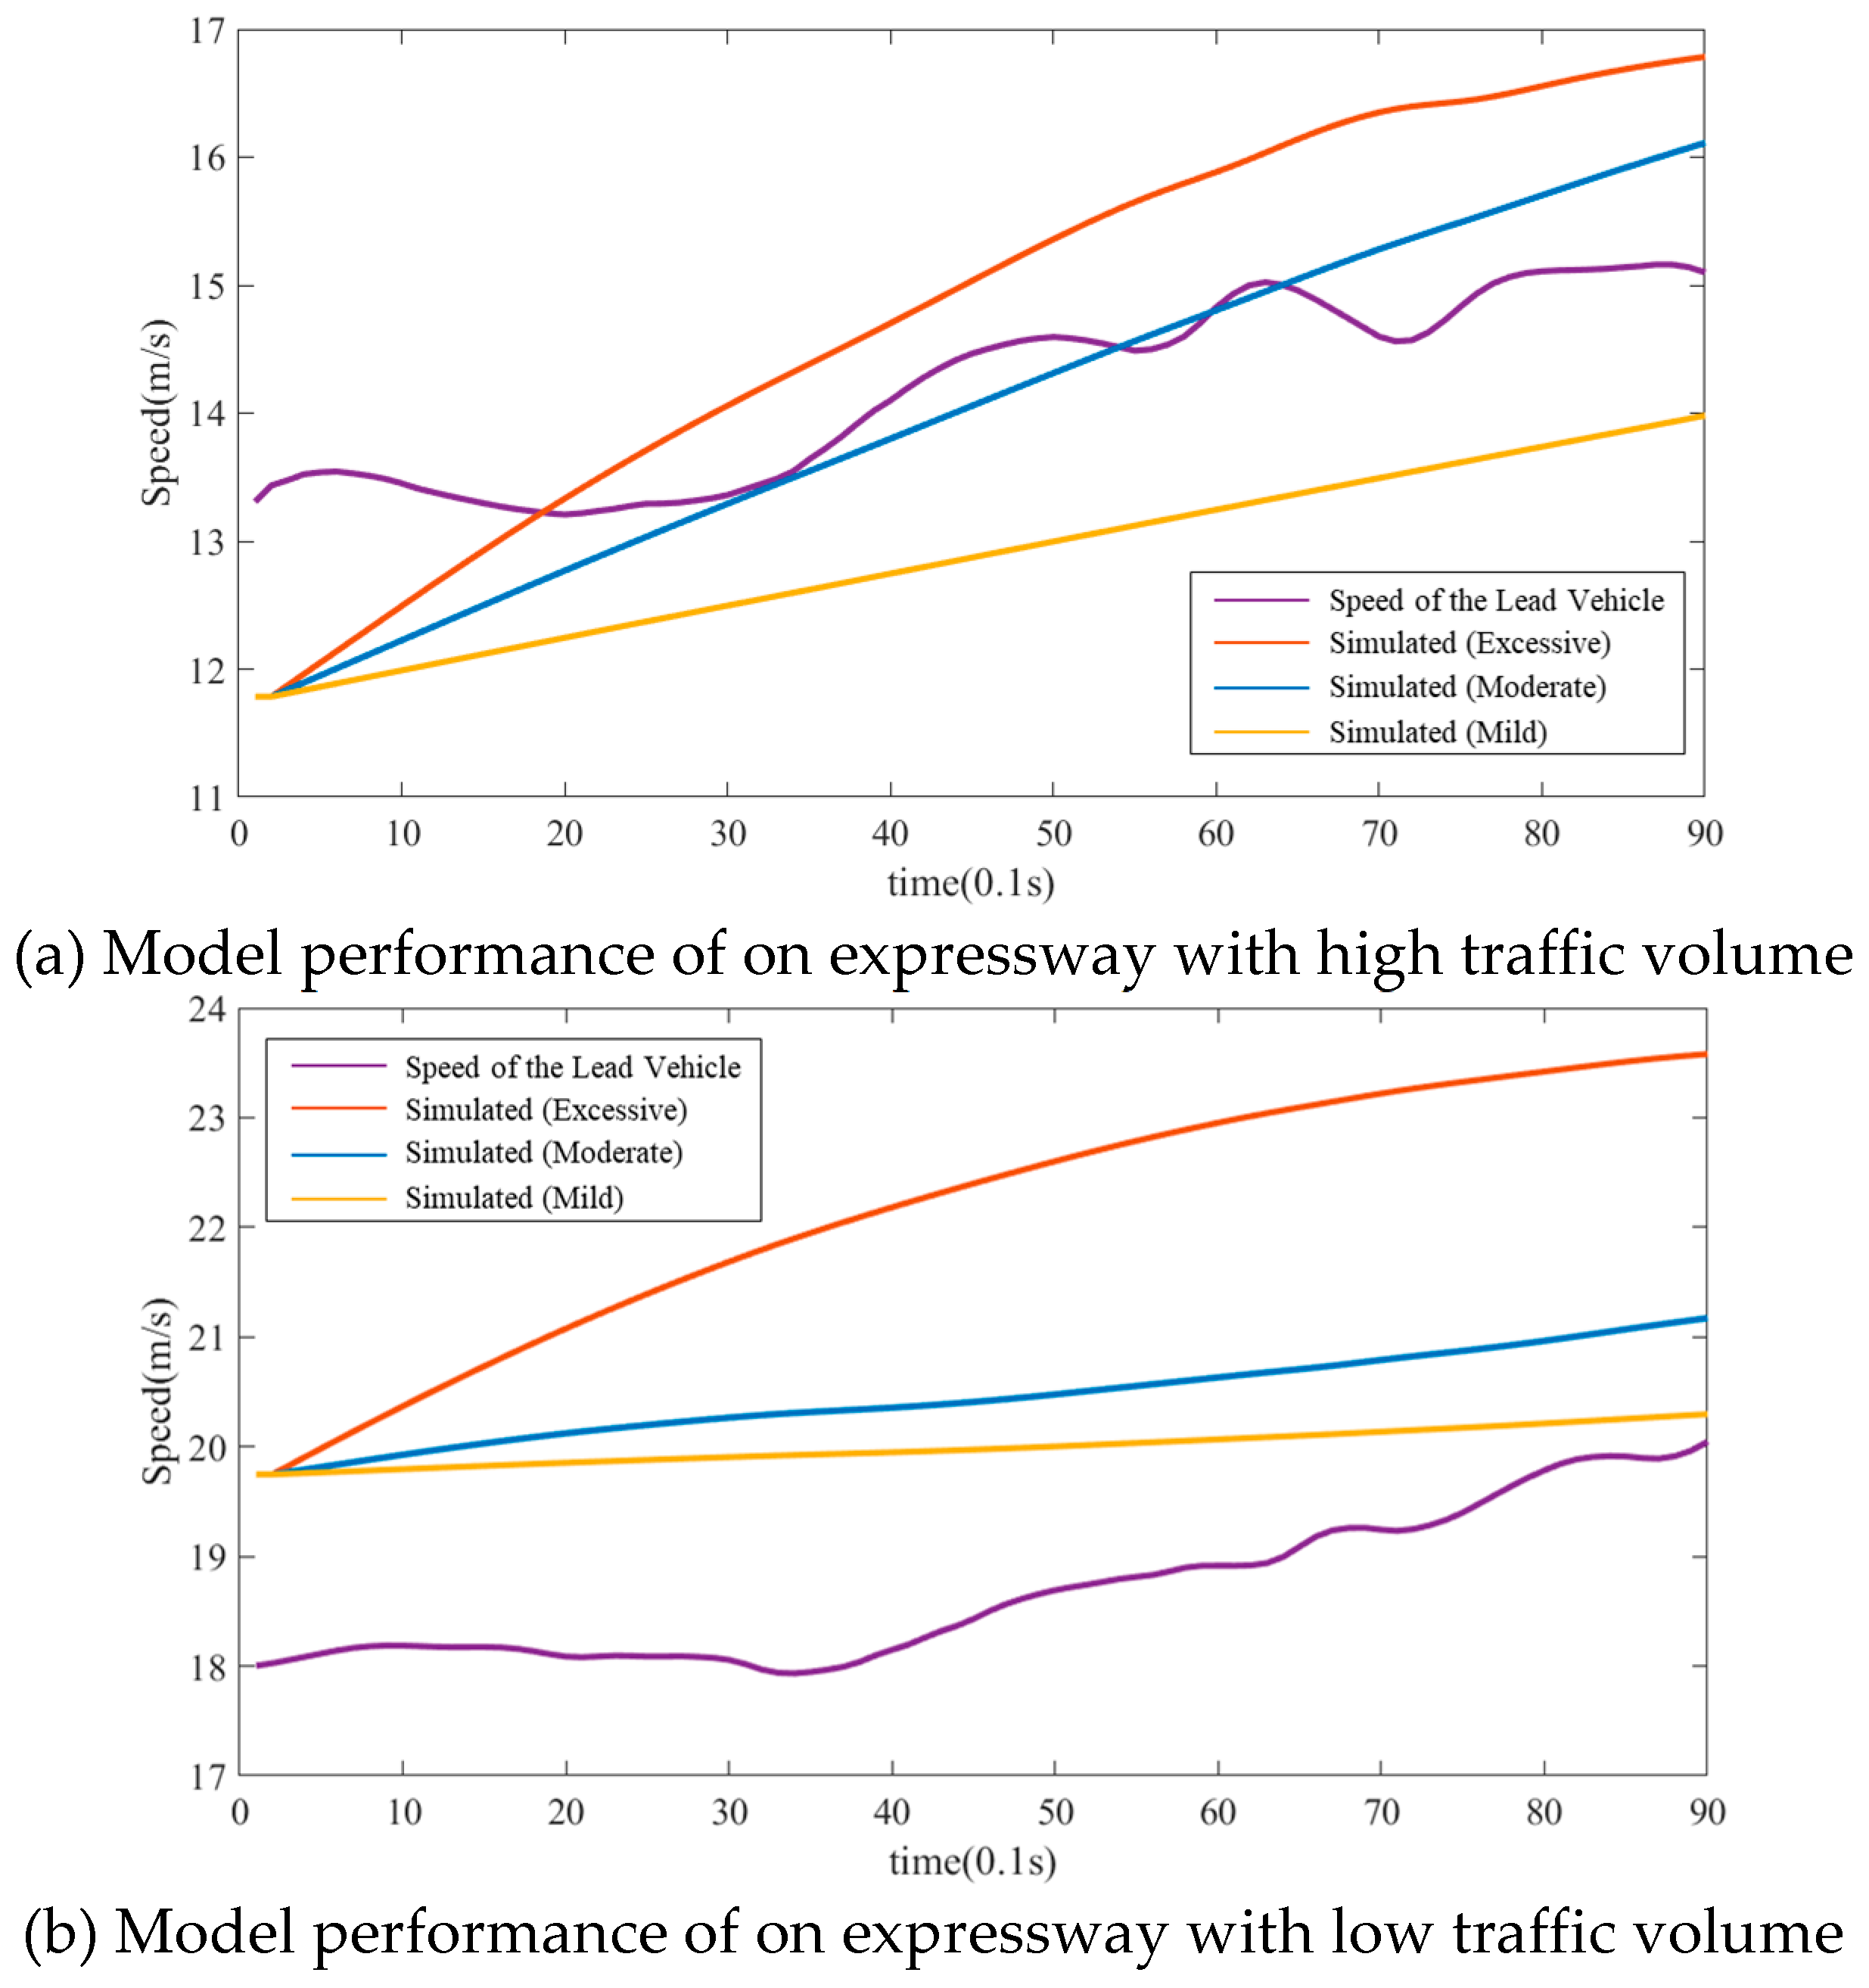
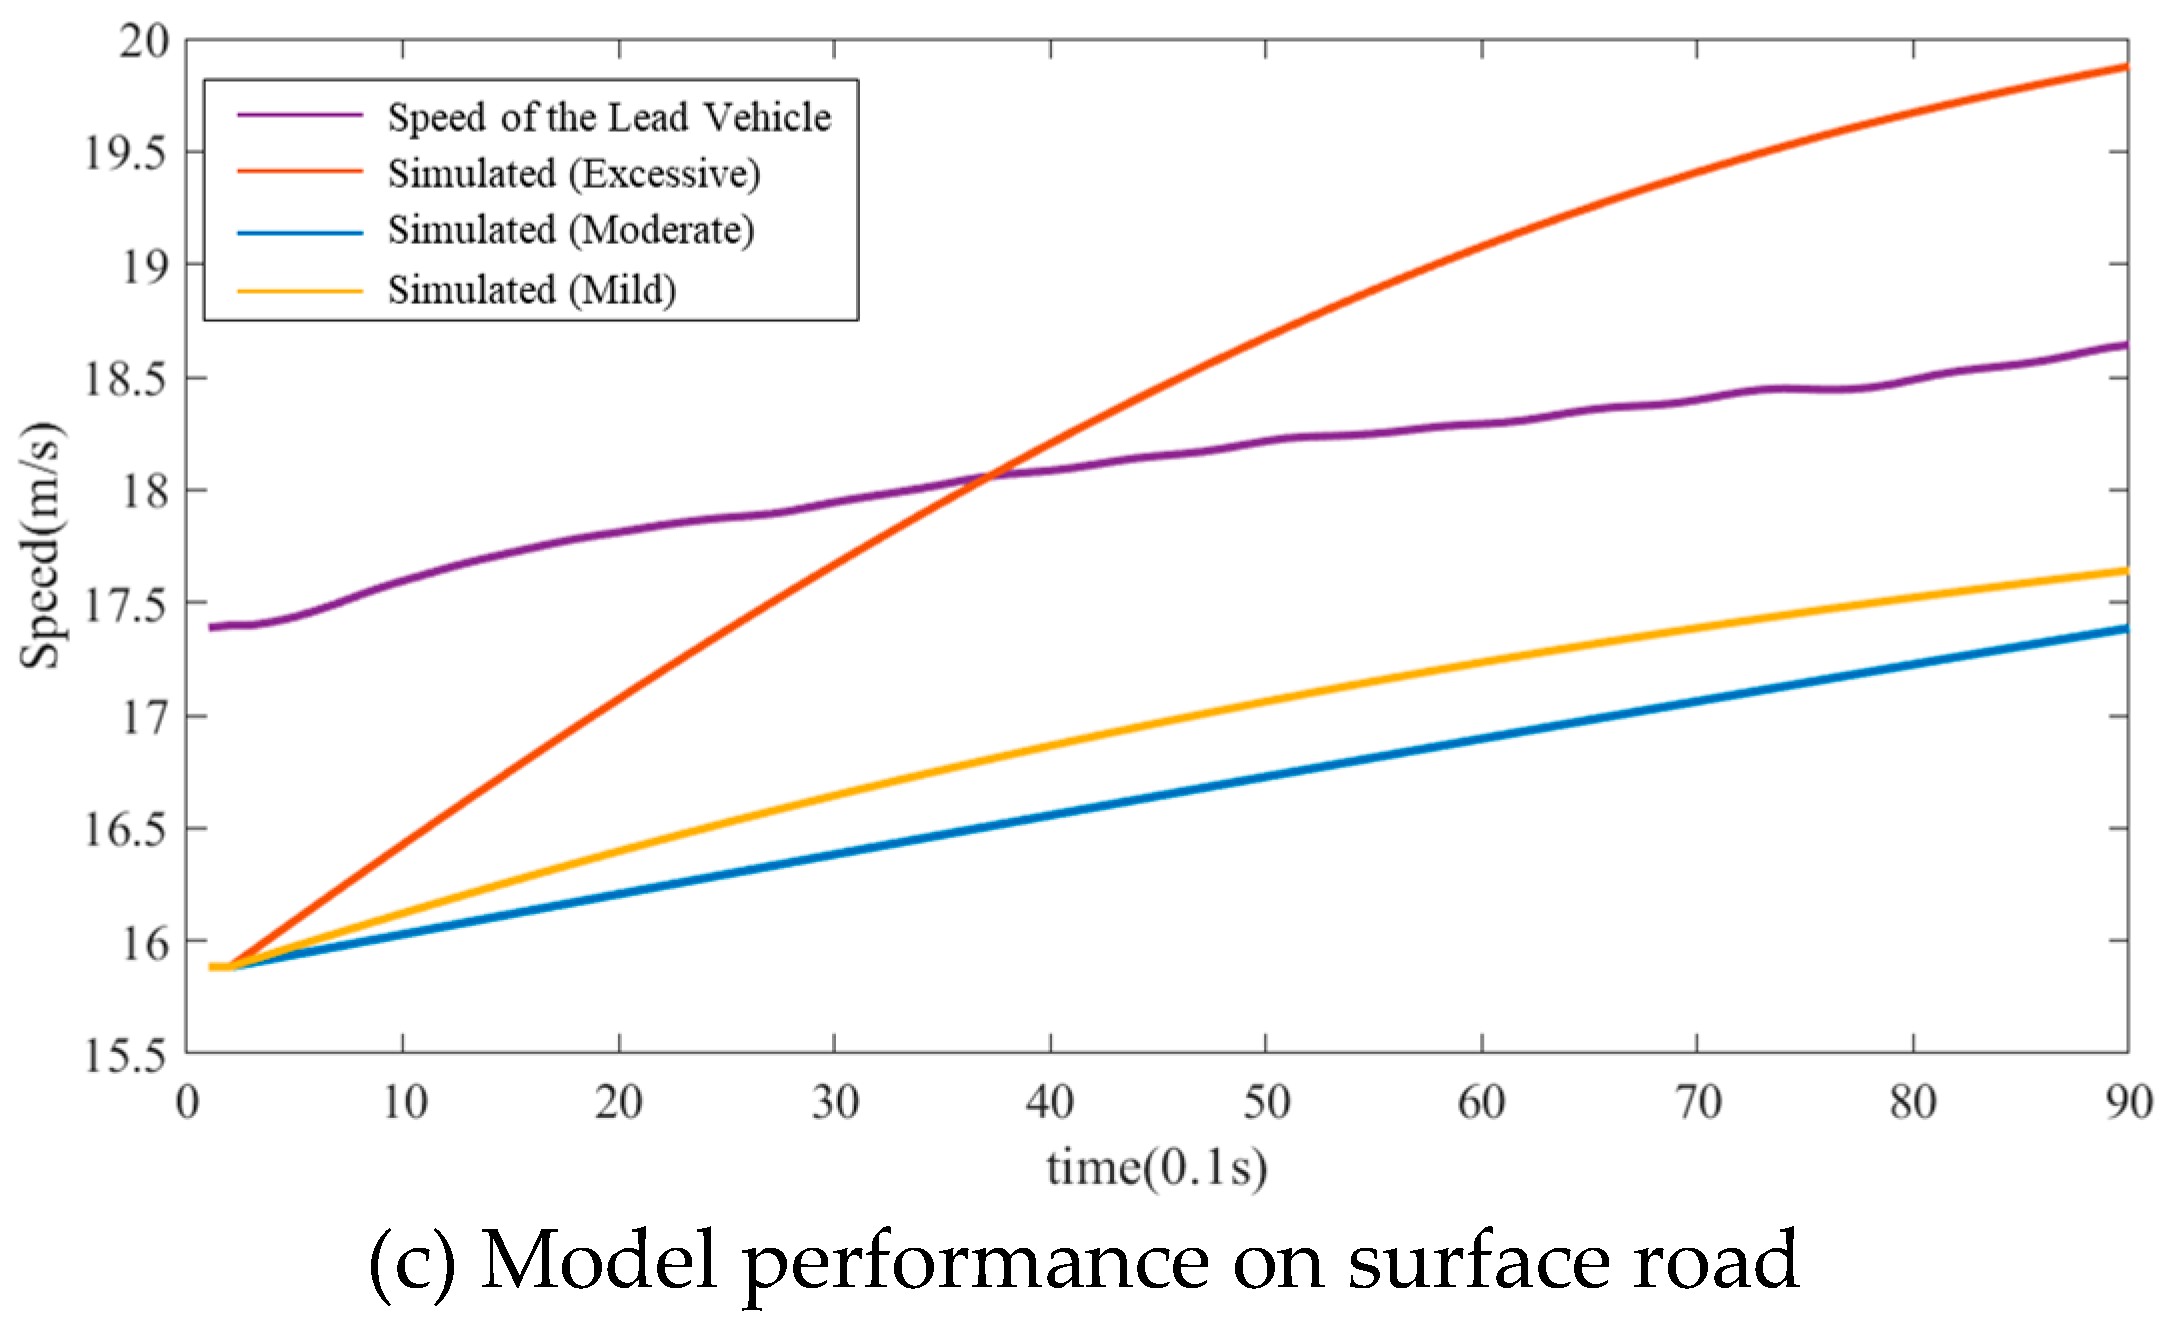
5.2. Model Performance at the Population Level
5.3. Model Performance at the Individual Level
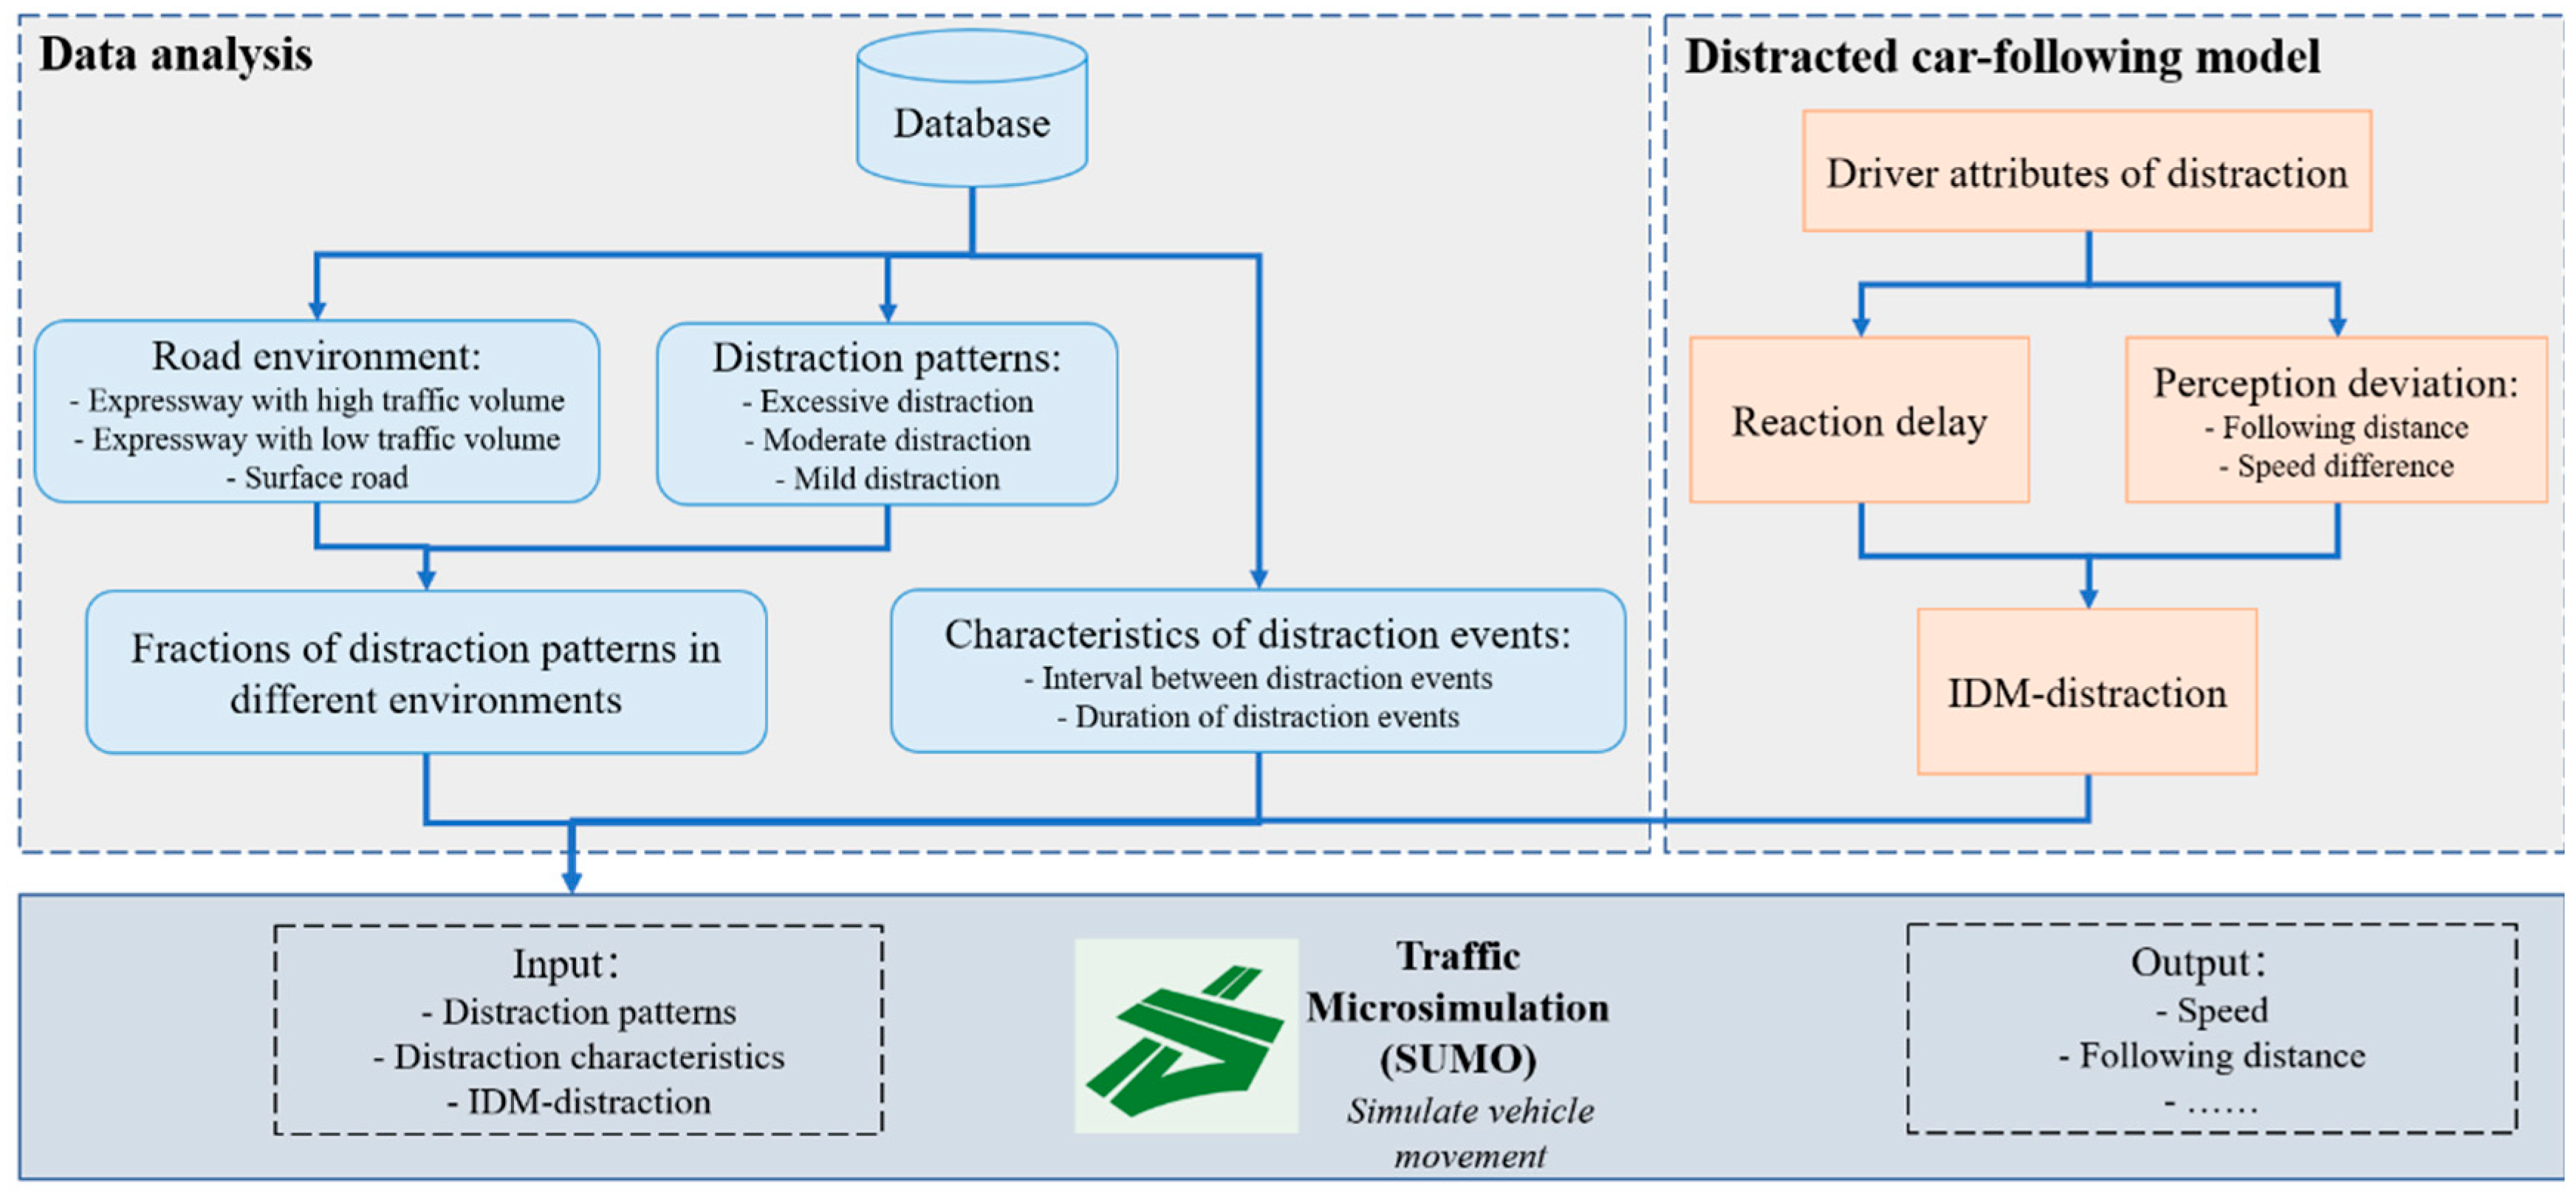
6. Micro-Simulation Implementation
6.1. Distracted Driving Simulation in Traffic Flow
6.2. Impact of Distraction on Traffic Flow
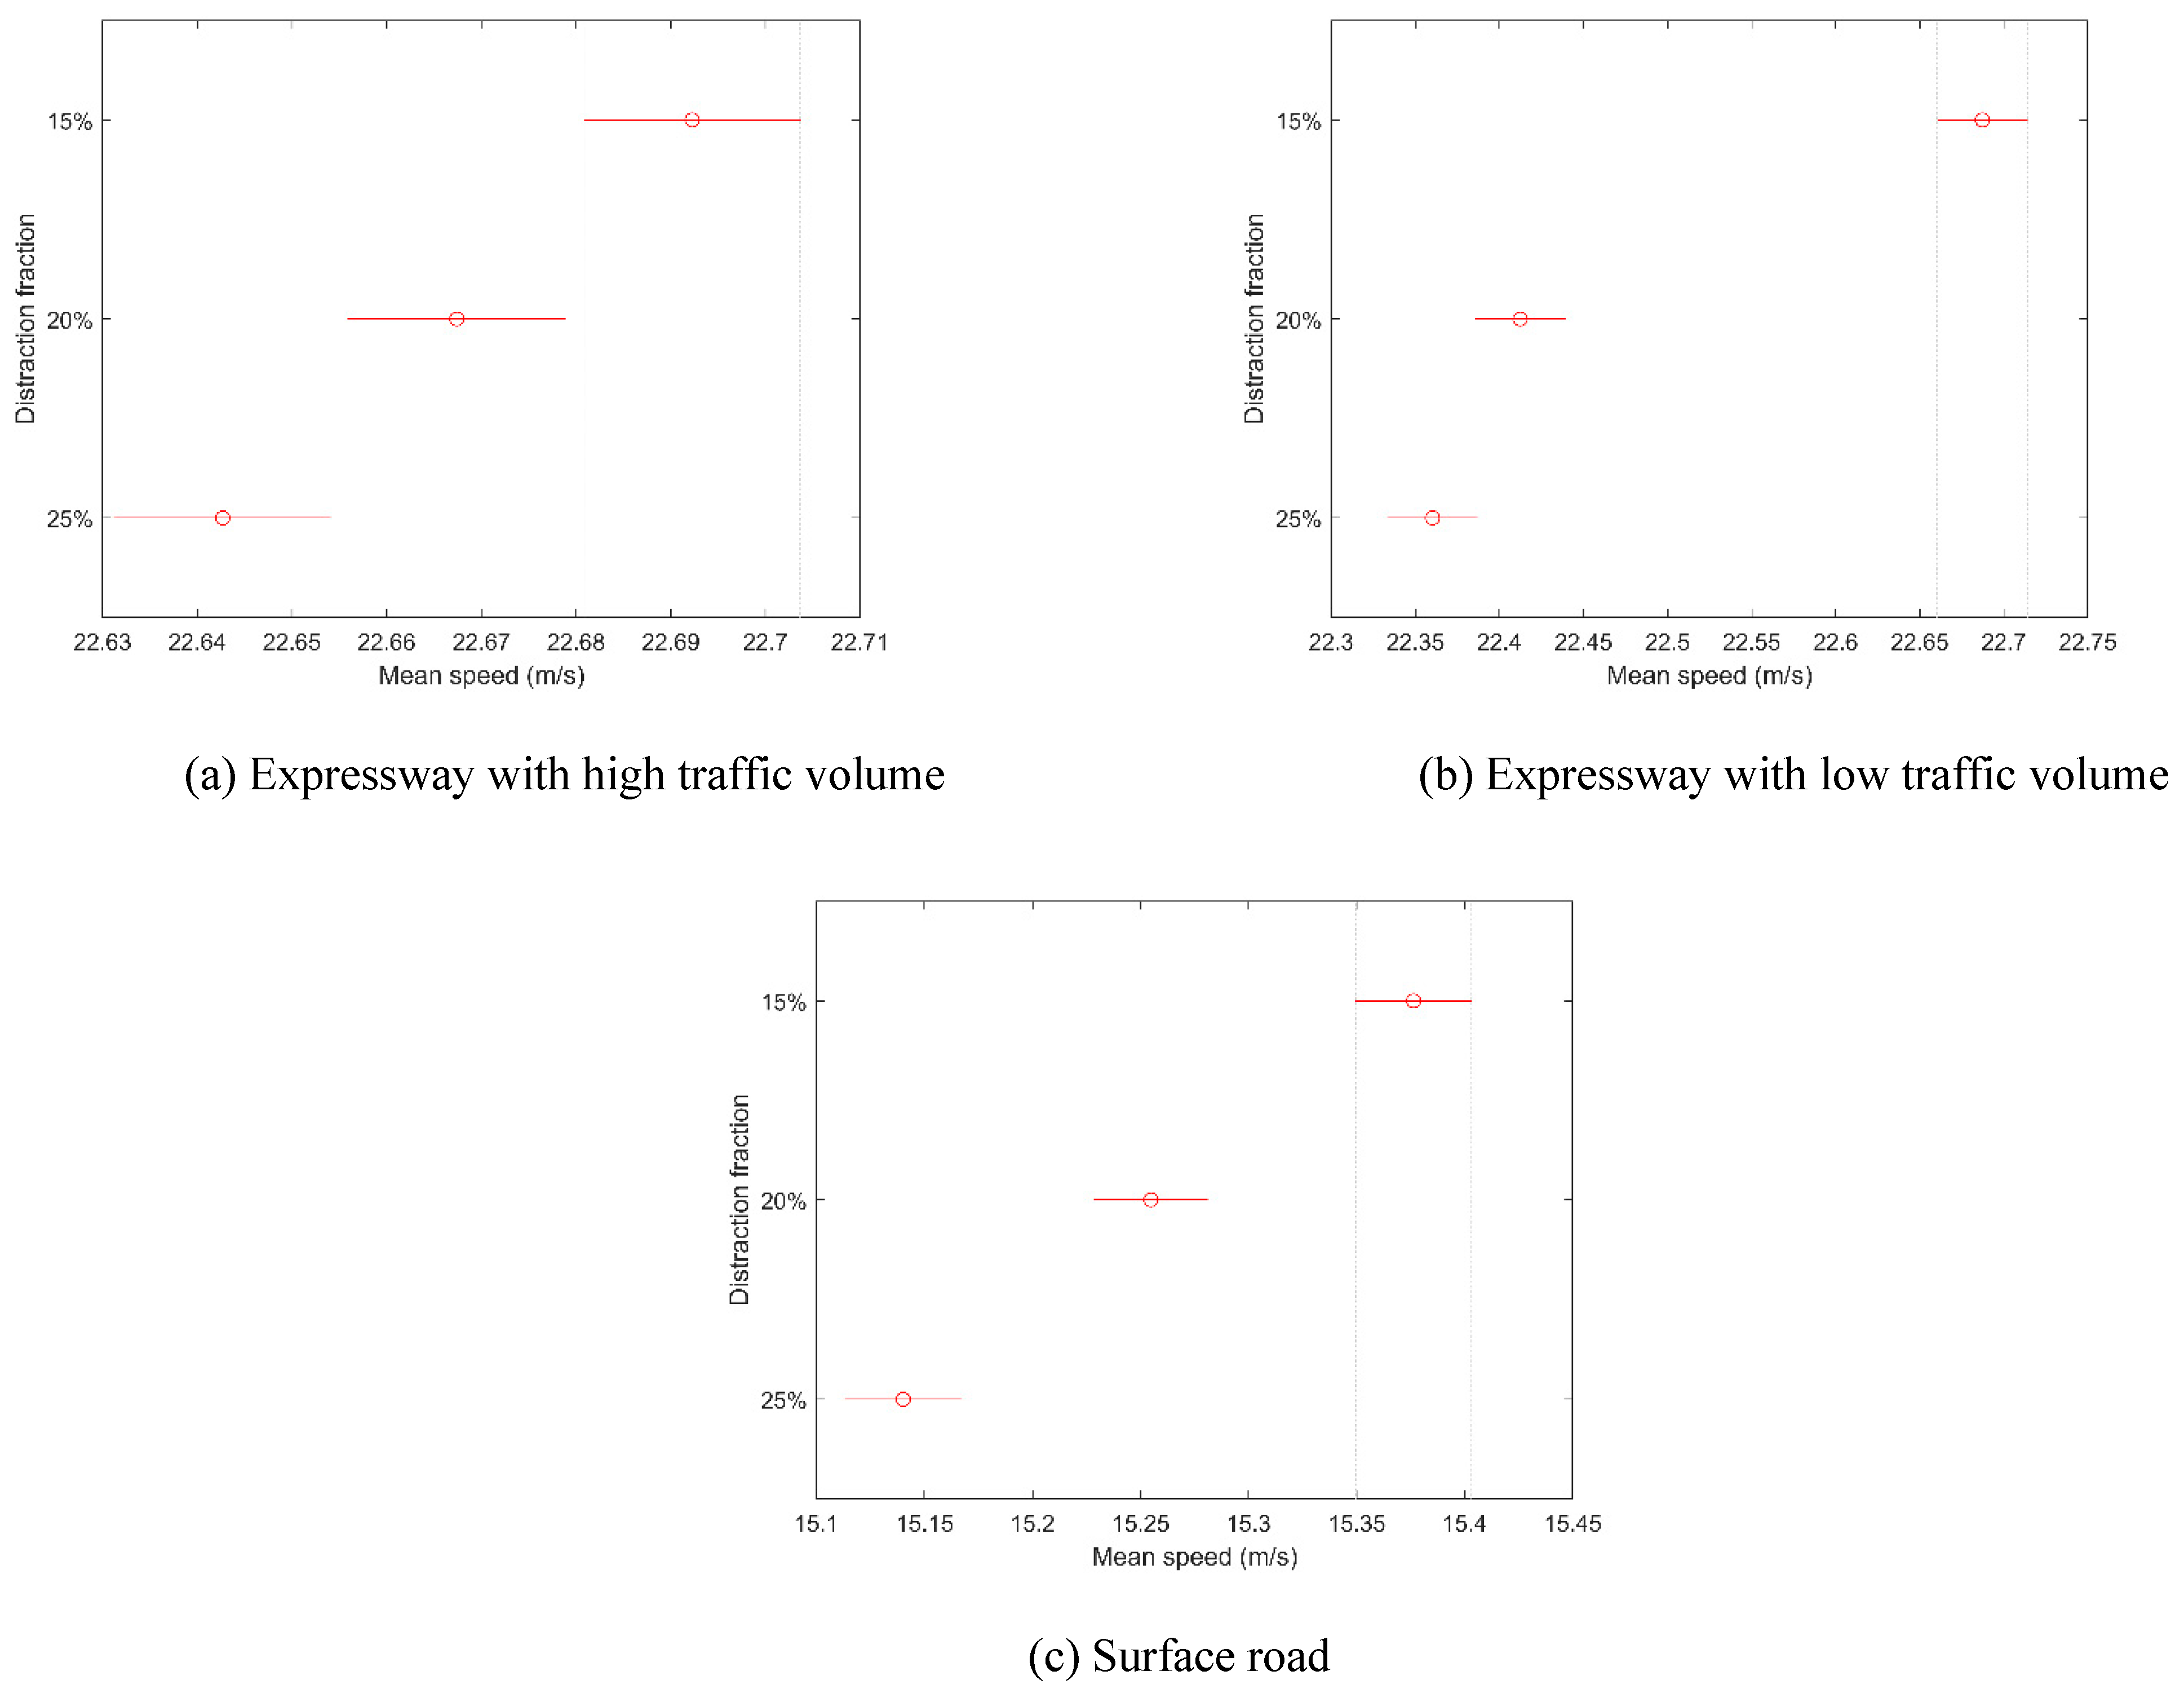
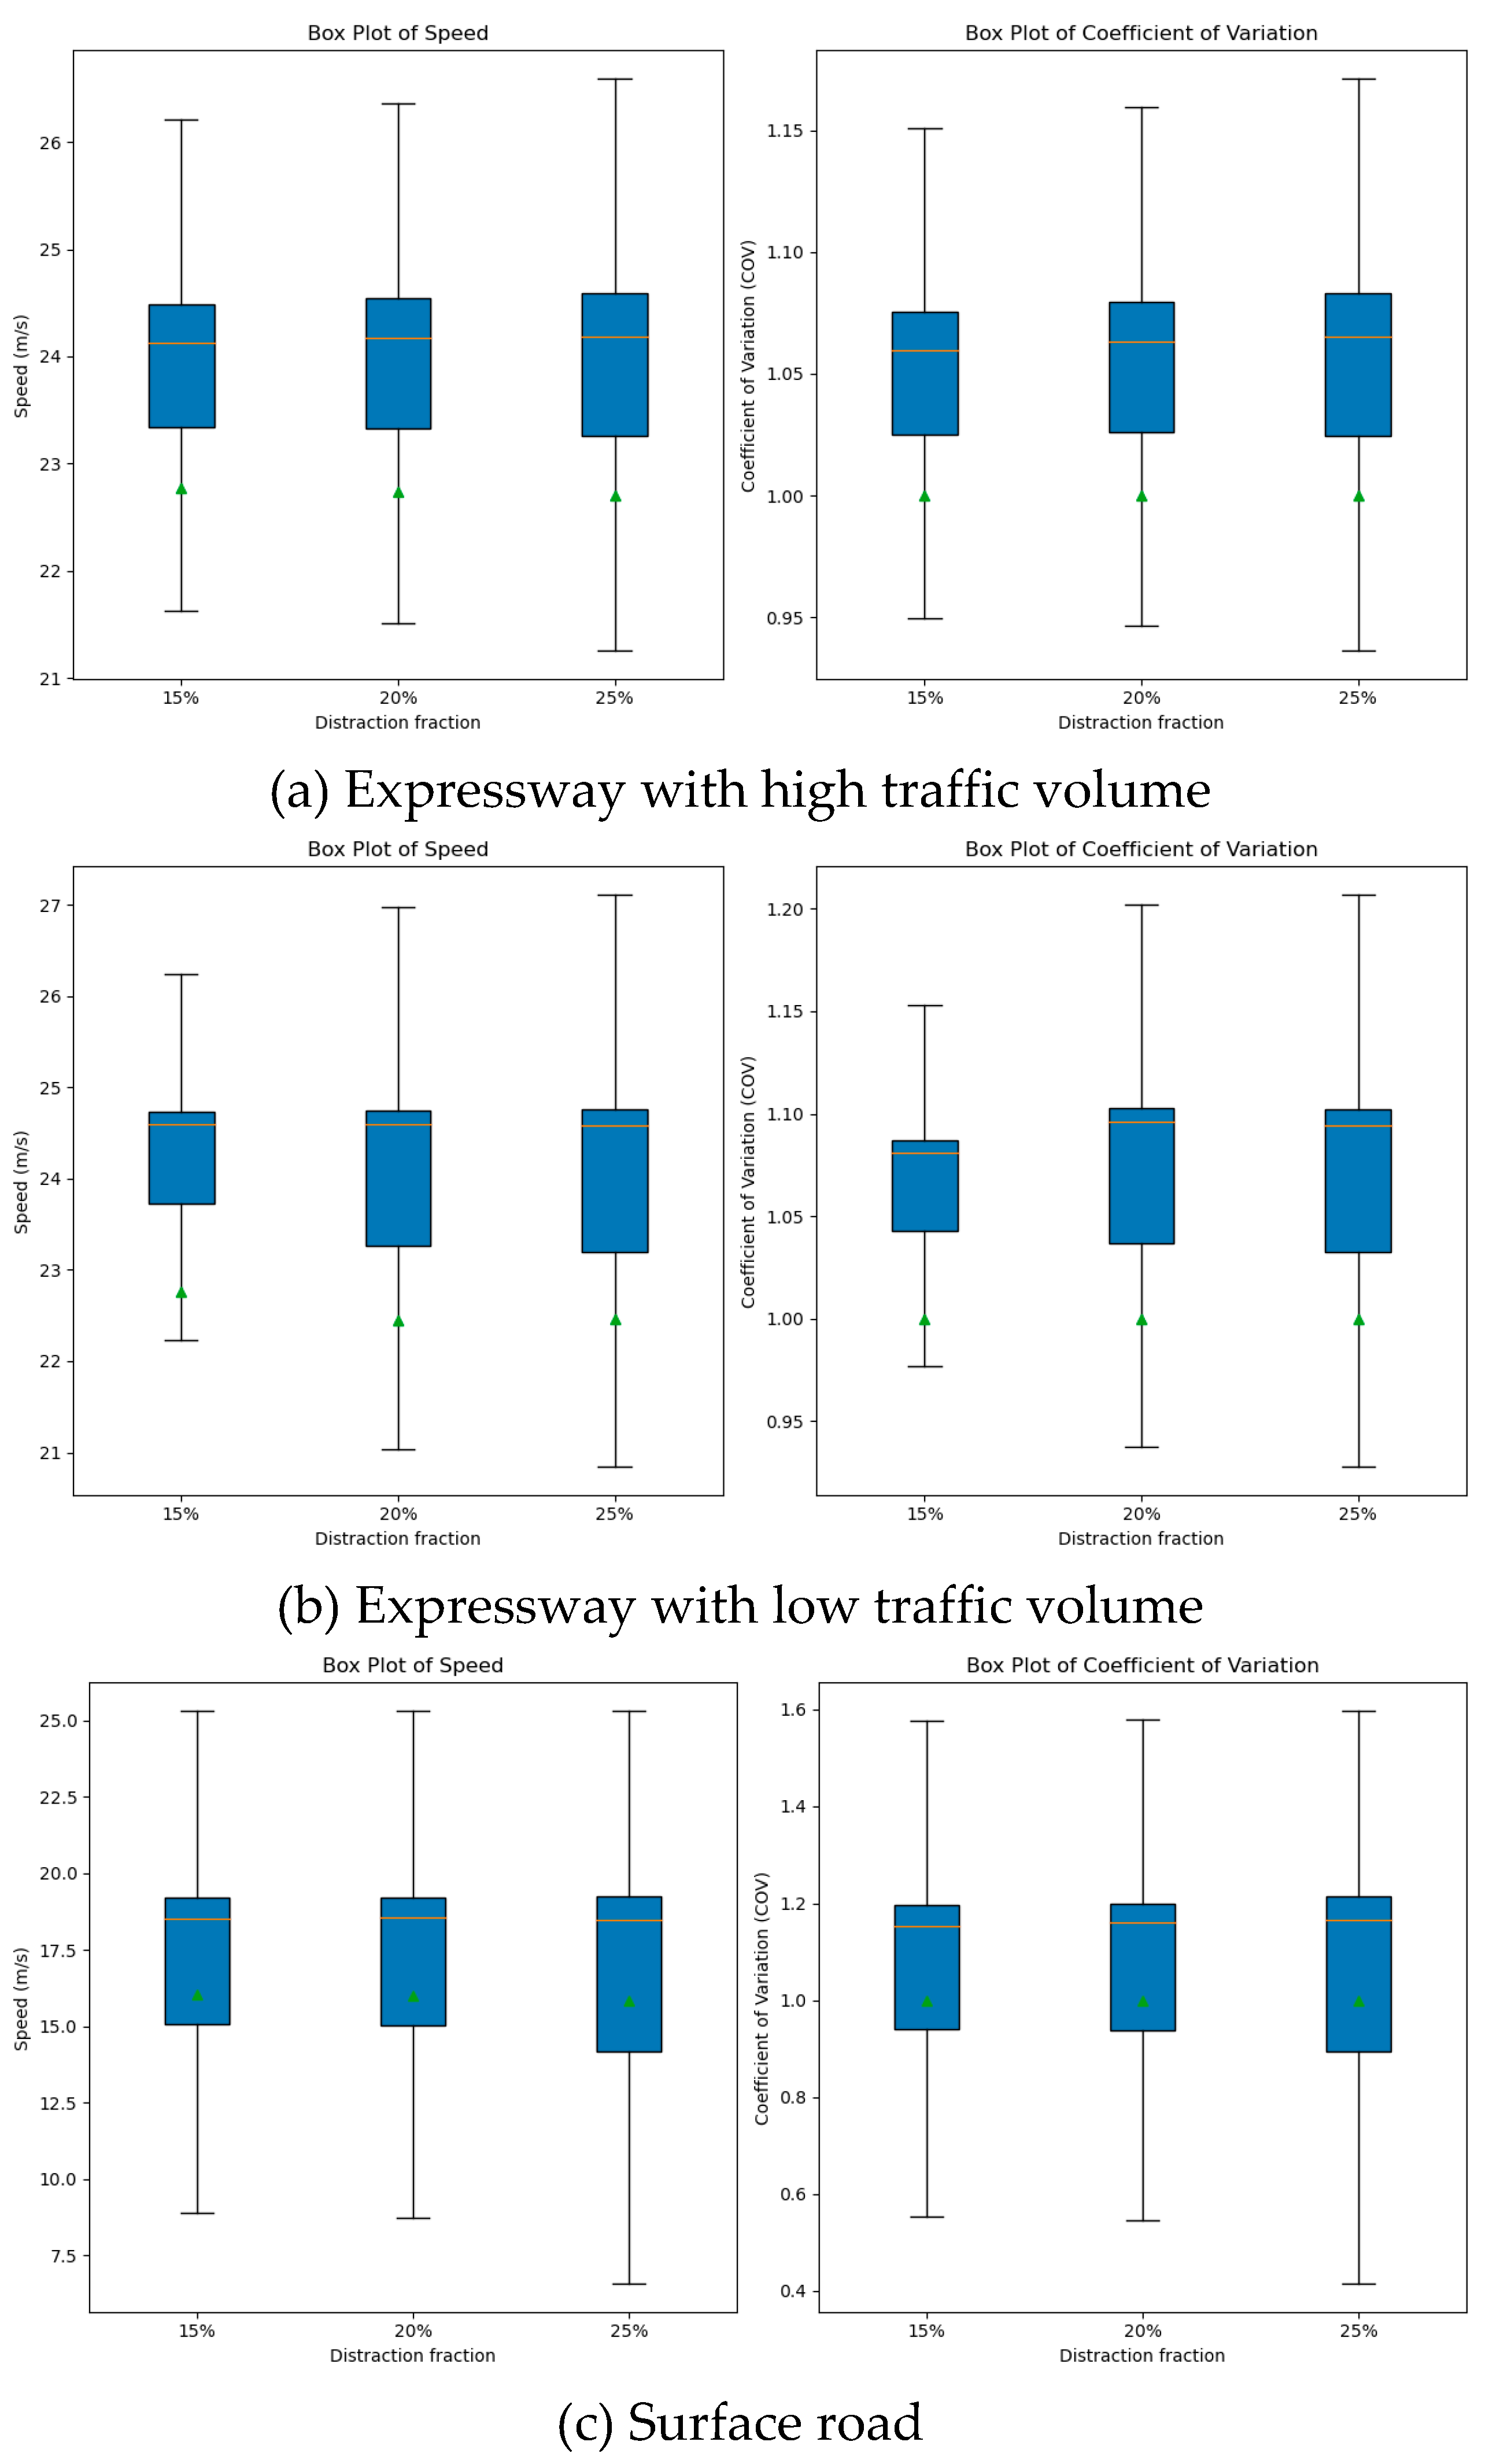
6.2.1. Impact of Distraction Fractions on Traffic Flow
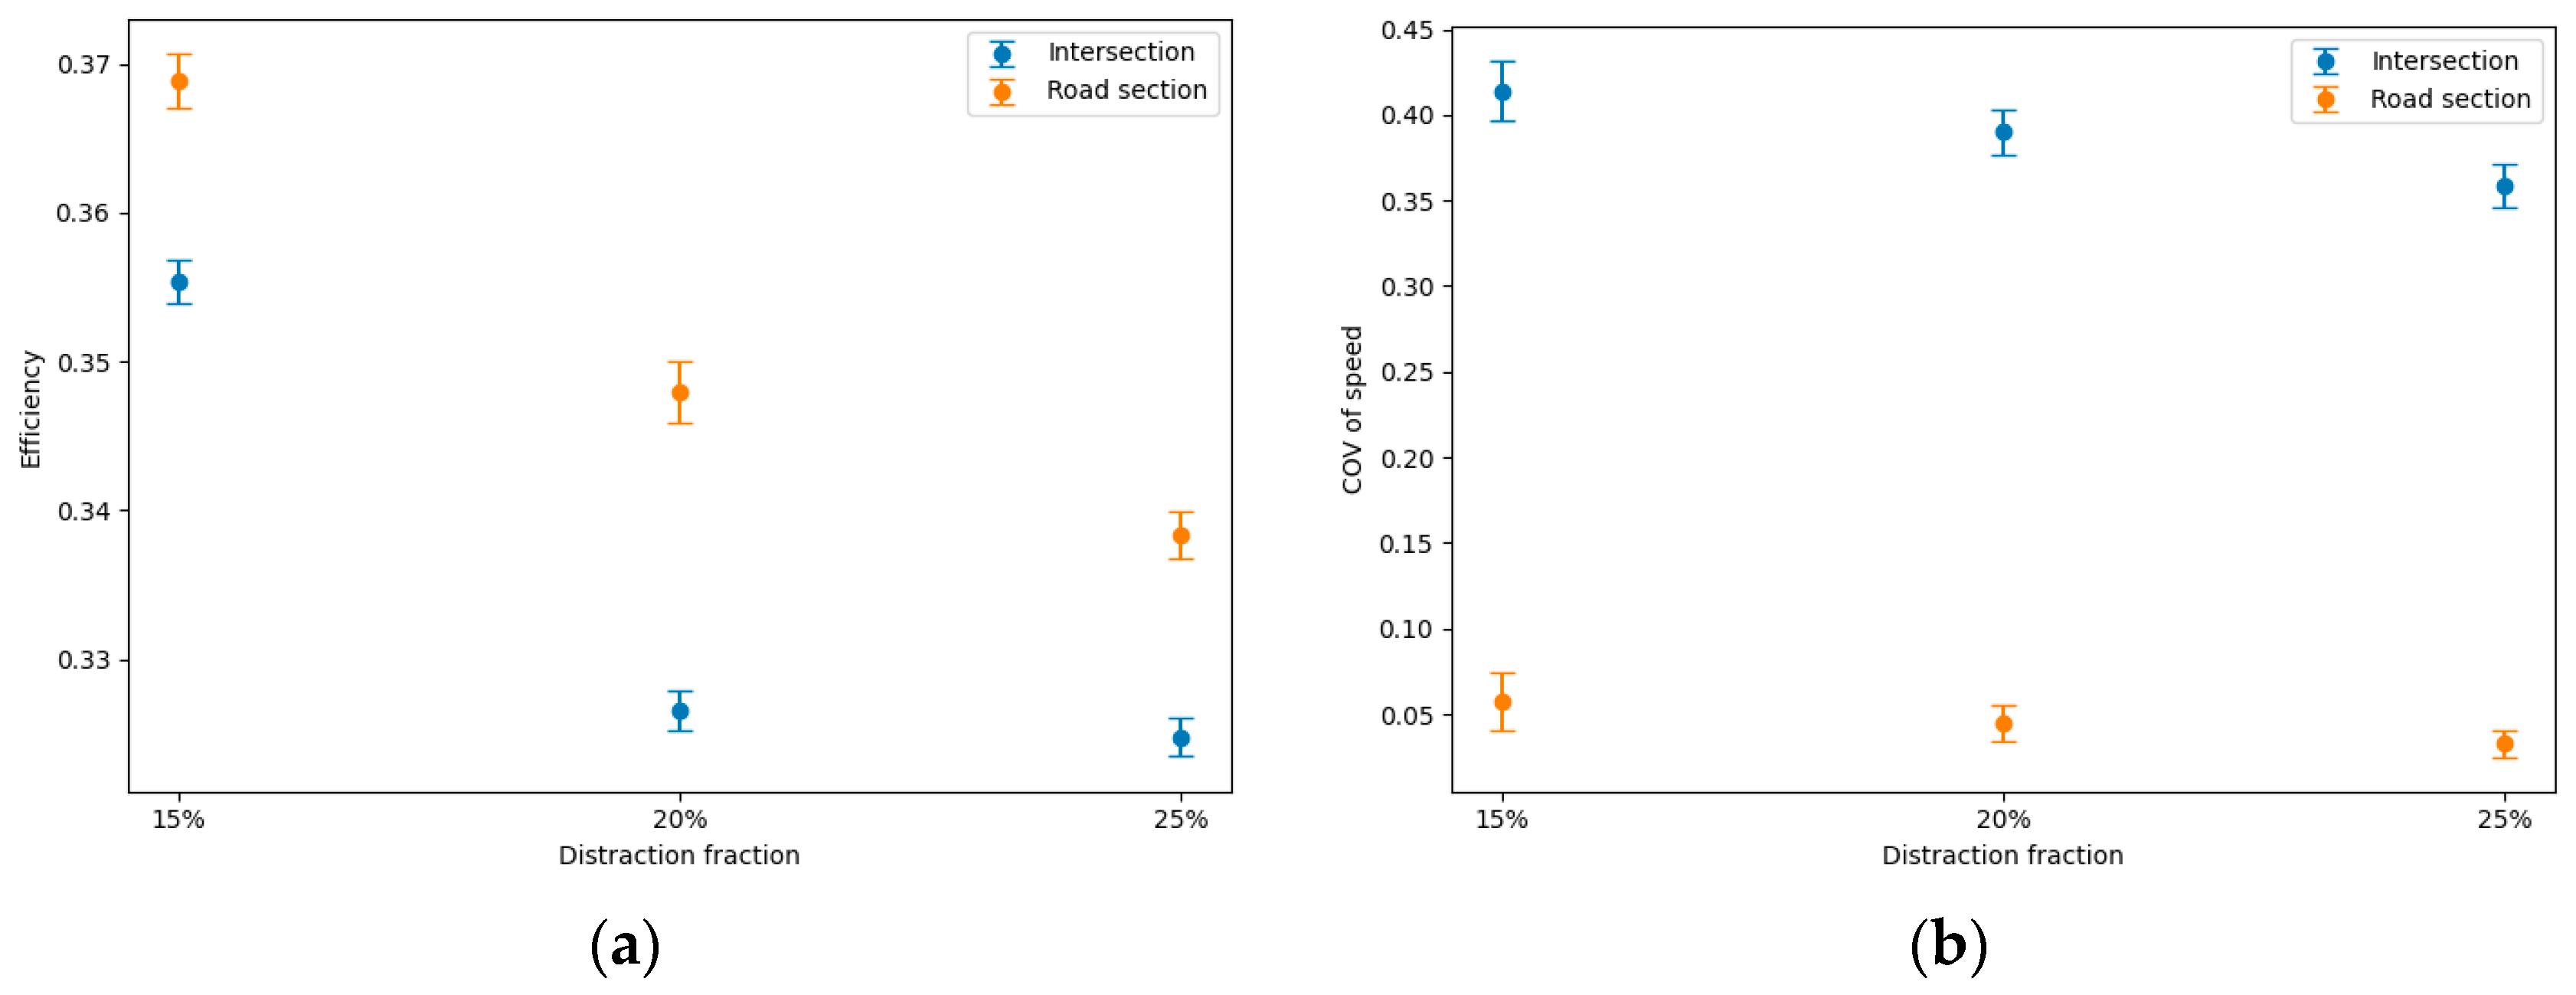
6.2.2. Impact of Distraction Fractions on Intersections and Segments on Surface Road
6.3. Pre-Crash Scenario Simulation
7. Discussion and Conclusions
Author Contributions
Funding
Institutional Review Board Statement
Informed Consent Statement
Data Availability Statement
Conflicts of Interest
References
- Sharma, A.; Zheng, Z.; Kim, J.; Bhaskar, A.; Haque, M.M. Assessing traffic disturbance, efficiency, and safety of the mixed traffic flow of connected vehicles and traditional vehicles by considering human factors. Transp. Res. Part C Emerg. Technol. 2021, 124, 102934. [Google Scholar] [CrossRef]
- Sharma, A.; Ali, Y.; Saifuzzaman, M.; Zheng, Z.; Haque, M.M. Human factors in modelling mixed traffic of traditional, connected, and automated vehicles. In Advances in Human Factors in Simulation and Modeling: Proceedings of the AHFE 2017 International Conference on Human Factors in Simulation and Modeling, Los Angeles, CA, USA, 17–21 July 2017; Springer: Berlin/Heidelberg, Germany, 2018; pp. 262–273. [Google Scholar]
- Bucsuházy, K.; Matuchová, E.; Zůvala, R.; Moravcová, P.; Kostíková, M.; Mikulec, R. Human factors contributing to the road traffic accident occurrence. Transp. Res. Procedia 2020, 45, 555–561. [Google Scholar] [CrossRef]
- Razzaghi, A.; Soori, H.; Kavousi, A.; Abadi, A.; Khosravi, A.K.; Alipour, A. Risk factors of deaths related to road traffic crashes in World Health Organization regions: A systematic review. Arch. Trauma Res. 2019, 8, 57–86. [Google Scholar]
- Chu, Y.; Liu, P. Human factor risks in driving automation crashes. In HCI in Mobility, Transport, and Automotive Systems, Proceedings of the 5th International Conference on Human-Computer Interaction, Copenhagen, Denmark, 23–28 July 2023; Springer: Berlin/Heidelberg, Germany, 2023. [Google Scholar]
- Paschalidis, E.; Choudhury, C.F.; Hess, S. Combining driving simulator and physiological sensor data in a latent variable model to incorporate the effect of stress in car-following behaviour. Anal. Methods Accid. Res. 2019, 22, 100089. [Google Scholar] [CrossRef]
- Wei, C.; Paschalidis, E.; Merat, N.; Solernou, A.; Hajiseyedjavadi, F.; Romano, R. Human-like decision making and motion control for smooth and natural car following. IEEE Trans. Intell. Veh. 2021, 8, 263–274. [Google Scholar] [CrossRef]
- Wang, J.; Zhang, Z.; Liu, F.; Lu, G. Investigating heterogeneous car-following behaviors of different vehicle types, traffic densities and road types. Transp. Res. Interdiscip. Perspect. 2021, 9, 100315. [Google Scholar] [CrossRef]
- Ding, Z.; Xu, D.; Tu, C.; Zhao, H.; Moze, M.; Aioun, F.; Guillemard, F. Driver identification through heterogeneity modeling in car-following sequences. IEEE Trans. Intell. Transp. Syst. 2022, 23, 17143–17156. [Google Scholar] [CrossRef]
- Huang, Y.; Yan, X.; Li, X.; Duan, K.; Rakotonirainy, A.; Gao, Z. Improving car-following model to capture unobserved driver heterogeneity and following distance features in fog condition. Transp. A Transp. Sci. 2024, 20, 2048917. [Google Scholar] [CrossRef]
- Huang, X.; Sun, J.; Sun, J. A car-following model considering asymmetric driving behavior based on long short-term memory neural networks. Transp. Res. Part C Emerg. Technol. 2018, 95, 346–362. [Google Scholar] [CrossRef]
- Fan, P.; Guo, J.; Zhao, H.; Wijnands, J.S.; Wang, Y. Car-following modeling incorporating driving memory based on autoencoder and long short-term memory neural networks. Sustainability 2019, 11, 6755. [Google Scholar] [CrossRef]
- Durrani, U.; Lee, C. Calibration and validation of psychophysical car-following model using driver’s action points and perception thresholds. J. Transp. Eng. Part A Syst. 2019, 145, 04019039. [Google Scholar] [CrossRef]
- Tan, H.; Lu, G.; Liu, M. Risk field model of driving and its application in modeling car-following behavior. IEEE Trans. Intell. Transp. Syst. 2021, 23, 11605–11620. [Google Scholar] [CrossRef]
- An, S.; Xu, L.; Chen, G.; Shi, Z. A new car-following model on complex road considering driver’s characteristics. Mod. Phys. Lett. B 2020, 34, 2050182. [Google Scholar] [CrossRef]
- Ma, L.; Qu, S. A sequence to sequence learning based car-following model for multi-step predictions considering reaction delay. Transp. Res. Part C Emerg. Technol. 2020, 120, 102785. [Google Scholar] [CrossRef]
- Sharma, D.G. Identifying Distracted and Inattentive Driving of Vehicles by Detecting Driver-Induced Steering Oscillations. Ph.D. Thesis, Doshisha University, Kyoto, Japan, 2018. [Google Scholar]
- Xu, J.; Lin, Y. Impact of distracted drivers on individual and group behavior of following vehicles: A networked multi-driver simulator study. Transp. Res. Rec. 2018, 2672, 45–54. [Google Scholar] [CrossRef]
- Stavrinos, D.; Jones, J.L.; Garner, A.A.; Griffin, R.; Franklin, C.A.; Ball, D.; Welburn, S.C.; Ball, K.K.; Sisiopiku, V.P.; Fine, P.R. Impact of distracted driving on safety and traffic flow. Accid. Anal. Prev. 2013, 61, 63–70. [Google Scholar] [CrossRef]
- Kantowitz, B.H.; Hanowski, R.J.; Tijerina, L. Simulator evaluation of heavy-vehicle driver workload: II: Complex secondary tasks. In Proceedings of the Human Factors and Ergonomics Society Annual Meeting, 1996; SAGE Publications: Los Angeles, CA, USA, 1996; pp. 877–881. [Google Scholar]
- Lansdown, T.C.; Brook-Carter, N.; Kersloot, T. Primary task disruption from multiple in-vehicle systems. ITS J.-Intell. Transp. Syst. J. 2002, 7, 151–168. [Google Scholar]
- Blanco, M.; Biever, W.J.; Gallagher, J.P.; Dingus, T.A. The impact of secondary task cognitive processing demand on driving performance. Accid. Anal. Prev. 2006, 38, 895–906. [Google Scholar] [CrossRef] [PubMed]
- Burns, P.C.; Trbovich, P.L.; McCurdie, T.; Harbluk, J.L. Measuring distraction: Task duration and the lane-change test (LCT). In Proceedings of the Human Factors and Ergonomics Society Annual Meeting; SAGE Publications: Los Angeles, CA, USA, 2005; pp. 1980–1983. [Google Scholar]
- Lansdown, T.C.; Brook-Carter, N.; Kersloot, T. Distraction from multiple in-vehicle secondary tasks: Vehicle performance and mental workload implications. Ergonomics 2004, 47, 91–104. [Google Scholar] [CrossRef]
- Ranney, T.A.; Harbluk, J.L.; Noy, Y.I. Effects of voice technology on test track driving performance: Implications for driver distraction. Hum. Factors 2005, 47, 439–454. [Google Scholar] [CrossRef]
- McEvoy, S.P.; Stevenson, M.R.; Woodward, M. The prevalence of, and factors associated with, serious crashes involving a distracting activity. Accid. Anal. Prev. 2007, 39, 475–482. [Google Scholar] [CrossRef]
- NHTSA. Traffic Safety Facts 2019. 2019. Available online: https://crashstats.nhtsa.dot.gov/Api/Public/ViewPublication/813141 (accessed on 23 June 2024).
- Van Lint, J.; Calvert, S.C. A generic multi-level framework for microscopic traffic simulation—Theory and an example case in modelling driver distraction. Transp. Res. Part B Methodol. 2018, 117, 63–86. [Google Scholar] [CrossRef]
- Saifuzzaman, M.; Zheng, Z.; Haque, M.M.; Washington, S. Revisiting the Task–Capability Interface model for incorporating human factors into car-following models. Transp. Res. Part B Methodol. 2015, 82, 1–19. [Google Scholar] [CrossRef]
- Przybyla, J.; Taylor, J.; Jupe, J.; Zhou, X. Estimating risk effects of driving distraction: A dynamic errorable car-following model. Transp. Res. Part C Emerg. Technol. 2015, 50, 117–129. [Google Scholar] [CrossRef]
- Zatmeh-Kanj, S.; Toledo, T. Car following and microscopic traffic simulation under distracted driving. Transp. Res. Rec. 2021, 2675, 643–656. [Google Scholar] [CrossRef]
- Kim, Y.; Choi, S.; Yeo, H. A study on development of a car-following model for accident simulation caused by driver distraction. J. Korean Soc. Transp. 2019, 37, 39–50. [Google Scholar] [CrossRef]
- Horberry, T.; Anderson, J.; Regan, M.A.; Triggs, T.J.; Brown, J. Driver distraction: The effects of concurrent in-vehicle tasks, road environment complexity and age on driving performance. Accid. Anal. Prev. 2006, 38, 185–191. [Google Scholar] [CrossRef] [PubMed]
- Ersal, T.; Fuller, H.J.; Tsimhoni, O.; Stein, J.L.; Fathy, H.K. Model-based analysis and classification of driver distraction under secondary tasks. IEEE Trans. Intell. Transp. Syst. 2010, 11, 692–701. [Google Scholar] [CrossRef]
- Gao, J.; Davis, G.A. Using naturalistic driving study data to investigate the impact of driver distraction on driver’s brake reaction time in freeway rear-end events in car-following situation. J. Saf. Res. 2017, 63, 195–204. [Google Scholar] [CrossRef]
- Choudhary, P.; Velaga, N.R. Modelling driver distraction effects due to mobile phone use on reaction time. Transp. Res. Part C Emerg. Technol. 2017, 77, 351–365. [Google Scholar] [CrossRef]
- Namian, M.; Albert, A.; Feng, J. Effect of distraction on hazard recognition and safety risk perception. J. Constr. Eng. Manag. 2018, 144, 04018008. [Google Scholar] [CrossRef]
- Ministerio del Interior. DGT (2009). Anuario Estadístico de Accidentes. 2009. Available online: https://www.dgt.es/export/sites/web-DGT/.galleries/downloads/dgt-en-cifras/publicaciones/Anuario-Estadistico-de-Accidentes/Anuario-estadistico-de-accidentes-2009.pdf (accessed on 23 June 2024).
- Varhelyi, A. Dynamic Speed Adaptation Based on Information Technology: A Theoretical Background. 1998. Available online: https://www.elibrary.ru/item.asp?id=6879405 (accessed on 23 June 2024).
- Lee, S.E.; Llaneras, E.; Klauer, S.; Sudweeks, J. Analyses of rear-end crashes and near-crashes in the 100-car naturalistic driving study to support rear-signaling countermeasure development. DOT HS 2007, 810, 1–125. [Google Scholar]
- Wang, X.; Zhang, X.; Guo, F.; Gu, Y.; Zhu, X. Effect of daily car-following behaviors on urban roadway rear-end crashes and near-crashes: A naturalistic driving study. Accid. Anal. Prev. 2022, 164, 106502. [Google Scholar] [CrossRef]
- Ervin, R.; Sayer, J.; LeBlanc, D.; Bogard, S.; Mefford, M.; Hagan, M.; Bareket, Z.; Winkler, C. Automotive Collision Avoidance System Field Operational Test Report: Methodology and Results; University of Michigan, Ann Arbor, Transportation Research Institute: Ann Arbor, MI, USA, 2005. [Google Scholar]
- Higgs, B.; Abbas, M. A two-step segmentation algorithm for behavioral clustering of naturalistic driving styles. In Proceedings of the 16th International IEEE Conference on Intelligent Transportation Systems (ITSC 2013), The Hague, The Netherlands, 6–9 October 2013; pp. 857–862. [Google Scholar]
- Zhang, Y.; Sun, J.; Wang, J. Detecting Driver Distractions Using a Deep Learning Approach and Multi-Source Naturalistic Driving Data. In Proceedings of the Transportation Research Board (TRB) 99th Annual Meeting, Washington, DC, USA, 12–16 January 2020. [Google Scholar]
- Yang, L.; Li, X.; Guan, W.; Zhang, H.M.; Fan, L. Effect of traffic density on drivers’ lane change and overtaking maneuvers in freeway situation—A driving simulator–based study. Traffic Inj. Prev. 2018, 19, 594–600. [Google Scholar] [CrossRef] [PubMed]
- Malik, M.; Nandal, R.; Dalal, S.; Maan, U.; Le, D.-N. An efficient driver behavioral pattern analysis based on fuzzy logical feature selection and classification in big data analysis. J. Intell. Fuzzy Syst. 2022, 43, 3283–3292. [Google Scholar] [CrossRef]
- Jin, S.; Wang, D.-H.; Huang, Z.-Y.; Tao, P.-F. Visual angle model for car-following theory. Phys. A Stat. Mech. Its Appl. 2011, 390, 1931–1940. [Google Scholar] [CrossRef]
- Amini, R.E.; Al Haddad, C.; Batabyal, D.; Gkena, I.; De Vos, B.; Cuenen, A.; Brijs, T.; Antoniou, C. Driver distraction and in-vehicle interventions: A driving simulator study on visual attention and driving performance. Accid. Anal. Prev. 2023, 191, 107195. [Google Scholar] [CrossRef] [PubMed]
- Cvahte Ojsteršek, T.; Topolšek, D. Influence of drivers’ visual and cognitive attention on their perception of changes in the traffic environment. Eur. Transp. Res. Rev. 2019, 11, 45. [Google Scholar] [CrossRef]
- Kim, S.; Park, S.; Jeong, H.; Sung, J. Study on response time measurement of distracted driving by virtual reality driving simulator. Int. J. Adv. Comput. Res. 2019, 9, 37–45. [Google Scholar] [CrossRef]
- Sullman, M.J. An observational study of driver distraction in England. Transp. Res. Part F Traffic Psychol. Behav. 2012, 15, 272–278. [Google Scholar] [CrossRef]
- Van der Horst, A. Time-to-Collision as a Measure for Critical Behaviour in Traffic. In Proceedings of the 2nd Workshop of International Cooperation on Theories and Concepts of Traffic Safety, Munich, Germany, November 1989; pp. 21–28. Available online: https://www.ictct.net/wp-content/uploads/02-Munich-1989/02-Proceedings.pdf#page=25 (accessed on 23 June 2024).
- Patten, C.J.; Kircher, A.; Östlund, J.; Nilsson, L. Using mobile telephones: Cognitive workload and attention resource allocation. Accid. Anal. Prev. 2004, 36, 341–350. [Google Scholar] [CrossRef] [PubMed]


| Possible Distributions | Distraction Event Interval | Distribution Diagram | |
|---|---|---|---|
| K–S Test Statistic | Chi-Squared Test Statistic | ||
| Normal distribution | <0.001 | <0.001 | 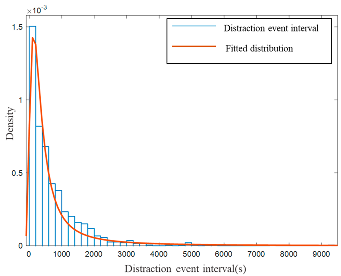 |
| Exponential distribution | 0.003 | 0.002 | |
| Extreme value distribution | <0.001 | <0.001 | |
| Burr distribution | <0.001 | 0.015 | |
| α-Stable distribution | 0.005 | 0.017 | |
| Gamma distribution | 0.542 | 0.220 | |
| Possible Distributions | Distraction Event Duration | Distribution Diagram | |
|---|---|---|---|
| K–S Test Statistic | Chi-Squared Test Statistic | ||
| Normal distribution | <0.001 | <0.001 | 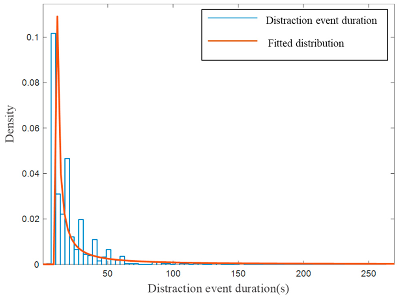 |
| Exponential distribution | 0.012 | 0.045 | |
| Extreme Value distribution | <0.001 | <0.001 | |
| Burr distribution | 0.443 | 0.086 | |
| a-Stable distribution | 0.005 | 0.017 | |
| Gamma distribution | 0.032 | 0.057 | |
| Parameter | Value |
|---|---|
| Population size | 300 |
| Number of generations | 1000 |
| Number of stall generations | 100 |
| Parameter | Description of Parameter | Boundary | Initial Searching Value |
|---|---|---|---|
| Maximum acceleration | [0.1, 5] | 2 | |
| Desired speed | [1, 50] | 30 | |
| Comfortable deceleration | [0.1, 5] | 2 | |
| Distance at standstill | [0.5, 10] | 5 | |
| Desired time headway | [0.1, 5] | 1.5 |
| Scenarios | Expressway with High Traffic Volume | Expressway with Low Traffic Volume | SURFACE ROAD | ||||||
|---|---|---|---|---|---|---|---|---|---|
| Pattern | Excessive | Moderate | Mild | Excessive | Moderate | Mild | Excessive | Moderate | Mild |
| 3.614 | 3.745 | 2.663 | 2.974 | 0.911 | 3.854 | 2.103 | 6.074 | 6.840 | |
| 0.671 | 0.437 | 1.223 | 0.814 | 0.875 | 0.621 | 0.886 | 0.140 | 1.032 | |
| 0.917 | 0.585 | 0.275 | 1.080 | 0.494 | 0.144 | 0.822 | 0.237 | 0.658 | |
| 0.906 | 1.828 | 0.716 | 5.000 | 0.840 | 2.966 | 1.311 | 2.000 | 0.973 | |
| 30.638 | 25.467 | 23.795 | 32.016 | 29.605 | 27.007 | 25.292 | 23.115 | 18.793 | |
| GMM μ = [4.09, 1.58], σ = [0.18, 1.13], α = [0.50, 0.50] | Normal μ = 2.77, σ = 1.53 | GMM μ = [4.62, 0.94], σ = [0.04, 0.48], α = [0.17, 0.83] | Normal μ = 2.46, σ = 1.53 | GMM μ = [1.68, 4.11], σ = [0.73, 0.33], α = [0.65, 0.35] | GMM μ = [3.93, 1.42], σ = [0.39, 0.71], α = [0.56, 0.44] | Normal μ = 3.28, σ = 1.66 | α_stable α = 0.40, β = –0.99, γ = 0.76, δ = 4.49 | Normal μ = 3.28, σ = 1.66 | |
| Normal μ = 0.11, σ = 13.53 | GMM μ = [8.33, −14.39], σ = [24.98, 22.18], α = [0.64, 0.36] | Normal μ = −1.43, σ = 10.57 | GMM μ = [15.32, −6.51], σ = [49.69, 22.57], α = [59.62, 12.11] | GMM μ = [8.10, −11.03], σ = [22.57, 49.69], α = [0.43, 0.57] | GMM μ = [12.72, −5.71], σ = [62.08, 18.17], α = [0.32, 0.68] | α_stable α = 1.41, β = −0.74, γ = 3.80, δ = 0.42 | α_stable α = 1.58, β = −0.67, γ = 4.21, δ = –2.09 | α_stable α = 2, β = 0.94, γ = 8.01, δ = −2.00 | |
| α_stable α = 0.40, β = 0.47, γ = 0.04, δ = −0.09 | GMM μ = [3.75, −3.68], σ = [0.08, 0.04], α = [0.64, 0.36] | α_stable α = 0.4, β = 0.96, γ = 1.01, δ = −3.14 | GMM μ = [3.17, −3.15], σ = [0.14, 0.20], α = [0.45, 0.55] | GMM μ = [−0.86, 0.32], σ = [0.01, 3.34], α = [0.63, 0.37] | GMM μ = [0.49, −5], σ = [2.27, 0.01], α = [0.95, 0.05] | GMM μ = [5, −2.16, 3.67], σ = [0, 4.67, 1.17], α = [0.26, 0.42, 0.32] | α_stable α = 2, β = −0.97, γ = 2.59, δ = 0.75 | α_stable α = 0.4, β = −0.38, γ = 0.46, δ = 2.22 | |
| Distraction Fractions | p-Value |
|---|---|
| 15% | <0.001 |
| 20% | <0.001 |
| 25% | <0.001 |
| Distraction Fraction | Dangerous (TTC < 1 s) | Serious Conflict (1 s ≤ TTC< 1.5 s) | Mild Conflict (1 s ≤ TTC < 2 s) | Safe (TTC ≥ 2 s) |
|---|---|---|---|---|
| 15% | 4.52% | 3.75% | 4.59% | 87.14% |
| 20% | 7.24% | 3.56% | 5.25% | 83.95% |
| 25% | 8.60% | 4.42% | 5.07% | 81.91% |
Disclaimer/Publisher’s Note: The statements, opinions and data contained in all publications are solely those of the individual author(s) and contributor(s) and not of MDPI and/or the editor(s). MDPI and/or the editor(s) disclaim responsibility for any injury to people or property resulting from any ideas, methods, instructions or products referred to in the content. |
© 2024 by the authors. Licensee MDPI, Basel, Switzerland. This article is an open access article distributed under the terms and conditions of the Creative Commons Attribution (CC BY) license (https://creativecommons.org/licenses/by/4.0/).
Share and Cite
Zhu, Y.; Yue, L. Simulation-Oriented Analysis and Modeling of Distracted Driving. Appl. Sci. 2024, 14, 5636. https://doi.org/10.3390/app14135636
Zhu Y, Yue L. Simulation-Oriented Analysis and Modeling of Distracted Driving. Applied Sciences. 2024; 14(13):5636. https://doi.org/10.3390/app14135636
Chicago/Turabian StyleZhu, Yixin, and Lishengsa Yue. 2024. "Simulation-Oriented Analysis and Modeling of Distracted Driving" Applied Sciences 14, no. 13: 5636. https://doi.org/10.3390/app14135636