Article

Evaluating Consolidation Centers of an Integrated Transportation Network under the Belt and Road Initiative

1
School of Economics and Management, China University of Geosciences, Wuhan 430074, China
2
School of Economics and Management, Changzhou Institute of Technology, Changzhou 213000, China
*
Author to whom correspondence should be addressed.
Appl. Sci. 2024, 14(13), 5637; https://doi.org/10.3390/app14135637
Submission received: 18 May 2024 / Revised: 19 June 2024 / Accepted: 26 June 2024 / Published: 27 June 2024
(This article belongs to the Special Issue Efficient and Innovative Goods Transportation and Logistics)

Abstract

:
Following the Belt and Road, the Air Silk Road has also been proposed. The coordinated development of multiple transportation modes, including air, land, and water, will create a strong transportation force in node cities. However, the current insufficient supply of cargo in various regions and the lack of integration among different transportation modes result in low transportation efficiency, which in turn affects the further advancement of the Belt and Road. To investigate these issues and attempt to find a solution, we selected 44 candidate cities from the prefecture-level cities in China as nodes based on relevant government policies, and constructed an integrated transportation network. For each node city, we first calculated the values of six classical indicators and then used the CRITIC to assign weights to each indicator. Subsequently, we employed the TOPSIS method combined with Grey Relational Analysis (GRA) to compute the comprehensive score for each node city. Based on the spatial layout and government policies under the BRI, eight cities, including Wuhan, Chongqing, Tianjin, Shanghai, Guangzhou, Lianyungang, Hefei, and Dalian, were finally recommended as the consolidation centers of the integrated transportation network. It is hoped that the results of this analysis can provide some insights for the government to outline and build the consolidation centers of the integrated transportation network composed of railway, air, highway, and water routes, which in turn can offer insights for elevating the Belt and Road Initiative (BRI) to a new level.

1. Introduction

The cooperative initiative of establishing the Belt and Road was proposed by Xi Jinping, President of the People’s Republic of China, in Kazakhstan and Indonesia in 2013, respectively, which aims to establish the world’s biggest economic cooperation platform covering Asia, Europe, and sub-regions of Africa and enhance the interconnectivity among countries. Currently, China Railway Express (CR Express), with active participation from local governments, has connected 108 Chinese cities and reached 208 cities in 25 European countries through ports such as Manzhouli, Erenhot, and Alashankou [1]. Meanwhile, as of September 2022, there are 94 routes along Maritime Silk Road, connecting 108 ports in 31 countries [2]. The in-depth development of the transportation network has greatly shortened the time and space distance between China and Europe. Currently, the Chinese local governments are faced with various issues in the process of promoting the in-depth development of the BRI, such as uneven supplies of goods, disordered competition, and inefficient coordination mechanism [3,4]. On the other hand, the Chinese domestic transportation network is a relatively independent development of various transportation modes, which lacks global optimization and integration of transportation resources. To address the above-mentioned issues, constructing consolidation centers through top-level government design is a promising solution to provide rational cargo allocation. This is because the rational location and layout of the consolidation centers can reduce logistics costs through economies of scale, as well as maximize service quality and transportation efficiency within multimodal networks [5,6].
Therefore, the issue of transportation hubs along the Belt and Road has been discussed by many scholars from different perspectives in the past few years. Zhang et al. applied the TOPSIS to sort out the logistics nodes and select the optimal nodes of CR Express under the BRI [7]. Li et al. applied contest theory to validate the number of multimodal transportation network hubs based on local government subsidies under the BRI [8]. Wan et al. used the TOPSIS to identify essential ports in the maritime silk network when encountering severe disasters [9]. By analyzing the quantitative and qualitative factors influencing the location of global logistics centers in the existing literature, Lee et al. proposed the eight locations of global LDCs [10]. Li et al. considered the government policies and operational experience from the BRI, and used the improved entropy TOPSIS to select imported grain distribution centers across railway, highway, and water transportation networks [11]. The TOPSIS was employed by Aljohani et al. to conduct an assessment and ranking of 20 candidate consolidation centers within the city of inner Melbourne, Australia, based on 11 decision criteria, and found that the most suitable locations for the consolidation centers are in economically viable industrial areas [12]. Muerza et al. used ANP technology to evaluate and rank five locations in Europe for establishing international consolidation centers based on 25 standards to support the choices of decision makers [13].
Furthermore, during a meeting with the leader of Luxembourg in June 2017, President Xi Jinping first proposed to build the Air Silk Road between Zhengzhou and Luxembourg. With the gradual integration of the civil aviation industry into the BRI, the Chinese government released an Implementation Plan of the Air Silk Road in May 2022, aiming to promote its in-depth development [14]. Meanwhile, scholars have begun to address the issues of the air transportation network. Zhou et al. employed local centrality and global centrality to research the hub problem of the integration of rail ports, airports, and maritime ports in the Belt and Road countries [15]. Derudder et al. applied the centrality indicator to study the ranking of connectivity of three-layer transportation network node cities for air and highway routes along the Belt and Road [16].
However, the above-mentioned scholars are only concerned about a single mode or a combination of two or three transport modes, and there is less research on the integration of railway, air, highway, and water transportation. Additionally, the whole layout of the integrated transportation network has not been formed at the national level, which cannot effectively fit in with the development of the BRI, making it difficult to effectively achieve the orderly linking up of the multi-tiered integrated transportation network consisting of water, land, and air transportation. Hence, this paper addresses the ranking and selection of node cities as the candidate consolidation centers of an integrated transportation network composed of highway, railway, air, and water routes under the BRI to provide a reference for the government in building the consolidation centers.
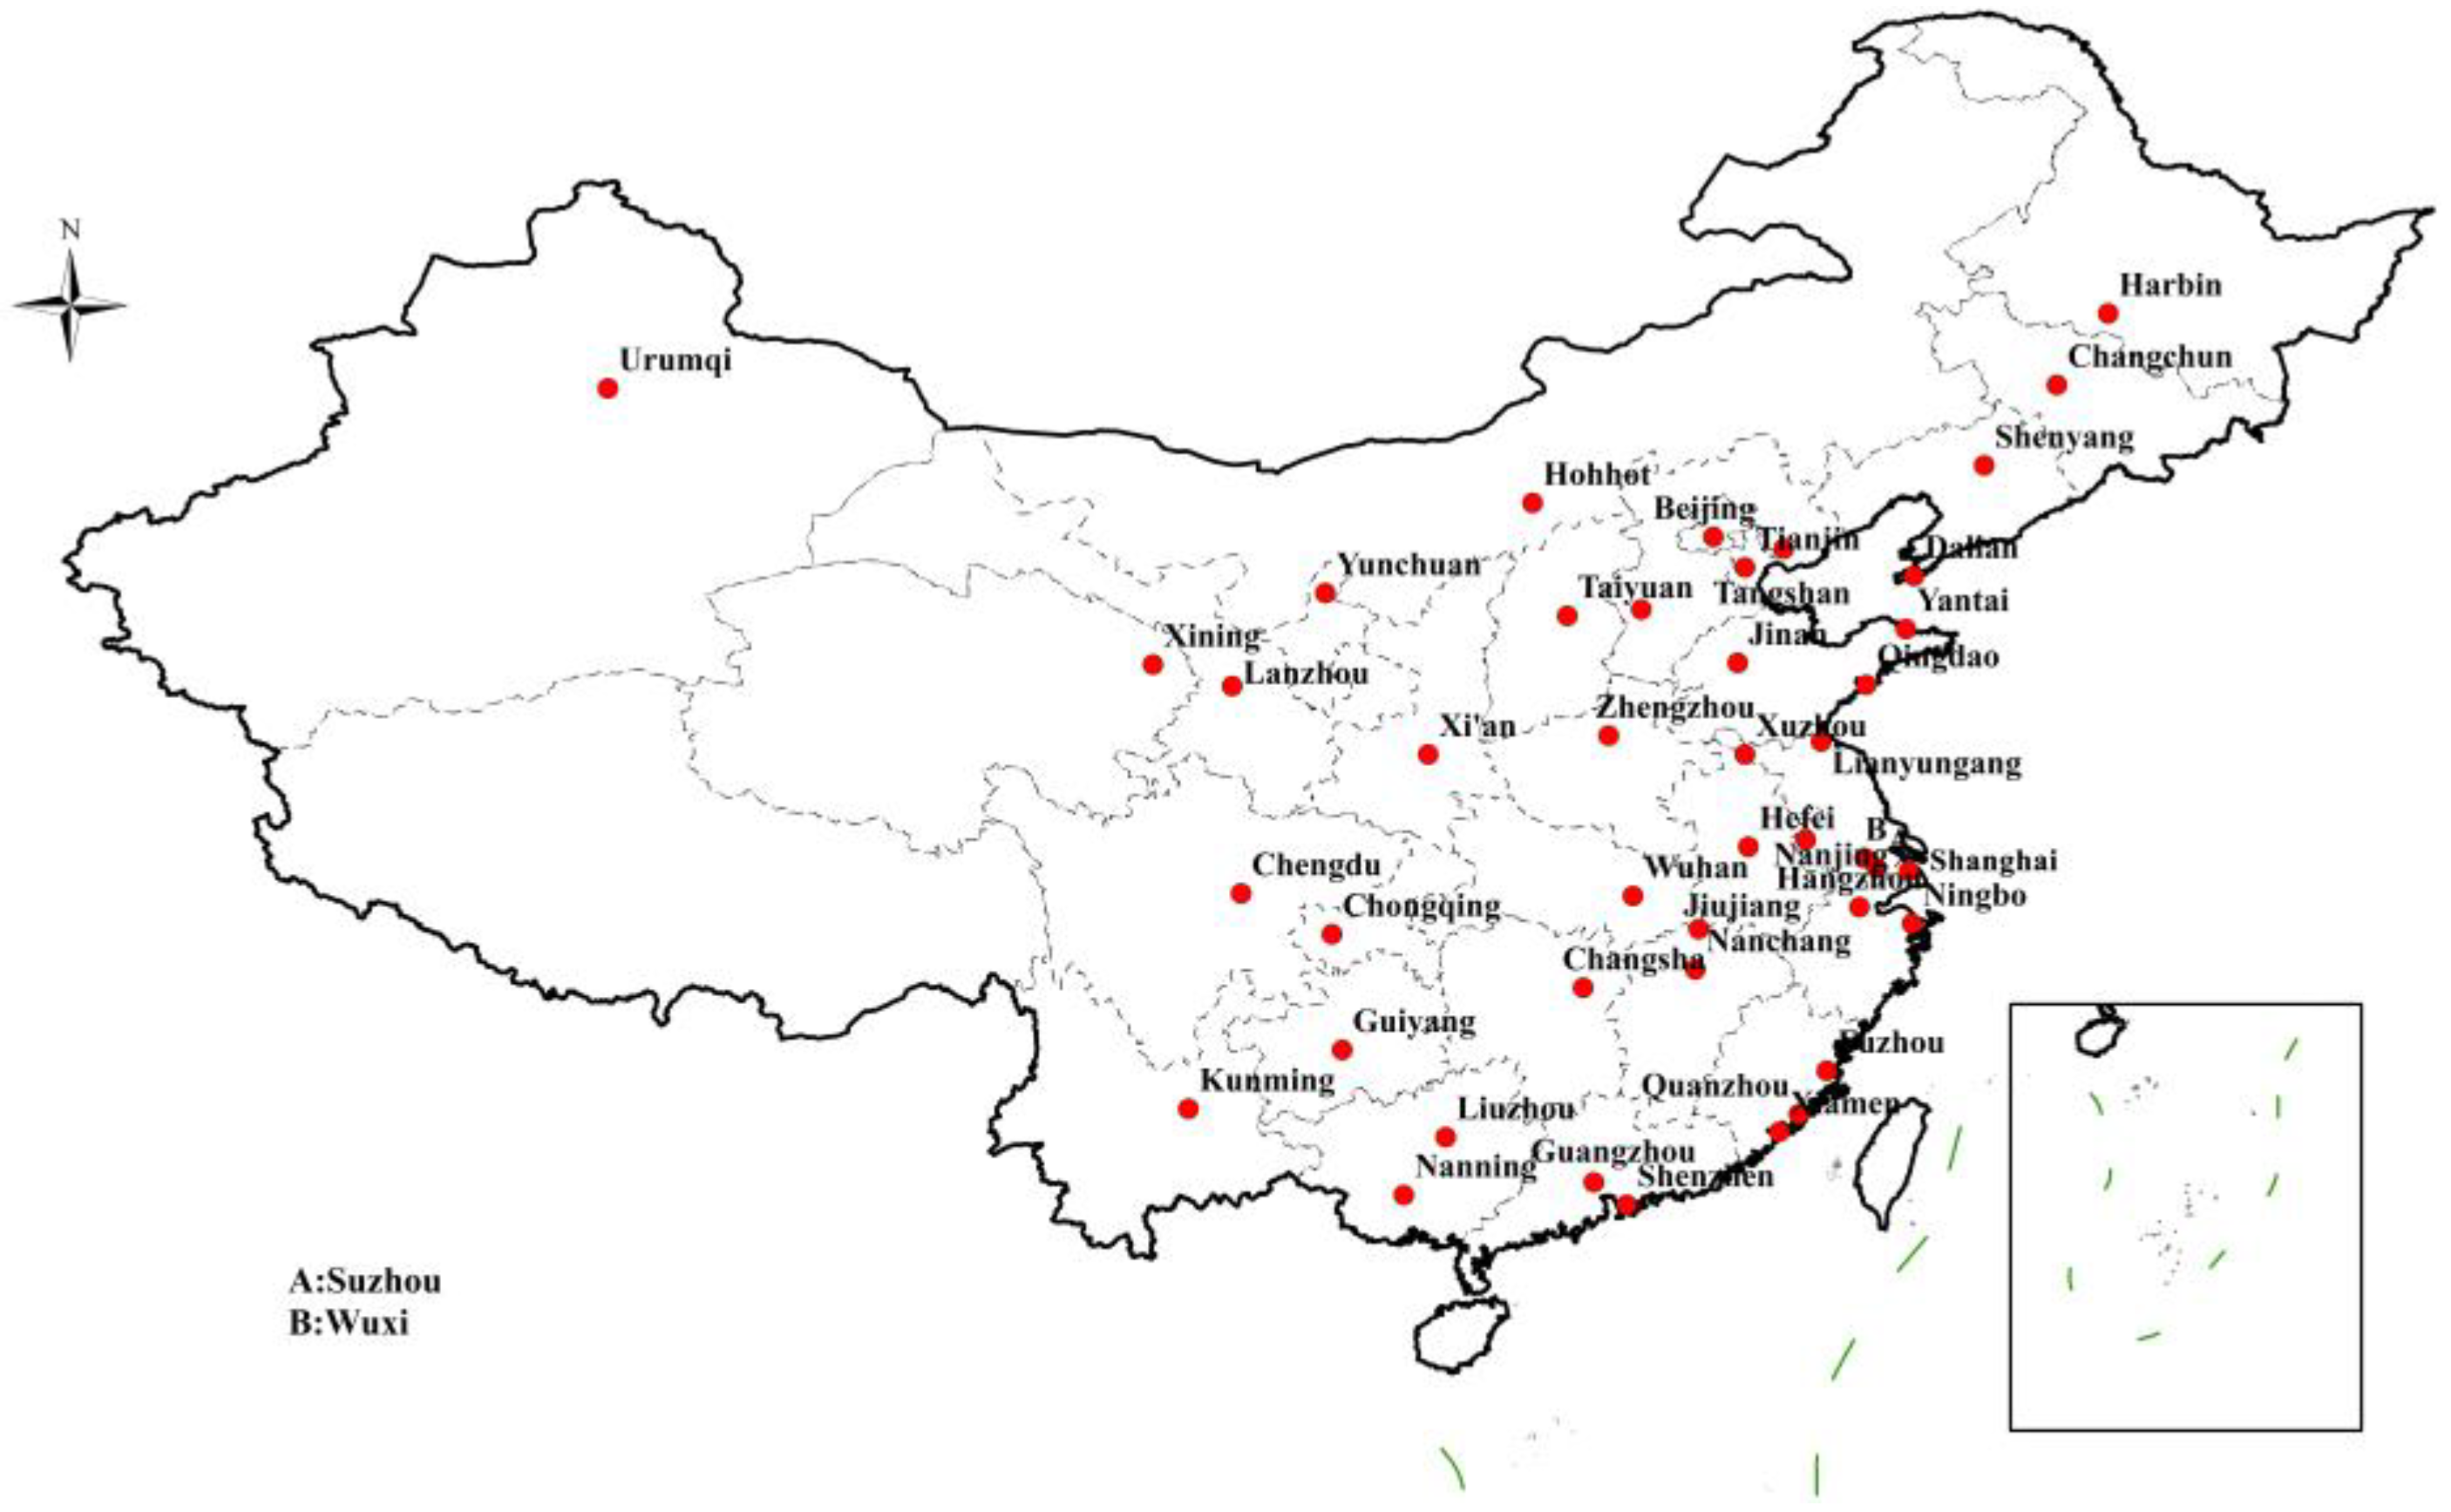
A total of 44 Chinese cities were selected as the candidate consolidation centers under the BRI. Then, the integrated transportation network was formed based on the links of transportation modes among these 44 Chinese cities. It should be noted that the evaluation of consolidation centers in this study was based on the consideration of the above issues of cargo transportation at the national level of China under the BRI. Consequently, each city was viewed as a node in the network without delving into the specific logistic activities within it.
Complex network theory has been widely employed in transportation network research in recent years [17,18]; extensive study has been implemented on single-mode transportation networks, including railway networks [11], subway networks [19,20], bus networks [21,22], water networks [23,24], road networks [25], and air networks [26]. Currently, complex network theory is employed by some scholars to study the single-mode transportation networks under the BRI. Zhao et al. used the TOPSIS method combined with complex network theory to select 10 cities from 27 candidate cities as consolidation centers of CR Express [27]. Sun et al. applied the TOPSIS method to select 10 cities from 48 candidate cities of CR Express as consolidation centers using some qualitative indicators [28]. Feng et al. applied the improved TOPSIS method to select the key node of CR Express through multiple centrality evaluation indicators [29]. The entropy weight TOPSIS method was used by Yin et al. [30] to choose eight inner cities as trans-shipment consolidation centers from the regional integration standpoint. Additionally, there are some studies on the impact of consolidation centers. Van Heeswijk et al. applied agent-based data simulation to verify that the urban consolidation center in Copenhagen can reduce truck mileage by about 65% and emissions by about 70% [31]. On the one hand, there is a lack of studies on the integration of various modes such as air, water, railway, and highway transportation in the aforementioned research. On the other hand, the multi-attribute indicators of transportation networks are rarely considered, which makes it difficult to comprehensively evaluate consolidation centers. Consequently, this study employed complex network theory to integrate various transportation modes—including air, water, highway, and railway—with the aim of constructing an integrated transportation network aligned with the BRI. Using this network, we evaluated the comprehensive scores of candidate node cities as potential consolidation centers.
The TOPSIS is a traditional multi-attribute decision-making approach. However, the TOPSIS cannot accurately reflect the similarity of data curves, making it difficult to accurately assess the optimal results. In this study, the TOPSIS combined with Grey Relational Analysis (GRA) was applied, which not only retains the objective advantage of the TOPSIS method but also takes the advantages of the similarity and dynamicity of GRA to make up for the shortcoming of the TOPSIS method. Finally, the ranking results of the candidate consolidation centers are obtained based on the combination of the TOPSIS and GRA.
This paper makes the following contributions. Firstly, the consolidation centers of an integrated transportation network, which includes highway, railway, air, and water routes, is considered as the research target under the BRI to attempt to solve the high logistics costs resulting from disorderly competition, poor efficiency, and so on among the different transportation modes. Secondly, considering the links among the candidate consolidation centers, the TOPSIS and GRA are combined to comprehensively evaluate the ranking of candidate consolidation centers within the integrated transportation network constructed based on complex network theory. Thirdly, the local and global evaluation indicators were integrated to evaluate the candidate consolidation centers of the integrated transportation network.
The remaining sections are as follows: Section 2 introduces the criteria and the steps for selecting node cities. 
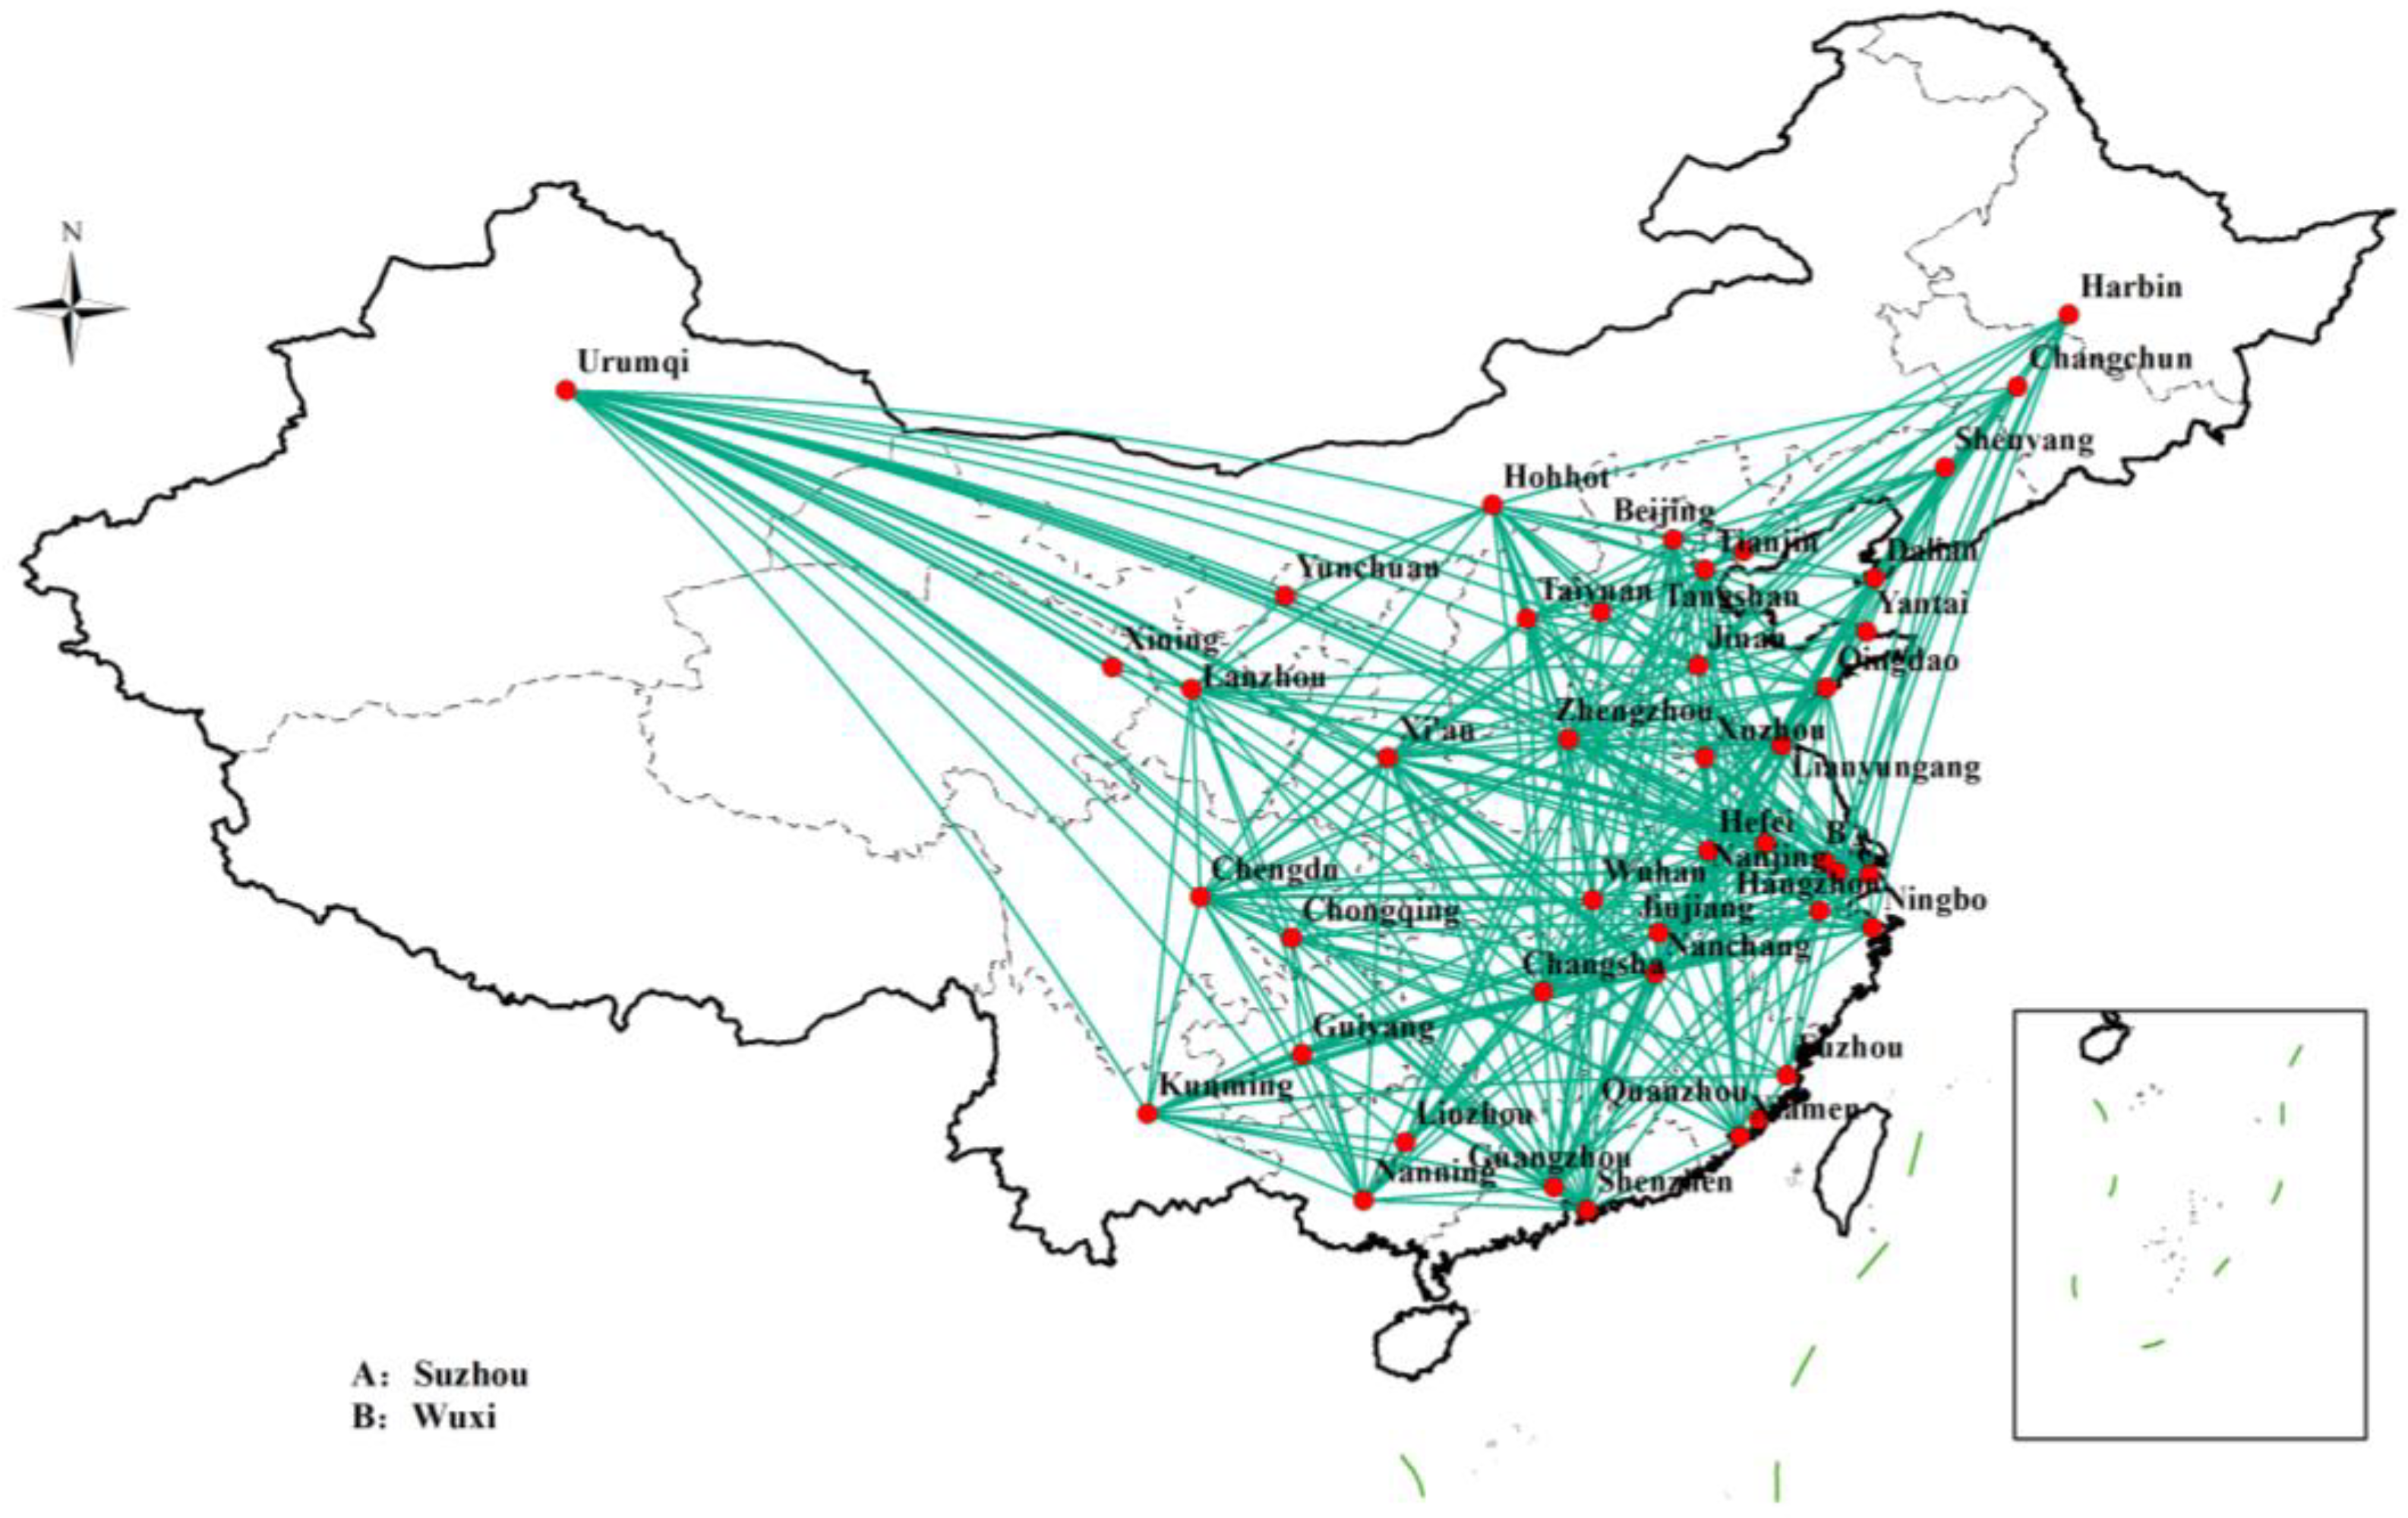
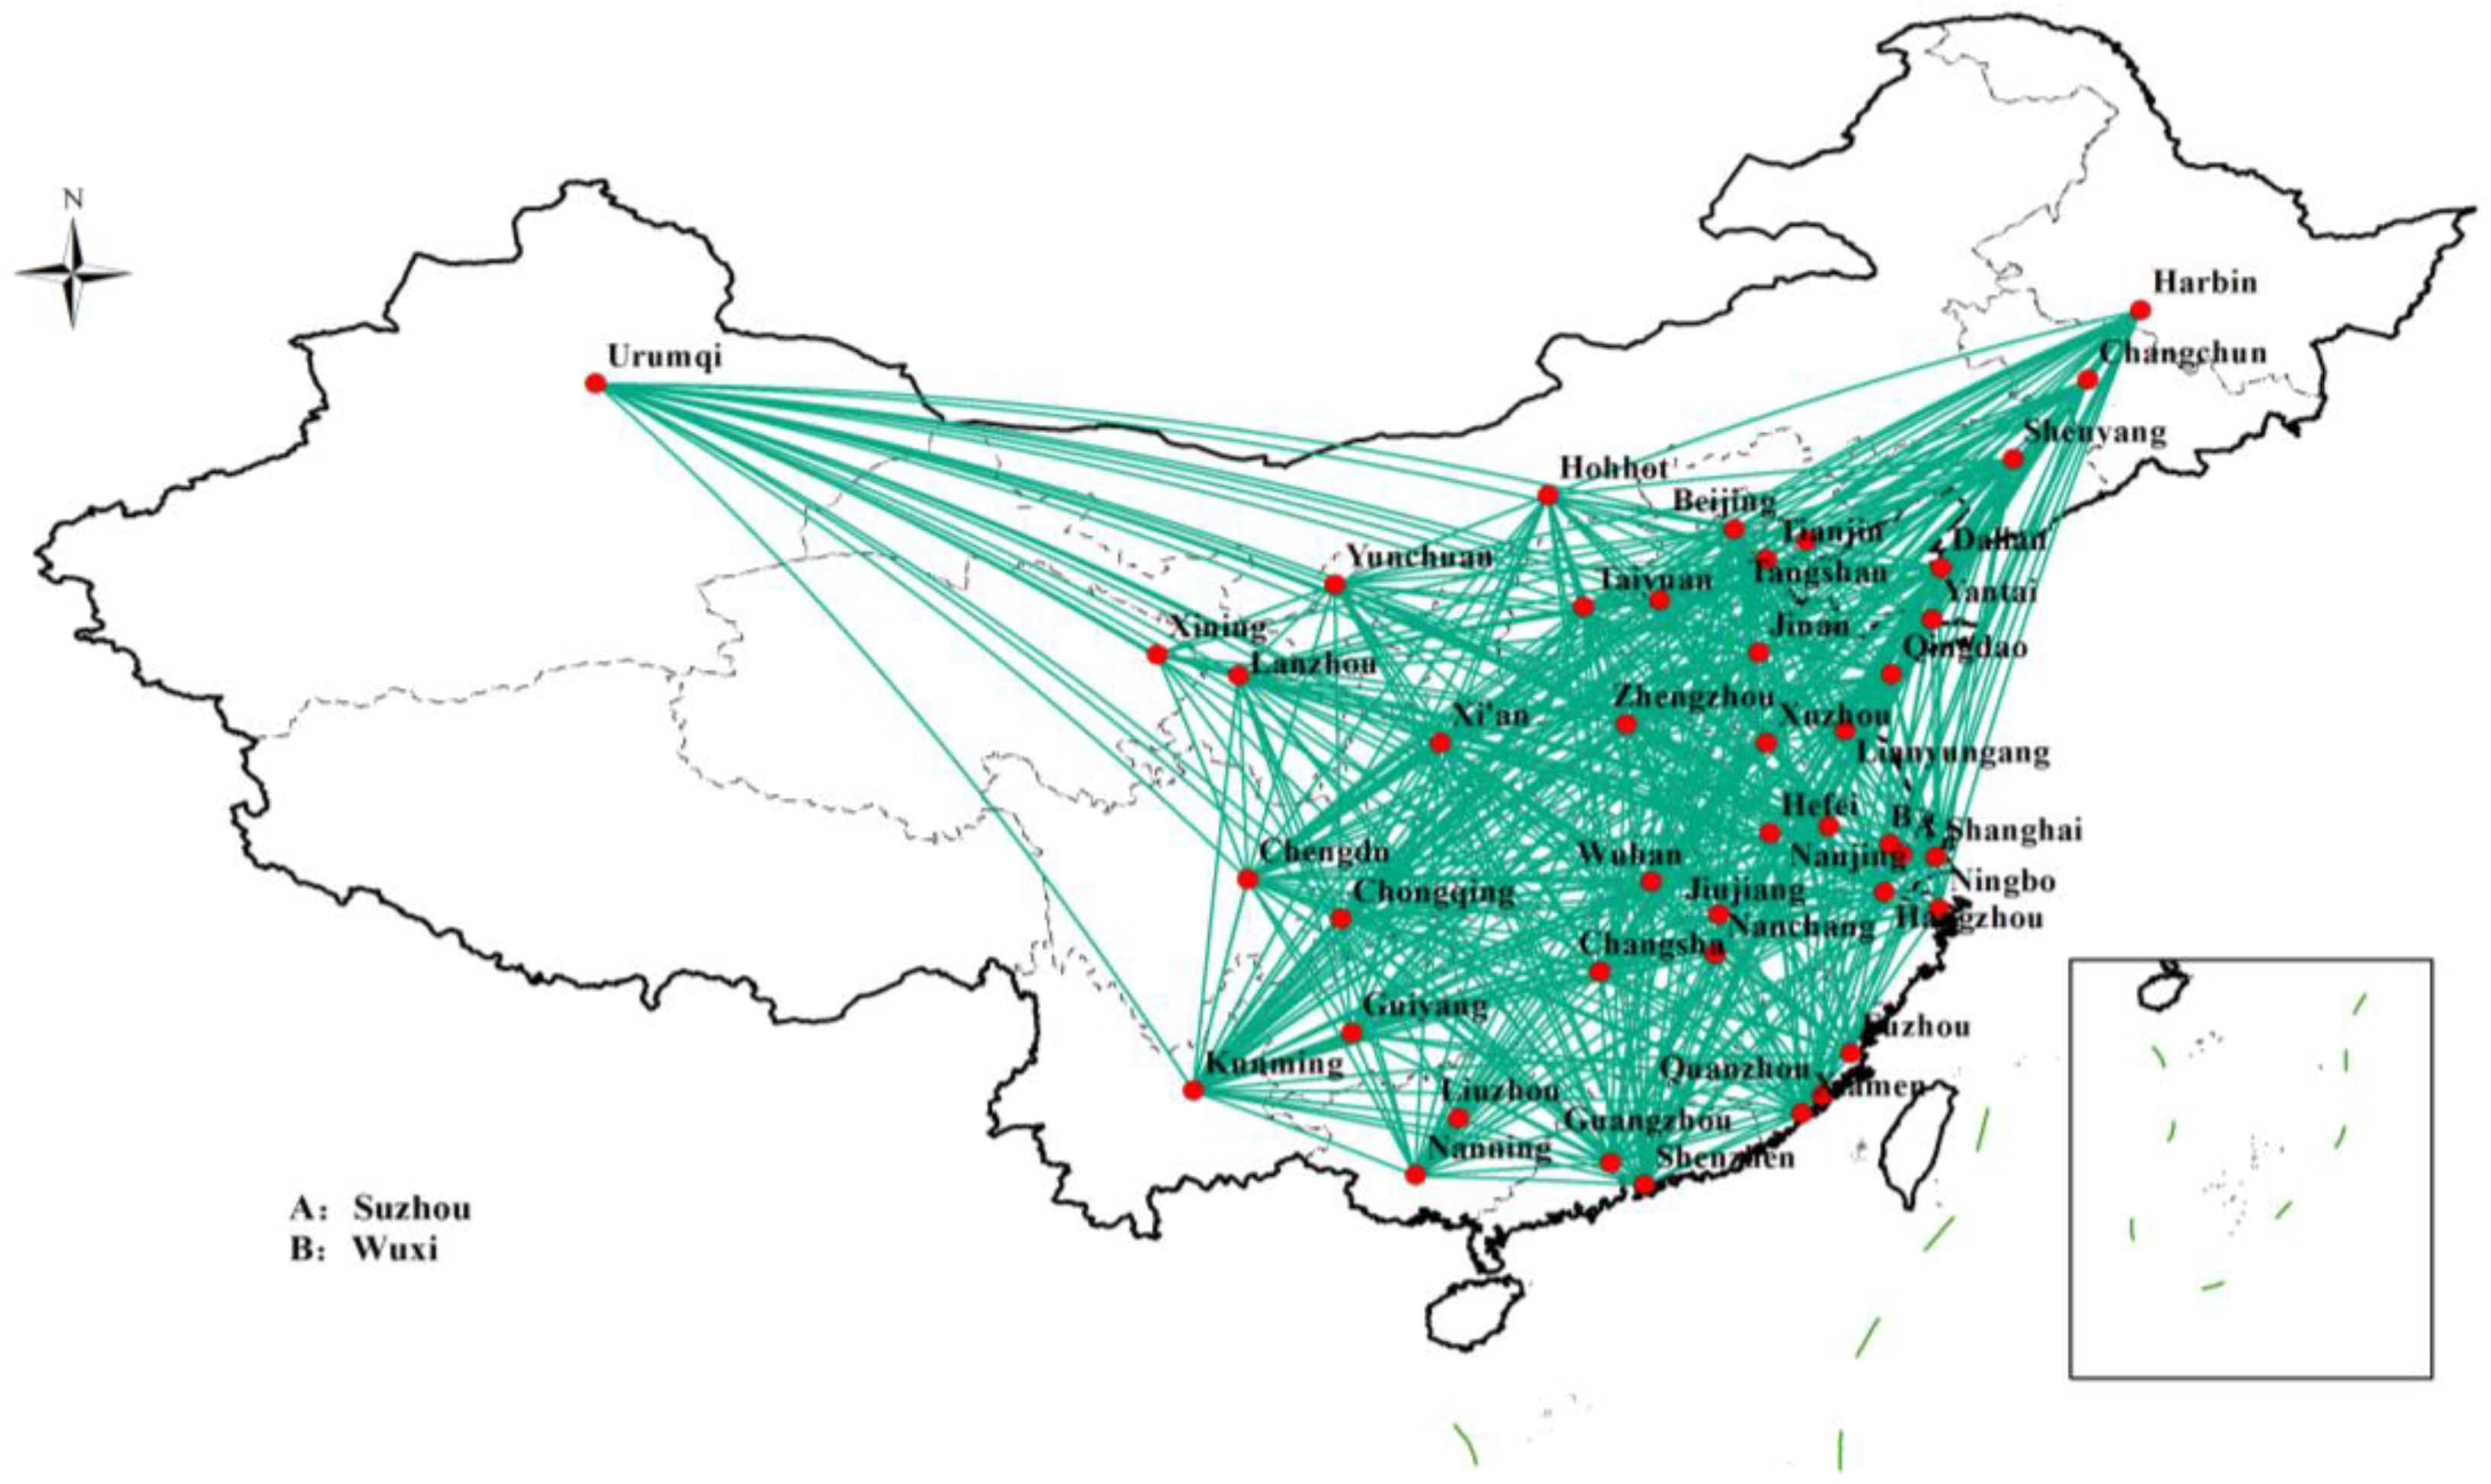
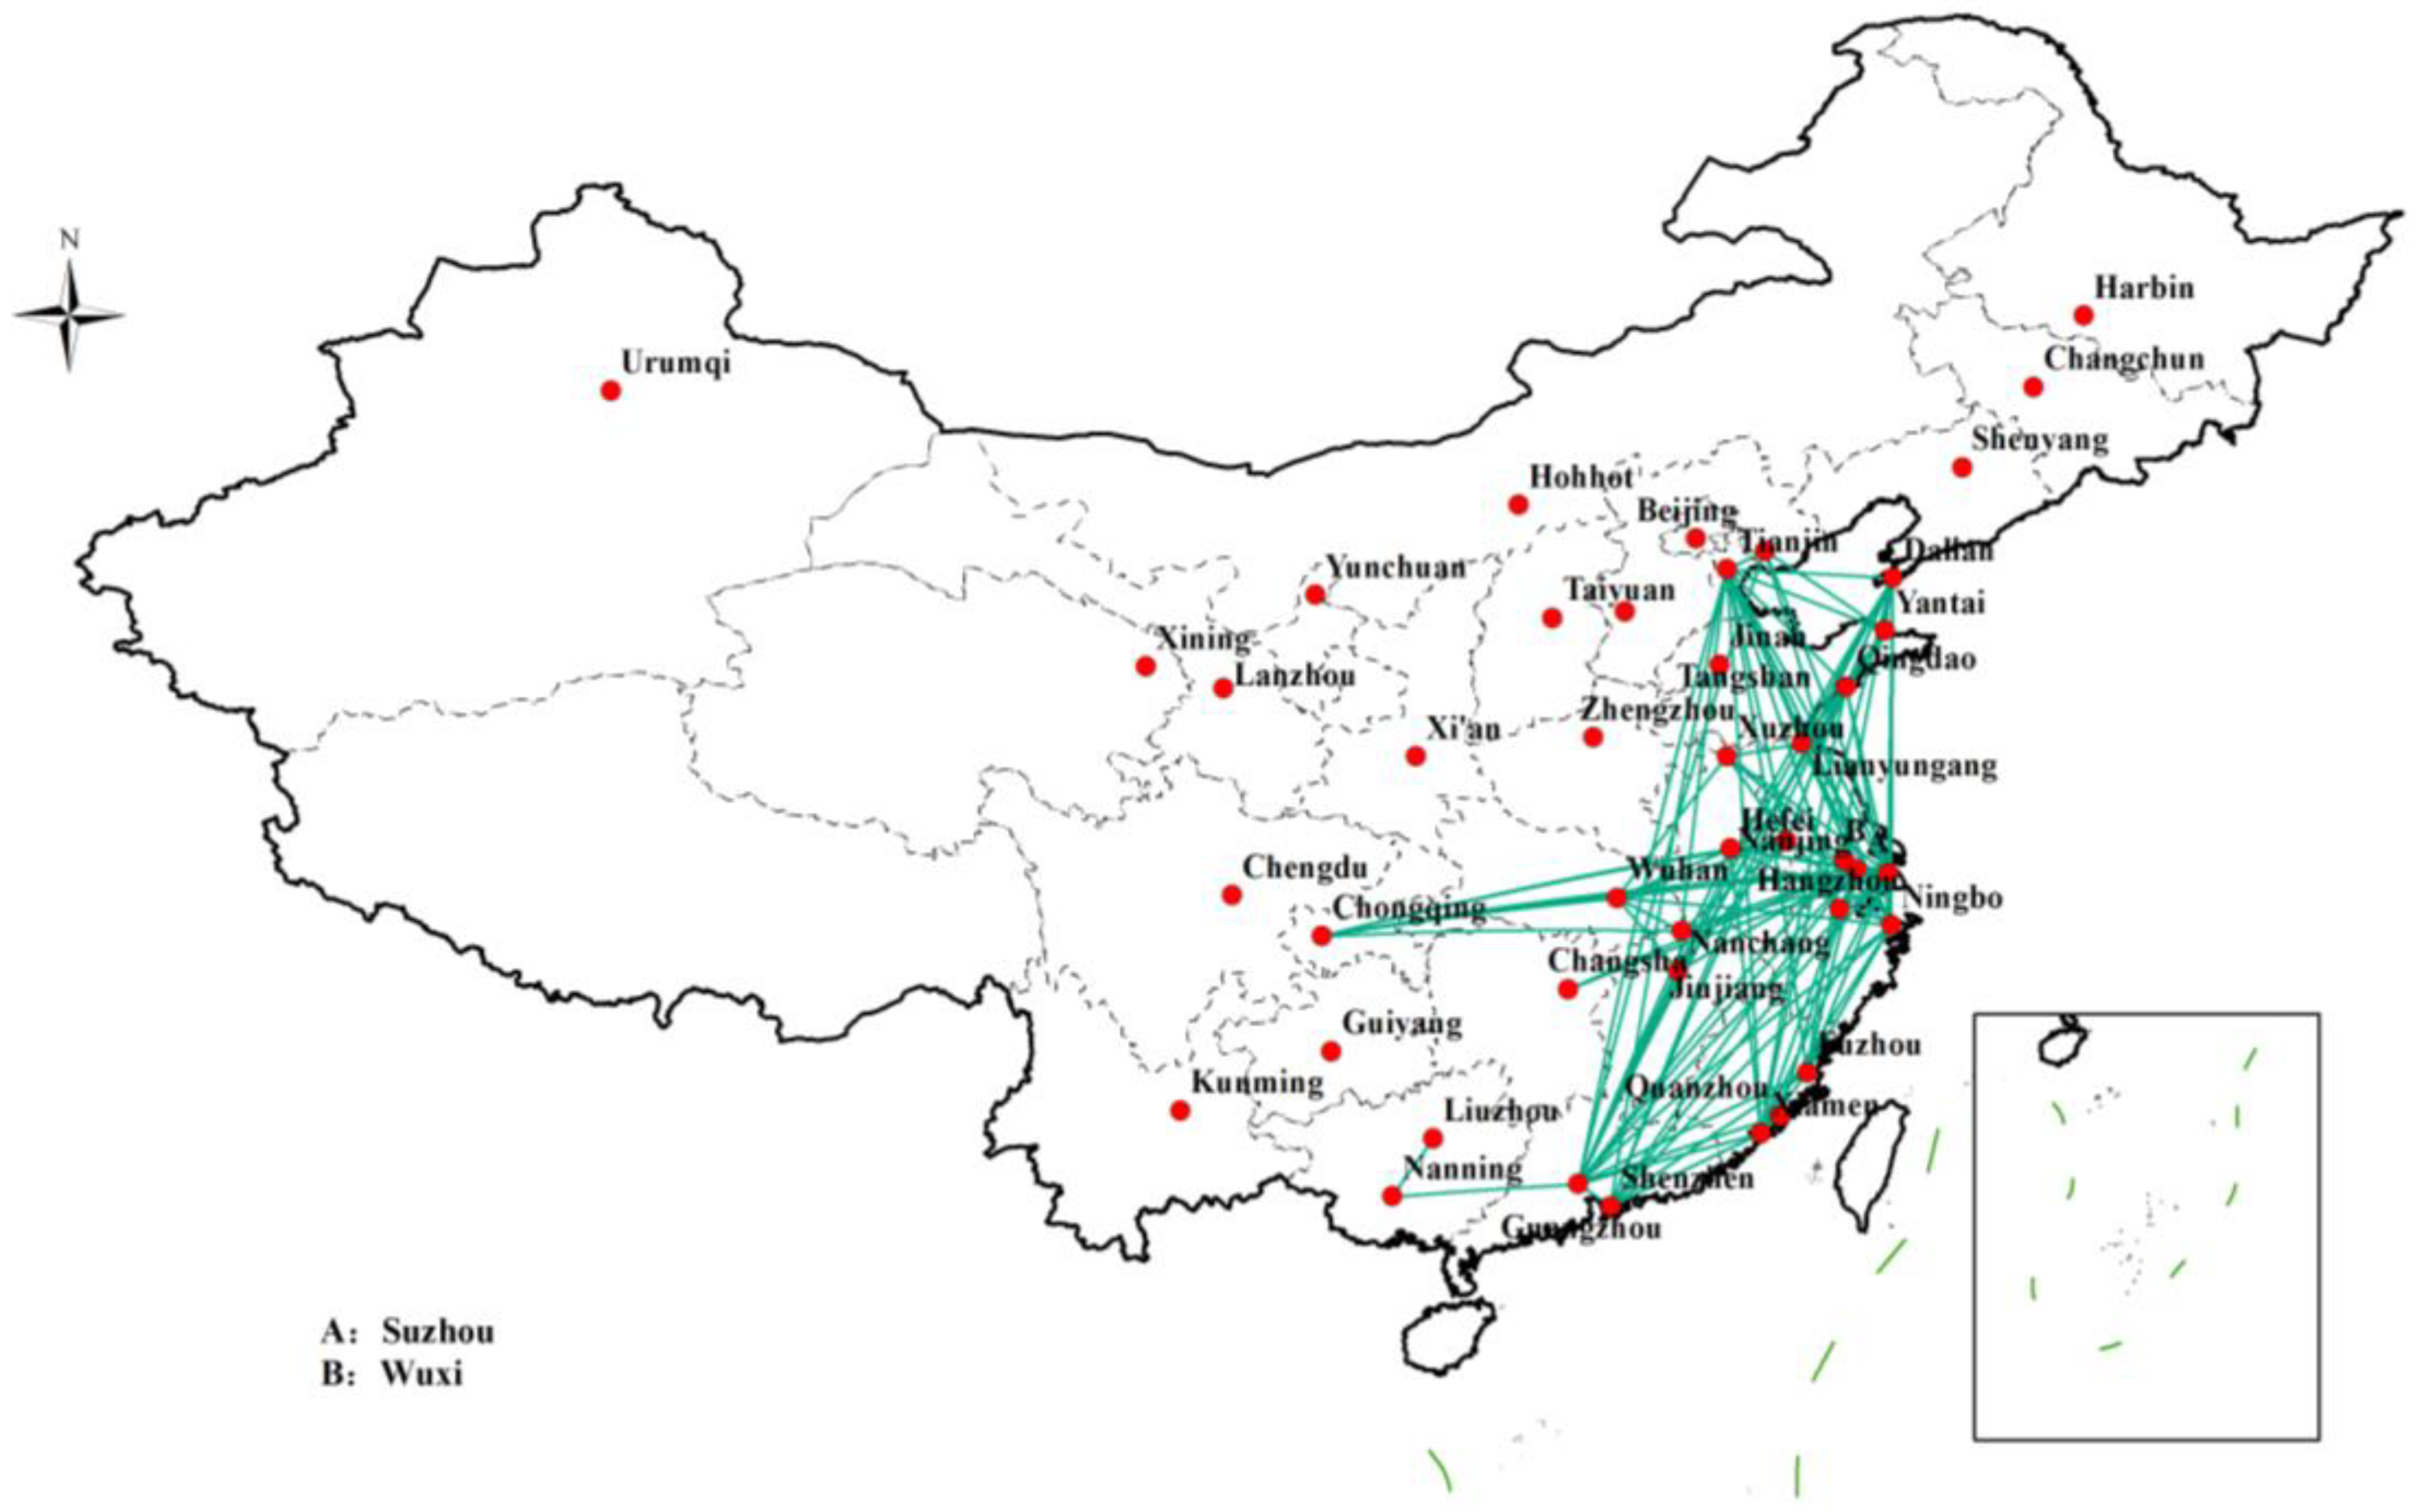
Section 3 establishes transportation networks of air, water, railway, and highway routes. The related evaluation indicators are selected in Section 4. The related approach is depicted in Section 5. A case application is analyzed in Section 6. Section 7 implements a comparative analysis. Finally, Section 8 is the conclusions.

2. Criteria and Procedure for Selecting Consolidation Centers

2.1. Screening Criteria

The Chinese government has issued various documents with regard to the layout of Chinese logistics center cities over recent years. These documents include: “a plan to develop modern logistics during the 14th Five-Year Plan period (2021–2025)” (https://www.gov.cn/zhengce/content/2022-12/15/content_5732092.htm, accessed on 15 January 2023), “Outline of National Comprehensive Three-Dimensional Transportation Network Plan (2021–2035)” (http://finance.people.com.cn/n1/2021/0224/c1004-32036071.html, accessed on 15 January 2023), “Outline of Building a Strong Transportation Nation (2020–2035)” (https://www.gov.cn/zhengce/2019-09/19/content_5431432.htm, accessed on 16 January 2023), “Outline of the 14th Five-Year Plan (2021–2025) for National Economic and Social Development and the Long-Range Objectives Through the Year 2035” (https://www.gov.cn/xinwen/2021-03/13/content_5592681.htm, accessed on 17 January 2023), “Implementation Plan for Promoting the High-Quality Development of the ‘Air Silk Road’ during the 14th Five-Year Plan Period (2021–2025)” (http://www.caac.gov.cn/PHONE/XXGK_17/XXGK/SYZCFBJD/202205/t20220506_213121.html, accessed on 17 January 2023), and so on. The publication of these different transportation plans provides policy support for the construction of transportation networks. However, these documents are primarily formulated for a single transportation mode and lack comprehensive planning for the integration of multiple modes.
Due to factors such as economic scale, geography, and population, not every city in China is suitable as a consolidation center [11,18]. This study constructed rules for screening the consolidation centers considering Chinese government documents, the geographical location, and the accessibility of transportation modes. Meanwhile, cities in Xizang, considering the population and economic scale, as well as Hainan, Taiwan, Hong Kong, and Macau, considering the geography and political factors, were excluded. This not only enhances the accuracy of the evaluation of the consolidation centers but also narrows down the selected cities. Considering the above-mentioned factors, with reference to [27] and [32], the specific screening criteria were formulated as follows:
Criterion 1: Node cities linked by CR Express, highway, domestic air, and/or water transportation modes.
Criterion 2: National- or regional-level logistics node cities.
Criterion 3: Provincial capital city.
Criterion 1 mainly reflects the cumulative advantages of the transportation mode of the comprehensive transportation network. Criterion 2 presents the national logistic layout, and Criterion 3 selects provincial capitals to demonstrate the support of local governments.

2.2. Screening Procedure

To screen out the candidate node cities, the following screening steps were formulated based on the criteria.
Step 1: Priority is given to cities that simultaneously meet all three criteria.
Step 2: If provinces do not have any candidate cities after Step 1, preference will be given to cities that meet 2 criteria. In particular, the order of precedence was ① Criteria 1 and 2; ② Criteria 2 and 3; and ③ Criteria 1 and 3.
Step 3: If provinces do not have any candidate cities after Steps 1 and 2, cities that meet the following order of criteria can be selected: Criterion 1, Criterion 2, and Criterion 3.
Simultaneously, national- or regional-level logistics cities are shown in Table A1, node cities of CR Express are shown in Table A2, node cities of water transportation are shown in Table A3, node cities of air transportation are shown in Table A4, and provincial capitals are shown in Table A5, which are appended in Appendix A. Based on the above-mentioned screening criteria and procedure, by searching government documents, relevant government websites, or industry websites, 44 node cities were ultimately screened as candidate consolidation centers for the integrated transportation network under the Belt and Road Initiative, as shown in Table 1 and Figure 1.

3. Construction of Integrated Network

The topology of the integrated transportation network consisting of railway, road, water, and air routes is a complex network, denoted as HG = (V, E, A). Here, V = { v 1 , v 2 , v n } and E = { e 1 , e 2 , e q } denote the link set and the node set of the network, respectively. A = ( a i j ) n × n denotes the adjacency matrix where the number of nodes is n, and a i j represents the following meaning:
a i j = 1 ,             if   i   and     j   is   adjacent   0 ,   if   i   and     j   is   not   adjacent
In other words, the transportation network G is defined as an undirected transportation network with n nodes and q links [26,33]. In this paper, a node denotes a city; meanwhile, a city also represents a candidate consolidation center and a link connects two cities by transportation modes such as railway, highway, water, or air. These network nodes are linked to establish an integrated transportation network, which is displayed in Figure 2.
In Figure 2, triangles of different colors indicate the nodes of a single transportation mode; the red triangles indicate the city nodes of the water transportation network, and the links of the same color denote the links among. Similarly, the yellow triangles, green triangles, and purple triangles indicate the city nodes of the highway network, air network, and railway network, respectively. Simultaneously, the links of the same color denote the links between cities that can be reached by highway, air, and railway modes, respectively. The blue hexagons denote the nodes of the integrated transportation network, and the links of the same color indicate multiple transportation modes passing through the same node city.

3.1. Establishment of the Railway Network

In this study, a railway transportation network connected by 277 railway lines was established between 44 node cities according to data from the China Railway website (https://ec.95306.cn/hycp/?active=0, accessed on 7 February 2023) and domestic cities serviced by CR Express. Figure 3 shows a topological map of the railway transportation network drawn using ArcGIS 10.2 software based on data from 277 railway transportation lines among the 44 node cities, which demonstrates the link network among cities serviced by CR Express or freight trains.

3.2. Establishment of the Highway Network

To simplify the processing of the transportation network data and align with the reality of freight transportation, the expressway was primarily considered in this study. At present, the expressway network in China is laid out with radial lines and vertical and horizontal grids, which are composed of 7 radial lines starting from Beijing, as well as 9 north–south vertical lines and 18 east–west horizontal lines [34]. Compared with the railway transportation network, only cities directly connected by expressways are considered as the nodes of the highway network. Therefore, the cities connected by expressways are divided into segments. For example, the expressway between Beijing and Harbin passing through multiple node cities is divided into many subsections, such as Beijing–Tangshan, Tangshan–Shenyang, Shenyang–Changchun, and Changchun–Harbin. In addition, Dongguan is not connected by highway. Therefore, in this study, based on the above-mentioned factors, 79 connections among 43 node cities were identified. By using ArcGIS 10.2 software, a topological map of the expressway transportation network was drawn based on the 79 connections among the 43 node cities, as shown in Figure 4, which indicates the highway link network among the 43 node cities connected by the highway network.

3.3. Establishment of the Air Network

Most airports in China are now dual-use airports for passengers and cargo; therefore, in this study, only the connections between the nodes of the aviation network were considered; the volume and frequency of freight transportation between the nodes were not considered. The data on the air transportation network primarily came from the direct routes between cities listed in the “Catalogue of Domestic Routes with Market-Adjusted Prices” published by the Chinese government. Many of these cities only have one airport, but some cities have multiple airports; cities with multiple airports were represented by the city name. For example, Pudong and Hongqiao airports in Shanghai were represented by Shanghai. Only one airline route was reserved between each pair of cities, and repetitive routes were deleted. After screening, since there are no airports in Dongguan, Tangshan, Jiujiang, and Suzhou, 462 direct routes were selected among 40 node cities in the air transportation network. A topological map of the air transportation network was drawn using ArcGIS 10.2 software based on the data from the 462 direct links among the 40 node cities, as shown in Figure 5, which denotes the air transportation network among the 40 node cities connected by the air network.

3.4. Establishment of the Waterway Network

Compared with railway, air, and highway transportation networks, water transportation is limited by geographical factors and not every node city has a mode of water transportation. Water transportation is generally divided into coastal and inland river transportation, but this study mainly considered the connection between ports. Domestic water transportation in China mainly involves inland river transport in the Heilongjiang, Yangtze, and Pearl River basins, as well as the Beijing–Hangzhou Grand Canal, and coastal shipping in coastal areas. However, because the Heilongjiang River basin is affected by geographical and climatic factors and the shipping scope is small, the port cities in the Heilongjiang River basin were not considered. The data used in this study were sourced from relevant government websites (for example, http://www.tcport.gov.cn/tcg/cjnh/zjgkwztt.sh-tml, accessed on 9 February 2023) and shipping companies (for example, http://www.chinaports.com/, accessed on 9 February 2023). Based on the above factors, 82 water transportation routes were identified among 27 port cities. Figure 6 is a topological map of the water transportation network drawn using ArcGIS 10.2 software based on the 82 water transportation links among the 27 port cities, which denotes the transportation network of direct water transportation links among the 27 port cities.

4. Evaluation Indicators

Given the complexity and diversity of evaluation factors, the impact of different evaluation indicators on the evaluation results is also different; therefore, the reasonable selection and use of evaluation indicators are crucial for obtaining scientific evaluation results. Considering the advantages and disadvantages of different evaluation indicators, based on references [25,27], this study selected six classic evaluation indicators from global and local perspectives, including closeness centrality, degree centrality, network constraint coefficient, betweenness centrality, clustering coefficient, and eigenvector centrality. The following are the six evaluation indicators:
(1)
Degree centrality
The centrality indicator degree centrality ( D C i ) measures the node’s influence, which is an essential parameter for studying the topology of complex networks. The number of the connection of individual node i is denoted as d i , that is, the number of links connected between node i and other nodes within the entire network. The maximum number of possible connections within the entire network is n 1 . The degree centrality indicates the ratio of d i to n 1 , as shown in Equation (2) [19,33].
D C i = d i n 1 ,
where n is the number of nodes in the network. Generally, a node with a higher D C i is directly connected to more nodes, thus occupying a more important position within the network.
(2)
Betweenness centrality ( B C i )
B C i is the number of the shortest paths between the node and node d passing through an intermediate node i [13]. B C i can be obtained from Equation (3):
B C i = 2 n 2 3 n + 2 s < d g s d ( i ) g s d ,
where g s d denotes the total number of shortest paths between node s and node d, and g s d ( i ) indicates the number of shortest paths between node s and d passing through node i. The higher the B C i is, the more important vertex i is.
(3)
Closeness centrality ( C C i )
C C i represents the reciprocal of the average distances of the shortest path between node i and all other nodes [33,35], which is defined as follows:
C C i = n 1 j = 1 n d i j ,
where d i j is the minimum distance between node i and node j. The closer node i is to the network center, the greater C C i becomes.
(4)
Eigenvector centrality ( E C i )
E C i indicates the linear relationship between the centrality indicator of vertex i and the centrality metrics of the neighboring nodes [33], which is defined as follows:
E C i = 1 θ j = 1 n a i j E C j ,
where proportionality constant θ is the maximum eigenvalue of the nth-order adjacent matrix A = ( a i j ) . E C j = E C 1 E C 2 E C 3 E C n T denotes the center vector of all vertices. The larger E C i is, the more import node i is.
(5)
Clustering coefficient ( C L C i )
C L C i reflects the tendency of node i to form clusters with its neighboring nodes, as shown in Equation (6). In general, only nodes with relatively low clustering coefficient values can become structural hole nodes [25].
C L C i = 2 e i d i [ d i 1 ] ,
where e(i) denotes the links number from node i to its neighboring nodes. d i is the degree of node i .
(6)
Network constraint coefficient ( R C i )
Burt put forward structural hole theory in 1992. The network constraint coefficient is an indicator used by Burt to reflect the number of structural holes and the extent of their impact on the information flow [36]. R C i j is defined as the influence of an individual node:
R C i j = P i j + q P i q P q j 2 ,
where q indicates the common adjacent node between node i and j , q i , j . The proportional strength of node j out of all the connections to node i is denoted as P i j . The sum of the proportions of indirect connections between node i and j is q P i q P q j . The network constraint coefficient R C i is defined as follows:
R C i = j R C i j .
The higher R C i is, the greater the probability that node i will become the central node.

5. The Integrated Evaluation Method

The TOPSIS is a multi-attribute decision-making approach employed by many scholars. However, it has some limitations. One limitation is that the accuracy of Euclidean distances is affected by the correlation between indicators. Another limitation is that it cannot accurately reflect the similarity of data curves. The GRA approach can not only capture non-linear relationships between sequences but also determine the level of closeness between system indicators. Therefore, the simplicity of the calculation of the TOPSIS approach and the similarity of the GRA approach were integrated into the multi-attribute decision approach. Moreover, the experience and knowledge of decision makers are seldom considered in the applications of the TOPSIS approach. Given these, this paper introduces Criteria Importance through the Intercriteria Correlation (CRITIC) objective weighting method into the combination of the TOPSIS and GRA. Then, this approach was combined with the indicators to assess the candidate consolidation centers of the integrated transportation network. The specific evaluation process is shown below.
Step 1: 
Construction of indicator matrix
It is assumed that m indicators are employed to assess the importance of n nodes in the integrated transportation network. x i j ( i = 1 ,   2 , , n ; j = 1 ,   2 , ,   m ) is the indicator value of each node. Here, i and j indicate the i -th node and j -th indicator separately, and the initial indicator matrix U = ( x i j ) n × m is shown in Equation (9):
U = x 11 x 21 x n 1 x 12 x 22 x n 2 x 1 m x 2 m x n m .
Step 2: 
Construction of normalized indicator matrix
Due to the presence of the evaluation indicators with different scales, the dimensionless indicator matrix F i j = ( x i j ) n × m is obtain by normalization.
F i j = x 11 x 21 x n 1 x 12 x 22 x n 2 x 1 m x 2 m x n m i = 1,2 , , n ; j = 1,2 , , m ,
where
x i j = x i j i = 1 n x i j i = 1,2 , , n ; j = 1,2 , , m .
Step 3: 
Construction of indicator weight
To avoid the influence of individual preferences of evaluators on indicator weights, the CRITIC method proposed in [37] was employed in this study, and the concrete process is shown below.
(1)
Calculate the difference between evaluation indicators
The difference between evaluation indicators was calculated based on the normalized matrix constructed according to Equation (10). The CRITIC method uses the standard deviation to estimate the differential fluctuation between indicators i and j, as shown in Equation (12):
x ¯ j = 1 n i = 1 n x i j , S j = i = 1 n x i j x ¯ j 2 n 1 ,
where x ¯ j denotes the average value of indicator j (column) and S j represents the standard deviation of indicator j. When the standard deviation between j and i is larger, it means that the information contained by indicator j is larger, which indicates that the evaluation intensity of indicator j is higher. Therefore, it is necessary to assign greater weight to indicator j. If the reverse is true, it is necessary to assign a smaller weight to indicator j.
(2)
Calculate the conflict between evaluation indicators
Similarly, the conflict between evaluation indicators was calculated based on the normalized matrix constructed according to Equation (10). The CRITIC method applies the correlation coefficient to estimate the conflict between indicator i and j. The stronger the correlation is, the smaller the conflict is, indicating that there is more identical information between indicators. Correspondingly, the evaluation intensity of indicator j is weakened to some extent, and therefore, less corresponding weight is assigned to indicator j. If the reverse is true, more weight is given. The equation for calculating the conflict R j between indicator j and other indicators is shown in Equations (13) and (14):
r j k = i = 1 n x i j x ¯ j x i k x ¯ k i = 1 n x i j x ¯ j 2 i = 1 n x i k x ¯ k 2 , i = 1,2 , , n ; j , k = 1,2 , , m ,
R j = k = 1 m 1 r j k ,
where r j k denotes the correlation coefficient of indicator j and k . x ¯ k indicates the average value of indicator k .
(3)
Calculate comprehensive information volume
The difference and conflict between indicators were calculated using Equations (12)–(14), and the information volume contained in the indicators was calculated using Equation (15) according to the difference and conflict.
I j = S j i = 1 n 1 r j k = S j × R j .
Generally, the larger I j is, the more the information contained in indicator j, and the more important it is. In such cases, more weight should be assigned to the indicator. If the reverse is true, less weight should be assigned to the indicator.
(4)
Determine objective weight
The CRITIC was employed to determine the objective weight of the indicators in accordance with the comprehensive information on the differences and conflicts. Therefore, according to Equation (16), the indicator information volume contained in the j-th indicator is calculated to determine the corresponding weight W j , and the equation of calculation is shown below:
W j = I j j = 1 m I j ,
where W j is the weight of the indicator j.
Step 4: 
Calculate the weighted normalization matrix
To effectively evaluate the influence of each indicator on the evaluation result, the normalized matrix constructed using Equation (10) and the weight of each indicator obtained from Equation (16) can be multiplied to obtain the weighted normalized matrix Z, as shown in Equation (17):
H = h i j n × m = F i j × W j ,
where z i j represents the indicator value of the weighted normalized matrix, and F i j indicates the dimensionless matrix.
Step 5: 
Determine the ideal solutions
According to the weighted normalization matrix, the maximum and minimum of the various indicators are determined as the positive ideal solutions and the negative ideal solutions, H +   and   H , respectively.
H + = h 1 + , h 2 + , , h m + = max h i j , 1 i n ; 1 j m ,
H = h 1 , h 2 , , h m = min h i j , 1 i n ; 1 j m .
Step 6: 
Calculate the Euclidean distance
The weighted normalized matrix H was computed from Equation (17), and the positive ideal solution sets were obtained from Equation (18) and the negative ideal solution sets were obtained from Equation (19). Then, D i + is labeled as the Euclidean distance of indicator j from the positive ideal solution, as shown in Equation (20). D i is labeled as the Euclidean distance of indicator j from the negative ideal solution, as shown in Equation (21).
D i + = j = 1 m h i j h j + 2 , i = 1,2 , , n ,
D i = j = 1 m h i j h j 2 , i = 1,2 , , n .
Step 7: 
Grey Relational Analysis (GRA)
(1)
Calculate grey relational coefficient
The grey relational coefficient is computed based on the weighted normalized matrix established by Equation (17). γ i j + is expressed as the correlation coefficient between indicator j and the positive ideal sequence and γ i j is expressed as the correlation coefficient between indicator j and the negative ideal sequence. The calculation equations are shown in Equations (22) and (23).
γ i j + = min i min j h i j h i + + ρ max i max j h i j h i + h i j h i + + ρ max i max j h i j h i + ,
γ i j = min i min j h i j h j + ρ max i max j h i j h j h i j h j + ρ max i max j h i j h j ,
where ρ is the resolution coefficient that controls the degree of discrimination of the grey relational coefficient, and the value of ρ ranges from 0 to 1. The smaller ρ is, the greater the degree of discrimination is. The greater ρ is, the smaller the degree of discrimination is. The value of ρ was set as 0.5 in this study.
(2)
Calculate grey relational degree
According to the grey relational coefficient, B i + is the grey relational degree between indicator j and the positive ideal solution, while B i is the grey relational degree between indicator j and the negative ideal solution, which are expressed as Equations (24) and (25).
B i + = 1 m j = 1 m γ i j + i = 1,2 , , n ; j = 1,2 , , m ,
B i = 1 m j = 1 m γ i j i = 1,2 , , n ; j = 1,2 , , m .
Step 8: 
Dimensionless processing of D i + , D i   and   B i + , B i
d i + , d i   and   a i + , a i are dimensionless values, and their specific calculations are shown in Equations (26)–(29).
d i + = D i + max D i + i = 1,2 , , n ,
d i = D i max D i i = 1,2 , , n ,
a i + = B i + max B i + i = 1,2 , , n ,
a i = B i max B i i = 1,2 , , n .
Step 9: 
Calculate the close degree
R i + and R i were set as the proximity of the node i to the positive ideal solution and the negative ideal solution, respectively. Hence, the proximity of the node to the ideal solution was calculated in accordance with the dimensionless grey relational degree and dimensionless Euclidean distance. The calculation equations are shown in Equations (30) and (31):
R i + = φ 1 a i + + φ 2 d i ,
R i = φ 1 a i + φ 2 d i + ,
where φ 1   and   φ 2 are the preference coefficients, which indicate the degree of preference of the decision maker. Generally, φ 1 + φ 2 = 1 and the values of φ 1   and   φ 2 are usually both 0.5.
Based on the above-mentioned comprehensive grey relational degree–Euclidean distance measure, the new measures obtained from Equations (30) and (31) were used to compute the relative closeness of each evaluation target. T i represents the target’s response to both the positive and negative ideal solutions in changing situations, and the calculation equation is shown in Equation (32). Finally, the targets were sorted based on the closeness value.
T i = R i + R i + + R i i = 1,2 , , n .
The greater T i is, the better the target’s evaluation is. Correspondingly, the smaller T i is, the poorer the target’s evaluation is.

6. Case Study

The purpose of the BRI is to enrich the transportation network and promote connection and cooperation around the world. Based on this background, a case study of the consolidation centers of an integrated transportation network composed of railway, road, water, and air routes was conducted to evaluate the above-mentioned approach.

6.1. Scoring and Ranking of the Candidate Consolidation Centers for a Single Mode

Firstly, according to the complex network theory, the raw data of the 44 node cities of the railway transportation network was normalized using Equation (10) in Section 5 in this paper, and then the CRITIC was employed to obtain the weights of six indicators of the railway transportation network according to Step 3 in Section 5. The concrete values of each indicator were 0.1939, 0.1363, 0.2029, 0.1994, 0.1335, and 0.1339. Similar to the process described above, the weights of the six indicators for the four transportation modes were calculated and are shown in Table 2.
Next, the weighted normalized matrix was obtained by multiplying the weights with the normalized matrix. Finally, the values of the six indicators for the 44 city nodes of the railway transportation network, including closeness centrality, eigenvector centrality, betweenness centrality, degree centrality, constraint coefficient, and clustering coefficient, were determined through the application of the combination of GRA and the TOPSIS. The concrete rankings are also shown in Table A6.
Similarly, the scores of the six indicators for the candidate consolidation centers of the highway, water, and air networks are also shown in Appendix B Table A7, Table A8 and Table A9. Table A6, Table A7, Table A8 and Table A9 show the indicator values, scores, and rankings of the six indicators for each candidate consolidation center in the railway transportation network, highway transportation network, air transportation network, and water transportation network, respectively.

6.2. Evaluation of the Single Transportation Mode Networks

To reflect the changes between the integrated transportation network and the single transportation mode networks, the candidate consolidation centers of the single transportation mode network were first evaluated and analyzed.
It can be seen from the overall rankings of the railway transportation network from Table A6 that more connections among the candidate consolidation centers resulted in higher rankings, which is in line with the clustering effect of complex network theory. These cities are important nodes in the Chinese domestic railway transportation network, which plays an important role in railway cargo transportation. In addition, China Railway Express (CR Express) mainly passes through ports such as Manzhouli, Erenhot, and Alashankou to reach Europe. However, from the perspective of geographical area, only Shenyang in Northeast China is in the top 50% and Manzhouli has not played its corresponding role as a port of CR Express due to distance reasons. Correspondingly, Urumqi and Xi’an are ranked high in Northwest China, indicating that the northwest land ports are regarded as the important outbound ports by the cities that are serviced by CR Express in China. Chengdu was one of the earliest cities in China to be serviced by CR Express, and it is also an important source of cargo consolidation centers. There are three cities in central China, Zhengzhou, Changsha, and Nanchang, which show the importance of the city’s geographical location. Currently, these cities have been the important Chinese starting points of CR Express. However, Beijing is not in the top 50%, because its main task is passenger transportation as the capital of China, despite its well-developed rail network.
The corresponding rankings of the candidate consolidation centers of the air transportation network are displayed in Table A7. The relevant indicator values for Suzhou, Dongguan, and Jiujiang were set to 0 due to them not having airports operating in air transportation. Similar to the railway transportation network, the more connections there are among node cities, the higher the rankings are. According to the geographical distribution of these cities, one can see that no cities were selected in the northwest region. The reasons are the vast territory, sparse population, backward economic development, or low industrial concentration. In addition, there are a few exceptions. Shanghai and Xi’an are not in the top 50%, although there are more routes among node cities. The reason is that these cities are affected by the direct routes, and the values of structural holes of these direct routes and other indicators are relatively low, resulting in their low ranking.
Table A8 shows the corresponding rankings of the candidate consolidation centers of the highway transportation network. Based on the geographical distribution of these cities, the cities in Northeast China are all in the bottom 50%. The reason is that there are fewer national highway connections between cities in the northeast and cities in other regions. Additionally, the relevant indicator values for Dongguan were set to 0 because Dongguan is not connected by the national highway. However, Beijing is at the forefront of the ranking in the highway network because, as the capital of China, the highway network is centered around Beijing.
Due to the particularity of water transportation, the relevant indicator values for cities with no water transportation modes passing through were set to 0. Meanwhile, Harbin is an inland river transportation city with a relatively small freight volume, mainly connecting some ports in Russia and not directly connected with other Chinese domestic node cities. Therefore, the relevant indicator value for Harbin was also set to 0. Therefore, there were 27 node cities in the water transportation network. As shown in Table A9, the rankings of the 27 candidate consolidation centers were determined based on the indicator values. It can be seen from the ranking that there were no node cities in Northwest China and Northeast China due to the lack of water transportation. Correspondingly, most of the selected node cities are mainly located in the coastal areas and some selected cities are located in the Yangtze River basin. The node cities in coastal areas were relatively high in the overall ranking of the water transportation network.

6.3. Comprehensive Evaluation of the Integrated Transportation Network

This study evaluated and ranked the candidate consolidation centers in an integrated transportation network under the BRI. This ranking can supply a reference for optimizing the layout of these centers to some extent, thereby enhancing the efficiency of freight services in China. We assessed the overall conditions of various transportation modes in each node city following the evaluation obtained for each mode individually. A comprehensive evaluation was conducted on the transportation modes passing through the candidate consolidation centers to obtain the ranking of these cities under the BRI.
Given that freight volume is an important indicator of transportation business and industry linkage, this study referred to references [11] and [27] and the proportion of freight volume of different transportation modes to the total freight volume in 2022 published by the Chinese government as the weight of each transportation mode [38]. After calculation, the proportions of railway, highway, water, and air freight volumes to total freight volume were 0.097419, 0.733509, 0.168952, and 0.000120, respectively. The comprehensive score of each node city can be obtained based on these weights. Consequently, the comprehensive score ( C s ) of each node city of the integrated transportation network was calculated using Equation (33).
C s = 0.097419 x r + 0.733509 x h + 0.168952 x w + 0.000120 x a ,
where x r , x h ,   x w , and x a represent the comprehensive score for each city in the highway, railway, water, and air transportation networks, respectively.
In summary, 44 candidate consolidation centers were comprehensively evaluated based on each transportation mode within the integrated transportation network under the BRI with the freight volumes serving as the weights. The final comprehensive scores and rankings of the 44 node cities are displayed in Table 3.
Based on the spatial layout and government policies under the BRI, with reference to [11], five attributes were employed to analyze the selection of candidate consolidation centers, including service by CR Express, along inland river, along the coast, along the key railway, and the final comprehensive score. Finally, the ten major cities, including Wuhan, Chongqing, Tianjin, Shanghai, Guangzhou, Yantai, Hangzhou, Lianyungang, Hefei, and Dalian, were selected as consolidation centers of the integrated transportation network in this study. On the other hand, the straight-line distance from Yantai to Dalian is only 170 km, and Hangzhou is about 170 km away from Shanghai. Considering the related geographical factors, Shanghai was merged with Hangzhou and Yantai was merged with Dalian. Wuhan, Chongqing, Tianjin, Shanghai, Guangzhou, Lianyungang, Hefei, and Dalian were finally recommended as the consolidation centers of the integrated transportation network, and Figure 7 shows the final selection results. Additionally, one can see that the top node cities are located along the inland river or coastal areas from Table 3. Xi’an, ranked 19th, is the top-ranked inland city without water transport, which indicates that the absence of water transport weakens the competitiveness of inland cities in the integrated transportation network. In addition, by comparing the top-ranked cities in the integrated transportation network with those in the single-mode networks, it can be observed that many of the top cities in the integrated network ranking are also among the top cities in the single-mode network rankings, indicating that the cities that hold important positions in the single-mode networks continue to maintain their significant status in the integrated network as well, such as Wuhan, Chongqing, Tianjin, Shanghai, and Guangzhou. At the same time, the ranking results revealed that the competitiveness of a node city increases as it accommodates more transportation modes. Consequently, the city’s cargo turnover capacity within the entire transportation network also strengthens.

7. Discussion

It is well known that the feasibility of results can be confirmed by the applied evaluation method. In this subsection, an evaluation was performed with the TOPSIS to validate the rationality and accuracy of the proposed GRA–TOPSIS method. Table 4 indicates the comparison results of the two different methods.
It can be seen that Wuhan, Chongqing, Guangzhou, Tianjin, Shanghai, and Yantai were always the best candidate cities for consolidation centers in the integrated transportation network. In contrast, Zhengzhou, Urumqi, Shijiazhuang, Yinchuan, Changchun, Taiyuan, and Hohhot were all the least suitable locations for consolidation centers as indicated by the comparison of the two methods. Moreover, some cities such as Xi’an, Harbin, Lanzhou, Kunming, Xiamen, Dongguan, Xining, Shenzhen, Chengdu, and others showed significant changes when their results were compared. The reasons for the above situation are the limited transportation modes or routes, and the results could be reflected by the core ideas of these two methods. Specifically, the GRA–TOPSIS approach focuses on the distance between alternative solutions and the connection between standards. The TOPSIS mainly considers the distance between alternative reference schemes and the best reference scheme.
Additionally, to compare the result obtained using the two methods, Kendall’s tau correlation coefficient (KTC) was applied to study the difference in accuracy between the two methods [39]. The value of the calculated KTC of the two methods was 0.661734. It can be concluded that the obtained rankings have a high correlation with each other. Meanwhile, the reliability of an evaluation method was also demonstrated based on the distinction degree of the evaluation methods [40]. Accordingly, the values of the GRA–TOPSIS and TOPSIS methods were 1.075746 and 1.075126, respectively. The value of the GRA–TOPSIS was greater than that of the TOPSIS and then the reliability of the GRA–TOPSIS is relatively better than that of the TOPSIS. Table 5 and Table 6 show the values of KTC and distinction degree, respectively.

8. Conclusions

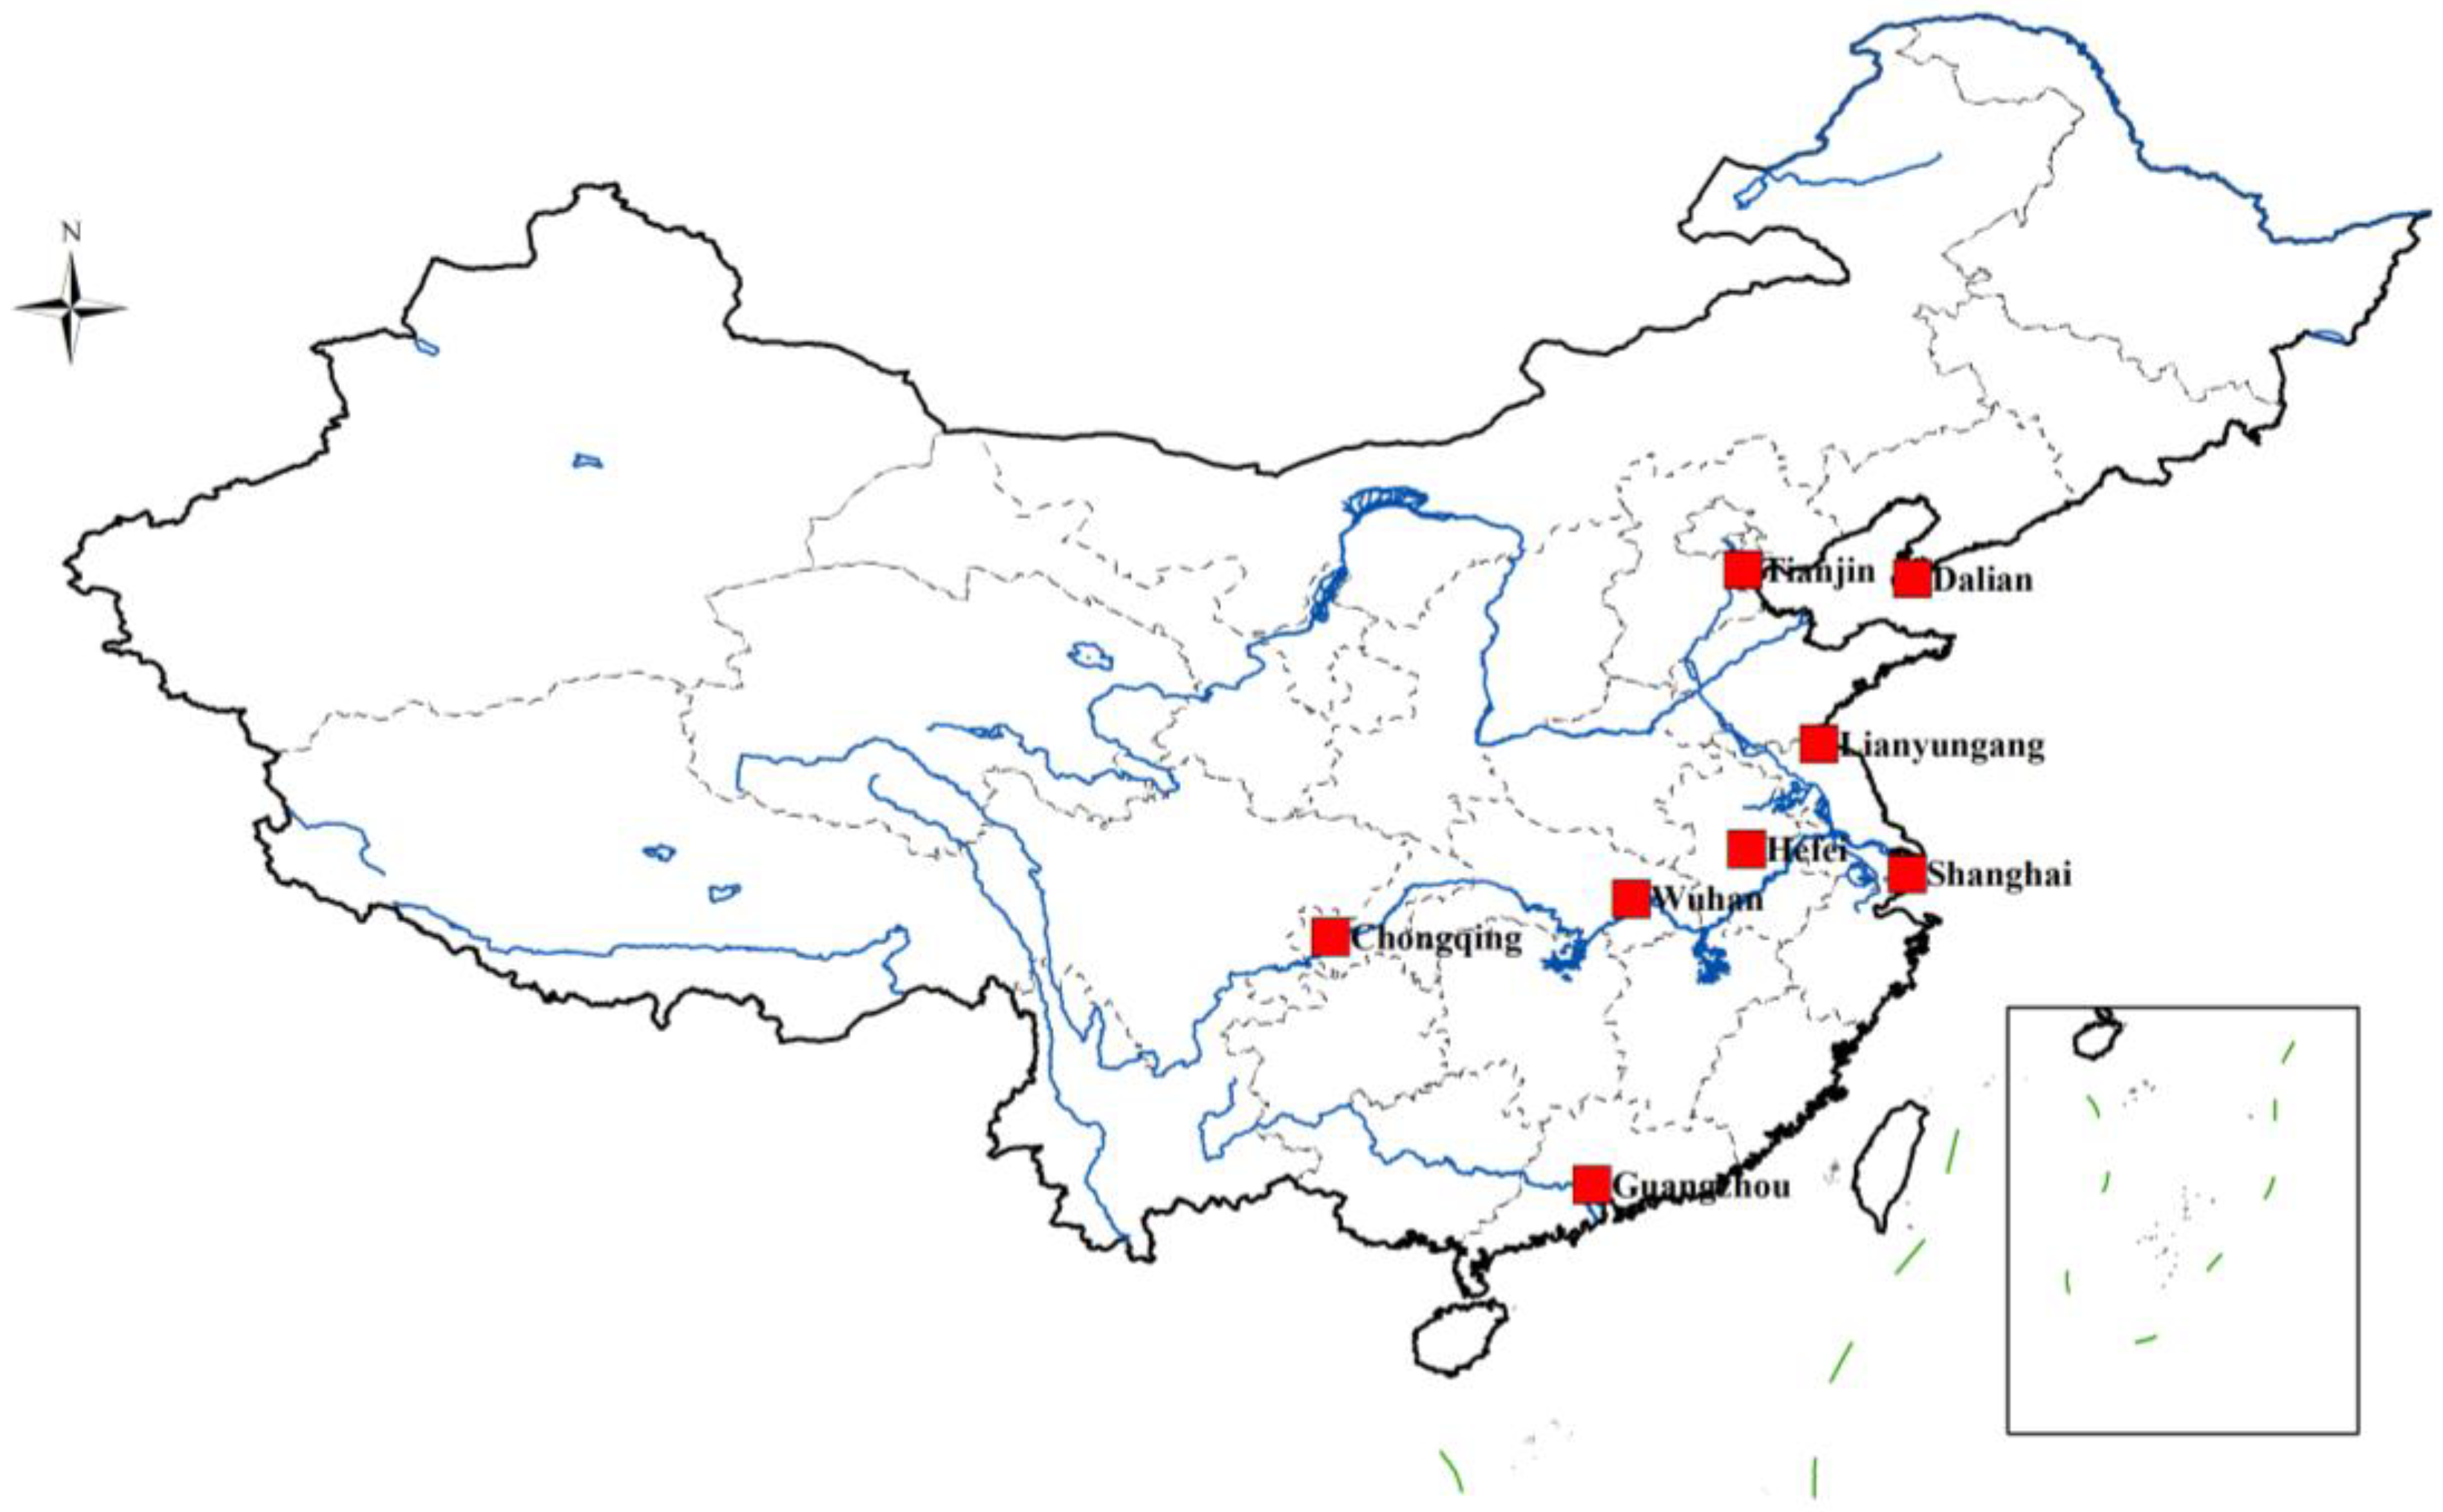
The selection of the consolidation centers in the integrated transportation network under the BRI was evaluated in this paper, with the aim to reduce freight transportation costs and improve the efficiency of logistics operations. First of all, 44 node cities were selected based on the relevant national policies. Then, the transportation networks composed of railway, air, highway, and water routes were constructed. Based on the above work, the corresponding indicators were determined according to complex network theory, and the weights of these indicators were also determined based on the CRITIC approach. Then, the TOPSIS and GRA methods were combined to calculate data on the different transportation modes of each node city. Next, the proportion of the freight volume of the different transportation modes to the total freight volume in 2022 published by the Chinese government was used as the weight of each transportation mode to calculate the comprehensive score of each node city. The results showed that there are the top-ranked node cities in the integrated transportation network are all intersections of the four transportation modes, and most of them are located in inland rivers or coastal areas, indicating that inland river and coastal shipping play an important role in cargo transportation. Additionally, it also indicates that the absence of water transportation weakens the competitiveness of inland cities. Finally, based on the comprehensive consideration, Wuhan, Chongqing, Tianjin, Shanghai, Guangzhou, Lianyungang, Hefei, and Dalian were recommended as the consolidation centers of the integrated transportation network. Moreover, the GRA-TOPSIS method was found to be better than the TOPSIS through Kendall’s tau correlation coefficient and the distinction degree based on the comparison between the GRA-TOPSIS and TOPSIS methods. Additionally, this study can also provide some reference for other countries with transportation networks similar to those of China.
This paper has covered transportation modes such as rail, water, air, and highway when evaluating the consolidation center of the integrated transportation network. However, there are still some limitations that require further study. For example, more factors could be considered when choosing the candidate consolidation centers, such as industrial output value, economic scale, export scale, and the distance between cities. On the other hand, more indicators could be considered for urban population, transportation cost, the impact on urban environments, the carrying capacity of the transportation mode, and the traffic conditions of the node cities in future research. It is hoped that this result can provide some insights for the government to outline and build consolidation centers for an integrated transportation network composed of railway, air, highway, and water routes and for enterprises to choose transportation routes.

Author Contributions

Conceptualization, Q.Y. and Y.X.; Data curation, Q.Y. and Y.X.; Formal analysis, Q.Y.; Funding acquisition, G.W.; Investigation, Q.Y.; Methodology, Q.Y.; Project administration, Q.Y. and G.W.; Resources, Q.Y.; Software, Q.Y.; Supervision, G.W.; Validation, Q.Y.; Visualization, Y.X.; Writing—original draft, Q.Y.; Writing—review and editing, Q.Y. and G.W. All authors have read and agreed to the published version of the manuscript.

Funding

This research was funded by the National Natural Science Foundation of China (72071184).

Institutional Review Board Statement

Not applicable.

Informed Consent Statement

Not applicable.

Data Availability Statement

The data in this paper are partly from the references (see the corresponding descriptions) and from the following websites: https://ec.95306.cn/hycp/?active=0 (accessed on 7 February 2023); http://www.chinaports.com/ (accessed on 9 February 2023); http://www.tcport.gov.cn/tcg/cjnh/zjgkwztt.sh-tml (accessed on 9 February 2023); http://www.cecs.org.cn/zhxw/7729.html (accessed on 11 February 2023); https://xxgk.mot.gov.cn/2020/jigou/zhghs/202308/t20230825_3899151.html (accessed on 13 February 2023); https://www.mnr.gov.cn/zt/hd/chfxcr/gcdtgltl_29657/gjbtzs/201608/t20160811_2130097.html (accessed on 14 February 2023).

Acknowledgments

We express our sincere gratitude to the reviewers and editors for their constructive comments and valuable suggestions, which have greatly improved the quality of our manuscript.

Conflicts of Interest

The authors declare no conflicts of interest.

Appendix A

Table A1. List of national or regional logistics node cities.
No.City Node CityNo. City Node City
1Chongqing National logistics node city23Xining National logistics node city
2Wuhan National logistics node city24Tianjin National logistics node city
3Zhengzhou National logistics node city25Taiyuan National logistics node city
4Suzhou National logistics node city26Shenzhen National logistics node city
5Guangzhou National logistics node city27Jinan National logistics node city
6Xi’anNational logistics node city28Shanghai National logistics node city
7Hefei National logistics node city29Tangshan Regional logistics node city
8Shenyang National logistics node city30Shijiazhuang National logistics node city
9Ningbo National logistics node city31Chengdu National logistics node city
10Changsha National logistics node city32Yinchuan National logistics node city
11Lianyungang Regional logistics node city33Nanning National logistics node city
12UrumqiNational logistics node city34HohhotNational logistics node city
13Harbin National logistics node city35Hangzhou National logistics node city
14Lanzhou National logistics node city36Fuzhou National logistics node city
15Qingdao National logistics node city37Guiyang National logistics node city
16Kunming National logistics node city38Beijing National logistics node city
17XiamenNational logistics node city39Xuzhou Regional logistics node city
18Changchun National logistics node city40Quanzhou Regional logistics node city
19Nanchang National logistics node city41Jiujiang Regional logistics node city
20DalianNational logistics node city42Yantai Regional logistics node city
21Dongguan Regional logistics node city43Liuzhou Regional logistics node city
22Nanjing National logistics node city44Wuxi Regional logistics node city
Source: China Association for Engineering Construction Standardization (http://www.cecs.org.cn/zhxw/7729.html, accessed on 11 February 2023).
Table A2. List of node cities of CR Express.
No.CityNode CityNo. City Node City
1ChongqingNode city of CR Express23XiningNode city of CR Express
2WuhanNode city of CR Express24TianjinNode city of CR Express
3ZhengzhouNode city of CR Express25TaiyuanNode city of CR Express
4SuzhouNode city of CR Express26ShenzhenNode city of CR Express
5GuangzhouNode city of CR Express27JinanNode city of CR Express
6Xi’anNode city of CR Express28ShanghaiNode city of CR Express
7HefeiNode city of CR Express29TangshanNode city of CR Express
8ShenyangNode city of CR Express30ShijiazhuangNode city of CR Express
9NingboNode city of CR Express31ChengduNode city of CR Express
10ChangshaNode city of CR Express32YinchuanNode city of CR Express
11LianyungangNode city of CR Express33NanningNode city of CR Express
12UrumqiNode city of CR Express34HohhotNode city of CR Express
13HarbinNode city of CR Express35HangzhouNode city of CR Express
14SuzhouNode city of CR Express36FuzhouNode city of CR Express
15QingdaoNode city of CR Express37GuiyangNode city of CR Express
16KunmingNode city of CR Express38BeijingNode city of CR Express
17XiamenNode city of CR Express39XuzhouNode city of CR Express
18ChangchunNode city of CR Express40QuanzhouNode city of CR Express
19NanchangNode city of CR Express41JiujiangNode city of CR Express
20DalianNode city of CR Express42YantaiNode city of CR Express
21DongguanNode city of CR Express43LiuzhouNode city of CR Express
22NanjingNode city of CR Express44WuxiNode city of CR Express
Source: 95306 China Railway (https://ec.95306.cn/hycp/?active=0, accessed on 7 February 2023).
Table A3. List of node cities of water transportation.
No.CityNode TypeNo.CityNode Type
1ChongqingInland river node city15TianjinCoastal node city
2WuhanInland river node city16ShenzhenCoastal node city
3SuzhouInland river node city17ShanghaiCoastal node city
4GuangzhouCoastal node city18TangshanInland river node city
5HefeiInland river node city19NanningInland river node city
6NingboCoastal node city20HangzhouCoastal node city
7ChangshaInland river node city21FuzhouCoastal node city
8LianyungangCoastal node city22XuzhouInland river node city
9QingdaoCoastal node city23QuanzhouCoastal node city
10XiamenCoastal node city24JiujiangInland river node city
11NanchangInland river node city25YantaiCoastal node city
12DalianCoastal node city26LiuzhouInland river node city
13DongguanInland river node city27WuxiInland river node city
14NanjingInland river node city28
Source: Ministry of Transport of the People’s Republic of China (https://xxgk.mot.gov.cn/2020/jigou/zhghs/202308/t20230825_3899151.html, accessed on 13 February 2023).
Table A4. List of node cities of air transportation.
No.City Node TypeNo.CityNode Type
1ChongqingAir node city21XiningAir node city
2WuhanAir node city22TianjinAir node city
3ZhengzhouAir node city23TaiyuanAir node city
4GuangzhouAir node city24ShenzhenAir node city
5Xi’anAir node city25JinanAir node city
6HefeiAir node city26ShanghaiAir node city
7ShenyangAir node city27ShijiazhuangAir node city
8NingboAir node city28ChengduAir node city
9ChangshaAir node city29YinchuanAir node city
10LianyungangAir node city30NanningAir node city
11UrumqiAir node city31HohhotAir node city
12HarbinAir node city32HangzhouAir node city
13LanzhouAir node city33FuzhouAir node city
14QingdaoAir node city34GuiyangAir node city
15KunmingAir node city35BeijingAir node city
16XiamenAir node city36XuzhouAir node city
17ChangchunAir node city37JiujiangAir node city
18NanchangAir node city38YantaiAir node city
19DalianAir node city39LiuzhouAir node city
20NanjingAir node city40WuxiAir node city
Source: Civil Aviation Administration of China [41].
Table A5. List of provincial capitals.
No.CityNode TypeNo.CityNode Type
1ChongqingMunicipality16XiningProvincial capital
2WuhanProvincial capital17TianjinMunicipality
3ZhengzhouProvincial capital18TaiyuanProvincial capital
4GuangzhouProvincial capital19JinanProvincial capital
5Xi’anProvincial capital20ShanghaiMunicipality
6HefeiProvincial capital21ShijiazhuangProvincial capital
7ShenyangProvincial capital22ChengduProvincial capital
8ChangshaProvincial capital23YinchuanProvincial capital
9UrumqiProvincial capital24NanningProvincial capital
10HarbinProvincial capital25HohhotProvincial capital
11LanzhouProvincial capital26HangzhouProvincial capital
12KunmingProvincial capital27FuzhouProvincial capital
13ChangchunProvincial capital28GuiyangProvincial capital
14NanchangProvincial capital29BeijingMunicipality
15NanjingProvincial capital30
Source: Ministry of National Resources of the People’s Republic of China (https://www.mnr.gov.cn/zt/hd/chfxcr/gcdtgltl_29657/gjbtzs/201608/t20160811_2130097.html, accessed on 14 February 2023).

Appendix B

Table A6. Values of indicators of railway transportation network.
No.City DegreeDegree CentralityBetweenness CentralityCloseness CentralityEigenvector CentralityConstraint Coefficient Clustering CoefficientComprehensive Score of Railway NetworkRanking
1Chongqing130.302326 0.007049 0.573333 0.138340 0.147733 0.589744 0.46887826
2Wuhan170.395349 0.023898 0.623188 0.171448 0.128758 0.514706 0.48394813
3Zhengzhou260.604651 0.045035 0.716667 0.247857 0.111981 0.455385 0.4958458
4Suzhou160.372093 0.013435 0.614286 0.166533 0.131415 0.541667 0.48124017
5Guangzhou240.558140 0.055312 0.693548 0.226815 0.112617 0.445652 0.5004746
6Xi’an230.534884 0.018487 0.682540 0.241499 0.124304 0.561265 0.5067513
7Hefei140.325581 0.006573 0.573333 0.152294 0.145876 0.615385 0.47762020
8Shenyang150.348837 0.014351 0.581081 0.135663 0.151742 0.514286 0.48028818
9Ningbo150.348837 0.013626 0.597222 0.156819 0.141121 0.590476 0.48371514
10Changsha220.511628 0.028515 0.671875 0.220099 0.126504 0.523810 0.5044864
11Lianyungang90.209302 0.003035 0.551282 0.099512 0.175169 0.638889 0.45481938
12Urumqi260.604651 0.097795 0.716667 0.237736 0.108931 0.421538 0.5070322
13Harbin90.209302 0.009000 0.537500 0.074581 0.171475 0.444444 0.45494137
14Lanzhou160.372093 0.029593 0.614286 0.150493 0.135311 0.458333 0.47537722
15Qingdao230.534884 0.031140 0.682540 0.224187 0.119908 0.486166 0.4996217
16Kunming150.348837 0.011352 0.597222 0.149395 0.145318 0.571429 0.47800619
17Xiamen150.348837 0.016713 0.605634 0.146181 0.125621 0.447619 0.46656329
18Changchun100.232558 0.004698 0.544304 0.085074 0.199911 0.622222 0.45750335
19Nanchang230.534884 0.031356 0.682540 0.227865 0.123532 0.513834 0.5030005
20Dalian80.186047 0.003583 0.511905 0.065188 0.220170 0.607143 0.45825833
21Dongguan30.069767 0.000000 0.472527 0.036872 0.397977 1.000000 0.45008540
22Nanjing200.465116 0.040724 0.651515 0.184936 0.118198 0.436842 0.49275611
23Xining20.046512 0.000000 0.430000 0.022584 0.551827 1.000000 0.45753034
24Tianjin250.581395 0.065271 0.704918 0.215978 0.113469 0.403333 0.4956189
25Taiyuan140.325581 0.004659 0.573333 0.150739 0.150503 0.637363 0.47671421
26Shenzhen170.395349 0.021504 0.623188 0.169303 0.133101 0.514706 0.48405412
27Jinan190.441860 0.032107 0.641791 0.168003 0.122759 0.438596 0.48326015
28Shanghai200.465116 0.032380 0.651515 0.194503 0.115797 0.457895 0.49370110
29Tangshan60.139535 0.000929 0.472527 0.045667 0.269930 0.733333 0.45556836
30Shijiazhuang100.232558 0.001965 0.551282 0.105552 0.175782 0.666667 0.45885731
31Chengdu220.511628 0.016248 0.671875 0.232521 0.129773 0.588745 0.5098491
32Yinchuan30.069767 0.000143 0.462366 0.030719 0.384650 0.666667 0.43278642
33Nanning150.348837 0.006503 0.605634 0.163758 0.154230 0.666667 0.48166916
34Hohhot170.395349 0.044308 0.614286 0.139838 0.114371 0.345588 0.47070425
35Hangzhou120.279070 0.011596 0.544304 0.103557 0.155106 0.439394 0.46689128
36Fuzhou70.162791 0.005679 0.511905 0.054375 0.174249 0.238095 0.42889043
37Guiyang100.232558 0.001753 0.524390 0.105467 0.196212 0.755556 0.47279723
38Beijing150.348837 0.014928 0.597222 0.143288 0.133323 0.485714 0.47130524
39Xuzhou 80.186047 0.003215 0.524390 0.072299 0.194695 0.535714 0.45225439
40Quanzhou50.116279 0.002304 0.518072 0.046195 0.260505 0.600000 0.42798744
41Jiujiang50.116279 0.000123 0.483146 0.052814 0.289660 0.900000 0.45867932
42Yantai60.139535 0.000154 0.500000 0.070883 0.242848 0.866667 0.46756027
43Liuzhou80.186047 0.001409 0.524390 0.090434 0.203046 0.714286 0.46174030
44Wuxi 60.139535 0.001638 0.505882 0.049560 0.242902 0.600000 0.44017241
Table A7. Value of indicators of air transportation network.
No.City DegreeDegree CentralityBetweenness CentralityCloseness CentralityEigenvector CentralityConstraint Coefficient Clustering CoefficientComprehensive Score of
Air Network
Ranking
1Chongqing340.790698 0.022157 0.808898 0.207518 0.107610 0.691622 0.504407 12
2Wuhan270.627907 0.013749 0.702062 0.167107 0.111167 0.706553 0.507661 8
3Zhengzhou290.674419 0.011407 0.729594 0.178043 0.106081 0.677340 0.501550 14
4Suzhou00.000000 0.000000 0.000000 0.000000 0.000000 0.000000 0.000000 42
5Guangzhou260.604651 0.005700 0.689061 0.166030 0.113788 0.756923 0.498788 19
6Xi’an330.767442 0.014321 0.791687 0.201866 0.106578 0.687500 0.494832 23
7Hefei220.511628 0.003839 0.641540 0.143496 0.114765 0.761905 0.484910 32
8Shenyang260.604651 0.012175 0.689061 0.163483 0.107634 0.707692 0.500712 15
9Ningbo180.418605 0.003174 0.600150 0.118785 0.122546 0.797386 0.482786 34
10Changsha320.744186 0.025009 0.775194 0.191227 0.102516 0.645161 0.513417 4
11Lianyungang90.209302 0.001655 0.516796 0.053307 0.159907 0.555556 0.457044 38
12Urumqi220.511628 0.004388 0.641540 0.141381 0.117314 0.761905 0.489342 28
13Harbin280.651163 0.005532 0.715564 0.181860 0.112862 0.777778 0.504578 11
14Lanzhou260.604651 0.004896 0.689061 0.169007 0.111967 0.766154 0.497409 21
15Qingdao300.697674 0.023128 0.744186 0.184530 0.106520 0.694253 0.525641 1
16Kunming340.790698 0.024978 0.808898 0.207101 0.106987 0.689840 0.508767 7
17Xiamen240.558140 0.003118 0.664452 0.160177 0.116026 0.811594 0.490206 26
18Changchun200.465116 0.006532 0.620155 0.129466 0.115638 0.747368 0.489678 27
19Nanchang280.651163 0.016774 0.715564 0.171219 0.107440 0.687831 0.511331 6
20Dalian310.720930 0.024997 0.759374 0.186932 0.104769 0.666667 0.520965 2
21Dongguan00.000000 0.000000 0.000000 0.000000 0.000000 0.000000 0.000000 42
22Nanjing300.697674 0.014936 0.744186 0.182812 0.104540 0.668966 0.505921 9
23Xining100.232558 0.000190 0.524075 0.068746 0.165443 0.911111 0.482772 35
24Tianjin270.627907 0.008963 0.702062 0.170361 0.109642 0.726496 0.499631 16
25Taiyuan260.604651 0.004522 0.689061 0.169759 0.113734 0.781538 0.497693 20
26Shenzhen320.744186 0.020495 0.775194 0.195552 0.108230 0.693548 0.512061 5
27Jinan210.488372 0.002576 0.630666 0.140005 0.118750 0.809524 0.482850 33
28Shanghai330.767442 0.014887 0.791687 0.202652 0.107103 0.696970 0.496730 22
29Tangshan50.116279 0.000215 0.471004 0.030302 0.240696 0.600000 0.453250 41
30Shijiazhuang210.488372 0.007760 0.630666 0.128840 0.113221 0.685714 0.485398 30
31Chengdu320.744186 0.011791 0.775194 0.199600 0.109484 0.721774 0.499575 17
32Yinchuan200.465116 0.002538 0.620155 0.132878 0.123724 0.826316 0.485644 29
33Nanning250.581395 0.003217 0.676533 0.166405 0.117022 0.820000 0.494052 24
34Hohhot210.488372 0.001475 0.630666 0.144287 0.122168 0.871429 0.485132 31
35Hangzhou300.697674 0.014640 0.744186 0.182050 0.105157 0.668966 0.505550 10
36Fuzhou190.441860 0.004997 0.600150 0.123659 0.124252 0.795322 0.499014 18
37Guiyang270.627907 0.004663 0.702062 0.176297 0.116645 0.800570 0.504032 13
38Beijing320.744186 0.029049 0.775194 0.188191 0.103704 0.637097 0.520587 3
39Xuzhou 70.162791 0.000610 0.509716 0.042801 0.199387 0.714286 0.456481 39
40Quanzhou130.302326 0.000670 0.547196 0.089531 0.137968 0.820513 0.476879 36
41Jiujiang00.000000 0.000000 0.000000 0.000000 0.000000 0.000000 0.000000 42
42Yantai210.488372 0.007319 0.630666 0.133342 0.117115 0.747619 0.492713 25
43Liuzhou40.093023 0.000000 0.471004 0.029524 0.299941 1.000000 0.473039 37
44Wuxi 50.116279 0.000123 0.489596 0.032621 0.249509 0.800000 0.455676 40
Table A8. Values of indicators of highway transportation network.
No.City DegreeDegree
Centrality
Betweenness CentralityCloseness CentralityEigenvector CentralityConstraint Coefficient Clustering CoefficientComprehensive Score of
Highway
Network
Ranking
1Chongqing60.139535 0.0581900.3204940.3348370.3219270.4666670.5512153
2Wuhan80.186047 0.1306880.3695790.3641110.1914930.1785710.5639922
3Zhengzhou40.093023 0.0312410.3230180.1862430.2832030.1666670.48086622
4Suzhou20.046512 0.0021780.2848840.0440020.5000000.0000000.42722543
5Guangzhou60.139535 0.1629120.3662790.1167120.1666670.0000000.51048911
6Xi’an80.186047 0.1072860.3418600.3693970.2421480.2857140.5718431
7Hefei50.116279 0.0740740.3476550.2128180.2212500.1000000.49601515
8Shenyang20.046512 0.0885940.1815190.0009940.5000000.0000000.47559827
9Ningbo30.069767 0.0085760.2930230.0824290.4135800.3333330.45572931
10Changsha20.046512 0.0069430.3180100.0946050.5000000.0000000.43406640
11Lianyungang50.116279 0.1041330.3308330.1067150.2320440.1000000.50093514
12Urumqi20.046512 0.0113500.2629700.0464620.5000000.0000000.43734538
13Harbin10.023256 0.0000000.1340630.0000401.0000000.0000000.47736425
14Lanzhou50.116279 0.0745180.2930230.1838210.2615280.2000000.5156179
15Qingdao30.069767 0.0626850.2994400.0428820.3333330.0000000.4546832
16Kunming60.139535 0.0603300.3038760.2416490.2672300.2666670.5304265
17Xiamen30.069767 0.0087120.2829190.0713860.3333330.0000000.43019642
18Changchun20.046512 0.0454040.1548050.0002030.5000000.0000000.46442730
19Nanchang40.093023 0.0151100.2951310.1293520.3077260.1666670.46453329
20Dalian20.046512 0.1295680.2170540.0048480.5000000.0000000.49327116
21Dongguan00.000000 0.0000000.0000000.0000000.0000000.0000000.00000044
22Nanjing50.116279 0.0552600.3390350.1364030.2636000.2000000.48364321
23Xining10.023256 0.0000000.2266480.0361681.0000000.0000000.47700126
24Tianjin60.139535 0.1864010.3335220.0724440.2136110.0666670.5424254
25Taiyuan40.093023 0.0299040.3230180.1435960.3017580.1666670.47207228
26Shenzhen30.069767 0.0409470.3180100.0665400.3333330.0000000.44982936
27Jinan50.116279 0.0990760.3390350.0875770.2000000.0000000.47878524
28Shanghai60.139535 0.1142350.3567240.1738840.2505560.2000000.518568
29Tangshan20.046512 0.0000000.2829190.0284320.7002781.0000000.4879118
30Shijiazhuang40.093023 0.0283800.3107820.0963080.2500000.0000000.44936937
31Chengdu50.116279 0.0186440.3131550.3046160.3759720.6000000.5246076
32Yinchuan40.093023 0.0305640.3084460.1473970.3521090.3333330.48598519
33Nanning40.093023 0.0736430.3155640.1288030.2951390.1666670.49317917
34Hohhot30.069767 0.0482090.2909450.0523210.3333330.0000000.45353434
35Hangzhou60.139535 0.0670500.3204940.1500830.2555090.2000000.5074112
36Fuzhou40.093023 0.0304080.2972700.0949700.2500000.0000000.45363133
37Guiyang60.139535 0.0415960.3084460.2382010.2672300.2666670.5224087
38Beijing50.116279 0.1219830.3418600.0720570.2644440.1000000.50477213
39Xuzhou 40.093023 0.0344480.3230180.1167470.2500000.0000000.45253735
40Quanzhou30.069767 0.0111850.2771840.0580740.3333330.0000000.43058241
41Jiujiang40.093023 0.0296740.3084460.1741680.3077260.1666670.48465420
42Yantai30.069767 0.1700070.2663850.0236460.3333330.0000000.51168710
43Liuzhou10.023256 0.0000000.2330870.0475461.0000000.0000000.48038523
44Wuxi 30.069767 0.0255390.3038760.0497510.3333330.0000000.43734339
Table A9. Values of indicators of water transportation network.
No.City DegreeDegree CentralityBetweenness CentralityCloseness CentralityEigenvector CentralityConstraint Coefficient Clustering CoefficientComprehensive Score of Water NetworkRanking
1Chongqing60.230769 0.001055 0.509804 0.1214520.3355750.8666670.51533813
2Wuhan80.3076920.0086150.5306120.1339280.3545900.6071430.50042423
3Zhengzhou00.0000000.0000000.0000000.0000000.0000000.000000028
4Suzhou200.7692310.2184690.7878790.3209460.1809920.3263160.5329965
5Guangzhou170.6538460.2521880.7428570.2978610.1859350.4044120.5470041
6Xi’an00.0000000.0000000.0000000.0000000.0000000.000000028
7Hefei80.3076920.0126590.5777780.1796100.2586440.7142860.50525821
8Shenyang00.0000000.0000000.0000000.0000000.0000000.000000028
9Ningbo130.5000000.0243750.6500000.2881510.1985670.6666670.5272357
10Changsha20.0769230.0000000.4727270.0595310.5483311.0000000.51165915
11Lianyungang90.3461540.0143490.5909090.2067430.2276390.6944440.50531820
12Urumqi00.0000000.0000000.0000000.0000000.0000000.000000028
13Harbin00.0000000.0000000.0000000.0000000.0000000.000000028
14Lanzhou00.0000000.0000000.0000000.0000000.0000000.000000028
15Qingdao110.4230770.0332930.6190480.2326600.3534920.6363640.5384853
16Kunming00.0000000.0000000.0000000.0000000.0000000.000000028
17Xiamen110.4230770.0133710.6190480.2472890.2639670.7090910.52452810
18Changchun00.0000000.0000000.0000000.0000000.0000000.000000028
19Nanchang40.1538460.0000000.4905660.0748210.4407071.0000000.52268511
20Dalian110.4230770.0113880.6190480.2458560.2354840.7272730.51890312
21Dongguan20.0769230.0000000.4482760.0484220.5643541.0000000.50940918
22Nanjing120.4615380.0384000.6046510.2269230.2885400.5151520.5295696
23Xining00.0000000.0000000.0000000.0000000.0000000.000000028
24Tianjin150.5769230.0546790.6842110.3020660.2139600.5428570.5373364
25Taiyuan00.0000000.0000000.0000000.0000000.0000000.000000028
26Shenzhen90.3461540.0011660.5909090.2256550.2529240.9166670.5245699
27Jinan00.0000000.0000000.0000000.0000000.0000000.000000028
28Shanghai180.6923080.1165580.7428570.3312770.2279440.4248370.5425562
29Tangshan50.1923080.0028970.5416670.1260450.2982550.8000000.50427822
30Shijiazhuang00.0000000.0000000.0000000.0000000.0000000.000000028
31Chengdu00.0000000.0000000.0000000.0000000.0000000.000000028
32Yinchuan00.0000000.0000000.0000000.0000000.0000000.000000028
33Nanning20.0769230.0769230.4482760.0274150.7196720.0000000.44618127
34Hohhot00.0000000.0000000.0000000.0000000.0000000.000000028
35Hangzhou30.1153850.0000000.4905660.0871010.3976551.0000000.51429614
36Fuzhou80.3076920.0003420.5777780.2061960.2617190.9642860.5248398
37Guiyang00.0000000.0000000.0000000.0000000.0000000.000000028
38Beijing00.0000000.0000000.0000000.0000000.0000000.000000028
39Xuzhou 60.2307690.0072380.5200000.1174710.3398700.5333330.48750524
40Quanzhou30.1153850.0000000.5200000.0790510.3979191.0000000.51079416
41Jiujiang70.2692310.0055930.5306120.1379520.3829260.7142860.50753319
42Yantai60.2307690.0021540.5098040.1288080.3053610.8000000.51031817
43Liuzhou10.0384620.0000000.3132530.0025021.0000000.0000000.44793126
44Wuxi 30.1153850.0027470.5200000.0672020.4208110.6666670.48260925
Note: 0 means that there was no participation in the ranking.

References

  1. Ministry of Commerce People’s Republic of China (MCPRC). Available online: http://tradeinservices.mofcom.gov.cn/article/ydyl/sedly/ysfw/202301/144654.html (accessed on 10 January 2023).
  2. Yidaiyilu.gov.cn. Available online: https://www.yidaiyilu.gov.cn/xwzx/gnxw/281310.htm (accessed on 10 January 2023).
  3. Ma, Y.T.; Shi, X.L.; Qiu, Y. Hierarchical Multimodal Hub Location with Time Restriction for China Railway (CR) Express Network. IEEE Access 2020, 8, 61395–61404. [Google Scholar] [CrossRef]
  4. Wei, H.R.; Wu, F. Formation of Coordinated Alliance for China Railway Express Platforms Considering Logistics Cost Sharing. Transp. Res. Rec. 2023, 3, 6489296. [Google Scholar] [CrossRef]
  5. Chen, G.; Cheung, W.; Chu, S.C.; Xu, L. Transshipment hub selection from a shipper’s and freight forwarder’s perspective. Expert Syst. Appl. 2017, 83, 396–404. [Google Scholar] [CrossRef]
  6. Zhang, X.F.; Lu, J.; Peng, Y. Decision framework for location and selection of container multimodal hubs: A case in China under the Belt and Road Initiative. J. Ind. Manag. Optim. 2022, 5, 2163–2190. [Google Scholar] [CrossRef]
  7. Zhang, X.; Zhang, W.; Lee, P.T.W. Importance rankings of nodes in the China Railway Express network under the Belt and Road Initiative. Transp. Res. Part A 2020, 139, 134–147. [Google Scholar] [CrossRef]
  8. Li, C.Z.; Wang, J.; Wang, H.J.; Jin, X.; Du, L.J. Intermodal transportation hub location optimization with governments subsidies under the Belt and Road Initiative. Ocean Coast. Manag. 2023, 231, 106414. [Google Scholar] [CrossRef]
  9. Wan, C.; Zhao, Y.; Zhang, D.; Yip, T.L. Identifying important ports in maritime container shipping networks along the Maritime Silk Road. Ocean Coast. Manag. 2021, 211, 105738. [Google Scholar] [CrossRef]
  10. Lee, P.T.W.; Hu, Z.H.; Lee, S.; Feng, X.; Notteboom, T. Strategic locations for logistics distribution centers along the Belt and Road: Explorative analysis and research agenda. Transp. Policy 2022, 116, 24–47. [Google Scholar] [CrossRef]
  11. Li, D.Q.; Zhao, L.J.; Wang, C.; Sun, W.J.; Xue, J. Selection of China’s imported grain distribution centers in the context of the Belt and Road initiative. Transp. Res. Part E 2018, 120, 16–34. [Google Scholar] [CrossRef]
  12. Aljohani, K.; Thompson, R.G. A multi-criteria spatial evaluation framework to optimise the siting of freight consolidation facilities in inner-city areas. Transp. Res. Part A Policy Pract. 2020, 138, 51–69. [Google Scholar] [CrossRef]
  13. Muerza, V.; Milenkovic, M.; Larrodé, E.; Bojovic, N. Selection of an international distribution center location: A comparison between stand-alone ANP and DEMATEL-ANP applications. Res. Transp. Bus. Manag. 2024, 56, 101135. [Google Scholar] [CrossRef]
  14. Civil Aviation Administration of China (CAAC). Available online: http://www.caac.gov.cn/XXGK/XXGK/ZCFBJD/202205/t20220506_213121.html (accessed on 8 May 2023).
  15. Zhou, Y.M.; Kundu, T.; Goh, M.; Sheu, J.B. Multimodal transportation network centrality analysis for Belt and Road Initiative. Transp. Res. Part E Logist. Transp. Rev. 2021, 149, 102292. [Google Scholar] [CrossRef]
  16. Derudder, B.; Liu, X.; Kunaka, C. Connectivity along Overland Corridors of the Belt and Road Initiative; World Bank: Washington, DC, USA, 2018. [Google Scholar]
  17. An, F.; Gao, X.Y.; Guan, J.H.; Jiang, M.H.; Liu, Q. Detecting the significant nodes in two-layer flow networks: An interlayer non-failure cascading effect perspective. Eur. Phys. J. Spec. Top. 2019, 228, 2475–2490. [Google Scholar] [CrossRef]
  18. Wang, L.; Zheng, S.; Wang, Y.; Wang, L. Identification of critical nodes in multimodal transportation network. Phys. A-Stat. Mech. Its Appl. 2021, 580, 126170. [Google Scholar] [CrossRef]
  19. Li, Z.; Tang, J.; Zhao, C.; Gao, F. Improved centrality measure based on the adapted PageRank algorithm for urban transportation multiplex networks. Chaos Solitons Fractals 2023, 167, 112998. [Google Scholar] [CrossRef]
  20. Meng, Y.; Tian, X.; Li, Z.; Zhou, W.; Zhou, Z.; Zhong, M. Exploring node importance evolution of weighted complex networks in urban rail transit. Phys. A-Stat. Mech. Its Appl. 2020, 558, 124925. [Google Scholar] [CrossRef]
  21. De Bona, A.A.; de Oliveira Rosa, M.; Fonseca, K.V.O.; Lüders, R. A reduced model for complex network analysis of public transportation systems. Phys. A-Stat. Mech. Its Appl. 2021, 567, 125715. [Google Scholar] [CrossRef]
  22. Wang, L.N.; Wang, K.; Shen, J.L. Weighted complex networks in urban public transportation: Modeling and testing. Phys. A-Stat. Mech. Its Appl. 2020, 545, 123498. [Google Scholar] [CrossRef]
  23. Sun, W.; Zhao, L.; Wang, C.; Li, D.; Xue, J. Selection of consolidation centers for China Railway Express. Int. J. Logist. Res. Appl. 2020, 23, 417–442. [Google Scholar] [CrossRef]
  24. Zhang, F.; Liu, Y.; Du, L.; Goerlandt, F.; Sui, Z.; Wen, Y. A rule-based maritime traffic situation complex network approach for enhancing situation awareness of vessel traffic service operators. Ocean Eng. 2023, 284, 115203. [Google Scholar] [CrossRef]
  25. Zhang, X.; Chen, B. Study on node importance evaluation of the high-speed passenger traffic complex network based on the Structural Hole Theory. Open Phys. 2017, 15, 1–11. [Google Scholar] [CrossRef]
  26. Belkoura, S.; Cook, A.; Peña, J.M.; Zanin, M. On the multi-dimensionality and sampling of air transport networks. Transp. Res. Part E Logist. Transp. Rev. 2016, 94, 95–109. [Google Scholar] [CrossRef]
  27. Zhao, L.; Zhao, Y.; Hu, Q.; Li, H.; Stoeter, J. Evaluation of consolidation center cargo capacity and locations for China railway express. Transp. Res. Part E 2018, 117, 58–81. [Google Scholar] [CrossRef]
  28. Sun, Z.; Wang, T.; Xiao, X.; Zhang, Q.; Guo, H. Research on the Measurement of Logistics Capability of Core Cities along “the Belt and Road” in China. Adv. Math. Phys. 2022, 2022, 2223212. [Google Scholar] [CrossRef]
  29. Feng, F.L.; Cai, M.X.; Jia, J. Key node identification of China Railway Express transportation network based on multilayer complex network. J. Transp. Syst. Eng. Inf. Technol. 2022, 12, 191–200. [Google Scholar]
  30. Yin, C.; Zhang, Z.; Zhang, X.; Chen, J.; Tao, X.; Yang, L. Hub seaport multimodal freight transport network design: Perspective of regional integration development. Ocean Coast. Manag. 2023, 242, 106675. [Google Scholar] [CrossRef]
  31. Van Heeswijk, W.; Larsen, R.; Larsen, A. An urban consolidation center in the city of Copenhagen: A simulation study. Int. J. Sustain. Transp. 2019, 9, 675–691. [Google Scholar] [CrossRef]
  32. Cheng, Z.; Zhao, L.; Wang, G.; Li, H.; Hu, Q. Selection of consolidation center locations for China railway express to reduce greenhouse gas emission. J. Clean. Prod. 2021, 305, 126872. [Google Scholar] [CrossRef]
  33. Zhang, W.; Zhang, Q.P.; Karimi, H. Seeking the Important Nodes of Complex Networks in Product R&D Team Based on Fuzzy AHP and TOPSIS. Math. Probl. Eng. 2013, 2013, 327592. [Google Scholar]
  34. National Development and Reform Commission (NDRC). China National Highway Network Planning 2013–2030. Available online: http://csl.chinawuliu.com.cn/upload/files/635349288757214896.pdf (accessed on 8 June 2023).
  35. Wasserman, S.; Faust, K. Social Network Analysis: Method and Applications; Cambridge University Press: New York, NY, USA, 1994. [Google Scholar]
  36. Burt, R.S. Structural holes and good ideas. Am. J. Sociol. 2004, 110, 349–399. [Google Scholar] [CrossRef]
  37. Diakoulaki, D.; Mavrotas, G.; Papayannakis, L. Determining Objective Weights in Multiple Criteria Problems: The CRITIC Method. Comput. Oper. Res. 1995, 22, 763–770. [Google Scholar] [CrossRef]
  38. Croux, C.; Dehon, C. Influence functions of the Spearman and Kendall correlation measures. Stat. Methods Appl. 2010, 19, 497–515. [Google Scholar] [CrossRef]
  39. Liu, D.; Liu, C.; Fu, Q.; Li, T.; Imran, K.M.; Cui, S.; Abrar, F.M. ELM evaluation model of regional groundwater quality based on the crow search algorithm. Ecol. Indic. 2017, 81, 302–314. [Google Scholar] [CrossRef]
  40. National Bureau of Statistic (NBS). Available online: http://www.stats.gov.cn/xxgk/sjfb/zxfb2020/202302/t20230228_1919001.html (accessed on 20 July 2023).
  41. Civil Aviation Administration of China (CAAC). Catalogue of Domestic Airlines Implementing Market Adjusted Prices [EB/OL]. Available online: http://www.caac.gov.cn/XXGK/XXGK/ZFGW/201911/P020191206554926012537.pdf (accessed on 20 July 2023).
Figure 1. Map of candidate consolidation centers.
Applsci 14 05637 g001
Figure 2. Map of integrated transportation nodes and links.
Applsci 14 05637 g002
Figure 3. Topological map of the railway transportation network.
Applsci 14 05637 g003
Figure 4. Topological map of the expressway transportation network.
Applsci 14 05637 g004
Figure 5. Topological map of the air transportation network.
Applsci 14 05637 g005
Figure 6. Topological map of the water transportation network.
Applsci 14 05637 g006
Figure 7. Topological map of location of consolidation centers.
Applsci 14 05637 g007
Table 1. Candidate consolidation centers.
NumberCity NumberCity NumberCity NumberCity
1Chongqing12Urumqi23Xining 34Hohhot
2Wuhan 13Harbin 24Tianjin 35Hangzhou
3Zhengzhou 14Lanzhou 25Taiyuan 36Fuzhou
4Suzhou 15Qingdao 26Shenzhen 37Guiyang
5Guangzhou 16Kunming 27Jinan 38Beijing
6Xi’an17Xiamen28Shanghai 39Xuzhou
7Hefei 18Changchun 29Tangshan 40Quanzhou
8Shenyang 19Nanchang 30Shijiazhuang 41Jiujiang
9Ningbo 20Dalian31Chengdu 42Yantai
10Changsha 21Dongguan 32Yinchuan 43Liuzhou
11Lianyungang 22Nanjing 33Nanning 44Wuxi
Table 2. Weights of indicators of railway, highway, air, and water networks.
WeightDegree
Centrality
Betweenness
Centrality
Closeness
Centrality
Eigenvector
Centrality
Constraint
Coefficient
Clustering Coefficient
Mode
Railway0.19390.13630.20290.19940.13350.1339
Highway0.15330.19790.17130.16810.18110.1283
Air0.17460.17500.20920.17650.14890.1158
Water0.16390.15040.16130.17710.15610.1911
Table 3. Comprehensive score and ranking of each node city.
NumberCity x r x a x h x w C s Ranking
1Chongqing0.4688780.5044070.5512150.5153380.5371272
2Wuhan0.4839480.5076610.5639920.5004240.5454471
3Zhengzhou0.4958450.501550.48086600.40108434
4Suzhou0.48124000.4272250.5329960.45030624
5Guangzhou0.5004740.4987880.5104890.5470040.5156815
6Xi’an0.5067510.4948320.57184300.46887919
7Hefei0.477620.484910.4960150.5052580.4957839
8Shenyang0.4802880.5007120.47559800.39570537
9Ningbo0.4837150.4827860.4557290.5272350.47054018
10Changsha0.5044860.5134170.4340660.5116590.45404523
11Lianyungang0.4548190.4570440.5009350.5053180.4971788
12Urumqi0.5070320.4893420.43734500.37025044
13Harbin0.4549410.5045780.47736400.39453138
14Lanzhou0.4753770.4974090.51561700.42458032
15Qingdao0.4996210.5256410.4546800.5384850.47322616
16Kunming0.4780060.5087670.53042600.43570028
17Xiamen0.4665630.4902060.4301960.5245280.44968425
18Changchun0.4575030.4896780.46442700.38529041
19Nanchang0.5030.5113310.4645330.5226850.47811115
20Dalian0.4582580.5209650.4932710.5189030.49419410
21Dongguan0.45008500.4165300.5094090.43544129
22Nanjing0.4927560.5059210.4836430.5295690.49229311
23Xining0.457530.4827720.47700100.39451539
24Tianjin0.4956180.4996310.5424250.5373360.5370003
25Taiyuan0.4767140.4976930.47207200.39277040
26Shenzhen0.4840540.5120610.4498290.5245690.46579820
27Jinan0.483260.482850.47878500.39833036
28Shanghai0.4937010.496730.5185600.5425560.5201904
29Tangshan0.4555680.453250.4879100.5042780.48752112
30Shijiazhuang0.4588570.4853980.44936900.37437643
31Chengdu0.5098490.4995750.52460700.43453330
32Yinchuan0.4327860.4856440.48598500.39869435
33Nanning0.4816690.4940520.4931790.4461810.48411714
34Hohhot0.4707040.4851320.45353400.37858542
35Hangzhou0.4668910.505550.5074100.5142960.5046267
36Fuzhou0.428890.4990140.4536310.5248390.46325721
37Guiyang0.4727970.5040320.52240800.42931131
38Beijing0.4713050.5205870.50477200.41623133
39Xuzhou0.4522540.4564810.4525370.4875050.45841822
40Quanzhou0.4279870.4768790.4305820.5107940.44388727
41Jiujiang0.45867900.4846540.5075330.48593113
42Yantai0.467560.4927130.5116870.5103180.5071556
43Liuzhou0.461740.4730390.4803850.4479310.47308517
44Wuxi0.4401720.4556760.4373430.4826090.44526926
Table 4. Ranking results for different methods.
NumberCityGRA–TOPSISTOPSIS
ValueRankingValueRanking
1Chongqing0.53712720.4570123
2Wuhan0.54544710.4864521
3Zhengzhou0.401084340.2750937
4Suzhou0.450306240.30601929
5Guangzhou0.51568150.4530444
6Xi’an0.468879190.4287856
7Hefei0.49578390.38036511
8Shenyang0.395705370.30345230
9Ningbo0.47054180.32088624
10Changsha0.454045230.30694528
11Lianyungang0.49717880.37403213
12Urumqi0.37025440.2391242
13Harbin0.394531380.3230722
14Lanzhou0.42458320.31902825
15Qingdao0.473226160.32100623
16Kunming0.4357280.34328717
17Xiamen0.449684250.28471335
18Changchun0.38529410.27562636
19Nanchang0.478111150.32926520
20Dalian0.494194100.404388
21Dongguan0.435441290.35022916
22Nanjing0.492293110.35633415
23Xining0.394515390.31902326
24Tianjin0.53730.4659462
25Taiyuan0.39277400.25240441
26Shenzhen0.465798200.29930631
27Jinan0.39833360.29031333
28Shanghai0.5201940.4378885
29Tangshan0.487521120.3863999
30Shijiazhuang0.374376430.21998544
31Chengdu0.434533300.36185714
32Yinchuan0.398694350.27135739
33Nanning0.484117140.34007418
34Hohhot0.378585420.22579243
35Hangzhou0.50462670.38172810
36Fuzhou0.463257210.2989232
37Guiyang0.429311310.3284321
38Beijing0.416231330.31466627
39Xuzhou0.458418220.28631734
40Quanzhou0.443887270.27430838
41Jiujiang0.485931130.33771919
42Yantai0.50715560.4195877
43Liuzhou0.473085170.37851512
44Wuxi0.445269260.26084840
Table 5. KTC of GRA-TOPSIS and TOPSIS.
MethodGRA-TOPSISTOPSIS
KTC10.661734
Table 6. Distinction degree of GRA-TOPSIS and TOPSIS.
MethodGRA-TOPSISTOPSIS
Distinction degree1.0757461.075126
Disclaimer/Publisher’s Note: The statements, opinions and data contained in all publications are solely those of the individual author(s) and contributor(s) and not of MDPI and/or the editor(s). MDPI and/or the editor(s) disclaim responsibility for any injury to people or property resulting from any ideas, methods, instructions or products referred to in the content.

