Article

Study on the Influence of Some Ventilation Parameters on Dust Dispersion in Heading Face Coal Mine Using CFD Numerical Model

by
Quang Van Nguyen
1,
Thinh Van Nguyen
1 and
Phong Duyen Nguyen
2,*
1
Department of Underground Mining, Hanoi University of Mining and Geology, 18 Vien Street, Hanoi 100000, Vietnam
2
Department of Underground Construction and Mining, Hanoi University of Mining and Geology, Hanoi 100000, Vietnam
*
Author to whom correspondence should be addressed.
Appl. Sci. 2024, 14(13), 5643; https://doi.org/10.3390/app14135643
Submission received: 28 April 2024 / Revised: 21 June 2024 / Accepted: 24 June 2024 / Published: 28 June 2024

Abstract

:
Coal dust is one of the environmental factors that seriously affect the health of workers as well as the mining equipment in underground coal mines. At present, coal dust is commonly generated during drilling, blasting, excavation, and transportation processes in mining operations. During mining blasting processes, coal dust is generated with varying particle sizes and high concentration levels. High concentrations of dust will affect mining operations and increase the ventilation time required for mining faces. In addition, coal dust exists in suspended form in the roadway and is harmful to human health, especially fine dust particles that have a negative impact on work efficiency. To improve ventilation efficiency and eliminate coal dust, this article presents a CFD-DPM numerical modeling method that integrates a DEM collision model based on the finite element method to analyze the motion characteristics of airflow and dust particles in the mine tunnel, while considering collisions between particles and between particles and walls. The article analyzes the distribution of wind speed, the dispersion of dust in the space around the roadway, and dust concentrations at distances of 1 m, 3 m, and 6 m from the working personnel and at a position 1.5 m above the roadway floor, corresponding to the breathing zone of the workers, with varying parameters such as velocity and duct position. The results indicate that with a wind velocity of V = 18 m/s and an air duct height h = 3.0 m, the best dust reduction results are achieved, and they provide theoretical guidance for selecting and optimizing ventilation parameters in dust control.

1. Introduction

Coal mining is one of the important industries and plays a significant role in the national economy of Vietnam. According to the development plan for the coal industry, coal production is projected to be 51–54 million tons by 2025 and 55–57 million tons by 2030. Consequently, increasing coal production has led to significant challenges in environmental and occupational health aspects due to the expansion of large-scale mining operations. Vietnamese underground coal mines commonly employ the drilling and blasting method for roadway construction as this approach is well-suited to geological conditions and offers cost savings. However, a high concentration of dust is generated during the blasting process. The high concentration of coal dust is the primary cause that not only affects the progress of tunnel construction and safety but also poses a serious threat to the workforce. Coal dust arises during the drilling, blasting, and transportation phases in the construction of tunnels. The majority of dust emissions result from the blasting process, with dust particle sizes varying widely and differently, leading to air pollution within the mining environment and posing a significant impact on the health of the workers. Furthermore, coal dust also exists in the form of suspended particulates in the mine air, comprising fine particles, especially those with sizes smaller than 10 µm. These particles have the potential to penetrate deep into the respiratory tract and come into contact with the lungs, leading to respiratory issues and other health-related concerns. Workers operating in prolonged mining environments are at risk of contracting respiratory diseases, such as lung inflammation, due to exposure to dust. Currently, the cases of pneumoconiosis among underground coal miners in the Quang Ninh region comprise 1228 individuals, and it is projected to rise to over 1400 individuals in the future without effective dust control measures. Hence, researching the ventilation parameters that influence the dispersion pattern of dust during blasting in tunnels and controlling the elimination of coal dust is highly essential. In Vietnam, several studies have been conducted: The authors in [1,2] conducted research and designed a dust control system using an air and water mixing box to generate fine water droplets. In [3], the authors proposed a solution involving mist spraying to protect laborers. However, the dust dispersion pattern in tunnels has not been determined; thus, the effectiveness of the dust reduction solution has not been high. In recent years, Computational Fluid Dynamics (CFD) has become a pivotal technology in simulating and analyzing dust dispersion in mining environments. CFD modeling allows for the detailed study of air and dust particle movements within tunnels. Notable international research includes analyses of dust concentration distribution and particle sizes at mechanized coal mining faces, numerical simulations of airflow patterns, and the dust distribution in tunnel excavations using solid–gas flow equations such as those in Geng [4]. Using Computational Fluid Dynamics (CFD) to study the movement patterns of dust in coal mines, the authors in [5] analyzed particle sizes and the distribution of dust concentration at the fully mechanized longwall. Kanaoka conducted numerical simulations on airflow patterns and the distribution of dust concentration within constructed tunnels [6]. Rao conducted simulations of airflow patterns within tunnels with long blind headings using three-dimensional (3D) numerical simulation technology, obtaining a preliminary correlation between airflow patterns and dust movement [7]. Jiang simplified the similarity criteria in the simulated tunnel excavation process using an approximate modeling method employing the two-phase solid–gas flow equations and subsequently determined the dust distribution pattern during excavation through experiments [8]. Some studies suggest that dust distribution is influenced by various factors, such as dust concentration [9,10], particle size [11], and moisture content. Hu conducted a similar investigation with different velocities [12]. Guoliang Zhang simulated the airflow-dust migration of Cuizhuang coal mine based on FLUENT [13]. Sa [14], using the theory of gas–solid two-phase flow through simulation using Fluent software, studied the change in dust concentration after blasting and thereby derived reasonable ventilation parameters. In summary, the primary focus of these studies has been on simulating dust within the mechanized construction of tunnels, with limited tunnel space in the modeling based on CFD technology. However, during the simulation, the forces acting on dust particles are simplified, and the processes of particle-to-particle and particle-to-wall collisions are rarely taken into account. In the context of mining conditions in Vietnam, predominantly involving drilling and blasting operations, this paper presents a CFD modeling method based on the finite element approach to analyze the movement of air and dust particles within mine tunnels. Particle collisions have been considered, including particle-to-wall collisions and the forces acting on particle motion, which have been established in the DEM model. These collisions are integrated into the DPM. This method allows for the study of factors influencing the distribution of coal dust concentration in the mining environment, including wind velocities with four velocity models of the air duct (V = 9 m/s, V = 12 m/s, V = 15 m/s, V = 18 m/s) and the placement of ventilation outlets at different heights (with heights h = 1.1 m, 1.4 m, 1.7 m, 2.3 m, 2.7 m, 3.0 m). The findings from this research will help determine the impact of ventilation parameters on dust concentration within tunnels and the dispersion of dust over time, thereby supporting management efforts to mitigate dust and protect the health of workers.

2. Modeling Geometry and Meshing

The simulation was based on the basic parameters of the roadway level −250 seam L7–2 of Mong Duong coal mine, Quang Ninh province: the length of roadway L = 50 m; the height of the roadway y = 3.5 m, the width of the roadway b = 4.5 m). The −250-level transport road uses the forced ventilation method with the following parameters (ϕduct = 0.6 m, hduct = 2.3, V = 9 m/s), the distance from the duct opening to the face is 8 m, the humidity of air is 85%, the air pressure in the tunnel is 100,678 (Pa) measured on-site. The air in the tunnel was treated as an incompressible fluid. Dust used in this study is coal-high-value dust. The transportation equipment employs scraper conveyors, which are positioned close to the ground and have minimal influence on the simulation outcomes. As a result, the model has been simplified by excluding the conveying equipment and the tunnel parameters explained above. Given that the largest source of dust emission is from blasting, other sources of dust have not been considered. The focus is mainly on the dust generated during the blasting process. Dust measurements are obtained using measuring devices (such as particle counting and dust concentration kanomax). Regarding measurement results, the particle diameter is 1 × 10⁻⁴–1 × 10⁻⁶ m. From that, the article builds six positions of duct models (height of duct y = 1.1 m; 1.4 m, 1.7 m; 2.3 m; 2.7 m; 3.0 m). The positions corresponding to P1–P7 shown in Figure 1 have the following coordinates: (P1(0.3; 1.1); P2(0.3; 1.4); P3(0.35; 1.7); P4(0.48; 2.0); P5(0.61; 2.3); P6(1; 2.7); P7(1.4; 3)). The wind speed is determined by the airflow demand supplied to the tunnel. After calculating, we find the airflow ranges from 150 to 306 m3/min, corresponding to wind speeds from 9 to 18 m/s. Therefore, the study simulates four velocity models of the air duct (V = 9 m/s; 12 m/s; 15 m/s; 18 m/s). Based on the parameters, a 3D geometric model was built using ANSYS Fluent 20 R1 software with corresponding dimensions as mentioned above. After completing the construction of the 3D geometric model, we will proceed with meshing with a total of 315,915 cells, with an average mesh quality of 0.876. The number of boundary layers is 2.
The position of the duct is arranged in Figure 1.

3. Numerical Model

3.1. Mathematical Model

The mathematical model for simulating gas and dust flow (two-phase gas–solid) in ANSYS 2020R1 software includes the Discrete Phase Model (DPM), the Eulerian model. The Discrete Phase Model belongs to the Euler–Lagrange method. It requires the particle volume to be not too large [15]. By computing the velocity and turbulent kinetic energy of the continuous flow field, we can observe the trajectories of particles. Currently, the study of particle trajectories is generated from the blasting process in the heading face in continuous flow using the DPM model of the Euler–Lagrange method [16]. The Discrete Phase Model (DPM)-Discrete Element Model (DEM) was constructed based on the gas–solid two-phase flow theory, and the dust pollution characteristics of the shuttle transfer stage were numerically simulated [17].
In this paper, the Euler–Lagrange model is utilized to calculate the flow field and the trajectory of dust particles within the tunnel. The Euler–Lagrange method considers the fluid as a continuous phase and applies Newton’s second law to track the fluid stream.
The variation characteristics of dust concentration and particle size distribution are simulated and analyzed using DPM. A pressure-based solver is utilized, and wind velocity and turbulent kinetic energy of the flow are computed using the SIMPLE algorithm.
The fundamental governing equations for the particle trajectory, flow field, and dust movement in the field are as follows [18].
The gas phase continuous equation in the two-phase solid–gas flow is as follows:
p t + ( p u i ) x i = 0            
The conservation equation of momentum is as follows:
( p u i ) t + ( p u i u j ) x j = T i j x j p x i + p g i F i
The equation k is as follows:
( ρ k ) t + ( ρ k u i ) x i = x j [ μ + μ t σ k ] + G k ρ ε
The equation ε is as follows:
( ρ ε ) t + ( ρ ε u i ) x i = x j [ μ + μ t σ ε ] + c 1 ε ε k G k C 2 ε ρ ε 2 k
where
G k = μ t [ u i x j + u j x i ] u i x j , μ t = ρ C μ k 2 ε
Here, t represents time, s; ρ is the gas density kg/m3; Tij is the Reynolds stress tensor; ցj is the acceleration of gravity, kg/m2; Fi is the particle flow resistance, N; xi and xj are the coordinates in the X, Y directions; ui and uj are the velocities in the X, Y directions (m/s); k is the turbulent kinetic energy, m2/s2; μ is the laminar viscosity coefficient; μt is the viscosity coefficient for turbulent flow, Pa.s; Gk is the rate of turbulent energy production caused by the mean velocity gradient, kg/(s3.m); ε is the dissipation velocity of the turbulent kinetic energy, m2/s3; C1ε, C2ε, Cμ, σk, and σε are empirical constants (C1ε = 1.44, C2ε = 1.92, Cμ = 0.09, σε = 1.3, and σk = 1.0).
Equation for particle phase control:
Equation for controlling the motion of dust particles: During the calculation of the trajectory of blasting dust particles in the tunnel. The governing equation for the motion of dust particles. During the calculation of the trajectory of dust particles in the tunnel explosion, this model is based on the Euler–Lagrange method, which treats air and dust as the coupling of two continuous phases of the flow and tracks the movement of dust inside the tunnel over time by solving the differential equation. Specifically, air is defined as the primary phase, and dust particles are defined as the secondary phase. The equation of motion for the dust particles is [19] as follows:
d u p d t = F D ( u u p ) + g x ( ρ p ρ ) ρ p + F
F D = 0.75 C D ρ | u p u | ρ p d p
where FD(uup) is the drag force on the particle per unit mass, N; CD is the drag force coefficent; u is the fluid phase velocity, m/s; up is the particle velocity, m/s; ρp is the particle density, kg/m3; dp is the particle diameter m; and F—the addition forces, Including particle–particle collisions, particle–wall collisions, Saffman force, and Magnus force, the DPM model in Fluent integrates DEM-collision to account for the impact interactions between particles and with walls. The contact forces between particles describe direct interactions among particles, particle–surface interactions, and torque forces. The contact force between particles i and j, denoted as Fn, ij, is expressed by the formula [20].
F n , i j = 4 3 Y * R * δ n , i j 2 3 F n , i j d
F n , i j d = 5 6 ln e ln 2 e + π 2 S n , i j m * v n
S n , i j = 2 Y * R * δ n , i j
where Fn,ij—normal force between particles; Y* is the equivalent Young’s modulus; m* is the particle mass; R* is the equivalent radius; δn,ij is the normal overlap; Sn,ij is the normal stiffness; Vn is the normal component of the relative velocity; and e is the coefficient of restitution.
The tangential force Ft,ij depends on the tangential overlap, δt,ij, and the tangential stiffness St,ij, and is limited by Coulomb friction μs Fn,ij, where μs is the coefficient of static friction and G* is the shear modulus.
F t , i j = δ t , i j S t , i j F t , i j d
F t , i j d = 2 5 6 ln e 1 n 2 e + π 2 S t , i j m * v t
S n , i j = 8 G * R * δ n , i j
The torques generated by the forces can be written as follows:
T t , i j = L i j n i j F t , i j
T t , i j = μ T L i j | F n , i j | ω i j | ω i j |
where Lij is the distance from the center of particle i to the contact plane with particle j, nij represents the normal unit vector between two contacted particles, and ωij is the angular velocity vector of the object at the contact point.
The equation governing the trajectory of the particle is [18] as follows:
d u p d t = 1 τ p [ u ¯ + u ( t ) u p ]
where τp is the relaxation time of the particle, s; u ¯ is the average velocity, m/s; and u′(t) is the pulsation velocity, m/s.

3.2. The Setting of the Simulation Parameters and Boundary Conditions

Based on relevant literature on dust transport characteristics in blasting within the heading face, related studies [20,21], from the on-site data collected by sensors, wind Speed Measurement Device PA-2008, Pressure and Differential Pressure Meter MCRC-1 Kanomax dust concentration measuring devices, particle counting was conducted over the course of one week during shift 1 [22]. We obtained the parameters of the discrete phase model, injection source parameters, and boundary conditions, and the velocity of speed is depicted in Table 1.
The simulation settings and methods are presented in the following table: the k-ε equation is used to simulate the fluid phase motion of the forced ventilation system, while the discrete phase of dust is simulated using the Discrete Phase Model (DPM) in combination with the continuous phase. The boundary conditions are established as follows:

4. Results and Discussion

4.1. Analysis of Gas Flow Distribution at Different Wind Speeds

The process of dust movement after blasting occurs within the continuous gas phase and is influenced by the distribution of wind velocities within the spatial and temporal dimensions of the tunnel. To study the dust dispersion process within the tunnel, we need to investigate the flow field within the tunnel using wind velocity parameters—V = 9 m/s, 12 m/s, 15 m/s, and 18 m/s—with the height of the ventilation outlet at 2.3 m and the distance from the outlet to the tunnel wall L = 8 m, which are actual data from the Mong Duong coal mine tunneling area.
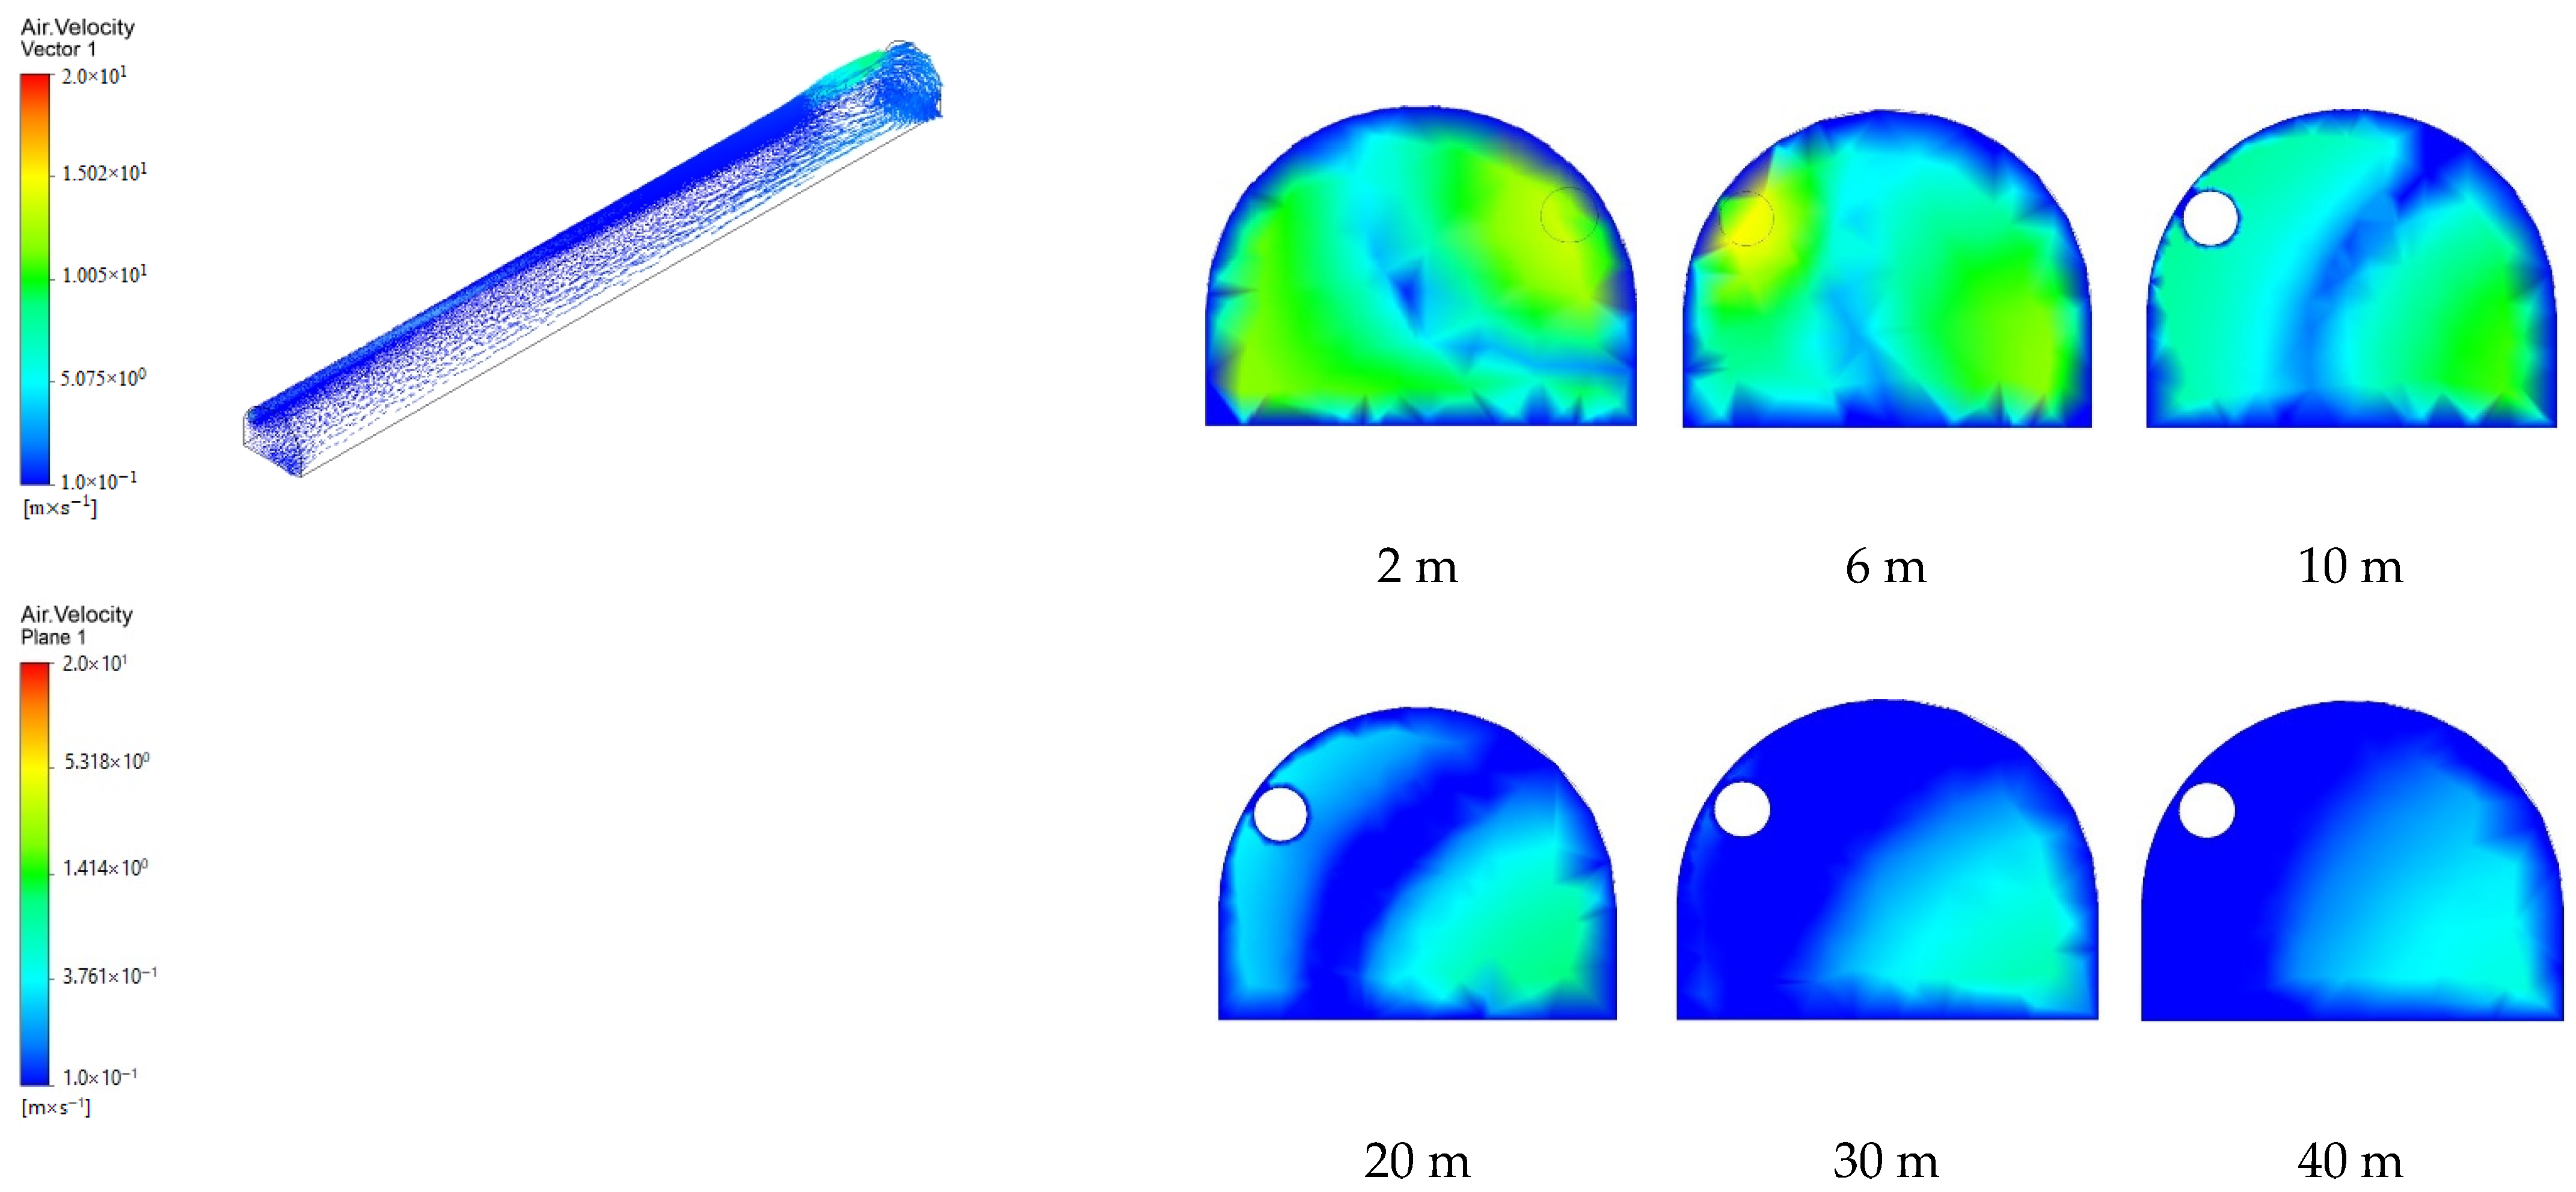
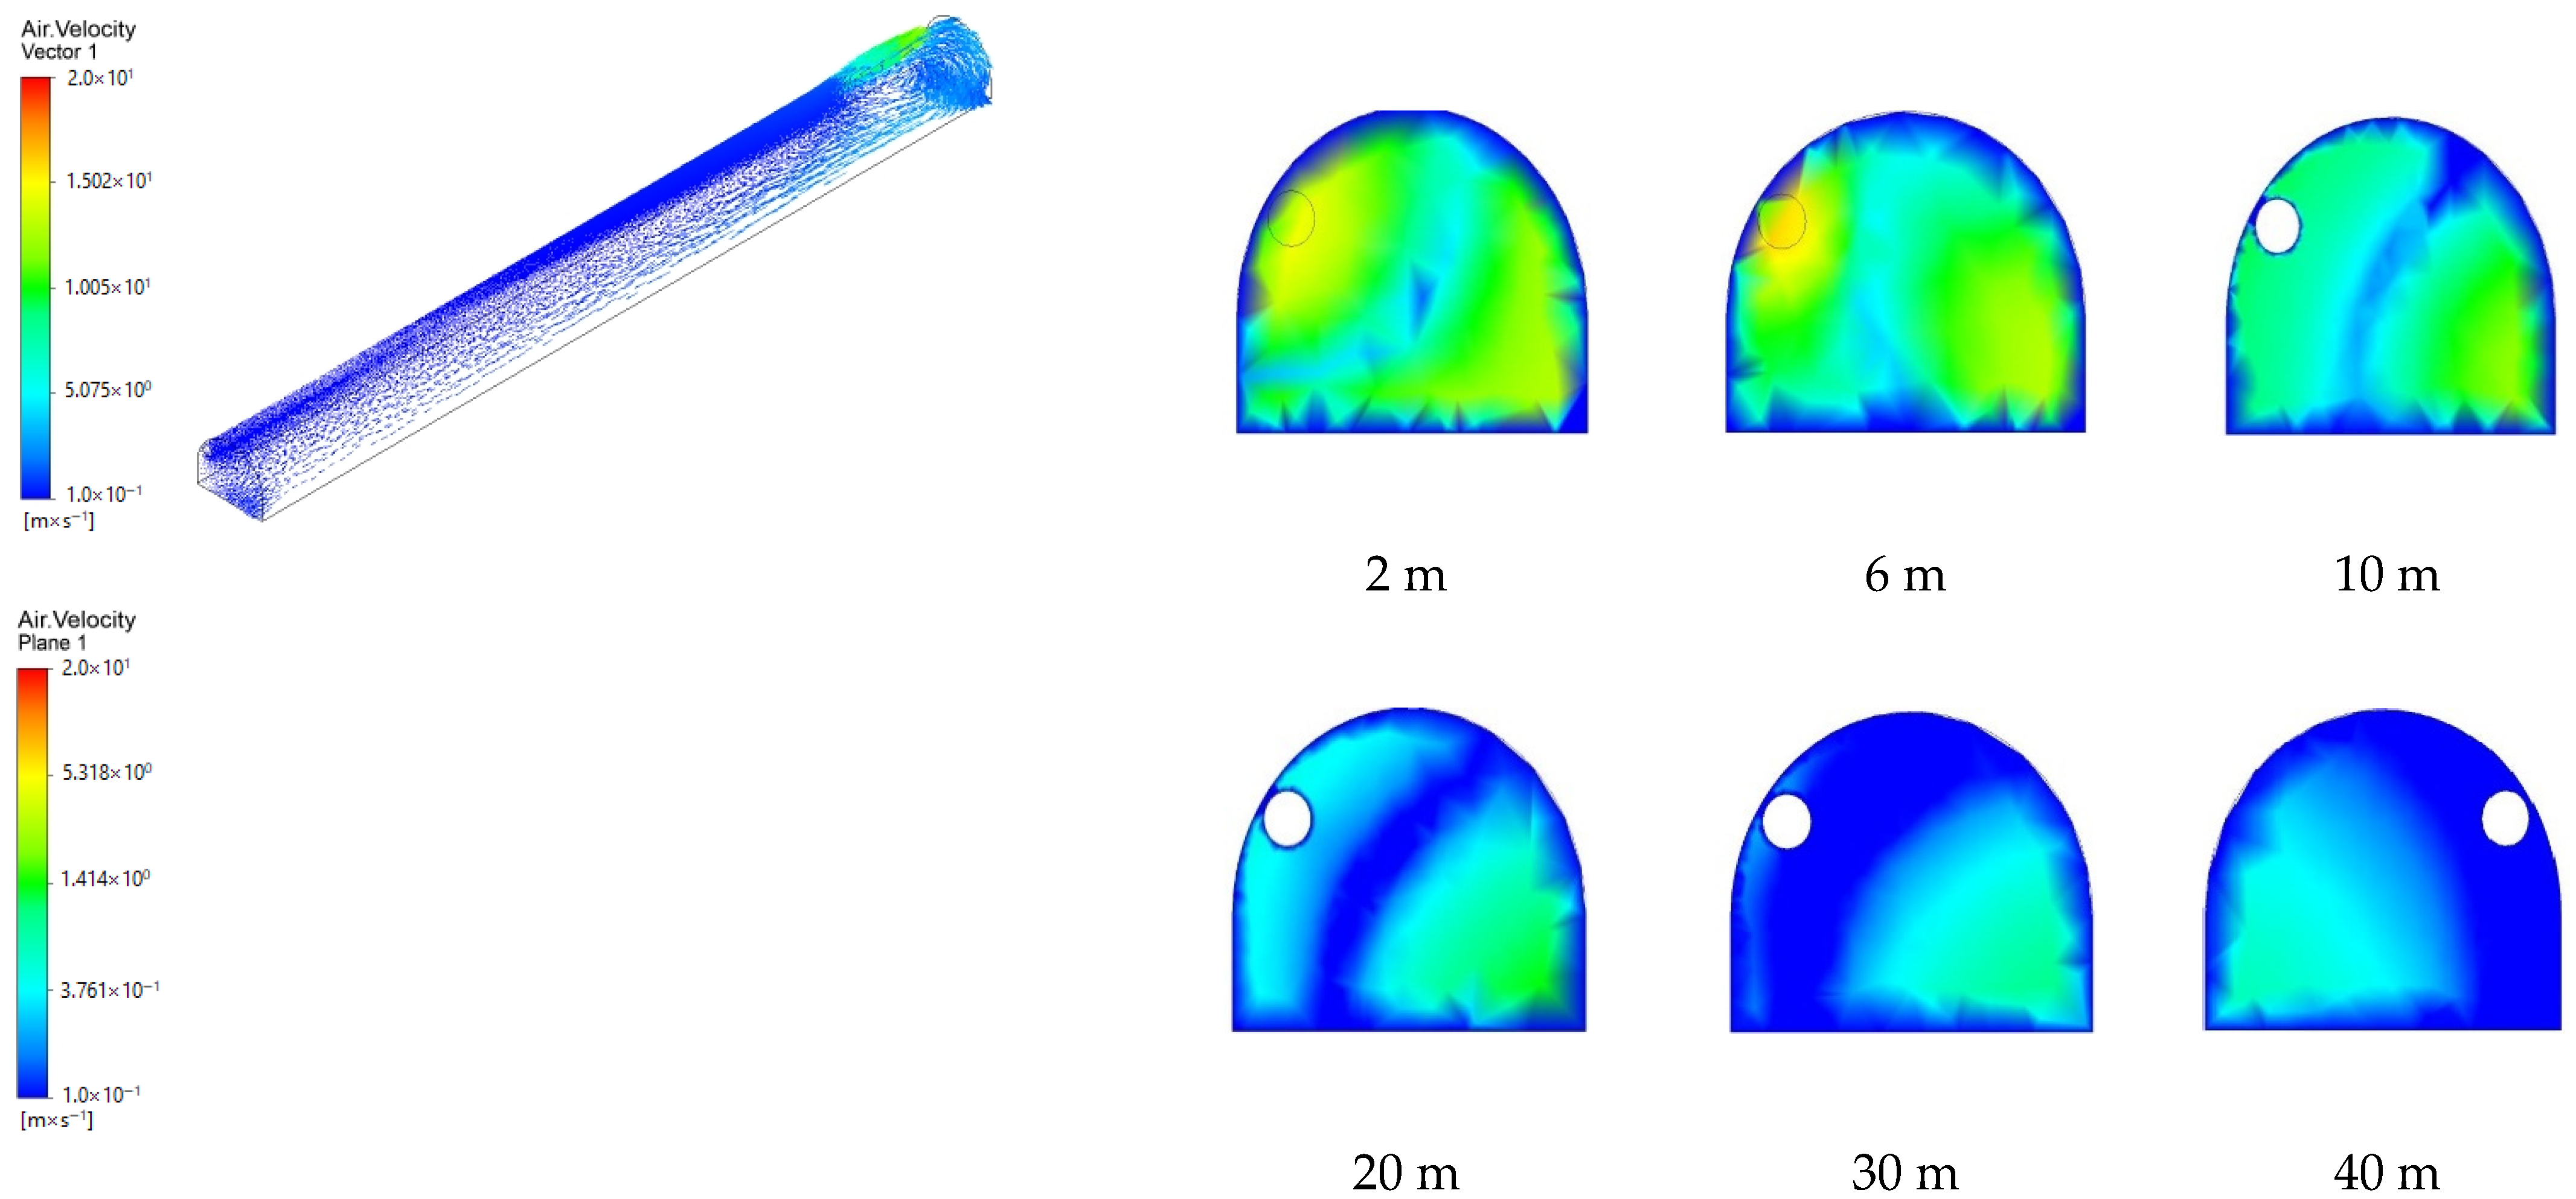
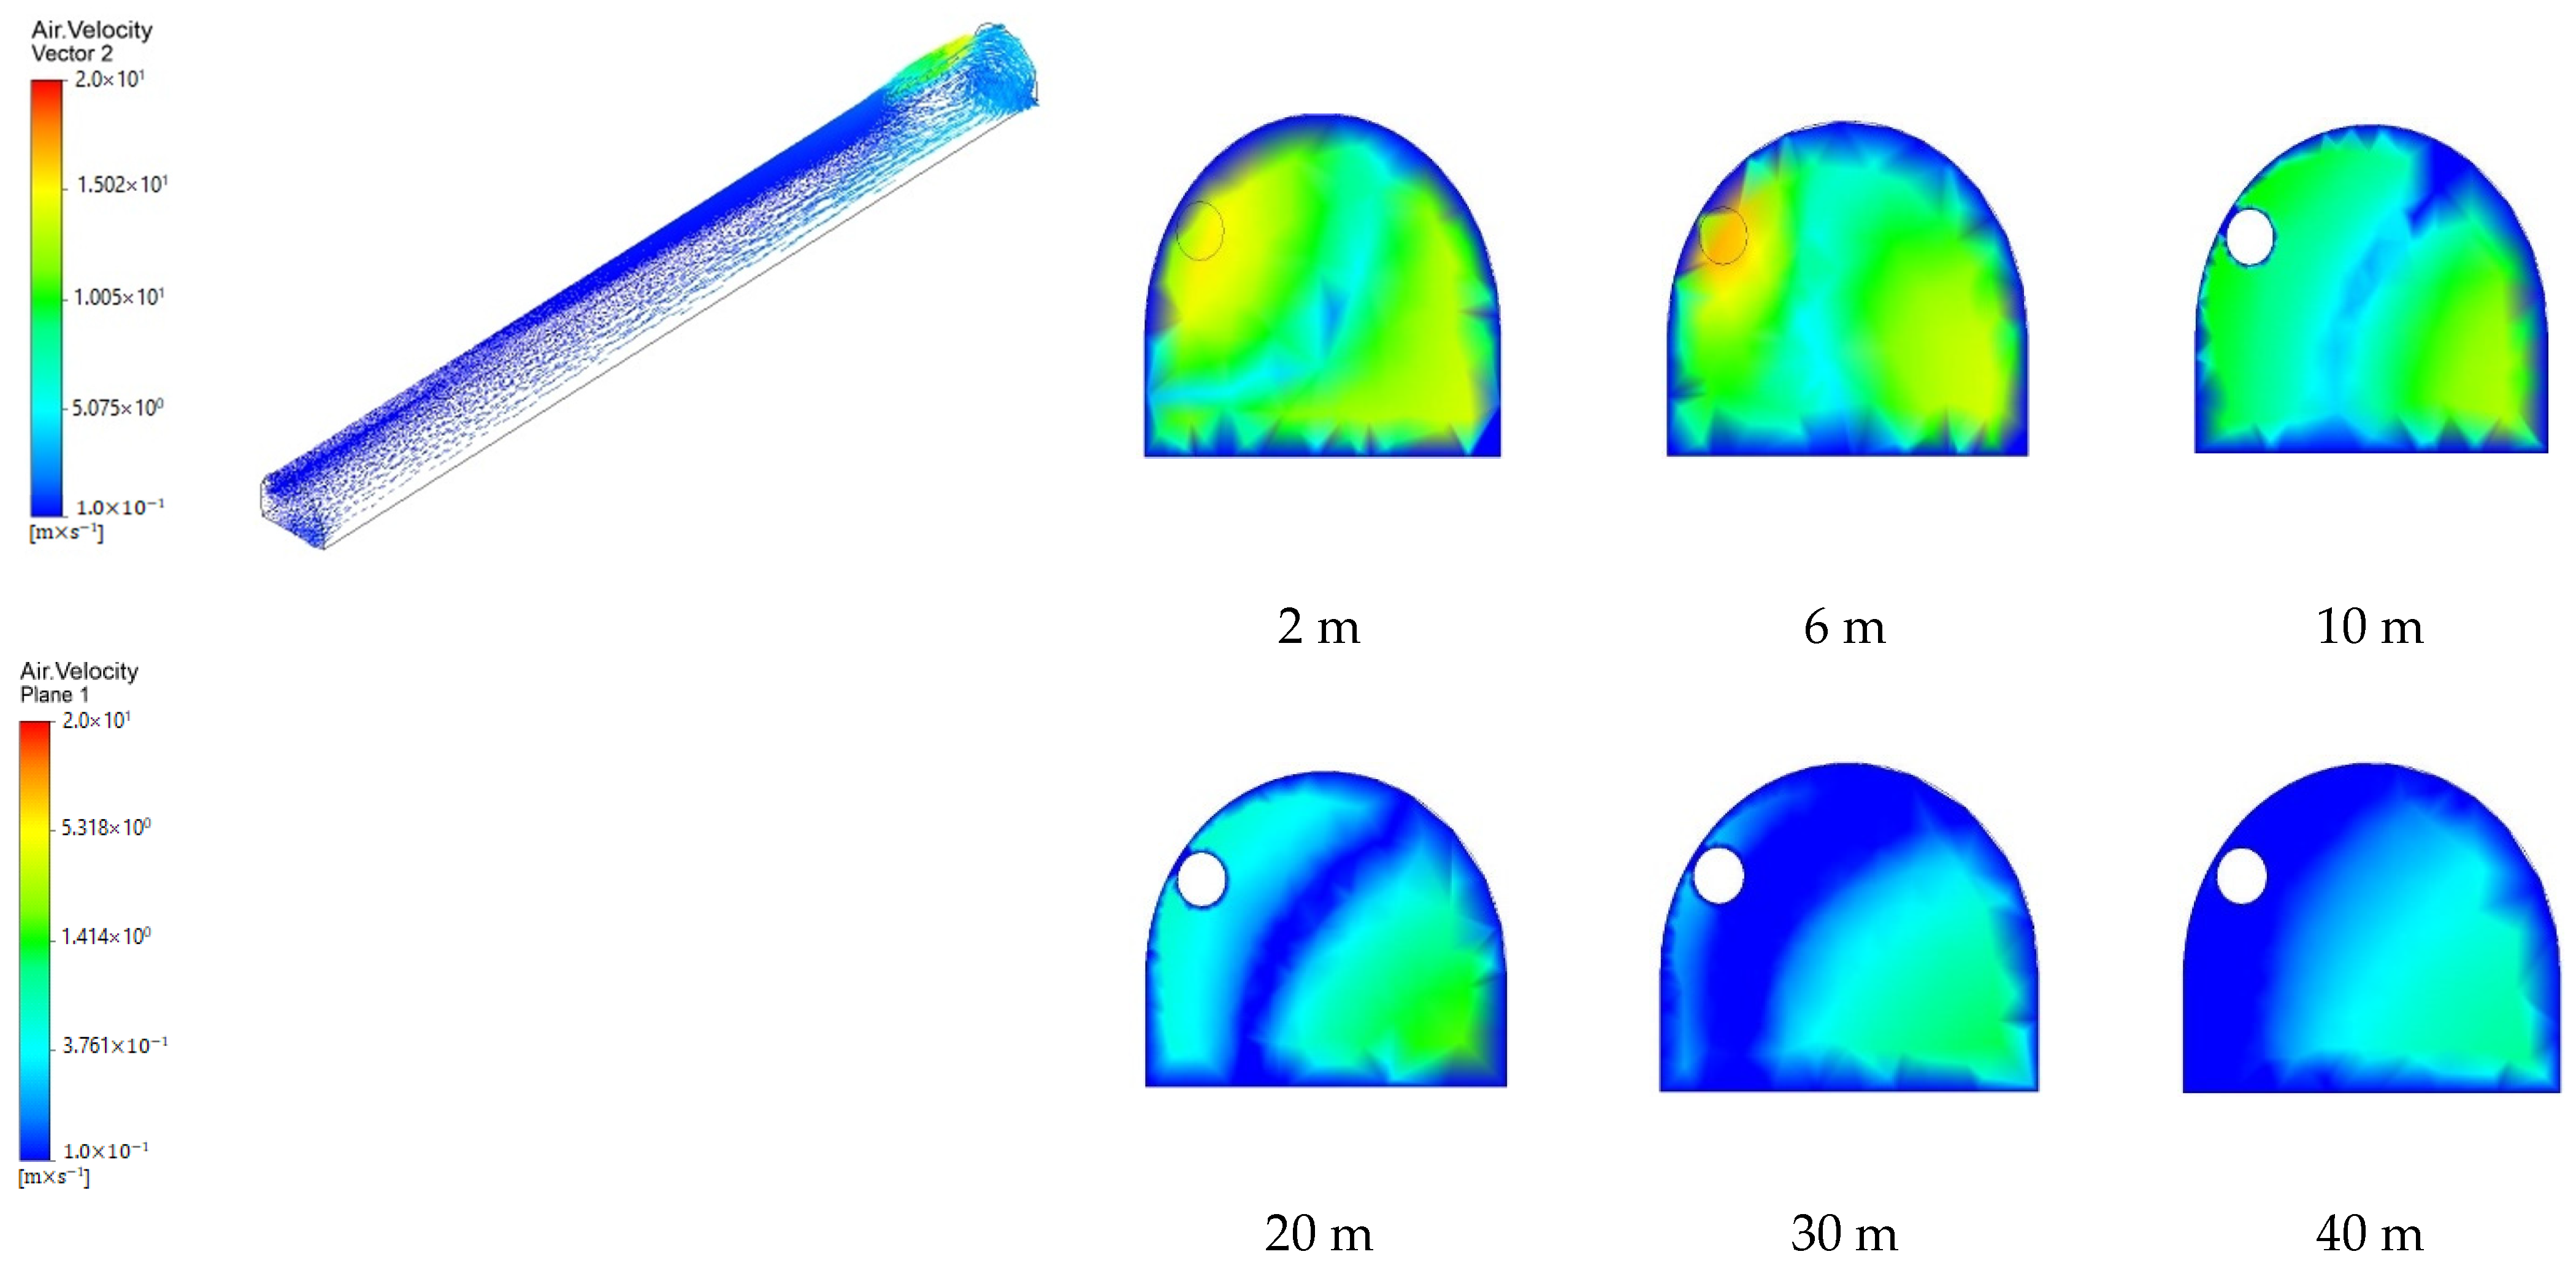
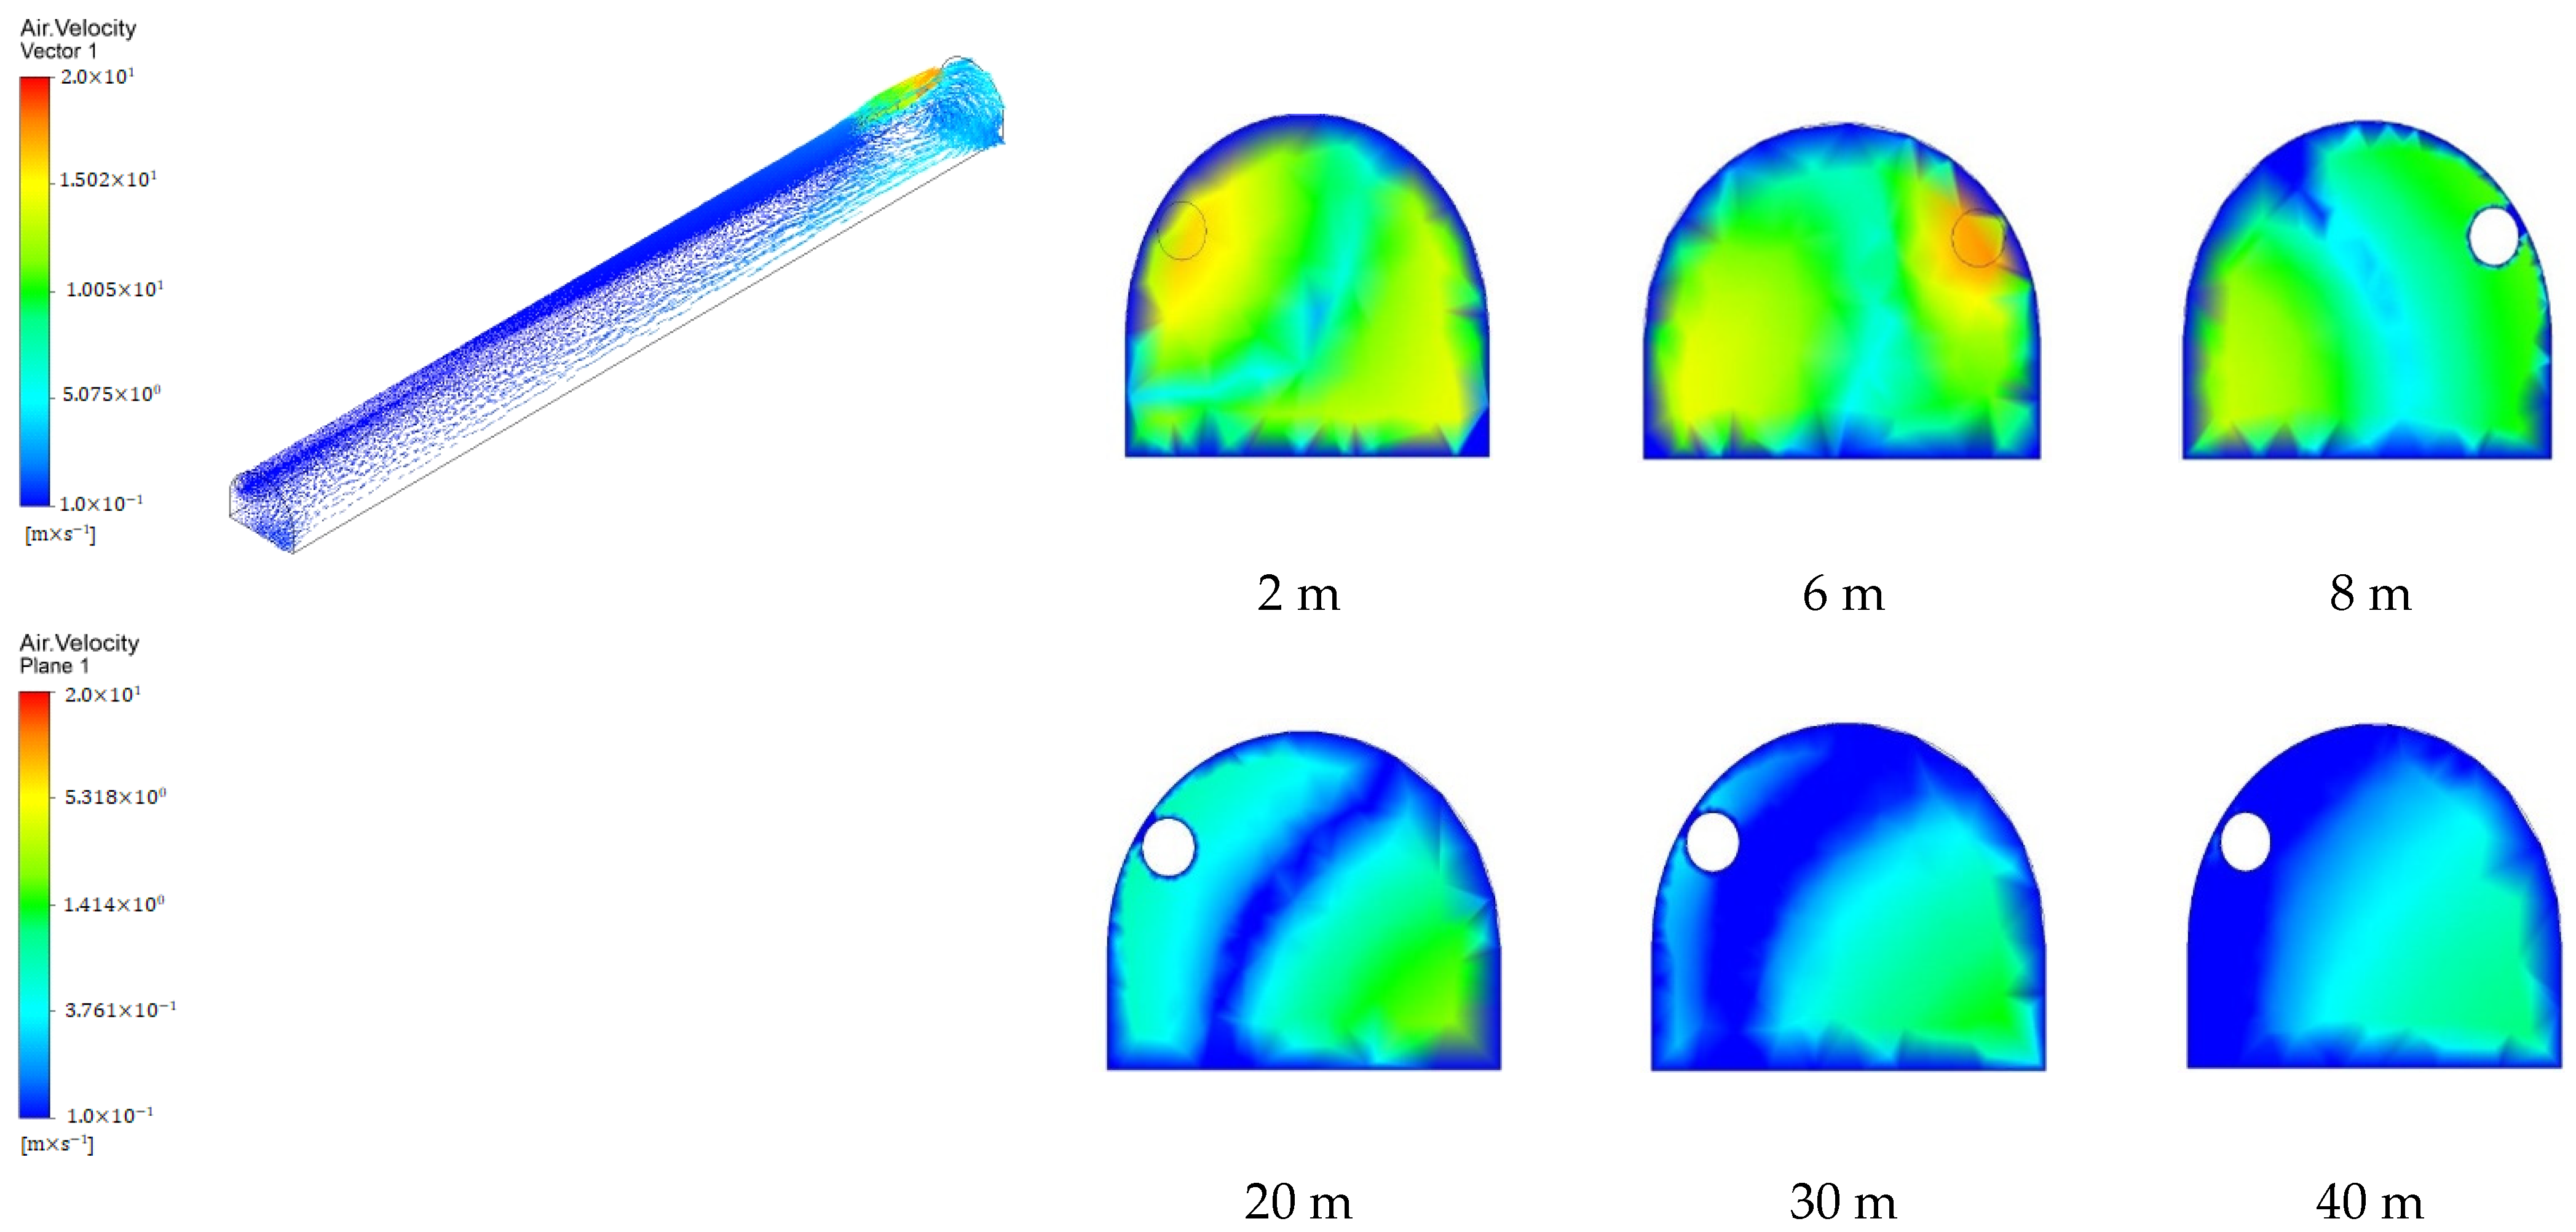
The results of the wind velocity distribution within the tunnel are as follows. Wind exits the ventilation duct with the specified velocities as mentioned above. The arrangement of ventilation ducts on the tunnel wall, based on the actual conditions of the coal mine, shows that the wind exits the ventilation ducts at high speed, moves toward the face, changes direction, flows back into the tunnel, and finally exits on the opposite side of the tunnel. Observing the cross-sectional profiles at positions 2 m, 6 m, 10 m, 20 m, 30 m, and 40 m in Figure 2, Figure 3, Figure 4 and Figure 5, it is evident that the wind velocity distribution on the tunnel face is distinct, creating two zones with high wind velocities: the area where wind exits the ventilation outlet and the area opposite, adjacent to the tunnel wall. The remaining central area exhibits lower wind velocities.
Subsequently, the wind continues to move, and the wind velocity in the section near the ventilation outlet gradually decreases to a stable level. Meanwhile, the higher wind velocity occupies the other side of the tunnel, covering approximately half of the tunnel’s cross-sectional area, as shown in Figure 2, Figure 3, Figure 4, Figure 5 and Figure 6.
Figure 2, based on longitudinal cross-sections along the tunnel, demonstrates that within approximately 20 m from the tunnel’s back, an uneven wind distribution exists. Higher wind velocities are concentrated on the right side of the tunnel, while lower velocities are found on the left side. The central portion experiences the lowest wind velocity within this distance. This indicates that the wind flow becomes more stable, reducing small variations. This is attributed to the influence of the wind flow rebounding after colliding with the tunnel wall and the wind exiting the ventilation outlet, which generates a vortex region, resulting in lower wind velocities within this area.
In Figure 6, we can observe that all four wind velocity models consistently indicate that after the wind exits the ventilation outlet, the wind velocity gradually decreases. Upon collision with the tunnel, the wind reverses its direction within approximately 10 m from the tunnel’s face. At this point, the wind velocity experiences a sharp decrease, followed by a gradual and stable reduction.

4.2. Influence of Wind Velocity on Dust Distribution in the Heading Face

In this study, dust is described over a period of 600 s after the explosion to analyze its dispersion over time and space within the roadway. As evident from Figure 7, Figure 8 and Figure 9, the influence of wind velocity within the ventilation outlet on dust dispersion over time and throughout the entire tunnel is apparent. Initially, after the explosion, a high concentration of dust is emitted from the tunnel’s face, forming a dense dust cloud concentrated near the tunnel’s face for approximately 10 s. Subsequently, due to the interplay between the initial dust velocity and the wind velocity circulating within the tunnel, the dust disperses along the tunnel.
For a wind velocity of 9 m/s (Figure 7), it takes about 150 s for the dust to disperse throughout the entire tunnel. The trend of dust concentration decreasing over time is evident from Figure 7, as larger particles settle and dust escapes from the tunnel. Similarly, for a wind velocity of 12 m/s, it takes about 110 s for full dust dispersion, while for 15 m/s (Figure 8), it takes 90 s, and for 18 m/s, it takes about 80 s.
With a wind velocity of 18 m/s (Figure 8), dust disperses more rapidly, and the dust concentration decreases more quickly compared to the other models. Higher wind velocities lead to a significant reduction in dust concentration.
In Figure 9, the graph illustrates the relationship between the distance of dust diffusion within the tunnel over time with various velocity parameters. This relationship is represented by a quadratic function. Higher wind velocities result in faster and more extended dust diffusion at the same time.
In Figure 10, at the level of y = 1.5, which corresponds to the breathing height of workers, it is evident that higher wind speeds lead to a significant and rapid reduction in dust concentration. Within the first 10 s following the blasting event, larger-sized dust particles quickly settle down or are captured due to gravitational forces, resulting in a rapid decrease in dust concentration. From the contour plot of dust concentration in the horizontal plane at the height of y = 1.5, it can be concluded that dust concentration decreases as wind speed increases.
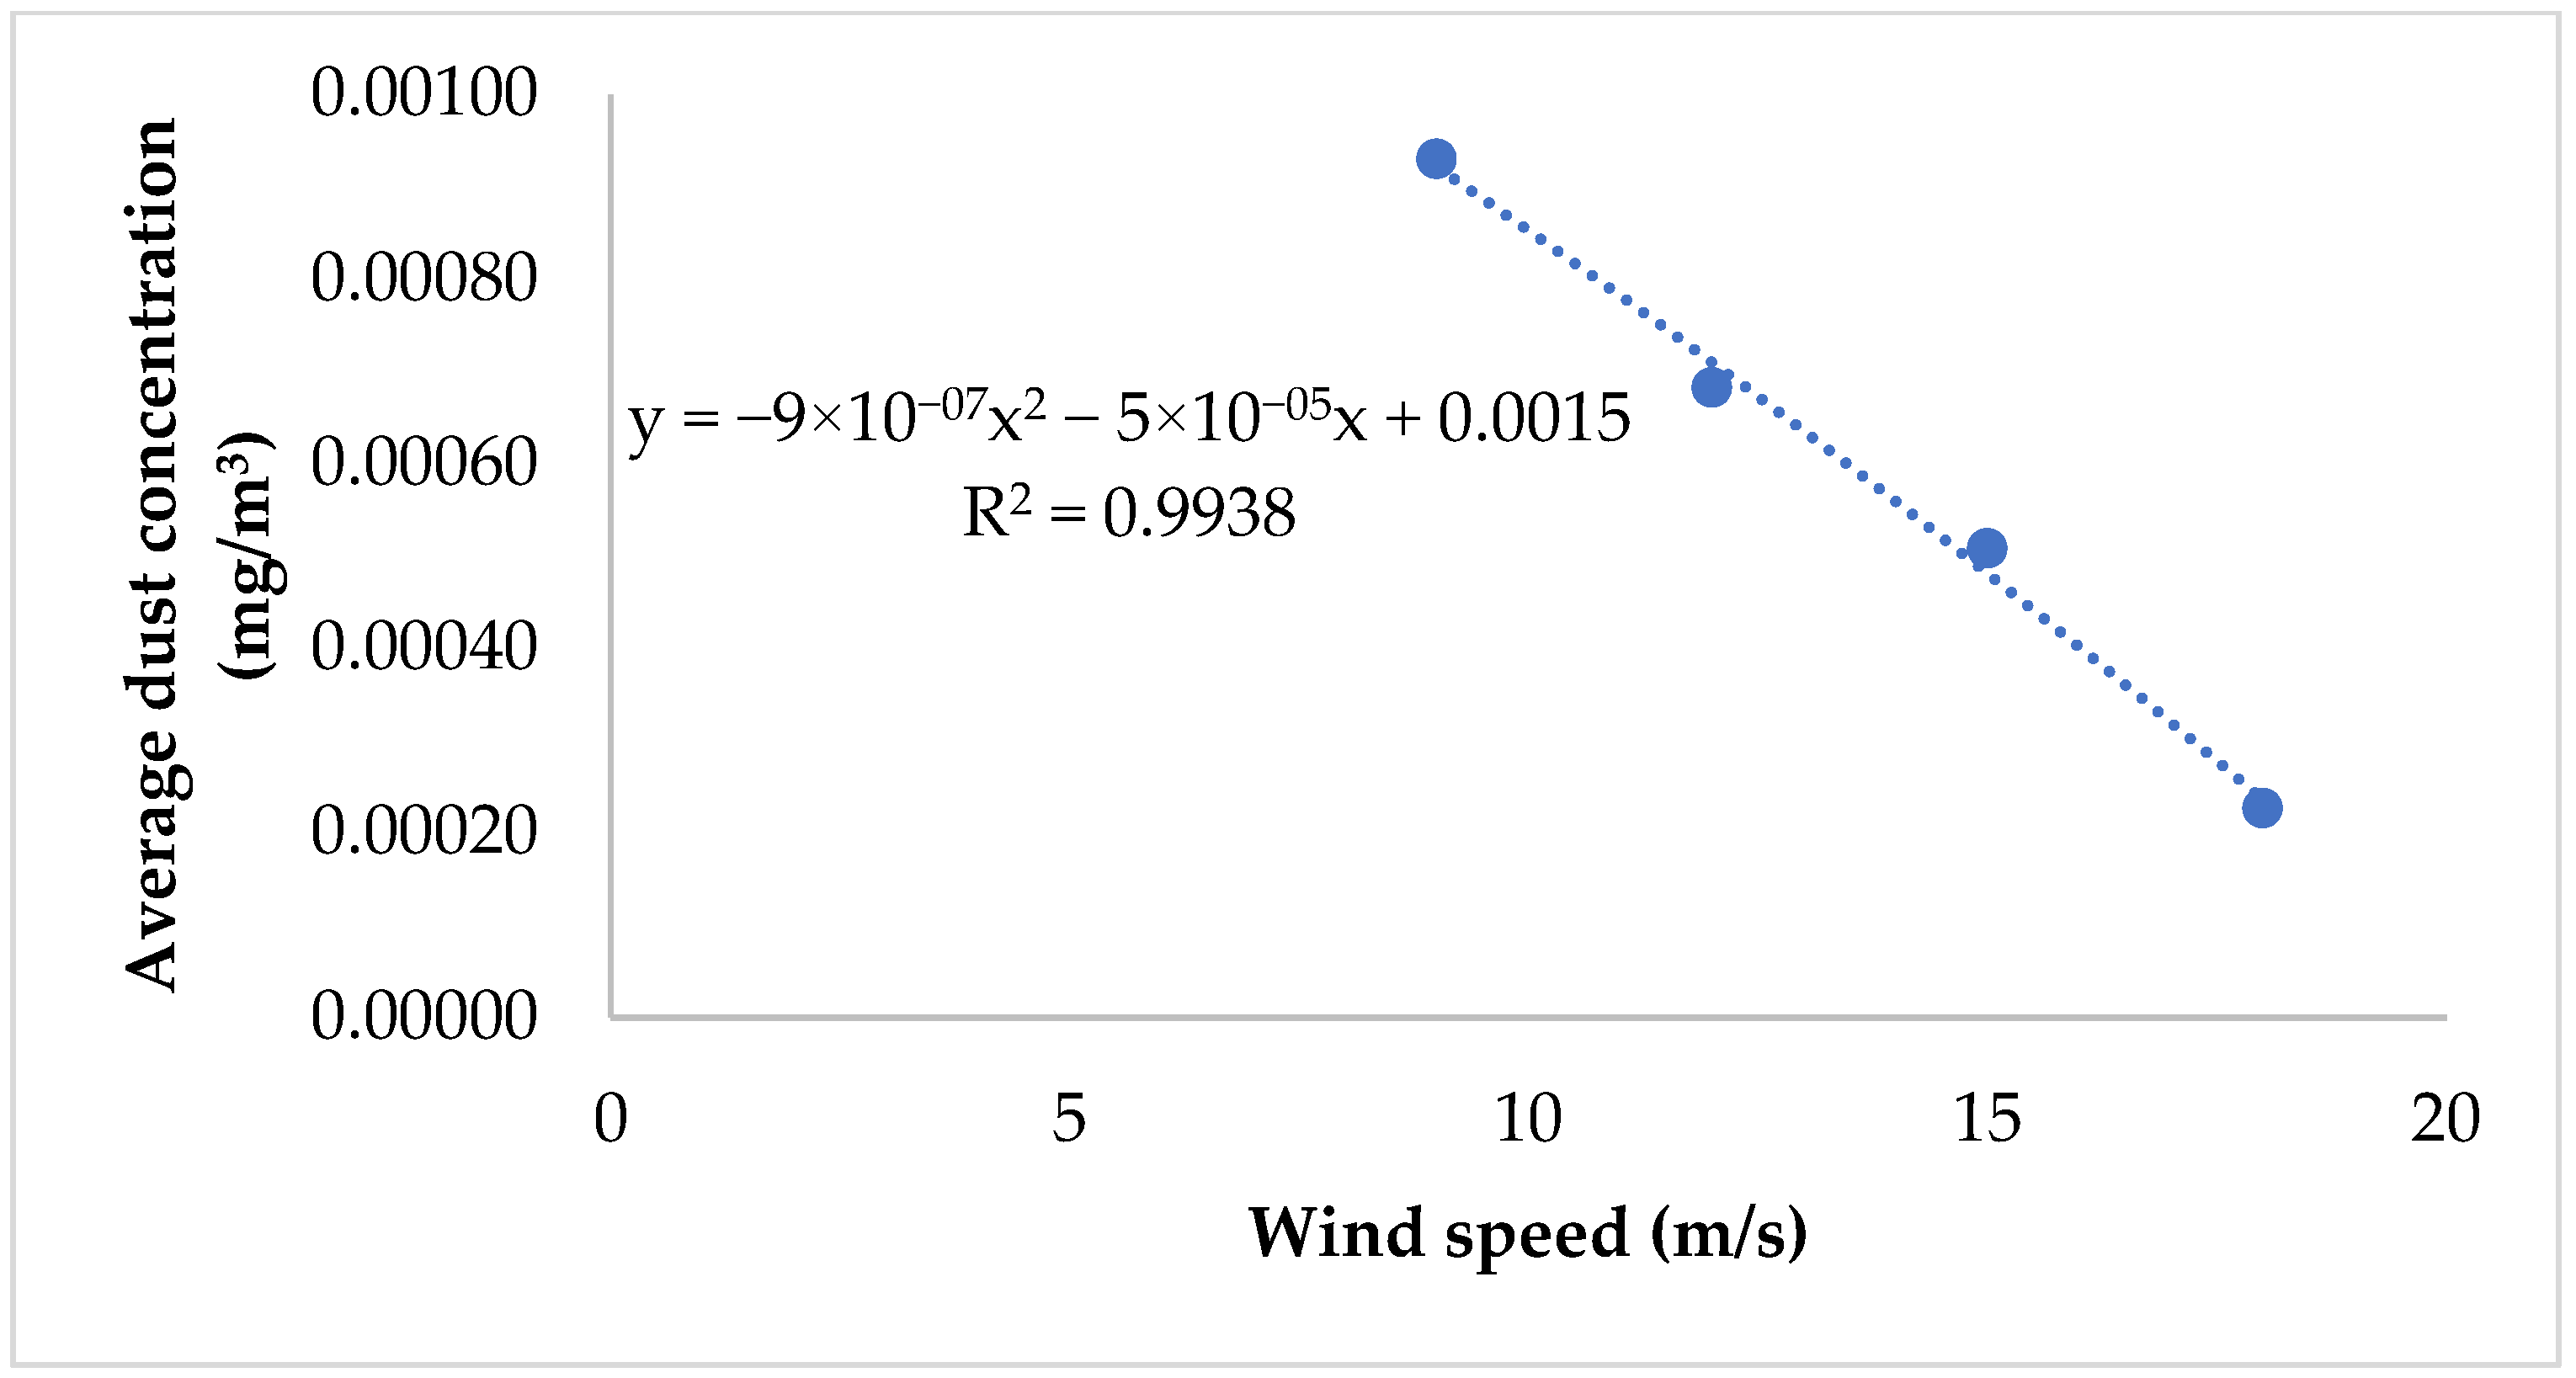
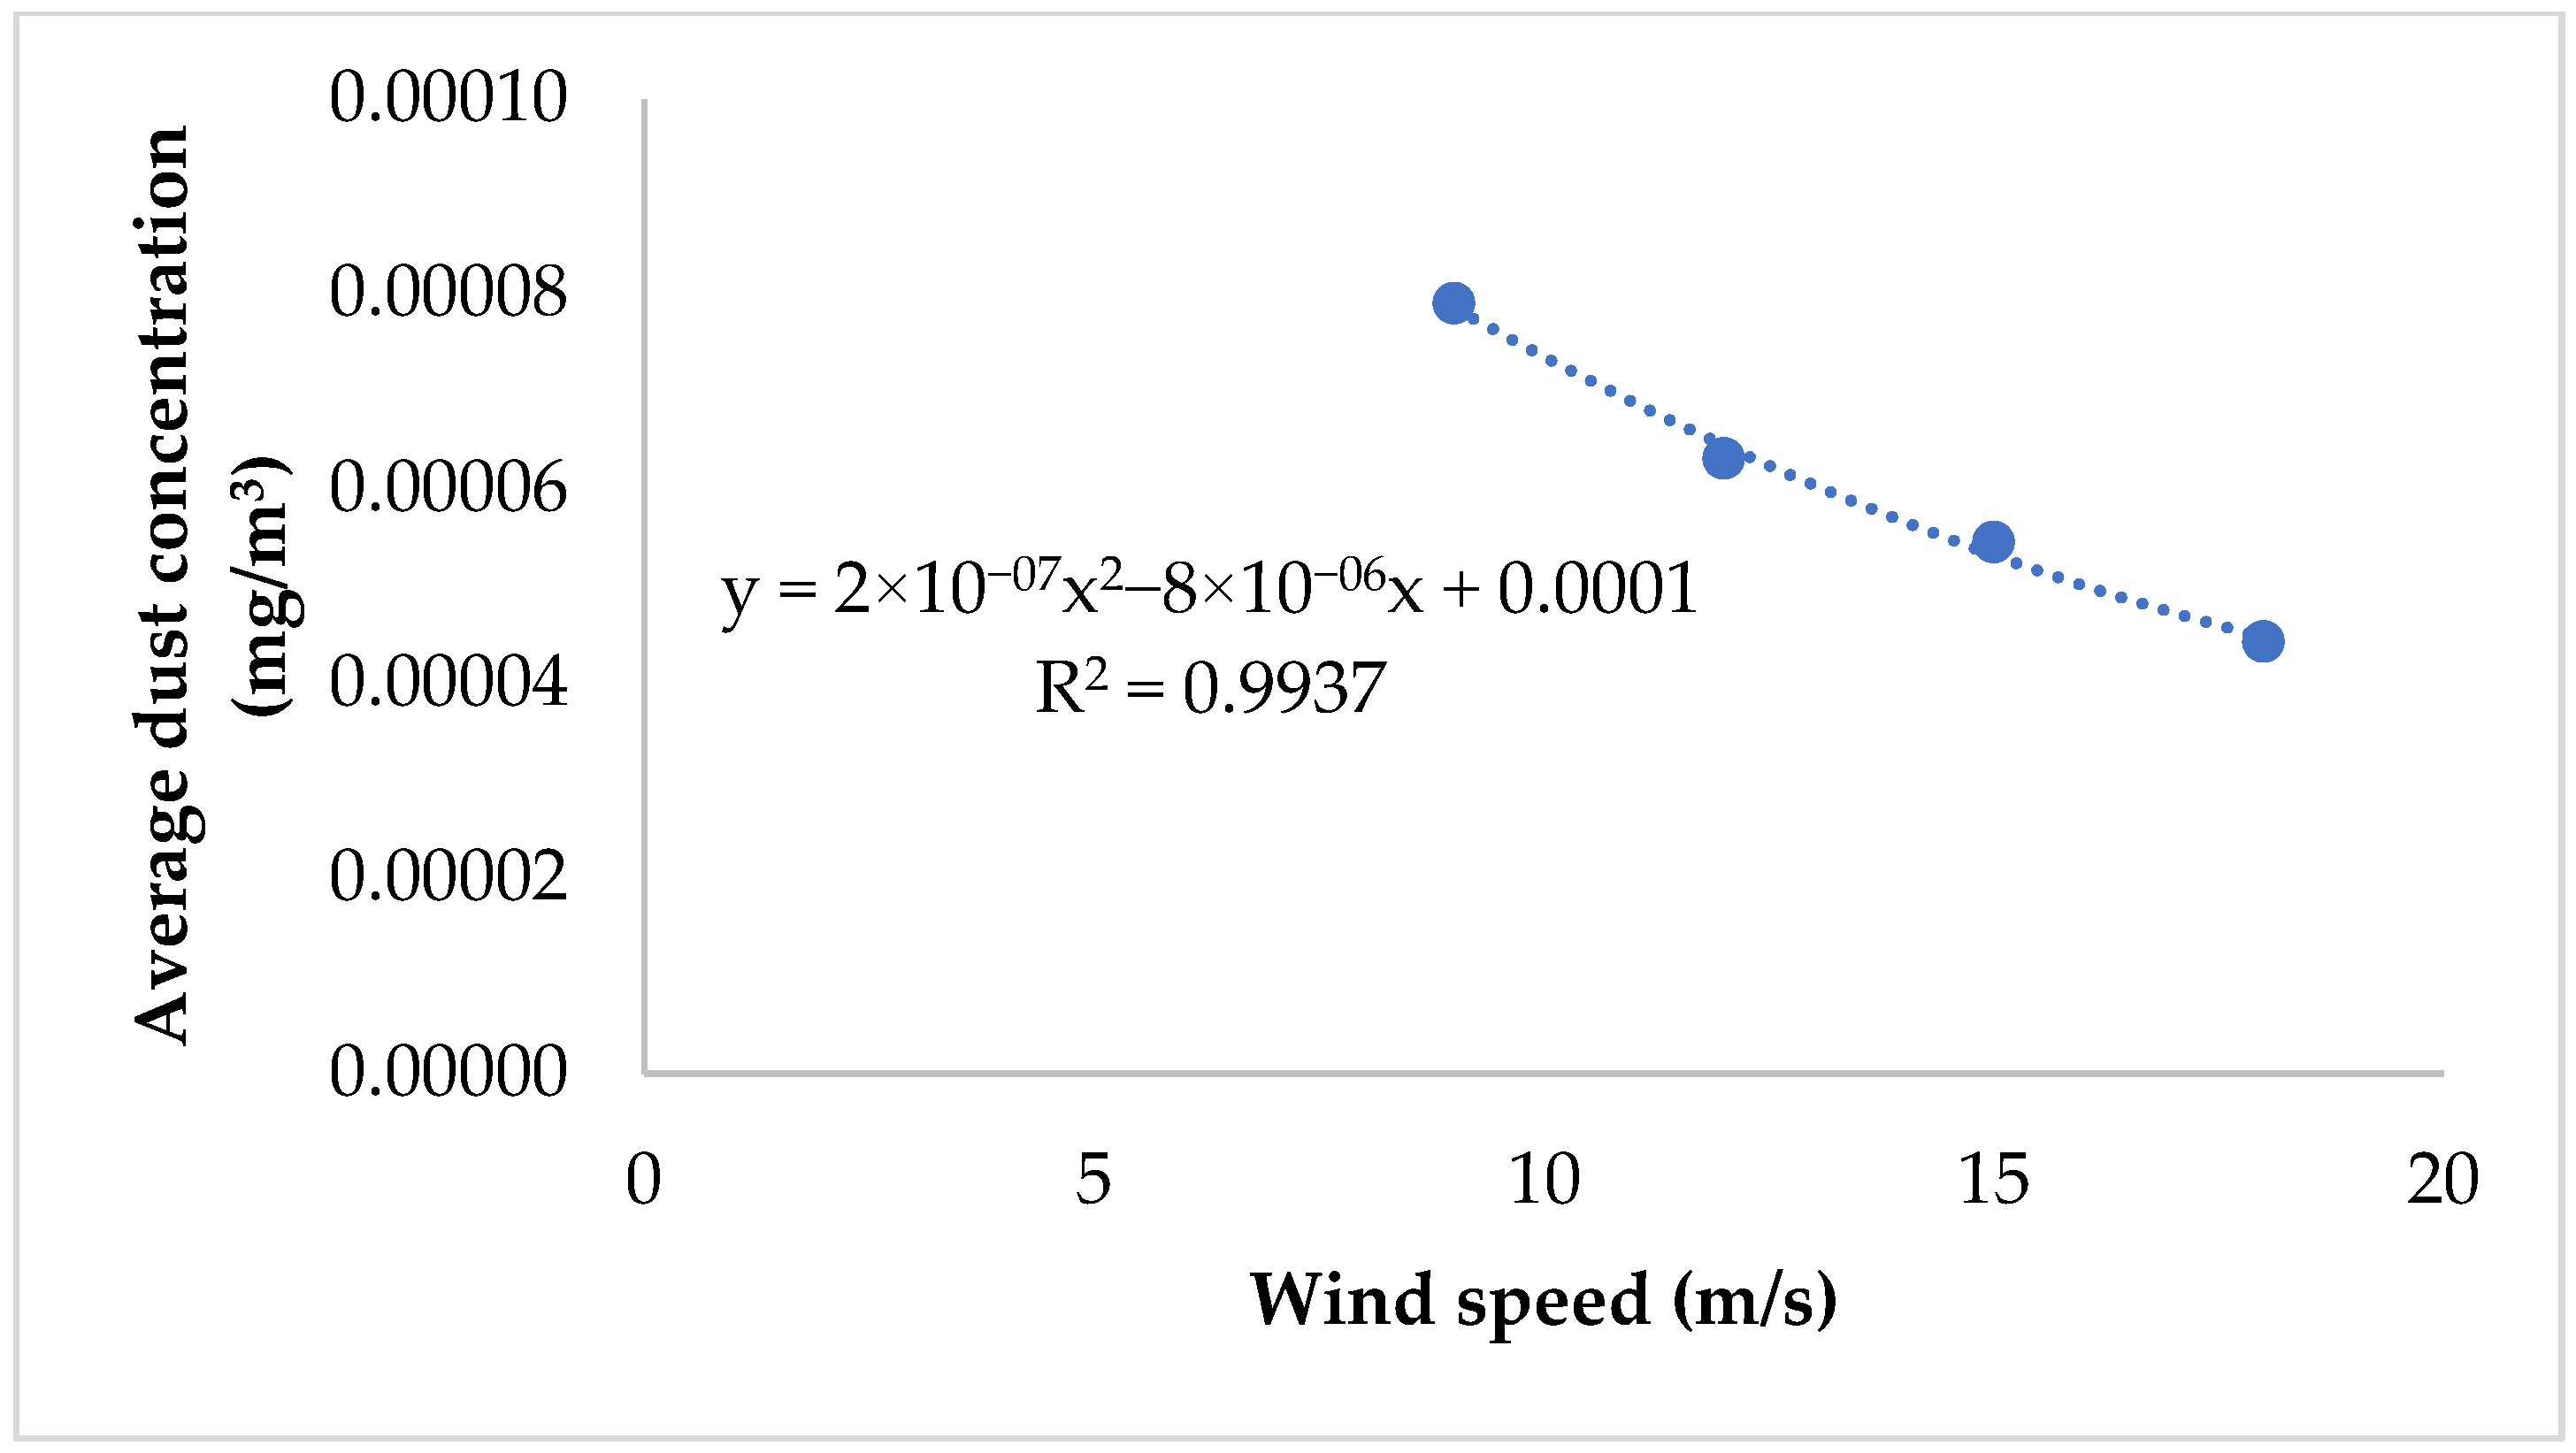
Figure 11, Figure 12, Figure 13 and Figure 14 show the largest variations in dust concentration at positions 1 m, 3 m, and 6 m from the mirror, which are areas where workers are concentrated performing tasks during the furnace excavation process. The figures also indicate that for these three positions, at wind speeds of V = 18 m/s, the dust concentration is the lowest, followed by V = 15 m/s, V = 12 m/s, and finally, V = 9 m/s. Considering the relationship between wind speed and dust concentration at the positions at 1 m, 3 m, and 6 m, and at a height of 1.5 m above the ground, Figure 11, Figure 12, Figure 13 and Figure 14 show that initially, higher wind speeds create areas of high dust concentration and chaotic movement. With V = 18 m/s, the highest average dust concentration occurs around 20 s, resulting in higher dust concentrations than the models with other speeds shown in Figure 11 and Figure 12. However, after this time, the dust concentration tends to decrease more rapidly with increasing wind speed. Figure 13 and Figure 14 show that over the entire research period, dust removal efficiency on the furnace road improves with increasing wind speed. The results of dust concentration at positions 1 m, 3 m, 6 m, and y = 1.5 indicate that a model with V = 18 m/s provides the best dust reduction efficiency.
Figure 11 shows the highest dust concentration results at the position y = 1.5 for different wind speeds. The highest average dust concentration over time at a speed of V = 9 m/s is 930 mg/m3; from 1 to 200 s, the dust concentration is 974 mg/m3; from 201 to 400 s, it is 972 mg/m3; and from 401 to 600 s, it is 844 mg/m3, with dust concentrations exceeding 10 mg/m3, which can affect workers’ health. At V = 12 m/s, the highest average dust concentration is 682 mg/m3; from 1 to 200 s, it is 914 mg/m3; from 201 to 400 s, it is 788 mg/m3; and from 401 to 600 s, it is 346 mg/m3. For V = 15 m/s, the highest average dust concentration is 508 mg/m3; from 1 to 200 s, it is 788 mg/m3; from 201 to 400 s, it is 568 mg/m3; and from 401 to 600 s, it is 169 mg/m3. For V = 18 m/s, the highest average dust concentration is 227 mg/m3; from 1 to 200 s, it is 227 mg/m3; from 201 to 400 s, it is 486 mg/m3; from 401 to 600 s, it is 182 mg/m3; and from 401 to 600 s, it drops to 12.3 mg/m3, taking 522 s to reduce the dust concentration below 10 mg/m3.
In Figure 12, Figure 13 and Figure 14, the highest average dust concentration results at positions 1 m, 3 m, and 6 m from the face within the 600 s study period are as follows: at 1 m from the face with wind speed V = 9 m/s, the dust concentration is 79 mg/m3; when V = 12 m/s, it is 63.1 mg/m3; V = 15 m/s results in 54.5 mg/m3; and when V = 18 m/s, it is 44.3 mg/m3.
At 3 m from the mirror with wind speed V = 9 m/s, the dust concentration is 27.9 mg/m3; when V = 12 m/s, it is 19.2 mg/m3; V = 15 m/s results in 11.2 mg/m3; and when V =18 m/s, it is 6.98 mg/m3.
At 6 m from the mirror with wind speed V = 9 m/s, the dust concentration is 32.8 mg/m3; when V = 12 m/s, it is 20.3 mg/m3; V = 15 m/s results in 12.4 mg/m3; and when V = 18 m/s, it is 6.75 mg/m3.
Figure 15, Figure 16, Figure 17 and Figure 18 depict the relationship between average dust concentration and wind speed over the 600 s study period.

4.3. Influence of Ventilation Duct Position on Dust Dispersion

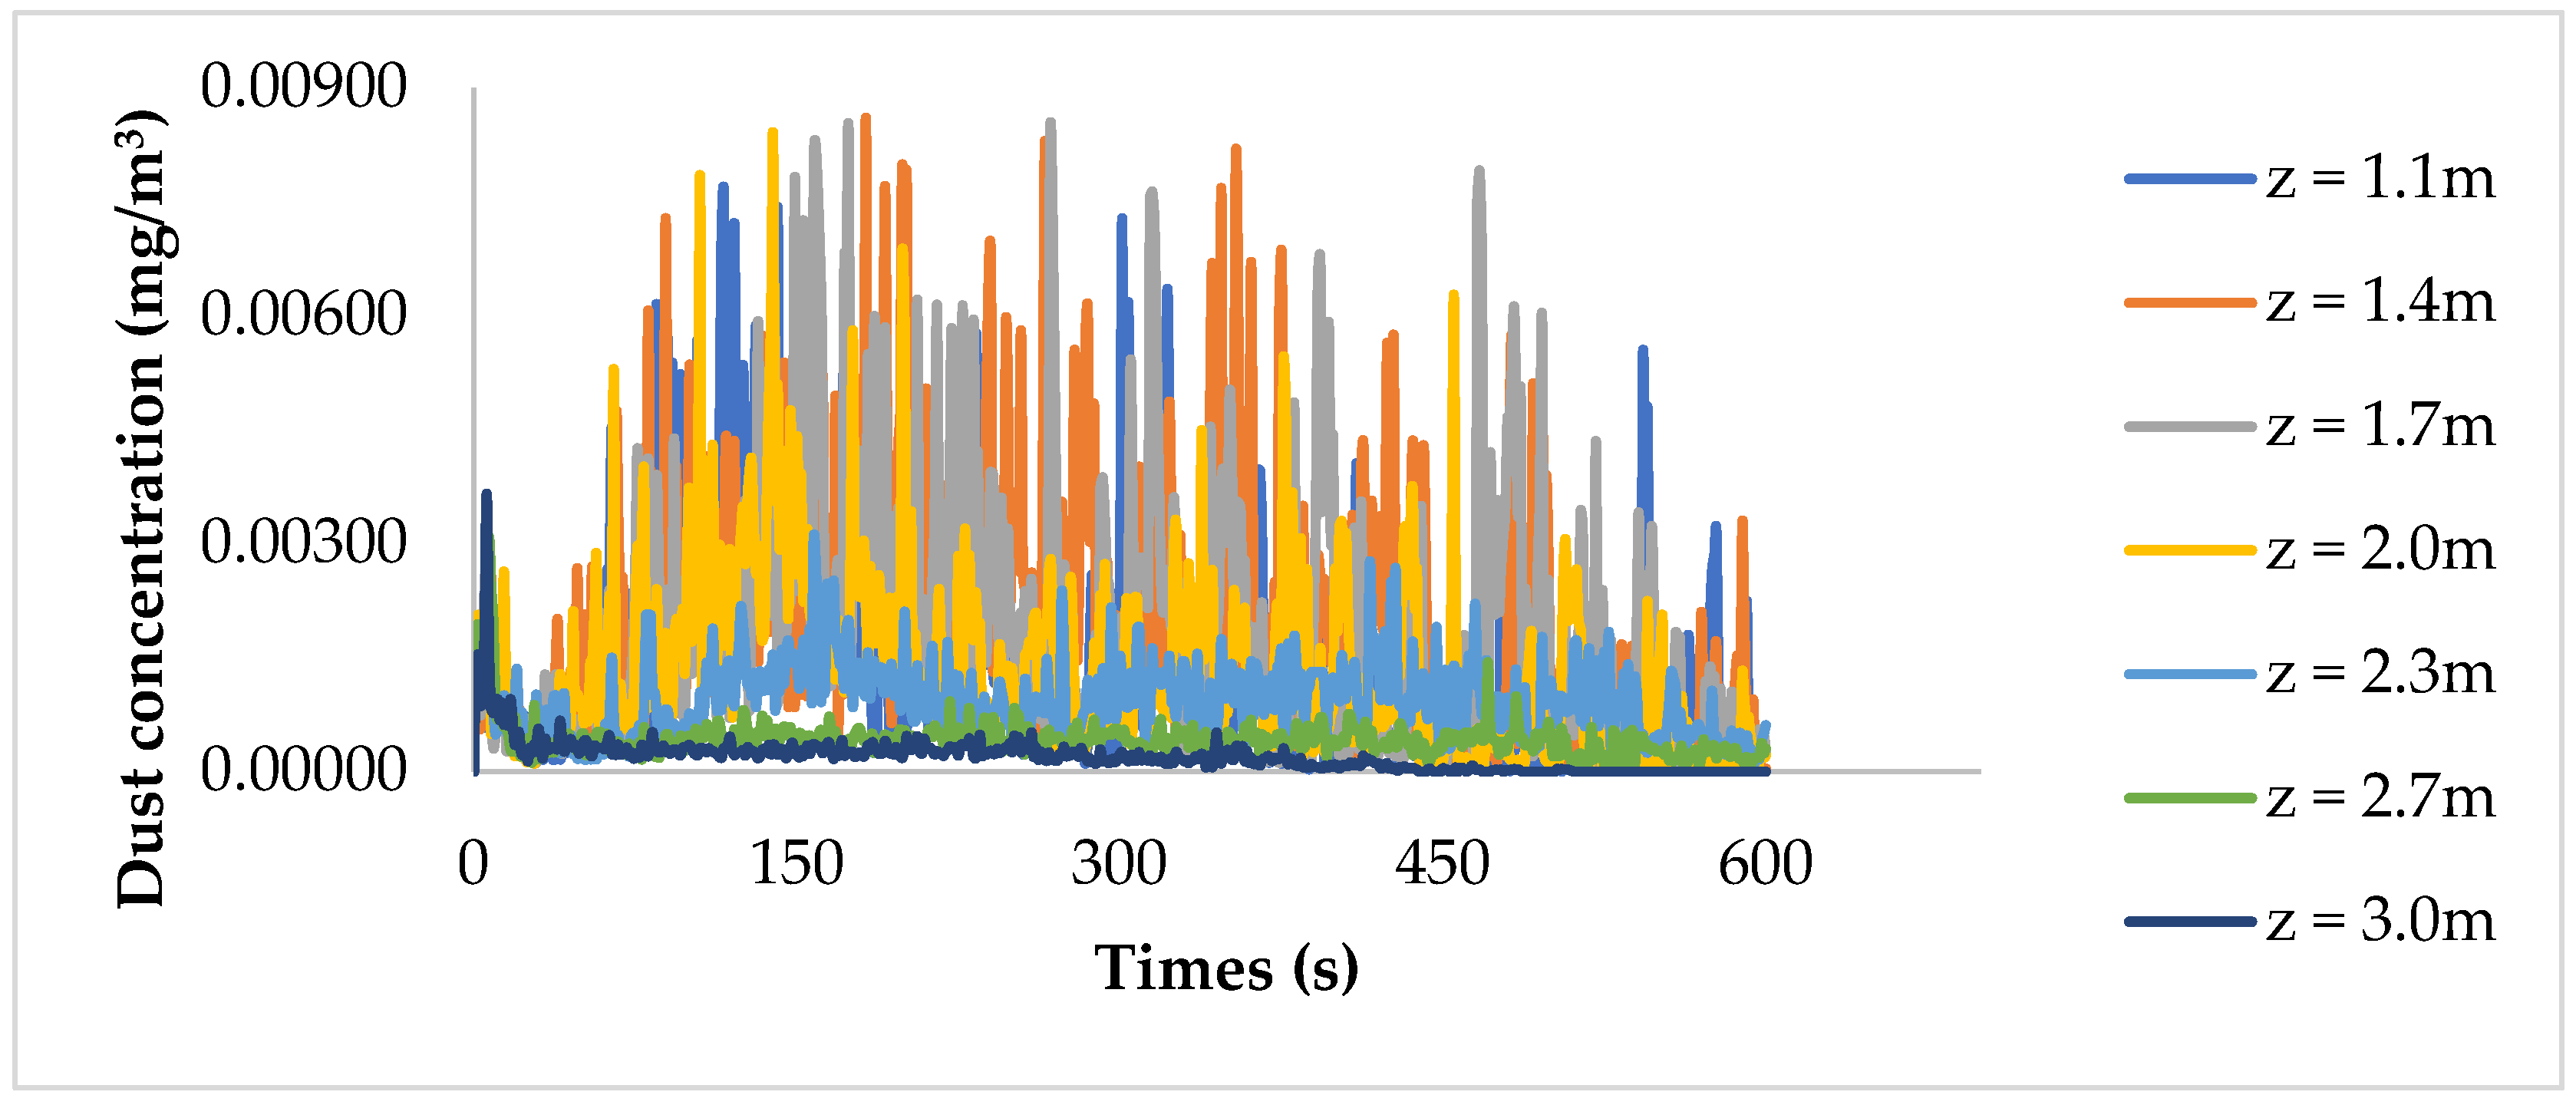
The study was conducted at seven different vertical positions along the height of the tunnel (h = 1.1 m, 1.4 m, 1.7 m, 2.0 m, 2.3 m, 2.7 m, 3.0 m) to determine the dust concentration distribution at cross-sections located at distances of 1 m, 3 m, 6 m from the tunnel wall và vị trí cách nền lò 1.5 m. These sections correspond to the working areas where laborers are engaged in construction activities within the tunnel over time. The average breathing height of tunnel workers in Vietnam was taken into consideration.
Furthermore, to assess the influence of the ventilation duct’s position on the dust dispersion pattern, the dust dispersion law was determined at different positions along the tunnel’s height over corresponding time intervals.
The results of the maximum dust concentration at various positions are shown in the following figure:
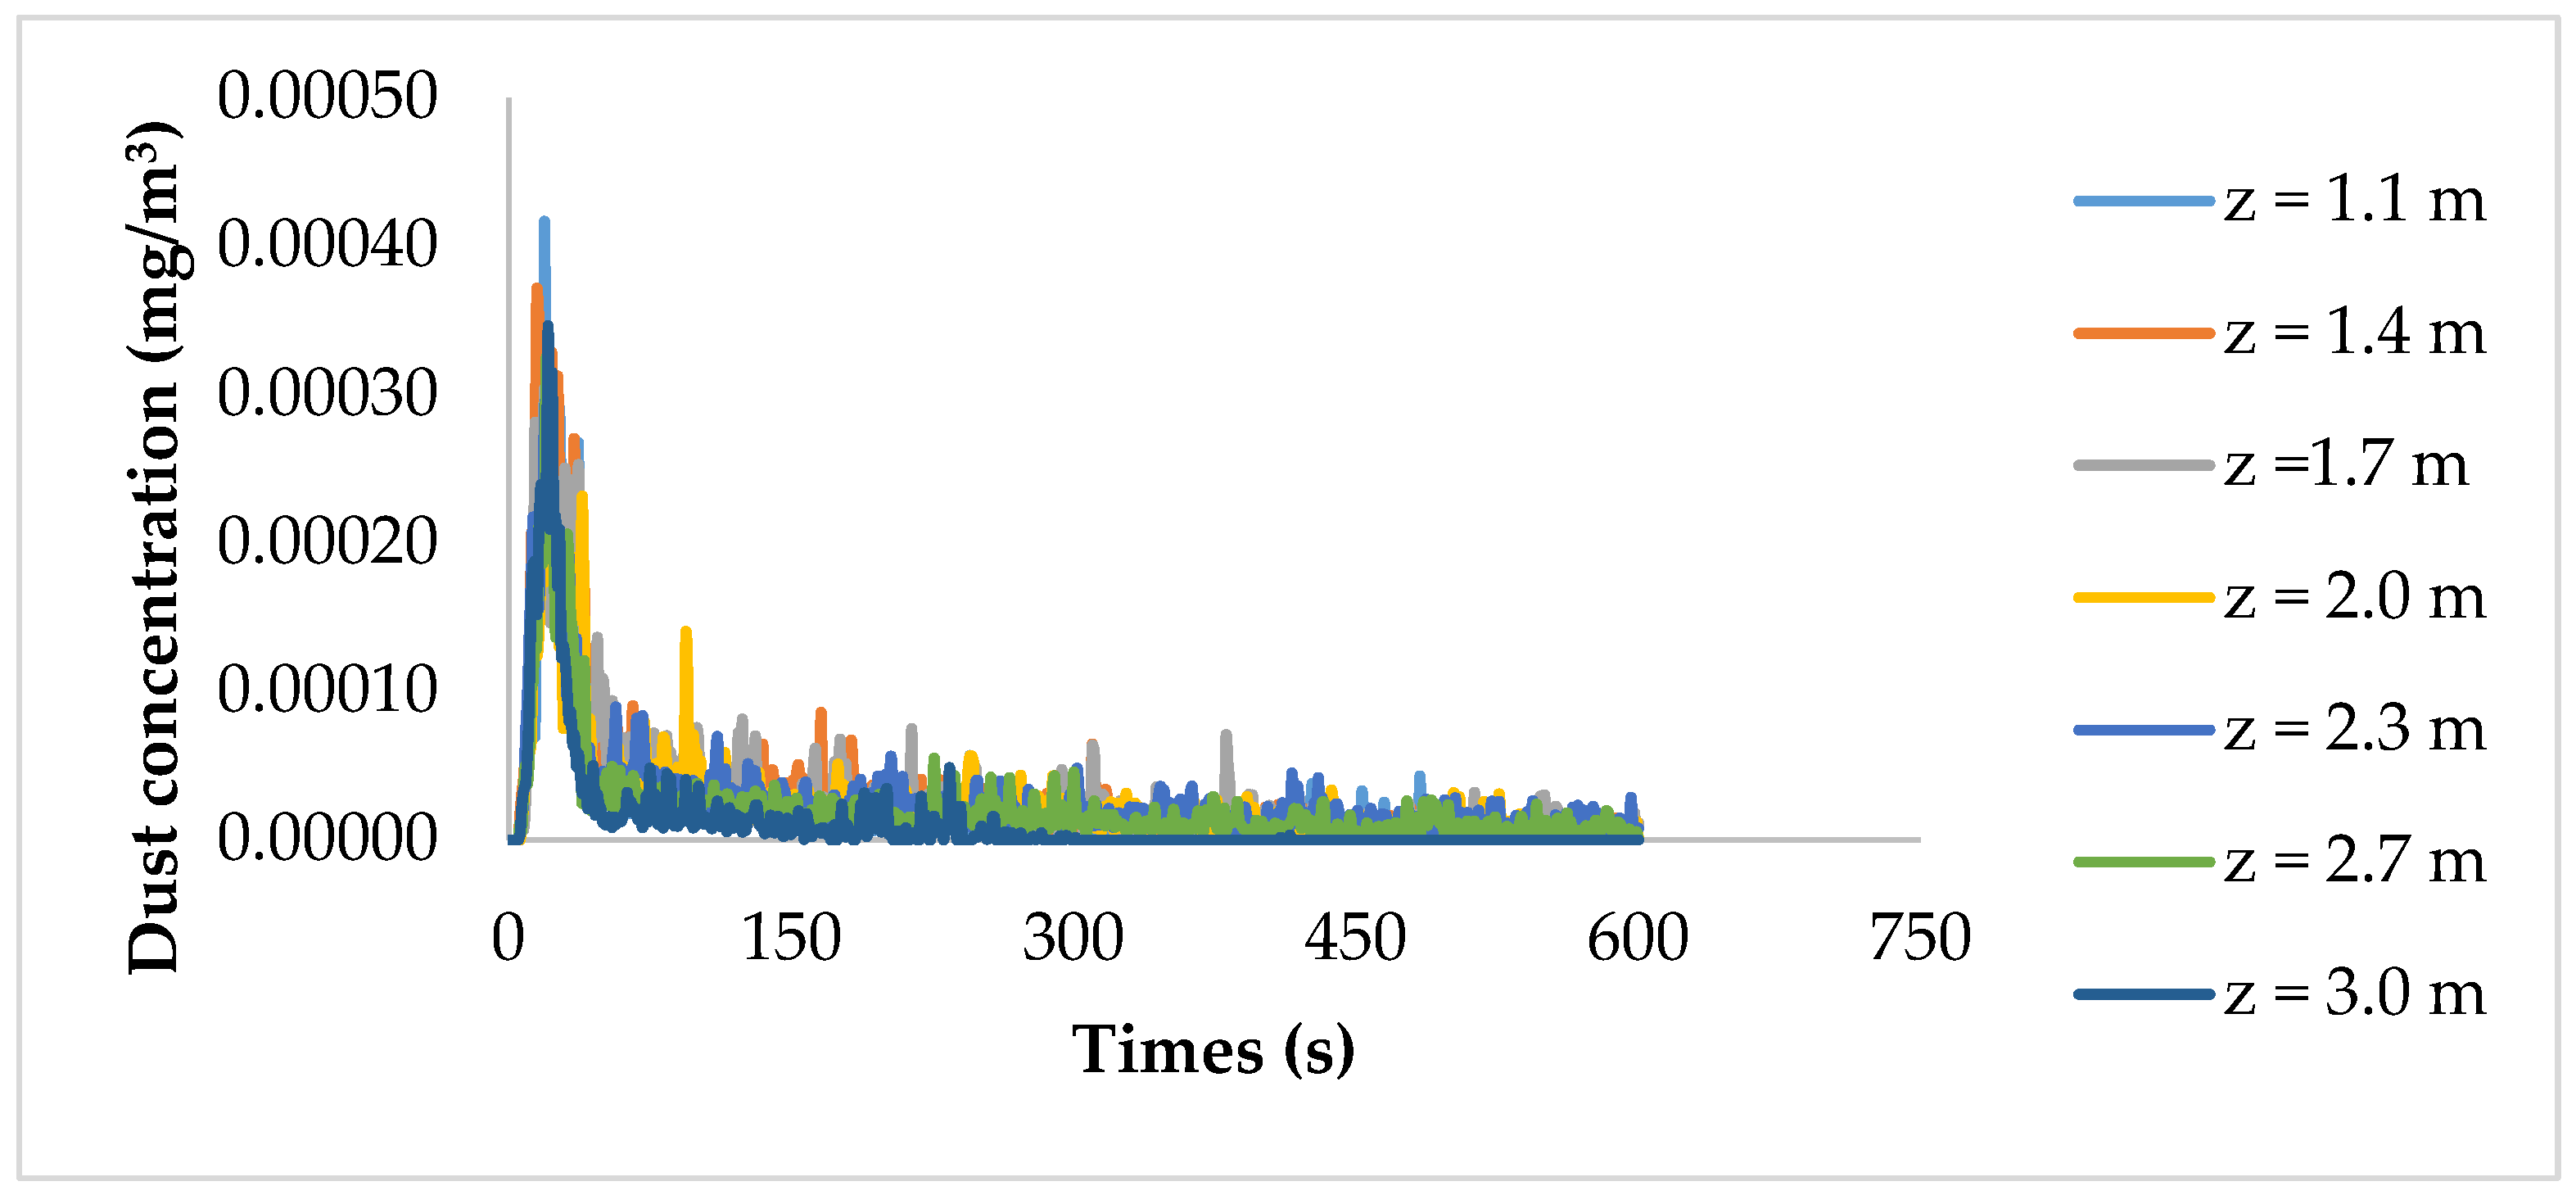
Figure 19 reveals that at a distance of 1.0 m from the source, dust concentration is prominently generated within approximately 10 s. Among the models with different heights (h = 1.1 m to h = 3.0 m), the model with h = 1.1 m exhibits the highest dust concentration, reaching around 1344 mg/m3, while the lowest concentration is observed in the h = 3.0 m model at 631 mg/m3. During the period of 10–100 s, dust concentration sharply declines due to rapid dispersion within the tunnel. From 100 to 600 s, the concentration gradually decreases as particles settle and diffuse outside the tunnel. For models h = 1.1 m to h = 2.7 m, it takes around 450–480 s for the dust concentration to fall below 10 mg/m3, whereas the h = 3.0 m model achieves this level within about 300 s. Throughout the total simulation time, the average concentration at h = 1.1 m was 71.9 mg/m3; at h = 1.4 m, the average concentration was 71.2 mg/m3; at h = 1.7 m, the average concentration was 83.4 mg/m3; at h = 2.0 m, the average concentration was 67.3 mg/m3; at h = 2.3 m, the average concentration was 86.2 mg/m3; at h = 2.7 m, the average concentration was 74.7 mg/m3; and at h = 3.0 m, the average concentration was 53.6 mg/m3. The results indicate that the position at h = 3.0 m provides better dust reduction, while the dust concentrations at other positions do not show significant differences.
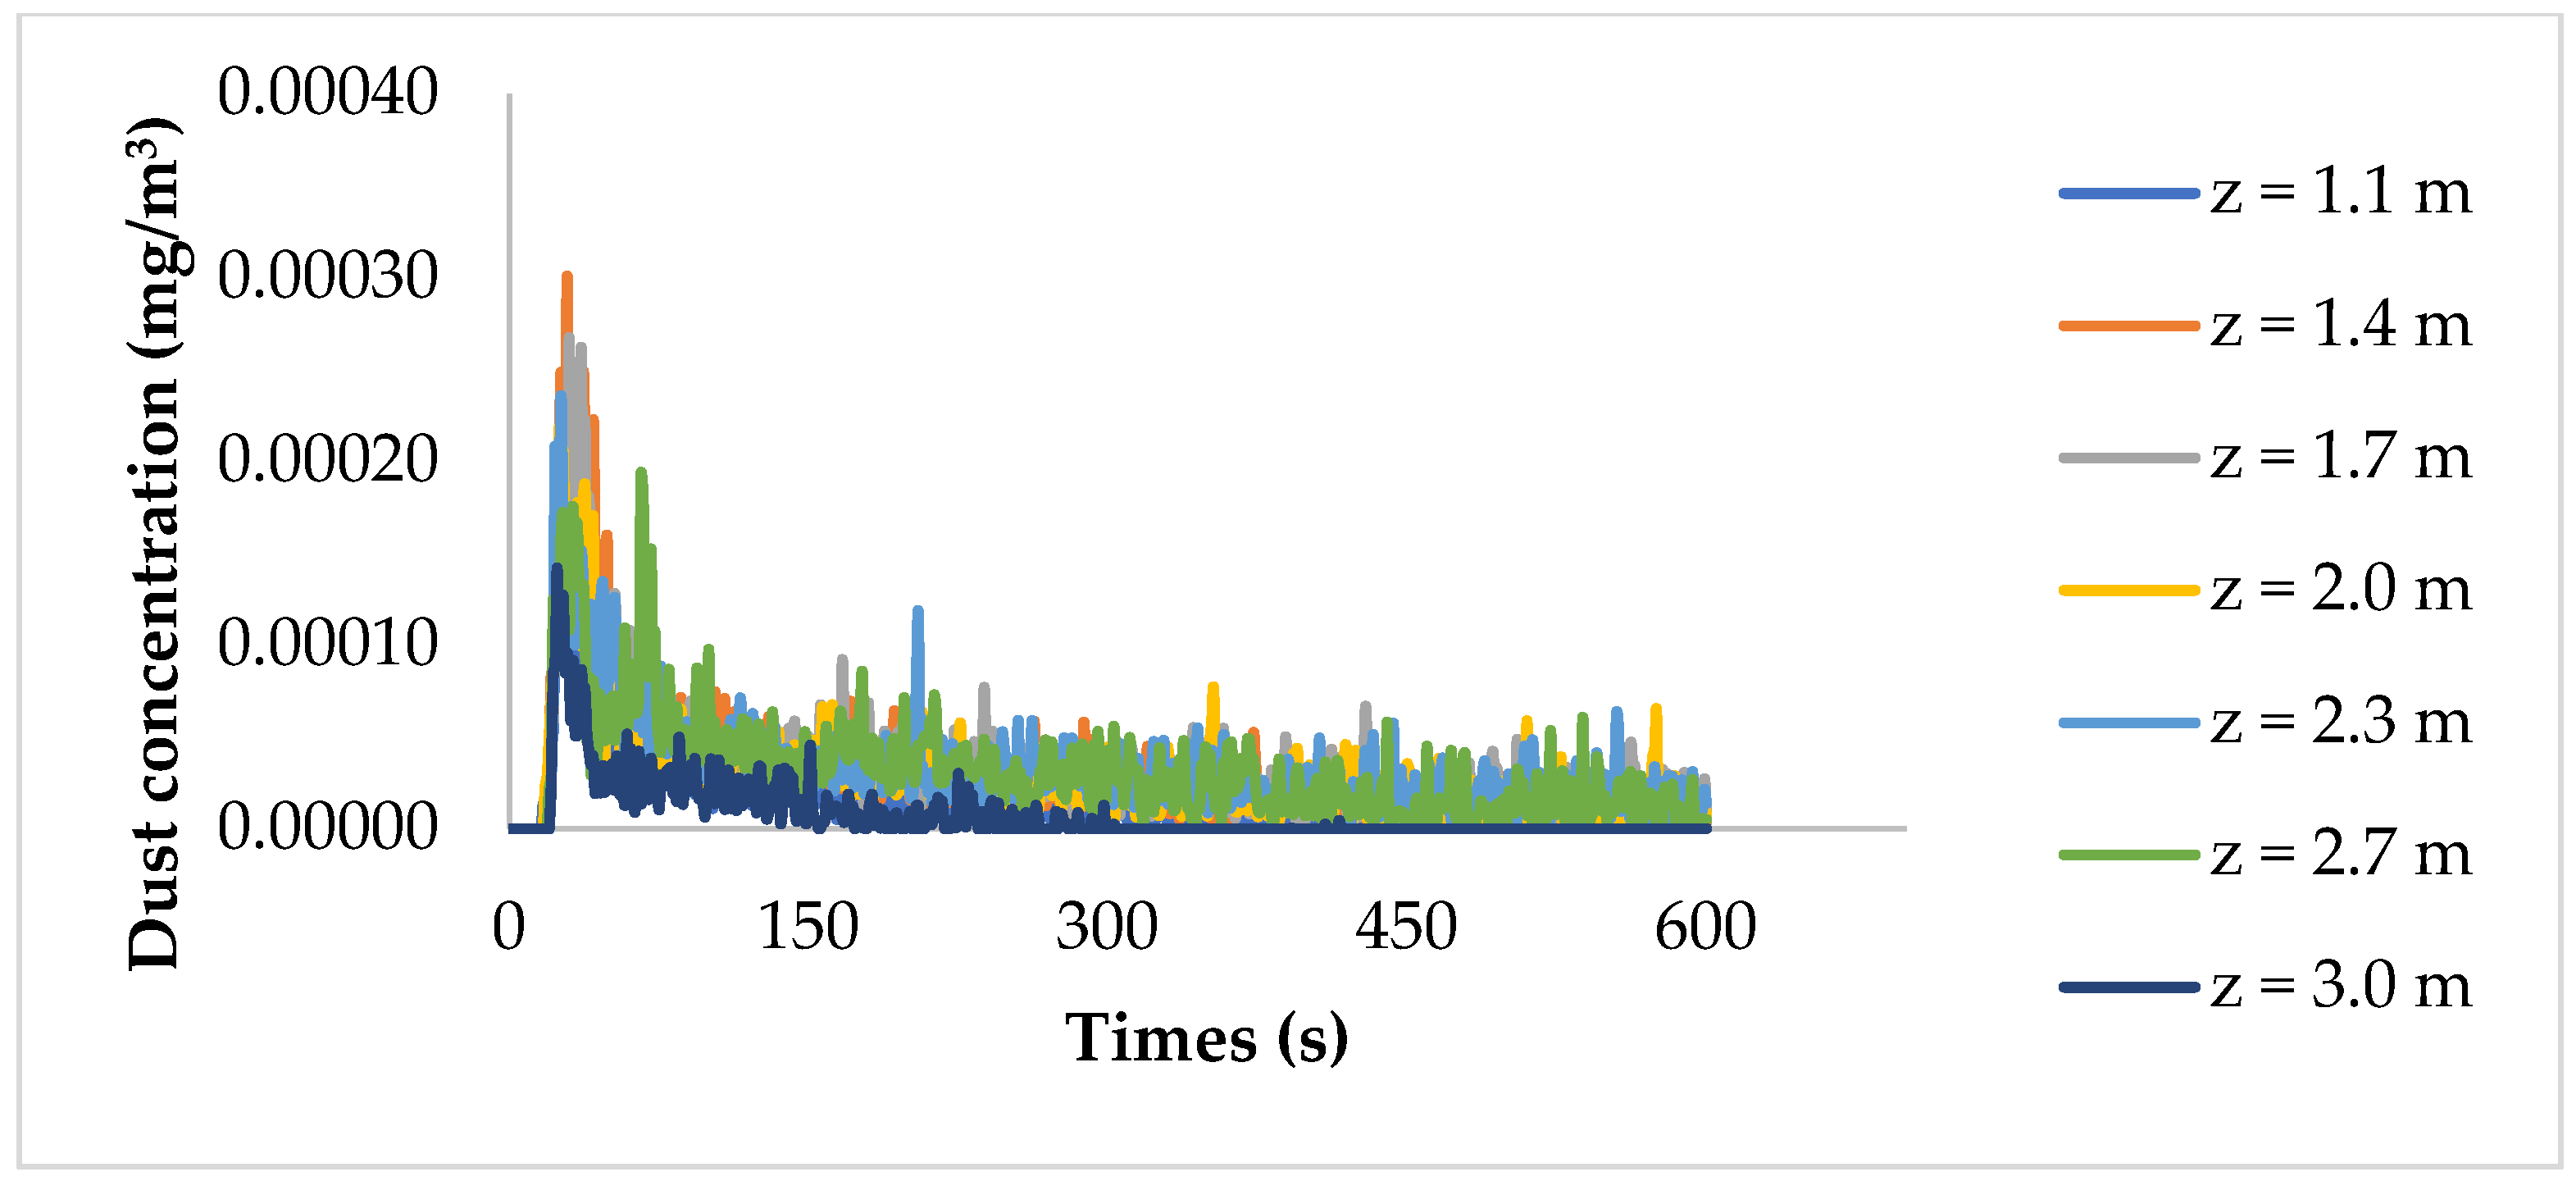
Figure 20 and Figure 21 show that at distances of 3 m and 6 m from the face, the results also indicate that within approximately 10 s, the dust concentration is lower for the h = 3.0 model compared to the other positions. It takes about 270 s for the dust concentration to decrease to 10 mg/m3 for the h = 3.0 m model, whereas the remaining models require between 450 and 600 s. At the measurement location 3 m from the face with a total time of 600 s the average concentration at h = 1.1 m was 19.5 mg/m3, at h = 1.4 m the average concentration was 29.5 mg/m3, at h = 1.7 m the average concentration was 28.9 mg/m3, at h = 2.0 m the average concentration was 24.6 mg/m3, at h = 2.3 m the average concentration was 27.9 mg/m3, at h = 2.7 m the average concentration was 22 mg/m3, and at h = 3.0 m the average concentration was 12.6 mg/m3.
At the measurement location 6 m from the face, the average concentration at h = 1.1 m was 17.1 mg/m3; at h = 1.4 m, the average concentration was 28.2 mg/m3; at h = 1.7 m, the average concentration was 31.4 mg/m3; at h = 2.0 m, the average concentration was 27.7 mg/m3; at h = 2.3 m, the average concentration was 32.8 mg/m3; at h = 2.7 m, the average concentration was 31.6 mg/m3; and at h = 3.0 m, the average concentration was 8.12 mg/m3.
It is observed that at positions 3 m and 6 m from the face, h = 3.0 m yields the lowest average concentration, while the differences in concentration at other positions are not significantly large.
Consider Figure 22. At the position y = 1.5 m and h = 3.0 m, it takes 513 s for the dust concentration to decrease below 10 mg/m3. For the remaining models with a total time of 600 s, the maximum dust concentration still exceeds 10 mg/m3. This will adversely affect the health of the workers. The average concentration at h = 1.1 m was 1320 mg/m3; at h = 1.4 m, the average concentration was 1930 mg/m3; at h = 1.7 m, the average concentration was 1900 mg/m3; at h = 2.0 m, the average concentration was 1330 mg/m3; at h = 2.3 m, the average concentration was 928 mg/m3; at h = 2.7 m, the average concentration was 422 mg/m3; and at h = 3.0 m, the average concentration was 199 mg/m3.
We can see that the differences in dust concentration are quite large between the positions, with the highest concentration at h = 1.4 m, followed by h = 1.7 m, h = 1.1 m, h = 2.0 m, h = 2.3 m, lower at h = 2.7 m, and the lowest at h = 3.0 m
Therefore, the results indicate that there is no significant difference in average dust concentration at positions 1.0 m, 3.0 m, and 6.0 m from the face, with heights ranging from h = 1.1 m to h = 2.7 m. However, the position of h = 3.0 m for the ventilation duct proves to be more effective in reducing dust concentration within the work area for laborers, as evident from the results. At a height of 1.5 m from the ground, there is a very large difference in dust concentration. The dust reduction model is effective with heights of h = 3.0 m.

4.4. Model Validation Results

Based on the actual measurement results in various cases, the airflow speed in the duct varies with V = 9 m/s, 12 m/s, 15 m/s, and 18 m/s. The average dust concentration results were measured at a cross-section located 1.0 m, 3.0 m, and 6.0 m from the mirror. Measurements were taken at three points, A(1, 1.5), B(2.25, 1.5), and C(3.5, 1.5), arranged as shown in Figure 1, and the average concentration results were recorded. The measurements were taken at intervals between 9 and 10 min using a Knomax dust concentration meter. The actual and simulated measurement results are shown in Figure 23.
From the data in Figure 23, it can be seen that the simulated dust concentration results are consistent with the actual measured results, with a relative error ranging from 4.89% to 14.7% and an average of 6.03%. Therefore, the numerical simulation results can accurately reflect the actual conditions in the Mong Duong coal mine.

5. Conclusions

The paper analyzes local airflow parameters such as wind velocity and the position of ventilation ducts that influence the flow field and dispersion characteristics of post-blasting dust over time and space within the tunnel. Based on theoretical studies of two-phase gas–solid flows and airflow simulation, the FLUENT software is employed to simulate dust concentration changes. The following conclusions can be drawn:
Within the scope of the study, wind speed significantly influences the dispersion and settling of dust in the tunnel. The paper has shown the relationship between wind speed and dust concentration, as well as the relationship between wind speed and the distance of dust dispersion in the roadway space, which follows a quadratic relationship. From this, it is evident that higher wind speeds lead to more effective dust reduction. At a wind speed of V = 18 m/s, the dust removal efficiency is optimal.
The change in height of the ventilation duct significantly affects the dust concentration within the roadway space, especially at a height of 1.5 m above the ground, which is the respiratory height. Considering the dust distribution and dispersion characteristics, the recommended layout of the air duct used on site is, therefore, as follows: the air duct is hung on the side at a height of h = 3.0 m where the ventilation and dust extraction efficiency in the tunnel is optimal.

Author Contributions

Conceptualization, Q.V.N., T.V.N. and P.D.N.; methodology, Q.V.N. and T.V.N.; software, Q.V.N. and T.V.N.; validation, T.V.N. and P.D.N.; formal analysis, Q.V.N., T.V.N., and P.D.N.; investigation, Q.V.N. and T.V.N.; resources, P.D.N.; data curation, Q.V.N. and P.D.N.; writing—original draft preparation, Q.V.N. and P.D.N.; writing—review & editing, Q.V.N. and T.V.N.; visualization, T.V.N. and P.D.N.; supervision, Q.V.N. and P.D.N.; project administration, T.V.N. and P.D.N.; funding acquisition, Q.V.N. and T.V.N. All authors have read and agreed to the published version of the manuscript.

Funding

This research was funded by the Vietnamese Ministry of Education and Training under Grant No. B2022-MDA-11.

Institutional Review Board Statement

Not applicable.

Informed Consent Statement

Not applicable.

Data Availability Statement

Data are contained within the article.

Acknowledgments

The authors gratefully acknowledge the financial support provided by the Vietnamese Ministry of Education and Training under Grant No. B2022-MDA-11.

Conflicts of Interest

The authors declare no conflicts of interest.

Abbreviations

List of symbols:
Lthe length of roadway (m)
ythe height of the roadway (m)
bthe width of the roadway (m)
ϕductair duct diameter (m)
hductair duct height (m)
Vwind velocities using (m/s)
trepresents time (s)
ρis the air density (kg/m3)
Ti,jis the Reynolds stress tensor
ցjis the acceleration of gravity (kg/m2)
xi and xjare the coordinates in the X, Y directions.
ui and ujare the velocities in the X, Y directions (m/s).
Fiis the particle flow resistance (N)
kis the turbulent kinetic energy (m2/s2)
μthe laminar viscosity coefficient
Gkis the rate of turbulent energy production caused by the mean velocity gradient, kg/(s3.m)
μtis the viscosity coefficient for turbulent flow, Pa.s
εis the dissipation velocity of the turbulent kinetic energy, m2/s3
C1ε, C2ε, , σk, and σεare empirical constants.
FD(uup)is the drag force on the particle per unit mass (N)
CDis the drag force coefficent.
uis the fluid phase velocity (m/s)
upis the particle velocity (m/s)
ρpis the particle density (kg/m3)
dpis the particle diameter (m)
τpis the relaxation time of the particle (s)
u ¯ is the average velocity (m/s)
u′(t) is the pulsation velocity (m/s)
Fis normal contact force between particles
Y*is the equivalent Young’s modulus
Mis the particle mass
Ris the equivalent radius
δijis the normal overlap
Sn, ijis the normal stiffness
Vnis the normal component of the relative velocity
Ft, ijis denotes the tangential force
δt,ijis the tangential overlap
St,ijis the tangential stiffness
μsis the coefficient of static friction
G*is the shear modulus.
Lijis the distance from the center of particle i to the contact plane with particle j
nijis the represents the normal unit vector between two contacted particles
ωijis the angular velocity vector of the object at the contact point

References

  1. Thao, L.V. Study on Dust Control in Stone Furnaces of Underground Coal Mines; Scientific Research Project, Ministry of Industry: Hanoi, Vietnam, 1995. (In Vietnamese)
  2. Manh, L.V. Study on the Impact and Measures to Reduce Dust Effects on Workers in Underground Coal Mines in Quang Ninh Province. Ph.D. Thesis, University of Mining and Geology, Hanoi, Vietnam, 2018. (In Vietnamese). [Google Scholar]
  3. Quang, N.V.; Thinh, N.V. Study on Solutions to Reduce Dust Concentration and Improve Climatic Conditions in Mining Faces of Nui Beo Coal Mine. Ind. Min. J. 2019, 2, 60–64. (In Vietnamese) [Google Scholar]
  4. Geng, F.; Zhou, F.B.; Luo, G. Research Status and Method Progress of Dust Prevention and Control Technology for Fully Mechanized Heading Face in Coal Mine. Min. Saf. Environ. Prot. 2014, 41, 85–89. (In Chinese) [Google Scholar]
  5. Zhang, L.; Zhou, G.; Ma, Y.; Jing, B.; Sun, B.; Han, F.; He, M.; Chen, X. Numerical analysis on spatial distribution for concentration and particle size of particulate pollutants in dust environment at fully mechanized coal mining face. Powder Technol. 2021, 383, 143–158. [Google Scholar] [CrossRef]
  6. Kanaoka, C.; Furuuchi, M.; Inaba, J.; Ohmata, K.; Myojo, T. Flow and dust concentration near working face of a tunnel under construction. Doboku Gakkai Ronbunshu 2002, 714, 43–52. [Google Scholar] [CrossRef] [PubMed]
  7. Rao, S.; Baafi, E.Y.; Aziz, N.I.; Singh, R.N. Three dimensional numerical modeling of air velocity and dust control techniques in a langwall face. In Proceedings of the 6th US Mine Ventilation Symposium, Salt Lake City, UT, USA, 21–23 June 1993. [Google Scholar]
  8. Jiang, W.; Xu, X.; Wen, Z.; Wei, L. Applying the similarity theory to model dust dispersion during coal-mine tunneling. Process Saf. Environ. Prot. 2021, 148, 415–427. [Google Scholar] [CrossRef]
  9. Cashdollar, K.L.; Zlochower, I.A. Explosion temperatures and pressures of metals and other elemental dust clouds. J. Loss Prev. Process Ind. 2007, 20, 337–348. [Google Scholar] [CrossRef]
  10. Li, Q.; Wang, K.; Zheng, Y.; Mei, X.; Lin, B. Explosion severity of micro-sized aluminum dust and its flame propagation properties in 20L spherical vessel. Powder Technol. 2016, 301, 1299–1308. [Google Scholar] [CrossRef]
  11. Castellanos, D.; Carreto-Vazquez, V.H.; Mashuga, C.V.; Trottier, R.; Mejia, A.F.; Mannan, M.S. The effect of particle size polydispersity on the explosibility characteristics of aluminum dust. Powder Technol. 2014, 254, 331–337. [Google Scholar] [CrossRef]
  12. Hu, S.; Liao, Q.; Feng, G.; Huang, Y.; Shao, H.; Gao, Y.; Hu, F. Influences of ventilation velocity on dust dispersion in coal roadways. Powder Technol. 2020, 360, 683–694. [Google Scholar] [CrossRef]
  13. Zhang, G.; Zhou, G.; Song, S.; Zhang, L.; Sun, B. CFD investigation on dust dispersion pollution of down/upwind coal cutting and relevant countermeasures for spraying dustfall in fully mechanized mining face. Adv. Powder Technol. 2020, 31, 3177–3190. [Google Scholar] [CrossRef]
  14. Zhanyou, S.; Feng, L.; Bo, Q.; Xiaohong, P. Numerical simulation study of dust concentration distribution regularity in cavern stope. Saf. Sci. 2012, 50, 857–860. [Google Scholar]
  15. Patankar, N.A.; Joseph, D.D. Modeling and numerical simulation of particulate flows by the Eulerian-Lagrangian approach. Int. J. Multiph. Flow 2001, 27, 1659–1684. [Google Scholar] [CrossRef]
  16. Zhang, J.J. Gas-Solid Two-Phase Flow Simulation of Dust Migration and Deposition in Fully Mechanized Excavation Face. Master’s Thesis, University of Mining and Technology, Xuzhou, China, 2015. (In Chinese). [Google Scholar]
  17. Zhou, G.; Liu, Y.; Liu, Z.; Zhang, Y.; Zhu, Y.; Sun, B.; Ma, Y. Study on the characteristics of compound dust source pollution and foam dust suppression technology in coal mine anchor excavation production. Process Saf. Environ. Prot. 2024, 186, 593–611. [Google Scholar] [CrossRef]
  18. Shi, J.; Zhang, W.; Guo, S.; An, H. Numerical Modelling of Blasting Dust Concentration and Particle Size Distribution during Tunnel Construction by Drilling and Blasting. Metals 2022, 12, 547. [Google Scholar] [CrossRef]
  19. Liu, H.; Wu, X.; Mao, S.; Li, M.; Yue, J. A Time Varying Ventilation and Dust Control Strategy Based on the Temporospatial Characteristics of Dust Dispersion. Minerals 2017, 7, 59. [Google Scholar] [CrossRef]
  20. Yu, H.; Cheng, W.; Xie, Y.; Peng, H. Micro-scale pollution mechanism of dust diffusion in a blasting driving face based on CFD-DEM coupled model. Environ. Sci. Pollut. Res. 2018, 25, 21768–21788. [Google Scholar] [CrossRef] [PubMed]
  21. Feng, G.; Liao, Q.; Hu, S. Numerical Simulation of Particulate Matter 2.5 Distribution in a Roadway. Sci. Rep. 2018, 8, 13220. [Google Scholar] [CrossRef] [PubMed]
  22. Mine Rescue Center. Gas Analysis Results of Vietnam National Coal and Mineral Industries Group; Mine Rescue Center: Quang Ninh, Vietnam, 2024. (In Vietnamese)
Figure 1. Tunnel model, mesh, and air duct suspension positions.
Applsci 14 05643 g001
Figure 2. Velocity distribution on longitudinal cross-section along the heading face with V = 9 m/s.
Applsci 14 05643 g002
Figure 3. Velocity distribution on longitudinal cross-section along the heading face with V = 12 m/s.
Applsci 14 05643 g003
Figure 4. Velocity distribution on longitudinal cross-section along the heading face with V = 15 m/s.
Applsci 14 05643 g004
Figure 5. Velocity distribution on longitudinal cross-section along the heading face with V = 18 m/s.
Applsci 14 05643 g005
Figure 6. Graph depicting the average wind velocity across longitudinal cross-sections along the heading face.
Applsci 14 05643 g006
Figure 7. Dust dispersion results in the tunnel space-time domain for V = 9 m/s and V = 12 m/s.
Applsci 14 05643 g007
Figure 8. Dust dispersion results in the tunnel space-time domain for V = 15 m/s and V = 18 m/s.
Applsci 14 05643 g008
Figure 9. Dust diffusion graph in time and space.
Applsci 14 05643 g009
Figure 10. Dust distribution on the cross-section at a distance of y = 1.5 m from the tunnel floor (respiratory zone height).
Applsci 14 05643 g010
Figure 11. Dust concentration at y = 1.5 m.
Applsci 14 05643 g011
Figure 12. Dust concentration at a distance of 1.0 m from the face.
Applsci 14 05643 g012
Figure 13. Dust concentration at a distance of 3.0 m from the face.
Applsci 14 05643 g013
Figure 14. Dust concentration at a distance of 6.0 m from the face.
Applsci 14 05643 g014
Figure 15. The relationship between the average concentration and wind speed at position y = 1.5m.
Applsci 14 05643 g015
Figure 16. The relationship between the average concentration and wind speed at a position 1.0 m away from the face.
Applsci 14 05643 g016
Figure 17. The relationship between the average concentration and wind speed at a position 3.0 m away from the face.
Applsci 14 05643 g017
Figure 18. The relationship between the average concentration and wind speed at a position 6.0 m away from the face.
Applsci 14 05643 g018
Figure 19. The maximum dust concentration at a position 1.0 m from the face corresponds to the location of the air duct.
Applsci 14 05643 g019
Figure 20. The maximum dust concentration at a position 3.0 m from the face corresponds to the location of the air duct.
Applsci 14 05643 g020
Figure 21. The maximum dust concentration at a position 6.0 m from the face corresponds to the location of the air duct.
Applsci 14 05643 g021
Figure 22. The maximum dust concentration at a position 1.5 m from the floor corresponds to the location of the air duct.
Applsci 14 05643 g022
Figure 23. The maximum dust concentration at a position 1.5 m from the floor corresponds to the location of the air duct.
Applsci 14 05643 g023
Table 1. Fluent model configuration parameters.
Parameter NameParameter SettingParameter NameParameter Setting
SolverPressure-based solverMin. particle diameter1 × 10−6 (m)
Viscous modelk—epsilon modelMax. particle diameter0.0001 (m)
Inlet boundary typeVelocity inletMedian diameter1.5 × 10−5 (m)
Inlet velocity9 m/s; 12 m/s; 15 m/s; 18 m/sDistribution index3.5
Outlet boundary typePressure outletMass flow rate0.0012 kg/s
MaterialCoal—hvHeight of the air duct1.1 m, 1.4 m, 1.7 m, 2.3 m, 2.7 m, 3.0 m
Diameter distributionRosin–RammlerInjection typeSurface
Number of timesteps for transient simulation600 sMaterialCoal—HV
Drag lawSphericalPhysical models; Saffman Lift forceDEM Collisiom
DPM-boundary typeReflectDiscrete Phase modelInteraction: interaction with continuous phase; particle treatment: unsteady particle tracking; Stochastic tracking: discrete random walk model
Disclaimer/Publisher’s Note: The statements, opinions and data contained in all publications are solely those of the individual author(s) and contributor(s) and not of MDPI and/or the editor(s). MDPI and/or the editor(s) disclaim responsibility for any injury to people or property resulting from any ideas, methods, instructions or products referred to in the content.