Article

Designing a Socially Assistive Robot to Assist Older Patients with Chronic Obstructive Pulmonary Disease in Managing Indoor Air Quality

1
Department of Health Policy and Management, Kangwon National University School of Medicine, Chuncheon-si 24341, Gangwon, Republic of Korea
2
School of Social Work, University of North Carolina at Charlotte, Charlotte, NC 28223, USA
3
Department of Internal Medicine, Kangwon National University School of Medicine, Chuncheon-si 24341, Gangwon, Republic of Korea
*
Author to whom correspondence should be addressed.
Appl. Sci. 2024, 14(13), 5647; https://doi.org/10.3390/app14135647
Submission received: 30 May 2024 / Revised: 24 June 2024 / Accepted: 26 June 2024 / Published: 28 June 2024

Abstract

:
Chronic obstructive pulmonary disease (COPD) stems from airflow blockage and lung damage, and indoor air pollution exacerbates COPD, underscoring the necessity for proactive management. Older COPD patients, prone to respiratory and heat-related issues, require crucial assistance, yet their reduced awareness necessitates ongoing education to identify and enhance indoor air quality. To tackle this challenge, we developed a socially assistive robot (SAR) integrating IoT air quality sensors to guide patients in improving indoor air quality (IAQ). This study evaluated IAQ enhancement among older COPD patients using this technology, uncovering a significant reduction in ‘poor air quality alerts’ with a clear linear trend. Although ‘good alerts’ remained consistent, machine learning models predicted improved air quality post-alerts. Consistent alerts serve as a motivating factor for patients to maintain IAQ standards. However, barriers to SAR utilization, such as psychological and operational hurdles, need to be addressed in future research endeavors.

1. Introduction

Chronic obstructive pulmonary disease (COPD) refers to a group of diseases that cause airflow blockage and breathing-related problems by damage to the airways and lung tissue [1]. Affecting approximately 10% of the population, COPD is a leading cause of death worldwide [2] and incurs significant costs to the healthcare system. Furthermore, it is associated with various comorbidities, including arterial, metabolic, and psychological disorders [3]. The primary risk factors for COPD are active smoking, occupational exposures, infections, air pollution [4], and aging, which leads to numerous physiological changes in lung function [5].
Due to symptoms such as breathlessness, chronic fatigue, and cough, COPD patients often spend a significant amount of time indoors [6]. Despite this, indoor air quality has been largely neglected [7], even though the air quality within buildings is a crucial determinant of health [8]. Notably, indoor levels of PM2.5 are significantly higher in homes with smokers [9]. Exposure to indoor air pollution [10,11], dampness, inadequate ventilation [8,12], and fine and ultrafine dust [13,14] are risk factors for the development and exacerbation of COPD. Additionally, if indoor temperatures are not properly regulated, older adults with weakened thermoregulation can be at risk for heat-related illnesses [15], which can contribute to the occurrence of respiratory diseases [16,17].
To address this issue, various strategies have been identified to promote air quality self-management for asthma and COPD patients. A recent systematic review categorized these interventions into four types: vigilance interventions (e.g., visits by health professionals), monitoring interventions (e.g., measuring indoor and outdoor air quality), education interventions (e.g., alerts about air quality, temperature, and humidity), and policy interventions (e.g., smoke-free regulations) [18]. The review indicated that although the available evidence on air quality self-management for individuals is limited, a comprehensive strategy to assist patients is necessary [18]. However, studies encompassing these intervention strategies have been scarce so far.
On the other hand, the Internet of things (IoT) has emerged as a tool for home health management [19]. Its strength lies in its continuous connectivity and its ability to gather information about the surrounding environment [20]. However, due to lower digital literacy and accessibility, older adults often find it difficult to use and manage IoT devices [21]. Previous research has shown that mobile application alerts, AI speakers, and web pages are often not suitable for older patients due to their complexity [22]. Additionally, because of the decline in sensory and cognitive functions in older patients [23], it is necessary to repeatedly provide training and education. Information on indoor air conditions and recommendations should be provided with the consideration of patient (user) experience and a user-centered design [24].
Socially assistive robots (SARs) can be a viable option for managing indoor air quality for COPD patients due to their technical scalability and user-centered design. Previous studies have leveraged the technological scalability of SARs in various fields, including emotional and physiological therapy, training, social facilitation, reminders, companionship, and assistance with daily tasks [23,25,26,27]. The use of SARs has primarily focused on treating patients with mental conditions such as dementia [28] or autism [29]. Following COVID-19, SAR functions related to healthcare coaching, including promoting medical adherence and physical functions, have become more prominent [30]. Consequently, SARs can also be connected to IoT sensors that detect and log the quality of indoor air.
In addition, SARs assist human users through social interaction [31]. Since the main users of SARs are older adults and patients who spend long periods indoors, need companionship, and require proper suggestions, a distinct advantage of SARs is their indoors installation. This approach can enhance user experience, as SARs provide suggestions with warm and encouraging words, motivating patients to participate more actively in their healthcare and self-management [32]. Therefore, if a SAR can make proper suggestions about air quality during their interactions, it might help patients manage their indoor environment more effectively.
Bearing these principles in mind, we developed a system that integrates SARs and the IoT to utilize real-time detected information for interactive health management facilitated by SARs. The system operates as follows: (1) sensors detect air conditions, (2) the information collected from the sensors is sent to a server and converted into push data, (3) the push data are sent to the SAR, which then announces the indoor and outdoor air conditions and suggests ways to improve indoor air quality, (4) the COPD patient listens to the announcement and follows the instructions, and (5) the sensor detects the air condition again and provides feedback on the indoor air quality.
This research aims to analyze changes in indoor air quality (IAQ) as an indicator of patients’ responses to SAR notifications about air quality. Our research question investigates whether SAR-delivered notifications about IAQ can enhance the self-management skills of COPD patients in real-life settings. Additionally, this study aims to identify the perceived advantages and disadvantages experienced by COPD patients after using SARs.

2. Materials and Methods

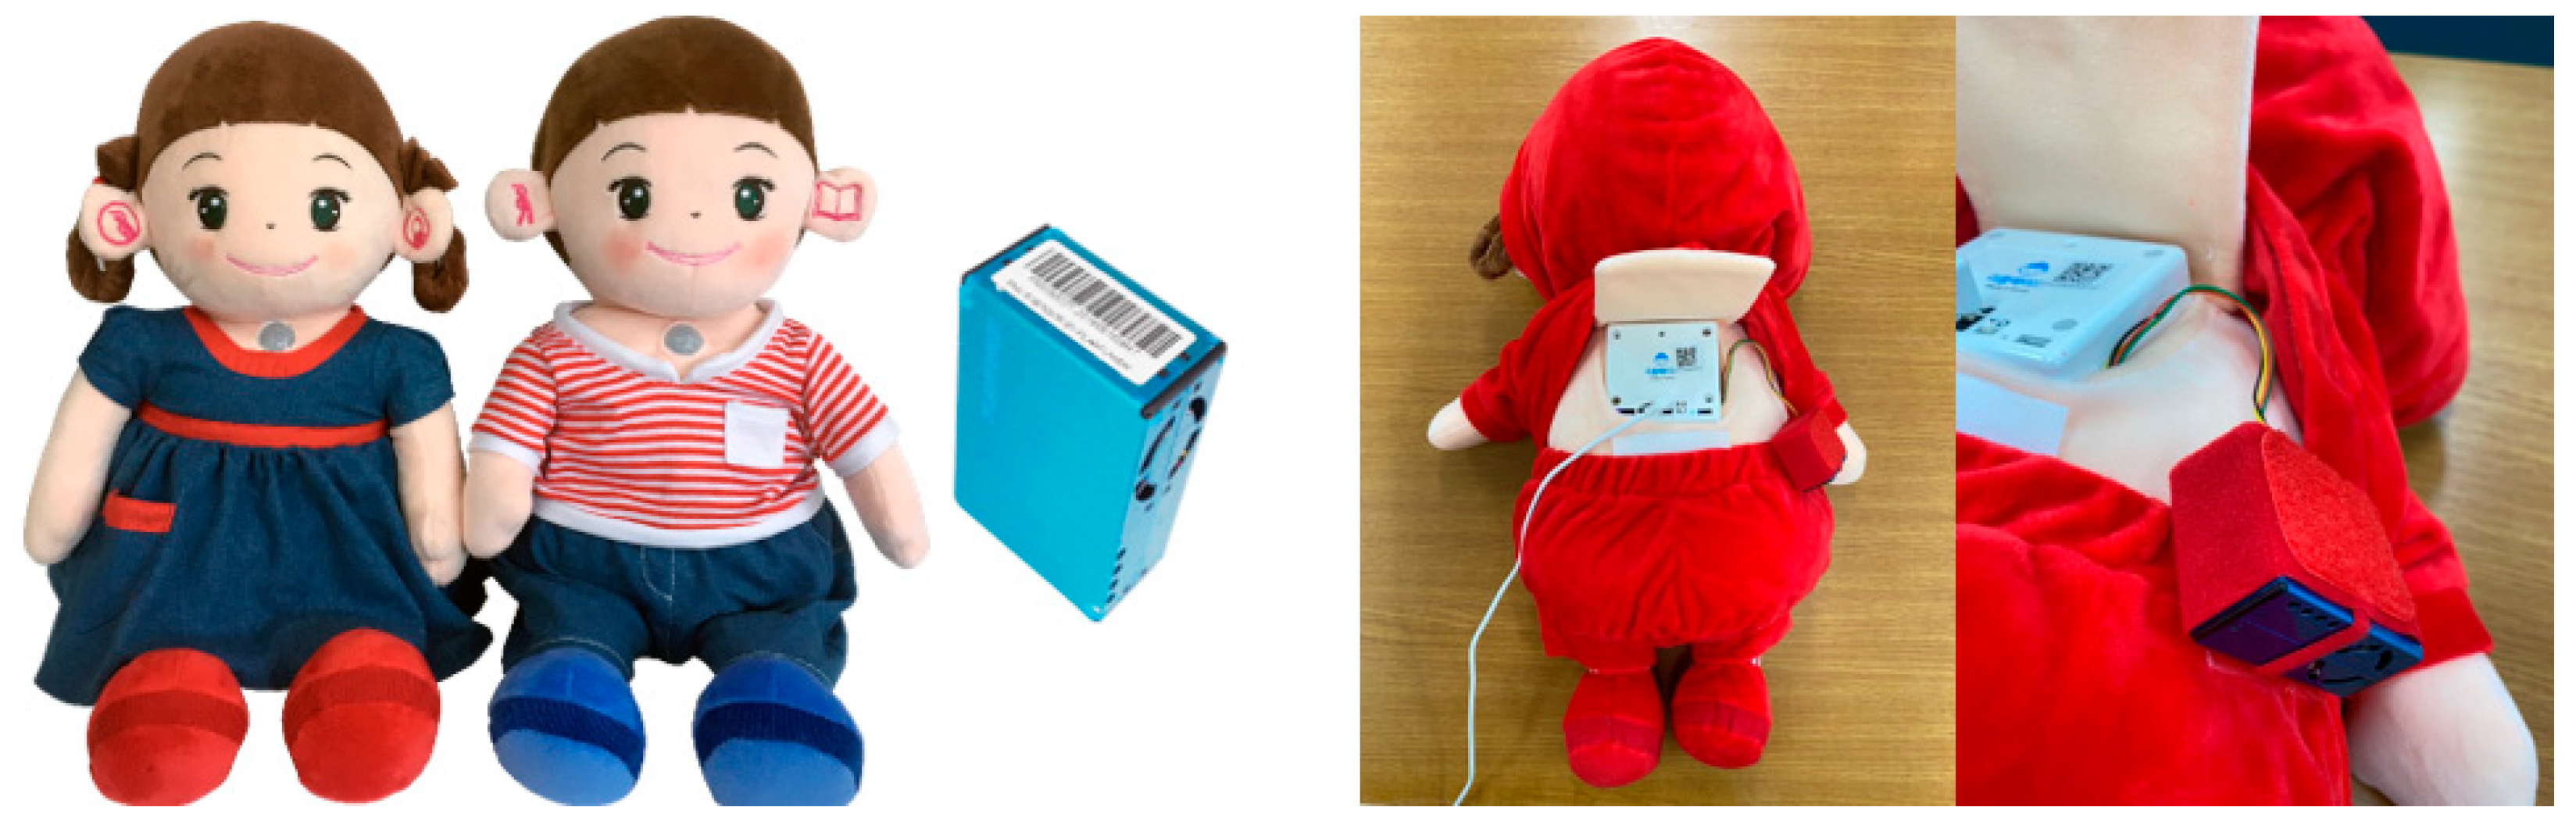
2.1. A Socially Assistive Robot with an Air Quality Sensor

We utilized a SAR named ‘Hyodol’, developed by the Hyodol Corporation in Seoul, Korea. Hyodol is a doll-shaped companion robot resembling a 7-year-old child (Figure 1). It is equipped with touch sensors on the head and back, buttons on the ears and hands, and an electronic control unit with antennas inside [33]. The care robot provides daily routine reminders for tasks such as taking medication, eating meals, and attending appointments. It also offers cognitive enhancement activities like singing, stretching, quizzes, and religious practices. Despite its doll-like appearance, Hyodol can maintain an upright seated position independently. Once fully charged, its battery lasts approximately 48 h, allowing elderly individuals to carry it to different locations within their living space. The SAR is equipped with a built-in speaker that delivers a maximum volume of 110 dB and an average volume of approximately 92.8 dB, ensuring that the sound is both loud and clear, making it suitable for elderly patients. This configuration enables Hyodol to be easily transported and used effectively in various living spaces.
One significant advantage of using a SAR as a mediator is that it introduces an element of play for the elderly. For older adults, interacting with a care robot is akin to engaging in a playful activity. The SAR is designed to be constantly interactive, initiating conversations in a kind and friendly manner on various topics. With around 4000 different phrases, Hyodol (version 1) can effectively capture the attention of elderly patients. This interaction helps reduce loneliness, providing a companion to talk with and simulating the experience of hugging, patting, and stroking a grandchild [34]. Moreover, the care robot responds to gestures such as hugging, patting, and touching. This interaction is crucial in allowing the elderly to experience hedonic motivation through the care robot [22].
We connected a “PMS5003T” air quality sensor (Plantower, Beijing, China) to the SAR. This real-time air quality monitoring device can measure temperature, humidity, and the concentrations of fine and ultrafine dust particles [35]. It measures airborne dust using laser particle detection and can detect particles with a minimum diameter of 0.3 μm. The sensor’s patented six-sided shielding structure ensures high anti-interference performance. It also includes options for different air inlet and outlet directions to accommodate various installation designs. Table 1 summarizes the measurement range and accuracy of the sensor. Although the sensor contains an air-circulating fan to reduce measurement errors, we attached it to the back of the SAR to ensure that diffusible dust raised during hugging or touching the SAR would not distort the measurements.

2.2. Collection of Weather (Atmosphere) Information

Given that weather conditions affect IAQ and to provide contextual alerts, we integrated outdoor air quality information into our system. The ‘automatic weather system’ of the Korean Meteorological Administration provides real-time weather information, including temperature and humidity, for internet-accessed locations [36]. Additionally, the ‘air pollution information’ from the Korean Environment Corporation offers real-time data on fine dust (PM10) and ultrafine dust (PM2.5) concentrations [37]. We configured the internet server to fetch real-time information on outdoor temperature, humidity, fine dust, and ultrafine dust.

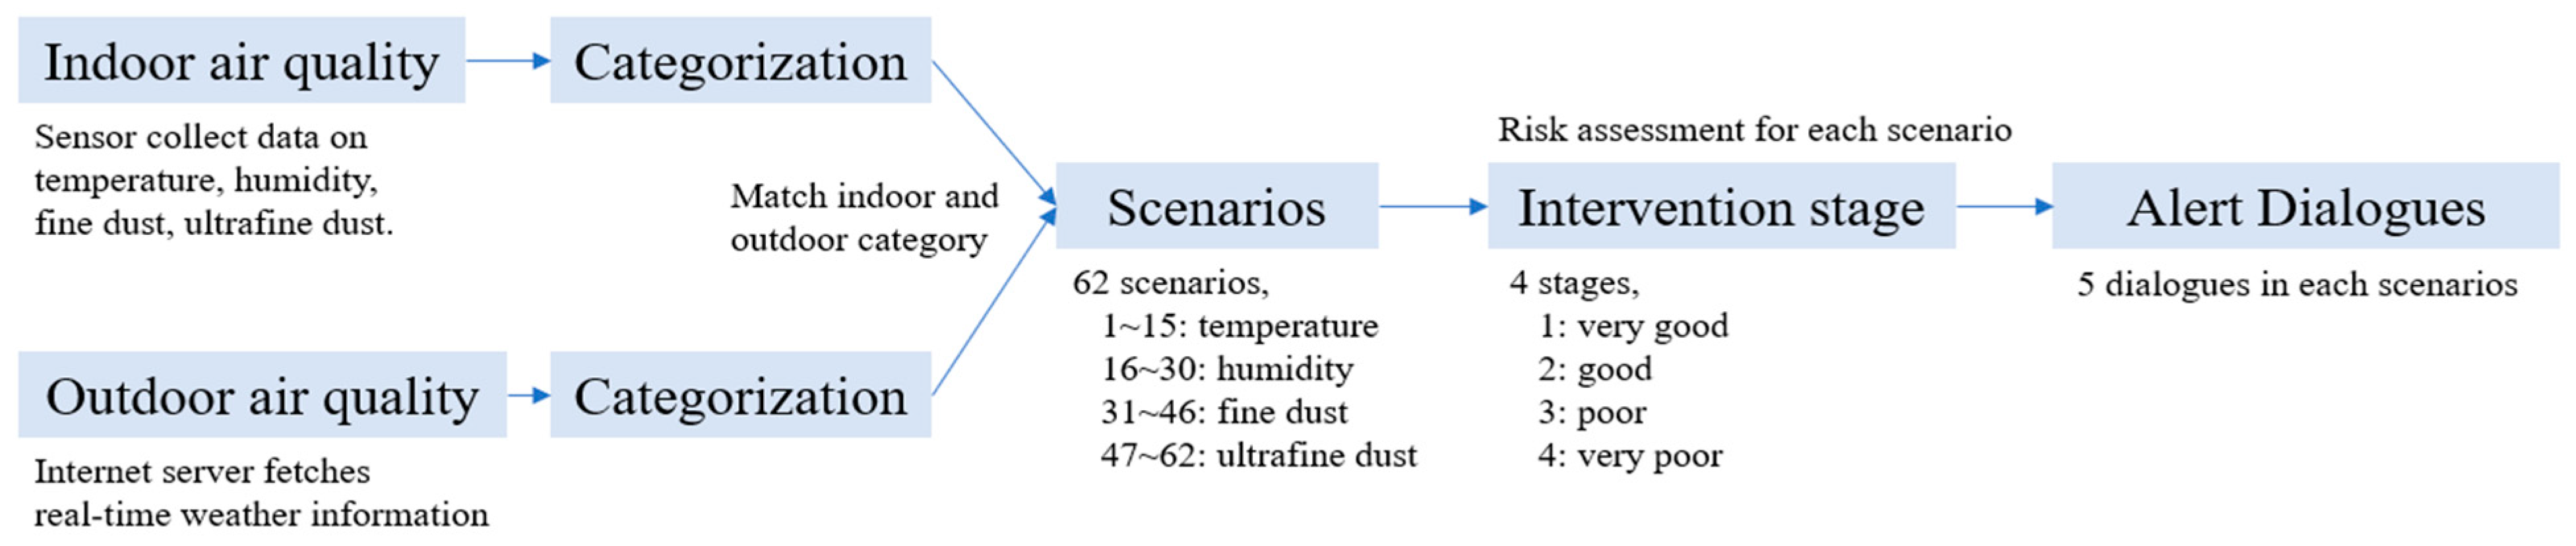
2.3. Scenarios and Intervention Stages

2.3.1. Combinations of Indoor and Outdoor Air Quality: Scenarios

We collected and transmitted four types of indoor and outdoor air quality data to the internet server: temperature, humidity, fine dust, and ultrafine dust concentrations. To enable systematic guidance based on the gathered data, we categorized the air quality information according to potential hazards, following the standards set by the Korean Meteorological Administration (see Table 2). We then matched IAQ categories with outdoor air quality categories to consider all possible scenarios for each air quality type. A total of 62 scenarios were derived (see Table S1).

2.3.2. Risk Assessment: Intervention Stages

Since the degree of harm to health depends on the air quality level, the content of the alerts must be sensitive to these levels. Therefore, we constructed scenarios to guide the utilization of the collected data (temperature, humidity, fine dust, and ultrafine dust) according to consistent criteria, using the range of air quality categories defined by governmental agencies. The differentiation of temperature and humidity was based on the “Living Weather Index” provided by the Korea Meteorological Administration’s website [38] and a systematic review [39]. The classification of fine dust concentration was based on the criteria used by the Korea Air Pollution Information Forecasting website [40].
We categorized the intervention stages into four levels to assess the risk level of each scenario and provide corresponding alerts. Intervention Stage 1 occurs when both indoor and outdoor air are deemed harmless. For instance, if the indoor and outdoor temperatures are at the ‘good’ level, this state is considered ideal, requiring no warning about air quality. Hence, we designate this as IAQ intervention Stage 1. Intervention Stage 2 emerges when IAQ is satisfactory but the external environment is unfavorable. Stage 3 pertains to cases where IAQ has deteriorated beyond the ‘normal’ or ‘good’ level, posing risks, particularly for older COPD patients, if exposure is prolonged. Stage 4 is assigned to scenarios where both indoor and outdoor air quality reach the most dangerous levels. For example, in Scenario 1, where the indoor temperature is ‘very hot’ and the outdoor temperature is ‘hot’, immediate action might be necessary to prevent potential harm.

2.3.3. Dialogues and Intervention Algorithm

We created five dialogues for each scenario, considering both indoor and outdoor air quality. These dialogues were then converted into Hyodol’s voice using text-to-speech engines. For scenarios in Stages 1 and 2, we provided suggestions for exercise or health tips while acknowledging the good air quality. For example, “The IAQ is very nice! Thanks!” (Scenario 8) or “On this hot day, take good care of your health. The indoor temperature is quite comfortable. Great job!” (Scenario 3).
In Stage 3, the prompts include suggestions for improving the air condition, such as the following: “Ventilation is essential for a pleasant life! Please open the window to let fresh air circulate.” (Scenario 22). For Stage 4, the SAR announces the measured air quality and warns about potential health risks, for example, “It’s very hot in here at 38 °C. What a scorching day! Make sure to turn on the air conditioner or fan!” (Scenario 1).
We designed the SAR to provide guidance whenever the IAQ stage changes. For instance, when the air quality remains good, as in Stages 1 and 2, alarms are set to occur every three hours. For Stage 3, alarms are scheduled every two hours, and for Stage 4, they occur every hour. Additionally, we programmed the SAR to not intervene during the participant’s sleeping hours. Figure 2 depicts the entire process of providing air quality alerts as a flowchart.

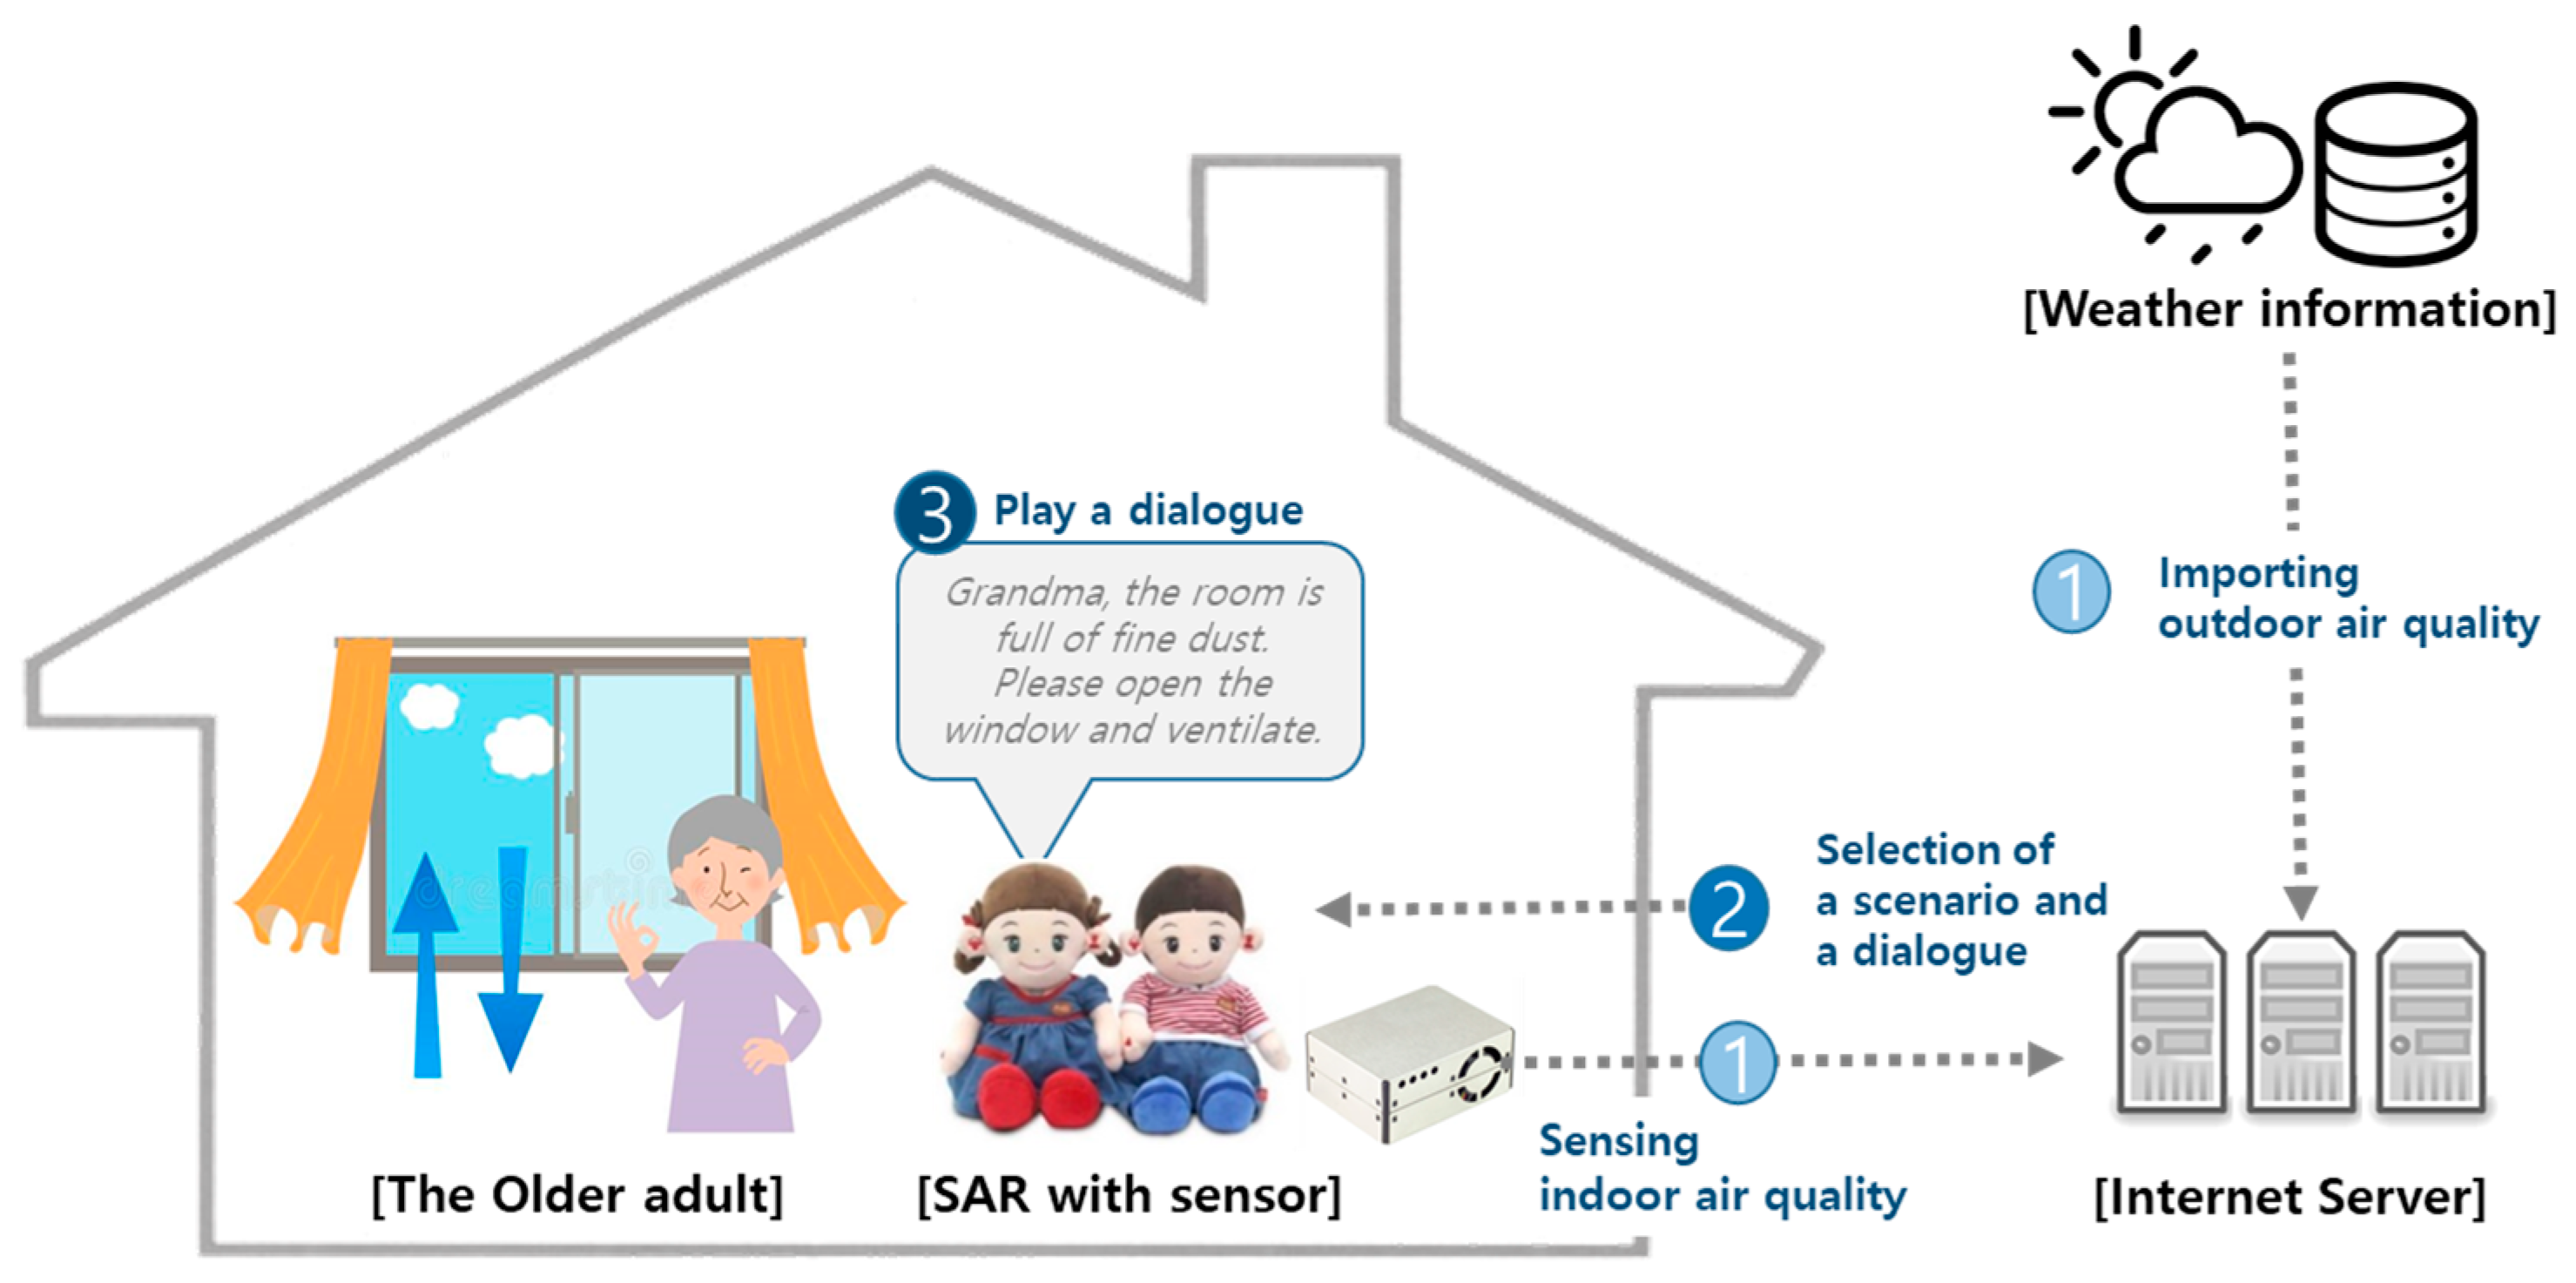
2.4. Operating Mechanism

Figure 3 further illustrates the alert system process of a SAR with an IAQ sensor. The internet server periodically monitors indoor and outdoor air quality at 5 to 10 min intervals, assessing the current air quality status and intervention stage. Should conditions necessitate an alert’s occurrence due to fluctuations in air quality, the internet server randomly selects one of five predefined dialogues corresponding to the situation, signaling the SAR system, which in turn delivers an alert to the COPD patient.

2.5. Participants

2.5.1. Inclusion and Exclusion Criteria

Participants were recruited using purposive sampling [41] from outpatients diagnosed with COPD at the pulmonology department of K*** hospital. The inclusion criteria were as follows: (1) aged over 65, (2) diagnosed with COPD, with a forced expiratory volume in one second (FEV1)/forced vital capacity ratio of less than 0.7 or an FEV1 of less than 80%, based on a lung function test with a bronchodilator, and (3) prescribed inhaler use. The exclusion criteria included any chronic conditions that made communication difficult or impossible, such as hearing or vision impairments.

2.5.2. Participant Information

A total of 25 COPD participants were initially recruited; however, 6 withdrew, 5 did not use the SAR continuously, and 3 encountered technical problems with the SAR. Consequently, real-time air quality logs of 11 participants were utilized. All the patients were male, the average age of the participants was 73.63 (SD = 7.86), and the average years of education was 10.82 (SD 4.14).

2.5.3. Research Process

A pulmonologist recruited patients during their outpatient counseling sessions. The physician provided a brief explanation of the study and obtained informed consent from the patients. Participants were informed that they had the right to withdraw from the study at any time.
A researcher visited each participant’s home to install the SAR and provide education on its use. After the installation of the SAR, logs regarding IAQ were sent to the internet server, and the SAR started issuing alerts. Subsequently, patients used the SAR for 8 weeks, based on criteria established by previous studies that set the intervention period at 6–8 weeks to determine the effect on lifestyle and healthcare [42,43].
During the 8-week period in which patients used the SAR, the SAR provided air quality alerts and collected air quality logs. At the end of the usage period, a researcher visited the patient’s home again to retrieve the SAR and conducted a brief interview about their experience using the SAR. (Figure 4)

2.6. Data Analysis

To investigate whether air quality alerts from the SAR contributed to the improvement in IAQ, we conducted an analysis using real-time data collected from both indoor and outdoor air quality, alongside SAR alert information. Two analytical approaches were employed for this assessment.
The first method involved examining the daily trend of air quality alert occurrences per hour. Each alert corresponded to a change in intervention stage, with alerts being more frequent during periods of poor air quality. We utilized two trendlines: one for ‘good alerts’, representing intervention Stages 1 and 2, and another for ‘poor alerts’, representing Stages 3 and 4. Therefore, with accumulated experience in receiving alerts via the SAR, it is reasonable to expect an improvement in air quality.
For the second method, we employed machine learning forecasting analysis. Specifically, we utilized supervised learning, which leverages feature vectors and labels from training data to train and test models [44]. Among the four air quality variables, we focused on ultrafine dust, known to be particularly detrimental for COPD patients.
Our primary outcome was a binary variable indicating the IAQ condition 30 min after the alert. The outcome was categorized as “remained good” or “improved” if the air quality either remained at Stage 1 or 2 or improved to those stages within 30 min of the alert. Conversely, it was categorized as “remained poor” or “worsened” if the air quality stayed at intervention Stages 3 or 4 or worsened to those stages within 30 min post-alert. Although we were unable to observe the specific efforts patients made to improve air quality after receiving alerts, an improvement in air quality from ‘bad’ to ‘good’ within 30 min suggests that the patient likely took appropriate measures. Previous studies have shown that air quality does not improve within 30 min of activities such as cleaning, cooking, or smoking indoors [45], and ultrafine particles generated during cooking can continue to concentrate for more than 5 h if ventilation is not implemented [46].
Explanatory variables encompassed various factors including IAQ-related conditions, sociodemographic factors, COPD-related variables, and behavioral health outcomes. IAQ-related factors included the intervention level at the time of the alert, duration in weeks, and the time of the alert. Sociodemographic variables comprised years of education (0 = <9 years; 1 = >9 years), perceived self-rated health (1 = poor, 2 = normal, 3 = good), and the amount of time spent alone each day. COPD-related variables included scores from assessments such as the COPD Assessment Test (CAT) [47], modified Medical Research Council (mMRC) [48], Breathlessness, Cough, and Sputum Scale (BCSS) [49], and Test of the Adherence to Inhalers (TAI) [50]. Additionally, behavioral health outcomes were assessed using instruments such as the Patient Health Questionnaire (PHQ-9) [51] and European Quality of Life (EQ-5D) [52] scores. All explanatory variables were measured at both the baseline and the 8-week end point of the study period.
We utilized the R 4.0.2 application for tasks such as machine learning, developing prediction models, association analysis, and model evaluation. We compared five commonly used supervised learning algorithms in machine learning: the naïve Bayes classification model, the logistic regression model, the random forest model, the decision tree model, the artificial neural network model, and the support vector machine model [53]. Additionally, we employed IBM SPSS 24.0 for analyzing the decision tree.

3. Results

3.1. Daily Trend of Air Quality Alert Occurrences per Hour

To assess patients’ initial compliance with the SAR, we examined the first four weeks of SAR utilization, considering the potential novelty effects [54]. During the first week, the frequency of alerts for ‘good’ air quality averaged 1.12 times per hour, while alerts for ‘poor’ air quality were issued at a rate of 0.57 times per hour. Subsequently, the frequency of ‘good’ air quality alerts showed a slight increase during weeks 2 and 3, before returning to the week 1 level of 1.12 times per hour by week 4. In contrast, the frequency of ‘poor’ air quality alerts demonstrated a decreasing trend, dropping to 0.509 times per hour in week 2, further decreasing to 0.464 times per hour in week 3, and reaching 0.298 times per hour in week 4. (Table 3)
Figure 5 presents the daily trend of air quality alert occurrence per hour. During this period, the average number of ‘poor’ alerts decreased over time (R2 = 0.4191), while the average number of ‘good’ alerts per hour showed no significant trend (R2 = 0.0006).

3.2. Prediction Analysis for Improvement in IAQ by Machine Learning

The SAR logged a total of 4689 alarms for ultrafine dust. In 3775 cases (80.5%), the IAQ either ‘improved’ or ‘remained good’ 30 min after the alarm. Following level 2 alerts, good air quality was maintained after 30 min in 91.3% of cases. For level 3 alerts, indicating ‘poor’ air conditions, 35.1% of cases returned to ‘good’ air conditions after 30 min. After level 4 alerts, 23.9% of cases returned to ‘good’ air conditions after 30 min. (Table 4).
Table 5 summarizes the accuracy, sensitivity, specificity, and area under the curve (AUC) of each prediction model. By comparing AUCs, all prediction models have similar explanatory power, ranging from 0.82 to 0.85. However, the random forest model (0.85) best predicted the IAQ improvement in terms of the ultrafine dust variable. The random forest model has the characteristic of generating a bootstrap sample using training data, selecting only some input variables to create a decision tree, and identifying a linear combination of variables to make a final learner [55].
Figure 6 illustrates the Increase in Node Purity (IncNodePurity), which represents the mean decrease in Gini impurity. This involves calculating the Gini impurity index at the split point of each tree and averaging these values across all trees [56]. IncNodePurity indicates the extent to which prediction error decreases when a particular variable is included compared to when it is not. A higher value suggests a more critical contribution of the variable to the model’s predictive ability (refer to Figure 6). In the random forest analysis, the most influential factor affecting the improvement in ultrafine dust IAQ was ‘intervention level 2’, followed by ‘intervention level 3’ and ‘intervention level 4’.

3.3. Summary of Interviews after Using SAR

We interviewed patients about the advantages and disadvantages of using the SAR after they had completed their usage period. The attitude of patients towards the SAR and any changes in their acceptance were confirmed through three stages.
First, patients wanted to ensure that the SAR alert was reliable. Patients reported being very surprised and excited when the SAR accurately suggested ways to improve the air quality or responded immediately to changes in air quality. The following patient responses are presented as examples:
Participant A: “When I start vacuuming, the SAR says, ‘There’s a lot of fine dust in the room, so keep the doors open to ensure good air quality’. Whenever I cook something over there (in the kitchen), the SAR says, ‘The air quality is poor’. Then I thought, ‘Oh, it’s sensing it right now’”.
Participant B: “Before SAR began telling us about the air quality, these days, even the elderlies can know what the weather is like. I can tell what the lowest temperature is and what the current temperature is by watching TV. When SAR gets it right, it amuses me or makes me laugh”.
Second, once the reliability was confirmed, patients paid more attention to the alerts from the SAR. The continuous air quality notifications from the SAR helped COPD patients remain constantly aware of indoor air quality. Additionally, the positive and encouraging words and healthcare tips provided by the SAR induced COPD patients to listen to the messages.
Participant D: “SAR always tells me about the humidity, temperature, and things like drinking more water. Because it helps me to watch out for the indoor environment, I think it’s a good thing to have”.
Third, the SAR guided patients in implementing ways to improve air quality. As the SAR functions as a talking robot, it can relieve the boredom of the elderly because they feel a sense of intimacy, despite it being a robot. Therefore, if the SAR alerts the patient about air quality, they are likely to follow the suggestions. Nevertheless, compliance depends on the individual.
Participant E: “The temperature in this room was quite hot when I turned on the heater, so the SAR said, ‘It’s too hot in the room, and you may feel heavy, so leave the window open for two minutes’. I would not have thought of that unless someone had said so, so I opened the front door and this window for about 10 min. Then the temperature dropped to 20 or 21 degrees. And then, when it gets cold, the SAR tells me to close the door again”.
Participant C: “When SAR gives an alarm about air quality, I change the air quality in the room. When the SAR says it’s hot, I increase ventilation according to its instructions”.

4. Discussion

We developed a system to help COPD patients better manage indoor air quality from a user-centered design perspective. We adopted SARs considering the preference and acceptability among elderly patients. The system measures indoor air quality in real time using sensors and provides notifications about air quality through the SAR, along with contextual improvement measures. This approach creates a user experience where patients are encouraged to actively participate in their healthcare and receive feedback through the SAR. We examined whether SARs, which were created for the purpose of interacting with people, can be applied to medical purposes—specifically, self-health management. Rather than an authoritarian self-management of health based on a doctor’s prescriptions or instructions, a strategy that empowers people to choose their own health behaviors is considered effective.
Our research questions aimed to ascertain whether older COPD patients could comprehend information from the SAR and whether they would adhere to the notifications. We explored the features associated with IAQ enhancement using two separate analytical approaches. Analyzing the ‘daily trend of air quality alert occurrences per hour’, we noted a significant decrease in ‘poor alerts’ with a strong linear trend, while ‘good alerts’ remained unchanged over time. This implies that SAR notifications foster a learning effect among COPD patients. Furthermore, machine learning prediction results indicated the predictability of air quality improvement following alerts. The shift from ‘poor’ to ‘good’ air quality 30 min after notification suggests that COPD patients likely took appropriate measures to enhance air quality. Both findings suggest that consistent air quality alerts can incentivize patients to enhance their skills in maintaining IAQ.
Moreover, through interviews with patients using the SAR, we confirmed that long-term educational effects can be expected. Patients reported that through repeated alarms, they learned in which situations the ‘bad’ alarms were triggered, how to respond to these alarms, and how to prevent ‘bad’ alarms from occurring, all through the guidance provided by the SAR. Therefore, future research should include a larger number of patients and a wider range of guidance to study the long-term effects of air quality changes.
We observed psychological barriers to SAR acceptance among older adults. Participants withdrew from the study for various reasons, including ‘do not like its shape (doll)’, ‘too talkative and noisy’, ‘no time to use it’, ‘can’t hear well what it says’, and ‘do not like what it says’. Among COPD patients, the proportion of men (gender difference) is high, and all the patients of this study were male. Some elderly male patients tended to feel ashamed of receiving help through the SAR, regardless of its actual skills, because it took the form of a doll. In such cases, the purpose of the intervention in this study was not reached by participants giving up participation or simply turning off the power to the SAR and storing it. Katie Winkle (2023) elucidates this phenomenon, noting that what matters is not just the robot’s physical appearance but also how its human-like features and social identity fit into the larger social context [57]. In other words, elderly male patients do not merely dislike the appearance of socially assistive robots (SARs); they perceive SARs as appropriate for elderly, seriously ill patients based on social norms, and thus, they do not consider themselves suitable candidates for using SARs.
Additionally, some participants encountered difficulties in operating the SAR, such as connecting power or adjusting volume. On the back of the care robot, there is a control panel with a charging port, power switch, and volume switch protruding. When our research team first installed the SAR, we taught elderly patients how to use it and also distributed instructions on how to operate it. Nevertheless, because elderly patients are unfamiliar with this type of control, there were cases where the charging port was not properly inserted when charging was necessary, causing the use of the SAR to stop. Additionally, after accidentally lowering the volume to the lowest level, they complained that ‘the care robot doesn’t say anything’. Therefore, it is necessary to design the SAR in a user-friendly manner to lower psychological barriers and increase user acceptance.
Our findings corroborate those of Guo et al. (2020), who implemented a program where nurses made four home visits to COPD patients, offering education on fine dust and particulate matter (PM) exposure, along with self-care guidance and instruction on using a mobile application to regulate window opening times. Consequently, patients became more aware of PM risks and endeavored to minimize their exposure [58]. Studies have demonstrated the efficacy of providing self-management education to COPD patients, leading to improvements in their quality of life [59], decreased hospitalizations for all causes, and reduced medication usage [27].
Notably, the integration of SAR–sensor technology in our study partly supplanted human intervention. SARs offer certain advantages, such as continuous monitoring, prompt responses in emergencies, and the ability to deliver persistent verbal instructions. They can potentially facilitate various caregiving services by establishing connections among SARs, sensors, caregivers, hospitals, emergency services, and more. However, further research is warranted to explore the role of SARs in nursing and service delivery.
SARs can be categorized into therapeutic, companion, entertainment, and telepresence robots based on their functions [60]. Previous research has indicated that certain individuals find intimacy through physical interaction with SARs, such as petting and cuddling [61], and are willing to use them to fulfill specific social needs [62]. Our study revealed that the effectiveness of information delivery may hinge on participants’ acceptance of SARs. Hence, researchers must account for individual preferences, needs, and technical proficiency when designing SAR services.
This pilot study has several limitations as a preliminary investigation of SARs integrating an environmental sensor. First, the small sample size limits the generalizability of our findings. In this study, we were unable to ascertain how older COPD patients changed their behavior after receiving alarms from the SAR. Consequently, when interpreting the results of this study, we cannot definitively conclude that SAR alarms directly cause improvements in air quality. Therefore, further investigation is warranted to examine how patients respond immediately to the SAR’s air quality alarms. Future studies should implement a robust design that includes multi-site data collection, a longer study duration, and the incorporation of control variables to account for external factors.

5. Conclusions

Since COPD patients need to proactively maintain proper IAQ, we developed a SAR care system that integrates IoT air quality sensors to guide patients in improving IAQ. This study evaluated IAQ enhancement among older COPD patients using this technology, revealing a significant reduction in ‘poor air quality alerts’ with a clear linear trend. Although ‘good alerts’ remained consistent, machine learning models predicted improved air quality following alerts. Consistent alerts serve as a motivating factor for COPD patients to maintain IAQ standards. However, barriers to SAR utilization, such as psychological and operational challenges, need to be addressed in future research.

Supplementary Materials

The following supporting information can be downloaded at https://www.mdpi.com/article/10.3390/app14135647/s1. Table S1: Composition of scenarios.

Author Contributions

Conceptualization, H.-S.J. and Y.-S.H.; methodology, H.-S.J. and Y.-S.H.; software, Y.-S.H.; validation, W.-J.K. and H.-S.J.; formal analysis, Y.-S.H.; investigation, Y.-S.H.; resources, W.-J.K.; data curation, Y.-S.H.; writing—original draft preparation, Y.-S.H. and O.E.-K.L.; writing—review and editing, O.E.-K.L. and H.-S.J.; visualization, Y.-S.H.; supervision, H.-S.J.; project administration, H.-S.J.; funding acquisition, H.-S.J. All authors have read and agreed to the published version of the manuscript.

Funding

This work was supported by the National Research Foundation of Korea (NRF) grant funded by the Korea government (MSIT) (RS-2023-00279534) * MSIT: Ministry of Science and ICT.

Institutional Review Board Statement

This study was conducted in accordance with the Declaration of Helsinki and approved by the Institutional Review Board (or Ethics Committee) of Kangwon National University Hospital (No. KNUH-2021-05-013-004).

Informed Consent Statement

Informed consent was obtained from all subjects involved in the study.

Data Availability Statement

The data presented in this study are available on request from the corresponding author due to the privacy of participants.

Conflicts of Interest

The authors declare no conflicts of interest.

References

  1. Pauwels, R.A.; Rabe, K.F. Burden and clinical features of chronic obstructive pulmonary disease (COPD). Lancet 2004, 364, 613–620. [Google Scholar] [CrossRef] [PubMed]
  2. Adeloye, D.; Song, P.; Zhu, Y.; Campbell, H.; Sheikh, A.; Rudan, I. Global, regional, and national prevalence of, and risk factors for, chronic obstructive pulmonary disease (COPD) in 2019: A systematic review and modelling analysis. Lancet Respir. Med. 2022, 10, 447–458. [Google Scholar] [CrossRef] [PubMed]
  3. Cavaillès, A.; Brinchault-Rabin, G.; Dixmier, A.; Goupil, F.; Gut-Gobert, C.; Marchand-Adam, S.; Meurice, J.-C.; Morel, H.; Person-Tacnet, C.; Leroyer, C. Comorbidities of COPD. Eur. Respir. Rev. 2013, 22, 454–475. [Google Scholar] [CrossRef] [PubMed]
  4. Raherison, C.; Girodet, P.O. Epidemiology of COPD. Eur. Respir. Rev. 2009, 18, 213–221. [Google Scholar] [CrossRef] [PubMed]
  5. Morley, J.E. Chronic obstructive pulmonary disease: A disease of older persons. J. Am. Med. Dir. Assoc. 2014, 15, 151–153. [Google Scholar] [CrossRef] [PubMed]
  6. Williams, V.; Bruton, A.; Ellis-Hill, C.; McPherson, K. The importance of movement for people living with chronic obstructive pulmonary disease. Qual. Health Res. 2011, 21, 1239–1248. [Google Scholar] [CrossRef] [PubMed]
  7. Bennett, J.; Shorter, C.; Kvalsvig, A.; Barnard, L.T.; Wilson, N.; Crane, J.; Douwes, J.; Cunningham, C.; Taptiklis, P.; Phipps, R. Indoor air quality, largely neglected and in urgent need of a refresh. New Zealand Med. J. 2022, 135, 136–139. [Google Scholar] [PubMed]
  8. Heseltine, E.; Rosen, J. WHO Guidelines for Indoor Air Quality: Dampness and Mould; World Health Organization: Geneva, Switzerland, 2009.
  9. Osman, L.M.; Douglas, J.G.; Garden, C.; Reglitz, K.; Lyon, J.; Gordon, S.; Ayres, J.G. Indoor air quality in homes of patients with chronic obstructive pulmonary disease. Am. J. Respir. Crit. Care Med. 2007, 176, 465–472. [Google Scholar] [CrossRef] [PubMed]
  10. Shetty, B.S.P.; D’Souza, G.; Padukudru Anand, M. Effect of indoor air pollution on chronic obstructive pulmonary disease (COPD) deaths in Southern Asia—A systematic review and meta-analysis. Toxics 2021, 9, 85. [Google Scholar] [CrossRef] [PubMed]
  11. Li, J.; Sun, S.; Tang, R.; Qiu, H.; Huang, Q.; Mason, T.G.; Tian, L. Major air pollutants and risk of COPD exacerbations: A systematic review and meta-analysis. Int. J. Chronic Obstr. Pulm. Dis. 2016, 11, 3079–3091. [Google Scholar] [CrossRef] [PubMed]
  12. World Health Organization. WHO Guidelines for Indoor Air Quality: Household Fuel Combustion; World Health Organization: Geneva, Switzerland, 2014.
  13. Liang, L.; Cai, Y.; Barratt, B.; Lyu, B.; Chan, Q.; Hansell, A.L.; Xie, W.; Zhang, D.; Kelly, F.J.; Tong, Z. Associations between daily air quality and hospitalisations for acute exacerbation of chronic obstructive pulmonary disease in Beijing, 2013–2017: An ecological analysis. Lancet Planet. Health 2019, 3, e270–e279. [Google Scholar] [CrossRef] [PubMed]
  14. Oh, J.S.; Park, S.H.; Kwak, M.K.; Pyo, C.H.; Park, K.H.; Kim, H.B.; Shin, S.Y.; Choi, H.J. Ambient particulate matter and emergency department visit for chronic obstructive pulmonary disease. J. Korean Soc. Emerg. Med. 2017, 28, 32–39. [Google Scholar]
  15. Meade, R.D.; Akerman, A.P.; Notley, S.R.; McGinn, R.; Poirier, P.; Gosselin, P.; Kenny, G.P. Physiological factors characterizing heat-vulnerable older adults: A narrative review. Environ. Int. 2020, 144, 105909. [Google Scholar] [CrossRef] [PubMed]
  16. Ailshire, J.; Brown, L.L. The importance of air quality policy for older adults and diverse communities. Public Policy Aging Rep. 2021, 31, 33–37. [Google Scholar] [CrossRef] [PubMed]
  17. McCormack, M.C.; Belli, A.J.; Waugh, D.; Matsui, E.C.; Peng, R.D.; Williams, D.A.L.; Paulin, L.; Saha, A.; Aloe, C.M.; Diette, G.B. Respiratory effects of indoor heat and the interaction with air pollution in chronic obstructive pulmonary disease. Ann. Am. Thorac. Soc. 2016, 13, 2125–2131. [Google Scholar] [CrossRef] [PubMed]
  18. Sebastião, B.F.; Hortelão, R.M.; Granadas, S.S.; Faria, J.M.; Pinto, J.R.; Henriques, H.R. Air quality self-management in asthmatic patients with COPD: An integrative review for developing nursing interventions to prevent exacerbations. Int. J. Nurs. Sci. 2023, 11, 46–56. [Google Scholar] [CrossRef] [PubMed]
  19. Pradhan, B.; Bharti, D.; Chakravarty, S.; Ray, S.S.; Voinova, V.V.; Bonartsev, A.P.; Pal, K. Internet of things and robotics in transforming current-day healthcare services. J. Healthc. Eng. 2021, 2021, 9999504. [Google Scholar] [CrossRef] [PubMed]
  20. Kodali, R.K.; Swamy, G.; Lakshmi, B. An implementation of IoT for healthcare. In Proceedings of the 2015 IEEE Recent Advances in Intelligent Computational Systems (RAICS), Trivandrum, India, 10–12 December 2015; pp. 411–416. [Google Scholar]
  21. Lee, H.; Park, Y.R.; Kim, H.-R.; Kang, N.Y.; Oh, G.; Jang, I.-Y.; Lee, E. Discrepancies in demand of internet of things services among older people and people with disabilities, their caregivers, and health care providers: Face-to-face survey study. J. Med. Internet Res. 2020, 22, e16614. [Google Scholar] [CrossRef]
  22. Jo, H.S.; Hwang, Y.S. Psychological factors that affect the acceptance and need for ICT services for older adults with chronic diseases. Gerontechnology 2021, 20, 1. [Google Scholar] [CrossRef]
  23. Pu, L.; Moyle, W.; Jones, C.; Todorovic, M. The effectiveness of social robots for older adults: A systematic review and meta-analysis of randomized controlled studies. Gerontologist 2019, 59, e37–e51. [Google Scholar] [CrossRef]
  24. Kim, E.-J.; Nam, I.-C.; Koo, Y.-R. Reframing patient experience approaches and methods to achieve patient-centeredness in healthcare: Scoping review. Int. J. Environ. Res. Public Health 2022, 19, 9163. [Google Scholar] [CrossRef] [PubMed]
  25. Abdi, J.; Al-Hindawi, A.; Ng, T.; Vizcaychipi, M.P. Scoping review on the use of socially assistive robot technology in elderly care. BMJ Open 2018, 8, e018815. [Google Scholar] [CrossRef] [PubMed]
  26. Jo, H.; Kim, J.; Kim, S. Factors related to the effectiveness in the use of an ICT-based toy robot for the in-home care of community dwelling elderly. Korean J. Health Educ. Promot. 2019, 36, 43–51. [Google Scholar] [CrossRef]
  27. Cooper, S.; Di Fava, A.; Vivas, C.; Marchionni, L.; Ferro, F. ARI: The social assistive robot and companion. In Proceedings of the 2020 29th IEEE International Conference on Robot and Human Interactive Communication (RO-MAN), Naples, Italy, 31 August–4 September 2020; pp. 745–751. [Google Scholar]
  28. Yu, C.; Sommerlad, A.; Sakure, L.; Livingston, G. Socially assistive robots for people with dementia: Systematic review and meta-analysis of feasibility, acceptability and the effect on cognition, neuropsychiatric symptoms and quality of life. Ageing Res. Rev. 2022, 78, 101633. [Google Scholar] [CrossRef] [PubMed]
  29. Cano, S.; González, C.S.; Gil-Iranzo, R.M.; Albiol-Pérez, S. Affective communication for socially assistive robots (sars) for children with autism spectrum disorder: A systematic review. Sensors 2021, 21, 5166. [Google Scholar] [CrossRef] [PubMed]
  30. Getson, C.; Nejat, G. Socially assistive robots helping older adults through the pandemic and life after COVID-19. Robotics 2021, 10, 106. [Google Scholar] [CrossRef]
  31. Feil-Seifer, D.; Mataric, M.J. Defining socially assistive robotics. In Proceedings of the 9th International Conference on Rehabilitation Robotics (ICORR 2005), Chicago, IL, USA, 28 June–1 July 2005; pp. 465–468. [Google Scholar]
  32. Meinert, E.; Van Velthoven, M.; Brindley, D.; Alturkistani, A.; Foley, K.; Rees, S.; Wells, G.; de Pennington, N. The internet of things in health care in oxford: Protocol for proof-of-concept projects. JMIR Res. Protoc. 2018, 7, e12077. [Google Scholar] [CrossRef] [PubMed]
  33. Hyodol Co., Ltd. Hello, We Are HYODOL ‘How It Works?’. Available online: https://hyodol.oopy.io/ (accessed on 17 December 2022).
  34. Lee, O.E.; Lee, H.; Park, A.; Choi, N.G. My precious friend: Human-robot interactions in home care for socially isolated older adults. Clin. Gerontol. 2024, 47, 161–170. [Google Scholar] [CrossRef] [PubMed]
  35. Od, S.; Huang, H.-H.; Wei, J.-B. Apply LoRa technology to construct an air quality monitoring IoT system. In Proceedings of the 2021 IEEE 3rd Eurasia Conference on Biomedical Engineering, Healthcare and Sustainability (ECBIOS), Tainan, Taiwan, 28–30 May 2021; pp. 88–91. [Google Scholar]
  36. Administration, K.M. Automatic Weather System (AWS) Database. Available online: https://data.kma.go.kr/data/rmt/rmtList.do?code=400&pgmNo=570 (accessed on 16 November 2022).
  37. Korea Environment Corporation. Air Pollution Information-Real-Time Measurement Information Station. Available online: https://www.airkorea.or.kr/web/khaiInfo?pMENU_NO=129 (accessed on 16 November 2020).
  38. Administration, K.M. Living Weather Index. Available online: https://www.weather.go.kr/w/theme/daily-life/life-weather-index.do (accessed on 10 February 2023).
  39. Tham, S.; Thompson, R.; Landeg, O.; Murray, K.; Waite, T. Indoor temperature and health: A global systematic review. Public Health 2020, 179, 9–17. [Google Scholar] [CrossRef] [PubMed]
  40. Korea, A. Fine Dust Concentration Forecast—Forecast Grades and Action Guidelines. Available online: https://www.airkorea.or.kr/web/dustForecast?pMENU_NO=113 (accessed on 10 February 2023).
  41. Etikan, I.; Musa, S.A.; Alkassim, R.S. Comparison of convenience sampling and purposive sampling. Am. J. Theor. Appl. Stat. 2016, 5, 1–4. [Google Scholar] [CrossRef]
  42. Tanaka, M.; Ishii, A.; Yamano, E.; Ogikubo, H.; Okazaki, M.; Kamimura, K.; Konishi, Y.; Emoto, S.; Watanabe, Y. Effect of a human-type communication robot on cognitive function in elderly women living alone. Med. Sci. Monit. Int. Med. J. Exp. Clin. Res. 2012, 18, CR550. [Google Scholar] [CrossRef]
  43. Liang, A.; Piroth, I.; Robinson, H.; MacDonald, B.; Fisher, M.; Nater, U.M.; Skoluda, N.; Broadbent, E. A pilot randomized trial of a companion robot for people with dementia living in the community. J. Am. Med. Dir. Assoc. 2017, 18, 871–878. [Google Scholar] [CrossRef] [PubMed]
  44. Nasteski, V. An overview of the supervised machine learning methods. Horizons. B 2017, 4, 56. [Google Scholar] [CrossRef]
  45. Kim, J.-h.; Song, D. Analysis of fine dust generation by indoor activities in residential building. In Proceedings of the Society of Airconditioning and Refrigerating Engineers of Korea, Seoul, Republic of Korea, 25 November 2016; pp. 261–264. [Google Scholar]
  46. Won, S.R.; Ji, H.A.; Kwon, M.; Hwang, E.S.; Lee, J.-S.; Shim, I.-K. Characteristics of particles and gaseous pollutants generated from roasting fish and meat in kitchens. J. Environ. Anal. Health Toxicol. 2019, 22, 224–229. [Google Scholar] [CrossRef]
  47. Jones, P.; Harding, G.; Berry, P.; Wiklund, I.; Chen, W.; Leidy, N.K. Development and first validation of the COPD Assessment Test. Eur. Respir. J. 2009, 34, 648–654. [Google Scholar] [CrossRef] [PubMed]
  48. Bestall, J.; Paul, E.; Garrod, R.; Garnham, R.; Jones, P.; Wedzicha, J. Usefulness of the Medical Research Council (MRC) dyspnoea scale as a measure of disability in patients with chronic obstructive pulmonary disease. Thorax 1999, 54, 581–586. [Google Scholar] [CrossRef] [PubMed]
  49. Leidy, N.K.; Rennard, S.I.; Schmier, J.; Jones, M.K.C.; Goldman, M. The breathlessness, cough, and sputum scale: The development of empirically based guidelines for interpretation. Chest 2003, 124, 2182–2191. [Google Scholar] [CrossRef] [PubMed]
  50. Plaza, V.; Fernández-Rodríguez, C.; Melero, C.; Cosío, B.G.; Entrenas, L.M.; De Llano, L.P.; Gutiérrez-Pereyra, F.; Tarragona, E.; Palomino, R.; López-Viña, A. Validation of the ‘Test of the Adherence to Inhalers’(TAI) for asthma and COPD patients. J. Aerosol Med. Pulm. Drug Deliv. 2016, 29, 142–152. [Google Scholar] [CrossRef] [PubMed]
  51. Löwe, B.; Unützer, J.; Callahan, C.M.; Perkins, A.J.; Kroenke, K. Monitoring depression treatment outcomes with the patient health questionnaire-9. Med. Care 2004, 42, 1194–1201. [Google Scholar] [CrossRef] [PubMed]
  52. Herdman, M.; Gudex, C.; Lloyd, A.; Janssen, M.; Kind, P.; Parkin, D.; Bonsel, G.; Badia, X. Development and preliminary testing of the new five-level version of EQ-5D (EQ-5D-5L). Qual. Life Res. 2011, 20, 1727–1736. [Google Scholar] [CrossRef] [PubMed]
  53. Caruana, R.; Niculescu-Mizil, A. An empirical comparison of supervised learning algorithms. In Proceedings of the 23rd International Conference on Machine Learning, Pittsburgh, PA, USA, 25–29 June 2006; pp. 161–168. [Google Scholar]
  54. Gockley, R.; Bruce, A.; Forlizzi, J.; Michalowski, M.; Mundell, A.; Rosenthal, S.; Sellner, B.; Simmons, R.; Snipes, K.; Schultz, A.C. Designing robots for long-term social interaction. In Proceedings of the 2005 IEEE/RSJ International Conference on Intelligent Robots and Systems, Edmonton, AB, Canada, 2–6 August 2005; pp. 1338–1343. [Google Scholar]
  55. Michalski, R.S.; Carbonell, J.G.; Mitchell, T.M. Machine Learning: An Artificial Intelligence Approach; Springer Science & Business Media: Berlin/Heidelberg, Germany, 2013. [Google Scholar]
  56. Sahin, E.K.; Colkesen, I.; Acmali, S.S.; Akgun, A.; Aydinoglu, A.C. Developing comprehensive geocomputation tools for landslide susceptibility mapping: LSM tool pack. Comput. Geosci. 2020, 144, 104592. [Google Scholar] [CrossRef]
  57. Winkle, K.; McMillan, D.; Arnelid, M.; Harrison, K.; Balaam, M.; Johnson, E.; Leite, I. Feminist human-robot interaction: Disentangling power, principles and practice for better, more ethical HRI. In Proceedings of the 2023 ACM/IEEE International Conference on Human-Robot Interaction, Stockholm, Sweden, 13–16 March 2023; pp. 72–82. [Google Scholar]
  58. Yu, S.-H.; Guo, A.-M.; Zhang, X.-J. Effects of self-management education on quality of life of patients with chronic obstructive pulmonary disease. Int. J. Nurs. Sci. 2014, 1, 53–57. [Google Scholar] [CrossRef]
  59. Simoni-Wastila, L.; Wei, Y.-J.; Qian, J.; Zuckerman, I.H.; Stuart, B.; Shaffer, T.; Dalal, A.A.; Bryant-Comstock, L. Association of chronic obstructive pulmonary disease maintenance medication adherence with all-cause hospitalization and spending in a Medicare population. Am. J. Geriatr. Pharmacother. 2012, 10, 201–210. [Google Scholar] [CrossRef] [PubMed]
  60. Gasteiger, N.; Loveys, K.; Law, M.; Broadbent, E. Friends from the future: A scoping review of research into robots and computer agents to combat loneliness in older people. Clin. Interv. Aging 2021, 16, 941–971. [Google Scholar] [CrossRef] [PubMed]
  61. Lazar, A.; Thompson, H.J.; Piper, A.M.; Demiris, G. Rethinking the design of robotic pets for older adults. In Proceedings of the 2016 ACM Conference on Designing Interactive Systems, Brisbane, QLD, Australia, 4–8 June 2016; pp. 1034–1046. [Google Scholar]
  62. Zhu, H.; Wu, C.K.; Koo, C.H.; Tsang, Y.T.; Liu, Y.; Chi, H.R.; Tsang, K.-F. Smart healthcare in the era of internet-of-things. IEEE Consum. Electron. Mag. 2019, 8, 26–30. [Google Scholar] [CrossRef]
Figure 1. Hyodol and an air quality sensor.
Applsci 14 05647 g001
Figure 2. The process of providing air quality alerts.
Applsci 14 05647 g002
Figure 3. The operating mechanism of a SAR with an air quality sensor.
Applsci 14 05647 g003
Figure 4. COPD patient monitoring workflow.
Applsci 14 05647 g004
Figure 5. Daily trend of air quality alert occurrences per hour (averaged, 11 patients).
Applsci 14 05647 g005
Figure 6. Random forest model result—Increase in Node Purity.
Applsci 14 05647 g006
Table 1. Range and accuracy of air quality sensor measurements.
MeasurementTemperatureHumidityFine DustUltrafine Dust
Range−20–99 °C0–99%2.5–10 µm1.0–2.5 µm
Accuracy0.1 °C0.1%1 µg/m31 µg/m3
Table 2. Standards for indoor and outdoor air quality.
Indoor Air QualityOutdoor Atmosphere
StandardsSpring and FallSummerWinterStandardsFour Seasons
TemperatureVery hot>32 °CHot>32 °C
Hot28–32 °CGood10–32 °C
Good22–28 °CCold10 °C
Cold18–22 °C
Very cold<18 °C
HumidityVery humid>80%>90%>70%Humid>80%
Humid60–80%70–90%50–70%Good20–80%
Good40–60%50–70%30–50%Dry<20%
Dry20–40%30–50%10–30%
Very dry<20%<30%<10%
PM10Good0–30 μg/m3Good0–30 μg/m3
Normal31–80 μg/m3Normal31–80 μg/m3
Poor81–150 μg/m3Poor81–150 μg/m3
Very poor>151 μg/m3Very poor>151 μg/m3
PM2.5Good0–15 μg/m3Good0–15 μg/m3
Normal16–35 μg/m3Normal16–35 μg/m3
Poor36–75 μg/m3Poor36–75 μg/m3
Very poor>76 μg/m3Very poor>76 μg/m3
Table 3. The average hourly frequency of SAR air quality alerts (by week).
Week 1Week 2Week 3Week 4
Good (Stage 1 or 2)1.1211.2621.2601.121
Bad (Stage 3 or 4)0.5800.5090.4640.298
Table 4. Descriptive statistics of features for machine learning and logs of IAQ.
FeaturesSumNot Improved/Worsened (Stage 3 or 4)Improved/Remain Good
(Stage 1 or 2)
N(%)N(%)
Intervention Stage 2 Alert3800329(8.7)3471(91.3)
Intervention Stage 3 Alert818531(64.9)287(35.1)
Intervention Stage 4 Alert7154(76.1)17(23.9)
Week 1 to 21300238(18.3)1062(81.7)
Week 3 to 41100192(17.5)908(82.2)
Week 5 to 61107225(20.3)882(79.7)
Week 7 to 81182259(21.9)923(78.1)
Alert time AM 0 to 6 ’o clock508106(20.9)402(79.1)
Alert time AM 7 to 12 ’o clock1823386(21.2)1437(78.8)
Alert time PM 12 to 6 ’o clock1379208(15.1)1171(84.9)
Alert time PM 7 to 12 ’o clock979214(21.9)765(78.1)
Aged over 752346531(22.6)1815(77.4)
Living Alone2309499(21.6)1810(78.4)
CAT high (baseline)1431299(20.9)1132(79.1)
CAT mid (baseline)1142210(18.4)932(81.6)
CAT low (baseline)2116405(19.1)1711(80.9)
CAT high (end point)1431299(20.9)1132(79.1)
CAT mid (end point)1791279(15.6)1512(84.4)
CAT low (end point)1467336(22.9)1131(77.1)
MRC 0 to 1 (baseline)2980582(19.5)2398(80.5)
MRC 2 to 3 (baseline)2833566(20.0)2267(80.0)
BSCC 0 to 2 (baseline)3465660(19.0)2805(81.0)
BSCC 0 to 2 (end point)1924392(20.4)1532(79.6)
TAI good (end point)3326664(20.0)2662(80.0)
TAI intermediate (end point)1170213(18.2)957(81.8)
TAI poor (end point)19337(19.2)156(80.8)
PHQ-9 none (baseline)4086780(19.1)3306(80.9)
PHQ-9 none (end point)2733434(15.9)2299(84.1)
EQ-5D perfect (baseline)1914382(20.0)1532(80.0)
EQ-5D perfect (end point)1461288(19.7)1173(80.3)
Table 5. Evaluation of machine learning models.
Evaluation
Index
Naïve Bayes ClassificationNeural NetworksLogistic
Regression
Support
Vector Machines
Random ForestsDecision Trees
Accuracy86.286.086.486.787.185.6
Sensitivity92.194.793.392.694.190.8
Specificity61.751.460.160.658.260.3
Precision90.888.690.091.390.391.7
AUC 10.830.830.830.820.850.84
1 Area under the curve.
Disclaimer/Publisher’s Note: The statements, opinions and data contained in all publications are solely those of the individual author(s) and contributor(s) and not of MDPI and/or the editor(s). MDPI and/or the editor(s) disclaim responsibility for any injury to people or property resulting from any ideas, methods, instructions or products referred to in the content.

