Article

Research on Outgoing Moisture Content Prediction Models of Corn Drying Process Based on Sensitive Variables

1
Liaoning Grain Science Research Institute, Shenyang 110032, China
2
National Engineering Research Centre for Grain-Corn Drying, Shenyang 110032, China
3
College of Information and Electrical Engineering, Shenyang Agricultural University, Shenyang 110065, China
*
Author to whom correspondence should be addressed.
Appl. Sci. 2024, 14(13), 5680; https://doi.org/10.3390/app14135680
Submission received: 23 May 2024 / Revised: 19 June 2024 / Accepted: 21 June 2024 / Published: 28 June 2024

Abstract

:
Accurate prediction of outgoing moisture content is the key to achieving energy-saving and efficient technological transformation of drying. This study relies on a grain drying simulation experiment system which combined counter and current drying sections to design corn kernel drying experiments. This study obtains 18 kinds of temperature and humidity variables during the drying process and uses Uninformative Variable Elimination (UVE) method to screen sensitive variables affecting the outgoing moisture content. Subsequently, six prediction models for the outgoing corn moisture content were developed, innovatively incorporating Multiple Linear Regression (MLR), Extreme Learning Machine (ELM), and Long Short-Term Memory (LSTM). The results show that eight sensitive variables have been screened to predict the moisture content of outgoing corn. The sensitive variables effectively reduced the redundancy and multicollinearity of data in the MLR model and improved the coefficient of determination (R2) of ELM and LSTM models by 0.02 and 0.05. The MLR prediction model established based on the full set of temperature and humidity data has an R2 of 0.910 and a root-mean-square error (RMSE) of 0.881%, while the UVE-ELM and UVE-LSTM prediction models achieve a better fitting effect and prediction accuracy. The UVE-LSTM model is set with a batch size of 30, a learning rate of 0.01, and 100 iterations. For the training set of UVE-LSTM, the R2 value is 0.931 and the RMSE value is 0.711%. The UVE-ELM model, with sigmoid as the activation function and 14 neurons configured, runs fast and has the best prediction accuracy. The R2 values of UVE-ELM training set and validation set are 0.943 and 0.946, respectively, and the RMSEs are 0.544% and 0.581%. The models proposed in this study provide data reference and technical support for process optimization and automation control of the corn drying process.

1. Introduction

Food security is integral to the well-being of people’s livelihoods globally, and a pivotal issue worldwide is achieving a consistent increase in food crop production while minimizing losses and maximizing efficiency. Corn, as a significant staple crop, boasts a vast cultivation area, high yields, and considerable demand. However, in China alone, annual corn losses during storage reach up to 4 million tons, primarily attributed to inadequate drying techniques [1,2,3]. Corn is an organic living organism with a complex internal structure that requires respiration and the ability to respond to external stimuli, which places higher demands on the exploration of the laws governing its drying process [4].
With the continuous advancement of agricultural production technology, mechanical drying has become prevalent. However, the level of automated control in corn drying remains relatively low. The difficulties in real-time monitoring of corn moisture, limited detection accuracy and lengthy measurement times directly impact the efficiency and quality of corn drying [5,6,7]. Additionally, the large-scale drying equipment involved in the drying process necessitates significant raw materials, consumables, human resources, and time, further compounding the challenges in exploring drying process laws [8,9].
To identify the optimum drying process for corn from nutritional, energy, economic and environmental perspectives, numerous researchers and scholars have attempted breakthroughs on various aspects. In their study of the coupling mechanism of drying process parameters, Bertotto et al. [10] investigated the effects of changes in process parameters, such as temperature, moment of temperature change, and length of temperature change, on the whole rice yield and drying rate of rice grains. Xin L et al. [11] analyzed the distribution of radial porosity and airflow path of the soybean packed bed and developed a double-diffusion heat and moisture transfer model of grain pile based on the thermal non-equilibrium principle, which effectively saved the drying time. Qingyue Bi [12] explored the heat and mass exchange characteristics of the maize drying process and developed a three-dimensional multilayer simulation model for maize kernel hot air drying by integrating Computational Fluid Dynamics (CFD) with a heat and mass transfer model. Based on the simulation of the drying process, the team from the Veracruz Institute of Science and Technology (Mexico) [13] constructed a prediction model for heat and mass transfer in cassava and mango drying process, utilizing an artificial neural network, to enable state monitoring and control of the drying process. Hoon K et al. [14] developed a drying prediction simulation program and determined the ideal drying conditions for different dryers to achieve cost-effective drying and processing. Çelik Emel et al. [15] innovatively developed an Adaptive Neuro-Fuzzy Inference System (ANFIS) model to effectively estimate the corn drying process parameters and this research improved corn drying operations and increased drying efficiency. What if we start from the aspect of moisture content prediction? Prediction and control models based on artificial neural networks have been widely used in the field of industrial automation and have high accuracy and practicality in many areas [16,17,18,19]. A team from Jilin University has proposed an intelligent control method for a continuous paddy dryer based on a BP neural network, which initially realized the regulation of the paddy drying process [20,21]. The BP neural network also performed well in the studies of Wang He et al. [22] and Lei Dechao et al. [23] for the prediction model of corn moisture content. These research examples provide broad research ideas for achieving accurate predictions of moisture content in the maize drying process [24,25]. However, the types of models developed are generally singular, the accuracy of moisture content prediction is limited, and the universality of prediction models is not strong. The potential and application capability of machine learning-based methods for data mining in the maize drying process needs to be further explored. At the same time, obtaining drying data in large-scale production facilities can be time-consuming and costly. This study will innovatively simulate, analyze, and put into practice the corn drying process in experimental equipment, which can improve the operability of the study and is in line with scientific and environmental protection research concepts [26,27].
In summary, this study simulates the corn drying process based on a batch-type to obtain the variable data during the process. It then analyzes the relationship between the characteristic data and the corresponding outgoing corn moisture content. Based on this analysis, representative and sensitive variables are screened to construct both linear and nonlinear prediction models for outgoing corn moisture content. The aim is to achieve real-time, non-destructive, and accurate predictions of the outgoing corn moisture content, thereby providing a model basis for the automation and intelligent control of the corn drying process.

2. Materials and Methods

2.1. Experimental Design and Data Collection

2.1.1. Experiment Materials

The corn samples tested are from Kaiyuan City, Liaoning Province, China, and belong to the ‘M81’ variety, which is commonly grown in northeastern China. The samples are freshly harvested corn kernels from the current season and have a moisture content ranging from 23.01% to 21.18%. The experimental site is Shenyang City, Liaoning Province, China, which is located at 123°25′31″ E, 41°48′12″ N.

2.1.2. Experiment Equipment

The corn drying experiment is based on a batch-type grain drying simulation experiment system, and the working principle and structure of the system are shown in Figure 1 and Figure 2. This system employs a countercurrent drying section combination model, which is a mainstream model in current corn drying production. This type of drying system is representative for simulating corn drying experiments [28,29]. Figure 1, wherein parts marked as 2, 3, and 4, indicate the arrangement of temperature and humidity sensors for real-time collection of temperature and humidity characteristics of the corn drying process [30]. The data are then transmitted via electrical signals to a programmable logic controller (PLC) module for storage. The drying section area is large; so, following the five-point sampling method, five groups of temperature and humidity monitoring points are arranged, with three additional groups of monitoring points in the remaining positions. The specific distribution of the system is shown in Figure 3.
The names of the measured temperature and humidity are as follows: upper outlet temperature, upper outlet humidity, lower outlet temperature, lower outlet humidity, drying section A temperature, drying section B temperature, drying section C temperature, drying section D temperature, drying section E temperature, drying section A humidity, drying section B humidity, drying section C humidity, drying section D humidity, drying section E humidity, hot air pipeline temperature, and hot air pipeline humidity.

2.1.3. Experiment Design

The experiment was conducted under sunny weather conditions without rain or snow. According to weather records, the corresponding temperature during the experiment period (9 a.m.–2 p.m.) ranged from −15.3 to 11.5 °C. The fan speed was set constant at 50 Hz, with an air volume of approximately 0.083 m3/s and a wind speed hat remained stable at approximately 4 m/s. The hot air temperature was adjusted to four levels: 70 °C, 80 °C, 90 °C, and 100 °C. The frequency of grain discharge was set to two levels: 10 Hz and 20 Hz, with other variables kept constant, resulting in a total of 8 parallel experiments [6,31]. Samples were collected every 15 min interval from the start of the experiment, and the drying endpoint was set at 13% (wet-basis moisture content). The moisture content was detected according to the Chinese standard GB5009.3-2016 Food Safety Standard Determination of Moisture in Food [32].

2.1.4. Data Acquisition

To enhance the accuracy of corn moisture content determination, which is often influenced by the performance of the experimental oven and the uniformity of sample placement, the moisture content of the samples was measured twice, and the average value was taken as the final result. After manual screening and elimination of error values, a total of 207 sets of one-to-one mapping data of temperature and humidity variables and moisture content of corn samples were obtained, as shown in Table 1. These data were tested and proved to be in line with the normal distribution.

2.1.5. Correlation Test

In order to fully understand the degree of correlation between corn moisture content and different temperature and humidity variables and to identify the factors with higher correlation with the target variables, this study first analyzed the dataset for Pearson’s correlation coefficient [33,34].
The Pearson correlation coefficient is calculated as follows:
r = ( ( x i x ¯ ) ( y i y ¯ ) ) ( x i x ¯ ) 2 ( y i y ¯ ) 2
( x i and y i denote the observed values of the two variables, respectively; x ¯ and y ¯ denote the mean values of the two variables, respectively).
From Table 2 and Table 3, the vast majority of temperature and humidity characteristic variables show strong positive or negative correlations with outgoing corn moisture content. Except for ambient temperature and ambient humidity, there are 16 temperature and humidity variables significantly correlated with corn moisture content. Among these, the absolute value of the correlation between hot air duct temperature, hot air duct humidity and outgoing corn moisture content is lower than 0.5. Hence, this study excludes the four temperature and humidity characteristic variables, namely, ambient temperature, ambient humidity, hot air duct temperature, and hot air duct humidity, and gives priority to the remaining 14 variables as the full set of temperature and humidity variables to construct the prediction model.

2.2. Screening for Sensitive Variables

The temperature and humidity datasets, belonging to the same type of variables, tend to exhibit covariance. Therefore, this study utilizes the Uninformative Variable Elimination (UVE) method to select representative sensitive variables from the temperature and humidity variable data. The set of sensitive variables will have the ability to predict the dependent variable instead of the full set of temperature and humidity variables [35,36].
UVE is a feature variable screening method based on the regression coefficients of the partial-least-squares (PLS) model, originally proposed by Centner et al. [37]. The method constructs a PLS model by combining the original factor matrix with a randomly generated noise matrix and obtains the coefficient matrix of the model. Finally, the set of sensitive variables is determined by finding the ratio of the mean to the standard deviation of the model’s coefficient matrix. The specific implementation process is as follows:
Step 1: The temperature and humidity variable matrix X n × p and the randomly generated noise matrix N n × p are summed to obtain the mixing matrix X N n × 2 p .
Step 2: A PLS regression model is constructed using the mixing matrix   X N as the model input and the outgoing corn moisture content matrix Y as the output, employing cross-validation. This results in a matrix of regression coefficients b n × 2 p .
Step 3: Calculate the mean M i and standard deviation S i of the matrix of regression coefficients, and find their ratio E i as shown in Equation (2).
E i = M i S i i = 1,2 , , 2 p
Step 4: Calculate the maximum absolute value E m a x = m a x a b s E i of E i in interval p + 1 , 2 p , and remove the bands with values less than E m a x in the matrix in interval 1 , p . The remaining variables constitute the filtered sensitive variables.
During the stage of constructing the prediction model, both the complete set of temperature and humidity variables and the eight sets of sensitive variables derived from UVE screening will be utilized as independent variables.

2.3. Construction of Moisture Content Prediction Model

In this study, we aim to construct a prediction model for outgoing corn moisture content by utilizing various methods. Specifically, we employ the Multiple Linear Regression (MLR) model, the Extreme Learning Machine (ELM) method, which excels in handling complex nonlinear problems, and the Long Short-Term Memory (LSTM) neural network, a method belonging to the deep learning category.

2.3.1. Multiple Linear Regression Model

MLR is a statistical model that establishes and analyzes the relationship between multiple independent variables and a dependent variable. It is an extension of linear regression analysis and can simultaneously consider the effects of multiple independent variables on the dependent variable [38,39]. The objective of the model is to estimate the coefficients of the independent variables by minimizing the difference between the observed values and the predicted values of the model and to build a model that can explain the variation of the dependent variable. The model equation is as follows:
C o r n   m o i s t u r e   c o n t e n t ( % ) = α + β i X i + ε
( α : intercept term; β i : regression coefficients; X i : observations of the dependent variables; ε : random errors generated by the model).
Meanwhile, the variance inflation factor (VIF) was used to detect the presence of multicollinearity in the Multiple Linear Regression model. The VIF value for independent variable i was calculated as follows:
V I F i = 1 1 R i 2
( R i : correlation coefficient of the variable i with the remaining independent variables).

2.3.2. Extreme Learning Machine Model

ELM is a neural network model that boasts advantages such as a fast training speed and small computational volume. It is particularly suitable for solving complex nonlinear problems and holds promising applications in predicting the moisture content of the corn drying process [40,41]. The implementation steps of ELM are as follows:
Step 1: Model initialization. Initialize model parameters, including weights w, bias b, and the number of neurons.
Step 2: Forward propagation. Pass the temperature and humidity feature data of the corn drying process from the input layer to the hidden layer, and select the sigmiod function as the activation function h ( x ) of the hidden layer output.
Step 3: Calculate the output weights. Use the least-squares method to calculate the output weight vector matrix β .
Step 4: Calculate the output results. The prediction output result is calculated as
y i = β h x i = j = 1 L β j h ( a j · x i , b j )
( a j : input weight vector; b j : bias parameter; L: number of nodes in the implicit layer).
The equation simplifies to
Y = β H  
Step 5: The mathematical expression of the objective function G for the required solution is given by
m i n : G = β 2 5 + θ i = 1 3 x i 2 s . t . : β j h x j = y i T x i T
( x i : error of output node i; θ : penalty factor corresponding to x i ).
Figure 4 provides a more intuitive visualization of the ELM process for predicting outgoing corn moisture content. This study constructs predictive models using the full set of temperature and humidity variables and the sensitive variables screened by UVE as inputs, respectively.

2.3.3. Long Short-Term Memory Neural Network Model

LSTM is an improved Recurrent Neural Network (RNN) [42], which was proposed by Hochreiter et al. [43] Based on the traditional RNN, the memory cell is added, which includes three modules, namely, forget gate, input gate, and output gate, to control the inflow and outflow of internal information.
Forget Gate: Determines how much of the past should be discarded by the memory cell. The activation function σ   is the sigmiod function.
f t = σ ( W f · [ h t 1 , x t ] + b f )
( x t : input for the current time step; h t 1 : hidden state of the previous time step; W : weighting of the model; b : bias parameter).
Input Gate: Determines how much of the currently entered information will be stored in the memory cell.
i t = σ ( W i · [ h t 1 , x t ] + b i )
C t ~ = t a n h ( W C · [ h t 1 , x t ] + b c )
(tanh: hyperbolic tangent activation function).
Cell State Update: Combining the results of the forget gate and the input gate updates the state C t of the memory cell.
C t = f t C t 1 + i t C t ~
Output Gate: Decide which parts of the memory cell will be used as outputs h t , which affects the state of the next moment.
o t = σ ( W o · [ h t 1 , x t ] + b o )
h t = o t t a n h ( C t )
The input layer takes the full set matrix of temperature and humidity variables and the matrix of sensitive variables as inputs, respectively, and the output gate outputs the predicted value of outgoing corn machine moisture.

2.3.4. Model Evaluation

Root-mean-square error (RMSE) and coefficient of determination (R2) metrics are used for assessment and comparison. A smaller RMSE indicates higher accuracy, and the R2 closer to 1 indicates a better fit of the model to the data.

3. Results

3.1. Data Pre-Processing Results

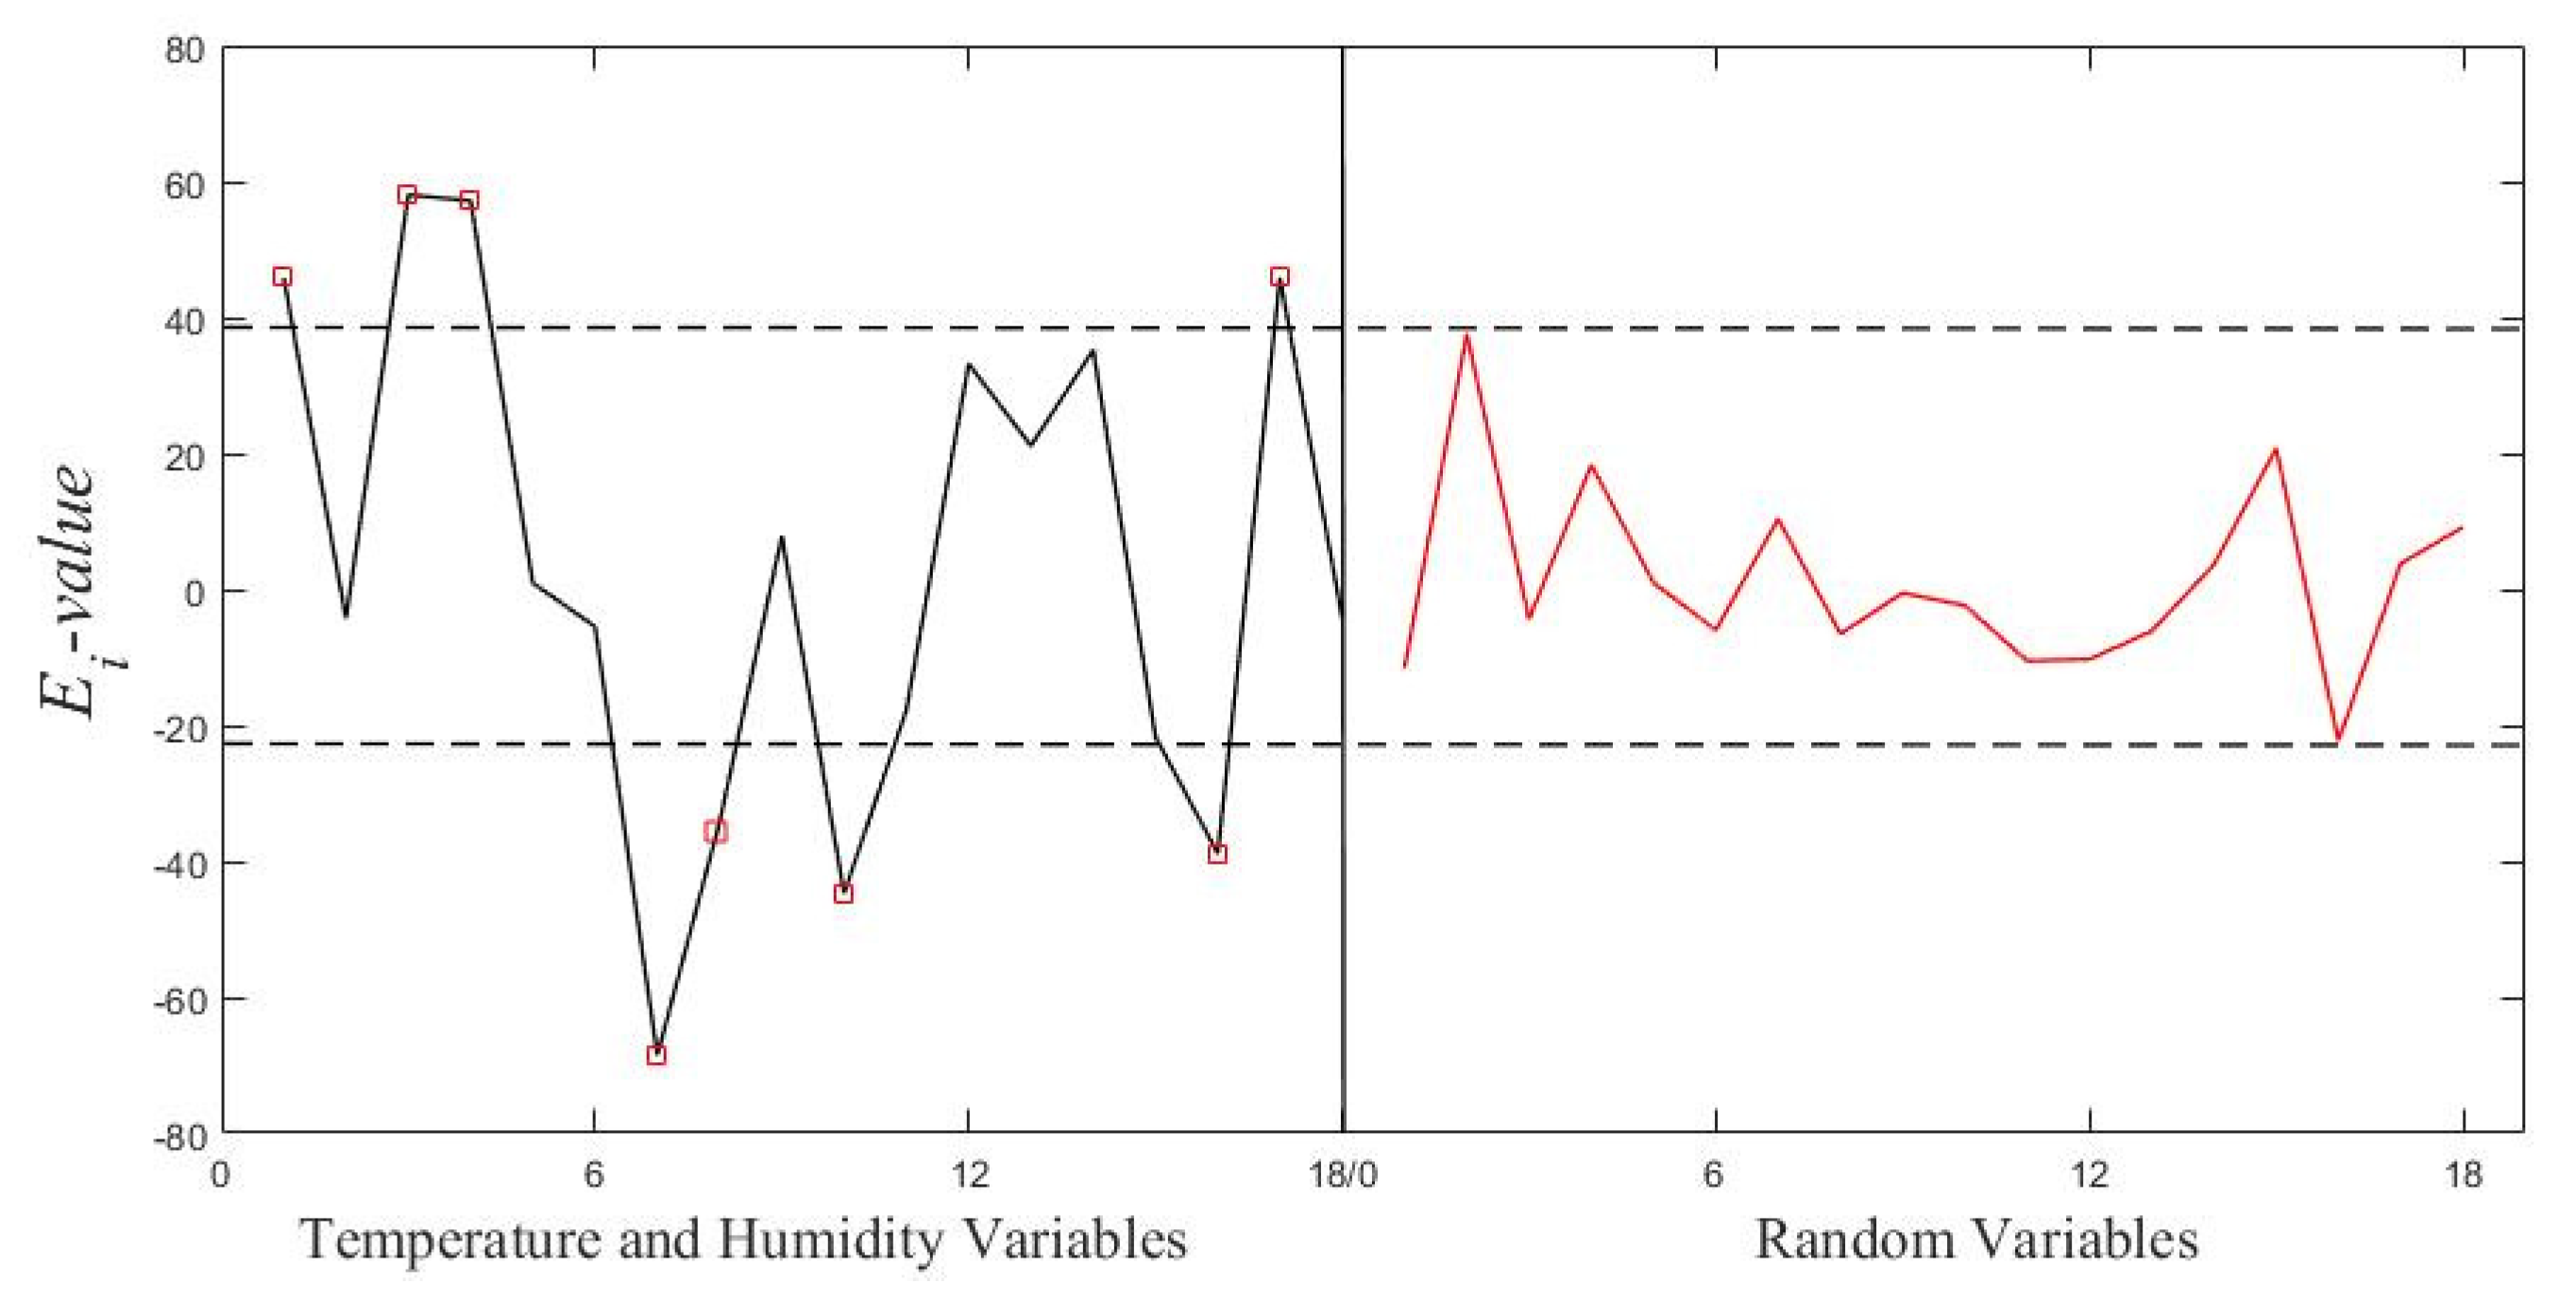
This study uses UVE to select sensitive variables for the sample of temperature and humidity variables to assess the reliability of each variable. The number of main components is selected as 10 and the number of sensitive variables is 8; the results of the treatment are shown in Figure 5.
The horizontal coordinates of Figure 5 indicate the variable ordinal numbers, and the vertical coordinates are the E i calculated according to the UVE method using Formula (2). The vertical line in the middle of the figure divides the temperature and humidity variable data matrix from the random noise data matrix. Two horizontal dashed lines are the upper and lower thresholds for sensitive variable selection, i.e., E m a x . UVE eliminates the data points within dashed lines and retains those outside, forming a new matrix X U V E .
Finally, eight groups of sensitive variables are selected: upper outlet temperature, lower outlet temperature, drying section B temperature, drying section C temperature, lower outlet humidity, humidity in drying section A, humidity in drying section B, and humidity in drying section D.

3.2. Multiple Linear Regression Model Results

3.2.1. MLR Established by Temperature and Humidity Variables

A Multiple Linear Regression model is developed, utilizing the full set of temperature and humidity variables as the independent input variables. The results of this model are presented in Table 4 and Table 5.
The model’s adjusted R2 is 0.910, which is not much different from the R2 of 0.919. The RMSE of the model is 0.881%, indicating a good fit of the model to the data, albeit with a larger error. Meanwhile, the VIF values in Table 4 can only reflect the problem of covariance between the model variables. Specifically, there are 3 variables with VIF values less than 10 and 11 variables with VIF values greater than 10. This suggests a significant issue of multicollinearity among the underlying variables in the model. As a result, the coefficients corresponding to most of the variables are not statistically significant, which may affect the interpretation and stability of the model. Although the presence of multicollinearity did not compromise the prediction results, and the joint test of the model remains significant, there is still a pressing need for further improvement in this model.

3.2.2. UVE-MLR Established by Sensitive Variables

Using the eight sensitive variables screened by UVE as the model’s independent variables, the Multiple Linear Regression model is built again, and the model results are presented in Table 6 and Table 7.
The model’s adjusted R2 is 0.898, and its RMSE is 0.908%. While the model-fitting effect is adequate, the error remains relatively high. Compared with the MLR model, from the VIF values in Table 6, it can be seen that there is only a slight multicollinearity problem between the variable data of the model, and the coefficients corresponding to the individual variables are not significant, and the problem of model covariance is obviously solved. The R2 of the model is significantly lower and the error is significantly higher, which shows that the reduction in the types of variables and the sample size of the data have an impact on the model, which may be caused by the fitting mechanism of the linear model.

3.3. Extreme Learning Machine Model results

3.3.1. ELM Established by Temperature and Humidity Variables

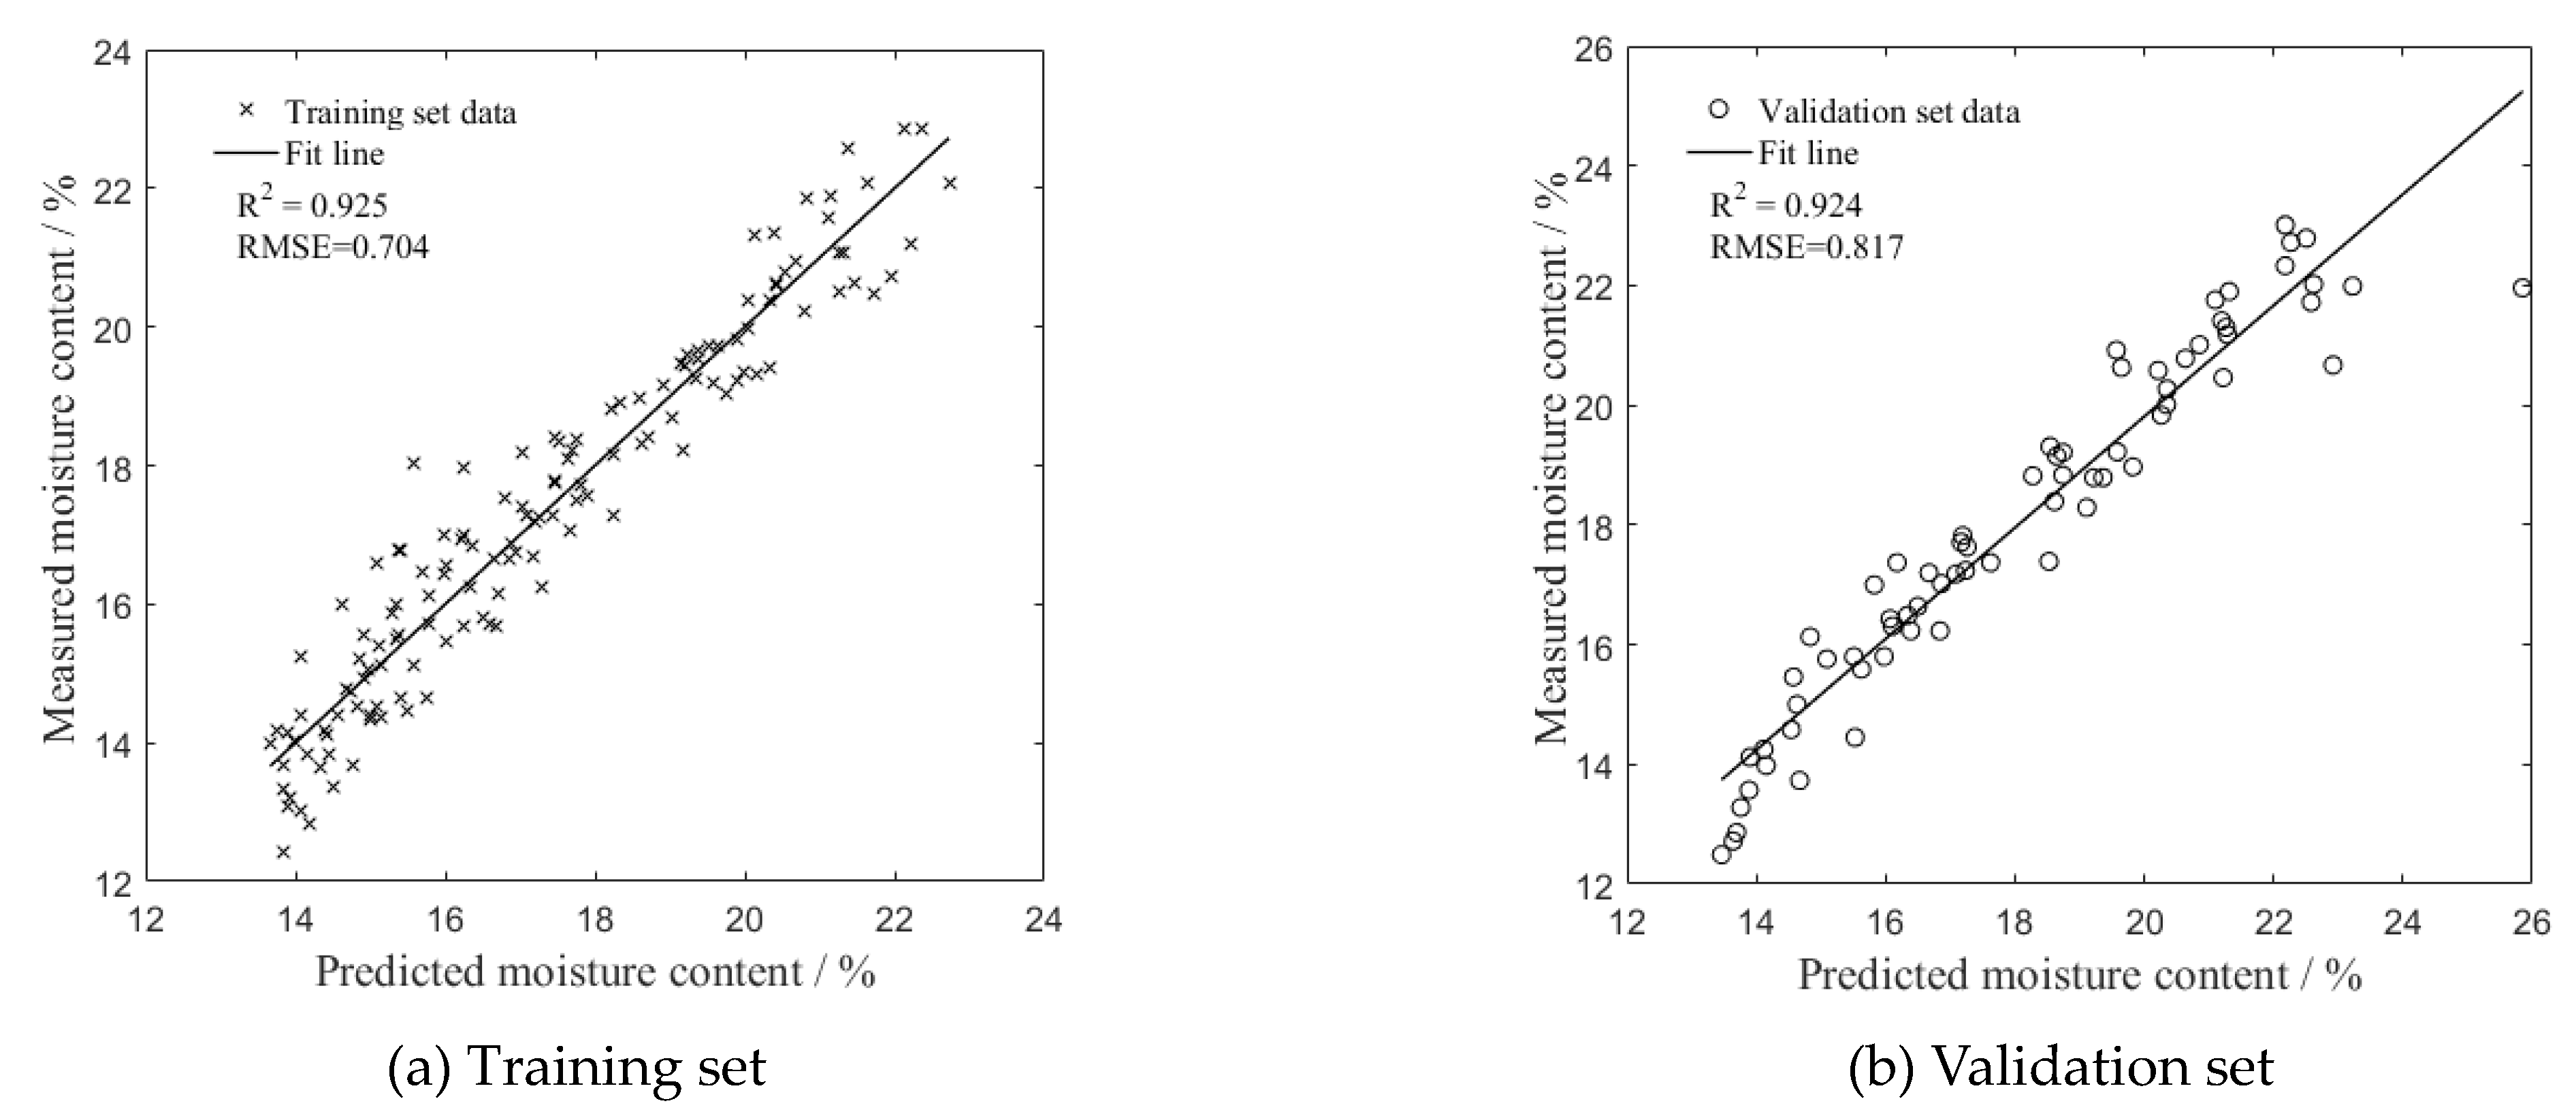
The ELM model is built with the full set of temperature and humidity variables as the independent variables. The determined optimal number of neurons for the model stands at 24, and the model results are shown in Figure 6.
The R2 of the model’s training set is 0.925, with an RMSE of 0.704%, while the R2 of the validation set is 0.924, with an RMSE of 0.817%, slightly higher than that of the training set. The relatively high R2 of the model’s training set indicates that the model can fit the training data well and has strong prediction ability, while the prediction error is small; the close R2 of the training set and the validation set indicates that the model is not overfitted. Compared with the Multiple Linear Regression model, the ELM model has more fitting advantages, and the prediction error is significantly reduced.

3.3.2. UVE-ELM Established by Sensitive Variables

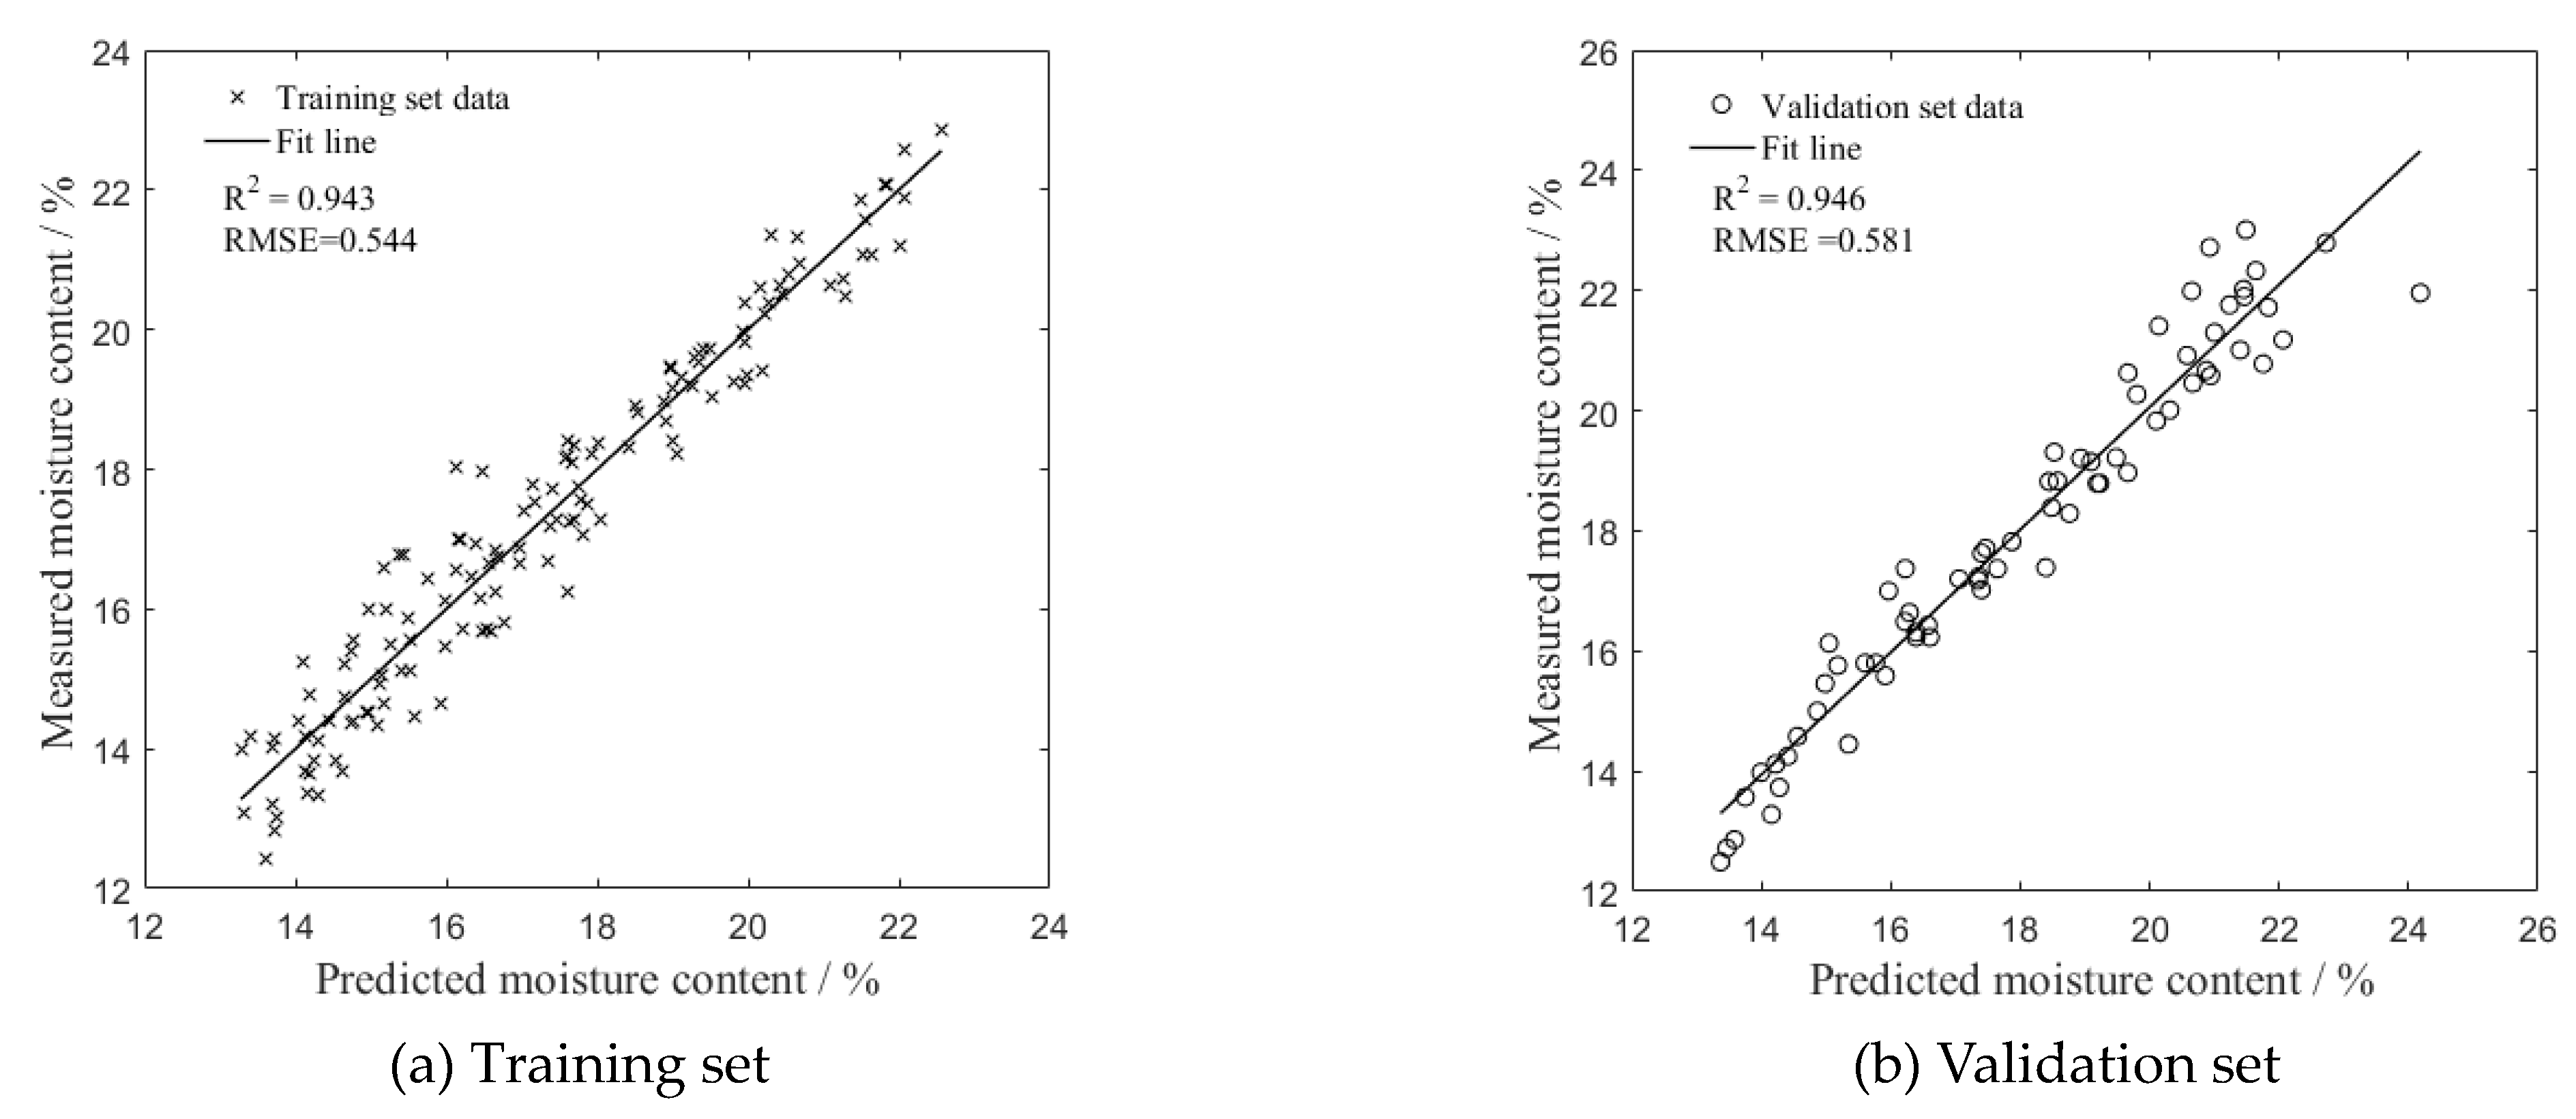
The sensitive variables screened by UVE are used as independent variables to construct the UVE-ELM model. The optimal number of conditioning neurons is 14, and the model runs at 0.02 s; the results of this model are shown in Figure 7.
The model’s training set achieves a goodness-of-fit R2 of 0.943 and an RMSE of 0.544%, and the validation set has an R2 of 0.946 and an RMSE of 0.581%. The UVE-ELM model built with sensitive variables improved the R2 by 0.02, and the prediction error was reduced substantially compared with the ELM model built with the full set of temperature and humidity variables. This indicates that the UVE-ELM model can better achieve the prediction of outgoing corn moisture content with stronger prediction ability and smaller error. Also, the training set and validation set R2 are close to each other, indicating that the model will not be overfitted; this result also shows that the sensitive variables screened by UVE are strongly representative, reducing the redundancy and covariance among data, and are more conducive to constructing the prediction model. The ELM method, compared with the multivariate-linear-fitting method, has obvious advantages in the prediction of outgoing moisture content in the drying process of corn.

3.4. Long Short-Term Memory Neural Network Model Results

3.4.1. LSTM Established by Temperature and Humidity Variables

The LSTM model is built with the full set of temperature and humidity variables as the independent variables, and some of the model results are shown in Table 8.
After training under various parameters, Table 8 presents representative parameter nodes along with their corresponding model results. It is observed that the model’s prediction accuracy is most favorable when the batch size is set to 30. As the number of iterations increases, the model error initially decreases sharply and then tends to stabilize. Notably, the computing time for the model does not scale significantly with the number of iterations; thus, there is no need to excessively increase the number of iterations. The optimal parameters for the whole network were obtained by setting the batch size to 30, the learning rate to 0.01, and the number of iterations to 500, under which the model runs in about 9 s.
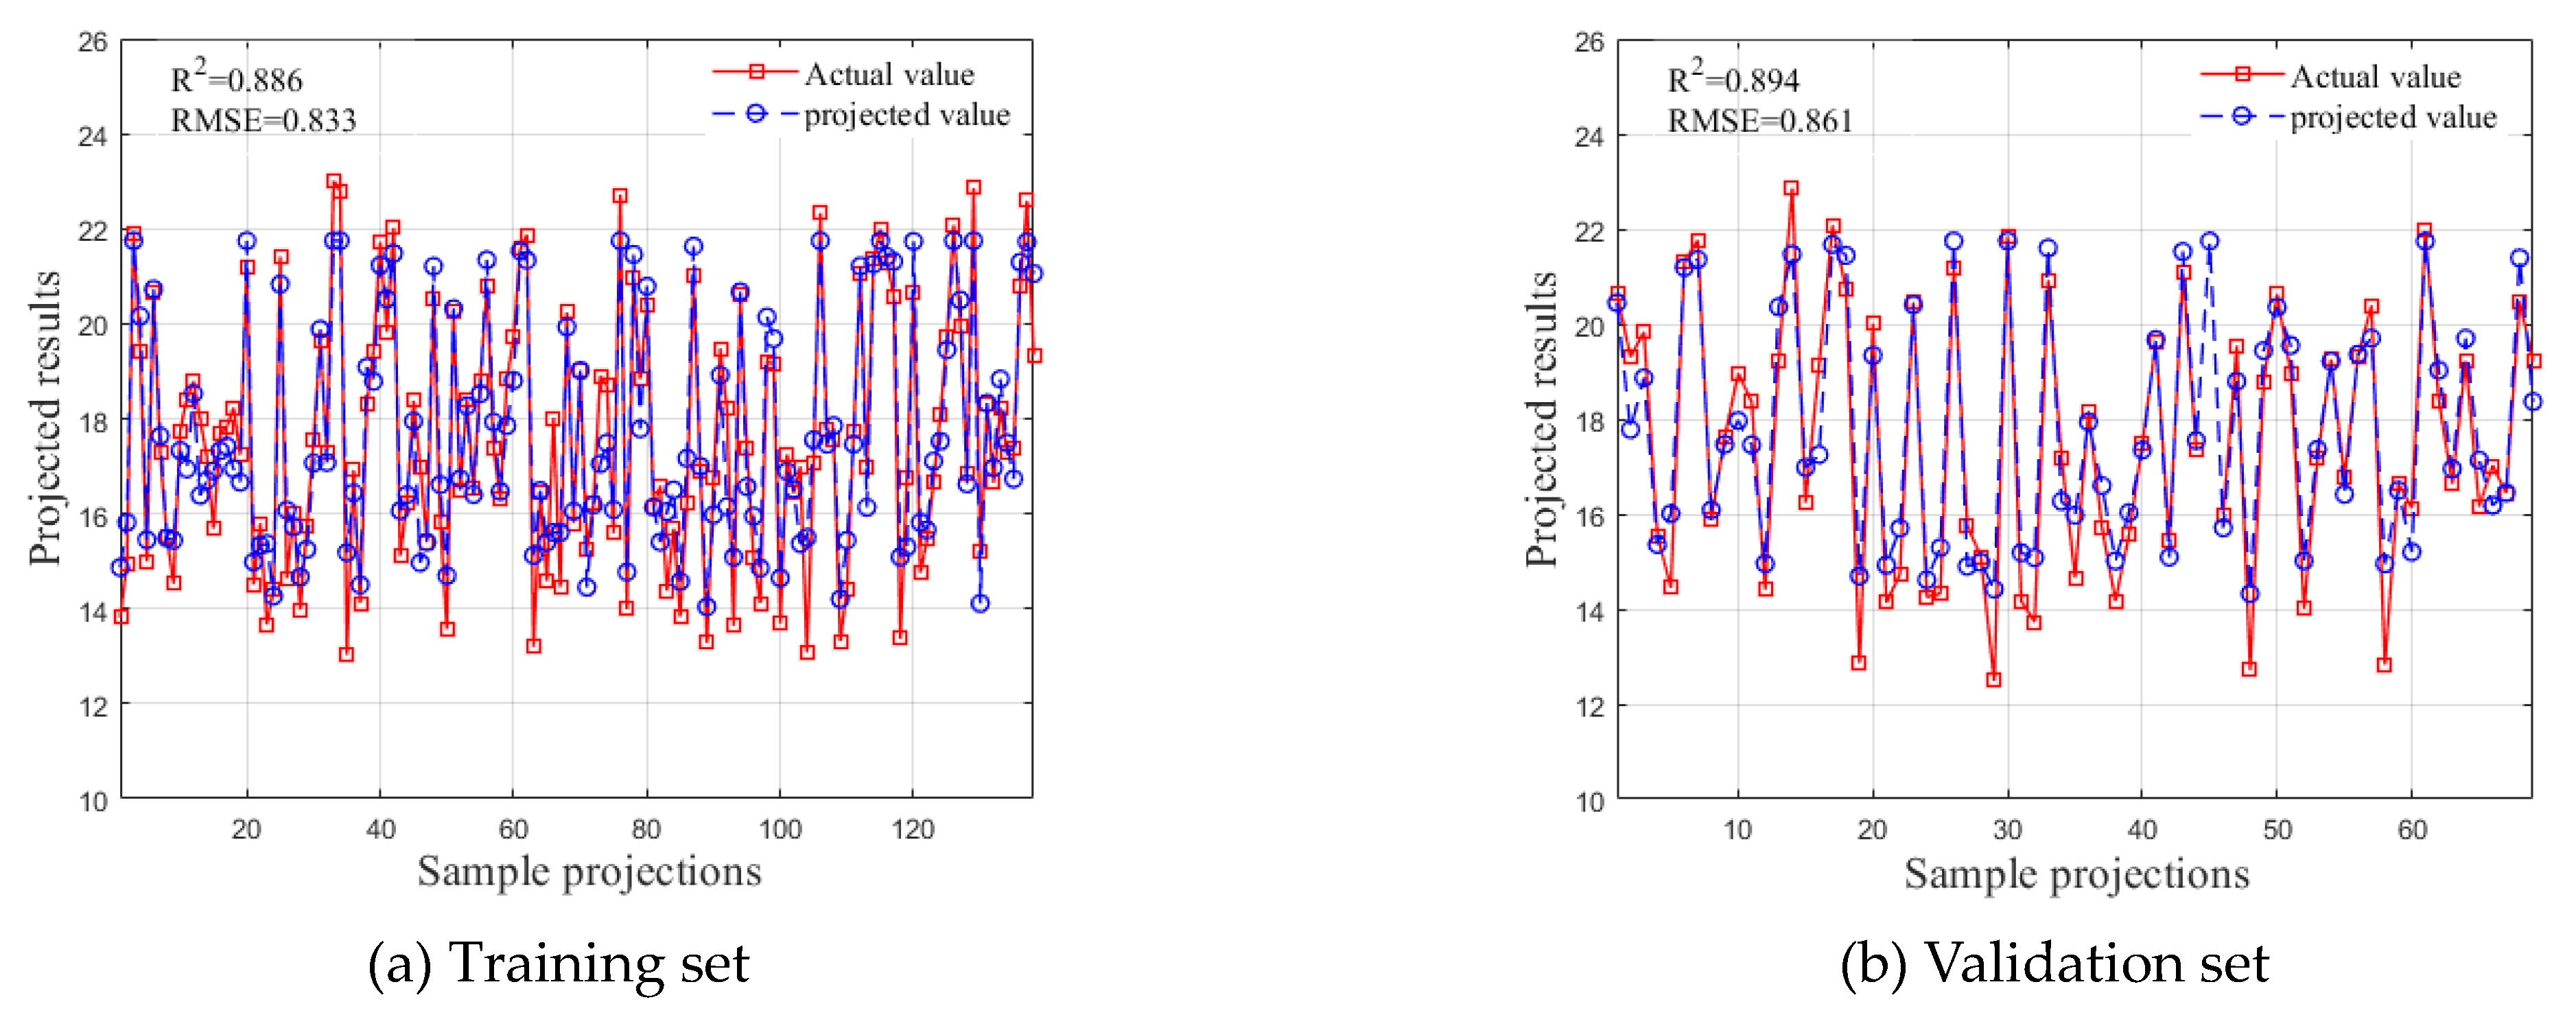
As shown in Figure 8, a model training set with an R2 of 0.886 and an RMSE of 0.883% and a validation set with an R2 of 0.894 and an RMSE of 0.861% are obtained. The prediction accuracy of this method is lower than that of the MLR and ELM models, and the prediction error lies between the two. This may be attributed to the high sensitivity requirement of LSTM to the input data. In addition, from Figure 8 we can intuitively observe the comparison between the predicted and actual values.

3.4.2. UVE-LSTM Established by Sensitive Variables

Similarly, in the development of UVE-LSTM, this study also conducts training experiments under different parameters, and the results are presented in Table 9. The pattern change in the parameters of the UVE-LSTM and LSTM models is more consistent. The optimal parameters of the whole network are finally obtained by setting the batch size to 30, the learning rate to 0.01, and the number of iterations to 100, under which the model runs at a speed of about 2 s.
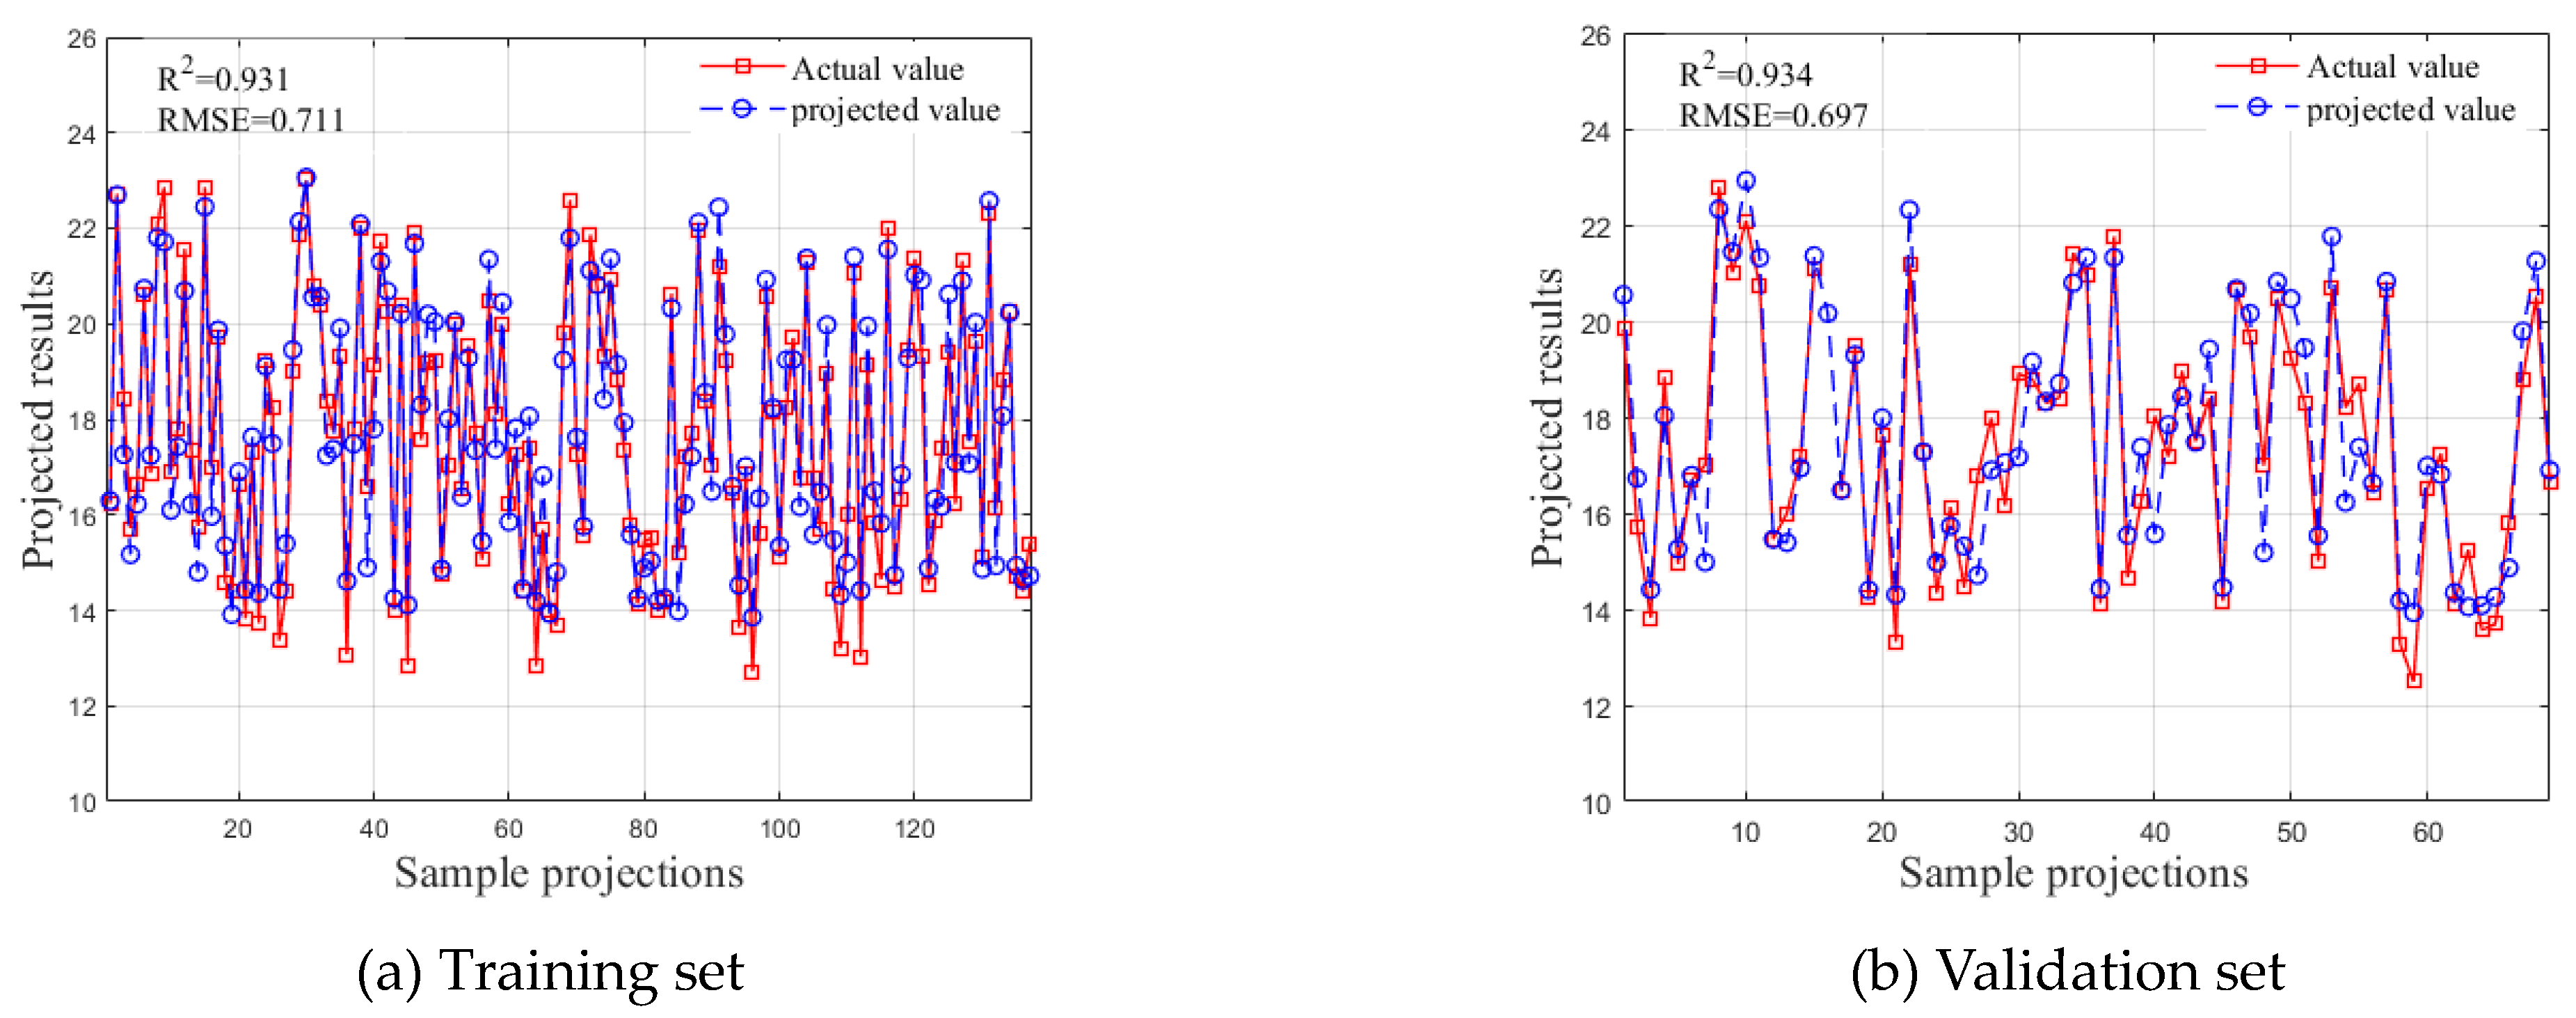
The UVE-LSTM model has an R2 of 0.931 and an RMSE of 0.711% for the training set and an R2 of 0.934 and an RMSE of 0.697% for the validation set. Combined with Figure 8 and Figure 9, the gap between predicted and actual values is significantly reduced in Figure 9. The UVE-LSTM model increases the R2 of predictions by nearly 0.05 compared with the LSTM model, and the prediction error is reduced by more than 0.2%. This also reaffirms the effectiveness and advantage of sensitive variables in predictive model building.

4. Discussion

In this study, a combined machine-type batch-type grain drying system with counter and current drying sections was used to design corn kernel drying experiments and gather researchable data. Then, based on UVE, sensitive variables were screened from temperature and humidity data, and six outgoing corn moisture content prediction models for the corn drying process based on MLR, ELM, and LSTM methods were proposed to provide theoretical support for improving the moisture content prediction capability and drying efficiency of the corn drying process. These models were developed based on an analysis of temperature and humidity data from mainstream drying models’ simulation experiments, providing significant reference value for the actual production of counter–current drying towers [44,45]. The constructed prediction models for the moisture content of corn drying systems exhibit high fitting accuracy, small error, and an ideal validation effect, thus offering technical support for the optimization of corn drying process parameters and the automatic control of the process [46,47].
First, we discuss future directions for model construction. Due to the high demand for LSTM models in terms of sample size, it is important to consider further exploring the deep analysis capability of such models by enriching the experimental design and increasing the training samples and feature data [48,49]. Moreover, to further improve the generalization ability of machine learning models and reduce the overfitting problem, model optimization can be carried out by considering the use of cross-validation [50], integrated learning [51], and swarm intelligence [52,53,54] to improve the prediction accuracy of the model. The problem of multicollinearity in the fitting process is more prominent in the MLR model. Integrating the model with UVE effectively screened sensitive variables and mitigated the issue, albeit at a certain cost to the model's predictive accuracy. In future research, we should consider combining the model with principal component analysis to effectively deal with the problem of multicollinearity [55,56,57] or using structural equation modelling, which can also incorporate multiple variables while not being restricted by data types [58,59].
Second, we also consider future directions for the experimental design aspect. It would be beneficial to consider enriching the experimental design by adding control variable gradients, increasing experimental varieties, accumulating training samples, and upgrading data complexity, so as to further improve the generalization and prediction capabilities of the model [60,61]. At the same time, there is limited experience in the validation of large-scale corn drying systems, and it is necessary to consider carrying out validation experiments to explore the application effect of the model in actual drying production [62].

5. Conclusions

The main conclusions of this study are as follows:
(1)
Based on the Uninformative Variable Elimination method, the sensitive variables for predicting the moisture content of outgoing corn can be effectively screened from 18 to 8, which effectively decreases the redundancy and multicollinearity of the data in the MLR model. The importance of sensitive variables in modeling is emphasized, and the coefficient of determination R2 of the ELM model is improved up to 0.02, while the improvement in the LSTM model is up to 0.05.
(2)
The prediction model for outgoing corn moisture content, based on ELM and LSTM methods, achieves a better fitting effect and higher prediction accuracy compared to MLR. The UVE-LSTM model, with a batch size of 30, a learning rate of 0.01, and 100 iterations, achieves a training set R2 of 0.931. When the UVE-ELM model uses sigmoid as the activation function and the number of neurons is set to 14, the model runs at a speed of 0.02 s and achieves the best prediction effect. The R2 of the training and validation set of the UVE-ELM model are 0.943 and 0.946, respectively, with the prediction errors of 0.544% and 0.581%, demonstrating its superior prediction ability. It provides a more scientific method for predicting corn drying moisture content and lays the foundation for using the prediction model to guide actual production.

Author Contributions

Conceptualization, S.X.; Methodology, S.X. and X.G.; Software, S.X. and Z.L.; Formal analysis, S.X.; Investigation, G.L.; Resources, S.X., Z.L., D.W. and G.L.; Data curation, Z.L. and X.G.; Writing—original draft, S.X., Z.L., X.G., D.W., G.L., Y.C. and Y.L.; Writing—review & editing, S.X. and X.G.; Visualization, Y.L.; Supervision, Y.C.; Project administration, Y.C.; Funding acquisition, Y.C., Z.L. and G.L. All authors have read and agreed to the published version of the manuscript.

Funding

This research was funded by Liaoning Provincial Natural Science Foundation-Superficial Project–“Research on the Mechanism of Multi-physical Field Coupling in Corn Drying Section” (2022-MS-068), The Presidential Foundation of the Liaoning Academy of Agricultural Sciences (NO2024MS0606) and 2023 Special Project for Young and Middle-aged Scientific and Technological Innovative Talents in Shenyang City (RC230459).

Institutional Review Board Statement

Not applicable.

Informed Consent Statement

Not applicable.

Data Availability Statement

The datasets presented in this article are not readily available because the data are part of an ongoing study. Requests to access the datasets should be directed to the corresponding author.

Conflicts of Interest

The authors declare no conflict of interest.

Abbreviations

ClassificationAbbreviationExplanation
Technical termMLRMultiple Linear Regression
ELMExtreme Learning Machine
LSTMLong Short-Term Memory
RNNRecurrent Neural Network
UVEUninformative Variable Elimination
Newly defined methodsUVE-MLRA modelling approach combining UVE and MLR
UVE-ELMA modelling approach combining UVE and ELM
UVE-LSTMA modelling approach combining UVE and LSTM

References

  1. Zhou, M.; Sun, H. Experimental study on corn grain crushing via quasi-static compression method. Trans. Chin. Soc. Agric. Eng. 2024, 40, 289. [Google Scholar]
  2. Wang, Z.; Wang, T.; Wu, Y.; Jingsheng, L.; Xiuying, X.; Chengbin, Z. Effects of Microwave intermittent Drying on Physicochemical Properties of Starch in Corn Kernels. J. Chin. Inst. Food Sci. Technol. 2024, 24, 179–190. [Google Scholar]
  3. Han, F.; Wu, W.; Liu, Z. Simulation Experiment System of Grain Continuous Drying Process and Process Control. Sci. Technol. Cereals Oils Foods 2023, 31, 83–89. [Google Scholar]
  4. Šooš, Ľ.; Urban, F.; Čačková, I.; olláth, Ľ.; Mlynár, P.; Čačko, V.; Bábics, J. Analysis of Thermodynamic Events Taking Place during Vacuum Drying of Corn. Sustainability 2024, 16, 879. [Google Scholar] [CrossRef]
  5. Adam, E.; William, L.; Greg, D.; Dyck, J. Performance evaluation of a non-equilibrium model for low temperature grain drying and simulation of seasonal dryer operation. Dry. Technol. 2022, 40, 835–851. [Google Scholar]
  6. Jibril, A.N.; Zhang, X.; Wang, S.; Bello, Z.A.; Henry, I.I.; Chen, K. Far-infrared drying influence on machine learning algorithms in improving corn drying process with graphene irradiation heating plates. J. Food Process Eng. 2024, 47, 14603. [Google Scholar] [CrossRef]
  7. Subrot, S.P.; Kaushik, L.; Singh, C.B.; Atungulu, G.; Corscadden, K. On-farm grain drying system sustainability: Current energy and carbon footprint assessment with potential reform measures. Sustain. Energy Technol. Assess. 2023, 60, 103430. [Google Scholar]
  8. Lin, Z.; Wang, D.; Liu, G. Application of Emulsified Fuel Oil Instead of Coal in Corn Dryer System. GRAIN Storage 2023, 52, 50–52. [Google Scholar]
  9. Amjad, W.; Chen, Z.; Ambrose, K. Design assessment of grain inverters in cross-flow grain dryer via CFD-DEM numerical simulation. Biosyst. Eng. 2024, 239, 147–157. [Google Scholar] [CrossRef]
  10. Bertotto, M.M.; Gastón, A.; Sánchez Sarmiento, G.; Gove, B. Effect of drying conditions on the quality of IRGA 424 rice. J. Sci. Food Agric. 2019, 99, 1651–1659. [Google Scholar] [CrossRef]
  11. Xin, L.; Kaimin, Y.; Yuancheng, W.; Du, X. Simulation study on coupled heat and moisture transfer in grain drying process based on discrete element and finite element method. Dry. Technol. 2023, 41, 2027–2041. [Google Scholar]
  12. Bi, Q. Multi-Field Coupled Hot Air Drying Characteristics of Multilayer Corn Seeds. Master’s Thesis, Northeast Electric Power University, Jilin, China, 2021. [Google Scholar]
  13. Hernández-Pérez, J.; García-Alvarado, M.; Trystram, G.; Heyd, B. Neural networks for the heat and mass transfer prediction during drying of cassava and mango. Innov. Food Sci. Emerg. Technol. 2003, 5, 57–64. [Google Scholar] [CrossRef]
  14. Hoon, K.; Seok, T.K.; Gwan, D.S.; Han, J.W. Optimization of Circulation Cross-Flow Dryer by Simulation During Wheat Drying. J. Biosyst. Eng. 2024, 49, 89–99. [Google Scholar]
  15. Çelik, E.; Koç, M.A.; Parlak, N.; Çay, Y. Prediction of the capacitance of the corn drying process parameter using adaptive- neuro-fuzzy intelligent technique with experimental validation. Dry. Technol. 2024, 42, 90–113. [Google Scholar] [CrossRef]
  16. Halaly, R.; Tsur, E.E. Continuous adaptive nonlinear model predictive control using spiking neural networks and real-time learning. Neuromorphic Comput. Eng. 2024, 4, 024006. [Google Scholar] [CrossRef]
  17. Ghosh, R.; Sahu, B.; Dey, A.; Thota, H.K.; Das, K. Artificial neural network-based approach for prediction of nanomechanical properties of anodic coating on additively manufactured Al–10Si–Mg alloy. Model. Simul. Mater. Sci. Eng. 2024, 32, 055006. [Google Scholar] [CrossRef]
  18. Xu, R.; Liang, X.; Qi, J.; Li, Z.Y.; Zhang, S.S. Advances and Trends in Extreme Learning Machine. Chin. J. Comput. 2019, 42, 1640–1670. [Google Scholar]
  19. Tongyu, X.; Simin, X.; Fenghua, Y.; Zhonghui, G.; Yadi, L. A BAS-ELM inversion method of japonica rice canopy nitrogen content based on a combination of multiple vegetation indices. J. Shenyang Agric. Univ. 2021, 52, 577–585. [Google Scholar]
  20. Jin, Y. Grain Drying Process Based on Equivalent Accumulated Temperature. Ph.D. Thesis, Jilin University, Changchun, China, 2019. [Google Scholar]
  21. Wu, Y.; Fu, D.; Yin, H. Establishment of Mathematical Model of Accumulated Temperature of Corn Based on Multi–Parameter Controllable Thin—Layer Drying Experiment and Its Tool Chart. J. Chin. Cereals Oils Assoc. 2020, 35, 114–120. [Google Scholar]
  22. Wang, H.; Liu, G.; Lin, L. Predictive control model of corn drying process based on neural network. Cereals Oils 2021, 34, 37–40. [Google Scholar]
  23. Lei, D.; Fu, Y.; Jin, H. Study on Prediction of Corn Drying Moisture Content Based on BP Neural Network. Grain Process. 2022, 47, 45–48. [Google Scholar]
  24. Dajbych, O.; Kabutey, A.; Mizera, Č.; Herák, D. Investigation of the Effects of Infrared and Hot Air Oven Drying Methods on Drying Behaviour and Colour Parameters of Red Delicious Apple Slices. Processes 2023, 11, 3027. [Google Scholar] [CrossRef]
  25. Xing, S.; Gao, X.; Lin, Z. A Model for Predicting the Outgoing Moisture Content of Corn Drying System Based on Extreme Learning Machine. J. Shenyang Agric. Univ. 2023, 54, 619–626. [Google Scholar]
  26. Kirtika, S.; Surendra, K.; Panwar, N.L.; Patel, M.R. Influences of a novel cylindrical solar dryer on farmer’s income and its impact on environment. Environ. Sci. Pollut. Res. Int. 2022, 29, 78887–78900. [Google Scholar]
  27. Meng, F. Numerical Simulation and Experimental Study of Moisture Heat Transfer During Corn Drying. Master’s Thesis, Henan University of Technology, Zhengzhou, China, 2022. [Google Scholar]
  28. Wang, H. Application of Regression Analysis in Modeling Drying Process of Counter and Current Grain Dryer. Mod. Food 2022, 28, 5–8. [Google Scholar]
  29. Wu, S.; Ren, G.; Zhang, Y. Simulation and experiment of heat and moisture transfer during ventilated drying process in maize grain pile. Trans. Chin. Soc. Agric. Eng. 2024, 4, 1–12. [Google Scholar]
  30. Jin, Y.; Xie, H.; Yin, J.; Zhang, Z. Research on Intelligent Control Method of Grain Drying Based on LSTM-MPC. Sci. Technol. Cereals Oils Foods 2023, 31, 25–34. [Google Scholar]
  31. An, N.N.; Sun, W.; Li, D.; Wang, L.J.; Wang, Y. Effect of microwave-assisted hot air drying on drying kinetics, water migration, dielectric properties, and microstructure of corn. Food Chem. 2024, 455, 139913. [Google Scholar] [CrossRef]
  32. GB 5009.3-2016; National Standard for Food Safety Determination of Moisture in Foods. National Health Commission of the People’s Republic of China: Beijing, China, 2016.
  33. Zhang, X.; Yu, B. Beijing Urban Haze Control Strategy Based on Pearson Correlation Analysis and BP Neural Network. Syst. Eng. 2023, 41, 26–34. [Google Scholar]
  34. Domingo, D.; Kareem, A.B.; Okwuosa, C.N.; Custodio, P.M.; Hur, J.W. Transformer Core Fault Diagnosis via Current Signal Analysis with Pearson Correlation Feature Selection. Electronics 2024, 13, 926. [Google Scholar] [CrossRef]
  35. Lotfi, M.; Chamjangali, M.A.; Mozafari, Z. Ridge regression coupled with a new uninformative variable elimination algorithm as a new descriptor screening method: Application of data reduction in QSAR study of some sulfonated derivatives as c-Met inhibitors. Chemom. Intell. Lab. Syst. 2023, 232, 104714. [Google Scholar] [CrossRef]
  36. Qu, G.; Chen, Z.; Zhang, Q. Study on germination rate of rice seed based on uninformation variable elimination method. Jiangsu, J. Agric. Sci. 2019, 35, 1015–1020. [Google Scholar]
  37. Centner, V.; Massart, D.L.; de Noord, O.E.; de Jong, S.; Vandeginste, B.M.; Sterna, C. Elimination of uninformative variables for multivariate calibration. Anal. Chem. 1996, 68, 3851–3858. [Google Scholar] [CrossRef] [PubMed]
  38. Leng, J.; Gao, X.; Zhu, J. Application of multiple linear regression statistical forecasting models. Stat. Decis. 2016, 7, 82–85. [Google Scholar]
  39. McIntosh, M.J. Conservative sample size for multiple regression models. Commun. Stat.-Theory Methods 2023, 52, 5527–5533. [Google Scholar] [CrossRef]
  40. Huang, G.; Zhu, Q.; Chee-Kheong, S. Extreme learning machine: Theory and applications. Neuro-Computing 2006, 70, 489–501. [Google Scholar] [CrossRef]
  41. Umair, R.U.J.; Pozarlik, A.K.; Gerrit, B. Experimental analysis of spray drying in a process intensified counter flow dryer. Dry. Technol. 2022, 40, 3128–3148. [Google Scholar]
  42. Zhang, M.; Yuan, M.Z.; Dai, S.S.; Chen, M.L.; Incecik, A. LSTM RNN-based excitation force prediction for the real-time control of wave energy converters. Ocean. Eng. 2024, 306, 118023. [Google Scholar] [CrossRef]
  43. Hochreiter, S.; Schmidhuber, J. Long short-term memory. Neural Comput. 1997, 9, 1735–1780. [Google Scholar] [CrossRef]
  44. Wang, D.; Liu, G.; Zhou, G. Current Status of Rice Storage and Drying in Liaoning Province. Mod. Food 2022, 28, 226–228. [Google Scholar]
  45. Zhao, B. Simulation Experiment System of Grain Continuous Drying Process and Process Control. Master’s Thesis, Jilin University, Changchun, China, 2012. [Google Scholar]
  46. Lv, W.; Zhang, M.; Wang, Y.; Adhikari, B. Online measurement of moisture content, moisture distribution, and state of water in corn kernels during microwave vacuum drying using novel smart NMR/MRI detection system. Dry. Technol. 2018, 36, 1592–1602. [Google Scholar] [CrossRef]
  47. Xie, H.; Jin, Y.; Zhang, Z. Prediction and Optimization of Grain Dryer Outlet Moisture Content Based on LSTM. J. Chin. Cereals Oils Assoc. 2023, 38, 196–204. [Google Scholar]
  48. José, A.M.; Carlos, A.S.; Helmer, M. Nonlinear model of a rice drying process using neural networks. Vitae 2018, 25, 120–127. [Google Scholar]
  49. Myhan, R.; Jachimczyk, E.; Markowski, M. The Use of Graph Theory for Modeling and Analyzing the Structure of a Complex System, with the Example of an Industrial Grain Drying Line. Processes 2023, 11, 2812. [Google Scholar] [CrossRef]
  50. Hong, M.; Ai, P.; Yue, Z. Mid—Long term runoff forecasting based on FPA—ELM model in Yalong River Basin. Yangtze River 2022, 53, 119–125. [Google Scholar]
  51. Li, L. Research on Land Use Cover Classification Optimization Methods for Hyperspectral Remote Sensing Image Based on ELM. Master’s Thesis, Xidian University, Chengdu, China, 2018. [Google Scholar]
  52. Zhang, X.; Chang, Y. Prediction of external corrosion rate of offshore oil and gas pipelines based on FA-BAS-ELM. China Saf. Sci. J. 2022, 32, 99–106. [Google Scholar]
  53. Li, Y.; Chang, J.; Wang, Y. MKL-SVM algorithm for pulmonary nodule recognition based on swarm intelligence optimization. Chin. J. Eng. 2021, 43, 1157–1165. [Google Scholar]
  54. Li, Z. Application of population intelligence optimization algorithms to environmental monitoring problems in maize fields. J. Biotech. Res. 2024, 16, 77–90. [Google Scholar]
  55. Xi, F.W.; Jiang, W.Q.; Yang, M.A. Using stepwise regression to address multicollinearity is not appropriate. Int. J. Surg. 2024, 110, 3122–3123. [Google Scholar] [CrossRef]
  56. Maryam, S. Modeling survival response using a parametric approach in the presence of multicollinearity. Commun. Stat. -Simul. Comput. 2024, 53, 1889–1898. [Google Scholar]
  57. Abasi, S.; Minaei, S. Effect of Drying Temperature on Mechanical Properties of Dried Corn. Dry. Technol. 2014, 32, 774–780. [Google Scholar] [CrossRef]
  58. Qi, Q.; Cai, T.; Zhou, K.; Hu, Z.; Hao, F.; Wei, Y.; Ge-Zhang, S.; Cui, J. Consumers’ Risk Perception of Triploid Food: Empirical Research Based on Variance Analysis and Structural Equation Modeling. Sustainability 2024, 16, 3872. [Google Scholar] [CrossRef]
  59. Islam, Q.; Khan, A.F.M.S. Assessing Consumer Behavior in Sustainable Product Markets: A Structural Equation Modeling Approach with Partial Least Squares Analysis. Sustainability 2024, 16, 3400. [Google Scholar] [CrossRef]
  60. Dai, A. Research on Intelligent Modeling and Control of Grain Drying Process. Ph.D. Thesis, Beijing University of Posts and Telecommunications, Beijing, China, 2019. [Google Scholar]
  61. Kamruzzaman, M.D.; Uyeh, D.D.; Jang, I.J.; Woo, S.M.; Ha, Y.S. Drying characteristics and milling quality of parboiled Japonica rice under various drying conditions. Eng. Agric. Environ. Food 2017, 10, 292–297. [Google Scholar] [CrossRef]
  62. Lei, D. Mixed-flow drying tower grain moisture content control model and control system research. Master’s Thesis, Heilongjiang Bayi Agricultural University, Daqing, China, 2023. [Google Scholar]
Figure 1. Grain drying simulation test system workflow sketch.
Applsci 14 05680 g001
Figure 2. Grain drying simulation experiment system. (1: Drying section; 2: Hot air duct; 3: Tempering section; 4: Electric hot air furnace; 5: Grain discharge section; 6: Feed opening; 7: Control box; 8: Grain elevator).
Applsci 14 05680 g002
Figure 3. Drying section monitoring point. (1: Upper outlet; 2: Lower outlet; 3: Drying section A; 4: Drying section B; 5: Drying section C; 6: Drying section D; 7: Drying section E; 8: Hot air pipe).
Applsci 14 05680 g003
Figure 4. Flowchart of ELM model construction.
Applsci 14 05680 g004
Figure 5. UVE processing results.
Applsci 14 05680 g005
Figure 6. Prediction model of moisture content of corn outlet based on ELM.
Applsci 14 05680 g006
Figure 7. Prediction model of moisture content of corn outlet based on UVE-ELM.
Applsci 14 05680 g007
Figure 8. Prediction model of moisture content of corn outlet based on LSTM.
Applsci 14 05680 g008
Figure 9. Prediction model of moisture content of corn outlet based on UVE-LSTM.
Applsci 14 05680 g009
Table 1. Summary of corn moisture content data.
Sample Size/SetsMaximum Value/%Minimum Value/%Mean Value/%SD/%C.V.
20723.0112.412.9622.6910.153
Table 2. Statistical table of Pearson correlation coefficient between characteristic factor (temperature) and corn moisture content.
NamesAmbient Upper Outlet Lower Outlet Drying Section A Drying Section B Drying Section C Drying Section D Drying Section E Hot Air Pipe
Pearson correlation coefficient 0.0400.8610.8090.7650.8820.7810.8740.7090.360
Significance0.569<0.001<0.001<0.001<0.001<0.001<0.001<0.001<0.001
Table 3. Statistical table of Pearson correlation coefficient between characteristic factor (humidity) and corn moisture content.
NamesAmbientUpper OutletLower OutletDrying Section ADrying Section BDrying Section CDrying Section DDrying Section EHot Air Pipe
Pearson correlation coefficient−0.121−0.749−0.770−0.714−0.752−0.721−0.790−0.816−0.452
Significance0.083<0.001<0.001<0.001<0.001<0.001<0.001<0.001<0.001
Table 4. MLR model coefficient table.
Variable NamesUnnormalized CoefficientStandard ErrorStandardization CoefficientVIFSignificance
Constant22.5961.094--<0.001
Upper outlet temperature0.1390.0850.57544.910.105
Lower outlet temperature0.0290.0930.11711.3200.756
Drying section A temperature0.1990.0990.85136.0120.046
Drying section B temperature−0.310.058−1.45829.79<0.001
Drying section C temperature−0.3810.119−1.5674.060.002
Drying section D temperature0.0880.0390.1063.370.027
Drying section E temperature0.090.0170.58717.73<0.001
Upper outlet humidity0.0410.0230.38921.520.078
Lower outlet humidity0.0260.0360.17823.170.477
Humidity in drying section A0.1280.030.59129.33<0.001
Humidity in drying section B−0.010.01−0.0412.939<0.001
Humidity in drying section C−0.0930.03−0.43830.650.003
Humidity in drying section D−0.1020.033−0.88153.160.003
Humidity in drying section E−0.0620.045−0.0764.60.172
Table 5. MLR model evaluation results.
Model Evaluation IndexR2Adjusted R2Root-Mean-Square ErrorSignificance
value0.9190.9100.881<0.001
Table 6. UVE-MLR model coefficient table.
Variable NamesUnnormalized CoefficientStandard ErrorStandardization CoefficientVIFSignificance
Constant22.9520.718--<0.001
Upper outlet temperature0.1430.0690.5928.8000.041
Lower outlet temperature0.1140.0100.7402.060<0.001
Drying section B temperature−0.3480.053−1.63611.861<0.001
Drying section C temperature−0.1830.089−0.7517.270<0.001
Lower outlet humidity0.0750.0290.0901.630<0.001
Humidity in drying section A0.0120.0260.0563.1600.742
Humidity in drying section B−0.0570.017−0.5353.740<0.001
Humidity in drying section D0.0100.0250.0854.3420.701
Table 7. UVE-MLR model evaluation results.
Model Evaluation IndexR2Adjusted R2Root-Mean-Square ErrorSignificance
value0.9050.8980.908<0.001
Table 8. Performance of LSTM network model with varying training parameters.
Batch SizeInitial Learn RateIterationsRMSE (Training Set)/%RMSE (Validation Set)/%Training Duration/s
300.01500.9831.0222
1000.8650.8763
5000.8830.8619
10000.8520.94618
500.01501.0020.9611
1000.8750.8962
5000.8920.9055
10000.8870.9229
1000.01501.0571.1311
1001.2011.2422
5000.8920.9355
10000.9120.9609
Table 9. Performance of UVE-LSTM network model with varying training parameters.
Batch SizeInitial Learn RateIterationsRMSE (Training Set)/%RMSE (Validation Set)/%Training Duration/s
300.01500.7740.7492
1000.7110.6972
5000.6900.7239
10000.6490.79317
500.01500.9970.8331
1000.7550.7142
5000.7690.8094
10000.7310.7529
1000.01501.0571.2331
1001.2011.1412
5000.8620.9155
10000.7400.8199
Disclaimer/Publisher’s Note: The statements, opinions and data contained in all publications are solely those of the individual author(s) and contributor(s) and not of MDPI and/or the editor(s). MDPI and/or the editor(s) disclaim responsibility for any injury to people or property resulting from any ideas, methods, instructions or products referred to in the content.