Article

A Multi-Objective Evaluation Method for Smart Highway Operation and Management

1
School of Mechanics and Engineering Science, Shanghai University, Shanghai 200044, China
2
Shanghai Urban Operation (Group) Co., Ltd., Shanghai 200023, China
*
Author to whom correspondence should be addressed.
Appl. Sci. 2024, 14(13), 5694; https://doi.org/10.3390/app14135694
Submission received: 18 May 2024 / Revised: 21 June 2024 / Accepted: 24 June 2024 / Published: 29 June 2024
(This article belongs to the Section Transportation and Future Mobility)

Abstract

:
Smart highways represent a novel highway concept in the era of big data, emphasizing the synergy among people, vehicles, road facilities, and the environment. However, the operation and management of smart highways have become more intricate, surpassing the adaptability of traditional highway evaluation and management methods. This study integrates the distinctive characteristics of smart highway facilities and operational objectives to enhance and modernize the existing highway evaluation system. Drawing from research on smart highway construction projects, a smart highway evaluation system encompassing facility structure, electromechanical facilities, and operation services is formulated based on a hierarchical analysis method. The quantitative evaluation of each indicator is achieved by combining existing specifications and expert questionnaire solicitation. The group decision-making method is initially employed to optimize subjective weights, followed by the calculation of combined weights using both the entropy weight method and critic method in objective evaluation. Finally, a comprehensive evaluation model is established and validated through engineering projects. The results demonstrate that the evaluation system effectively highlights the advantages and disadvantages in the operation and management of smart highways, thereby fostering the advancement of smart highway iteration.

1. Introduction

With the continuous improvement of highway networks worldwide, highway operations management is undergoing a transformation from being focused on facilities to being focused on users. The highway transportation industry is progressing towards rapid digitization and informatization, as well as intelligent highway infrastructure. The concept of a smart highway has also been proposed to extend and innovate the traditional highway system [1].
Based on international explorations in the development of smart highway construction, there is a fundamental consensus on their service functions. Smart highways aim to fully leverage the functional attributes of highways by integrating advanced sensing, communication, information processing, and control technologies, thereby forming an open and shared foundational platform. With goals focused on safety, efficiency, convenience, and sustainability, smart highways adopt diverse management and service modes. They provide reliable networked transit services for the rapid transportation of people and goods, offer a free communication service for vehicle-to-vehicle and vehicle-to-road interactions, deliver responsive emergency services around the clock, and furnish travelers with refined and autonomous travel services [2]. Therefore, smart highways have the potential to meet the practical needs of the public in the long term. They have been attracting increasing attention and show broad prospects for application.
The construction of smart highways still poses certain challenges [3]. Existing research findings have not provided substantial guidance for the widespread construction of smart highways due to significant variations in infrastructure conditions and traffic operations among different regions’ highways. Currently, there is a lack of unified standards for evaluating decision factors related to facility equipment, operational management, and the overall quality of smart highways. Moreover, the assessment of smart highway systems poses difficulties in obtaining standardized and quantitative data due to the consideration of multiple indicators. To address these issues, regional characteristics of smart highways must be analyzed, an effective evaluation system must be developed, and a differentiated construction strategy must be proposed to guide the targeted development of highways. Research on an evaluation system for smart highways holds significant practical engineering relevance.
In the context of growing interest in smart highways, there is an absence of in-depth analysis of the theoretical system of this emerging field. This lack of research is particularly evident in the following areas: the essential connotation of smart highways, basic support in the construction process, the quantitative and qualitative evaluation of construction and management, and the selection and optimization of specific evaluation methods [4,5,6]. Therefore, this paper presents a summary of the development mode and current situation of smart highways. It investigates multiple smart highways in different regions, integrates subjective and objective weighting methods, and develops and consolidates a scientific evaluation system based on the needs of practical smart highway management. This evaluation system is founded on the principles of systematicity, authenticity, and quantifiability. It integrates the development goals of efficiency, safety, intelligence, and sustainability with the construction and management concepts of facility structure, electromechanical facilities, and operation services. This comprehensive multi-level and multi-indicator system is well suited for both the management department to assess the intelligence level of the smart highway and for the operational department to offer guidance on the construction of the smart highway.

2. Literature Review

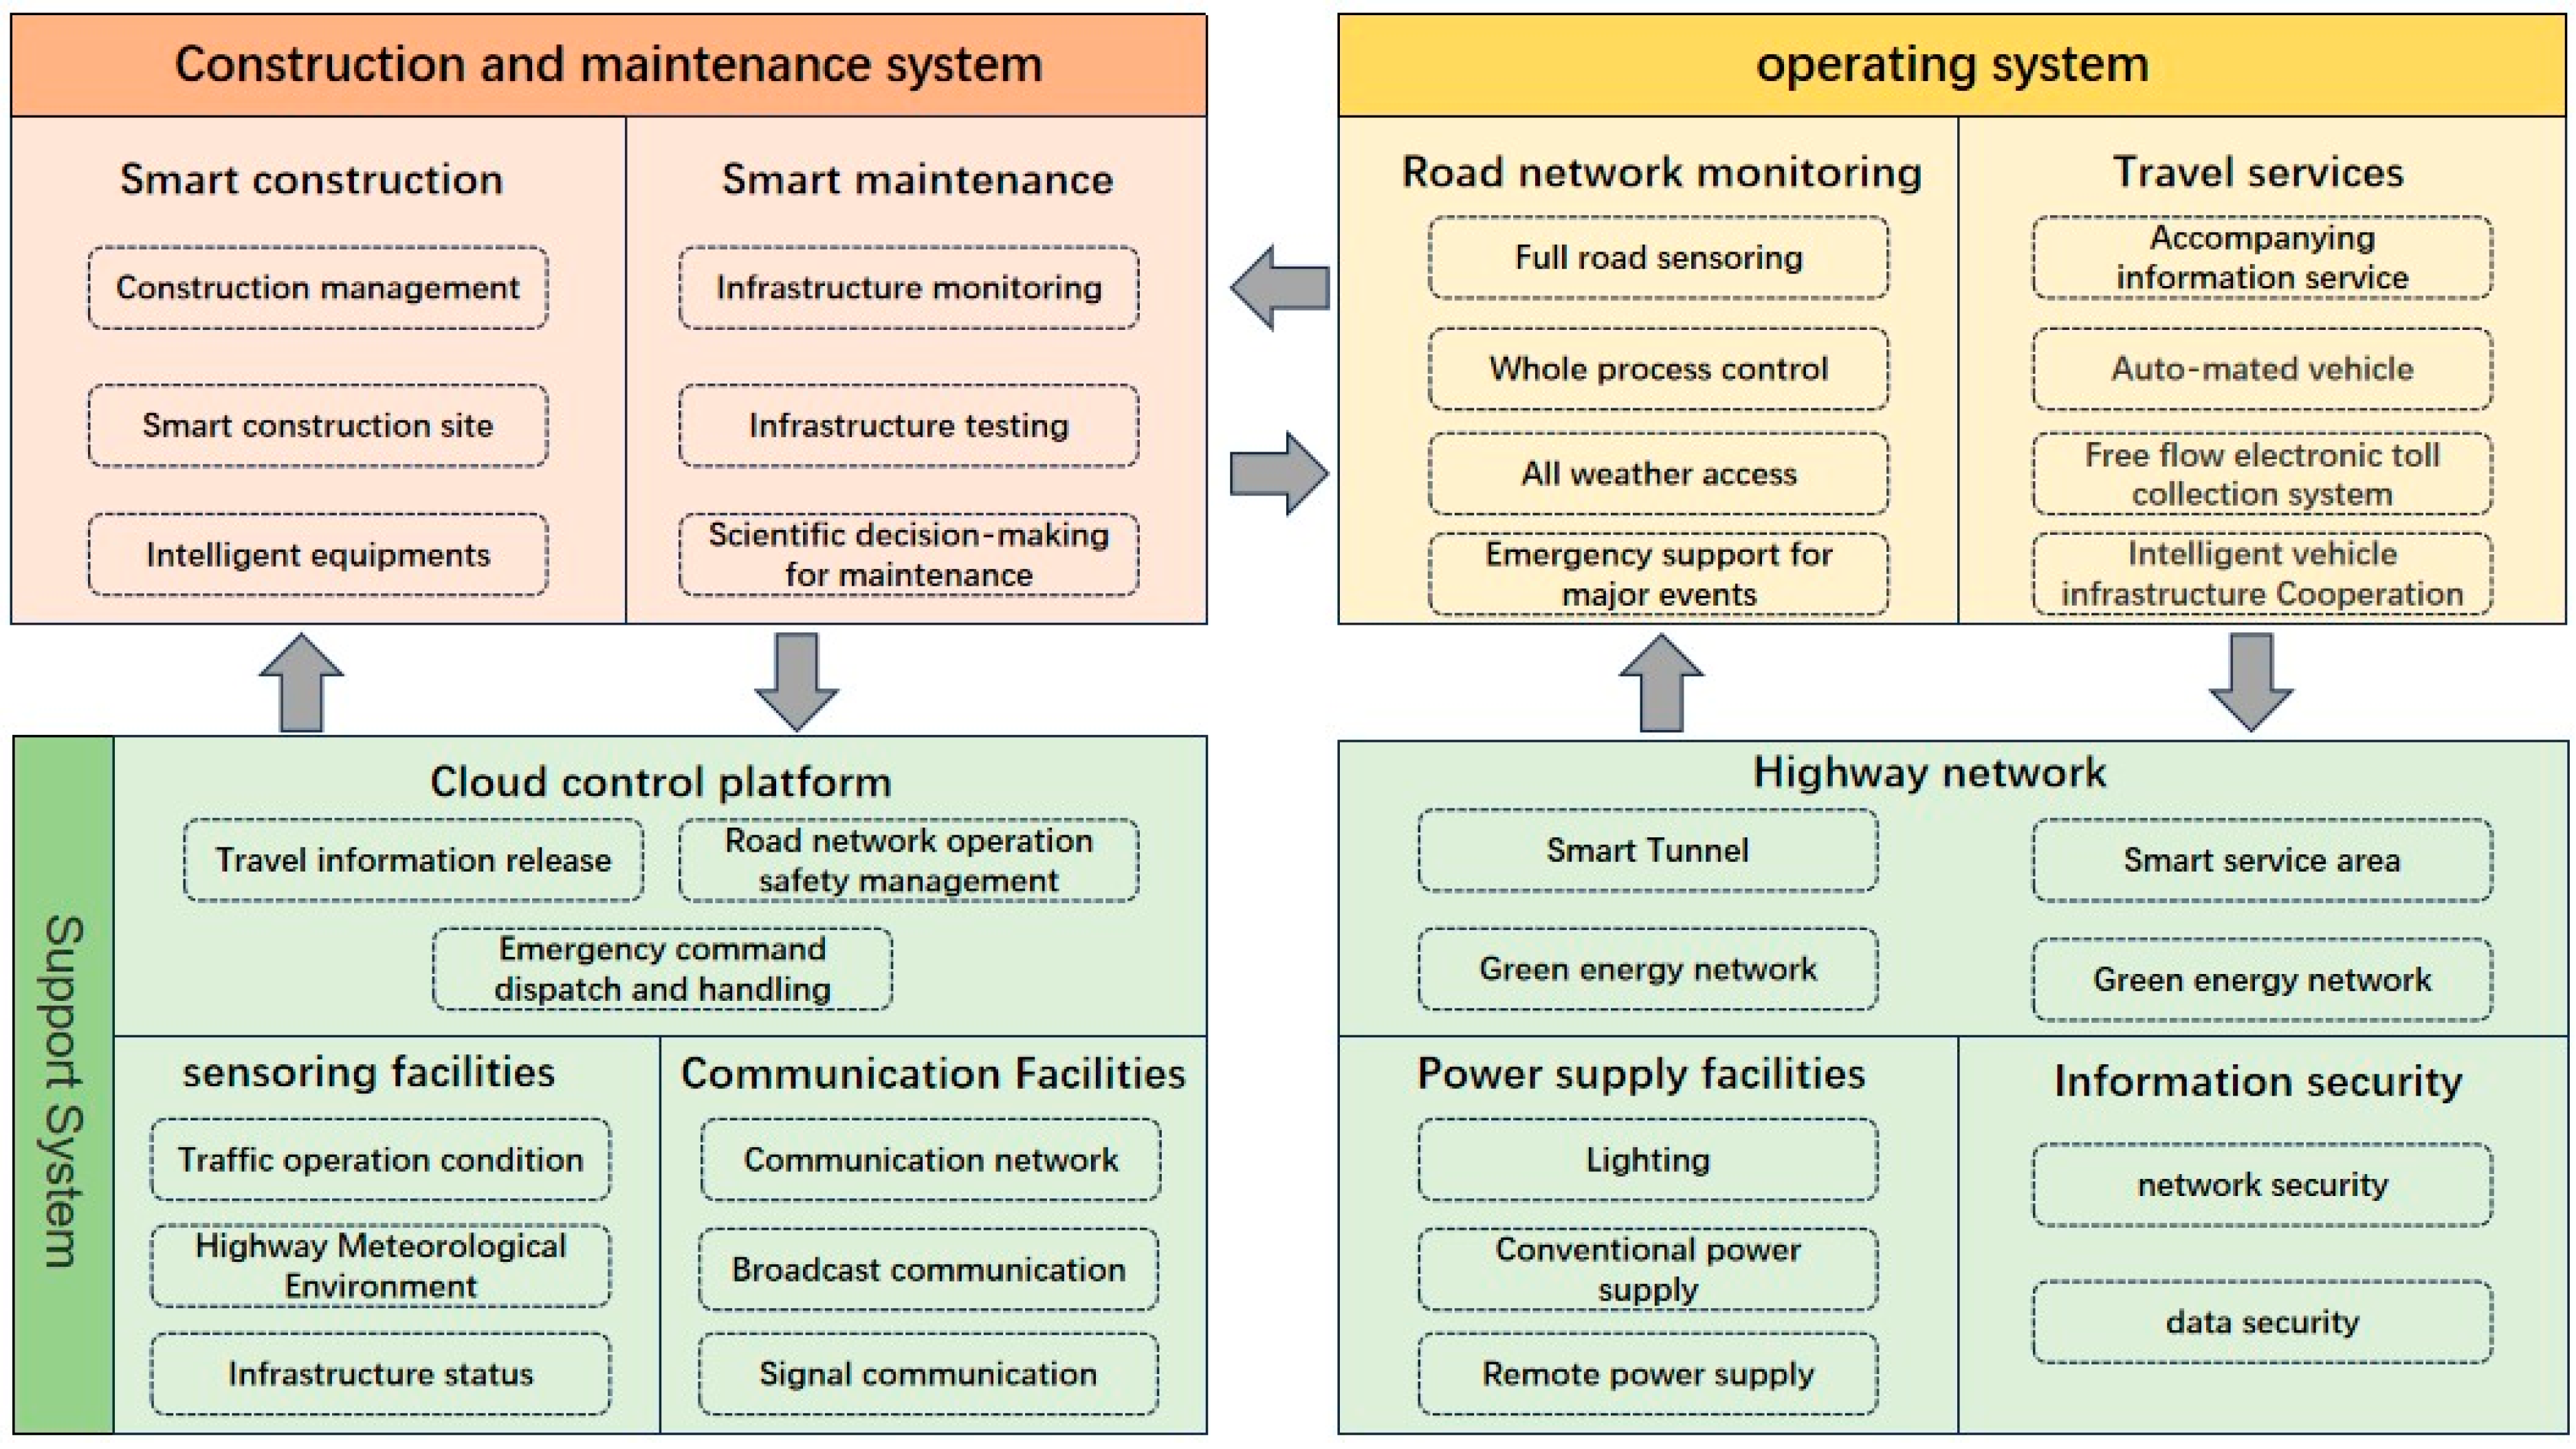
2.1. The Definition of Smart Highway

The ongoing wave of the digital revolution has led to the rapid evolution of smart highways, emerging as a new type of digital infrastructure in the field of intelligent transportation. It has become a global hotspot, with countries striving to accelerate its deployment. In the United States, research on smart highways is primarily directed towards traffic safety, emphasizing the development of vehicular networks and autonomous driving applications that utilize highways as platforms [7]. This approach enriches application scenarios for the intelligent upgrading of highways [8]. In Europe, the focus is on proactive traffic management, creating digital traffic corridors, strengthening digital connectivity and information sharing among road users, infrastructures, and traffic management systems [9]. Japan is predominantly exploring the domain of user interaction and information sharing with intelligent expressways, delineating a development direction based on vehicle-to-road communication [10]. South Korea combines emerging technologies such as IT and communication with vehicles and road infrastructure to develop safe and comfortable smart highways [11].
Technologically, smart highways integrate information technology into the construction of regular highways, imparting intelligent features to improve service levels, reduce environmental pollution, and enhance road safety [12]. It represents a significant early form of implementation for smart transportation [13]. Smart highways are expected to embody principles such as efficiency, safety, intelligence, green technology, economy, and convenience [14]. This study summarizes the components of the smart highway system, as depicted in Figure 1.

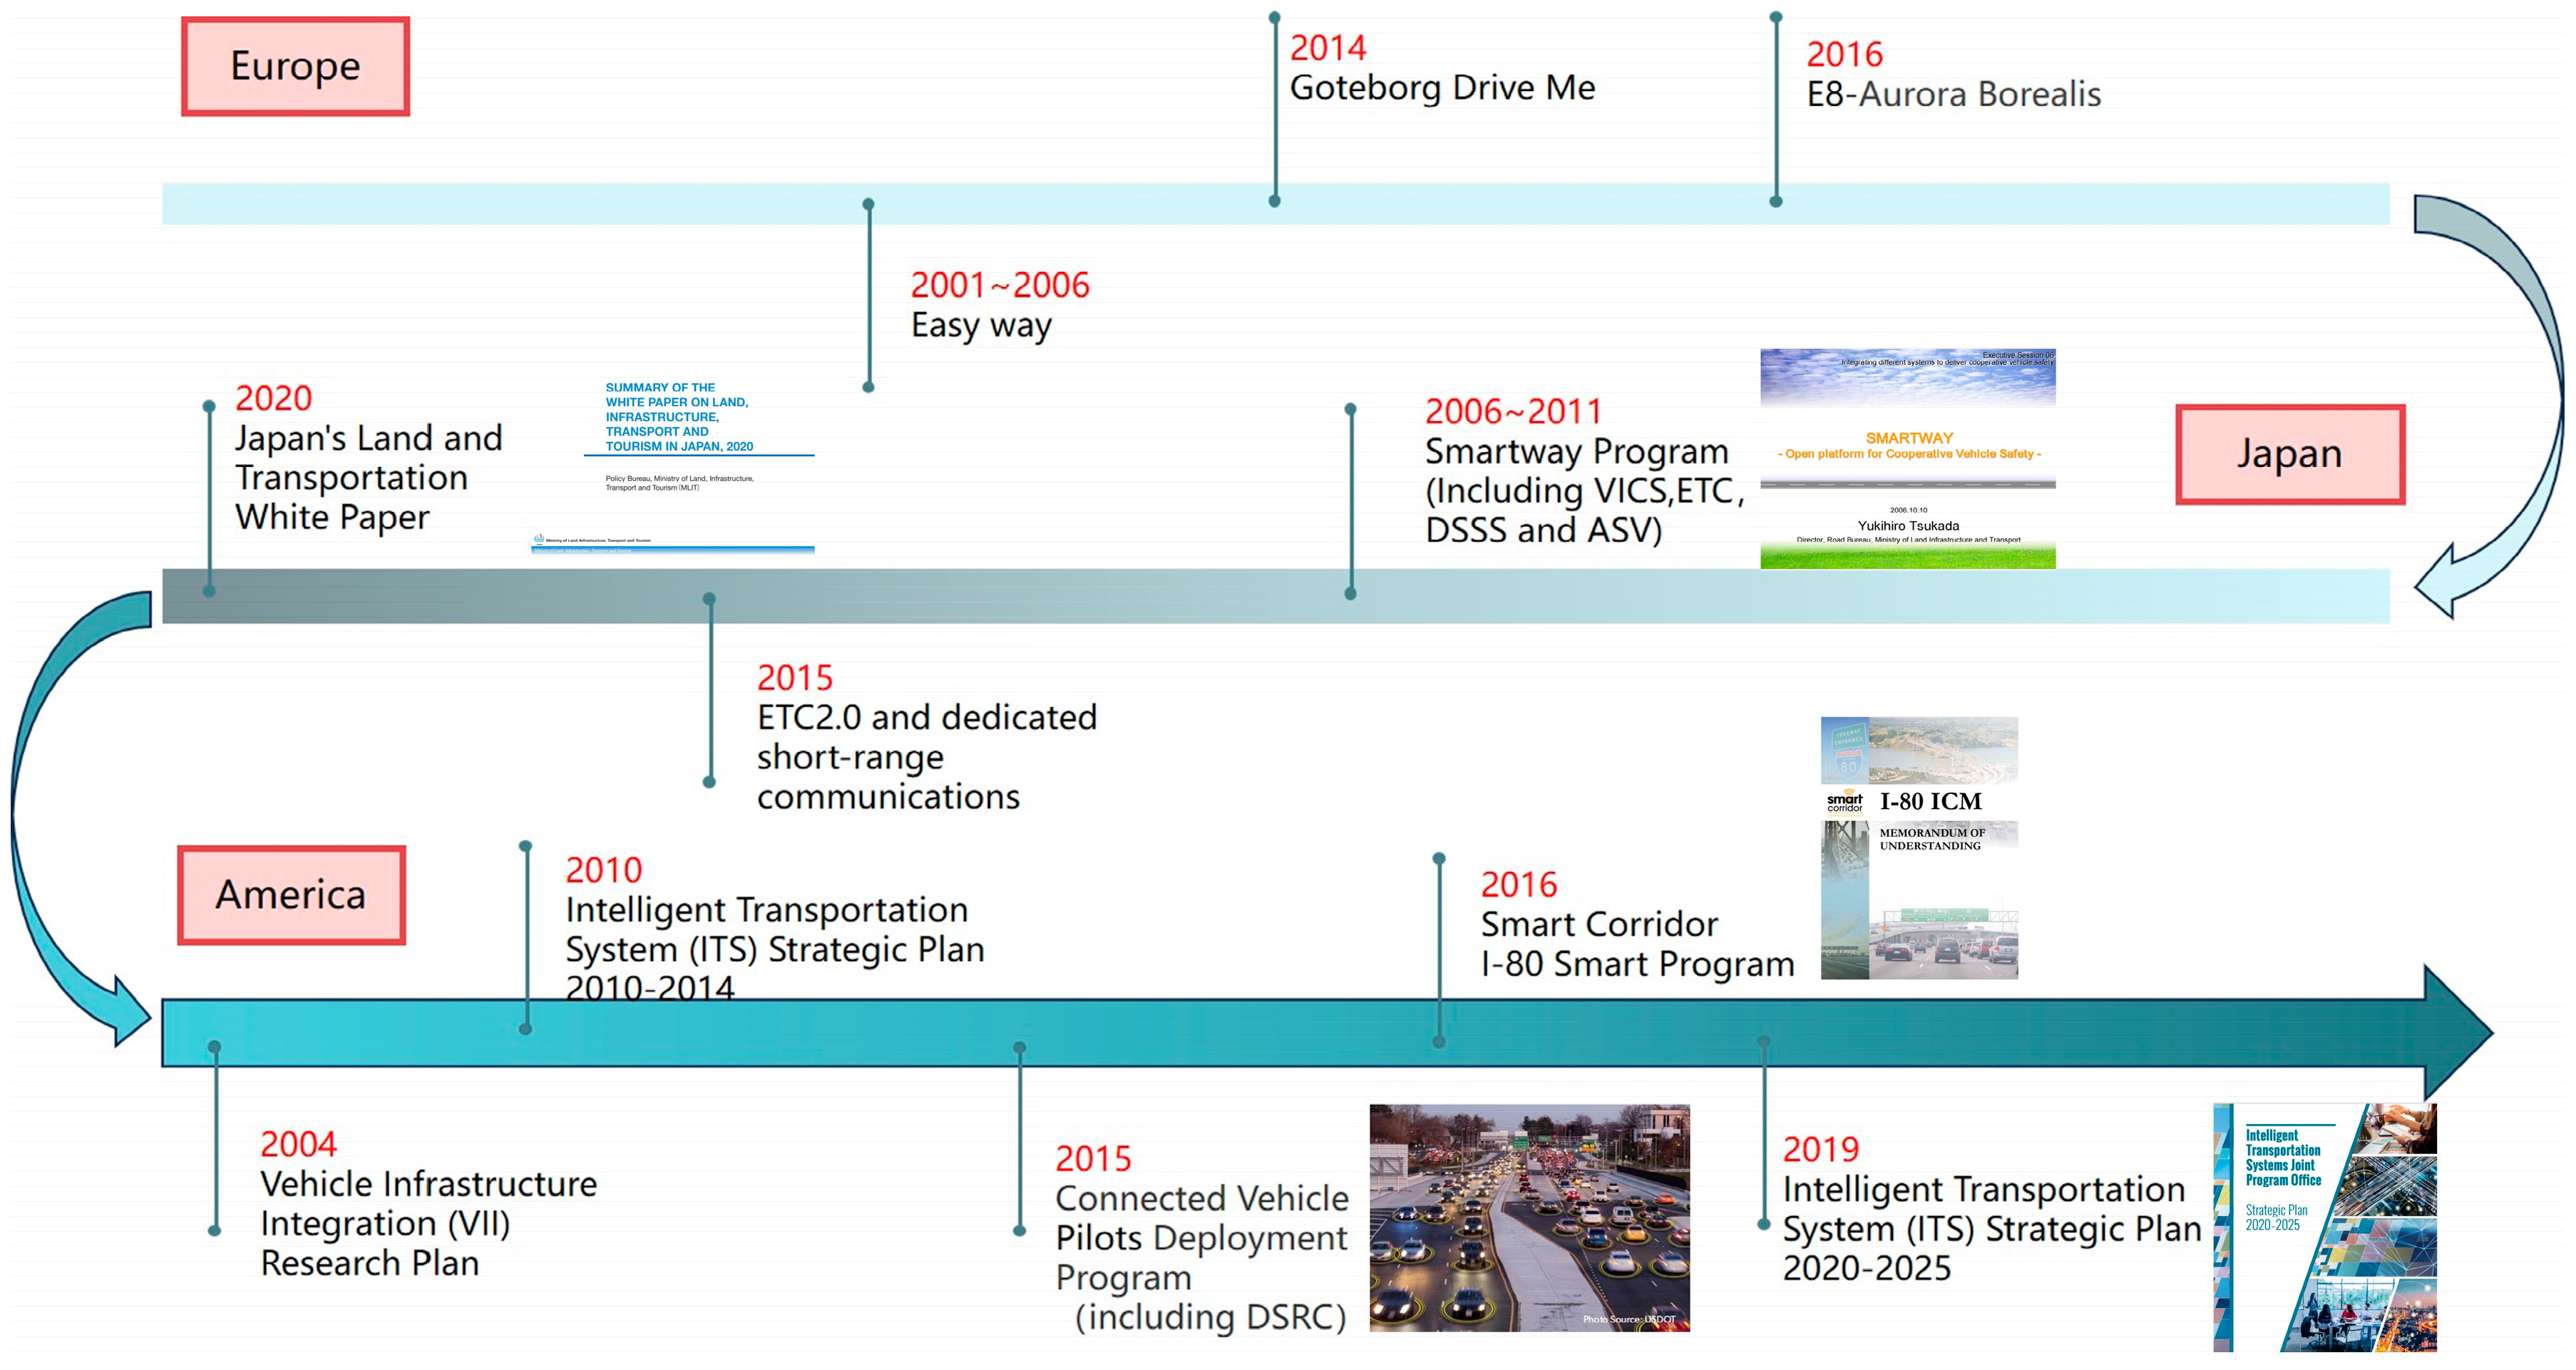
2.2. Current Status of Construction and Development of Smart Highways

In a broad sense, the concept of smart highways emerged earlier in developed countries, dating back to the 1940s [15], including the United States [16,17,18,19], Japan [20,21], and the European Union [22,23]. The policy initiatives and development trends of smart highways in developed countries is summarized in Figure 2.
The smart highway introduces an innovative approach to highway infrastructure within the contemporary big data era. It signifies an extension and innovation of conventional highway systems, grounded in advanced detection equipment and video monitoring systems [24]. It relies on high-bandwidth network transmission and efficient smart highway information management systems [25]. The primary goal of the smart highway is to offer precise and comprehensive traffic information services for travelers, efficient traffic management services, and decision support for managers. Moreover, it aims to facilitate rapid interconnection among various departments. The smart highway system is focused on management and service, emphasizing data utilization and dissemination, as well as the integration of internal system functions [26].
The continuous maturation of the internet, big data, artificial intelligence, and other new technologies has driven their deep integration with the development of smart highways. The degree of standardization in smart highway construction is gradually increasing, in addition to the scale of construction. In 2019, the Colorado Department of Transportation (CDOT) in the United States classified roads into six classes, based on their target users and functions, spanning from L1 roads with no installed equipment to L6 roads tailored for advanced autonomous driving requirements [27]. Also, in 2019, the China Highway and Transportation Society classified intelligent transportation infrastructure into levels I0 to I5, where I0 represents no intelligence and I5 represents fully automated driving based on traffic infrastructures [28]. In 2022, the European Road Transport Research Advisory Council (ERTRAC) defined the Infrastructure Support Levels for Automated Driving to better support and guide autonomous driving technology. They categorized road infrastructures into five levels, from A (highest, supporting cooperative driving) to E (lowest, no digital information) [29].
In summary, international attention is focused on the development of smart highways. There are already some available construction standards for smart highways worldwide, and there are also many projects that have been constructed and put into operation. However, the current evaluation standards for facility maintenance and management are generally traditional and do not match the development needs of the facilities. The evaluation standards for smart highways generally remain at the level of overall functional conditions. There has been a lack of quantitative and qualitative analysis and evaluation based on specific road data. Therefore, there is an urgent need for a rational evaluation system for smart highways.

2.3. Methods Available for the Establishment of Evaluation Systems

Establishing an evaluation framework for smart highways has become a crucial issue in the research and exploration of smart highways. The evaluation system for smart highways exhibits characteristics of diversification, and its evaluation methods fall under the research methods of multi-objective decision theory.
In the process of addressing the issue of weight allocation for multi-objective decision-making, two reliable methods are available [30,31]. The first category is subjective weighting methods, such as the Analytic Hierarchy Process (AHP) [32,33], expert scoring method [33,34], and Fuzzy Analytic Hierarchy Process [35]. The second category is objective weighting methods, including the critic method [36] and entropy weight method [37]. The studies mentioned above have formed the research methods and foundation for the evaluation system of smart highways [38].
It has been demonstrated that the AHP is suitable for multiple domains such as smart highways and smart transportation. However, it also highlights the issue of the subjective factors of judging experts having a significant impact on the evaluation conclusions, leading to a certain degree of distortion in the final results. According to multi-criteria decision theory [39], the subjective weighting process suffers from issues such as confusing subjective logic and the evaluation attitude of the decision-maker [40]. Objective weighting methods rely entirely on measured data, disregarding the decision-maker’s professional experience and knowledge. Therefore, combining and integrating subjective and objective weights is necessary [41]. The use of optimization algorithms to determine subjective weights from experts and objective attribute weights is becoming increasingly widespread [42,43,44,45].
These research advancements have propelled the evolution of the smart highway evaluation system. However, previous evaluation indicators have primarily focused on roads, traffic operations, the environment, and benefits, neglecting the inclusion of traffic engineering facilities. Secondly, deriving precise indicator weights and formulating a comprehensive evaluation method tailored for assessing smart highways in diverse regions poses a significant challenge. Furthermore, within comprehensive evaluation methodologies, the selection of weights can be either subjective or objective. Consequently, this paper enhances and refines the smart highway evaluation model and methodologies, introducing a more comprehensive evaluation system.

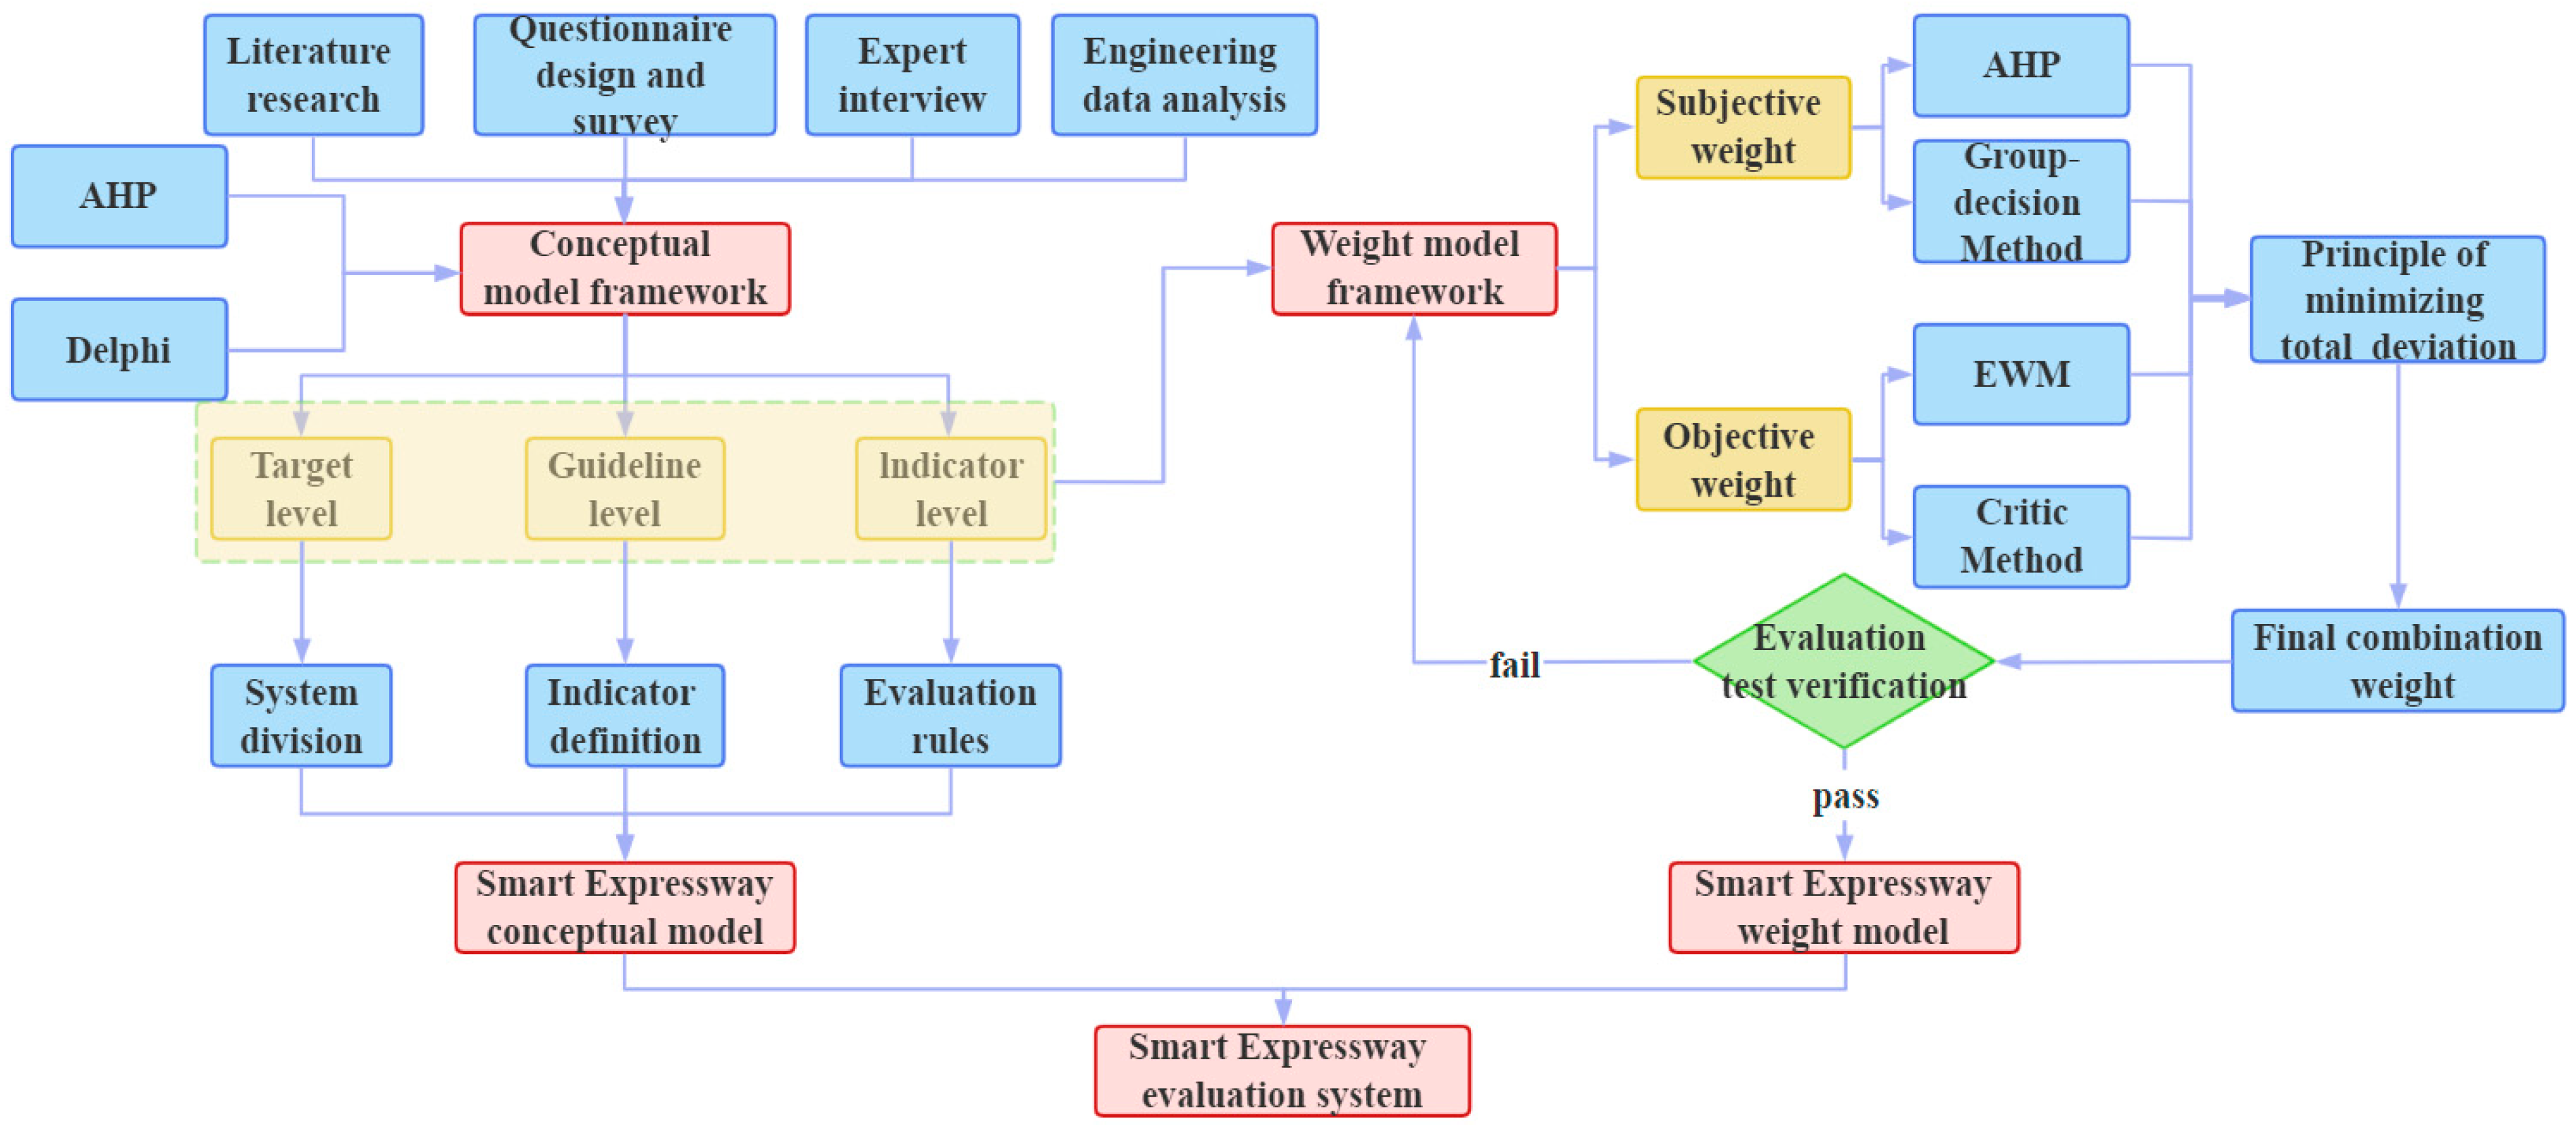
3. Establishment of the Smart Highway Evaluation Framework

The evaluation system framework proposed in this study comprises two main components: the conceptual model and the weight model. These parts are utilized to establish an evaluation index system based on smart highway facilities and operations. The indexes, with a full score of 100, are scored or deducted to determine the corresponding evaluation levels, which range from unqualified to excellent.

3.1. Methods Available for the Establishment of Evaluation Systems

The evaluation framework design depicted in Figure 3 should adhere to the following principles:
  • The quantification of empirical indicators should be conducted using the Delphi method.
  • The Analytic Hierarchy Process (AHP) is utilized to analyze the key factors identified by experts.
  • A group decision-making method is utilized to improve the accuracy of the results.
  • The entropy weight method and critic method are incorporated to improve the rationality and operability of the intelligent highway evaluation system.
  • The principle of total deviation minimization is introduced for computing the combined weight vector.

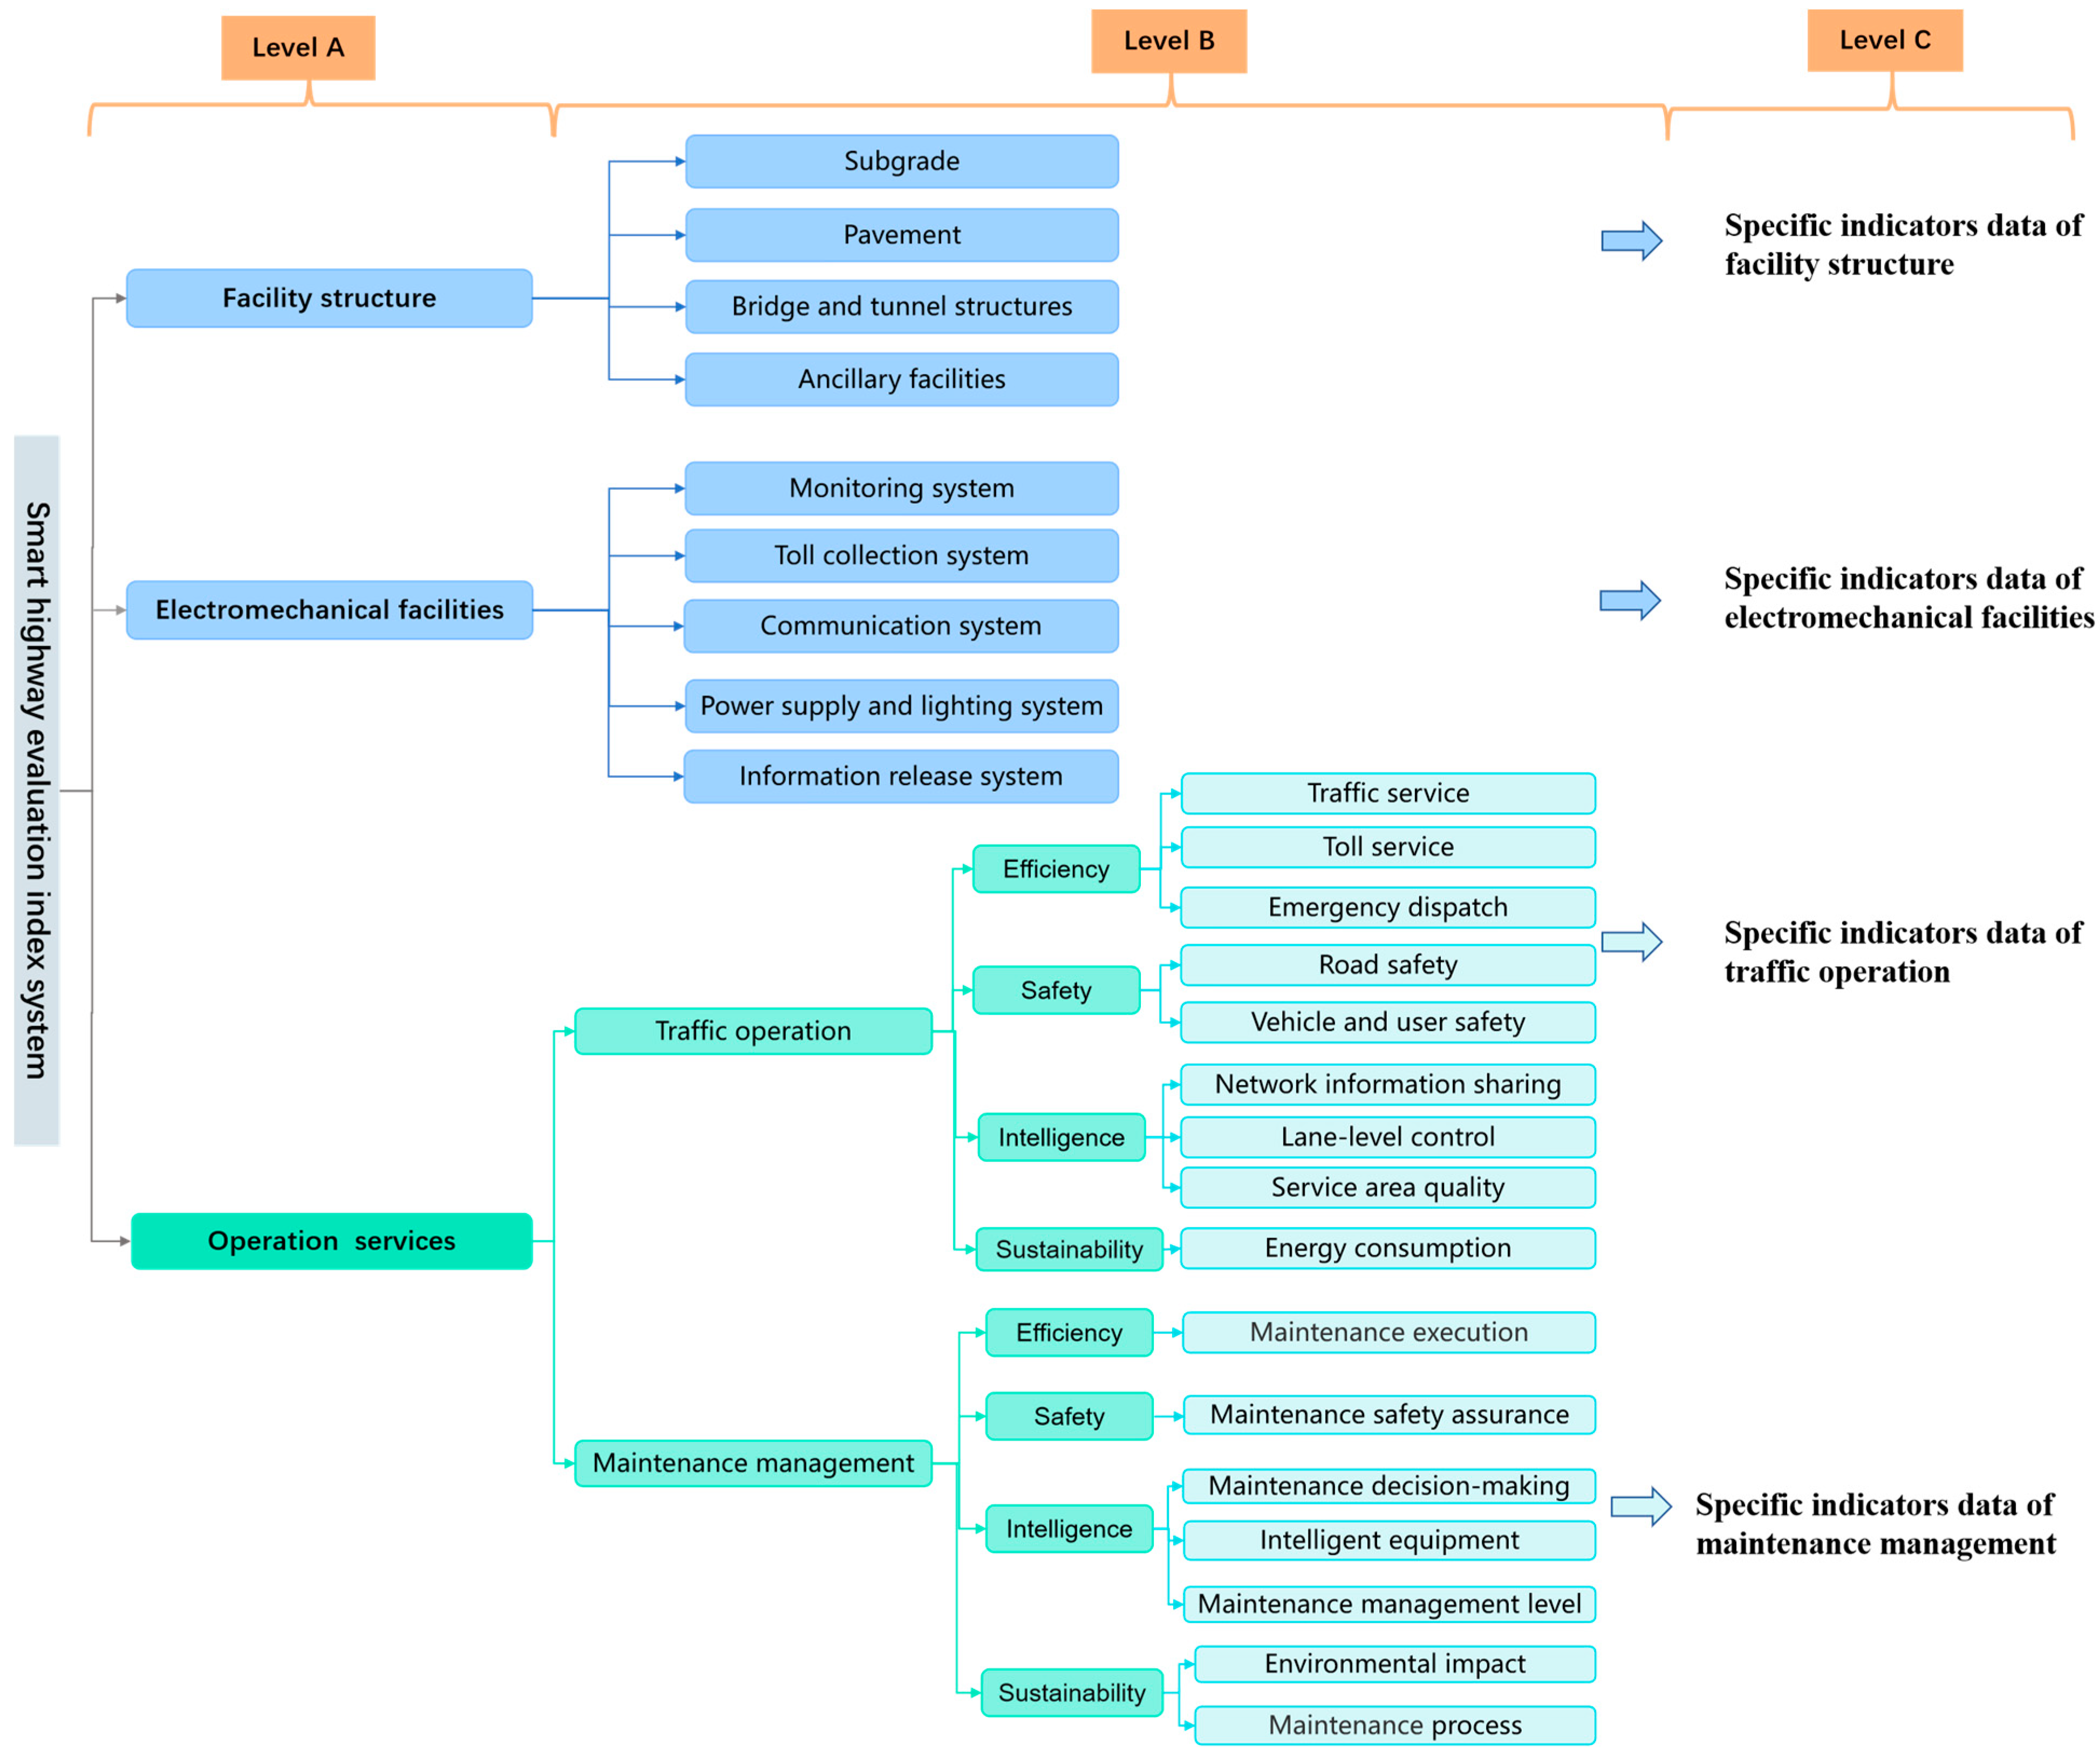
3.2. Hierarchical Design of the Framework

Due to the intricate nature of the smart highway system, its evaluation entails various aspects. Hence, a suitable evaluation system should incorporate a multi-tiered, hierarchical weighting structure to comprehensively evaluate diverse dimensions.
In this paper, the Analytic Hierarchy Process (AHP) is utilized to design the evaluation system for smart highways, systematically dividing the indicator system into the Target Level (Level A), Guideline Level (Level B), and Indicator Level (Level C). The Target Level assesses the purpose of the evaluation system and the issues it addresses, thereby establishing the logical framework for evaluating smart highways. The Guideline Level and Indicator Level can be further broken down into sub-levels according to specific evaluation content. The Guideline Level addresses the diversity of evaluations and evaluation criteria, along with data accessibility and the future requirements of smart highways. The Indicator Level examines the parameters and sources of content essential for decision analysis. The ultimate objective is to conduct a direct evaluation of the smart highway’s condition using practical and quantifiable data derived from real engineering projects.
The Delphi method [46] is an approach that integrates opinions from multiple experts. It is utilized to mitigate subjective factors in establishing indicators and to further enhance the initial reference model. The process entails soliciting expert judgments through questionnaires, and then compiling and summarizing the feedback without revealing individual responses. If significant inconsistencies are present in the results, additional rounds of expert opinions are sought. This iterative process aids in converging expert opinions, resulting in a progressively growing consensus and objectivity in the composite opinions [47]. In this study, 12 road maintenance and inspection experts with substantial frontline work experience and managerial expertise were invited for consultation. The expertise of the experts was assessed based on objective criteria including qualifications and academic achievements, as well as subjective factors like evaluation experience and professionalism. Each expert possessed over 5 years of professional experience, and held technical titles at the engineer level or higher. It is advisable to appoint these experts to constitute an expert panel responsible for presenting the smart highway framework system to all peers. Furthermore, the experts received pertinent information to inform their deliberations. Subsequently, upon gathering anonymous feedback from the questionnaire survey, the experts were requested to offer additional feedback in two consecutive rounds. This process promotes greater consistency in expert opinions, facilitating the acquisition of the most optimal and appropriate viewpoints while mitigating potential biases.
After conducting initial research, an overarching framework for the evaluation system was formulated, as illustrated in Figure 4. The evaluation system’s target layer is segmented into three key indicators: “Facility structure”, “Electromechanical facilities”, and “Operation services”. This segmentation approach primarily considers the current industry model and regulatory framework governing highway operation and management in China. The three main indicators provide a comprehensive description and evaluation of smart highways from construction and operational viewpoints. This segmentation is coherent with the organizational structure of current management departments, thereby streamlining subsequent implementation processes.

3.3. Definition of Evaluation Indicators

The evaluation of “Facility structure” encompasses the assessment of roads, the main structures of bridges and tunnels, and ancillary facilities. It primarily relies on current regulations and findings from industry research, serving to integrate with the established highway evaluation system. Specifically, it pertains to the “Technical Specifications of Maintenance for Highways” (JTG H10-2009) [48], “Standards for Technical Condition Evaluation of Highway Bridges” (JTG/T H21-2011) [49], and “Highway Performance Assessment Standards” (JTG 5210-2018) [50]. The specific indicators of facility structure are listed in Table 1.
In the realm of operating and managing electromechanical facilities on highways, a robust industry standard system is yet to be established. Drawing on comparable industry standards and empirical engineering studies, this study has enhanced and broadened the functional classification, naming conventions, and facility details of electromechanical facilities to more accurately depict the attributes of intelligent expressway electromechanical configurations. The electromechanical facilities are categorized into five subsystems: monitoring system, charging system, communication system, power supply and lighting system, and information release system. Each subsystem may be subdivided into several subunits, each comprising multiple electromechanical devices. This study has systematically organized and summarized all electromechanical devices present on intelligent highways, establishing their scores and weights through evaluation of the qualification rate of these devices. The specific classification of electromechanical facilities’ equipment is shown in Table 2.
The definition of the working state for each electromechanical device adopts the indicator qualification rate K i , calculated using the following formula:
K i = ( 1 n t N T ) × 100 %
where K i represents the integrity index of the i-th device in the subsystem, ranging from 0 to 100; n represents the number of equipment failures; t represents the equipment downtime, the value is 0 if no failures; N represents the total number of devices; and T represents the equipment operating time.
The evaluation of “Operation services” primarily focuses on their characteristics related to “Efficiency, Safety, Intelligence, and Sustainability”. These aspects manifest in two key facets: “Traffic operation” and “Maintenance management”. Within “Traffic operation”, there is a focus on elucidating the traits of intelligent highways for enhancing efficiency and managing safety. The aspect of “Maintenance management” underscores the intelligence and eco-friendliness of maintenance practices, alongside the precision and effectiveness of emergency response procedures [51]. The precise indicators for “Operation services” are detailed in Table 3.
The indicators for “Operation services” are all innovative indicators. Their definitions and evaluation explanations are provided in Table S1 (Supplementary Materials).

4. Methods for Assigning Weights to Evaluation Indicators

4.1. Analytic Hierarchy Process (AHP) Method

The construction of the judgment matrix is a crucial step in applying the AHP method [52]. The proportional scale method is employed to quantitatively process the importance of each hierarchical evaluation indicator. Here, a i j represents the importance value of the element in the judgment matrix. After obtaining the judgment matrix P, a consistency check is performed, and the final weight values are derived [53].
Step 1: Calculate the Consistency Index (CI):
C I = λ m a x n 1 .
Step 2: Find the Random Index (RI).
Step 3: Calculate the Consistency Ratio (CR):
C R = C I R I .
The Consistency Ratio should be less than 0.1 for the judgments to be considered acceptable.
Step 4: Calculate the weight.
Taking the geometric mean, the formula is as follows, where w i represents the weight vector obtained by the AHP method:
w i = j = 1 n   a i j n i = 1 n   j = 1 n   a i j n , i = 1 , 2 , , n .

4.2. Group Decision-Making Method (GDM)

The judgment matrix of an individual expert reveals a significant level of subjectivity, capable of reflecting only a specific perspective on objective phenomena. Employing equal weights for aggregation might not adequately capture the expertise of the individual expert, thus diminishing the reliability of the group decision-making results [54].
If an expert’s judgments closely align with the comprehensive results of the group decision, it indicates a higher level of credibility, resulting in a correspondingly higher weight assignment. The credibility of an expert can be evaluated from two perspectives: similarity to the comprehensive results and dissimilarity from other experts. The combination of similarity and dissimilarity ultimately determines the credibility of each judgment matrix. By calculating the credibility for each judgment matrix and utilizing it as the expert’s weight, this approach not only reflects each expert’s evaluation of various indicators but also enhances the precision and objectivity of the group decision-making process [55].
Step 1: Calculation of Group Decision-Making Dissimilarity.
Use the standard deviation to reflect the diversity of expert judgments, assuming there are x experts, corresponding to x judgment weight column vectors γ 1 , γ 2 , , , γ x , where γ i = γ k 1 ,   γ k 2 , , γ k n , γ k n represents the judgment values of the k-th expert for n evaluation indicators. Let σ k i be the standard deviation of the judgment made by the k-th expert for the i-th evaluation indicator, where k represents the expert code, and i represents the evaluation indicator. The definition of standard deviation is given by the following formula:
σ k i = γ k i 1 x k = 1 x γ k i , k = 1,2 , , x , i = 1,2 , , n .
Let σ k represent the sum of standard deviations for each evaluation indicator by the k-th expert. It is defined as follows:
σ k = i = 1 n σ k i .
Normalize σ k to obtain the dissimilarity coefficient λ k , defined as follows:
λ k = σ k k = 1 x σ k .
Step 2: Calculation of Group Decision-Making Similarity.
The calculation of the similarity coefficient involves utilizing the spatial relationship between vectors to reflect the similarity of expert judgments. Specifically, the cosine of the angle between two vectors is utilized to represent their similarity. Each expert’s weight vector acquired from the judgment matrix can be regarded as a column vector. With multiple experts, there are multiple column vectors, and the size of the spatial angle between any two vectors reflects the similarity between their respective judgment matrices. When two vectors are more similar, the angle between them is closer to 0°, and the cosine of the angle approaches 1; conversely, as the angle approaches 90°, the cosine of the angle approaches 0.
The judgment weights obtained through the AHP are column vectors, denoted as α and β , where α = a 1 , a 2 , , a n T and β = b 1 , b 2 , , b n T . The angle θ between vectors α and β is defined by the cosine as follows:
cos θ = α , β | | α | |   | | β | | = i = 1 n a i b i i = 1 n a i 2 i = 1 n b i 2 .
Define η = cos θ , 0 η 1 if and only if α = k β , η = 1 .
Assume there are x experts, corresponding to x judgment weight column vectors a 1 , a 2 , , a x . Let η i j be the cosine value of α i and α j , defined as follows:
η i j = cos θ = α i , α j | | α i | |   | | α j | | .
Let η i denote the sum of the similarities between expert i and other experts. If η i is larger, it indicates higher similarity with the judgments of other experts, thus resulting in a higher credibility of its judgment weight column vector α i . Conversely, if η i is lower, its credibility is reduced. This is defined as follows:
η i = j = 1 m η i j 1 .
Normalize η i to obtain the similarity coefficient μ i , defined as follows:
μ i = η i j = 1 m η i , i = 1,2 , , x .
Step 3: Calculation of Group Decision-Making Credibility.
The higher the credibility coefficient, the closer the expert’s judgment is to the comprehensive result of the group decision. λ k and μ k represent the distinctiveness and similarity coefficients of expert k, and the credibility coefficient of expert k is denoted as ω k , as expressed by the following formula:
ω k = μ k 1 λ k 1 k = 1 x μ k λ k k = 1 x μ k λ k 1 μ k k = 1 x μ k λ k = 1 .

4.3. Entropy Weight Method (EWM)

The EWM [56] is an objective weighting method that utilizes the concept of entropy to determine the weights of indicators. The entropy weight method is recognized for its reliability and objectivity in result calculation, ensuring stability and consistency. The entropy value allows for the assessment of the dispersion level of a particular indicator. Entropy is inversely proportional to information: when there is a significant difference in the data of a certain indicator, its effective information is greater, resulting in a smaller entropy value and a larger weight for that indicator; conversely, when the difference is smaller, the entropy value is larger, and the weight is smaller. The introduction of the entropy weight method has the potential to reduce the subjectivity of AHP weighting and the fluctuation of weights due to data changes. This improvement would lead to a more objective assessment of indicator differences and importance, resulting in enhanced calculation accuracy [57]. The calculation process is as follows.
Step 1: Data normalization.
Assuming that there are n evaluation objects and m evaluation indicators contained in the evaluation matrix, then x i j is the value of the j-th indicator for the i-th sample ( i = 1,2 , , n ; j = 1,2 , , m ) . Since the measurement units for various indicators are not uniform, it is necessary to normalize them before calculating the comprehensive weights. This involves transforming the absolute values of the indicators into relative values.
Positive   indicators :   x i j = x i j m i n x 1 j , , x n j m a x x 1 j , , x n j m i n x 1 j , , x n j
Negative   indicators :   x i j = m a x x 1 j , , x n j x i j m a x x 1 j , , x r j m i n x 1 j , , x n j
For ease of calculation, the normalized data is still denoted as x i j .
Step 2: Calculate the correlation coefficient by determining the proportion of the i-th solution’s indicator value under the j-th indicator, as follows:
p i j = x i j i = 1 n   x i j .
Consequently, it is possible to establish a weight matrix for the indicator data.
Step 3: Calculate the information entropy value e j and redundancy g j for the j-th indicator using the following formulas:
e j = k i = 1 n   p i j l n p i j ;
g j = 1 e j .
Step 4: Calculate the weight w j for the j-th indicator using the following formula:
w j = g j j = 1 m   g j .

4.4. CRITIC Method

The CRITIC [58] method is an objective weight assignment method frequently utilized for analyzing data with strong inter-indicator correlations while accounting for the variability among indicators. Scholars have identified that the critical method can comprehensively measure the contrast strength and conflict between indicators. However, it cannot measure the degree of dispersion between indicators [59]. The entropy weight method determines indicator weights based on the dispersion level between them. Combining the critical method with the entropy weight method can provide a more objective reflection of indicator weights [60]. The calculation steps are as follows:
Step 1: Data normalization.
Step 2: Calculate indicator variability.
Employ the standard deviation to represent the variability of internal values for each indicator. A larger standard deviation signifies increased numerical variation for the indicator, reflecting more information. The indicator’s evaluation strength is enhanced, leading to a higher weight assignment. S j represents the standard deviation of the j-th indicator.
x ¯ j = 1 n i = 1 n   x i j S j = i = 1 n   x i j x ¯ j 2 n 1
Step 3: Calculate the indicator conflict.
Use the correlation coefficient R j to represent the correlation between indicators. The stronger the correlation with other indicators, the less conflict there is with those indicators. This reflects duplicated information, to some extent weakening the evaluation strength of the indicator and reducing the weight assigned to it. The formula is as follows:
R j = i = 1 p   1 r i j .
Step 4: Calculate information quantity.
The larger C j is, the greater the impact of the j-th evaluation indicator in the entire evaluation indicator system; thus, more weight is assigned to it.
C j = S j i = 1 p   1 r i j = S j × R j
Step 5: Calculate weights.
w j = C j j = 1 p   C j

4.5. Minimum Deviation Method

The commonly employed method is the linear weighting approach, which necessitates the determination of subjective preference coefficients, thus introducing a level of subjectivity into the evaluation outcomes. To effectively utilize attribute weight information acquired from diverse subjective and objective weighting methods, minimizing deviations in the weighted weights derived from these methods is crucial. Hence, this study employs the method of minimum deviation for the comprehensive calculation of indicator weights [61].
Step 1: Given the total number of q methods for calculating the weights of the indicators, of which there are l and q-l for the subjective and objective methods, respectively, the weight vector is expressed as follows:
u k = u k 1 , u k 2 , , u k m T ; i = 1 m   u k i = 1 ; k = 1,2 , , q .
Step 2: The utilization of a deviation function allows for a comprehensive consideration of the objectivity of decision-making and the subjective opinions of decision-makers. It aims to minimize the weight deviations obtained from various methods, and the reasonable weight vector is represented as w = w 1 , w 2 , , w m T . The constructed single-objective optimization model can be expressed as follows:
min J = k = 1 l   j = 1 n   a k f j u k + k = l + 1 q   j = 1 n   a k g j u k s .   t . i = 1 m   w i = 1 ;   w 0 .
In Equation (24), J represents the objective function to be solved. a k represents the weight coefficients obtained from various weighting methods. a j represents the weights obtained using the j-th weighting method. f j ( u k ) and g j u k are the deviation functions for subjective and objective weighting methods, respectively.
Step 3: The lower the deviation in weight for each weighting method, the higher the effective utilization rate of the obtained weight information. Therefore, the constructed model can be transformed into Equation (25).
min J = j = 1 n   k = 1 q   i = 1 m   a k u k i a j u i j 2 s .   t . k = 1 q   a k = 1 ; a k 0 ; k [ 1 , q ]
Step 4: Combining the necessary conditions for the existence of extremum in the Lagrange function, L is the established Lagrange function. To solve it, take the following derivative:
L a k = q a k i = 1 m u k i 2 α 1 i = 1 m u 1 i u k i α q i = 1 m u q i u k i + λ 2 = 0 L λ = k = 1 q a k 1 = 0

5. Application Results and Discussion

The calculation results for the three target-level indicators, namely facility structure (A1), electromechanical facilities (A2), and operation services (A3), are presented as an example.

5.1. Subjective Weights Calculation and Discussion

By using Equations (2)–(4) and eliminating the expert weight questionnaires that do not pass the consistency test, the target-level weights obtained through the AHP method are shown in Table 4.
Perform calculations based on Equations (5)–(12). The parameters for the group decision-making method for each criterion are shown in Table 5.
The credibility coefficients of all experts are used as weights for the experts, and the AHP and GDM-corrected weights for the Target Level are shown in Table 6.
Given the complexity of smart highways’ overall system and the diversity of facilities and equipment, the evaluation system comprises two crucial aspects: facilities and management. The facilities aspect encompasses civil engineering monitoring facilities and electromechanical operation facilities. The management aspect can be further divided into traffic operation management, emergency management, safety management, and other related areas. There may be differences among experts in their respective fields, leading to varying interpretations of different indicators. Through both research and practical application, it is evident that a combination of GDM methods and AHP can be employed. By utilizing data analysis and theoretical calculations, such an approach enables the accurate determination of weights for the smart highway evaluation system.
Experts generally believe that, in the smart highway system, facility structure is the most important, with a weight proportion of 37.96%. Operation services come next, followed by electromechanical facilities. Therefore, experts consider facility structure and operation services as the key focal points for the development of smart highways. The reason for this is that many of the indicators in facility structure and operation services cover factors such as pavement quality and user experience during highway operations, making these two areas especially significant.

5.2. Objective Weights Calculation and Discussion

This study investigated five smart highways that were renovated, expanded, and upgraded to become smart highways from their original state. These highways were located in various provinces and cities in China, including Jiangxi, Shanghai, and Beijing. The varied topographical, infrastructural, climatic, and natural resource conditions in different provinces require a multifaceted approach to smart highway implementation. The utilization of advanced technologies included perception technology and Internet of Things (IoT) technology. Furthermore, the directions for applying smart highway upgrades varied, reflecting the distinct characteristics of each highway’s design. For example, Highway A was mainly improved in three areas: traffic flow, emergency response, and maintenance operations. Conversely, Highway B was mainly upgraded in two areas, road detection facilities and service areas, aiming to provide a broader range of services. According to the data collected from these smart highways, scores for each smart highway were calculated using the existing conceptual model, resulting in Table 7.
Data normalization was carried out according to Equations (13) and (14) to derive the normalized evaluation matrix. In the calculation of the weight matrix P, x i j serves as the numerator. Hence, a threshold range was defined for x i j to standardize the denominator, with values ranging from 0.0020 to 0.9960. Consequently, this process yielded the normalized standard matrix P.
P = 0.0020 0.9960 0.6935 0.2926 0.5189 0.9960 0.8839 0.3129 0.9960 0.5984 0.9960 0.0020 0.7367 0.5422 0.0020
Utilizing Equations (15)–(18) to apply the entropy weight method to the normalized data enables the calculation of the entropy value e j , information redundancy g j , and the weight w j for each indicator. The results are shown in Table 8.
Applying Equations (19)–(22) of the critic method to the normalized data allows us to determine the standard deviation s j , correlation coefficient r j , information content c j , and the weight w j for each indicator. The results are shown in Table 9.
The weight deviation of the target layers from the two objective weight methods is relatively small, showing a maximum deviation of just 4.67%. This suggests that the two objective weight methods can effectively and accurately portray the current developmental trajectory of smart highways.
In terms of objective weights derived from the comparison of data from various highways, it was observed that the facility structure still garners the highest level of attention, followed by electromechanical facilities, with operations and services ranking last. This disparity from the weights ranking obtained through subjective methods indicates a significant emphasis on the conditions of various facility types in the surveyed smart highway projects in China.

5.3. Combined Weights Calculation and Discussion

Through summarizing and organizing the calculation results of subjective and objective weights, the weight matrix U is constructed as follows:
U = u i j 3 × 3 = 0.3796 0.2441 0.3763 0.4157 0.3023 0.2820 0.4624 0.2966 0.2410
According to Equation (26) and Cramer’s rule, the Lagrange function is established and its derivative is solved. The results yield α = (0.3336, 0.3382, 0.3282) and λ = −0.0100. α represents the weight vector obtained from the three weighting methods. By substituting the weight matrix U and the weight vectors from the three weighting methods into the following equation, the final combined weights for the target layer are determined as A1(0.4190), A2(0.2810), and A3(0.3000).
The weighting methods for each level of the indicator layer and the data layer have been previously outlined and will not be reiterated. The combined weights for each layer are shown in Table 10 and Table 11.
Through the calculation of combined weights, it is observed that the significance of operations and services has escalated. This implies that smart highways should be directed towards management and services in the future, accentuating data utilization and dissemination and emphasizing the integration of system functionalities and user experiences.

6. Conclusions

This study is motivated by the operational management demands of smart highways and centers on the pivotal aspect of the evaluation system. By analyzing the practical requirements and policy background of smart highway development, the paper categorizes evaluation objects and assigns weights. Expanding on this groundwork, the paper depends on monitoring and gathering data on the usability and service quality of smart highways. Furthermore, by considering the requirements for causal analysis and decision-making throughout the entire lifecycle maintenance, the study develops a comprehensive evaluation system framework and content.
The evaluation system comprehensively assesses smart highways across three dimensions: “Facility Structure”, “Electromechanical Facilities”, and “Operation Services”. Each of these dimensions is then broken down into multiple data layer indicators, facilitating a quantitative analysis and scoring of facility conditions and service levels. Through analysing the distribution of assessment scores for each indicator within the smart highway, the system offers an accurate portrayal of the current state of smart highway implementation, pinpointing areas in need of enhancement and offering guidance for future developmental paths.
This study contributes to related fields by providing the following aspects:
The evaluation system in this research offers comprehensive indicator content with precise definitions. It encompasses detailed guidelines for assessing indicators, addressing the current status and future trend objectives of smart highway development. This ensures the applicability of the evaluation system for assessing smart highways in diverse regions with varying development directions.
Introducing a novel model method that combines subjective and objective weighting, breaking away from the conventional practice where researchers tend to rely solely on either subjective or objective evaluation methods. This innovative approach holds promise in offering valuable insights for the advancement of future evaluation systems.
Comprehensive consideration of facilities and operational processes. This evaluation system not only considers the health of civil and electromechanical facilities but also categorizes facility types explicitly. Additionally, it considers traffic and maintenance aspects during highway operation, collecting data on user experiences. The entire evaluation system, from assessing facility performance to the impact on traffic services, provides a benchmark for the development of final maintenance and management plans, creating a virtuous cycle for smart highways throughout their entire lifecycle.
Guidance for designing regional standards. The findings and insights from this study’s evaluation system can assist decision-makers in designing regional standards for smart highway construction. It offers theoretical and practical guidance for the effective evaluation of smart highway construction.
Cross-domain applicability. After adjusting indicators and recalculating weights, the evaluation system can be extended to various domains, including smart roads, intelligent water transport, and digital transportation. This expansion enhances the system’s scope.
Building upon this foundation, the smart highway evaluation system should be carefully implemented, aligning evaluation results with maintenance and management strategies. Following the current evaluation system, future research could concentrate on predicting performance and evolutionary patterns within smart highways. Exploring the impact of various maintenance strategies on costs, performance, and social services and providing lifecycle maintenance optimization plans based on cost–benefit analysis represent avenues for further study.

Supplementary Materials

The following supporting information can be downloaded at: https://www.mdpi.com/article/10.3390/app14135694/s1, Table S1: The specific definition of operational service indicators.

Author Contributions

Conceptualization and methodology, L.L.; resources, data curation, C.P.; experiments, investigation, formal analysis, and writing—original draft preparation, Y.L.; writing—review and editing, L.L. and C.P. All authors have read and agreed to the published version of the manuscript.

Funding

This research received no external funding.

Institutional Review Board Statement

Not applicable.

Informed Consent Statement

Not applicable.

Data Availability Statement

Data are contained within the article.

Acknowledgments

The authors would like to acknowledge the support and facilities provided by the School of Mechanics and Engineering Science at Shanghai University and Shanghai Urban Operation (Group) Co., Ltd. to carry out the research.

Conflicts of Interest

Dr. Chongmei Peng is an employee of Shanghai Urban Operation (Group) Co., Ltd. All other authors have no conflicts of interest.

References

  1. Zhu, B. Research and Practice of “Internet+” Intelligent Highway Operation and Maintenance Management Technology. Eng. Technol. Res. 2023, 5, 115–117. [Google Scholar] [CrossRef]
  2. Zhang, J.; Li, B.; Wang, X.-j.; Zhang, F.; Sun, X.-l. Design of Architecture and Development Roadmap of Smart Expressway. J. Highw. Transp. Res. Denelopment 2018, 35, 88–94. [Google Scholar]
  3. Sazali, H.; Firdaus, I.M. Highway infrastructure: Visions & challenges in the next decades. IOP Conf. Ser. Mater. Sci. Eng. 2019, 512, 012047. [Google Scholar] [CrossRef]
  4. Zhou, Z.; Su, Y.; Zheng, Z.; Wang, Y. Analysis of the Drivers of Highway Construction Companies Adopting Smart Construction Technology. Sustainability 2023, 15, 703. [Google Scholar] [CrossRef]
  5. Zhang, H. Analysis of the essential characteristics of smart highways and the issues that need to be addressed in their construction. China ITS J. 2021, S1, 155–157. [Google Scholar] [CrossRef]
  6. Pan, X.; Xu, M.; Jia, J.; Xia, Y.; Chen, Q.; Hossain, Z. Evaluation Model of Highway Reconstruction and Expansion Scheme Based on Multiple Attribute Decision Making. Adv. Civ. Eng. 2022, 2022, 3764557. [Google Scholar] [CrossRef]
  7. Mirshahi, M.; Obenberger, J.; Fuhs, C.A.; Howard, C.E.; Krammes, R.A.; Kuhn, B.T.; Mayhew, R.M.; Moore, M.A.; Sahebjam, K.; Stone, C.J. Active Traffic Management: The Next Step in Congestion Management; Federal Highway Administration: Washington, DC, USA, 2007.
  8. Zhang, Y.; Gantt, G.W.; Rychlinski, M.J.; Edwards, R.M.; Correia, J.J.; Wolf, C.E. Connected vehicle diagnostics and prognostics, concept, and initial practice. IEEE Trans. Reliab. 2009, 58, 286–294. [Google Scholar] [CrossRef]
  9. Shladover, S.E. Deployment Path Analysis for Cooperative ITS Systems; California Path Programinstitute of Transportation Studiesuniversity of California: Berkeley, CA, USA, 2009. [Google Scholar]
  10. Fujimoto, A.; Sakai, K.; Ogawa, M.; Hamada, S.; Handa, S.; Matsumoto, M.; Takahashi, K. Toward Realization of Smartway in Japan. In Proceedings of the 15th World Congress on Intelligent Transport Systems and ITS America’s 2008 Annual Meeting, New York, NY, USA, 16–20 November 2008. [Google Scholar]
  11. Cho, W.; Oh, H.-S.; Park, B.-J. Wireless access technologies for smart highway: Requirements and preliminary results. J. Inst. Internet Broadcast. Commun. 2011, 11, 237–244. [Google Scholar] [CrossRef]
  12. Kothari, C.; France-Mensah, J.; O’Brien, W.J. Developing a Sustainable Pavement Management Plan: Economics, Environment, and Social Equity. J. Infrastruct. Syst. 2022, 28, 04022009. [Google Scholar] [CrossRef]
  13. Chang, Y.; Cui, Y.; Tang, Y.; Zhang, B. The Idea and Method of Constructing the Ex-ante Evaluation Index System for The Deployment Scheme of Intelligent Expressway Information Service Equipment. In Proceedings of the 2023 World Transportation Conference (WTC2023), Wuhan, China, 14 June 2023; p. 7. [Google Scholar]
  14. China ITS Industry Alliance. General Technical Requirement of Smart Expressway Construction; China ITS Industry Alliance: Beijing, China, 2023. [Google Scholar]
  15. Whelan, R. Smart Highways, Smart Cars. IEEE Spectr. 1994, 31, 27–33. [Google Scholar]
  16. Al-Qadi, I.L.; Loulizi, A.; Elseifi, M.; Lahouar, S. The Virginia Smart Road: The impact of pavement instrumentation on understanding pavement performance. J. Assoc. Asph. Paving Technol. 2004, 73, 427–465. [Google Scholar]
  17. Gopalakrishna, D.; Garcia, V.; Ragan, A.; English, T.; Zumpf, S.; Young, R.; Ahmed, M.; Kitchener, F.; Serulle, N.U. Connected Vehicle Pilot Deployment Program Phase 1, Concept of Operations (ConOps), ICF/Wyoming; Intelligent Transportation Systems Joint Program Office: Washington, DC, USA, 2015.
  18. Saroj, A.; Roy, S.; Guin, A.; Hunter, M.; Fujimoto, R. Smart city real-time data-driven transportation simulation. In Proceedings of the 2018 Winter Simulation Conference (WSC), Gothenburg, Sweden, 9–12 December 2018; pp. 857–868. [Google Scholar]
  19. Pande, A. Evaluation of Adaptive Ramp Metering on I-80 in the San Francisco Bay Area; Center for Transportation, Equity, Decisions and Dollars: Arlington, TX, USA, 2018. [Google Scholar]
  20. Nakashima, H.; Nakamura, T.; Hosoi, Y.; Konno, K.; Kawamura, H. Smart Infrastructure Asset Management System on Metropolitan Expressway in Japan. In Proceedings of the International Road Federation World Meeting & Exhibition, Dubai, United Arab Emirates, 7–10 November 2021; pp. 575–586. [Google Scholar]
  21. Policy Bureau, Ministry of Land, Infrastructure, Transport and Tourism (MLIT). Summary of the White Paper on Land, Infrastructure; Transport and Tourism in Japan: Chiyoda-ku, Tokyo, 2020.
  22. Hildebrandt, C.; Bandyszak, T.; Petrovska, A.; Laxman, N.; Cioroaica, E.; Törsleff, S. EURECA: Epistemic uncertainty classification scheme for runtime information exchange in collaborative system groups. SICS Softw. Intensive Cyber Phys. Syst. 2019, 34, 177–190. [Google Scholar] [CrossRef]
  23. Soriano, F.R.; Tomás, V.R.; Pla-Castells, M. Deploying harmonized ITS services in the framework of EasyWay project: Traffic Management Plan for corridors and networks. In Proceedings of the 6th Euro American Conference on Telematics and Information Systems, Valencia, Spain, 23–25 May 2012; pp. 309–315. [Google Scholar]
  24. Minea, M.; Dumitrescu, C.M. On the Feasibility and Efficiency of Self-Powered Green Intelligent Highways. Energies 2022, 15, 4693. [Google Scholar] [CrossRef]
  25. Wu, W.; Wang, X.; Chu, P. An Overview of Wireless Communication Technology Applications for Smart Roads. Urban Transp. Syst. 2023, 3, 11–17. [Google Scholar] [CrossRef]
  26. Zhang, Q.; Shi, Y.; Yin, R.; Tao, H.; Xu, Z.; Wang, Z.; Chen, S.; Xing, J. An Integrated Framework for Real-Time Intelligent Traffic Management of Smart Highways. J. Transp. Eng. Part A Syst. 2023, 149, 7. [Google Scholar] [CrossRef]
  27. Erhart, J.; Carreras, A.; Daura, X.; Innerwinkler, P.; Solmaz, S. Novel Approaches for Analysing and Testing the Effect of Autonomous Vehicles on the Traffic Flow. In Proceedings of the 26th ITS World Congress (ITSCWC 2019), Singapore, 21–25 October 2019. [Google Scholar]
  28. China Highway and Transportation Society. Classification and Definition for Connected Automated Highway (CAH) Systems; China Highway and Transportation Society: Beijing, China, 2019. [Google Scholar]
  29. ERTRAC Working Group: “Connectivity and Automated Driving”. Connected, Cooperative and Automated Mobility Roadmap; European Road Transport Research Advisory Council: Brussels, Belgium, 2022. [Google Scholar]
  30. Wang, H.; Liu, Y.; Hou, Y.; Qi, H. Method for multiple attribute group decision making with single-valued neutrosophic number and applications to service quality evaluation of urban public transport. Int. J. Knowl. Based Intell. Eng. Syst. 2023, 27, 233–244. [Google Scholar] [CrossRef]
  31. Zak, J. The methodology of multiple criteria decision making/aiding in public transportation. J. Adv. Transp. 2011, 45, 1–20. [Google Scholar] [CrossRef]
  32. Hao, S.; Qiao, Z.; Zhao, L.; He, X. AHP Matter Element Model for Expressway Service Quality Evaluation. In 2021 International Conference on Big Data Analytics for Cyber-Physical System in Smart City; Springer: Singapore, 2022; pp. 541–547. [Google Scholar]
  33. Bilașco, Ș.; Man, T.-C. GIS-Based Spatial Analysis Model for Assessing Impact and Cumulative Risk in Road Traffic Accidents via Analytic Hierarchy Process (AHP)—Case Study: Romania. Appl. Sci. 2024, 14, 2643. [Google Scholar] [CrossRef]
  34. Liu, G.; Wu, H.; Jiang, G. Research on the Evaluation System of Intelligent Expressway Indicators. China ITS J. 2021, 8, 91–97. [Google Scholar] [CrossRef]
  35. Wang, Z.; Yuan, Y. Construction Safety Risk Assessment of High-Pile Wharf: A Case Study in China. Buildings 2024, 14, 1189. [Google Scholar] [CrossRef]
  36. Shan, Y.; Ma, X.; Liu, W.; Qin, L. An Analysis Model of Performance Index Based on Weighted Fuzzy Mutual Information. Acad. J. Comput. Inf. Sci. 2023, 6, 102–113. [Google Scholar] [CrossRef]
  37. Pajković, V.; Grdinić-Rakonjac, M.; Antić, B.; Tay, R.S. Application of Fuzzy Linguistic Rating and Entropy-Based GRA to Address Uncertainty in Safety Performance Index Construction. J. Adv. Transp. 2022, 2022, 5025768. [Google Scholar] [CrossRef]
  38. Zheng, J.; Zhang, J. Research on the Post-evaluation of Intelligent Expressway Improvement and Renovation Project Based on AHP-fuzzy Comprehensive Evaluation. Constr. Econ. 2023, 44, 214–219. [Google Scholar] [CrossRef]
  39. Zavadskas, E.K.; Vinogradova-Zinkevic, I.; Juodagalviene, B.; Lescauskiene, I.; Keizikas, A. Comparison of Safety and Sustainability of U-Shaped Internal Staircase Projects via a Combined MCDM Approach CORST. Appl. Sci. 2023, 14, 158. [Google Scholar] [CrossRef]
  40. Huang, M.; Zhang, X.; Ren, R.; Liao, H.; Zavadskas, E.K.; Antuchevičienė, J. Energy-Saving Building Program Evaluation with an Integrated Method under Linguistic Environment. J. Civ. Eng. Manag. 2020, 26, 447–458. [Google Scholar] [CrossRef]
  41. Deng, Z.; Du, A.; Yang, C.; Tong, J.; Chen, Y. Multilevel Evaluation Model of Electric Power Steering System Based on Improved Combination Weighting and Cloud Theory. Appl. Sci. 2024, 14, 1043. [Google Scholar] [CrossRef]
  42. Xu, Y. Deriving Priorities from Incomplete Fuzzy Reciprocal Preference Relations; Springer: Singapore, 2023. [Google Scholar]
  43. Luo, M.; Ma, Z.; Zhao, W.; Enoch, M.; Steven, I.; Chien, J. An ex-post evaluation of the public acceptance of a license plate-based restriction policy: A case study of Xi’an, China. Transp. Res. Part A Policy Pract. 2022, 155, 259–282. [Google Scholar] [CrossRef]
  44. Schlesinger, M.; Vodolazskiy, E. Minimax Deviation Strategies for Machine Learning and Recognition with Short Learning Samples. Cybern. Syst. Anal. 2022, 58, 862–875. [Google Scholar] [CrossRef]
  45. Chen, J.; Gao, C.; Zhou, H.; Wang, Q.; She, L.; Qing, D.; Cao, C. Urban Flood Risk Assessment Based on a Combination of Subjective and Objective Multi-Weight Methods. Appl. Sci. 2024, 14, 3694. [Google Scholar] [CrossRef]
  46. Maceika, A.; Bugajev, A.; Šostak, O.R. Evaluating Modular House Construction Projects: A Delphi Method Enhanced by Conversational AI. Buildings 2024, 14, 1696. [Google Scholar] [CrossRef]
  47. You, X.; Song, Y. Research on Sustainable Supplier Evaluation Index System in Architectural Design Industry. Sustainability 2024, 16, 4466. [Google Scholar] [CrossRef]
  48. Ministry of Transport of the People’s Republic of China. Technical Specifications of Maintenance for Highway; Ministry of Transport of the People’s Republic of China: Beijing, China, 2009.
  49. Ministry of Transport of the People’s Republic of China. Standards for Technical Condition Evaluation of Highway Bridges; Ministry of Transport of the People’s Republic of China: Beijing, China, 2011.
  50. Ministry of Transport of the People’s Republic of China. Highway Performance Assessment Standards; Ministry of Transport of the People’s Republic of China: Beijing, China, 2018.
  51. Yu, H.; Li, A. Assessing Traffic Noise and Its Impact on High-Rise Apartment Buildings Adjacent to an Urban Expressway: A Case Study in Chengdu, China. Buildings 2024, 14, 1377. [Google Scholar] [CrossRef]
  52. Wu, J.; Jiang, X. Flood Disaster Risk Assessment in Wuhan City Based on GIS Analysis and Indicator Ranking Using Random Forest. Buildings 2024, 14, 1370. [Google Scholar] [CrossRef]
  53. Avcı, İ.; Koca, M. A Novel Security Risk Analysis Using the AHP Method in Smart Railway Systems. Appl. Sci. 2024, 14, 4243. [Google Scholar] [CrossRef]
  54. Al Shdifat, M.; Jalón, M.L.; Puertas, E.; Chiachío, J. A Quantitative Group Decision-Making Methodology for Structural Eco-Materials Selection Based on Qualitative Sustainability Attributes. Appl. Sci. 2023, 13, 12310. [Google Scholar] [CrossRef]
  55. Tong, S.; Sun, B.; Zhang, L.; Chu, X. An approach of multi-criteria group decision making with incomplete information based on formal concept analysis and rough set. Expert Syst. Appl. 2024, 248, 123364. [Google Scholar] [CrossRef]
  56. Yao, L.; Fu, H.; Shao, M.; Yu, Z. Highway Microgrid Project Evaluation under Energy Transportation Integration. Applied Sciences 2024, 14, 2707. [Google Scholar] [CrossRef]
  57. Zhou, Y.; Guo, F. Evaluation System of Sustainable Development of Bus Transit System Based on Analytic Hierarchy Process-Entropy Method. Sci. Technol. Eng. 2019, 19, 288. [Google Scholar]
  58. Liu, W.; Liu, A.; Qin, H.; Yan, Y.; Fu, D.; Singh, R.P. Application of hybrid multi-criteria decision-making approach to analyze wastewater microalgae culture systems for bioenergy production. Environ. Res. 2024, 256, 119234. [Google Scholar] [CrossRef]
  59. Zhang, L.; Cheng, Q.; Qu, S.; Yang, Y. Evaluation of Railway Transportation Performance Based on CRITIC-Relative Entropy Method in China. J. Adv. Transp. 2023, 2023, 5257482. [Google Scholar] [CrossRef]
  60. Pan, Z.; Huang, X. A Multivariate Statistical Process Control Model Based on CRITIC Entropy Method and EWMA. Adv. Comput. Signals Syst. 2023, 7, 20–26. [Google Scholar] [CrossRef]
  61. Zhou, M.; Li, D. Minimum Deviation Method for Multi objective Optimization Design. J. Mach. Des. 2002, 12, 50–52. [Google Scholar] [CrossRef]
Figure 1. Smart highway system facilities and functions.
Applsci 14 05694 g001
Figure 2. Smart highway system facilities and functions.
Applsci 14 05694 g002
Figure 3. Establishment process of the evaluation system.
Applsci 14 05694 g003
Figure 4. Overall framework of the evaluation system.
Applsci 14 05694 g004
Table 1. Specific indicators of facility structure.
Guideline Level BIndicator Level C
Subgrade (B11)Roadbed settlement (B111)Number and location of roadbed settlements (C1)
Shoulder damage (B112)Shoulder damage area (C2)
Slope collapse (B113)Number and location of slope collapse (C3)
Damage to roadbed structures (B114)Number and location of damaged retaining walls (C4)
Displacement/settlement values of retaining walls (C5)
Curb stone lacking (B115)Length of curb stone lacking (C6)
Washout gully due to water damage (B116)Number and location of washout gullies due to water damage (C7)
Poor drainage (B117)Number of blocked drainage locations (C8)
Pavement (B12)Pavement damage (B121)Pavement surface condition index (PCI) (C9)
Pavement riding quality (B122)Pavement Riding Quality Index (RQI) (C10)
Unevenness of riding quality (C11)
Pavement rutting depth (B123)Pavement Rutting Depth Index (RDI) (C12)
Unevenness of rut depth (C13)
Pavement bumping (B124)Pavement bumping index (PBI) (C14)
Pavement surface wearing (B125)Pavement surface wearing index (PWI) (C15)
Pavement skidding resistance (B126)Pavement skidding resistance index (SRI) (C16)
Pavement structure strength (B127)Pavement structure strength index (PSSI) (C17)
Bridge and tunnel structures (B13)Superstructure condition index (SPCI) (B131)Upper load-bearing components (C18)
Upper general components (C19)
Bearing (C20)
Substructure condition index (SBCI) (B132)Wing wall, abutment wall (C21)
Conical slope (C22)
Bridge pier (C23)
Bridge abutment (C24)
Pier and abutment foundation (C25)
Riverbed (C26)
Regulating structures (C27)
Bridge deck condition index (BDCI) (B133)Bridge pavement (C28)
Expansion joint device (C29)
Sidewalk (C30)
Guardrail (C31)
Drainage system (C32)
Lighting (C33)
Deflection deformation (B134)Bridge displacement and deformation (C34)
Joint dislocation (B135)Vertical joint misalignment height difference (C35)
Ancillary facilities (B14)Protective facilities (B141)Anti-collision guardrail (C36)
Anti-glare board (C37)
Anti-fall net (C38)
Sound barrier (C39)
Center median movable guardrail (C40)
Crash barrel (C41)
Crash cushion (C42)
Isolation barrier (B142)
Signs (B143)
Isolation barrier (C43)
Indicator sign (C44)
Warning sign (C45)
Prohibition sign (C46)
Milestone (C47)
Variable message sign (C48)
Profile marking (C49)
Hundred meters marking (C50)
Markings (B144)Road marking (C51)
Raised pavement marking (C52)
Green facilities (B145)Green belt (C53)
Table 2. Specific indicators of electromechanical facilities.
Guideline Level BIndicator Level C
Monitoring system (B21)Central control and management subsystem (C54)
Video surveillance subsystem (C55)
Environmental and equipment monitoring subsystem (C56)
Traffic monitoring subsystem (C57)
Toll collection system (B22)Toll booth subsystem (C58)
Toll settlement center system (C59)
Communication system (B23)Data and video communication subsystem (C60)
Broadcast communication subsystem (C61)
Telephone communication subsystem (C62)
Power supply and lighting system (B24)Power distribution system (C63)
Lighting subsystem (C64)
Information release system (B25)Information release subsystem (C65)
Table 3. Specific indicators of operation services.
Guideline Level BIndicator Level C
Traffic operation (B31)Efficiency (B311)Traffic service (B3111)Peak saturation (C66)
Traffic service volume (C67)
Average speed (C68)
Toll service (B3112)Percentage of ETC lanes (C69)
Toll collection status (C70)
Manual lane service level (C71)
Emergency dispatch (B3113)Average arrival time (C72)
Traction service satisfaction (C73)
Safety (B312)Road safety (B3121)Monitoring facility coverage rate (C74)
Accuracy of overload and over limit monitoring (C75)
Structural sensing facility coverage rate (C76)
Vehicle and user safety (B3122)Traffic accident rate (C77)
At-fault accidents during traffic operations (C78)
Intelligence (B313)Network information sharing (B3131)Highway network coverage rate (C79)
Meteorological traffic information transmission (C80)
Lane-level control (B3132)Lane flow equilibrium level (C81)
Traffic guidance level (C82)
Service area quality (B3133)Service facility integrity (C83)
Parking service capacity (C84)
Vehicle range extension service (C85)
Sustainability (B314)Energy consumption (B3141)Green energy share (C86)
Carbon emission level (C87)
Electric power consumption (C88)
Maintenance management (B32)Efficiency (B321)Maintenance execution (B3211)Punctuality rate of maintenance work order execution (C89)
Maintenance operation passage impact rate (C90)
Safety (B322)Maintenance safety assurance (B3221)At-fault accidents during maintenance period (C91)
Facility management at maintenance construction sites (C92)
Intelligence (B323)Maintenance decision-making (B3231)Medium- to long-term planning (C93)
Intelligent equipment
(B3232)
The level of civil structure health monitoring (C94)
The level of electromechanical equipment monitoring (C95)
The level of application of intelligent inspection equipment (C96)
Maintenance management level (B3233)The level of information technology in daily maintenance (C97)
The level of information technology in periodic inspection (C98)
Sustainability (B324)Environmental impact (B3241)Exhaust emission level (C99)
Dust control level (C100)
Noise pollution level (C101)
Maintenance process
(B3242)
Application of new energy (C102)
Road surface cleaning (C103)
The utilization rate of green materials (C104)
Table 4. The indicator weights for the Target Level after applying AHP.
Target Level AA1A2A3
Expert 10.160.30.54
Expert 20.160.30.54
Expert 30.330.330.33
Expert 40.710.110.18
Expert 50.460.130.41
Expert 60.440.110.44
Expert 70.590.250.16
Expert 80.620.120.27
Expert 90.140.240.62
Expert 100.330.330.33
Expert 110.330.330.33
Expert 120.330.330.33
Table 5. The indicator parameters after applying the group decision-making method.
Weight Values λ k μ k ω k
Expert 10.110.08030.0778
Expert 20.110.08030.0778
Expert 30.040.08860.0926
Expert 40.160.07390.0675
Expert 50.060.08760.0896
Expert 60.070.08690.0879
Expert 70.100.07920.0776
Expert 80.110.08090.0784
Expert 90.120.07670.0734
Expert 100.040.08860.0926
Expert 110.040.08860.0926
Expert 120.040.08860.0926
Table 6. The indicator weights for the Target Level after applying the AHP and GDM-corrected weights.
Target Level AA1A2A3
The corrected weights0.37960.24410.3763
Table 7. Smart highway scoring table.
HighwaysHighway AHighway BHighway CHighway DHighway E
A1 score91.192.2494.5692.3295
A2 score10095.29610090
A3 score9596.495.294.391.8
Table 8. Entropy weight method calculation results.
Weight Values e j g j w j
A10.77820.22180.4157
A20.83870.16130.3023
A30.84950.15050.2820
Table 9. Critic method calculation results.
Weight Values s j r j c j w j
A10.42413.36941.42890.4624
A20.41092.23060.91650.2966
A30.36912.01780.74480.2410
Table 10. Table of final combined weights for Guideline Level B.
Indicator LevelCombined Weight Values
First-level indicatorsB11(0.18)B12(0.40)B13(0.32)B14(0.10)B21(0.30)B22(0.30)
B23(0.20)B24(0.20)B25(0.10)B31(0.58)B32(0.42)
Second-level indicatorsB111(0.25)B112(0.10)B113(0.25)B114(0.10)B115(0.05)B116(0.15)
B117(0.10)B121(0.35)B122(0.30)B123(0.15)B124(0.05)B125(0.05)
B126(0.05)B127(0.05)B131(0.30)B132(0.30)B133(0.30)B134(0.05)
B135(0.05)B141(0.35)B142(0.10)B143(0.25)B144(0.20)B145(0.10)
B311(0.27)B312(0.45)B313(0.17)B314(0.11)B321(0.29)B322(0.44)
B323(0.14)B324(0.13)
Third-level indicatorsB3111(0.41)B3112(0.30)B3113(0.29)B3121(0.38)B3122(0.62)B3131(0.29)
B3132(0.33)B3133(0.38)B3141(1)B3211(1)B3221(1)B3231(0.39)
B3232(0.29)B3233(0.32)B3241(0.53)B3242(0.47)
Table 11. Table of final combined weights for Indicator Level C.
Indicator LevelCombined Weight Values
Indicator Level CC1(1)C2(1)C3(1)C4(0.50)C5(0.50)C6(1)
C7(1)C8(1)C9(1)C10(0.82)C11(0.18)C12(0.81)
C13(0.19)C14(1)C15(1)C16(1)C17(1)C18(0.70)
C19(0.18)C20(0.12)C21(0.02)C22(0.01)C23(0.30)C24(0.30)
C25(0.28)C26(0.07)C27(0.02)C28(0.40)C29(0.25)C30(0.10)
C31(0.10)C32(0.10)C33(0.05)C34(1)C35(1)C36(0.20)
C37(0.10)C38(0.10)C39(0.10)C40(0.10)C41(0.20)C42(0.20)
C43(1)C44(0.20)C45(0.20)C46(0.20)C47(0.10)C48(0.10)
C49(0.10)C50(0.10)C51(0.50)C52(0.50)C53(1)C54(0.30)
C55(0.30)C56(0.10)C57(0.30)C58(0.70)C59(0.30)C60(0.40)
C61(0.30)C62(0.30)C63(0.70)C64(0.30)C65(1)C66(0.35)
C67(0.30)C68(0.35)C69(0.29)C70(0.43)C71(0.28)C72(0.48)
C73(0.52)C74(0.36)C75(0.30)C76(0.34)C77(0.55)C78(0.45)
C79(0.60)C80(0.40)C81(0.42)C82(0.58)C83(0.50)C84(0.25)
C85(0.25)C86(0.25)C87(0.52)C88(0.23)C89(0.37)C90(0.63)
C91(0.52)C92(0.48)C93(1)C94(0.41)C95(0.30)C96(0.29)
C97(0.48)C98(0.52)C99(0.30)C100(0.37)C101(0.33)C102(0.20)
C103(0.50)C105(0.30)
Disclaimer/Publisher’s Note: The statements, opinions and data contained in all publications are solely those of the individual author(s) and contributor(s) and not of MDPI and/or the editor(s). MDPI and/or the editor(s) disclaim responsibility for any injury to people or property resulting from any ideas, methods, instructions or products referred to in the content.

