
Geomechanical Analysis of the Main Roof Deformation in Room-and-Pillar Ore Mining Systems in Relation to Real Induced Seismicity


Abstract
1. Introduction
- – Forecasting the mining-induced processes within the rock strata;
- – Steering the elements of the room-and-pillar mining systems such as to reduce the rockburst and seismic hazard levels.
2. Materials and Methods
2.1. Geological and Mining Conditions in the Area
2.2. General Characteristic of Seismic Activity and Rockburst Hazard
2.3. Assumptions for the Analytical Assessment of Tremor-Prone Formations Activation Possibility
- Af, Av, Ac—elastic strain energy density (shear Af, volumetric Av and total strain energy density, respectively) in the secondary state of stress, J/m3,
- σi, τij—secondary stress tensor components (i, j = x, y, z), Pa,
- Rc, Rr—instantaneous compressive and tensile strength, Pa,
- Es, νs—Young modulus and Poisson ratio of the medium, Pa, –.
- –
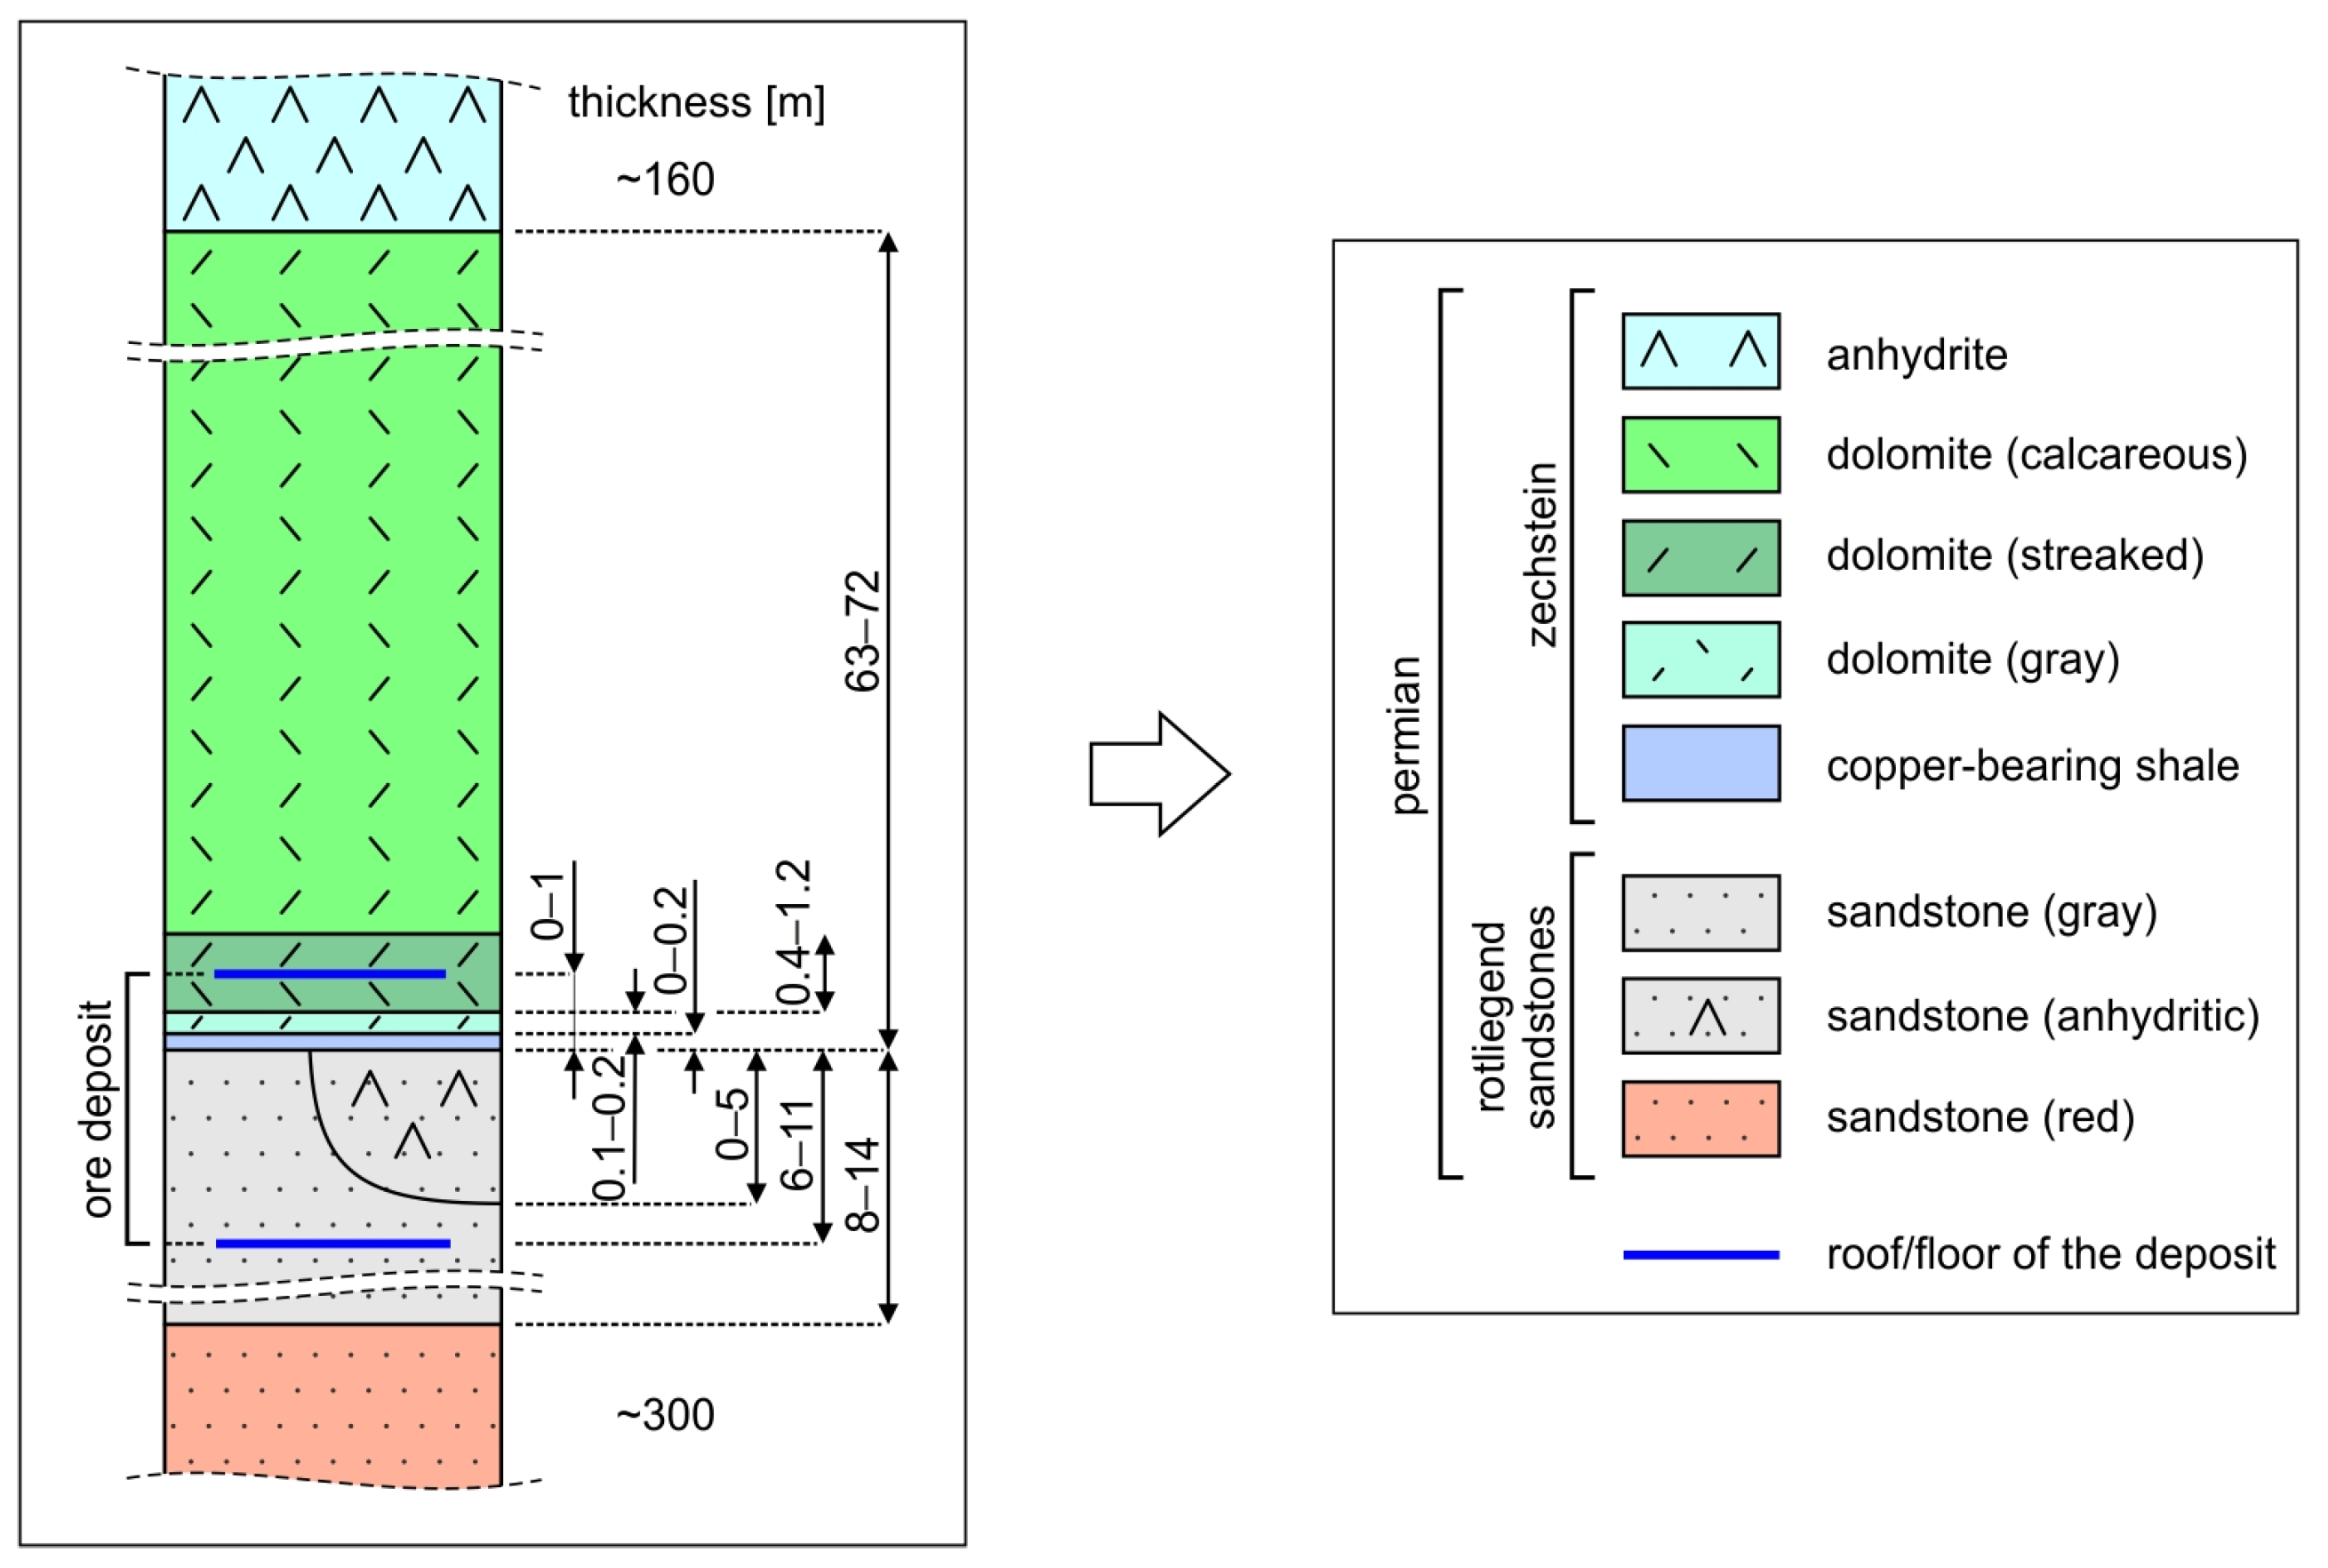
- It was assumed that fracturing (failure) took place on the horizon level of the contact zone between the dolomite and anhydrite layers (Figure 1); this level appears to be most likely in terms of the pre-supposed error in locating the vertical coordinate of registered high-energy events;
- –
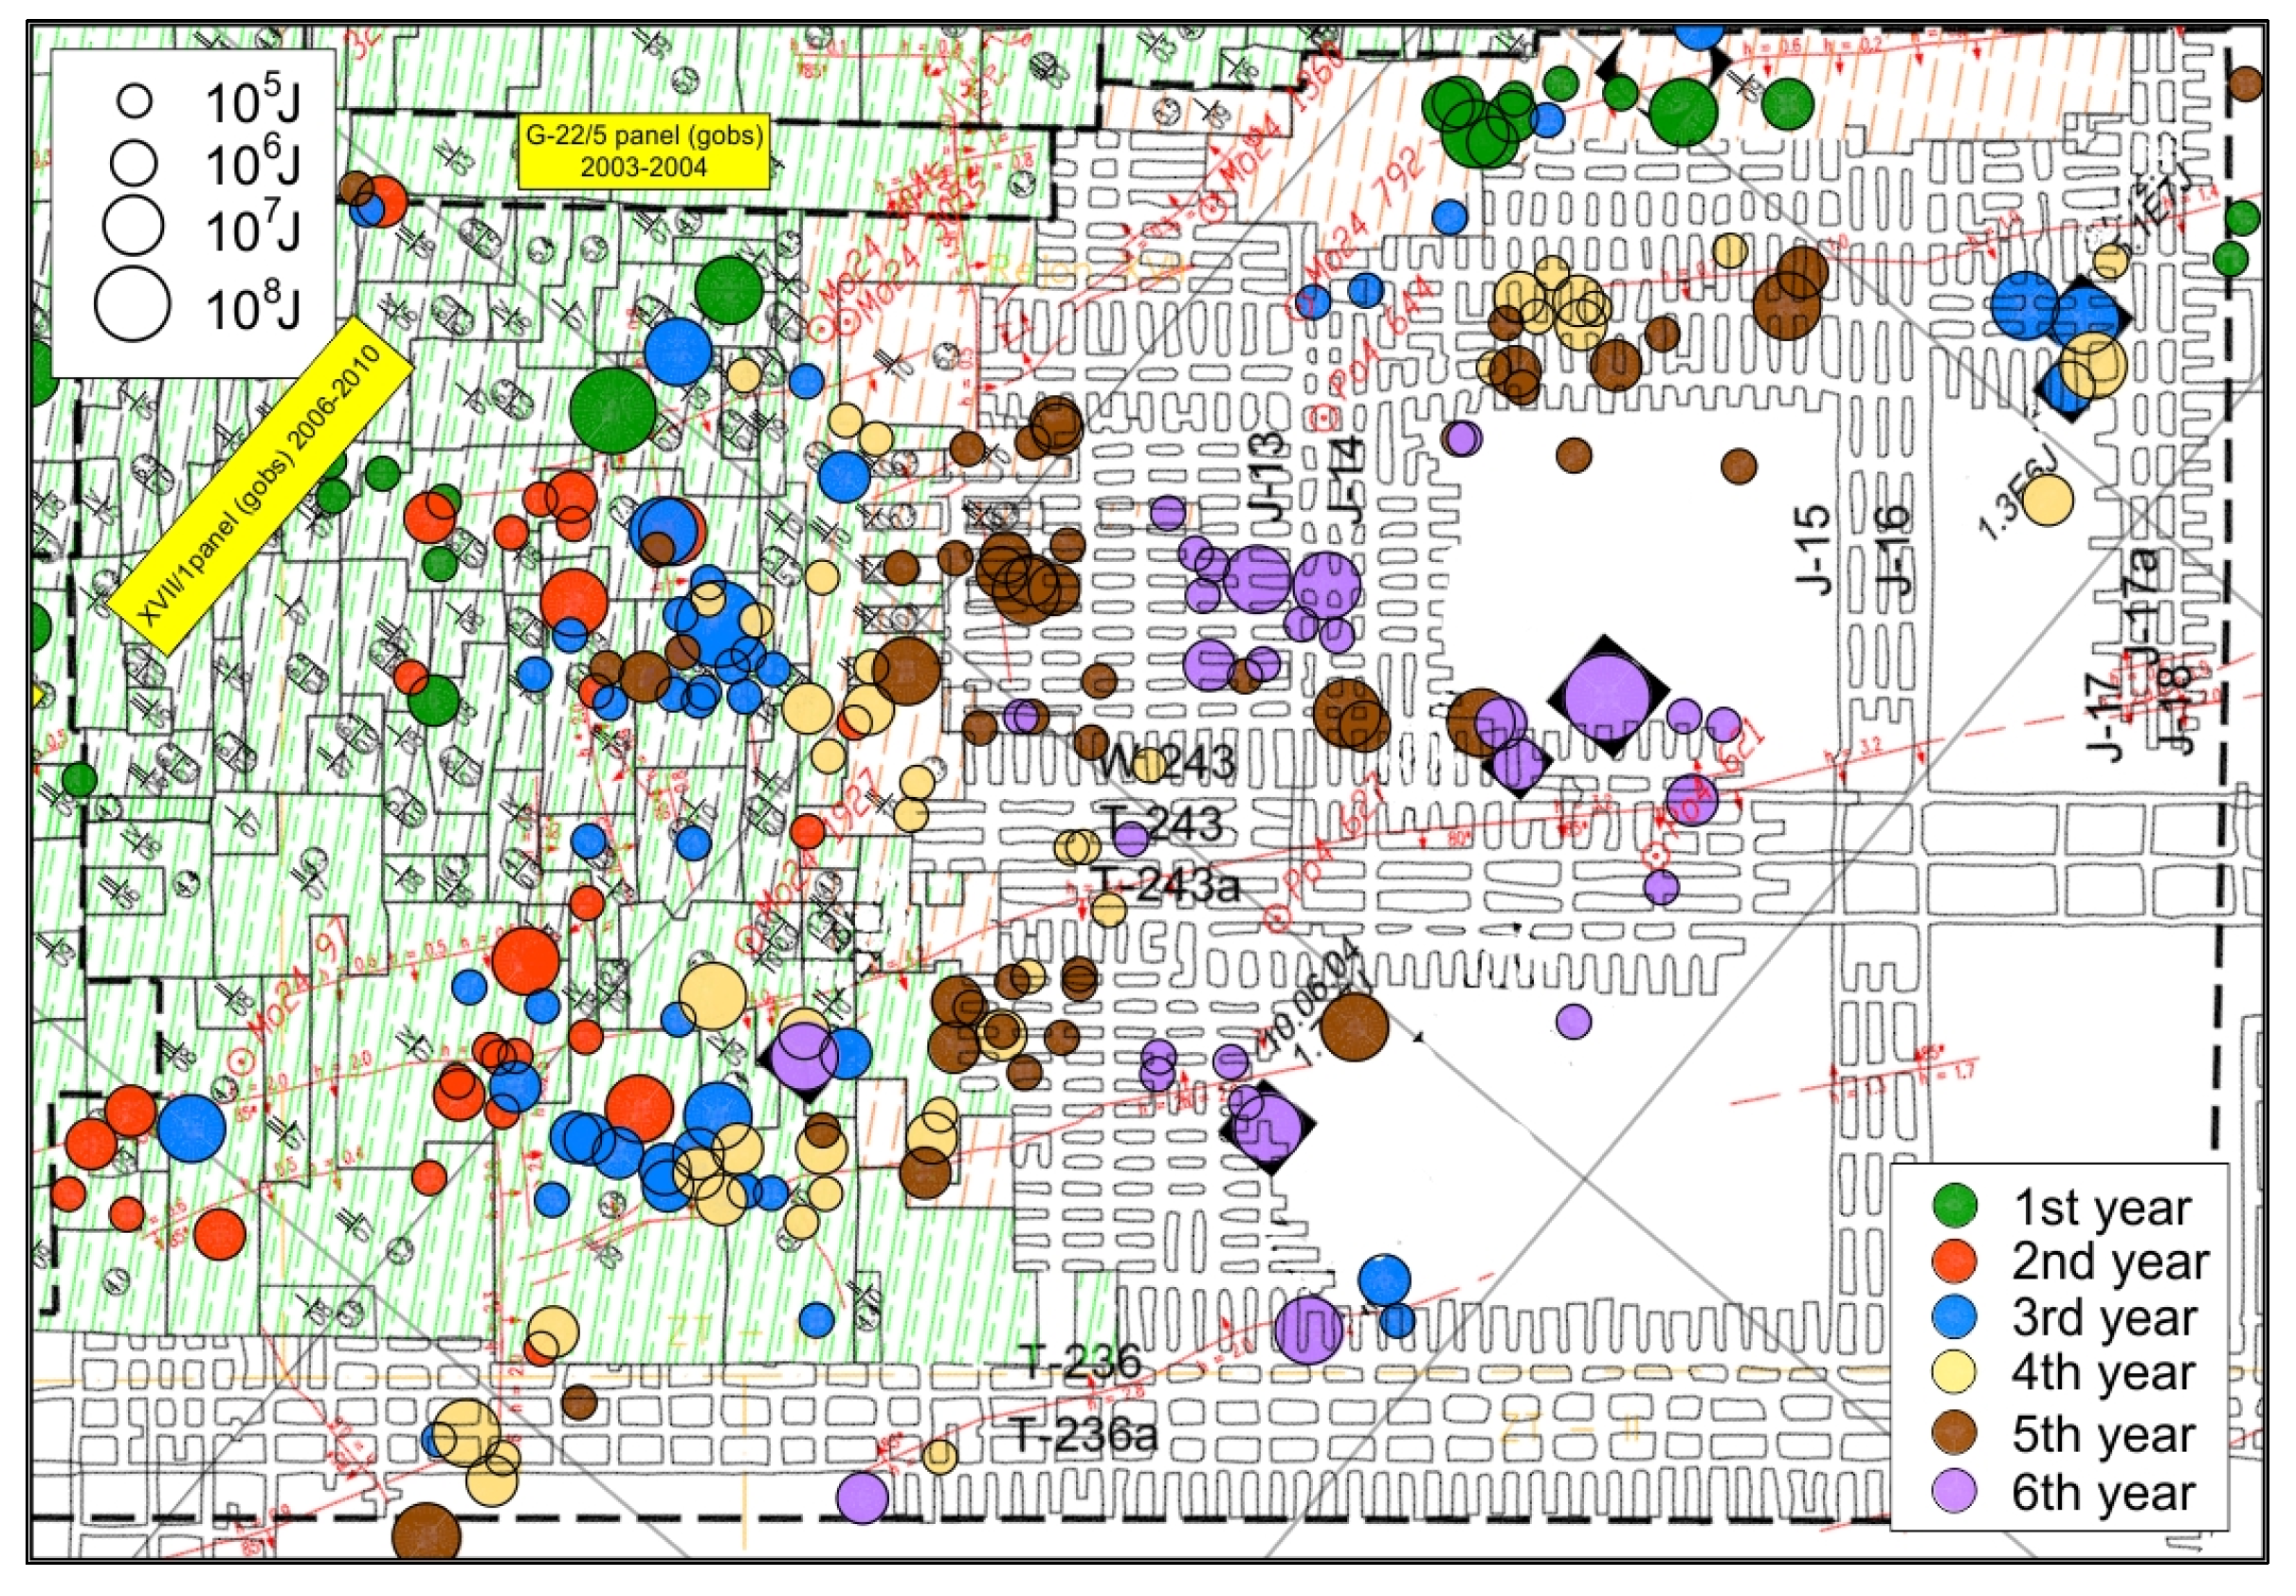
- We were cognisant of the state and progress of mining operations at the time when the two events were registered (December in Year 3—Figure 2 and in December Year 6—Figure 3), and of impacts produced by advancing panelling works, liquidation of working zones and the presence of the existing gobs and development openings in neighbouring plots, as well as the applied methods of roof control (deflection, backfilling);
- –
- The presence of faults with relatively low downthrow (in relation to the height of the face entry drivage) and their impacts on the state of stress within the burst-prone layer were neglected; hence, the lower value of the derived safety factor in regions in the vicinity of faults, characterised by the presence of additional stress concentration zones and areas of elastic strain energy concentration,
- –
- The effects of potential changes in the structure of burst-prone formations (and consequent changes in their geomechanical properties) due to previous mining-induced seismicity were neglected; a quantitative analysis of such changes is in fact not feasible.
3. Results and Discussion
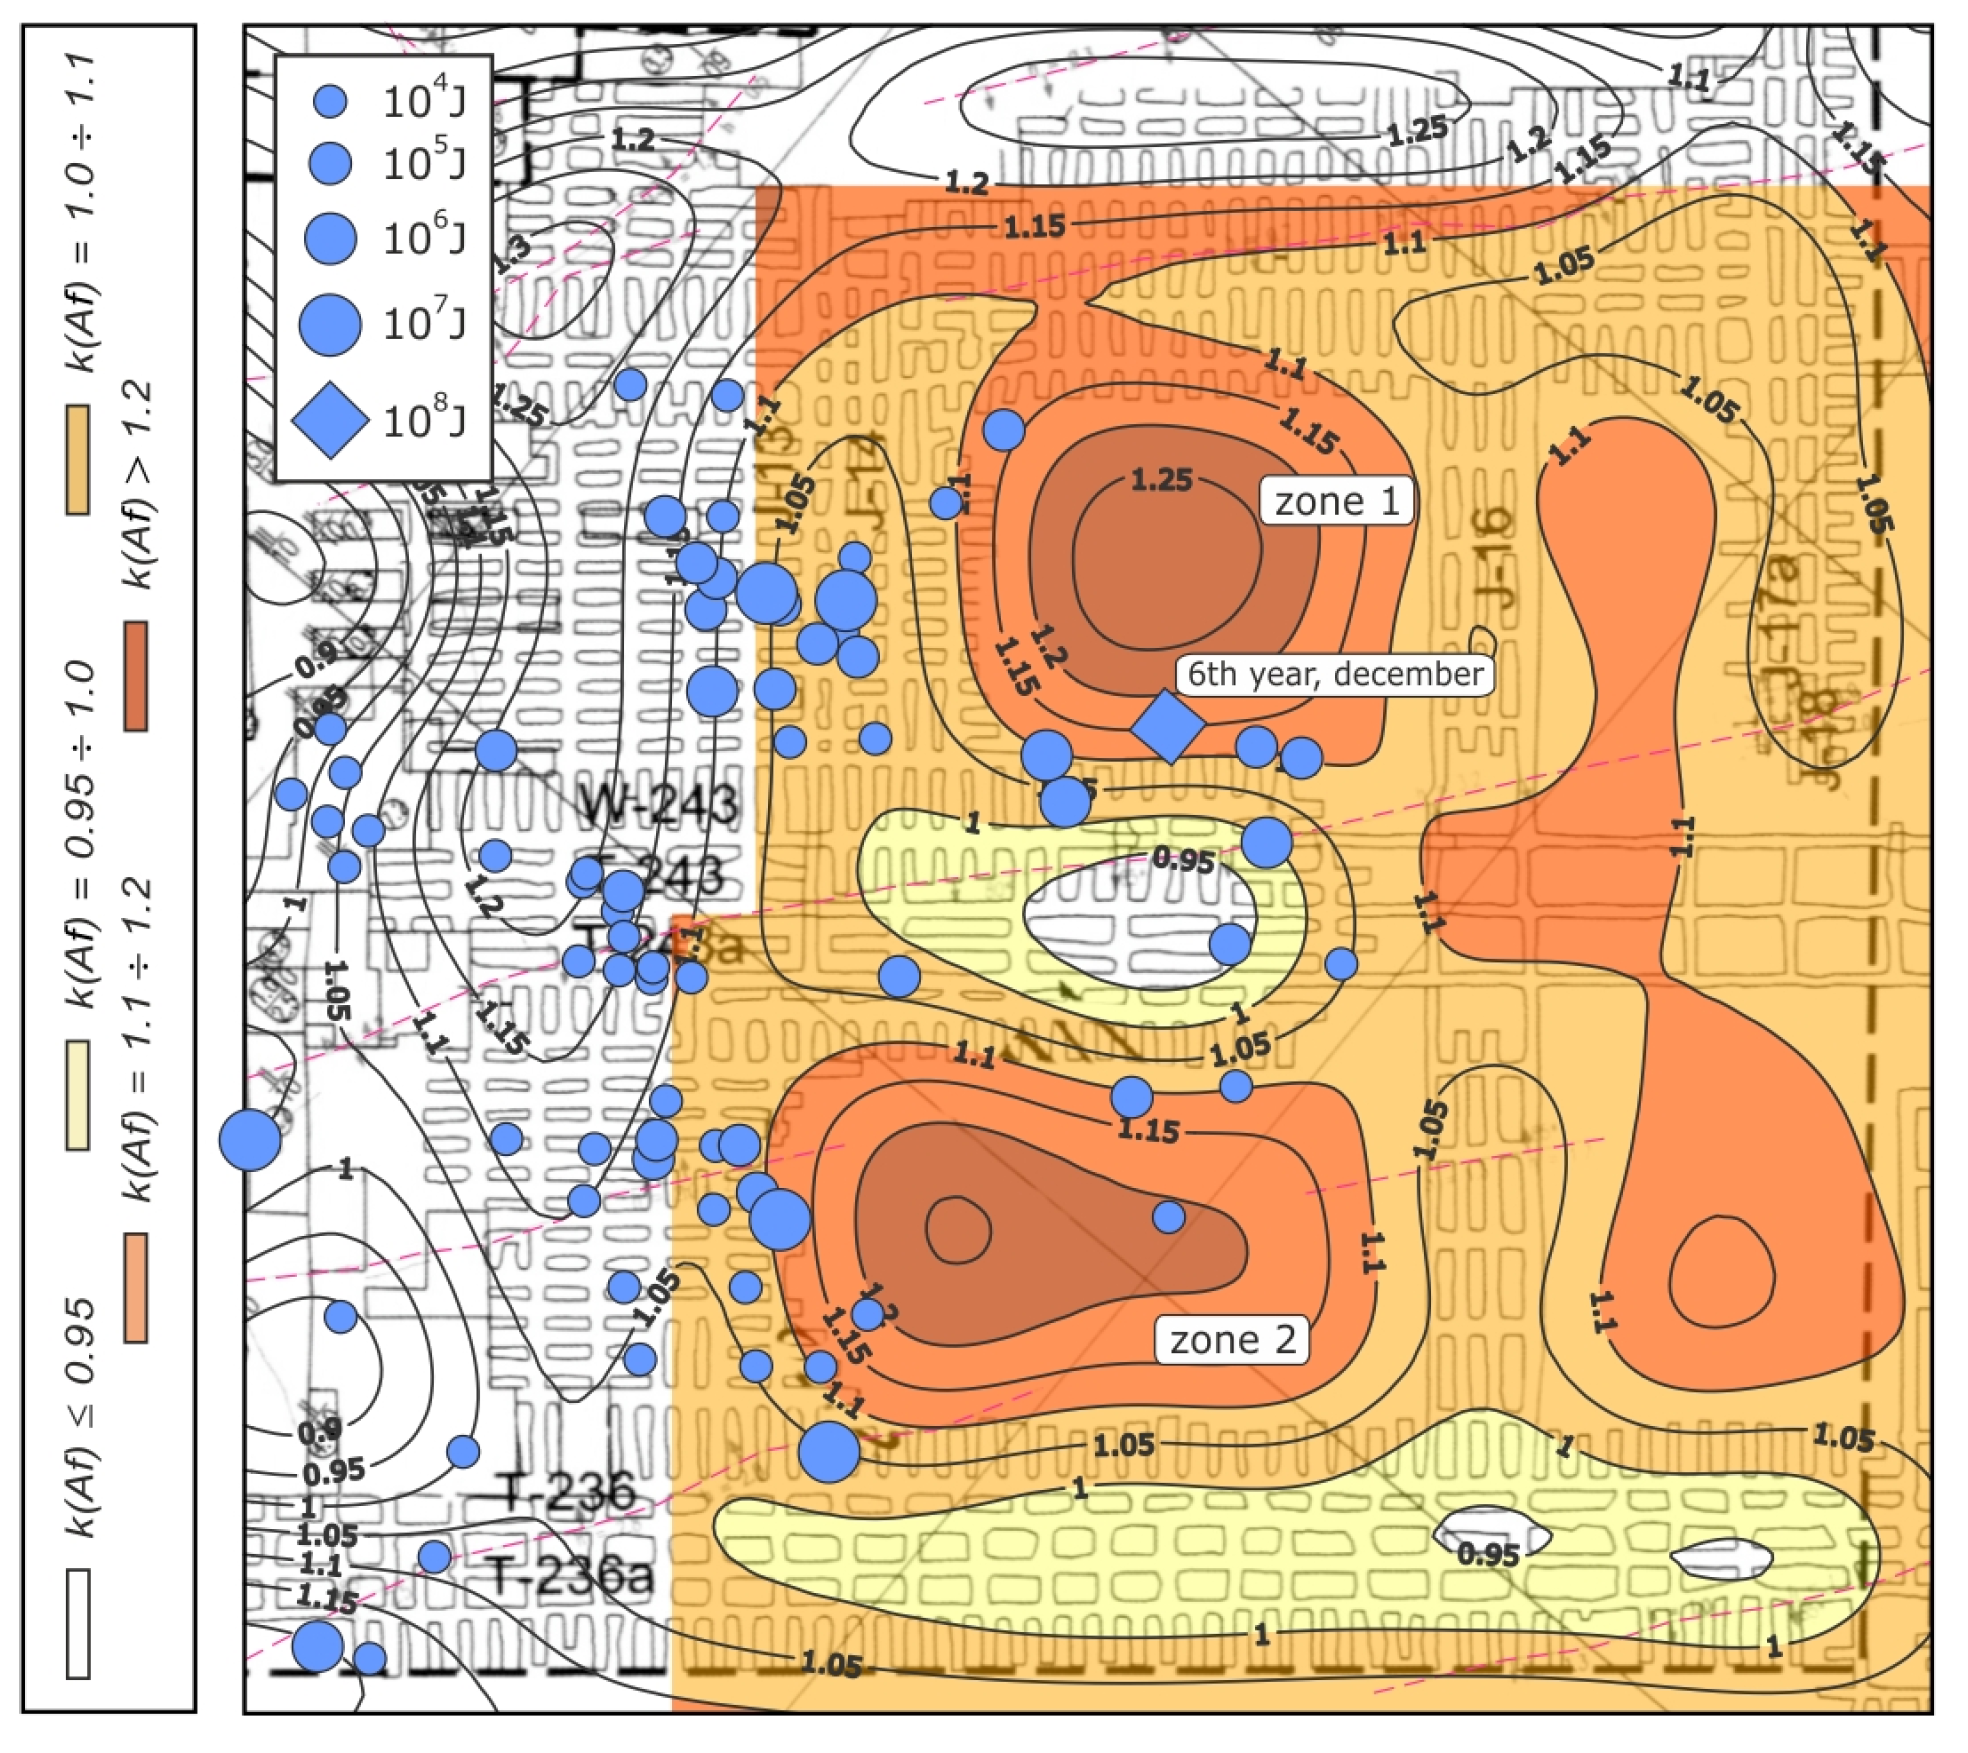
- –
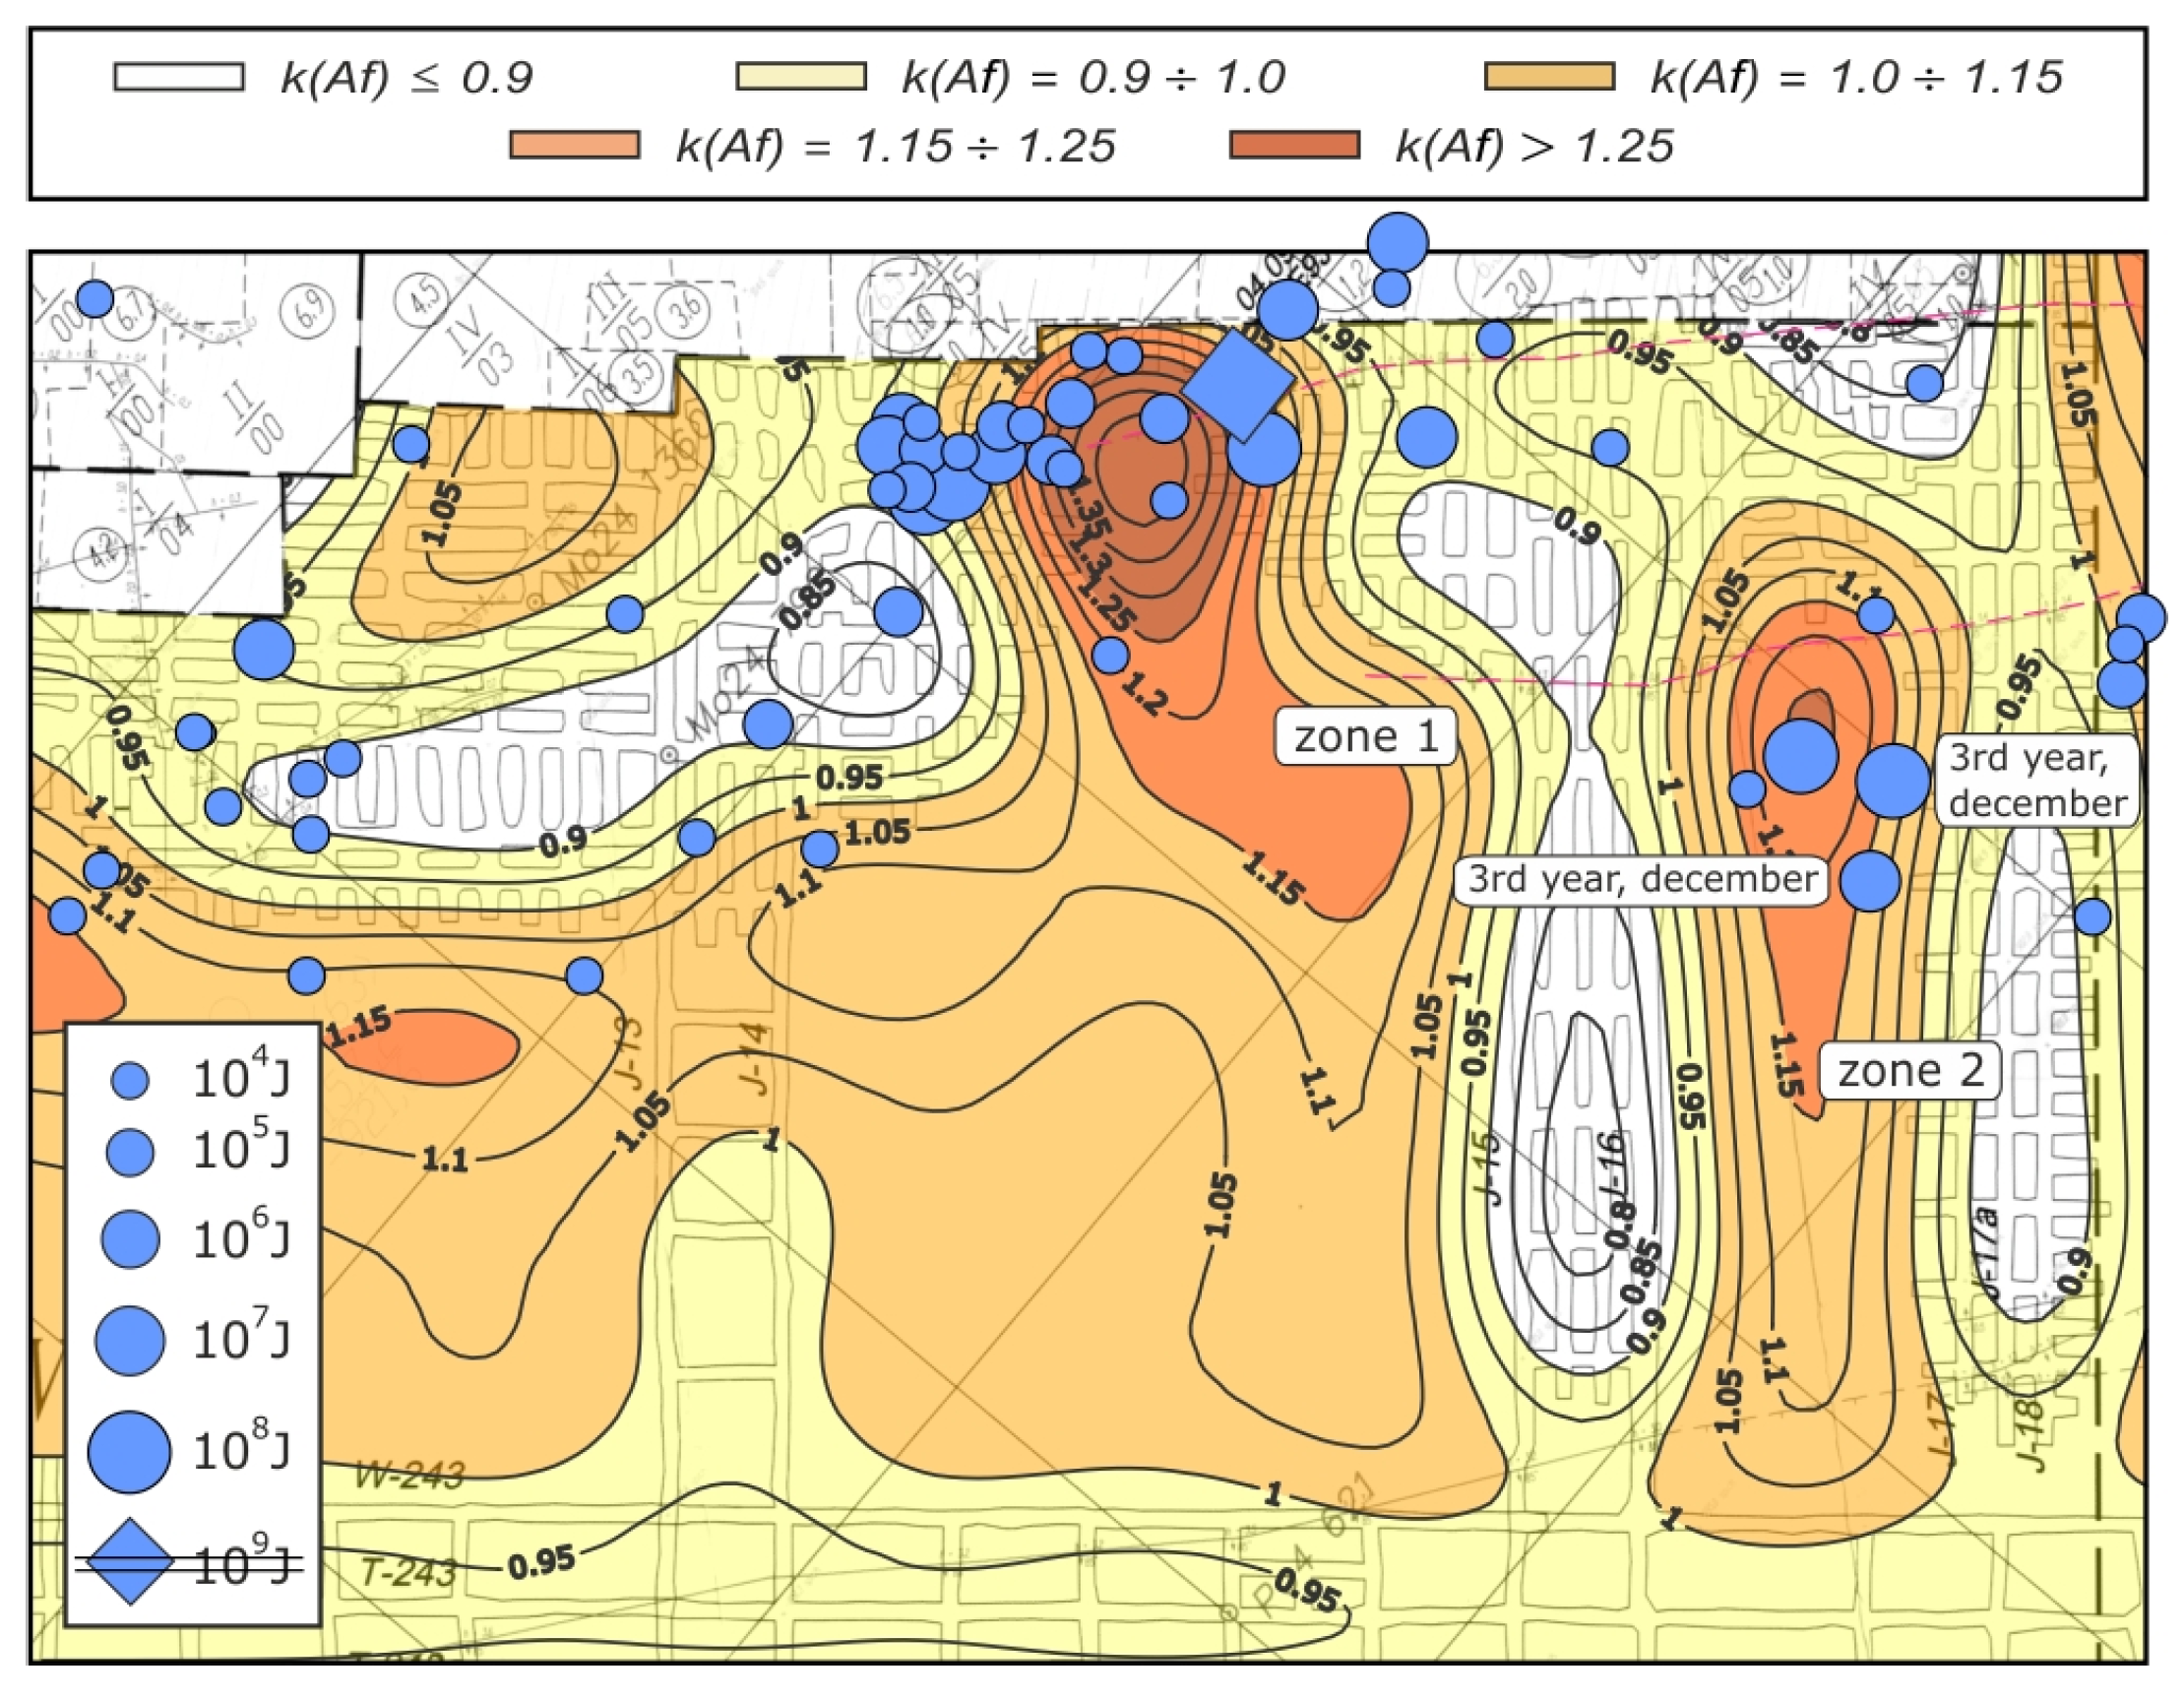
- Shear strain energy density factor (k(Af)) on the level of burst-prone layers of the main roof (the dolomite–anhydrite interface), defined aswhere —density of the primary shear strain energy associated with gravity-induced stress exclusively, J/m3.
- –
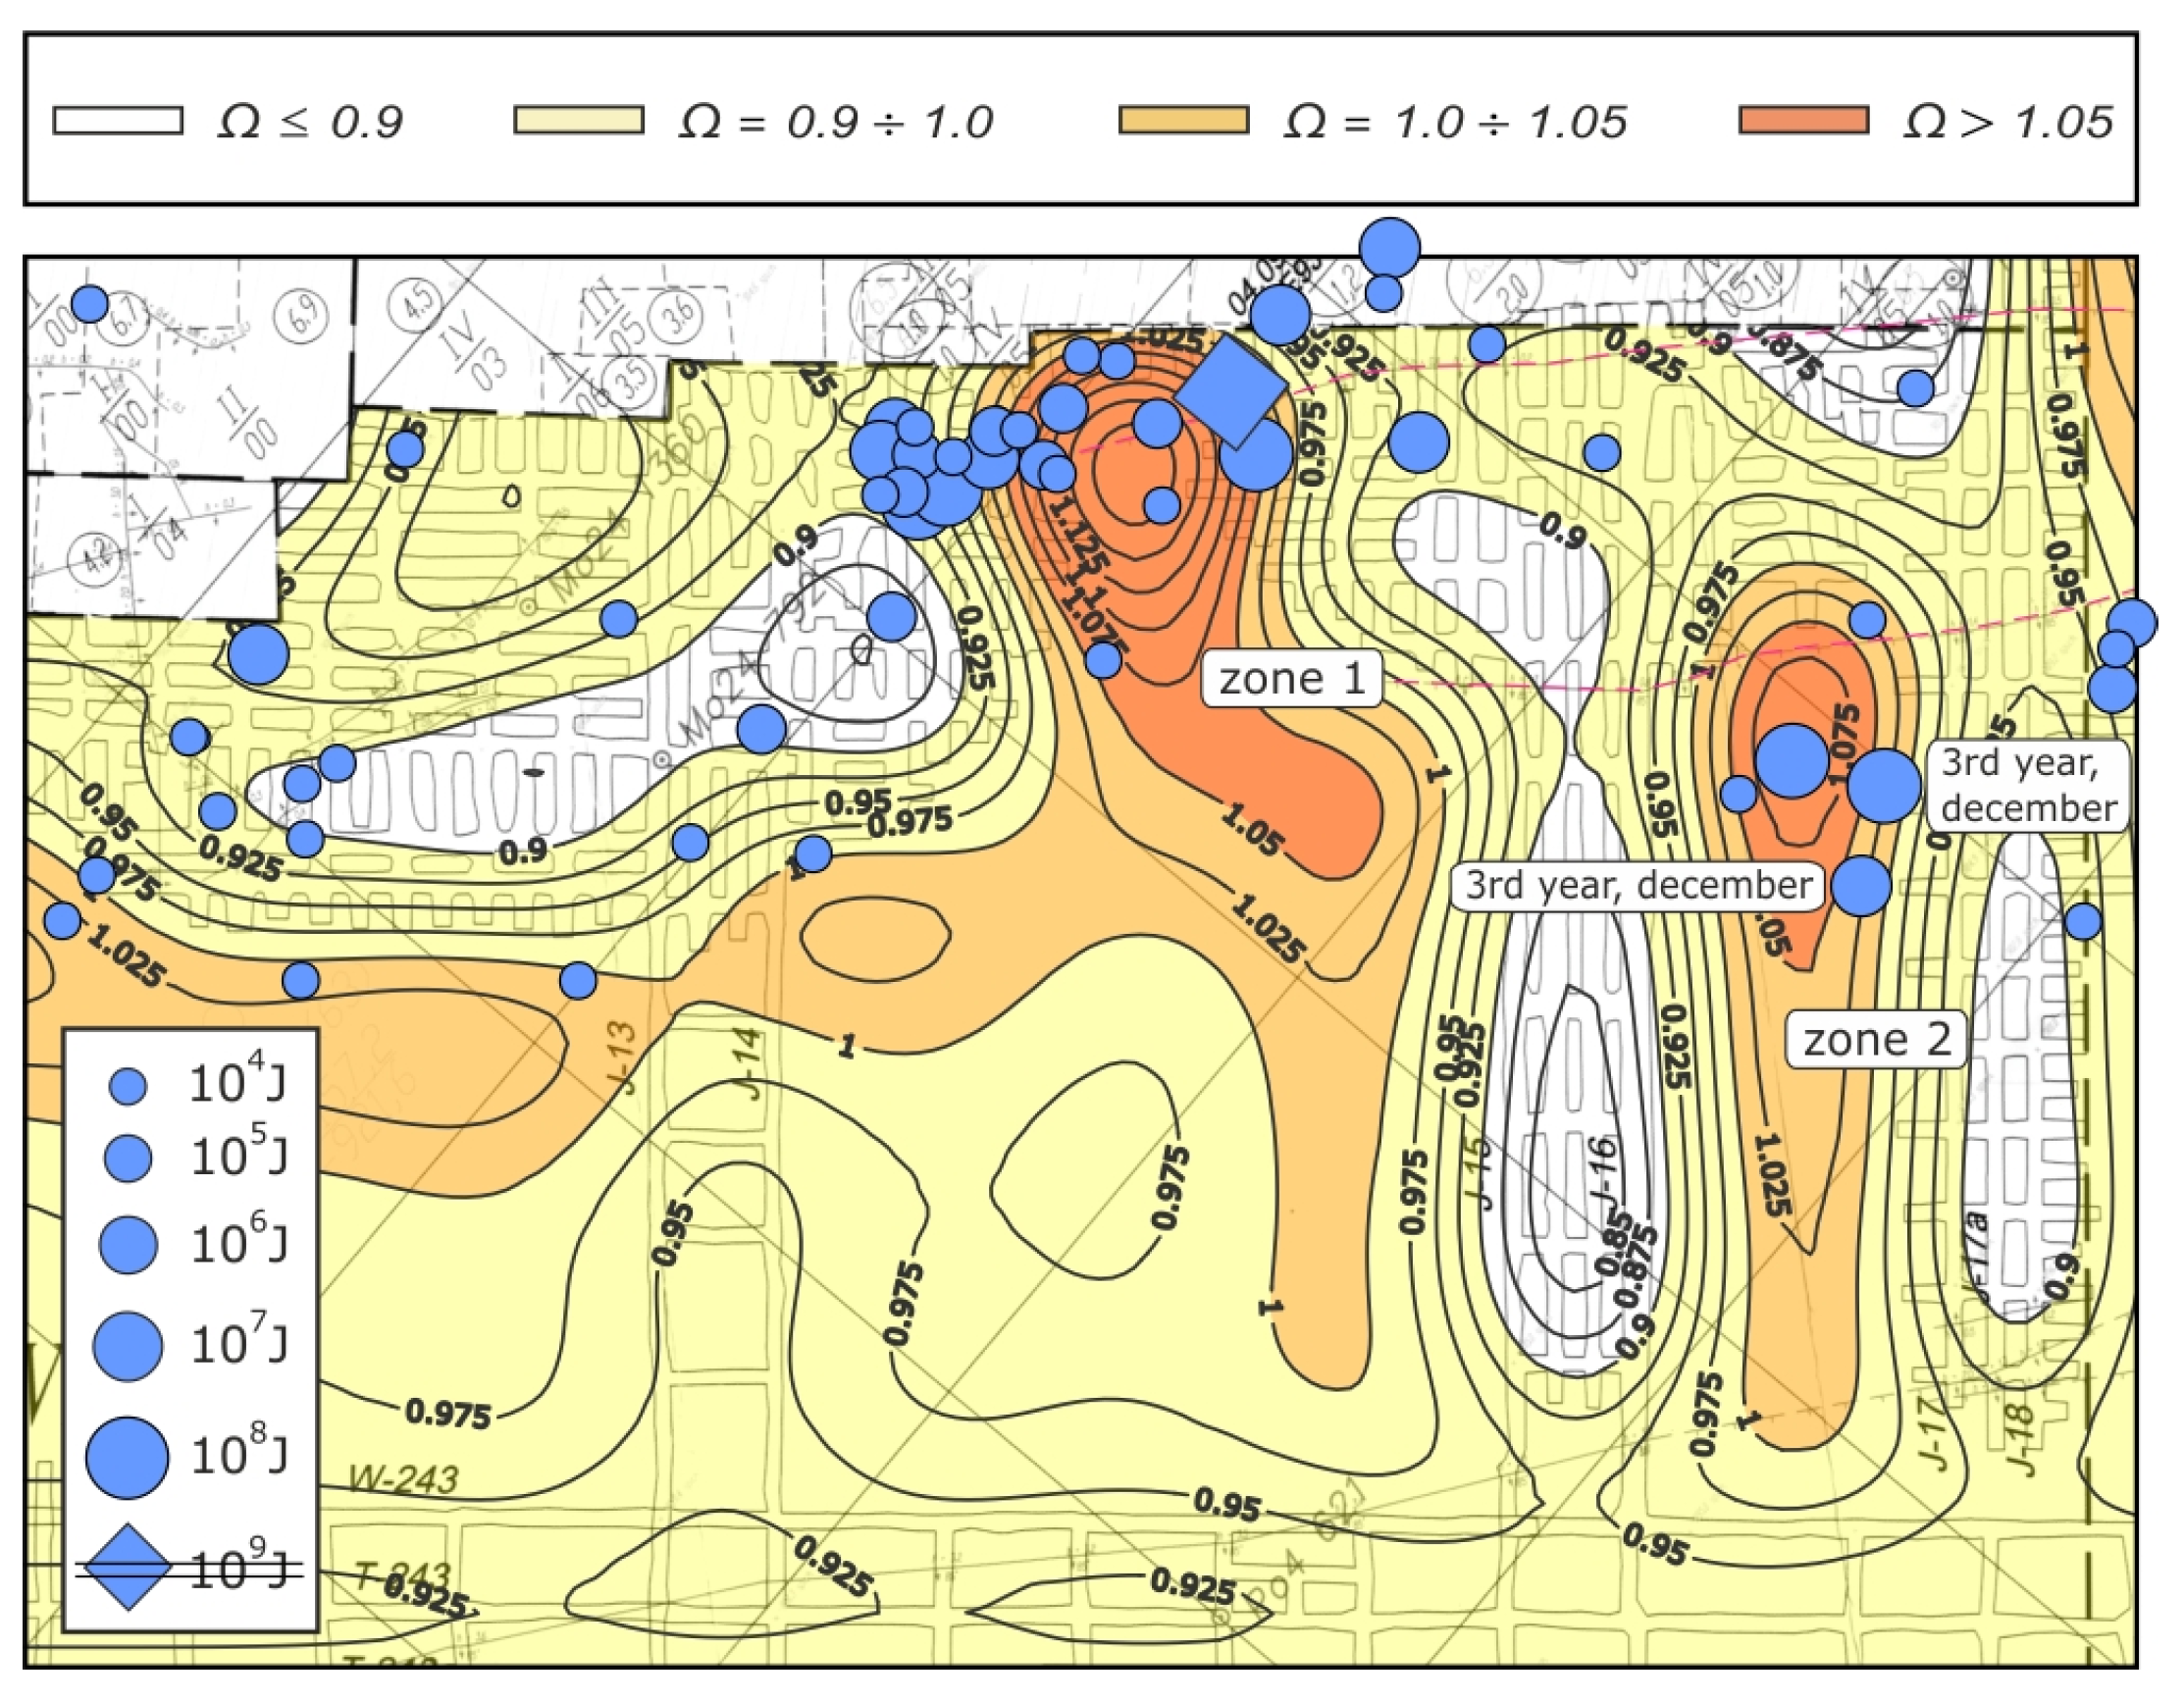
- Effort factor (Ω) related to the same roof horizon, –.
- –
- For the mining conditions as of Year 3 (Figure 6 and Figure 7): on the left-hand side of the advancing face, near the old workings, between the descending galleries J-13/14 and J-15/16 (zone 1) and in the vicinity of development openings in between the descending galleries J-15/16 and J-17/18 (zone 2);
- –
- –
- Vertical roof displacement (deflection) over the development openings and old excavations;
- –
- Areas opened by panelling works in the orebody.
4. Conclusions
- (a)
- The level of mining-induced seismicity during the mining operations was relatively high, showing a gradual increase in quantitative terms, revealing cyclical fluctuations in terms of energy release. Registered rockbursts were triggered by strong tremors whose epicentres were, to a large extent, located in the vicinity of the gob boundary and development works; only in a few cases were they located in the neighbourhood of tectonic faults of small downthrow.
- (b)
- At the time the two analysed rockbursts occurred, the main roof layers with a high rockbursting potential (including the anhydrite layers) were strongly deformed as a result of mining of the adjoining panels and due to the presence of vast areas of development openings and splitting pillars within the working zone in panel XVII/1. Furthermore, the structure of burst-prone formations might have been disturbed by dynamic interactions due to previous mining-induced seismicity, particularly high-energy seismic events.
- (c)
- The zones of shear strain elastic energy density concentration and maximal values of the effort factor derived by numerical modelling are located on the face range, encompassing the areas overlying the uncut sections of the orebody adjacent to old excavations and development sites.
- (d)
- The result of the back analysis and predictions have confirmed that the state of stress and strain in roof strata was nonuniform, locally most unfavourable. In the context of mining-induced seismicity, the anomaly zones in graphic representation would correspond with locations of epicentres of rockburst-triggering tremors.
- (e)
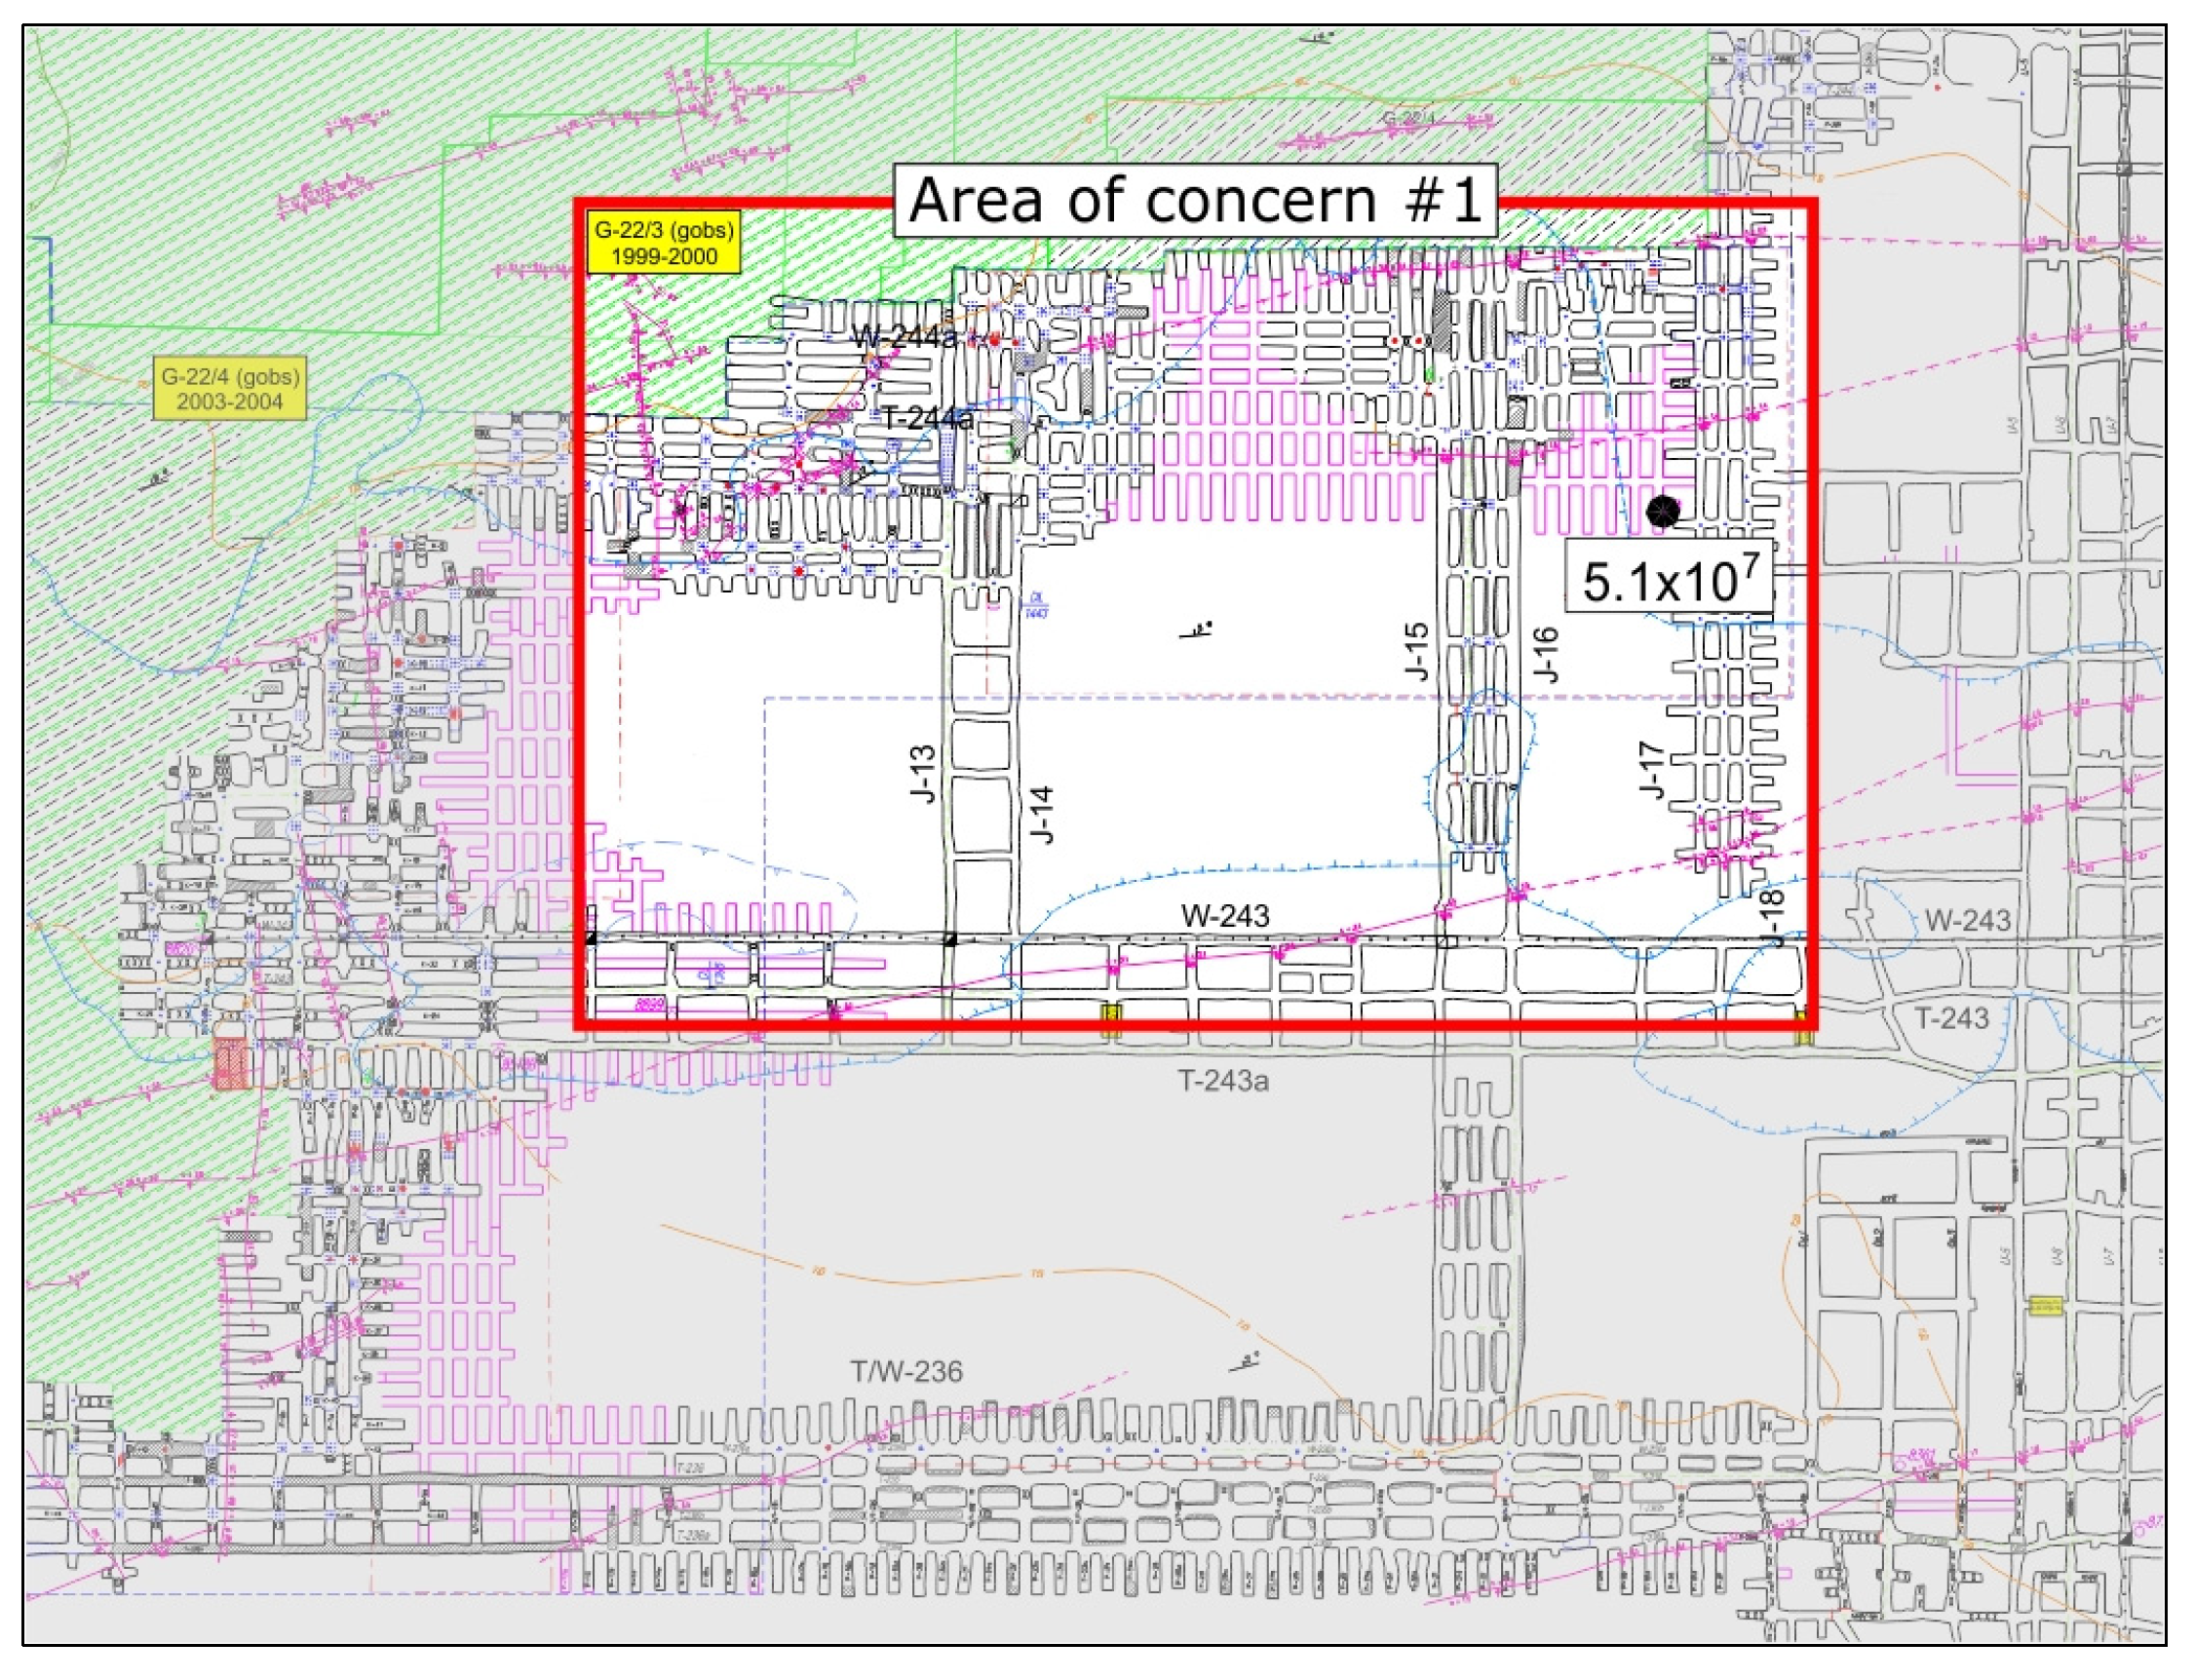
- The two high-energy rockburst events in the energy class of 5.1 × 10⁷ J and 1.5 × 10⁸ J can presumably be attributed to critical efforting of the rock strata due to progressing rock fracturing on the horizon of strongly deformed anhydrite formations. Identification of the underlying causes of these events allowed the plans of further mining operations to be verified accordingly. The implemented technical solutions proved to be justified and produced the desired effects limiting the mining-induced seismicity both in quantitative terms and in terms of energy release.
Author Contributions
Funding
Institutional Review Board Statement
Informed Consent Statement
Data Availability Statement
Conflicts of Interest
References
- Butra, J.; Mrozek, K.; Osadczuk, T. Aktualny Stan Zagrożenia Tąpaniami w Kopalniach KGHM Polska Miedź SA. Prace Naukowe Instytutu Geotechniki i Hydrotechniki Politechniki Wrocławskiej (Konferencje); Oficyna Wydawnicza Politechniki Wrocławskiej: Wrocław, Poland, 2005; Volume 75, pp. 59–74. (In Polish) [Google Scholar]
- Cieślik, J.; Burtan, Z.; Chlebowski, D.; Zorychta, A. Geomechanical analysis of location and conditions for mining-induced tremors in LGOM copper mines. J. Sustain. Min. 2017, 16, 94–103. [Google Scholar] [CrossRef]
- Stec, K. Skala zagrożenia sejsmicznego w Górnośląskim Zagłębiu Węglowym. In Prace Naukowe GiG (Górnictwo i Środowisko); Wydawnictwo Głównego Instytutu Górnictwa: Katowice, Poland, 2007; Volume 3, pp. 55–75. (In Polish) [Google Scholar]
- Patyńska, R.; Mirek, A.; Burtan, Z.; Pilecka, E. Rockburst of parameters causing mining disasters in mines of Upper Silesian Coal Basin. 4th Nationwide Scientific Conference on Engineering-Infrastructure-Mining. E3S Web Conf. 2018, 36, 1–8. [Google Scholar] [CrossRef]
- Knopik, M.; Zuberek, W.; Wojtecki, Ł. Wieloprzyczynowość wysokoenergetycznych wstrząsów górniczych. Przegląd Górniczy 2015, 12, 12–19. (In Polish) [Google Scholar]
- Marcak, H. Modele Rozwoju Deformacji Górotworu Poprzedzającej Tąpnięcie. Badania Geofizyczne w Kopalniach; Wydawnictwo Instytutu Gospodarki Surowcami Mineralnymi i Energią PAN: Kraków, Poland, 2001; pp. 49–57. (In Polish) [Google Scholar]
- Marcak, H. A geophysical model for the analysis of seismic emissions in the area of rock beam splitting caused by mining operations. In International Mining Forum 2006. New Technological Solutions in Underground Mining, Proceedings of the 7th International Mining Forum, Wieliczka, Poland, 20–24 February 2006; Sobczyk, E.J., Kicki, J., Eds.; A.A. Balkema Publishers: London, UK, 2006; pp. 73–86. [Google Scholar]
- Idziak, A.; Teper, L.; Zuberek, W. Sejsmiczność a Tektonika Górnośląskiego Zagłębia Węglowego; Wydawnictwo Uniwersytetu Śląskiego: Katowice, Poland, 1999. (In Polish) [Google Scholar]
- Marcak, H.; Mutke, G. Seismic activation of tectonic stresses by mining. J. Seismol. 2013, 17, 1139–1148. [Google Scholar] [CrossRef]
- Zhou, J.; Li, X.; Mitri, H.S. Evaluation method of rockburst: State-of-the-art literature review. Tunn. Undergr. Space Technol. 2018, 81, 632–659. [Google Scholar] [CrossRef]
- Gibowicz, S.J. Seismicity induced by mining recent research. Adv. Geophys. 2009, 51, 1–53. [Google Scholar]
- Hatherly, P. Overview on the application of geophysics in coal mining. Int. J. Coal Geol. 2013, 114, 74–84. [Google Scholar] [CrossRef]
- Marcak, H. Seismicity in mines due to roof layer bending. Arch. Min. Sci. 2012, 57, 229–250. [Google Scholar]
- Gogolewska, A.; Markowiak, A. Seismic activity and convergence in deep mining field, case study from copper ore mine, SW Poland. In Proceedings of the 28th International Symposium on Mine Planning and Equipment Selection; Topal, E., Ed.; Springer Series in Geomechanics and Geoengineering: Berlin/Heidelberg, Germany, 2019; pp. 508–515. [Google Scholar]
- Barański, A.; Drzewiecki, J.; Dubiński, J.; Kabiesz, J.; Konopko, W. Zasady Stosowania Metody Kompleksowej i Metod Szczegółowych Oceny Stanu Zagrożenia Tapaniami w Kopalniach Wegla Kamiennego; Wydawnictwo Głównego Instytutu Górnictwa: Katowice, Poland, 2012; pp. 15–38. (In Polish) [Google Scholar]
- Das, J.P.; Balasubramaniam, V.R.; Goverdhan, K.; Ganapathy, G.P. Overview of seismic monitoring and assessment of seismic hazard based on a decade of seismic events. In Proceedings of the Conference on Recent Advances in Rock Engineering, Bengaluru, India, 16–18 November 2016; Advances in Engineering Research; Atlantis Press: Amsterdam, The Netherlands, 2016; pp. 557–564. [Google Scholar]
- Cianciara, A.; Cianciara, B. The meaning of seismoacoustic emission for estimation of time of mining tremors occurrence. Arch. Min. Sci. 2006, 51, 563–575. [Google Scholar]
- Kornowski, J.; Kurzeja, J. Prediction of rockburst probability given seismic energy and factors defined by the expert method of hazard evaluation (MRG). Acta Geophys. 2012, 60, 472–486. [Google Scholar] [CrossRef]
- Kołodziejczyk, P.; Kornowski, J.; Gołda, I. Zagrożenie sejsmiczne od wstrząsów górniczych w warunkach niepewnej informacji. Górnictwo I Geol. 2013, 8, 47–60. (In Polish) [Google Scholar]
- Stec, K. Focal mechanisms of mine-induced seismic events an explanation of Geomechanical processes in the area of longwall 6, seam 510 in hard coal mine Bobrek-Centrum. Arch. Min. Sci. 2012, 57, 871–886. [Google Scholar]
- Sen, A.T.; Cesca, S.; Bischoff, M.; Meier, T.; Dahm, T. Automated full moment tensor inversion of coal mining-induced seismicity. Geophys. J. Int. 2013, 195, 1267–1281. [Google Scholar] [CrossRef]
- Cao, A.; Liu, Y.; Chen, F.; Hao, Q.; Yang, X.; Wang, C.; Bai, X. Focal Mechanism and Source Parameters Analysis of Mining-Induced Earthquakes Based on Relative Moment Tensor Inversion. Int. J. Environ. Res. Public Health 2022, 19, 7352. [Google Scholar] [CrossRef]
- Mutke, G.; Pierzyna, A.; Barański, A. b-value as a criterion for the evaluation of rock-burst hazard in coal mines. In Proceedings of the 3rd International Symposium on Mine Safety Science and Engineering (ISMS), Montreal, QC, Canada, 13–19 August 2016; pp. 1–5. [Google Scholar]
- Wesseloo, J. Addressing misconceptions regarding seismic hazard assessment in mines: B-value, Mmax, and space-time normalization. J. South. Afr. Inst. Min. Metall. 2020, 120, 67–80. [Google Scholar] [CrossRef]
- Dubiński, J.; Stec, K.; Krupanek, J. Comprehensive use of the Gutenberg–Richter law and geotomography for improving seismic hazard evaluation in hard coal mines. Int. J. Coal Sci. Technol. 2023, 10, 3. [Google Scholar] [CrossRef]
- Hosseini, N. Evaluation of the rockburst potential in longwall coal mining using passive seismic velocity tomography and image subtraction technique. J. Seismol. 2017, 21, 1101–1110. [Google Scholar] [CrossRef]
- Ma, X.; Westman, E.; Malek, F.; Yao, M. Stress redistribution monitoring using passive seismic tomography at a deep nickel mine. Rock Mech. Rock Eng. 2019, 52, 3909–3919. [Google Scholar] [CrossRef]
- Mutke, G.; Dubiński, J.; Lurka, A. New criteria to assess seismic and rockburst hazard in coal mines. Arch. Min. Sci. 2015, 60, 743–760. [Google Scholar]
- Zhang, W.; Ma, N.; Ren, J.; Li, C. Peak particle velocity of vibration events in underground coal mine and their caused stress increment. Measurement 2021, 169, 108520. [Google Scholar] [CrossRef]
- Lasocki, S.; Orlecka-Sikora, B. Seismic hazard assessment under complex source size distribution of mining-induced seismicity. Tectonophysics 2008, 456, 28–37. [Google Scholar] [CrossRef]
- Wesseloo, J. The spatial assessment of the current seismic hazard state for hard rock underground mines. Rock Mech. Rock Eng. 2018, 51, 1839–1862. [Google Scholar] [CrossRef]
- Pu, Y.; Apel, D.B.; Liu, V.; Mitri, H. Machine learning methods for rockburst prediction-state-of-the-art review. Int. J. Min. Sci. Technol. 2019, 29, 565–570. [Google Scholar] [CrossRef]
- Cichy, T.; Prusek, S.; Świątek, J.; Apel, D.B.; Pu, Y. Use of neural networks to forecast seismic hazard expressed by number of tremors per unit of surface. Pure Appl. Geophys. 2020, 177, 5713–5722. [Google Scholar] [CrossRef]
- Kabiesz, J.; Makówka, J. Selected elements of rock burst state assessment in case studies from the silesian hard coal mines. Min. Sci. Technol. 2009, 19, 660–667. [Google Scholar] [CrossRef]
- Lin’kov, A.M. Numerical modeling of seismic and aseismatic events in geomechanics. J. Min. Sci. 2005, 41, 14–26. [Google Scholar] [CrossRef]
- Pytel, W.; Mertuszka, P.; Jones, T.; Paprocki, H. Numerical simulations of geomechanical state of rock mass prior to seismic events occurrence—Case study from a Polish Copper Mine aided by FEM 3D approach. In Proceedings of the 27th International Symposium on Mine Planning and Equipment Selection; Widzyk-Capehart, E., Hekmat, A., Singhal, R., Eds.; Springer: Berlin/Heidelberg, Germany, 2018; pp. 417–427. [Google Scholar]
- Małkowski, P.; Niedbalski, Z. A comprehensive geomechanical method for the assessment of rockburst hazards in underground mining. Int. J. Min. Sci. Technol. 2020, 30, 345–355. [Google Scholar] [CrossRef]
- Dymek, F. Przemieszczeniowe zadanie brzegowe przestrzennej teorii sprężystości i jego zastosowanie do zagadnień mechaniki górotworu. Arch. Min. Sci. 1969; XIV, 263–280. (In Polish) [Google Scholar]
- Gil, H. The Theory of Strata Mechanics; Wydawnictwo PWN: Warszawa, Poland, 1991. [Google Scholar]
- Ozog, T. Ugięcie Stropu Przy Uwzględnieniu Sił Ścinających; Zeszyty Problemowe Górnictwa PAN: Kraków, Poland, 1965; Volume 3, pp. 45–79. (In Polish) [Google Scholar]
- Budryk, W. Stan naprężeń w górotworze pod wpływem wyeksploatowania pokładu. Arch. Górnictwa I Hut. 1955, 4, 90–102. (In Polish) [Google Scholar]
- Sałustowicz, A. Zarys Mechaniki Górotworu; Wydawnictwo Śląsk: Katowice, Poland, 1968. (In Polish) [Google Scholar]
- Knothe, S. Prognozowanie Wpływów Eksploatacji Górniczej; Wydawnictwo Śląsk: Katowice, Poland, 1984. (In Polish) [Google Scholar]
- Sih, G.C. Methods of analysis and solutions of crack problems. Recent developments in fracture mechanics. Theory and methods of solving crack problems. In Mechanics of Fracture; Noordhoff International Publishing: Leyden, IL, USA, 1973; Volume 1. [Google Scholar]
- Kłeczek, Z. Geomechanika Górnicza; Wydawnictwo AGH: Warszawa, Poland, 1985; no 1000. (In Polish) [Google Scholar]
- Chlebowski, D. Energetyczna Ocena Możliwości Wystąpienia Procesów Pękania w Utworach Anhydrytowych na Przykładzie Oddziału G-22 O/ZG Rudna. Prace Naukowe GiG (Górnictwo i Środowisko); Wydawnictwo Głównego Instytutu Górnictwa: Katowice, Poland, 2011; Volume 4, pp. 43–51. (In Polish) [Google Scholar]
- Szeptyński, P. Some remarks on Burzyński’s failure criterion for anisotropic materials. Eng. Trans. 2011, 59, 119–136. [Google Scholar]


| Rock Layer | Rc [MPa] | Es [GPa] | ν [–] |
|---|---|---|---|
| Roof (25 m rock package) | 108.9–129.2 | 33.5–59.1 | 0.15–0.28 |
| Orebody zone | 57.8–77.6 | 16.7–19.0 | 0.13–0.24 |
| Floor (6 m rock package) | 21.3–26.5 | 10.0–16.4 | 0.12–0.18 |
| Year | 103 J | 104 J | 105 J | 106 J | 107 J | 108 J | ΣN [–] | ΣE [J] | ΣEw/Nw [J] |
|---|---|---|---|---|---|---|---|---|---|
| 1st | 15 | 10 | 6 | 2 | 1 | 1 | 35 | 2.63 × 10⁸ | 2.62 × 10⁷ |
| 2nd | 96 | 40 | 19 | 10 | 4 | -- | 169 | 1.25 × 10⁸ | 3.73 × 10⁶ |
| 3rd | 164 | 62 | 36 | 13 | 7 | 1 | 283 | 3.46 × 10⁸ | 6.04 × 10⁶ |
| 4th | 234 | 87 | 30 | 18 | 3 | -- | 372 | 1.58 × 10⁸ | 3.04 × 10⁶ |
| 5th | 241 | 92 | 39 | 15 | 9 | -- | 396 | 2.70 × 10⁸ | 4.22 × 10⁶ |
| 6th | 162 | 56 | 20 | 5 | 5 | 1 | 249 | 2.91 × 10⁸ | 9.32 × 10⁶ |
| Σ/av. | 912 | 347 | 150 | 63 | 29 | 3 | 1504 | 1.45 × 10⁹ | 5.89 × 10⁶ |
| Year | 103 J | 104 J | 105 J | 106 J | 107 J | 108 J | ΣN [–] | ΣE [J] | ΣEw/Nw [J] |
|---|---|---|---|---|---|---|---|---|---|
| 7th | 29 | 14 | 5 | 6 | 1 | -- | 55 | 4.71 × 10⁷ | 3.87 × 10⁶ |
| 8th | 27 | 6 | 1 | 2 | -- | -- | 36 | 1.50 × 10⁷ | 4.93 × 10⁶ |
| 9th | 38 | 15 | -- | 2 | -- | -- | 55 | 5.46 × 10⁶ | 2.45 × 10⁶ |
| 10th | 36 | 13 | 7 | 3 | -- | -- | 59 | 7.29 × 10⁶ | 6.72 × 10⁵ |
| Σ/av. | 130 | 48 | 13 | 13 | 1 | -- | 205 | 7.49 × 10⁷ | 2.70 × 10⁶ |
Disclaimer/Publisher’s Note: The statements, opinions and data contained in all publications are solely those of the individual author(s) and contributor(s) and not of MDPI and/or the editor(s). MDPI and/or the editor(s) disclaim responsibility for any injury to people or property resulting from any ideas, methods, instructions or products referred to in the content. |
© 2024 by the authors. Licensee MDPI, Basel, Switzerland. This article is an open access article distributed under the terms and conditions of the Creative Commons Attribution (CC BY) license (https://creativecommons.org/licenses/by/4.0/).
Share and Cite
Chlebowski, D.; Burtan, Z. Geomechanical Analysis of the Main Roof Deformation in Room-and-Pillar Ore Mining Systems in Relation to Real Induced Seismicity. Appl. Sci. 2024, 14, 5710. https://doi.org/10.3390/app14135710
Chlebowski D, Burtan Z. Geomechanical Analysis of the Main Roof Deformation in Room-and-Pillar Ore Mining Systems in Relation to Real Induced Seismicity. Applied Sciences. 2024; 14(13):5710. https://doi.org/10.3390/app14135710
Chicago/Turabian StyleChlebowski, Dariusz, and Zbigniew Burtan. 2024. "Geomechanical Analysis of the Main Roof Deformation in Room-and-Pillar Ore Mining Systems in Relation to Real Induced Seismicity" Applied Sciences 14, no. 13: 5710. https://doi.org/10.3390/app14135710
APA StyleChlebowski, D., & Burtan, Z. (2024). Geomechanical Analysis of the Main Roof Deformation in Room-and-Pillar Ore Mining Systems in Relation to Real Induced Seismicity. Applied Sciences, 14(13), 5710. https://doi.org/10.3390/app14135710