Article

Evaluation of Air Pollution Levels in Agricultural Settings Using Integrated Weather Variables and Air Pollutants

by
Saad S. Almady
1,
Saleh M. Al-Sager
1,
Abdulrahman A. Al-Janobi
1,
Samy A. Marey
2 and
Abdulwahed M. Aboukarima
1,*
1
Department of Agricultural Engineering, College of Food and Agriculture Sciences, King Saud University, P.O. Box 2460, Riyadh 11451, Saudi Arabia
2
Deanship of Scientific Research, King Saud University, P.O. Box 2460, Riyadh 11451, Saudi Arabia
*
Author to whom correspondence should be addressed.
Appl. Sci. 2024, 14(13), 5713; https://doi.org/10.3390/app14135713
Submission received: 6 June 2024 / Revised: 26 June 2024 / Accepted: 28 June 2024 / Published: 29 June 2024

Abstract

:
Research on the quality of the air in rural areas is essential for determining base emissions of air pollutants, evaluating the effects of dust pollutants particular to rural areas, modeling the dispersion of pollutants, and developing appropriate pollution mitigation systems. The absence of a systematic review based on the assessment of air quality levels in agricultural settings based on integrated weather variables and air pollutants in the literature draws attention to the deficiencies and the necessity of further research in this area. Hence, our study aimed to develop an Arduino monitoring system with related sensors to acquire some air pollutants and weather parameters. Additionally, we proposed an innovative solution to compare air quality levels by suggesting a new criterion called an integrated indicator for air quality assessment (IAQA). It was created based on the weighted average method to combine the investigated air pollutants and weather parameters. This criterion was evaluated while conducting field measurements in 29 environmentally different agricultural regions located within the Kingdom of Saudi Arabia. To determine the integrated indicator, all the values of the variables were normalized between 0 and 1. The agricultural setting with the lowest integrated indicator was the best environmentally. The lowest and highest values of the integrated indicator ranged from 37.03% and 66.32%, respectively, with an arithmetic average of 48.24%. The developed criterion can change its value depending on the change in the weight value of the variables involved, and it is suitable for application to any other agricultural or non-agricultural setting to evaluate the pollution level in the air. Although similar research has been published, this paper presents novelty findings based on integrated values of air pollutants and weather variables for defining a new criterion called IAQA. Additionally, this paper presents original results for air pollutants and weather aspects in different agricultural settings.

1. Introduction

Environmental issues related to pollution have become more important; this is particularly the case with air pollution in the indoor environment because most individuals spend about 90% of their time indoors [1]. Nonetheless, environmental contamination is a major concern for the majority of developing countries worldwide [2]. Human health, ecosystems, and financial development are all at risk because of environmental deterioration, including noise, air, water, and land pollution [3].
Researchers and governments everywhere are deeply concerned about the causes of health issues and their associated expenses. To alleviate these concerns, it is crucial to consider air pollution and other forms of environmental pollution. One major factor driving rising healthcare expenses is air pollution [4]. To gauge the degree of environmental contamination, numerous studies have already looked into the physical and chemical characteristics of the contaminated soil, water, and air [5]. Furthermore, there are many different sources, forms, and consequences of the contamination that farming produces, but one of the most common and significant is air pollution [6]. Agriculture can pollute the air in a number of ways, such as by using heavy machinery, burning crop residues, raising animals, applying fertilizers, and raising poultry and birds. In agriculture production, different pesticides are utilized, which can pollute the air. In addition to lowering air quality, these activities may also be a factor in global warming and climate change [6]. To reduce the environmental impacts resulting from agricultural actions, we must understand the behavior of agricultural emissions and the subsequent transformations. This can be achieved by conducting actual measurements of the emissions that cause a reduction in air quality in the agricultural environment. The purpose was to determine what should be performed to improve the quality while taking into consideration the diversity of agricultural actions. However, agricultural settings are affected by environmental factors such as ambient temperature and relative humidity, so it is important to monitor these variables in the environment by making effective use of modern technologies in designing and implementing systems that can monitor these variables.
Monitoring air quality in different places through various sensors in portable devices is a new area of research [7], especially concerning the capabilities that enable the design, deployment, and management of such sensors, which can measure gaseous and non-gaseous air pollutants. For the monitoring of air quality in areas with large population densities, making real-time data available to decision-makers is important and beneficial [8]. Some researchers have attempted to use Arduino boards and related sensors to monitor air pollutants and meteorological variables [9,10]. Air pollutants, which can be measured by sensors that can be linked to an Arduino board, are carbon monoxide (CO), which can be detected by the MQ7 sensor [11,12,13]. Moreover, dust concentration in the air can be detected by Sharp’s optical dust sensor, GP2Y1010AU0F, which can be linked to an Arduino board [12,14]. Additionally, weather variables of the surroundings, such as air temperature and relative humidity, can also be monitored using related sensors of DHT11 [15,16,17]. Moreover, air pressure can be detected using the BMP180 Barometric Pressure Sensor [17,18]. All these sensors measure the pollutants and weather variables in the air and generate real-time data, which can either be seen on a computer or an Android device using the Bluetooth module [12].
Research on air quality in rural areas is essential for determining base emissions of air pollutants, evaluating the effects of dust pollutants particular to rural areas, modeling the dispersion of pollutants, and developing appropriate pollution mitigation systems. The absence of a systematic review based on the assessment of the approaches and procedures used for the evaluation of air quality levels in agricultural settings in the literature draws attention to the deficiencies and the necessity of further research in this area [19]. The air quality was based only on parameters related to air pollutants, and it neglected the effect of weather parameters such as air temperature, air relative humidity, and atmospheric pressure. Considering these limitations in the literature, the research problem for this study can be summarized as follows: In light of the quest to provide the best environment within agricultural spaces, how can modern technological means contribute to the measurement and monitoring of air quality in the agricultural environment and to the enhancement of air quality in the agricultural environment. The importance of this study from an applied perspective is that it may contribute to scientific efforts aimed at measuring air pollutants in agricultural settings. It may also contribute to the opening of new horizons for conducting further research aimed at predicting air quality standards, which may be useful in preserving the environment; this research would add information that may help in detecting the levels of pollution in various agricultural environments in the Kingdom of Saudi Arabia or other places with similar conditions. This study contributes to the literature in two ways. (1) This study utilizes a large sample covering different agricultural environments to reflect the general circumstances in agricultural settings. (2) This research further examines the possible moderating effects of the integration between climate factors and some air pollutants on the level of air quality in different agricultural settings.
Kaur et al. [20] used sensors to measure the levels of carbon dioxide and carbon monoxide, temperatures, and relative humidity in the environment; these readings were transmitted to a smartphone that gave a warning message if the measured levels were higher than the recognized limit. A study by Husain et al. [12] used the GP2Y1010AU0F sensor to determine the concentration of dust particles in the air. The sensor was connected to an Arduino Mega 2560 board, and data could be transferred to an Android phone using a Bluetooth connection with a device or computer through the COM port. Balta et al. [21] used a sensor to measure carbon dioxide levels in classrooms with a Raspberry PI board. Temperatures and relative humidity were also measured with their sensors, and the readings were transferred to a site on a server connected to the internet, where the user could view the air quality inside the classroom. They showed that the developed system was low-cost.
Gunawan et al. [22] showed that there has been an increasing public awareness of real-time air quality recently because air pollution can have serious impacts on human health and the environment. In their study, they presented a cost-effective and portable air quality measurement system using an Arduino Uno microcontroller and four low-cost sensors. This device allows the concentration of carbon monoxide, ground-level ozone, and particulate matter (PM10 and PM2.5) in the air to be measured anywhere. In their study, Biswal et al. [15] showed that the Raspberry Pi microcontroller, to which different sensors such as the MQ7 and DHT11 and dust density sensors were connected, plays an important role in checking the status of the environment. It detects the level of carbon dioxide and carbon monoxide, temperature, relative humidity, and dust particles present in the environment. Furthermore, probe data were stored and digitally analyzed when necessary, and various results were extracted. In a study by Taştan [23], sensors were used to measure carbon monoxide and carbon dioxide levels, dust density, and nitrogen oxide concentration. These sensors were connected to an Arduino board, and the measurements were used to determine air quality; these data were sent to a smartphone.
For use in time series studies of acute health consequences, a robust methodology was devised to compute population-weighted daily measurements of ambient air pollution [24]. Therefore, the present study aimed to develop a portable device to quantify the amount of air contaminants in the atmosphere, which were measured using an MQ7 sensor and a GP2Y1010AU0F sensor; however, all sensors were linked to an Arduino board. Moreover, weather variables were measured by a DHT11 temperature and relative humidity sensor and a BMP180 barometric pressure sensor. Additionally, this study aimed to develop an integrated indicator of the air quality pollution level called an integrated indicator for air quality assessment (IAQA). It was dependent on weather variables and other variables related to air quality. The IAQA can be used to compare agricultural environments in terms of their air quality. The calculation depends on the value of the weight assigned to each of the variables, such as carbon monoxide concentration, dust concentration in the air, air temperature, air relative humidity, and atmospheric pressure. These variables were measured using sensors connected to an Arduino board. The novel aspect is to link indicators of air pollutants to meteorological parameters for the development of a new criterion, represented by the Integrated Indicator for Air Quality Assessment (IAQA). It was also proposed that the indexes of air pollutants and climatic parameters be linked to assess air quality under certain agricultural conditions. Finally, it also reports new outcomes on the integration of different types of farm activities with air pollutants and weather parameters, thus showing their contribution to the levels of air quality. Hence, the novel methodology serves as a contribution to the existing literature as it gives new insight into the estimate and improvement of air quality in agricultural environments.

2. Materials and Methods

2.1. Laboratory Procedures

Various units make up the air quality monitoring system. A regulator and a DC jack make up the power supply unit, which is the first unit. The control unit included a preprogrammed Arduino Mega 2560 microcontroller.
However, there are no special versions of Arduino boards released in specific geographical regions. All Arduino boards are assembled in Italy.
The Arduino Mega is powered by the ATmega2560 processor. The board has 54 inputs/outputs (14 of which can be used as Pulse-Width Modulation outputs), 16 analog inputs, 4 Universal Asynchronous Receiver-Transmitter, a 16 MHz quartz, a USB connection, a power supply socket, an In-Circuit Serial Programming) port, and a reset button [25]. It serves as the system’s brain, carrying out the mathematical calculations required to compare the analog signals from the sensors with the preset value. This microcontroller also coordinates tasks with other parts of the system. A real-time clock and an integrated communication interface were used with an Arduino board.
The concentration of air contaminants in the atmosphere was shown on a 16 × 2 LCD monitor. However, the units of the air quality monitoring system were put together in a plastic box with ventilation holes built into it that act as a window to allow air in. In addition, a smartphone was used to obtain the site’s geographical coordinates. The Integrated Development Environment (IDE) of the Arduino, which has a wealth of code libraries for creating measurement and control systems, is one of its advantages. The Arduino.cc-introduced IDE is an official program used primarily for editing, building, and uploading code to the Arduino device. The Arduino IDE 2 was used to implement the software for this study. Additionally, IDEwas used for coding, setting up, and testing the components. Kelechi et al. [26] outline the software configuration steps. Figure 1 depicts the parts and steps involved.
The sensing unit to quantify the amount of air contaminants in the atmosphere was measured using an MQ7 sensor to determine carbon monoxide concentration in the air and a sharp GP2Y1010AU0F sensor to measure dust density. Moreover, the sensing unit also had sensors to measure weather variables; however, a DHT11 sensor was used to measure temperature and relative humidity in the air, and a BMP180 sensor was used to measure barometric pressure in the air.
The MQ7 gas sensor was used to measure the amount of carbon monoxide present in the atmosphere. The MQ7 gas sensor operates in the temperature range of −20 to 50 °C. This sensor requires less than 150 mA of electricity at a 5 V rating and is capable of accurately detecting gas concentrations ranging from 100 to 10,000 ppm [27].
The Sharp GP2Y1010AU0F sensor is a common selection for low-cost particle matter monitoring because of its high obtainability and simple interfacing [28]. The manufacturer’s documentation [29] describes the basic interfacing of the sensor. However, the sensor description can be seen in [28]. More information about the assembly and process principle of the Sharp GP2Y1010AU0F sensor was provided in an earlier study [30]. The GP2Y1010AU0F sensor comprises an infrared light-emitting diode transmitter, a photodiode receiver, and an amplifier circuit [28]. The manufacturer’s directions on the understanding of the sensor readout are established in the datasheet [29]. The voltage at that particular moment can be converted to a concentration in μg/m3 in a chart given in the datasheet [29]. As specified by the manufacturer, the sensitivity of the Sharp GP2Y1010AU0F sensor is (0.5 V/0.1 mg/m3) [31].
Barometric pressure (also known as atmospheric pressure) is the pressure caused by the weight of air pressing down on the Earth. This pressure varies with both altitude and weather. Barometric pressure will change according to local weather conditions, but it will also change depending on our altitude. The BMP180 sensor is regularly used to measure atmospheric pressure. It is manufactured by Bosch Sensortec company. The BMP180 sensor is a piezoresistive sensor that detects pressure. Piezoresistive sensors are made up of a semiconducting material (usually silicon) that alters resistance when a mechanical force, such as atmospheric pressure, is applied [32].
The manufacturer provides datasheets and libraries to help with a BMP180 sensor integration. The BMP180 can deliver exact pressure measurements with a resolution of up to 0.01 hPa (hectopascals) [32]. The BMP180 sensor has a measuring range from 300 to 1100 hPa [32].
The DHT11 comprises two sensors: a temperature sensor and a humidity sensor. Its temperature readings range from 0 to 50 °C, and its humidity readings range from 20 to 90%. The sensor for measuring air temperature and air relative humidity has a simple 3-pin connection, enabling programming and connectivity with other sensors. It has two power supply pins and one pin for data decoding between the sensor and the Arduino board [33]. DHT11 sensor is small and has an operating voltage of 3 to 5 V.

2.2. Sensors Calibration and Software Implementation

When using the MQ sensors for the first time, it needs to be calibrated. The MQ sensor datasheet describes the ppm ratio using the terms Rs/Ro, where Rs is the internal resistance of the MQ sensor in time, and Ro is the value of Rs in clean air. The datasheets have graphs of MQ sensor performance for some gases using the Rs/Ro ratio, allowing information to be acquired on how to measure each type of gas [34].
Analyzing the various sensitivity curves given in the relevant datasheets of MQ sensors is a necessary step in the sensor calibration procedure [35]. MQ7 sensor (Hanwei Electronics CO., Ltd., Zhengzhou, China) has a sensitivity curve where the x-axis is the detected concentration of the CO gas in parts per million (ppm), while the y-axis is the voltage that the sensor receives. In this study, we derived an equation (Equation (1)) using Plotdigitizer software (version 2.6.8), which is an online data extraction tool that allows users to extract data from images in numerical format; however, it is inserted into a code to obtain the values of concentration of the CO gas directly in ppm unit:
CO_ppm_1 = 2.6357 × exp(1.0994 × ((CO_rawValue_1 × 5)/1023))
Using the sensitivity curve of the Sharp GP2Y1010AU0F sensor (Manufacturer: SHARP/Socle Technology), where the x-axis is the detected concentration of the dust in mg/m3, while the y-axis is the output voltage (V), the values of dust concentration were directly obtained as the sampled voltage correlated to the dust density [28]. Thus, the Sharp GP2Y1010AU0F sensor was calibrated according to the chart given in its datasheet [29] as we wrote the following codes (Equations (2) and (3)) to obtain the values of dust density directly in μg/m3
calcVoltage = vo Measured × (5.0/1024)
Dust Density = 170 × calc Voltage − 0.1
Each BMP180 sensor (Brand: Bosch Sensortec) is separately calibrated during manufacturing [36], and these calibration data are stored in the sensor’s onboard memory. However, 1013.25 hPa is the standard sea-level pressure. However, all barometric pressure values reported by news and weather stations add a certain amount of pressure to the readings to make it appear that the measurement was taken from sea level [32].
The temperature and humidity sensors were calibrated after being mounted on top of the Arduino board to ensure that they were operating correctly. For the DHT11 temperature and relative humidity sensor (Manufacturer: Winson), a commercial Testo 625 device (Testo SE & Co., Titisee-Neustadt, Germany) was used to measure air temperature and humidity and to compare the values with those that were read from the developed device. Measurements were made for half an hour. The calibration formulas for temperature and relative humidity were inserted into the Arduino programming to obtain the readings of temperature and relative humidity directly.
To verify the readings from the weather sensors in this study, the average values from the meteorological stations on the web pages for the values of air temperature, atmospheric pressure, and air relative humidity were compared with the general average of the actual measurements using the developed device and the relative error (RE, %) was computed as follows:
R E ( % ) = A V W V A V × 100
where AV is reading from the developed device, and WV is the reading from the web pages for the investigated locations.

2.3. Experimental Agricultural Settings

The experiments were conducted in different agricultural settings located in the Kingdom of Saudi Arabia. We chose just agricultural settings because there are different research papers focused on the air pollutants in urban environments, and in the literature, the air pollutant levels in agricultural settings are uncommon. The description and geographical coordinates of the agricultural settings, the measurement times (start and end), the measurement dates, the description of agricultural actions, the experimental periods, and the No. of recorded data items are shown in Table A1 in Appendix A. The investigated agricultural settings had different actions, such as raising animals, applying fertilizers, and raising birds. The agricultural settings were located in different areas of the Kingdom of Saudi Arabia, such as the Riyadh, Shaqra, Al-Taiff, Al-Kharj, and Al-Zulfi regions. It is clear that the agricultural actions differed, as sheep farms were three denotes by F1, F10, and F22. Animal and bird farms were denoted by camel pastures (F2), dairy cows (F4), duck farms (F7), and typical and traditional pigeon farms (F8, F24, and F9), respectively. Fish farms are denoted by F5 and F6. However, other farm activities belong to agricultural production, such as palm farms (F11), vegetable farms (F25, F26, and F28), greenhouses for tomatoes (F12), cucumbers (F13), eggplants (F14 and F18), seeds (F16), bell peppers (F17), and strawberries (F21). For open farms, the agricultural actions included pomegranate farms (F19), corn farms (F20), vineyards (F24), Persian fig farms (F29), and finally, public gardens (F3). Furthermore, the investigation sites were located between 40.31968 N° and 47.19306 N° and between 21.12037 °E and 26.17933 °E. Moreover, the experimental period was between 20 December 2021 and 16 July 2022. Furthermore, measurement times were different; some measurements were taken in the morning, and others were taken around 1.00 pm. Additionally, Figure 2 shows some images of the agricultural activities in this research; these included a sheep farm (F1), a camel pasture (F2), fish tanks for fattening (F6), and a duck farm (F7).

2.4. Derivation of Integrated Indicator of Air Quality

The integrated indicator for air quality assessment (IAQA) was developed to compare the selected agricultural settings based on the measured variables. The calculations were performed using a Microsoft Excel spreadsheet. Initially, to develop the IAQA, the readings had to be modified as their units of measurement were different. To adjust the readings between zero and one, Equation (5) was used [37].
X N = X i X m i n ( X m a x X m i n )
where XN is the normalized reading value, Xi is the original reading value, Xmin is the lowest value among the original readings for one variable, and Xmax is the largest value among the original readings for one variable. This method (Equation (5)) gives no dimension to these original data. Additionally, the rationale behind the assigned weights to each variable should be elaborated upon to justify their selection. A weight of 1 to 5 was assigned to each variable, depending on its importance. Additionally, the rationale behind the assigned weights to each variable should be elaborated upon to justify their selection. A weight of 5 was used for the dust concentration (particulate matter) in the air because of its major role in pollution; however, particulate matter is an important parameter in determining air quality, affecting visibility [38], human health [39,40], and global climate [41]. However, particles vary in size, shape, and composition. Moreover, particulate matter is the most commonly monitored indoor air pollutant, which is defined as a mixture of solid or liquid particles suspended in air [42]. Additionally, a weight of 4 was used for the carbon monoxide concentration as CO is produced indoors by combustion sources (cooking and heating) and is also introduced through the infiltration of carbon monoxide from outdoor air into the indoor environment [43,44]. Moreover, a weight of 2 was used for the air temperature variable and a weight of 3 for the air relative humidity. Finally, a weight of 1 was used for the atmospheric pressure. According to the IAQA values, the environment with the lowest value is the best environmentally, and the equation that calculated the IAQA is as follows:
I A Q A = ( i = 1 n ( X N D × 5 + X N C O × 4 + X N R H × 3 + X N T × 2 + X N P × 1 ) 5 + 4 + 3 + 2 + 1 ) × 100
Then, the arithmetic average of the IAQA (%) is averaged over the monitoring period.
Where XND is the reading value after adjusting for the dust concentration in the air; XNCO is the reading value after adjusting for the carbon monoxide concentration; XNRH is the reading value after adjusting for the air relative humidity; XNT is the reading value after adjusting for the air temperature; XNP is the reading value after adjusting for the variable of atmospheric pressure, and n is the number of reads per site. In a previous study, the weighted linear combination method was used by Yin et al. [45] to assess the appropriateness of agricultural land.

3. Results and Discussion

3.1. Evaluation Example

The IAQA can be determined as shown in Table A2 in Appendix A, which presents raw data of parameters for farms numbered F1, where the number of readings was 44. It is clear from Table A2 that the average values of air relative humidity, air temperature, atmospheric pressure, dust concentration in the air, and CO were 39.55%, 21.40°, 945.69 hPa, 167.66 μg/m3, and 13.81 ppm, respectively. Moreover, Table A3 in Appendix A shows normalized data according to Equation (5) of the parameters for the farms numbered F1, where the number of readings was 44. Furthermore, Table A4 in Appendix A depicts the normalized data multiplied by the corresponding parameters for the farms numbered F1, where the number of readings was 44.

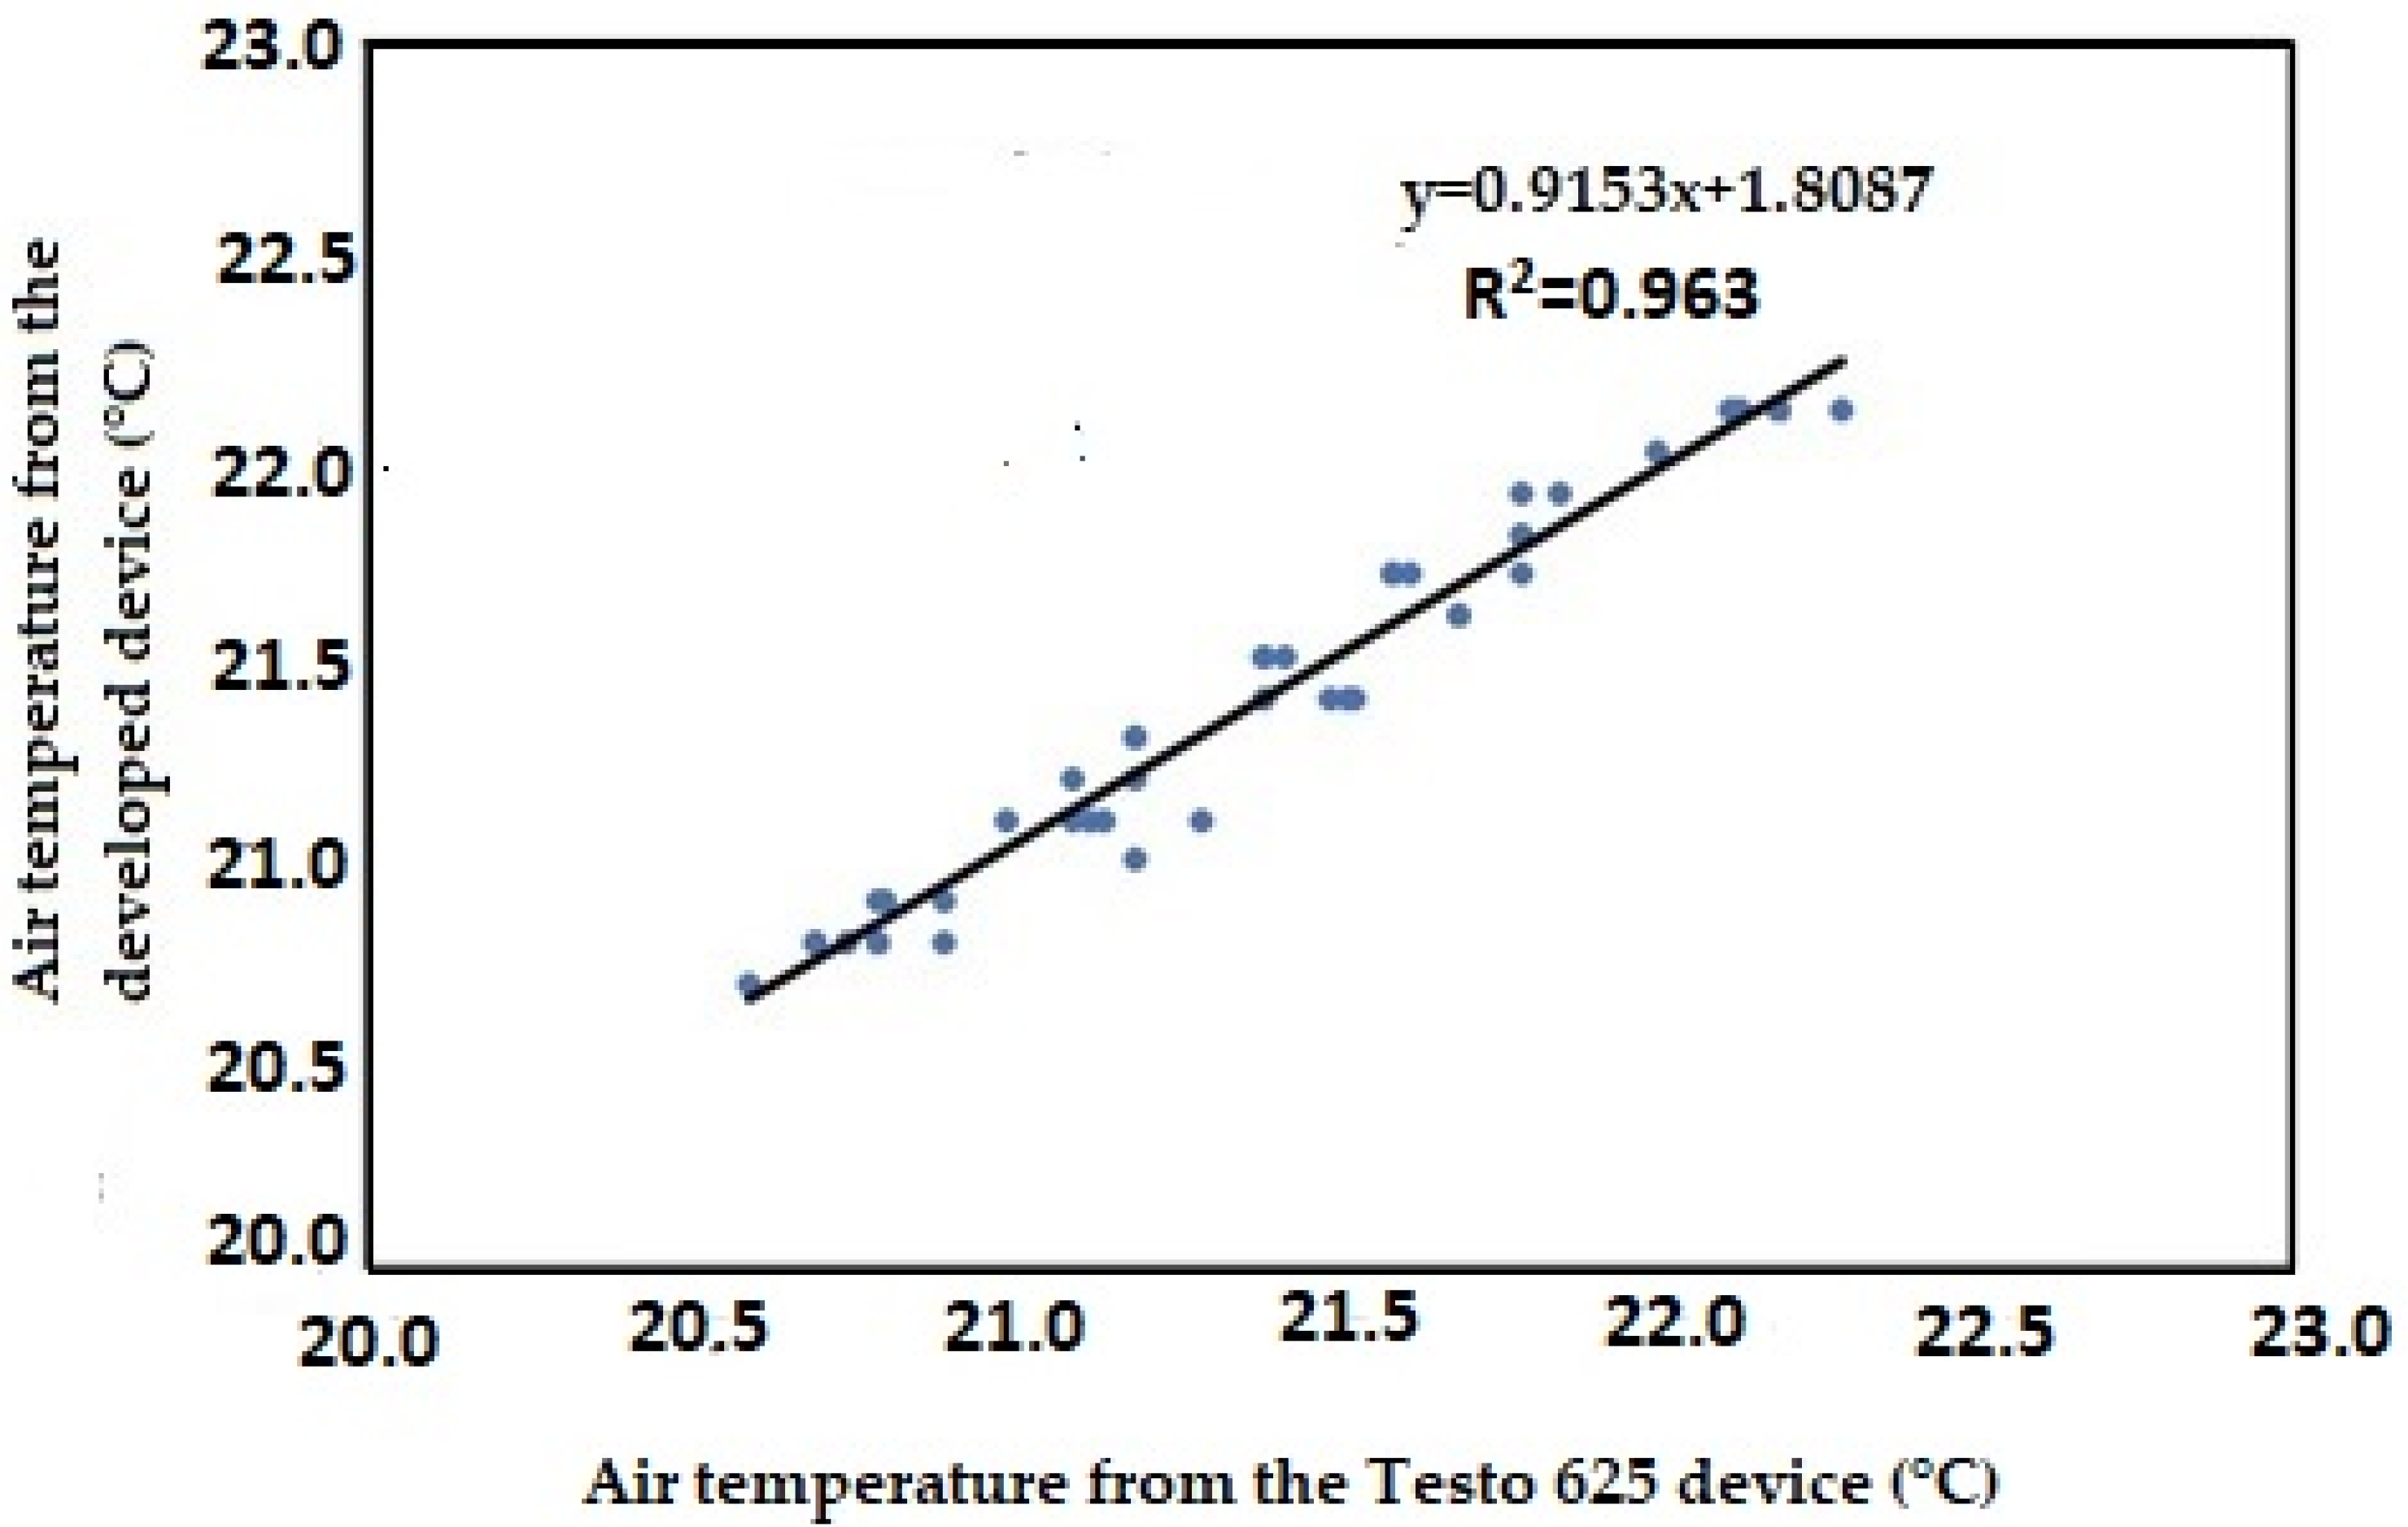
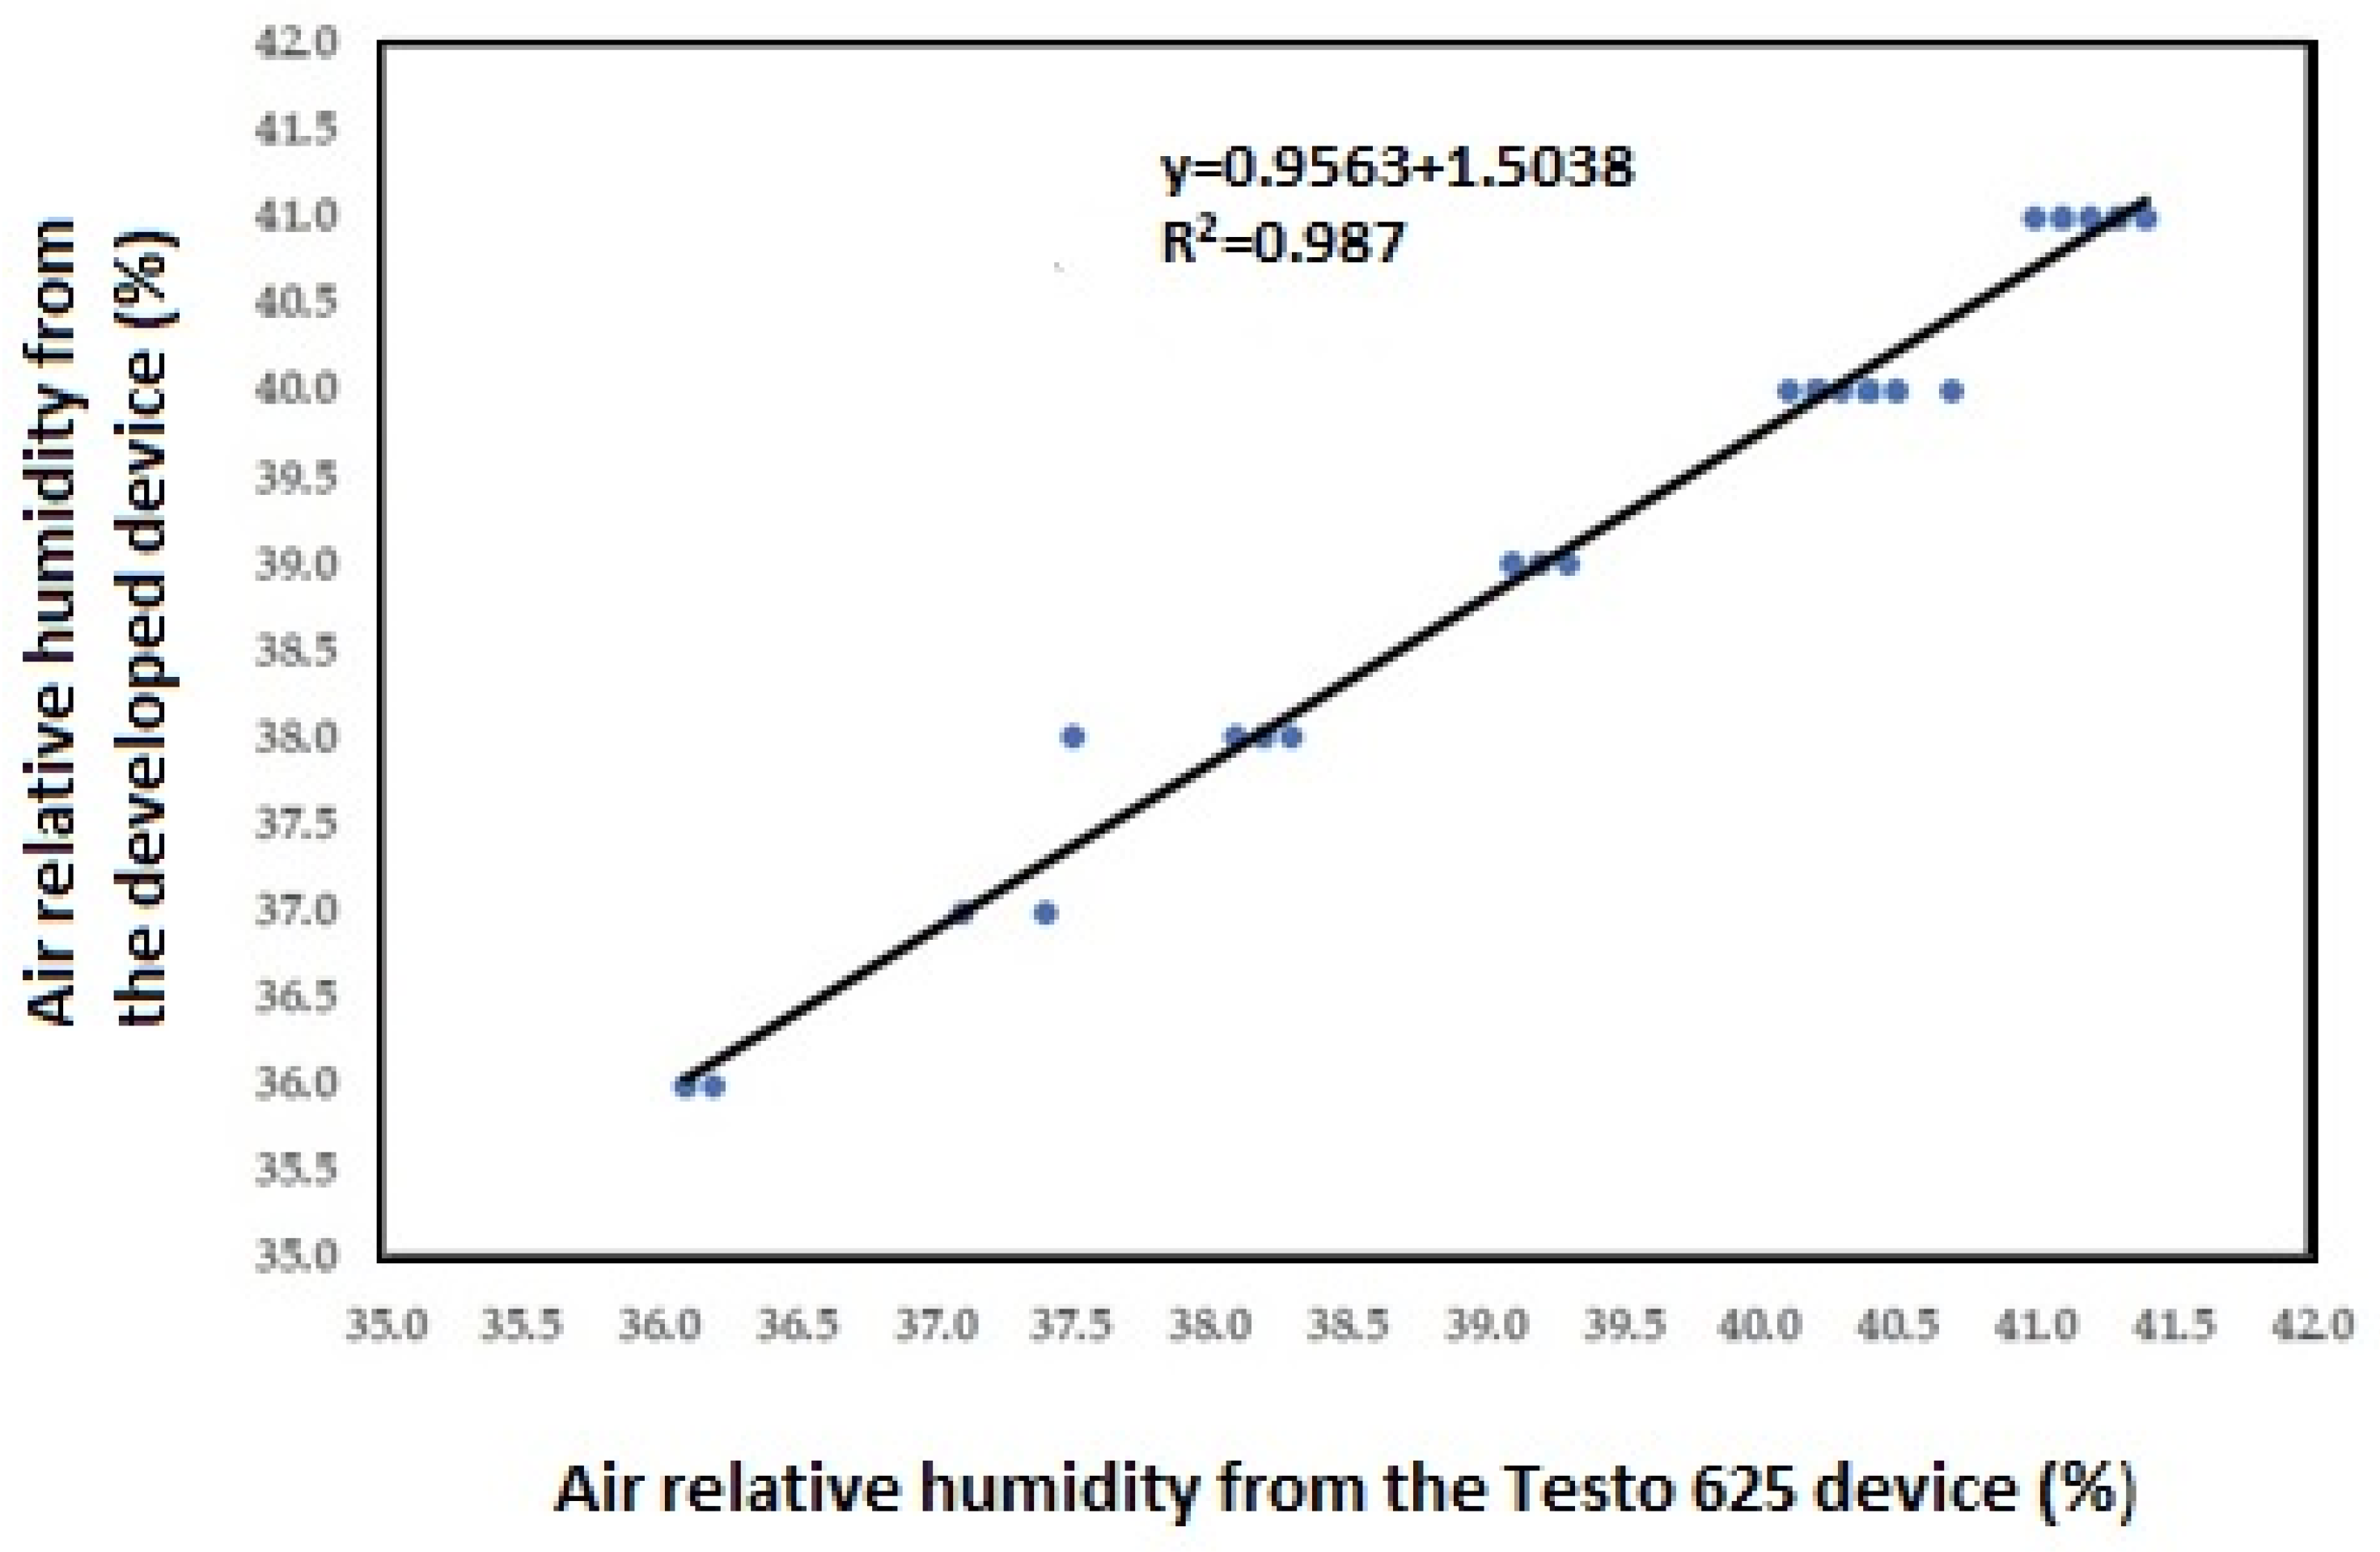
3.2. Data Analysis of Sensors Calibration

The relationship between the readings of air temperature from the developed device and the Testo 625 device is shown in Figure 3, and the relationship between the readings of air relative humidity from the developed device and the Testo 625 device is shown in Figure 4. It was found that the relationship between the readings was strong and linear, with coefficients of determination (R2) equal to 0.963 for air temperature and 0.987 for air relative humidity. Therefore, it became clear that it was possible to rely on the readings produced by the developed device to know the temperature and relative humidity of the atmosphere.
To verify the readings of the weather sensors placed on the Arduino board, a comparison was made with what was available on the web pages of the measurements of weather conditions, such as air temperature, air relative humidity, and atmospheric pressure (Table A5) in Appendix A; it was noted that there were differences in the heights at which the measuring devices were placed; these devices included both the developed device and the standard devices in meteorological stations; the measurement locations also differed as they could be indoors or outdoors. The average values from the meteorological stations on the web pages for the values of air temperature, atmospheric pressure, and air relative humidity were compared with the general average of the actual measurements. The relative error (RE) between the readings was calculated, and the computed average relative error was about −13.22% for atmospheric pressure, 10.04% for air temperature, and 21.01% for air relative humidity from data shown in Table A4 in Appendix A.

3.3. Analyzing of Recorded Data

Given that the statistical dispersion of measurements of a quantity under identical circumstances defines precision, the standard deviation calculated from each sensor’s readings is steady and repeatable. The standard deviation is a metric used to assess how dispersed data are in relation to their average value; a larger range for this parameter indicates a higher degree of measurement uncertainty. However, data from all sensors were subjected to descriptive statistical analysis to obtain the mean, minimum, maximum, standard deviation (SD), and coefficient of variation (CV, %). The percentage value of CV was categorized as low (CV < 12%), medium (if CV = 12–24%), and high (when CV > 24%) [33]. However, the average values for air temperature, relative humidity, atmospheric pressure, air dust concentration, and carbon monoxide concentration are displayed in Table 1 for the different sites. Meanwhile, Table 2 shows the maximum and minimum values, the coefficient of variation, and the standard deviation of these data on the variables of carbon monoxide concentration (CO) and dust concentration in the air (DC).
It is clear from Table 1 that the overall average dust concentration in the air and carbon monoxide concentration recorded at different sites were respectively 233.6 μg/m3 and 11.6 ppm. In addition, the overall average of air relative humidity, air temperature, and atmospheric pressure were respectively 23.8%, 34.1 °C, and 895.3 hPa. Furthermore, low air relative humidity (<30%) can affect human health [46]. Moreover, the overall average CO value was 11.6 ppm (Table 1); the obtained CO level in this study was at a bad level according to Loganathan et al. [47], who stated two levels of CO, normal in the range of 0.0~9.0 ppm and bad in the range of 9.1~15.0. In the study of Bakri et al. [11], they recorded values of 28.38 ppm and 35.40 ppm in a residential area using an MQ7 sensor connected to an Arduino board for detecting CO concentration using two sensors. Additionally, on the main road (commercial area), the averages of 44.10 ppm and 35.40 ppm for CO concentration were detected by these two sensors. The duration of monitoring measurements of Bakri et al. [11] study was set at 3 min.
The overall average dust concentration in the air in this study was 233.6 μg/m3 (Table 1); however, particulate matter exposure is generally considered hazardous and dangerous because of the potential for some negative health effects, including irritation of the eyes, nose, and throat, worsening of symptoms associated with respiratory and heart diseases, and even an increased risk of premature mortality in individuals with lung or heart illness [48]. So, several authorities have published recommendations for permissible limits for particulate matter in the air. The recommended level of PM10 was identical by 50 μg/m3 and not to be exceeded more than 35 times a year with an annual average limit of 40 μg/m3 [49]. The World Health Organization also recommended a limit of PM2.5, which is 25 μg/m3 [49]. It is also clear from Table 1, which shows the concentrations of carbon monoxide gas in different environments, that the largest arithmetic average was equal to 15.7 ppm inside a greenhouse planted with bell peppers (F17) and that the lowest value was 7.5 ppm in a public garden (F3); it is known that the concentration of carbon monoxide gas within unhealthy limits has the values of 9–15 ppm. The values of CO varied during the measurement times; this phenomenon was also observed in a study by Karamchandani et al. [50], in which they found that the concentration of carbon monoxide varied with the measurement time. In addition, the arithmetic average of the dust concentration in the air was determined for different agricultural settings; the largest arithmetic average was equal to 263 μg/m3 in a palm farm (F11), and the lowest value was 162 μg/m3 in a greenhouse planted with eggplant (F14). However, some selected areas in this study were located at a level of high pollution based on dust concentration in the air, which was in the range of 150–250 μg/m3 (micrograms per cubic meter of air). In a study by Beyaz [14], using the GP2Y1010AU0F sensor and an Arduino board to determine the dust concentration on a poultry farm, they found that the dust concentration value was 74.69 µg/m3, and it varied over time, as the dust concentration value in the fourth week of rearing reached about 242.55 µg/m3.
It is clear from Table 1 that the overall average, overall minimum, and overall maximum of air relative humidity in investigated settings were 23.8%, 12.3%, and 43.0%, respectively. Moreover, the overall average, overall minimum, and overall maximum air temperature in investigated settings were 34.1 °C, 21.2 °C, and 44.3 °C, respectively, and for atmospheric pressure, the values were 895.3 hPa, 795.8 hPa, and 963.1 hPa, respectively (Table 1). Finally, by exploring Table 2, the range of coefficient of variation for carbon monoxide concentration was 4.3% to 29.0%, the maximum range was 8.5 ppm to 19.2 ppm, and the minimum range was 4.8 ppm to 11.3 ppm. Moreover, the range of coefficient of variation for dust concentration in the air was 7.4% to 27.3%, the maximum range was 228.1 µg/m3 to 309.5 µg/m3, and the minimum range was 102.8 µg/m3 to 214.1 µg/m3.

3.4. Correlation Analyzing of Recorded Data

The variations in air temperature, relative humidity, and atmospheric pressure and their influences on pollutant concentrations in the ambient air were analyzed using Spearman correlation annually. The results show that the CO concentrations had a weak negative correlation with atmospheric pressure, but a weak positive correlation with air temperature and air relative humidity, as shown in Table 3, was observed. Additionally, the dust concentrations in the air had a weak negative correlation with atmospheric pressure and air relative humidity, but a strong positive correlation (r = 0.723, p ≤ 0.01) with air temperature, as shown in Table 3, was observed. However, the observed correlation coefficient ranges from 0.00 to 0.10, which means a negligible correlation; from 0.10 to 0.39, which means a weak correlation; from 0.40 to 0.69 means a moderate correlation; from 0.70 to 0.89 means a strong correlation, and from 0.90 to 1.00 means very strong correlation as reported by [51]. In a study by Tasić et al. [52], they recommended that there be a study to clarify the effect of changes in air temperature and humidity on the concentration of PM2.5 dust particles. They used a GP2Y1010AU0F sensor connected to an Arduino board to measure the concentration of dust particles in an indoor environment. They chose this sensor because of its low cost and its quality in measuring dust concentration. They compared their readings with the approved readings and found a strong correlation between the readings and the measurements for 15 min. Moreover, in the study of Ulutaş et al. [53], a strong positive correlation was reported between CO and PM10 and PM2.5. Additionally, they revealed that the changes in the meteorological parameters significantly affect the behavior of air pollutant parameters. Furthermore, during the winter and summer, there were significant correlations between particle matter and air relative humidity. These results add to our knowledge of how weather patterns affect air quality in agricultural settings and highlight the crucial role that meteorological factors play in shaping the dynamics of air pollution throughout the nation [54].

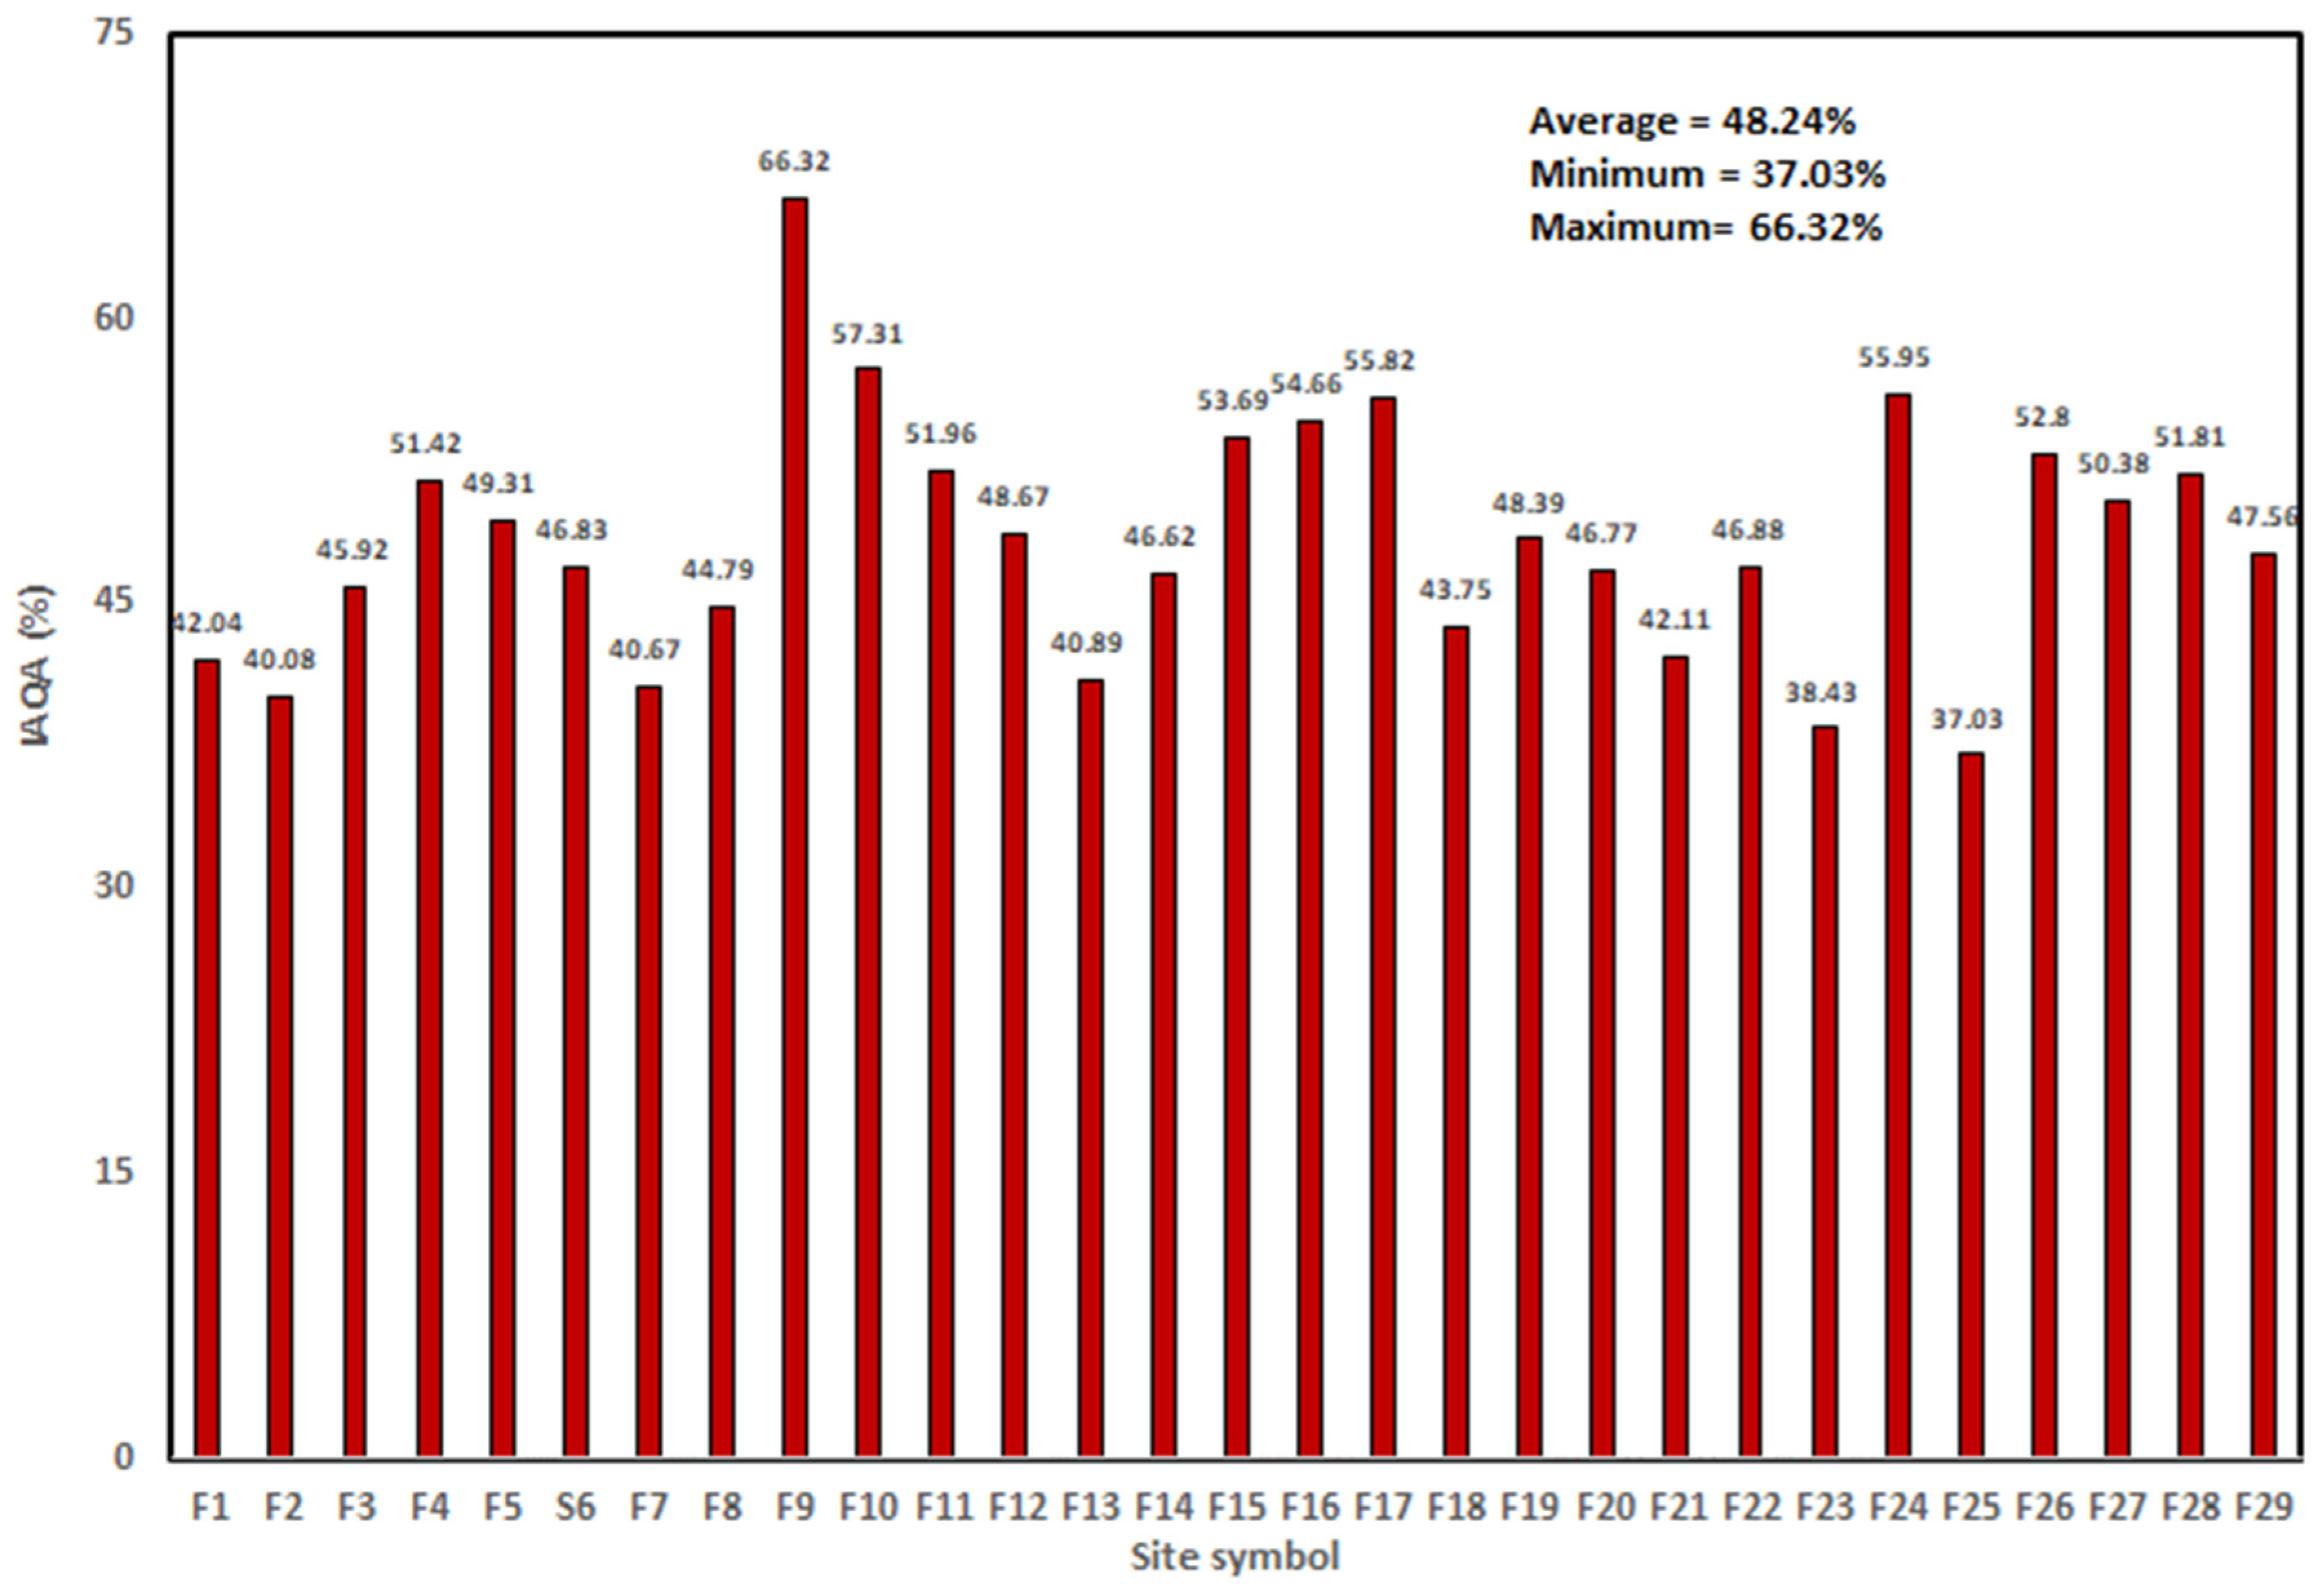
3.5. Analyzing Data of Integrated Indicator of Air Quality

For the whole set of data, Figure 5 shows the average values of IAQA. According to the index values of IAQA, the environment with the lowest value is the most environmentally friendly; its lowest and highest values ranged from 37.03%, which occurred on a vegetable farm, and 66.32%, which occurred on a traditional pigeon farm, respectively (Figure 5), with an arithmetic average of 48.24%.
As is clear from Figure 5, the two sheep farms (F1 and F22) had IAQA values of 42.04 and 46.88%, respectively. However, the pigeon farms (F24 and F9) had IAQA values of 55.95% and 66.32%, respectively, while the typical pigeon farm (F8) had an IAQA value of 44.79%. In addition, the seed greenhouse (F16) had an IAQA value of 54.66%, the bell pepper greenhouse (F17) had an IAQA value of 55.82%, and the eggplant greenhouse (F18) had an IAQA value of 43.75%. Given their considerable effects on pollutant dispersion and/or transformation, air temperature, and air relative humidity may be the primary factors influencing year-round air quality; they account for the variation in IAQA values. The term air quality refers to how clean the air is in relation to the level of pollution [21]. The air quality of monitoring farms F24 and F9 are seriously dangerous. An early warning should be issued to the farm workers in such environments, and the working hours should be reduced. Then, a statement should be formed following prescribed procedures, and work can continue after the pollution concentrations are reduced. If left untreated, the occupational health of farm workers can be endangered, causing human and property losses [33]. It can also be seen in Figure 5 that the air quality of the monitoring farms’ public garden (F3), duck farm (F7), and corn farm (F20) is good compared with other monitoring farms. The reason for this might be that safer activities are used in such farms. The created IAQA model will suitably emphasize the impact on the air quality level when one of the examined indicators has a greater scale. Interactions and synergies between different pollutants and atmospheric parameters happen when the scale of all indicators increases, and this has a major effect on the level of air quality.
The purpose of this study was to monitor and assess different air pollutants and atmospheric factors in agricultural contexts using the weighted average scale index evaluation technique. Initially, it is possible to measure the atmospheric parameters and air quality indicators in an agricultural setting. Second, the weighted average scale index evaluation methodology can precisely and swiftly manage the variables that cause environmental fall and reflect the governance status following action. These measurement data can be used as a guide for air quality assessment and agricultural environment structure design. Although similar research has been published, this paper presents novelty findings from combined values of air pollutants and weather parameters for defining a new criterion called an integrated indicator. Additionally, this paper presents original results for air pollutants and weather parameters in different agricultural activities.

4. Conclusions

This study performed measurements to comprehensively assess air pollution levels in different regions of the Kingdom of Saudi Arabia. For this purpose, a portable device was developed and designed that employed different sensors connected to an Arduino board. Measurements in 29 environmentally different agricultural regions located within the Kingdom of Saudi Arabia were obtained. Atmospheric pressure, air temperature, and air relative humidity were evaluated during the experiments. The utilized dust concentration in the air and the carbon monoxide concentration served as indicators of air pollution. However, we selected the concentration of dust in the air to represent air pollutants, as dust storms are important weather occurrences that affect air quality, public health, and visibility—especially in desert Saudi Arabia. Moreover, we selected the concentration of carbon monoxide due to car emissions of carbon monoxide having a negative impact on human health in addition to causing environmental pollution and climate change. A vital tool was established, offering both the public and the decision-makers an understandable gauge of air quality. The unequivocal success of these two indicators of air pollutants was not sufficient to compare the agricultural activities in the selected area; thus, a new indicator was developed and utilized to compare the pollution levels of the agricultural environments under study by assigning a weight to each variable according to its role in the pollution of the agricultural environment. The agricultural environment with the lowest indicator was the best environmentally, as the lowest and highest values of the integrated indicator ranged from 37.03% and 66.32%, respectively, with an arithmetic average of 48.24%. This indicator can change depending on the change in the weights of the variables involved, and it is suitable for application to any other agricultural or non-agricultural settings to evaluate the pollution level in the air. Our research has yielded insights that are broadly applicable and offer prospects for tackling air quality issues worldwide. We created the conditions for a more sustainable agricultural practice and advanced monitoring of the environment that utilizes both air pollutant indicators and the commonly available meteorological parameters. This study is of great worth for improving the air quality in agricultural environments. Finally, technological advancements continue, and future research could explore the integration of real-time data transmission capabilities into the developed portable device. Incorporating such capabilities would enable continuous monitoring and timely dissemination of air quality information, providing an even more dynamic and responsive approach to addressing environmental concerns in agricultural and non-agricultural settings. Finally, the limitations in this study are related to the measurement period, which can be increased in a future study. In addition, the results presented here were not related to the different seasons of the year.

Author Contributions

S.S.A., A.M.A., S.M.A.-S., A.A.A.-J. and S.A.M. conceptualization, methodology, analyzed the data, prepared figures and tables, funding acquisition, authored and reviewed drafts of the paper, and approved the final draft; and A.M.A. and A.A.A.-J., designed the experiments, performed the experiments. All authors have read and agreed to the published version of the manuscript.

Funding

This research was funded by Researchers Supporting Project number (RSPD2024R752), King Saud University, Riyadh, the Kingdom of Saudi Arabia.

Institutional Review Board Statement

Not applicable.

Informed Consent Statement

Not applicable.

Data Availability Statement

The original contributions presented in the study are included in the article, further inquiries can be directed to the corresponding author.

Acknowledgments

The authors would like to extend their sincere appreciation to the Researchers Supporting Project (RSPD2024R752) at King Saud University, Riyadh, the Kingdom of Saudi Arabia.

Conflicts of Interest

The authors declare no conflict of interest.

Appendix A

Table A1. The description of the investigated sites, no. of recorded data items, measurement time, longitude, latitude, and measurement dates.
Site SymbolDescriptionNo. of Recorded Data ItemsMeasurement TimeLongitude (N°)Latitude (°E)Measurement Dates
StartEnd
F1Sheep farm4408:19:28 a.m.08:49:59 a.m.46.5201524.8066620 December 2021
F2Camel pasture4408:55:21 a.m.09:24:23 a.m.46.5201524.8066620 December 2021
F3Public garden4610:19:08 a.m.10:51:52 a.m.46.6195424.7374920 December 2021
F4Dairy cows5912:07:59 p.m.12:35:31 p.m.44.8434726.1793325 January 2022
F5Fish hatchery4210:33:30 a.m.10:59:33 a.m.45.3334625.3940311 May 2022
F6Fish tanks for fattening4211:18:21 a.m.11:47:23 a.m.45.3334625.3940311 May 2022
F7Duck farm5111:52:37 a.m.12:03:02 p.m.45.3339725.3973311 May 2022
F8Typical pigeon farm4412:39:05 p.m.01:06:37 p.m.45.3309725.3983611 May 2022
F9Traditional pigeon farm4201:16:04 p.m.01:45:51 p.m.45.3309725.3983611 May 2022
F10Sheep farm3901:57:48 p.m.02:23:56 p.m.45.3317525.4008911 May 2022
F11Palm farm4202:38:00 p.m.03:05:33 p.m.45.3374725.3990311 May 2022
F12Tomato greenhouse3401:19:26 p.m.01:43:16 p.m.47.1930624.2883617 May 2022
F13Cucumber greenhouse4302:03:52 p.m.02:34:23 p.m.47.1930624.2883617 May 2022
F14Eggplant greenhouse5407:57:26 a.m.08:36:13 a.m.47.1953124.2845619 May 2022
F15Palm farm5008:54:44 a.m.09:30:29 a.m.47.1906124.2855319 May 2022
F16Seed greenhouse 4809:14:34 a.m.09:48:53 a.m.40.4228321.3001912 July 2022
F17Bell pepper greenhouse 5009:58:41 a.m.10:29:57 a.m.40.4228321.3001912 July 2022
F18Eggplant greenhouse4610:38:00 a.m.11:15:21 a.m.40.4228321.3001912 July 2022
F19Pomegranate farm4111:22:06 a.m.11:51:08 a.m.40.4247521.2988912 July 2022
F20Corn farm4710:03:52 a.m.10:38:06 a.m.40.4277821.3261713 July 2022
F21Strawberry greenhouse4311:22:54 a.m.11:53:25 a.m.40.5565221.3317713 July 2022
F22Sheep farm4312:10:02 p.m.12:41:18 p.m.40.5572821.3191113 July 2022
F23Poultry farm4001:11:21 p.m.01:40:23 p.m.40.5586321.3404413 July 2022
F24Typical pigeon farm4901:44:23 p.m.02:18:38 p.m.40.5586721.3407313 July 2022
F25Vegetable farm4103:31:52 p.m.04:00:09 p.m.40.4649921.3261513 July 2022
F26Vegetable farm4004:05:09 p.m.04:33:26 p.m.40.4649921.3261513 July 2022
F27Vineyard6510:16:26 a.m.11:03:19 a.m.40.3695421.2405616 July 2022
F28Vegetable farm4611:12:17 a.m.11:51:32 a.m.40.3695421.2405616 July 2022
F29Persian fig farm4901:56:45 p.m.02:28:00 p.m.40.3196821.1203716 July 2022
Table A2. Raw data of parameters for farms numbered F1, where the number of readings was 44.
No.Air relative HumidityAir TemperatureAtmospheric PressureDust Concentration in the AirCO
(%)(°C)(hPa)(μg/m3)(ppm)
14022.1945.8129.411.3
23922.1945.7190.811.2
34022.0945.7127.311.1
44022.1945.6154.111.6
54022.1945.7165.911.5
64022.1945.8154.811.4
74022.1945.7212.411.7
84021.9945.7176.711.9
94021.9945.7165.911.9
104021.8945.7145.712.0
114021.7945.7145.212.0
124021.7945.6302.912.3
134121.7945.7119.012.3
144121.6945.7301.212.7
154121.5945.7303.312.7
164121.5945.7153.913.1
174121.4945.7137.713.1
184121.4945.7151.013.4
194121.2945.7191.713.6
204121.3945.8155.613.6
214121.2945.7233.213.9
224121.1945.7143.114.2
234121.1945.6167.614.4
244121.1945.7148.614.6
254021.0945.7146.515.0
264020.9945.7146.015.1
274020.9945.6151.015.7
284020.8945.7134.816.2
294020.8945.7163.416.6
304020.8945.6168.417.0
314020.8945.7128.117.9
323920.7945.6175.918.3
333920.8945.7159.311.5
343920.8945.8123.112.0
353820.9945.7160.112.7
363821.1945.7241.613.6
373821.1945.7145.214.5
383821.3945.715.0615.9
393821.4945.7130.617.9
403721.4945.7150.112.1
413721.5945.6205.814.7
423621.6945.6160.918.9
433621.7945.6139.415.1
443621.8945.6114.015.5
Average39.5521.40945.7167.6613.81
Standard deviation1.470.450.0645.832.14
Minimum value3620.7945.611411.1
Maximum value4122.1945.8303.318.9
Table A3. Normalized data according to Equation (5) of parameters for farms numbered F1, where the number of readings was 44.
No.Air Relative HumidityAir TemperatureAtmospheric PressureDust Concentration in the AirCO
10.8001.0000.8820.0810.031
20.6001.0000.5290.4060.015
30.8000.9290.5880.0700.000
40.8001.0000.0000.2120.070
50.8001.0000.1760.2740.054
60.8001.0001.0000.2150.038
70.8001.0000.4710.5200.078
80.8000.8570.1760.3310.102
90.8000.8570.2940.2740.110
100.8000.7860.1760.1670.118
110.8000.7140.2350.1650.118
120.8000.7140.0000.9980.151
131.0000.7140.3530.0260.151
141.0000.6430.4710.9890.202
151.0000.5710.2941.0000.211
161.0000.5710.6470.2110.255
171.0000.5000.4120.1250.255
181.0000.5000.5880.1950.291
191.0000.3570.4710.4100.318
201.0000.4290.8240.2190.318
211.0000.3570.7060.6290.365
221.0000.2860.6470.1530.394
231.0000.2860.0590.2830.423
241.0000.2860.2350.1830.453
250.8000.2140.6470.1720.493
260.8000.1430.3530.1690.514
270.8000.1430.1180.1950.588
280.8000.0710.3530.1100.653
290.8000.0710.5290.2610.709
300.8000.0710.0590.2870.755
310.8000.0710.3530.0750.874
320.6000.0000.0590.3270.924
330.6000.0710.2350.2390.054
340.6000.0710.7650.0480.118
350.4000.1430.7060.2440.211
360.4000.2860.3530.6740.328
370.4000.2860.2350.1650.433
380.4000.4290.1760.2220.620
390.4000.5000.2940.0880.874
400.2000.5000.1760.1910.134
410.2000.5710.0590.4850.463
420.0000.6430.0000.2481.000
430.0000.7140.0590.1340.514
440.0000.7860.0590.0000.566
Table A4. Normalized data multiplied by the corresponding parameters for farms numbered F1 and IAQA values, where the number of readings was 44.
CODust Concentration in the AirAir Relative HumidityAir TemperatureAtmospheric PressureSumIAQA = [sum/(5 + 4 + 3 + 2 + 1)]
0.1220.1220.1220.1220.1225.8110.387
0.0610.0610.0610.0610.0616.4190.428
0.0000.0000.0000.0000.0005.1960.346
0.2790.2790.2790.2790.2795.7360.382
0.2160.2160.2160.2160.2166.1630.411
0.1530.1530.1530.1530.1536.6300.442
0.3100.3100.3100.3100.3107.7800.519
0.4070.4070.4070.4070.4076.3540.424
0.4390.4390.4390.4390.4396.2190.415
0.4720.4720.4720.4720.4725.4570.364
0.4720.4720.4720.4720.4725.3590.357
0.6040.6040.6040.6040.6049.4210.628
0.6040.6040.6040.6040.6045.5170.368
0.8080.8080.8080.8080.80810.5090.701
0.8430.8430.8430.8430.84310.2800.685
1.0191.0191.0191.0191.0196.8610.457
1.0191.0191.0191.0191.0196.0560.404
1.1631.1631.1631.1631.1636.7280.449
1.2741.2741.2741.2741.2747.5090.501
1.2741.2741.2741.2741.2747.0520.470
1.4611.4611.4611.4611.4619.0280.602
1.5771.5771.5771.5771.5776.5620.437
1.6941.6941.6941.6941.6946.7390.449
1.8121.8121.8121.8121.8126.5320.435
1.9741.9741.9741.9741.9746.3080.421
2.0562.0562.0562.0562.0565.9390.396
2.3502.3502.3502.3502.3506.1300.409
2.6122.6122.6122.6122.6126.0550.404
2.8362.8362.8362.8362.8367.2130.481
3.0203.0203.0203.0203.0207.0580.471
3.4973.4973.4973.4973.4976.7650.451
3.6953.6953.6953.6953.6957.1880.479
0.2160.2160.2160.2160.2163.5890.239
0.4720.4720.4720.4720.4723.4210.228
0.8430.8430.8430.8430.8434.2520.283
1.3111.3111.3111.3111.3116.8040.454
1.7331.7331.7331.7331.7334.5620.304
2.4802.4802.4802.4802.4805.8210.388
3.4973.4973.4973.4973.4976.4290.429
0.5380.5380.5380.5380.5383.2690.218
1.8521.8521.8521.8521.8526.0770.405
4.0004.0004.0004.0004.0006.5250.435
2.0562.0562.0562.0562.0564.2130.281
2.2652.2652.2652.2652.2653.8950.260
Total sum18.495
No. of readings44
Average IAQA (%)=(18.495/44) × 100 = 42.035
Table A5. Data from web pages and data from the developed device for air temperature, atmospheric pressure, and air relative humidity during the experimental periods in the investigated locations.
Data from the Developed DeviceData from Web Pages
Atmospheric pressureAir TemperatureAir Relative HumidityAverage Air TemperatureMinimum Air TemperatureMaximum Air TemperatureAtmospheric PressureAir Relative Humidity
(hPa)(°C)(%)(°C)(°C)(°C)(hPa)(%)
946.621.439.5 20.5 1625101948
949.427.828.9 20.5 1625101948
940.124.033.9 20.5 1625101948
941.321.213.1 18.0 1620101724
940.841.115.3 29.0 2830100914
940.837.743.0 29.0 2830100914
940.338.212.4 37.0 363810058
938.638.212.3 37.0 363810058
938.739.613.0 37.0 363810058
962.244.315.6 37.0 363810058
962.140.213.4 37.0 363810058
963.132.238.3 36.5 3538101212
962.829.340.0 36.5 3538101212
839.829.637.2 34.0 2642101421
839.136.530.7 34.0 2642101421
840.034.518.1 29.0 2533101815
840.140.123.8 29.0 2533101815
840.839.526.0 29.0 2533101815
850.435.615.9 29.0 2533101815
850.031.438.4 29.5 2633101719
850.833.332.4 29.5 2633101719
850.337.213.4 32.0 3034101520
844.635.214.8 32.0 3034101520
844.638.912.8 32.0 3034101520
829.631.128.8 32.0 3034101520
829.729.532.3 32.0 3034101520
795.833.718.7 29.5 2534101517
895.336.713.8 29.5 2534101517
795.831.315.4 32.5 3134101512
895.334.123.827.833.630.71013.618.8

References

  1. Jin, M.; Liu, S.; Schiavon, S.; Spanos, C. Automated mobile sensing: Towards high-granularity agile indoor environmental quality monitoring. Build. Environ. 2018, 127, 268–276. [Google Scholar] [CrossRef]
  2. Rahman, K.M.; Rummana, R.; Aziz, S.; Nishat, B. Urban pollution in Dhaka City: A tri-partite qualitative model for alleviation and prevention. In Proceedings of the International Conference on Sustainable Urban Environmental Practices, Chiang Mai, Thailand, 28–31 October 2008; pp. 1–20. [Google Scholar]
  3. Sheraj, S. Social and economic life affected by environmental degradation in China and Bangladesh. Int. J. Sci. Bus. 2017, 1, 119–139. [Google Scholar]
  4. Xu, X.; Yang, H.; Li, C. Theoretical model and actual characteristics of air pollution affecting health cost: A review. Int. J. Environ. Res. Public Health 2022, 19, 3532. [Google Scholar] [CrossRef] [PubMed]
  5. Nahar, N.; Mahiuddin, S.; Hossain, Z. The severity of environmental pollution in the developing countries and its remedial measures. Earth 2021, 2, 124–139. [Google Scholar] [CrossRef]
  6. Available online: https://www.envirotech-online.com/news/environmental-laboratory/7/breaking-news/how-does-agriculture-pollute-the-air/59400#:~:text=There%20are%20a%20range%20of,the%20burning%20of%20crop%20stubble (accessed on 21 June 2024).
  7. Firculescu, A.C.; Tudose, D.S. Low-cost air quality system for urban area monitoring. In Proceedings of the 20th International Conference on Control Systems and Computer Science, Bucharest, Romania, 27–29 May 2015. [Google Scholar]
  8. Yang, Y.; Li, L. A smart sensor system for air quality monitoring and massive data collection. In Proceedings of the International Conference on Information and Communication Technology Convergence, Jeju Island, Republic of Korea, 28–30 October 2015. [Google Scholar]
  9. Raju, D.T.; Shivani, K.; Bharathi, T.S.; Yamini, M.; Charishma, P. Air quality monitoring system using Arduino. Dogo Rangsang Res. J. 2021, 11, 612–615. [Google Scholar]
  10. Vishwas, S.; Saha, S.; Bhowmik, M.N.; Nath, A.; Kundu, S.S.; Pradhan, S.N.; Sarkar, M.B. Design and Development of Arduino Based Portable Air Quality Monitoring Systems. In Proceedings of the 2021 1st Odisha International Conference on Electrical Power Engineering, Communication and Computing Technology (ODICON), Bhubaneswar, India, 8–9 January 2021; pp. 1–4. [Google Scholar] [CrossRef]
  11. Bakri, N.A.M.; Al Junid, S.A.; Abdul Razak, A.; Idros, M.F.M.; Halim, A.K. Mobile Carbon Monoxide Monitoring System Based on Arduino-Matlab for Environmental Monitoring Application. In Proceedings of the 4th International Conference on Electronic Devices, Systems and Applications 2015 (ICEDSA), Kuala Lumpur, Malaysia, 14–15 September 2015; IOP Conf. Series: Materials Science and Engineering. IOP Publishing: Bristol, UK, 2015; Volume 99, p. 012009. [Google Scholar] [CrossRef]
  12. Husain, A.M.; Rini, T.H.; Haque, M.I.; Alam, M.R. Air Quality Monitoring: The Use of Arduino and Android. J. Mod. Sci. Technol. 2016, 4, 86–96. [Google Scholar]
  13. Kaneri, N.; Bhalekar, K.; Kharvatkar, S. Carbon Monoxide Monitoring System Based on Arduino-GSM for Environmental Monitoring Application. Int. J. Eng. Res. Appl. 2017, 7, 57–61. [Google Scholar] [CrossRef]
  14. Beyaz, A. Air quality evaluation with a low-cost dust sensor for a hencoop. Agric. Sci. Dig. -A Res. J. 2019, 39, 236–243. [Google Scholar] [CrossRef]
  15. Biswal, A.; Subhashini, J.; Pasayat, A.K. Air quality monitoring system for indoor environments using IoT. AIP Conf. Proc. 2019, 2112, 020180. [Google Scholar] [CrossRef]
  16. Siddiqui, S.A.; Fatima, N.; Ahmad, A. Smart Air Pollution Monitoring System with Smog Prediction Model using Machine Learning. Int. J. Adv. Comput. Sci. Appl. 2021, 12, 401–409. [Google Scholar] [CrossRef]
  17. Gimena, R.Z.A.; Narvaez, C.A.A.; Balitaon, A.G.; Abad, A.C.; Arada, G.P. Arduino-based Remotely Accessed Weather Monitoring Station. Int. J. Adv. Trends Comput. Sci. Eng. 2020, 9, 8860–8865. [Google Scholar]
  18. Hastak, O.G.; Verma, K.; Zagdamwar, A.; Patil, A.; Tembhurnikar, R. IOT based weather forecasting system using arduino board. Int. J. Res. Publ. Rev. 2022, 3, 2664–2669. [Google Scholar]
  19. Borghi, F.; Spinazzè, A.; De Nardis, N.; Straccini, S.; Rovelli, S.; Fanti, G.; Oxoli, D.; Cattaneo, A.; Cavallo, D.M.; Brovelli, M.A. Monitoring of air pollution in agricultural settings: A systematic review of the literature. Res. Sq. 2023, preprint. [Google Scholar] [CrossRef]
  20. Kaur, N.; Mahajan, R.; Bagai, D. Air quality monitoring system based on Arduino microcontroller. Int. J. Innov. Res. Sci. Eng. Technol. 2016, 5, 9635–9648. [Google Scholar]
  21. Balta, D.; Yalcin, N.; Ozmen, A. Indoor air quality monitoring system using Raspberry Pi for energy efficiency in classrooms. In Proceedings of the III International Conference on Engineering and Natural Science, Budapest, Hungary, 3–7 May 2017; pp. 253–256. [Google Scholar]
  22. Gunawan, T.S.; Munir, Y.M.S.; Kartiwi, M.; Mansor, H. Design and implementation of portable outdoor air quality measurement system using Arduino. Int. J. Electr. Comput. Eng. (IJECE) 2018, 8, 280–290. [Google Scholar] [CrossRef]
  23. Taştan, M. An IoT based air quality measurement and warning system for ambient assisted living. Eur. J. Sci. Technol. 2019, 16, 960–968. [Google Scholar] [CrossRef]
  24. Ivy, D.; Mulholland, J.A.; Russell, A.G. Development of ambient air quality population-weighted metrics for use in time-series health studies. J. Air Waste Manag. Assoc. 1995, 58, 711–720. [Google Scholar] [CrossRef] [PubMed]
  25. Arduino Mega 2560 Rev3—Arduino Official Store. Available online: https://store.arduino.cc/products/arduino-mega-2560-rev3 (accessed on 26 March 2024).
  26. Kelechi, A.H.; Alsharif, M.H.; Agbaetuo, C.; Ubadike, O.; Aligbe, A.; Uthansakul, P.; Kannadasan, R.; Aly, A.A. Design of a low-cost air quality monitoring system using Arduino and thingspeak. Comput. Mater. Contin. 2022, 70, 151–169. [Google Scholar] [CrossRef]
  27. Bučar, K.; Malet, J.; Stabile, L.; Pražnikar, J.; Seeger, S.; Žitnik, M. Statistics of a Sharp GP2Y Low-Cost Aerosol PM Sensor Output Signals. Sensors 2020, 20, 6707. [Google Scholar] [CrossRef]
  28. SHARP Corporation. GP2Y1010AU0F Compact Optical Dust Sensor, Sheet No.: E4-A01501EN. Available online: https://global.sharp/products/device/lineup/data/pdf/datasheet/gp2y1010au_e.pdf (accessed on 26 March 2024).
  29. Wang, Y.; Li, J.; Jing, H.; Zhang, Q.; Jiang, J.; Biswas, P. Laboratory Evaluation and Calibration of Three Low-Cost Particle Sensors for Particulate Matter Measurement. Aerosol Sci. Technol. 2015, 49, 1063–1077. [Google Scholar] [CrossRef]
  30. Sousan, S.; Koehler, K.; Thomas, G.; Park, J.H.; Hillman, M.; Halterman, A.; Peters, T.M. Inter-comparison of low-cost sensors for measuring the mass concentration of occupational aerosols. Aerosol Sci. Technol. 2016, 50, 462–473. [Google Scholar] [CrossRef]
  31. Available online: https://www.circuitbasics.com/set-bmp180-barometric-pressure-sensor-arduino/ (accessed on 26 March 2024).
  32. de Melo, D.A.; Silva, P.C.; da Costa, A.R.; Delmond, J.G.; Ferreira, A.F.A.; de Souza, J.A.; de Oliveira-Júnior, J.F.; da Silva, J.L.B.; da Rosa Ferraz Jardim, A.M.; Giongo, P.R.; et al. Development and Automation of a Photovoltaic-Powered Soil Moisture Sensor for Water Management. Hydrology 2023, 10, 166. [Google Scholar] [CrossRef]
  33. Kalra, V.; Baweja, C.; Simmarpreet; Chopra, S. Influence of temperature and humidity on the output resistance ratio of the MQ-135 Sensor. Int. J. Adv. Res. Comput. Sci. Softw. Eng. Res. 2016, 6, 423–429. [Google Scholar]
  34. Alvear-Puertas, V.E.; Burbano-Prado, Y.A.; Rosero-Montalvo, P.D.; Tözün, P.; Marcillo, F.; Hernandez, W. Smart and Portable Air-Quality Monitoring IoT Low-Cost Devices in Ibarra City, Ecuador. Sensors 2022, 22, 7015. [Google Scholar] [CrossRef]
  35. Available online: https://pdf1.alldatasheet.com/datasheet-pdf/view/1132068/BOSCH/BMP180.html (accessed on 22 March 2024).
  36. Kong, Z.; Zhang, C.; Lv, H.; Xiong, F.; Fu, Z. Multimodal feature extraction and fusion deep neural networks for short-term load forecasting. IEEE Access 2020, 8, 185373–185383. [Google Scholar] [CrossRef]
  37. Guo, S.; Hu, M.; Zamora, M.L.; Peng, J.; Shang, D.; Zheng, J.; Du, Z.; Wu, Z.; Shao, M.; Zeng, L. Elucidating Severe Urban Haze Formation in China. Proc. Natl. Acad. Sci. USA 2014, 111, 17373–173783. [Google Scholar] [CrossRef]
  38. Biswas, P.; Wu, C.-Y. Nanoparticles and the Environment. J. Air Waste Manage. Assoc. 2005, 55, 708–746. [Google Scholar] [CrossRef]
  39. Karlsson, H.L.; Gustafsson, J.; Cronholm, P.; Moller, L. SizeDependent Toxicity of Metal Oxide Particles—A Comparison Between Nano-and Micrometer Size. Toxicol. Lett. 2009, 188, 112–118. [Google Scholar] [CrossRef] [PubMed]
  40. Stocker, T.; Qin, D.; Plattner, G.; Tignor, M.; Allen, S.; Boschung, J.; Nauels, A.; Xia, Y.; Bex, B.; Midgley, B. IPCC, 2013: Climate Change 2013: The Physical Science Basis. In Contribution of Working Group I to the Fifth Assessment Report of the Intergovernmental Panel on Climate Change; Cambridge University Press: Cambridge, UK; New York, NY, USA, 2013. [Google Scholar]
  41. Davidson, C.I.; Phalen, R.F.; Solomon, P.A. Airborne Particulate Matter and Human Health: A Review. Aerosol Sci. Technol. 2005, 39, 737–749. [Google Scholar] [CrossRef]
  42. Kozlov, A.; Gura, D.; Repeva, A.; Lushkov, R. Assessing Air Pollution and Determining the Composition of Airborne Dust in Urbanized Areas: Granulometric Characteristics. Atmosphere 2022, 13, 1802. [Google Scholar] [CrossRef]
  43. International Programme on Chemical Safety. Carbon monoxide. In Environmental Health Criteria 213; World Health Organization: Geneva, Switzerland, 1999. [Google Scholar]
  44. Yin, S.; Li, J.; Liang, J.; Jia, K.; Yang, Z.; Wang, Y. Optimization of the weighted linear combination method for agricultural land suitability evaluation considering current land use and regional differences. Sustainability 2020, 12, 10134. [Google Scholar] [CrossRef]
  45. Xu, Q.; Goh, H.C.; Mousavi, E.; Nabizadeh Rafsanjani, H.; Varghese, Z.; Pandit, Y.; Ghahramani, A. Towards Personalization of Indoor Air Quality: Review of Sensing Requirements and Field Deployments. Sensors 2022, 22, 3444. [Google Scholar] [CrossRef]
  46. Loganathan, V.; Ravikumar, D.; Devaraj, V.; Kannan, U.M.; Kesavan, R. Development of a Compact IoT-Enabled Device to Monitor Air Pollution for Environmental Sustainability. Eng. Proc. 2023, 58, 18. [Google Scholar] [CrossRef]
  47. Li, Z.; Wen, Q.; Zhang, R. Sources, health effects and control strategies of indoor fine particulate matter (PM2.5): A review. Sci. Total Environ. 2017, 586, 610–622. [Google Scholar] [CrossRef]
  48. Paolucci, R.; Rotilio, M.; Ricci, S.; Pelliccione, A.; Ferri, G. A Sensor-Based System for Dust Containment in the Construction Site. Energies 2022, 15, 7272. [Google Scholar] [CrossRef]
  49. Karamchandani, S.; Gonsalves, A.; Gupta, D. Pervasive monitoring of carbon monoxide and methane using air quality prediction. In Proceedings of the 10th INDIACom, INDIACom-2016, IEEE Conference ID: 37465 2016 3rd International Conference on “Computing for Sustainable Global Development”, New Delhi, India, 16–18 March 2016. Bharati Vidyapeeth’s Institute of Computer Applications and Management (BVICAM). [Google Scholar]
  50. Schober, P.; Boer, C.; Schwarte, L.A. Correlation coefficients: Appropriate use and interpretation. Anesth. Analg. 2018, 126, 1763–1768. [Google Scholar] [CrossRef] [PubMed]
  51. Tasić, V.; Jovašević-Stojanović, M.; Topalović, D.; Davidović, M. Measurement of PM2.5 concentrations in indoor air using low-cost sensors and Arduino platforms. In Proceedings of the Conference: COST Action TD1105—New Sensing Technologies for Air-Pollution Control and Environmental Sustainability—Final Meeting—Sixth Scientific Meeting, organized by Czech Academy of Sciences, Prague, Czech Republic, 5–7 October 2016. [Google Scholar] [CrossRef]
  52. Ulutaş, K.; Abujayyab, S.K.M.; Abu Amr, S.S. Evaluation of the major air pollutants levels and its interactions with meteorological parameters in Ankara. J. Eng. Sci. Des. 2021, 9, 1284–1295. [Google Scholar] [CrossRef]
  53. Maltare, N.N.; Vahora, S.; Jani, K. Seasonal analysis of meteorological parameters and air pollutant concentrations in Kolkata: An evaluation of their relationship. J. Clean. Prod. 2024, 436, 140514. [Google Scholar] [CrossRef]
  54. Qiao, Z.; Wu, F.; Xu, X.; Yang, J.; Liu, L. Mechanism of Spatiotemporal Air Quality Response to Meteorological Parameters: A National-Scale Analysis in China. Sustainability 2019, 11, 3957. [Google Scholar] [CrossRef]
Figure 1. The components and procedures of air quality monitoring system.
Applsci 14 05713 g001
Figure 2. Some images of the agricultural actions in this research.
Applsci 14 05713 g002
Figure 3. Relationship between the readings of air temperature from the developed device and the Testo 625 device.
Applsci 14 05713 g003
Figure 4. Relationship between the readings of air relative humidity from the developed device and the Testo 625 device.
Applsci 14 05713 g004
Figure 5. Values of average IAQA for different farm activities.
Applsci 14 05713 g005
Table 1. Average daily air relative humidity, air temperature, atmospheric pressure, dust concentration in the air, and carbon monoxide concentration recorded at different sites.
Site SymbolAir Relative HumidityAir TemperatureAtmospheric PressureDust Concentration in the AirCarbon Monoxide Concentration
(%)(°C)(hPa)(μg/m3)(ppm)
F139.521.4945.7167.713.8
F228.927.8944.7167.99.7
F333.924.0946.6170.17.5
F413.121.2949.4197.012.7
F515.341.1940.1243.78.1
S643.037.7941.3258.213.2
F712.438.2940.8248.212.1
F812.338.2940.8261.311.6
F913.039.6940.3245.010.7
F1015.644.3938.6234.610.7
F1113.440.2938.7256.211.5
F1238.332.2962.2247.813.4
F1340.029.3962.1246.512.2
F1437.229.6963.1161.611.6
F1530.736.5962.8262.611.0
F1618.134.5839.8242.611.2
F1723.840.1839.1254.815.7
F1826.039.5840.0252.715.1
F1915.935.6840.1258.913.6
F2038.431.4840.8255.812.7
F2132.433.3850.4245.312.6
F2213.437.2850.0256.510.2
F2314.835.2850.8238.312.4
F2412.838.9850.3246.710.5
F2528.831.1844.6247.310.0
F2632.329.5844.6197.89.9
F2718.733.7829.6227.813.4
F2813.836.7829.7239.810.4
F2915.431.3795.8242.910.3
Overall average23.834.1895.3233.611.6
Overall minimum12.321.2795.8161.67.5
Overall maximum43.044.3963.1262.615.7
Table 2. Coefficient of variation, maximum and minimum values, and standard deviation of data on variables of carbon monoxide concentration (CO) and dust concentration in the air (DC, μg/m3 of air).
Site SymbolCoefficient of Variation (%)MaximumMinimumStandard Deviation
CODCCODCCODCCODC
(%)(%)(ppm)(μg/m3)(ppm)(μg/m3)(ppm)(μg/m3)
F115.627.3 18.9 303.3 11.1 114.0 2.2 45.83
F213.918.7 13.5 246.4 8.0 120.7 1.3 31.35
F34.315.7 8.5 228.1 7.1 124.0 0.3 26.77
F418.614.3 17.3 261.3 8.5 131.1 2.4 28.08
F523.211.1 13.0 291.6 4.8 172.6 1.9 27.10
S629.010.5 19.0 306.2 7.8 211.5 3.8 27.12
F77.19.9 15.4 302.1 10.7 212.0 0.9 24.48
F88.210.4 15.1 307.0 8.9 214.1 0.9 27.06
F95.411.3 11.9 298.7 7.8 198.3 0.6 27.60
F107.117.9 12.9 298.7 8.7 129.8 0.8 41.87
F117.611.3 14.7 305.4 10.5 199.9 0.9 28.89
F1217.611.3 17.1 308.2 7.8 210.4 2.4 28.03
F1312.99.6 17.4 305.4 10.3 213.2 1.6 23.61
F1423.021.9 15.8 248.9 5.5 102.8 2.7 35.35
F1512.810.2 14.6 307.9 5.8 209.0 1.4 26.68
F1628.97.4 15.4 274.7 4.8 208.2 3.2 18.07
F1715.38.4 18.3 299.6 11.0 211.5 2.4 21.31
F1810.98.9 18.8 309.5 11.2 213.7 1.6 22.51
F199.810.1 17.9 302.9 10.5 204.5 1.3 26.02
F2013.18.8 17.6 295.4 10.9 207.9 1.7 22.54
F2110.010.2 16.3 297.9 11.3 187.1 1.3 25.04
F228.68.9 12.4 292.9 8.9 213.2 0.9 22.78
F2310.99.7 17.6 297.1 10.9 191.7 1.4 23.06
F246.59.7 12.0 297.9 7.9 202.4 0.7 23.90
F259.18.4 14.4 304.5 9.2 209.9 0.9 20.74
F265.416.9 11.4 262.2 7.8 133.2 0.5 33.46
F2717.613.3 19.2 285.5 8.1 171.3 2.3 30.38
F287.611.1 12.5 295.4 7.8 149.7 0.8 26.55
F2910.613.0 15.0 306.2 9.2 158.4 1.1 31.50
Table 3. Correlation coefficients of the air temperature, air relative humidity, atmospheric pressure, and concentration values of air pollutants (CO and dust concentration in the air) during the investigation periods.
VariablesCODust Concentration in the AirAtmospheric PressureAir TemperatureAir Relative Humidity
CO1.000
Dust concentration in the air0.2551.000
Atmospheric pressure−0.145−0.3121.000
Air temperature0.0610.723−0.1521.000
Air relative humidity0.194−0.3210.269−0.4811.000
Disclaimer/Publisher’s Note: The statements, opinions and data contained in all publications are solely those of the individual author(s) and contributor(s) and not of MDPI and/or the editor(s). MDPI and/or the editor(s) disclaim responsibility for any injury to people or property resulting from any ideas, methods, instructions or products referred to in the content.

